Embed Size (px)
Citation preview
Copyright © 2005, SAS Institute Inc. All rights reserved.
Need Java Graphics?
Use of BIP Graph ComponentsName Ravi DevarajanTitle Software ManagerDepartment Data Visualization R&D
Copyright © 2005, SAS Institute Inc. All rights reserved. 2
What are Graph Components?
Java Components
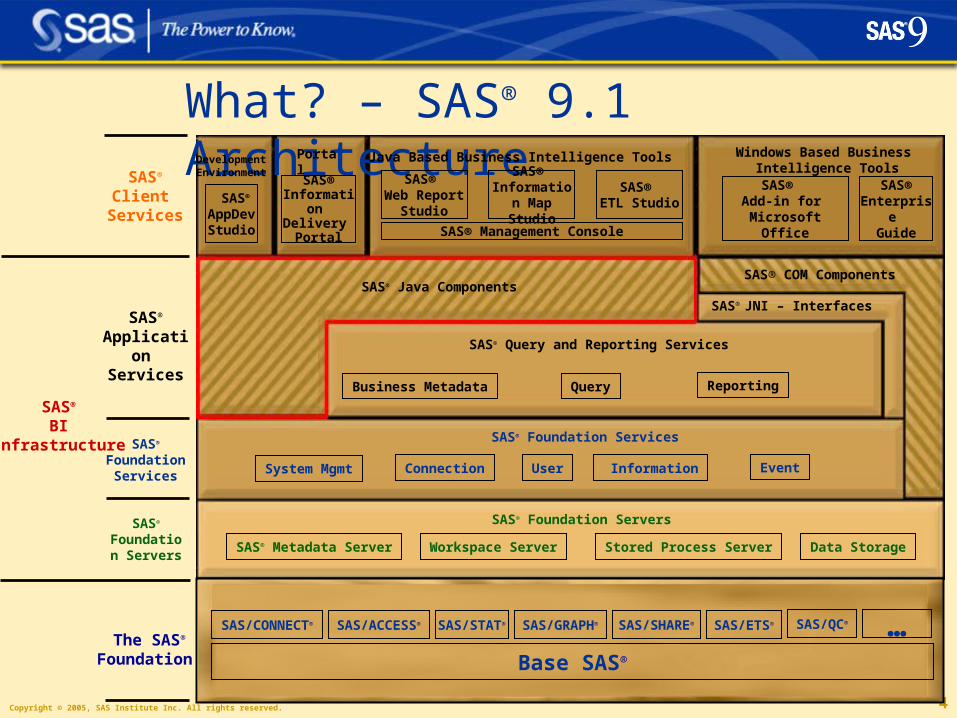
SAS® 9.1 Architecture
Copyright © 2005, SAS Institute Inc. All rights reserved. 3
What ? – Java Components
Modular code
Public API
Similar to SAS Procs
Copyright © 2005, SAS Institute Inc. All rights reserved. 4
The SAS®
Foundation
SAS®
Application Services
SAS®
BIInfrastructure
What? – SAS® 9.1 ArchitectureSAS®
Client Services
SAS® Foundation Servers
SAS® Metadata Server Workspace Server Stored Process Server Data Storage
SAS® Foundation Services
System Mgmt InformationUser EventConnection
SAS® Query and Reporting Services
Business Metadata ReportingQuery
SAS® JNI – Interfaces
Windows Based Business Intelligence Tools
SAS® Enterprise
Guide
SAS® Information
Delivery Portal
SAS® AppDevStudio
DevelopmentEnvironment
SAS® Web Report
Studio
SAS® Information Map Studio
Java Based Business Intelligence Tools
SAS® Management Console
Portal
SAS® COM ComponentsSAS® Java Components
Base SAS®
SAS/CONNECT® SAS/STAT® SAS/SHARE®SAS/ACCESS® SAS/GRAPH® SAS/QC®SAS/ETS® …
SAS® Add-in for
Microsoft Office
SAS® Foundation
Services
SAS® Foundation
Servers
SAS® ETL Studio
Copyright © 2005, SAS Institute Inc. All rights reserved. 5
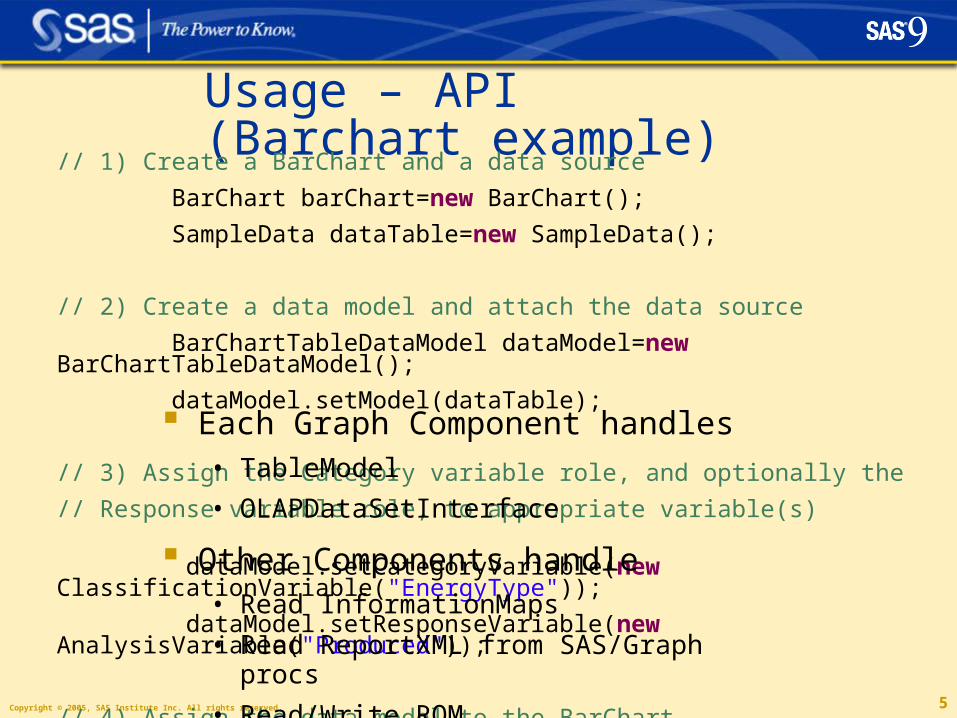
Usage – API (Barchart example)
// 1) Create a BarChart and a data source
BarChart barChart=new BarChart();
SampleData dataTable=new SampleData();
// 2) Create a data model and attach the data source
BarChartTableDataModel dataModel=new BarChartTableDataModel();
dataModel.setModel(dataTable);
// 3) Assign the Category variable role, and optionally the
// Response variable role, to appropriate variable(s)
dataModel.setCategoryVariable(new ClassificationVariable("EnergyType"));
dataModel.setResponseVariable(new AnalysisVariable("Produced"));
// 4) Assign the data model to the BarChart
barChart.setDataModel(dataModel);
Each Graph Component handles• TableModel
• OLAPDataSetInterface
Other Components handle• Read InformationMaps
• Read ReportXML from SAS/Graph procs
• Read/Write ROM
Copyright © 2005, SAS Institute Inc. All rights reserved. 6
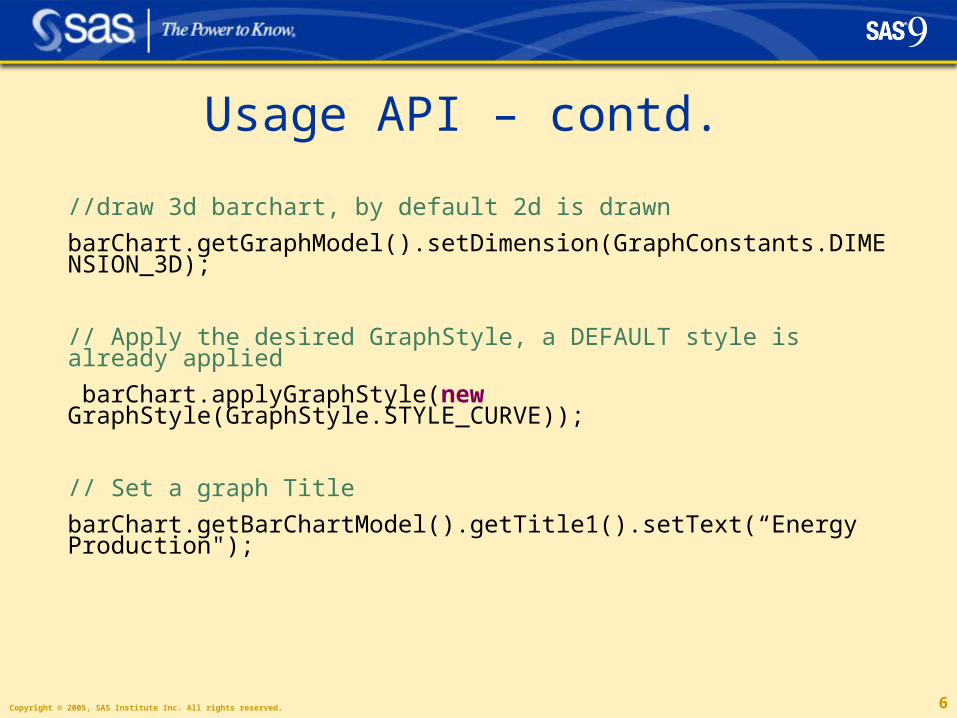
Usage API – contd.
//draw 3d barchart, by default 2d is drawn
barChart.getGraphModel().setDimension(GraphConstants.DIMENSION_3D);
// Apply the desired GraphStyle, a DEFAULT style is already applied
barChart.applyGraphStyle(new GraphStyle(GraphStyle.STYLE_CURVE));
// Set a graph Title
barChart.getBarChartModel().getTitle1().setText(“Energy Production");
Copyright © 2005, SAS Institute Inc. All rights reserved. 7
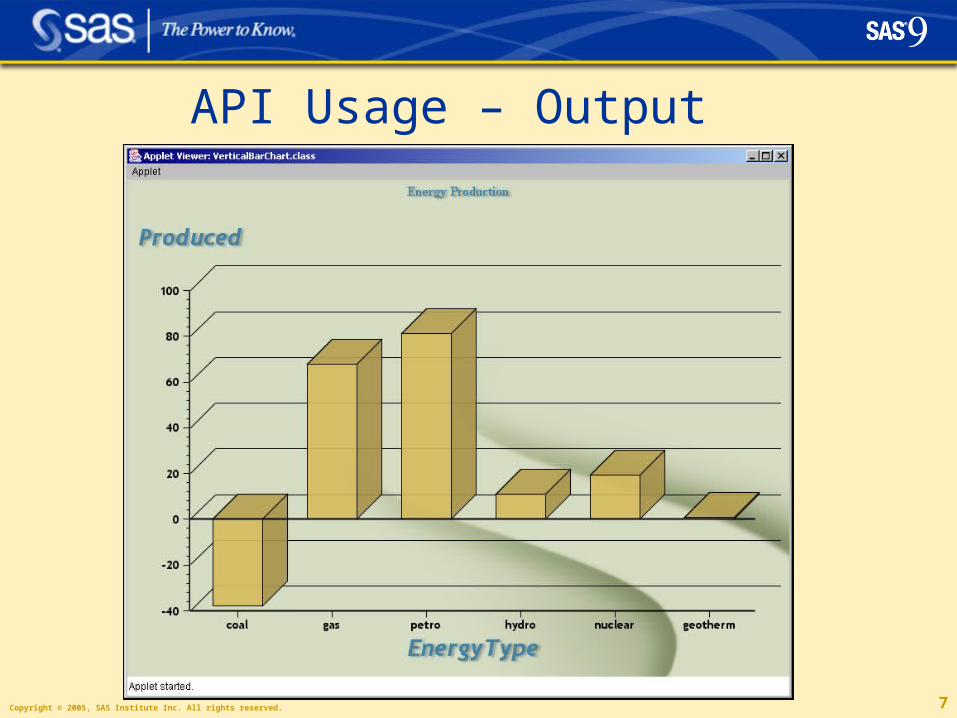
API Usage – Output
Copyright © 2005, SAS Institute Inc. All rights reserved. 8
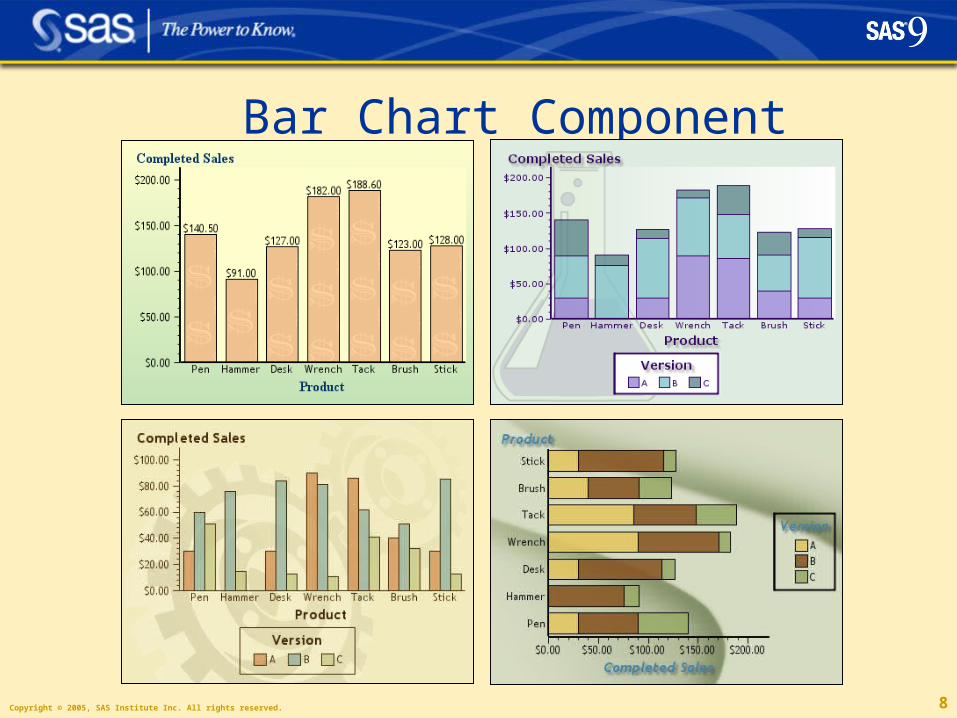
Bar Chart Component
Copyright © 2005, SAS Institute Inc. All rights reserved. 9
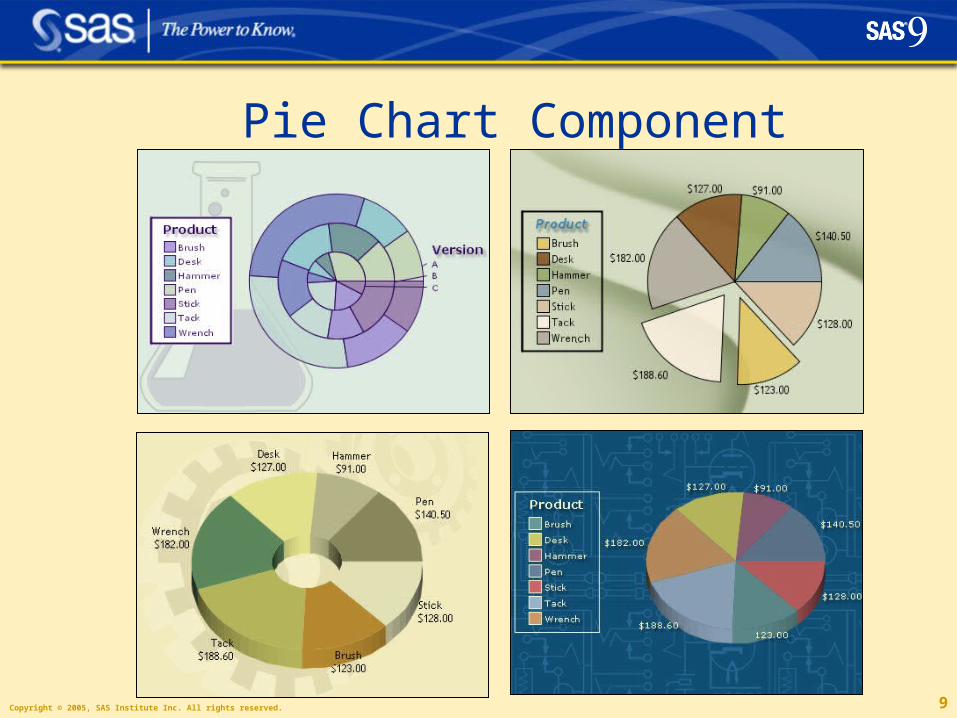
Pie Chart Component
Copyright © 2005, SAS Institute Inc. All rights reserved. 10
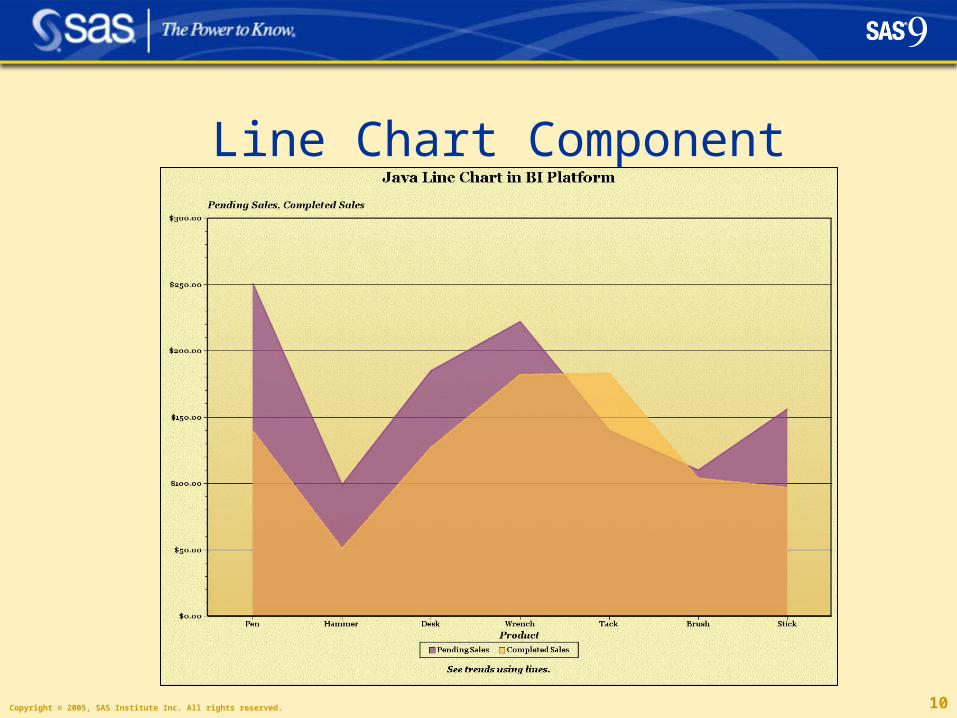
Line Chart Component
Copyright © 2005, SAS Institute Inc. All rights reserved. 11
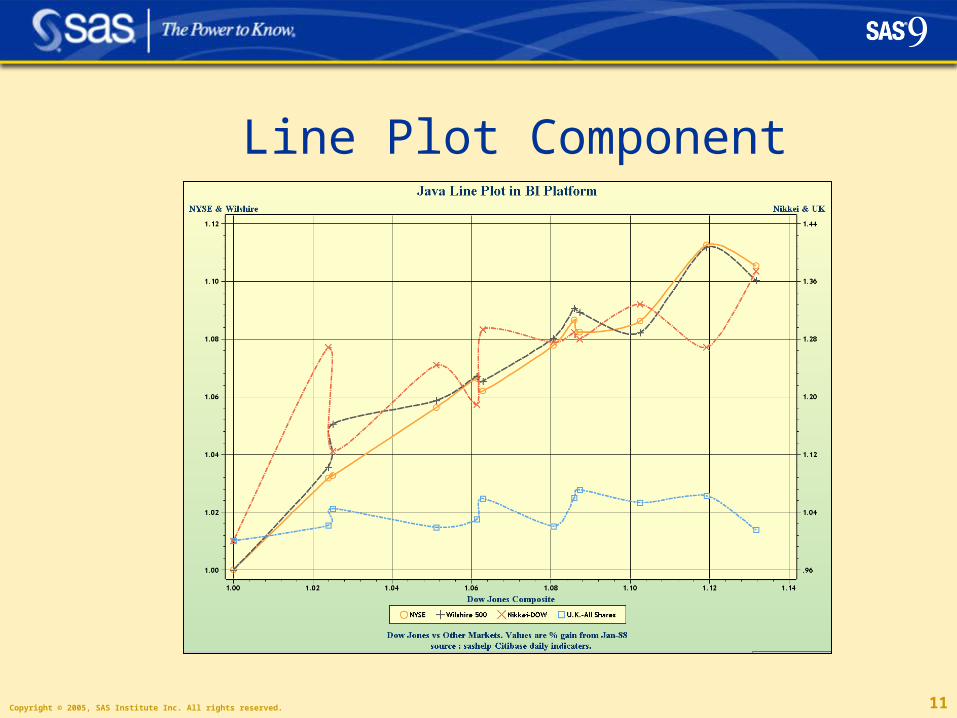
Line Plot Component
Copyright © 2005, SAS Institute Inc. All rights reserved. 12
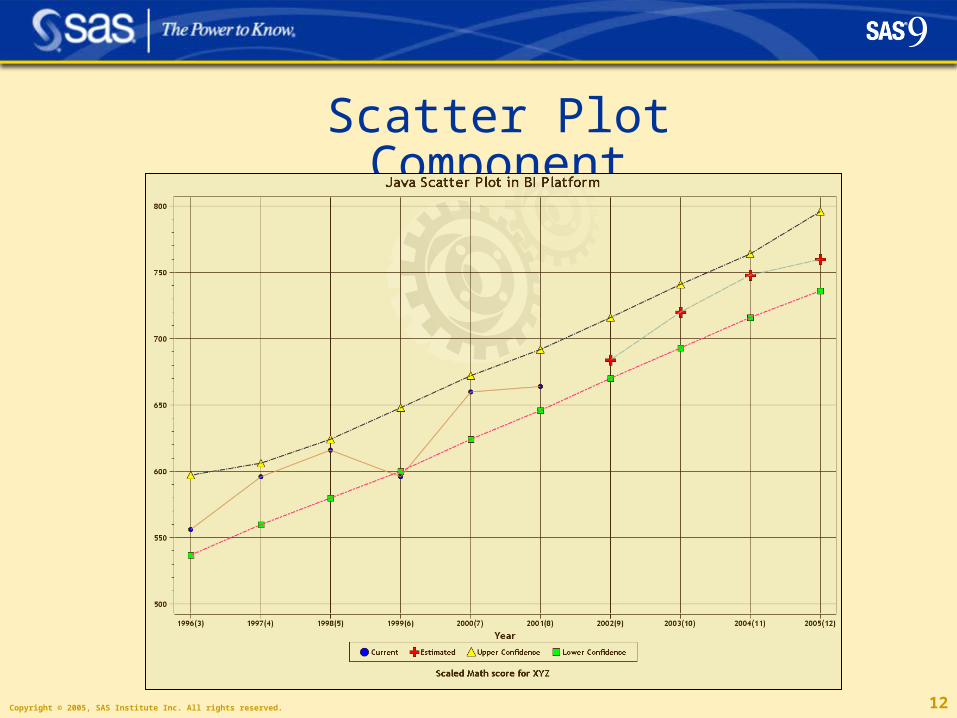
Scatter Plot Component
Copyright © 2005, SAS Institute Inc. All rights reserved. 13
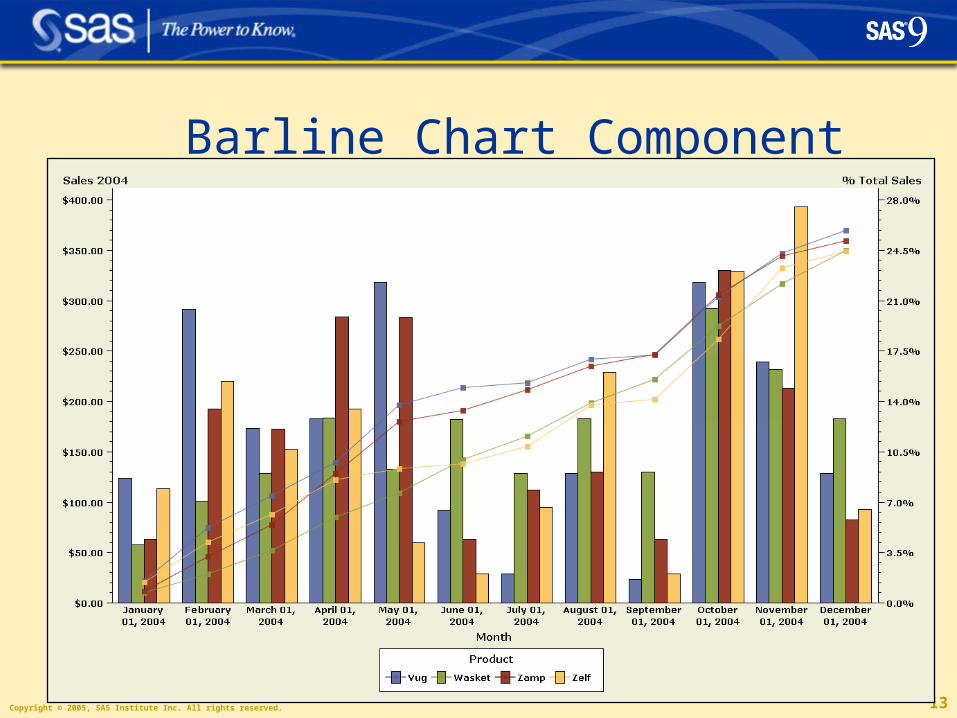
Barline Chart Component
Copyright © 2005, SAS Institute Inc. All rights reserved. 14
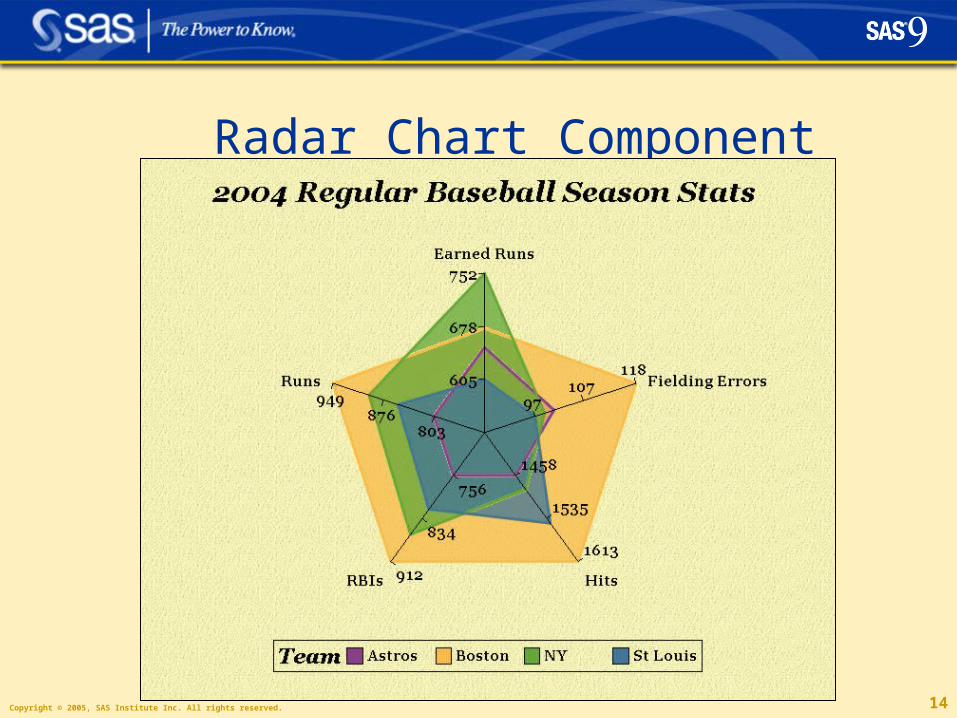
Radar Chart Component
Copyright © 2005, SAS Institute Inc. All rights reserved. 15
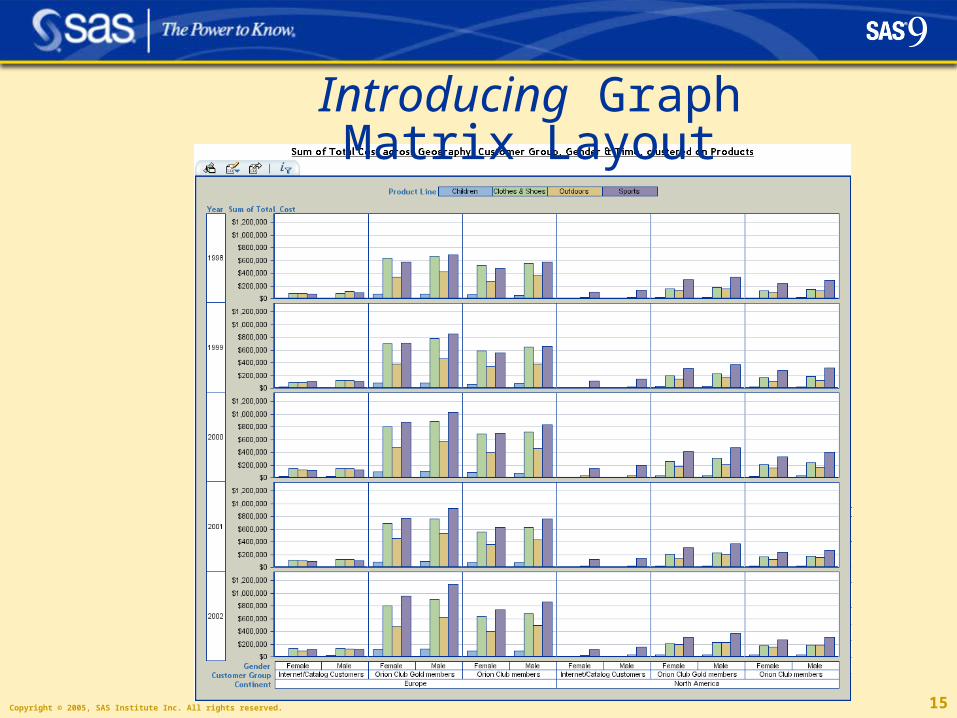
Introducing Graph Matrix Layout
Copyright © 2005, SAS Institute Inc. All rights reserved. 16
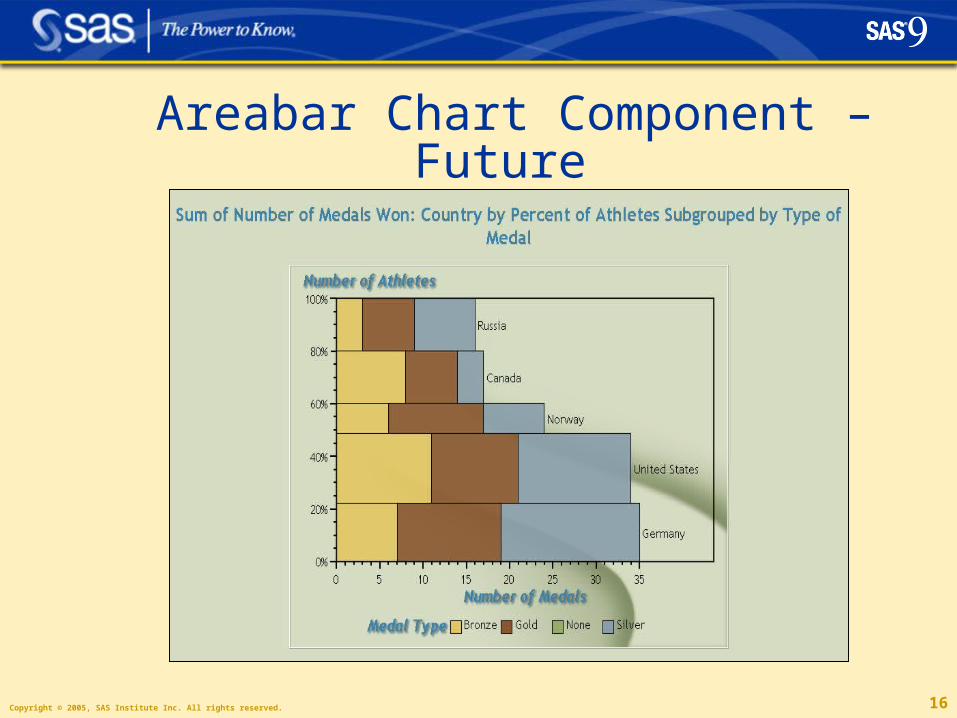
Areabar Chart Component – Future
Copyright © 2005, SAS Institute Inc. All rights reserved. 17
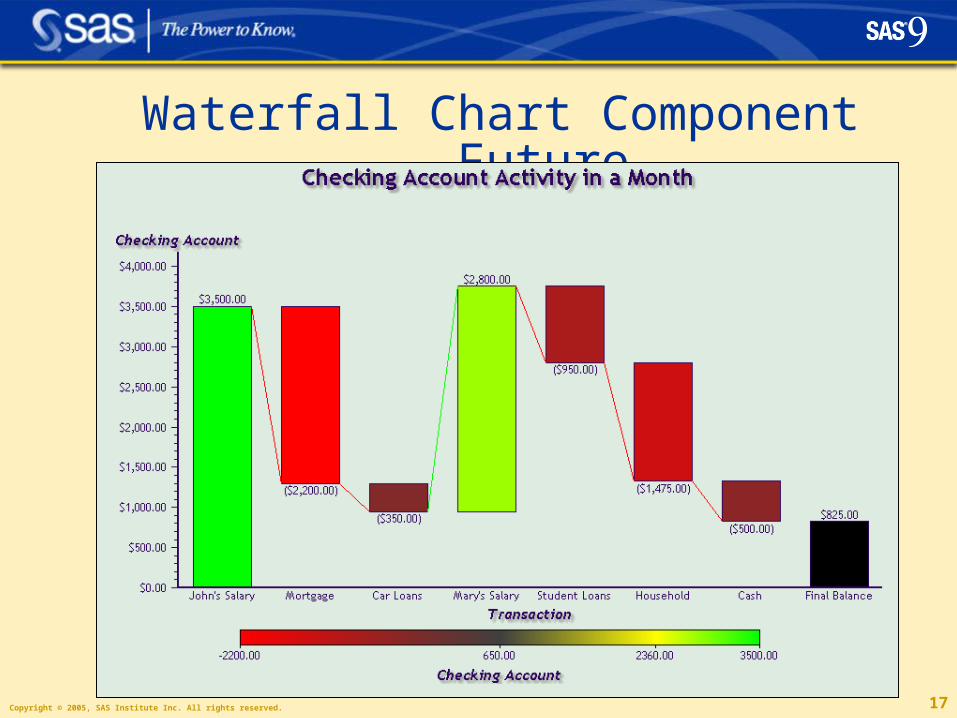
Waterfall Chart Component – Future
Copyright © 2005, SAS Institute Inc. All rights reserved. 18
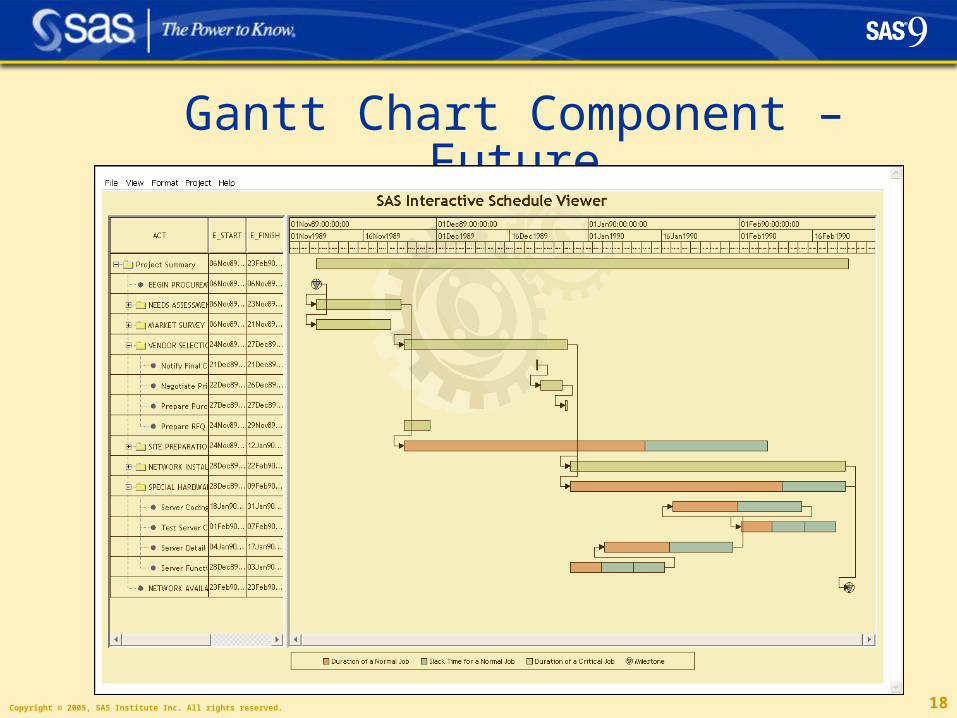
Gantt Chart Component – Future
Copyright © 2005, SAS Institute Inc. All rights reserved. 19
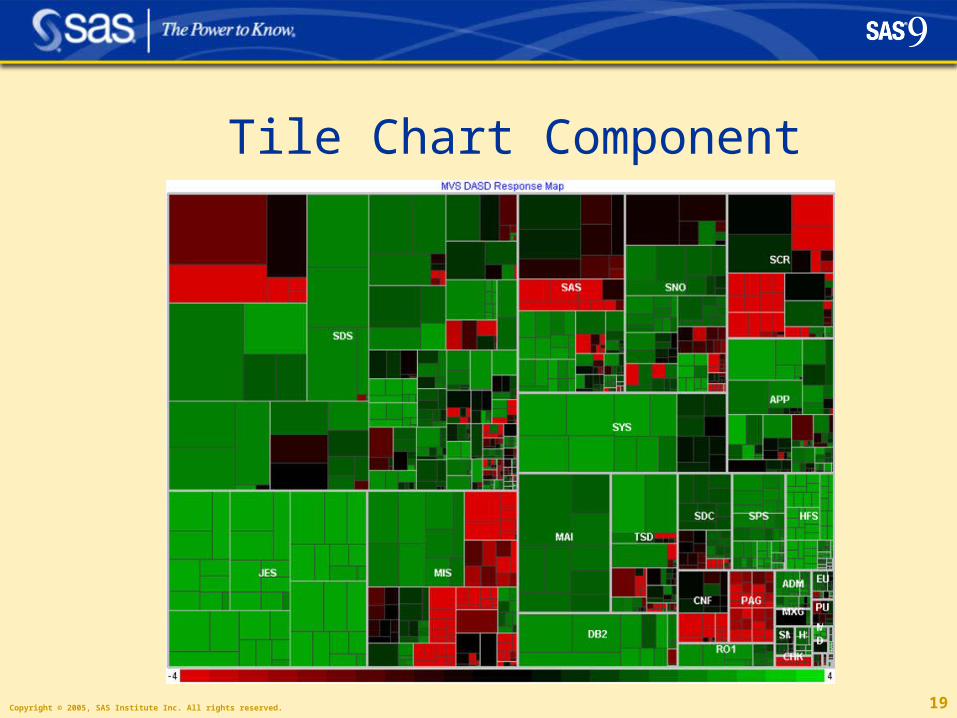
Tile Chart Component
Copyright © 2005, SAS Institute Inc. All rights reserved. 20
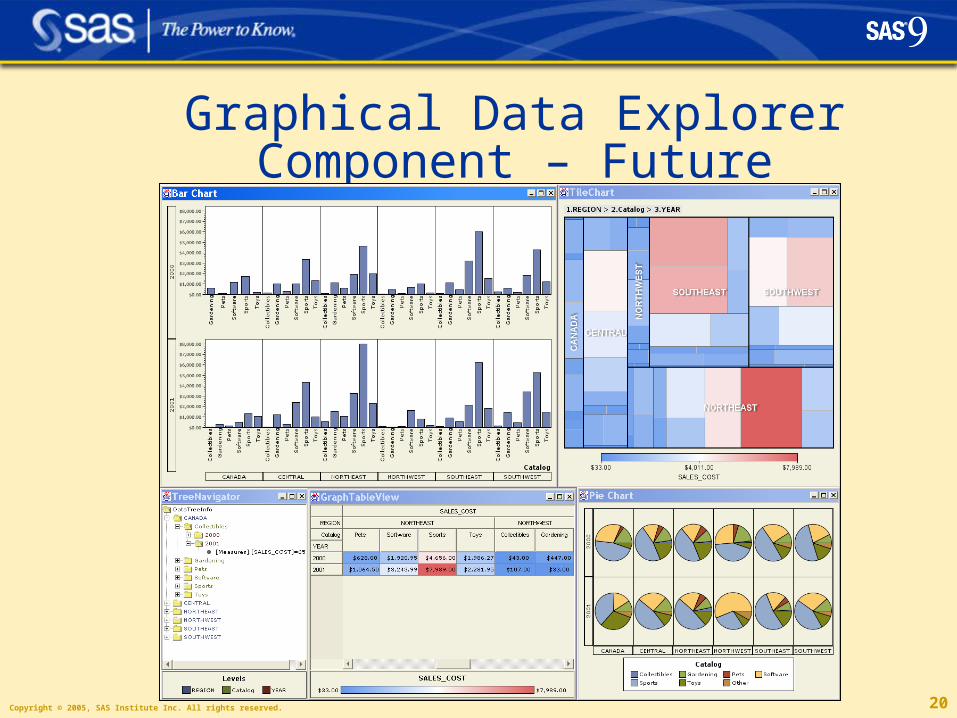
Graphical Data Explorer Component – Future
Copyright © 2005, SAS Institute Inc. All rights reserved. 21
Usage – Beyond SAS/Graph
Interactive (demo)• Selection/Brushing
• Tooltips, Links
• OLAP Actions – Drill, Expand, Query, Filter, Sort, Rank
Other Highlights• Modern Java Graphs
• Graph Matrix
• Exception Highlighting
• Render SVG output
Copyright © 2005, SAS Institute Inc. All rights reserved. 22
Availability – Programmable Components SAS Java IDE
• SAS®AppDev Studio™
Standalone • SAS®BI Server
Copyright © 2005, SAS Institute Inc. All rights reserved. 23
Availability – SAS 9 Applications Web Applications – Web Report Studio,
SWOVJ, VDE in BI Portal, SAS Web Analytics, SPM, SRM Spend Analysis
Swing Applications – Marketing Optimization, Marketing Automation & Risk Dimensions
SWT Applications – Promotion Optimization & Markdown Optimization
Applets – ISV & Tilechart
SAS/Graph ® via ODS SASREPORT (experimental)
Copyright © 2005, SAS Institute Inc. All rights reserved. 24Copyright © 2005, SAS Institute Inc. All rights reserved. 24
Email address: [email protected]
Need Java Graphics? Use of BIP Graph Components
![YSLO RTS ELEC BOARD FR - Somfy...BIP-BIP [] BIP-BIP [] BIP-BIP [] BIP-BIP [_____] BIP-BIP [] BIP-BIP [] BIP-BIP []… Appuyer sur la touche jusqu’au va-et-vient du vantail prioritaire](https://img.pdfslide.net/doc/110x75/60fbc1563febf120f853a528/yslo-rts-elec-board-fr-somfy-bip-bip-bip-bip-bip-bip-bip-bip-.jpg)