Embed Size (px)
Citation preview

Copyright © 2008 Pearson Addison-Wesley. All rights reserved.
Chapter 2
How Economists Work
Copyright © 2008 Pearson Addison-Wesley. All rights reserved. 2-2
In this chapter you will learn to
1. Distinguish between positive and normative statements in economics.
2. Explain how economists use models to help them think about the economy.
3. Describe the interaction between economic theories and empirical observation.
4. Describe several types of economic data, including time-series and cross-sectional data, and scatter diagrams.
5. Explain how the slope of a relation between two variables, X and Y, is interpreted as the marginal response in Y to a unit change in X.
Copyright © 2008 Pearson Addison-Wesley. All rights reserved. 2-3
Normative statements depend on value judgments and opinions -- cannot be settled by recourse to facts.
Positive statements do not involve value judgements. They are statements about what is, was, or will be.
Positive and Normative Advice

Copyright © 2008 Pearson Addison-Wesley. All rights reserved. 2-4
Table 2.1 Positive and Normative Statements

Copyright © 2008 Pearson Addison-Wesley. All rights reserved. 2-5
Economists often disagree with each other in public discussions -- often because of poor communication.
Disagreement also stems from economists’ failure to acknowledge the full state of their ignorance.
Perhaps the biggest source of public disagreement is based on the positive/normative distinction.
Disagreements Among Economists
Economists must differentiate normative proffered advice from positive facts.
Copyright © 2008 Pearson Addison-Wesley. All rights reserved. 2-6
Economic theories
Theories
• a set of definitions about variables
– endogenous and exogenous variables
• a set of assumptions
– motives, physical relations, direction of causation, conditions of application
• a set of predictions (or hypotheses)
A theory consists of:
Copyright © 2008 Pearson Addison-Wesley. All rights reserved. 2-7
Models
• as a synonym for a theory;
• as a specific quantitative formulation of a theory;
• as a specific application of a general theory; and
• as an illustrative abstraction which helps to understand key features of a complex world.
The term model is used in several different ways:

Copyright © 2008 Pearson Addison-Wesley. All rights reserved. 2-8
Testing theories
Rejection Versus Confirmation
A hypothesis can be tested and may be rejected by the data. This rejection brings the value of the theory into question.
An alternative is to search for confirming evidence for a theory.
But no matter how unlikely the theory is, some confirming evidence can generally be found.
Copyright © 2008 Pearson Addison-Wesley. All rights reserved. 2-9
Statistical Analysis
Statistical analysis is used to test a hypothesis such as “if X increases, then Y will also increase.”
Economists are compelled to use millions of “uncontrolled” experiments that are going on every day in the economy.
These activities can be observed and recorded continuously, producing a mass of data.
The analysis of such data requires the use of appropriate -- and often quite complex -- statistical techniques.
Copyright © 2008 Pearson Addison-Wesley. All rights reserved. 2-10
Correlation Versus Causation
Positive correlation means only that X and Y move together.
Negative correlation means that X and Y move in opposite directions.
But X and Y may not be causally related. Or they may be related in the opposite way to what is expected -- reverse causality.
Most economic predictions attempt to establish causality. Statistical tests often attempt to distinguish between correlation and causality.

Copyright © 2008 Pearson Addison-Wesley. All rights reserved. 2-11
Figure 2.1 The Interaction Between Theory and Empirical Observation
Copyright © 2008 Pearson Addison-Wesley. All rights reserved. 2-12
Economic data
Graphing Economic Data
Economic variables usually come in two basic forms:
• Cross-sectional data
• Time-series data
A scatter diagram is a useful and common way of looking at the relationship between two variables.

Copyright © 2008 Pearson Addison-Wesley. All rights reserved. 2-13
Figure 2.2 Unemployment Rates for the 10 Largest States, March 2006
Copyright © 2008 Pearson Addison-Wesley. All rights reserved. 2-14
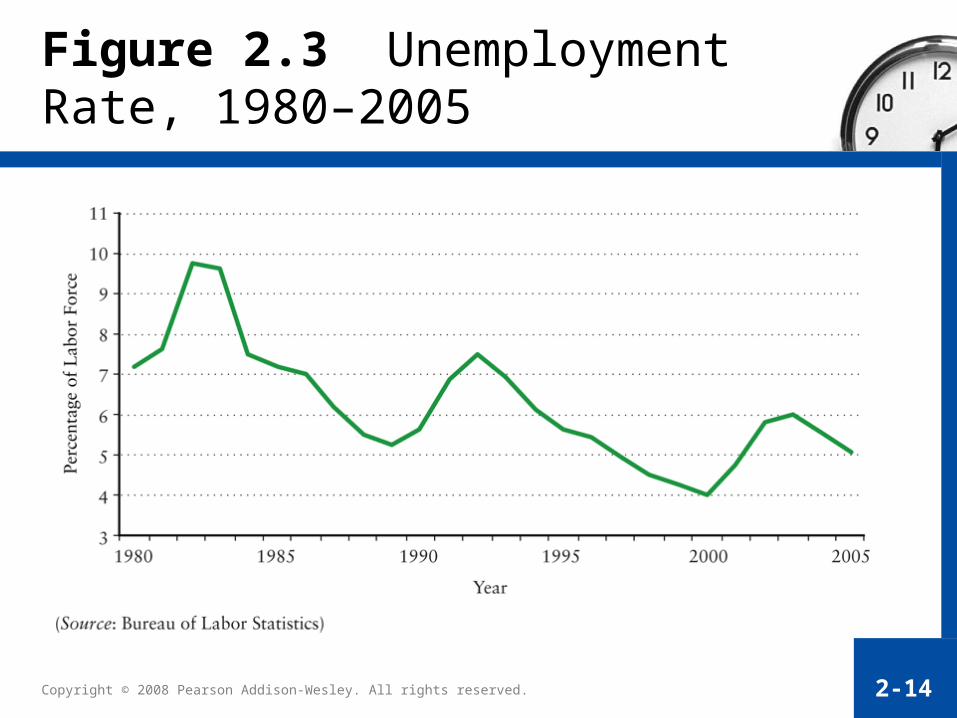
Figure 2.3 Unemployment Rate, 1980–2005
Copyright © 2008 Pearson Addison-Wesley. All rights reserved. 2-15
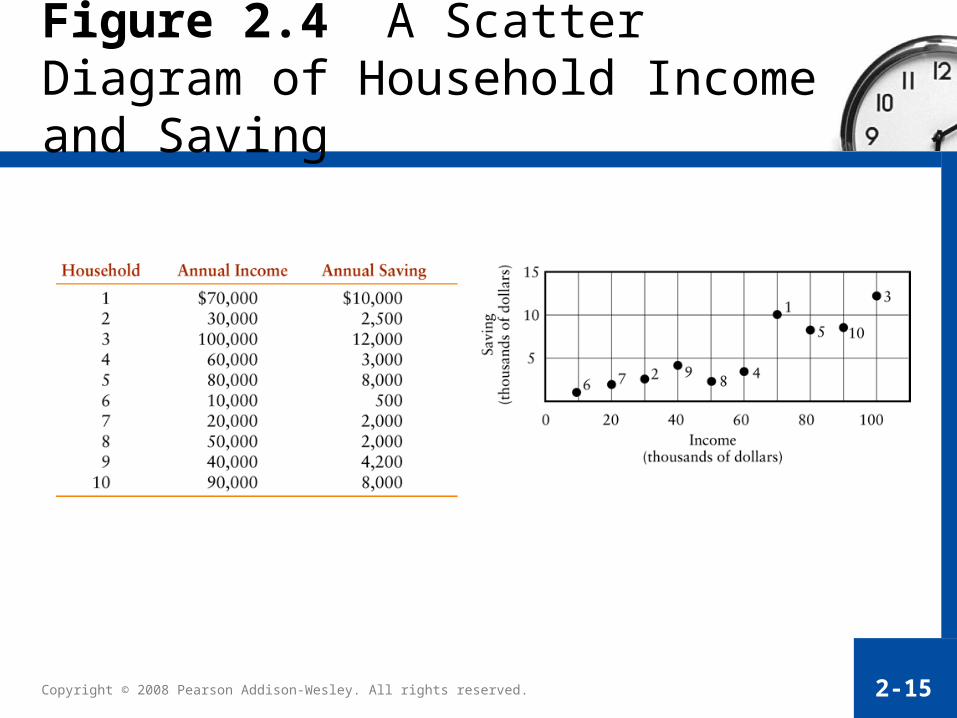
Figure 2.4 A Scatter Diagram of Household Income and Saving
Copyright © 2008 Pearson Addison-Wesley. All rights reserved. 2-16
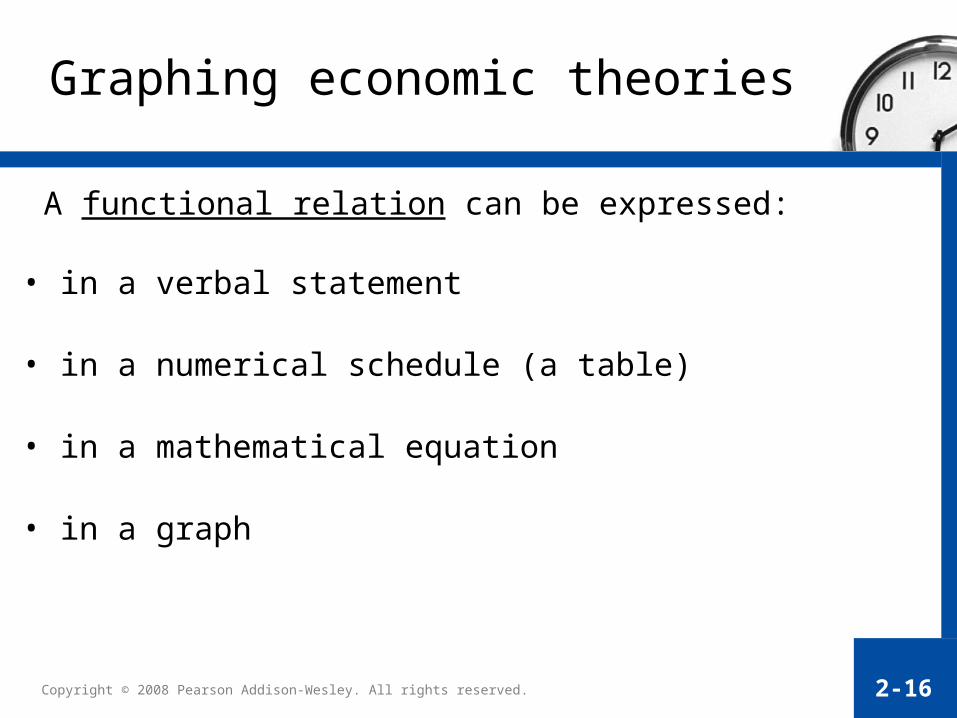
Graphing economic theories
A functional relation can be expressed:
• in a verbal statement
• in a numerical schedule (a table)
• in a mathematical equation
• in a graph
Copyright © 2008 Pearson Addison-Wesley. All rights reserved. 2-17
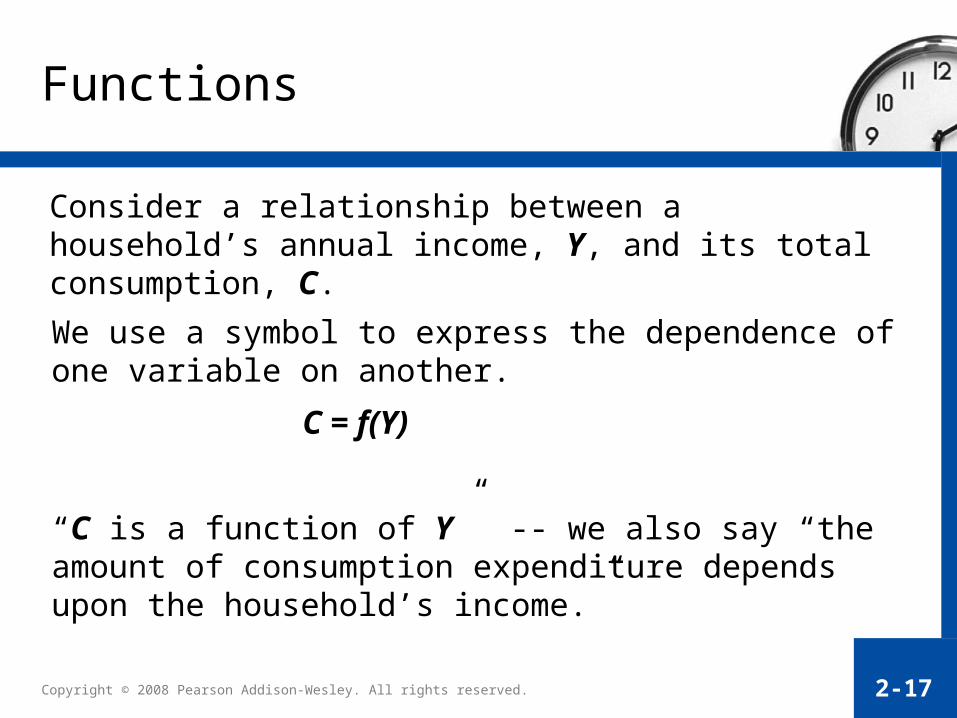
Functions
Consider a relationship between a household’s annual income, Y, and its total consumption, C.
We use a symbol to express the dependence of one variable on another.
C = f(Y)
“C is a function of Y” -- we also say “the amount of consumption expenditure depends upon the household’s income.”
Copyright © 2008 Pearson Addison-Wesley. All rights reserved. 2-18
Graphing Functional Relations
The relationship between two variables may be positive or negative.
If the graphs of these relationships are straight lines, the variables are linearly related to each other.
Otherwise, variables are said to be non-linearly related.
Copyright © 2008 Pearson Addison-Wesley. All rights reserved. 2-19
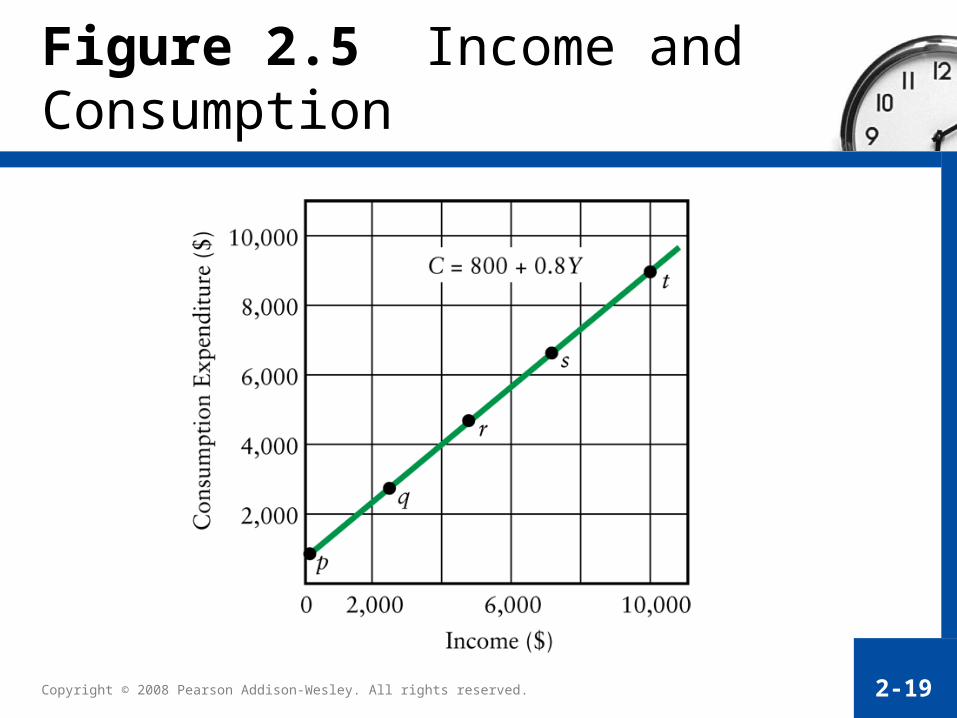
Figure 2.5 Income and Consumption
Copyright © 2008 Pearson Addison-Wesley. All rights reserved. 2-20
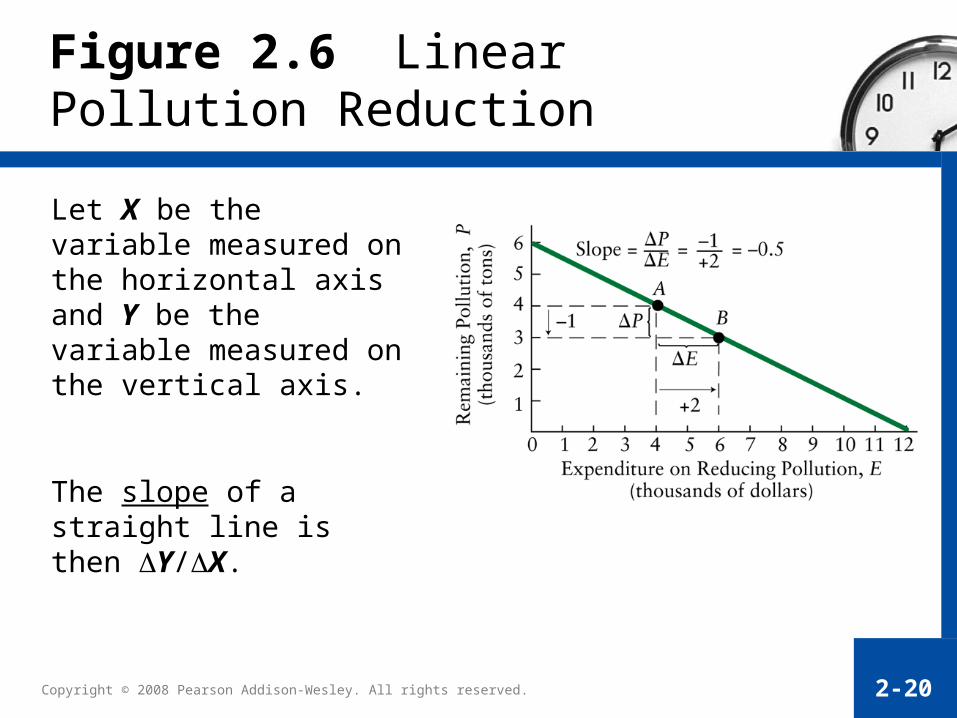
Let X be the variable measured on the horizontal axis and Y be the variable measured on the vertical axis.
The slope of a straight line is then Y/X.
Figure 2.6 Linear Pollution Reduction
Copyright © 2008 Pearson Addison-Wesley. All rights reserved. 2-21
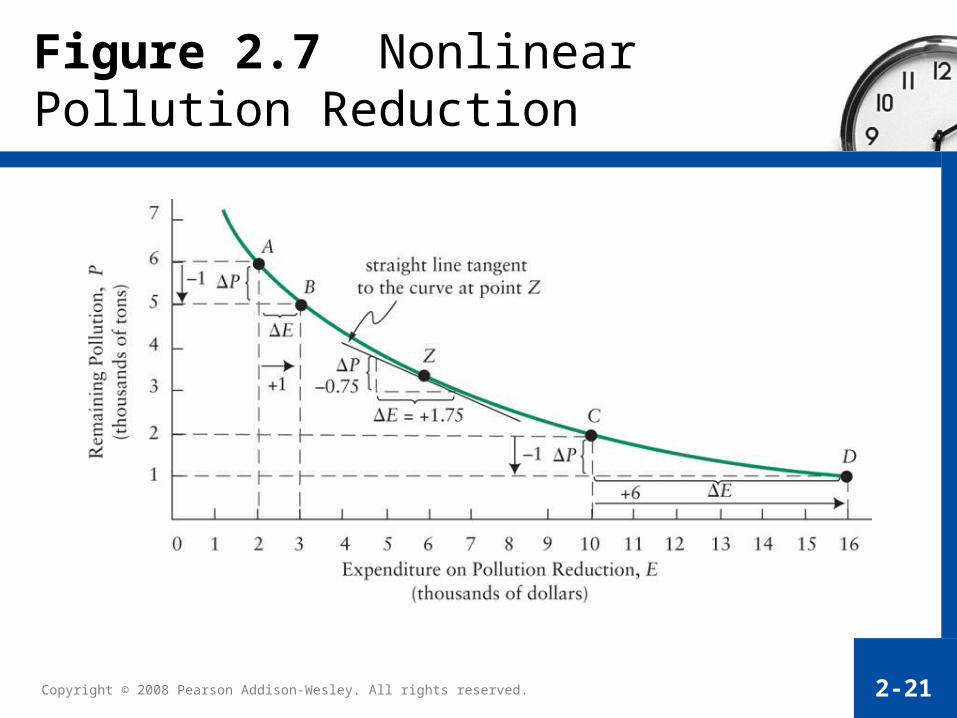
Figure 2.7 Nonlinear Pollution Reduction
Copyright © 2008 Pearson Addison-Wesley. All rights reserved. 2-22
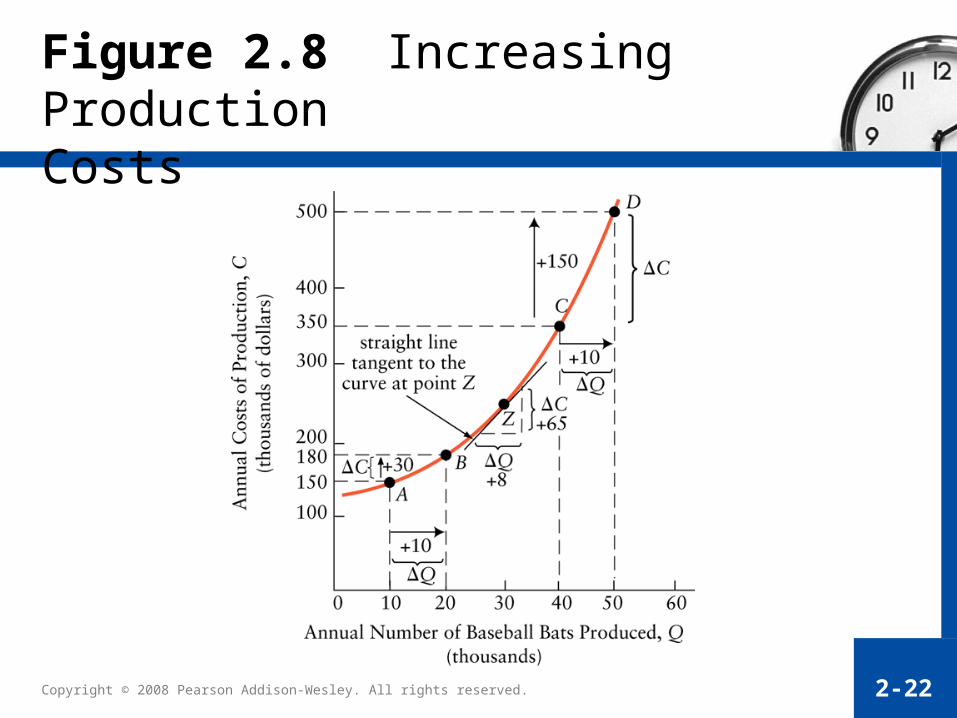
Figure 2.8 Increasing Production Costs

Copyright © 2008 Pearson Addison-Wesley. All rights reserved. 2-23
Figure 2.9 Profits as a Function of Output
At a minimum of a function, the slope of the curve is zero.
Copyright © 2008 Pearson Addison-Wesley. All rights reserved. 2-24
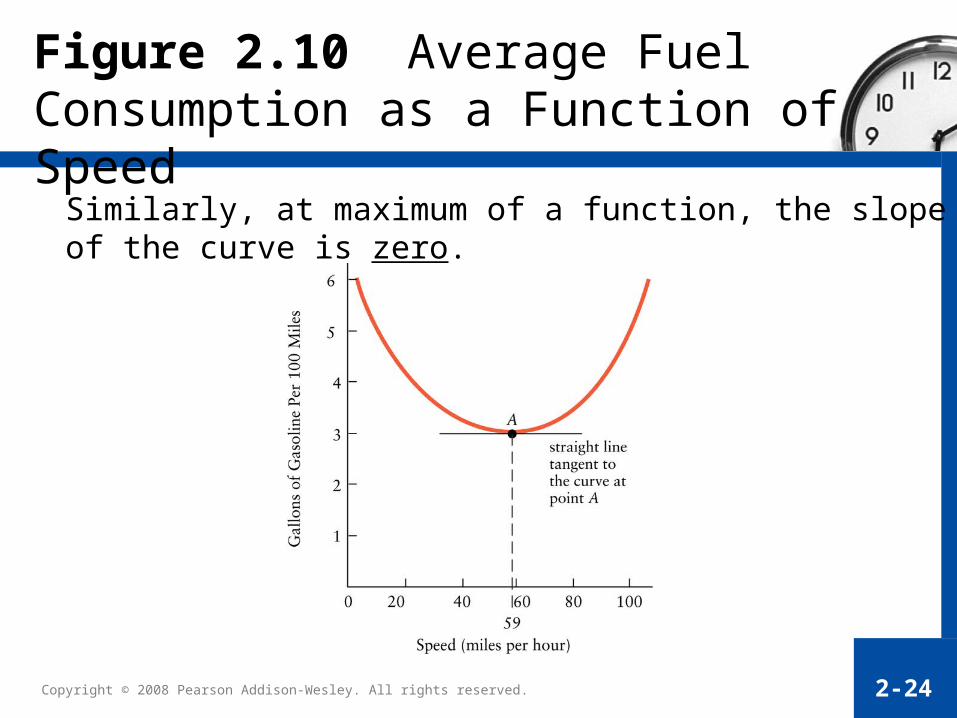
Figure 2.10 Average Fuel Consumption as a Function of Speed
Similarly, at maximum of a function, the slope of the curve is zero.
Copyright © 2008 Pearson Addison-Wesley. All rights reserved. 2-25
A Final Word
We have discussed why economists use theory and how they build economic models.
We have discussed how there is a continual back-and-forth process between empirical testing of predictions and refining the theoretical models.
We have explored the many ways data can be displayed in graphs and how economists use graphs to illustrate their theories.