Embed Size (px)
Citation preview
Copyright 2008 The McGraw-Hill Companies32-1
32Income Inequality and Poverty
Copyright 2008 The McGraw-Hill Companies32-2
Chapter Objectives• How Income Inequality in the United
States is Measured and Described• The Extent and Sources of Income
Inequality• How Income Inequality Has
Changed Since 1970• The Economic Arguments For and
Against Income Inequality• How Poverty is Measured and its
Incidence by Age, Gender, Ethnicity, and Other Characteristics
• The Major Components of the Income-Maintenance Program in the United States
Copyright 2008 The McGraw-Hill Companies32-3
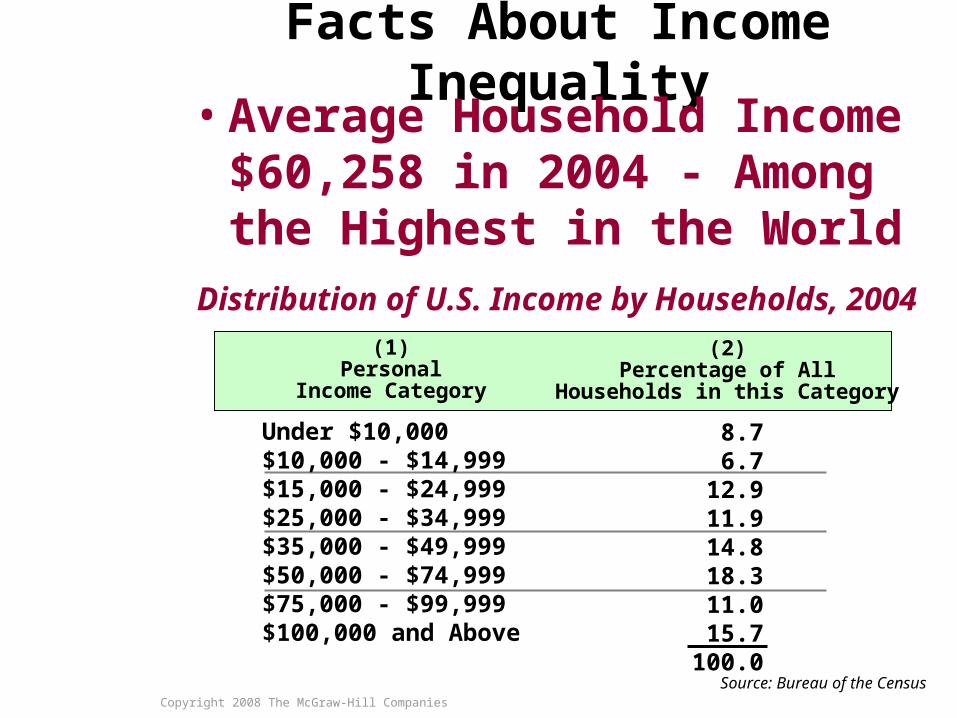
Facts About Income Inequality• Average Household Income
$60,258 in 2004 - Among the Highest in the World
(1)Personal
Income Category
(2)Percentage of All
Households in this Category
Under $10,000$10,000 - $14,999$15,000 - $24,999$25,000 - $34,999$35,000 - $49,999$50,000 - $74,999$75,000 - $99,999$100,000 and Above
Distribution of U.S. Income by Households, 2004
8.76.7
12.911.914.818.311.015.7
100.0Source: Bureau of the Census
Copyright 2008 The McGraw-Hill Companies32-4
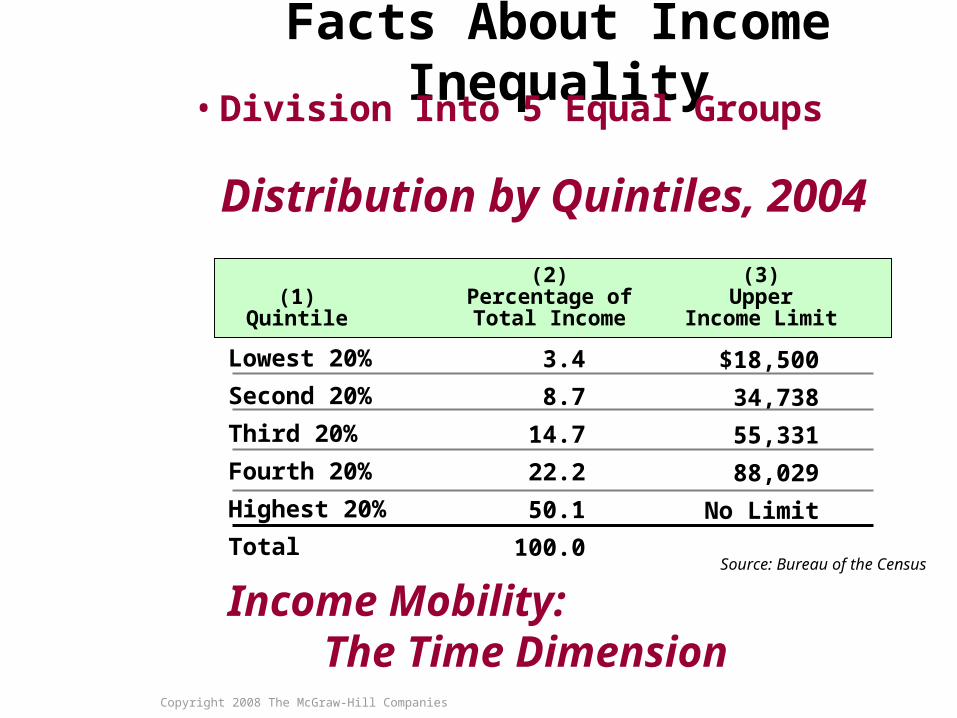
Facts About Income Inequality• Division Into 5 Equal Groups
(1)Quintile
(2)Percentage ofTotal Income
Lowest 20%
Second 20%
Third 20%
Fourth 20%
Highest 20%
Total
Distribution by Quintiles, 2004
3.4
8.7
14.7
22.2
50.1
100.0Source: Bureau of the Census
(3)Upper
Income Limit
$18,500
34,738
55,331
88,029
No Limit
Income Mobility: The Time Dimension
Copyright 2008 The McGraw-Hill Companies32-5Cumulative % of families
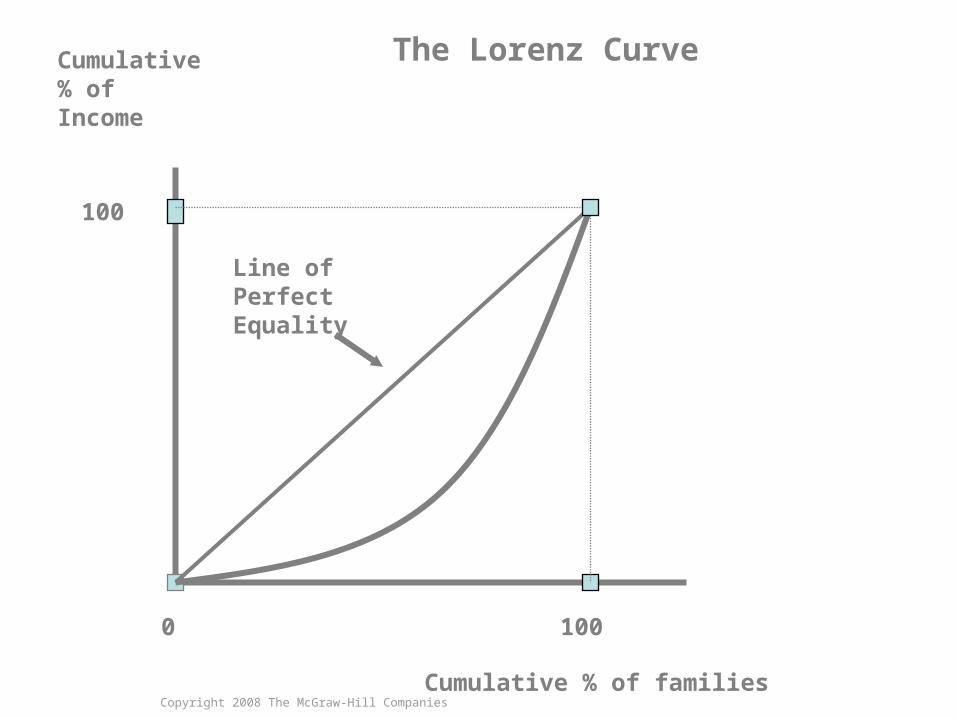
Cumulative % of Income
0 100
100
The Lorenz Curve
Line of Perfect Equality
Copyright 2008 The McGraw-Hill Companies32-6
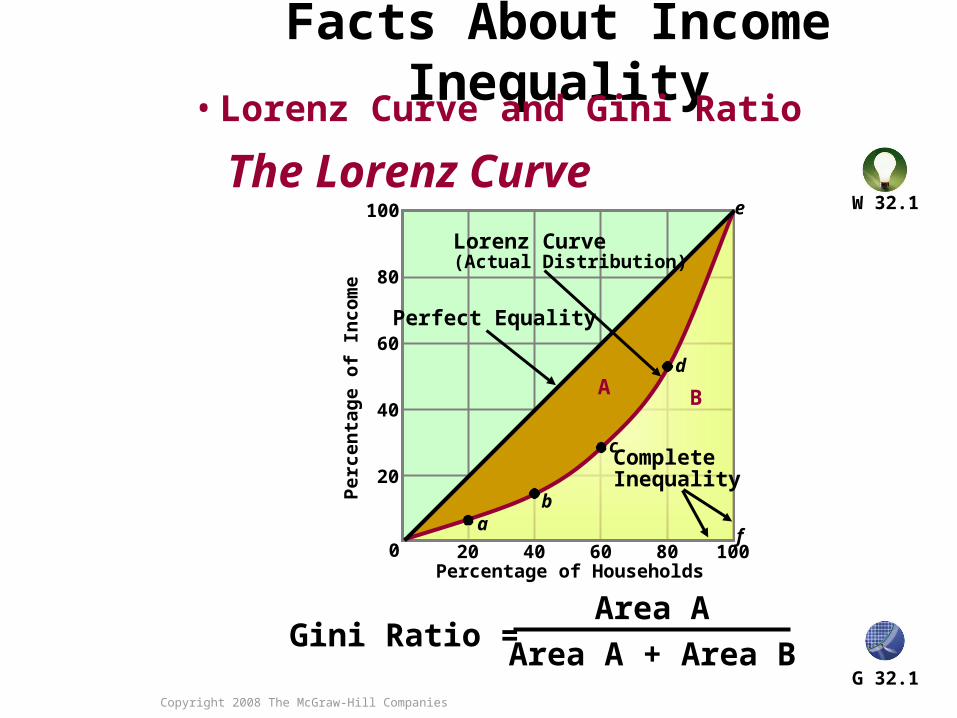
Facts About Income Inequality• Lorenz Curve and Gini Ratio
The Lorenz Curve
20 40 60 80 100
20
40
60
80
100
0
Perfect Equality
Lorenz Curve(Actual Distribution)
Complete Inequality
A B
ab
c
d
e
f
Gini Ratio =Area A
Area A + Area B
Percentage of Households
Per
cen
tag
e o
f In
co
me
W 32.1
G 32.1

Copyright 2008 The McGraw-Hill Companies32-7
What is theGini Coefficient?
• A numerical measure of the degree on income inequality in an economy

Copyright 2008 The McGraw-Hill Companies32-8
What does the Gini Coefficient have to do with the Lorenze Curve?
• The coefficient transforms the Lorenze Curve into a numerical value
Copyright 2008 The McGraw-Hill Companies32-9
With the Gini Coefficient, what do the #’s mean?
• A number of 0 is perfect income equality
• A number of 1 is perfect income inequality

Copyright 2008 The McGraw-Hill Companies32-10
Gini Coefficients, US
1970 .394
1975 .397
1980 .403
1985 .419
1990 .428
1995 .450
Copyright 2008 The McGraw-Hill Companies32-11
Some problems in measuring income distribution
Life cycle incomeFamily size and effortUnderground economyTaxes and in-kind income
Copyright 2008 The McGraw-Hill Companies32-12
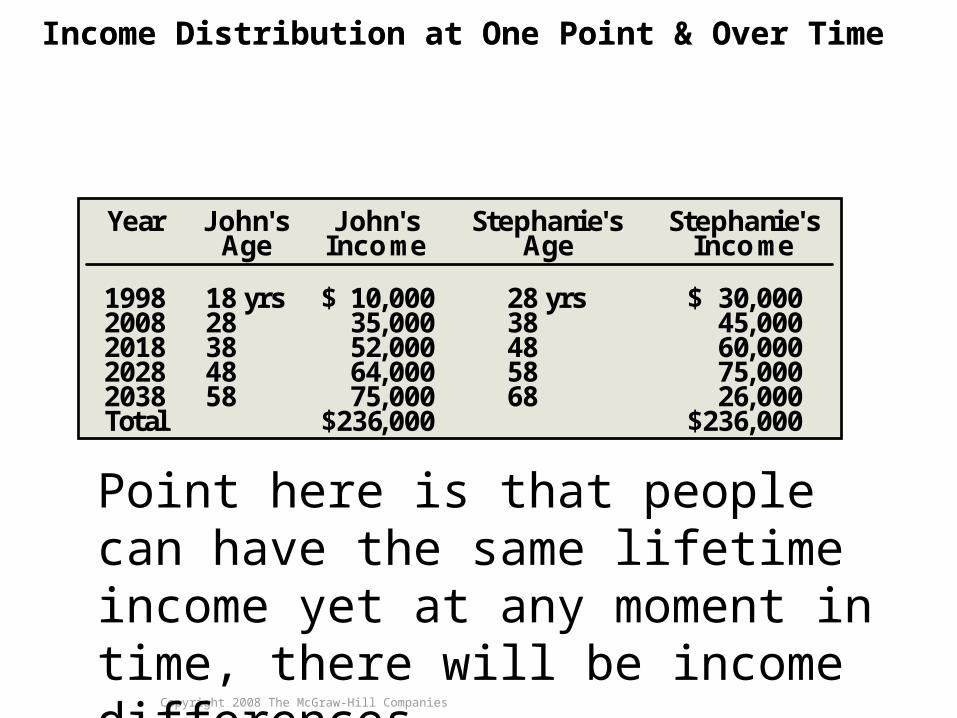
Income Distribution at One Point & Over TimeIncome Distribution at One Point & Over Time
Year John'sAge
John'sIncome
Stephanie'sAge
Stephanie'sIncome
19982008201820282038Total
18 yrs28384858
$ 10,00035,00052,00064,00075,000
$236,000
28 yrs38485868
$ 30,00045,00060,00075,00026,000
$236,000
Point here is that people can have the same lifetime income yet at any moment in time, there will be income differences.
Copyright 2008 The McGraw-Hill Companies32-13
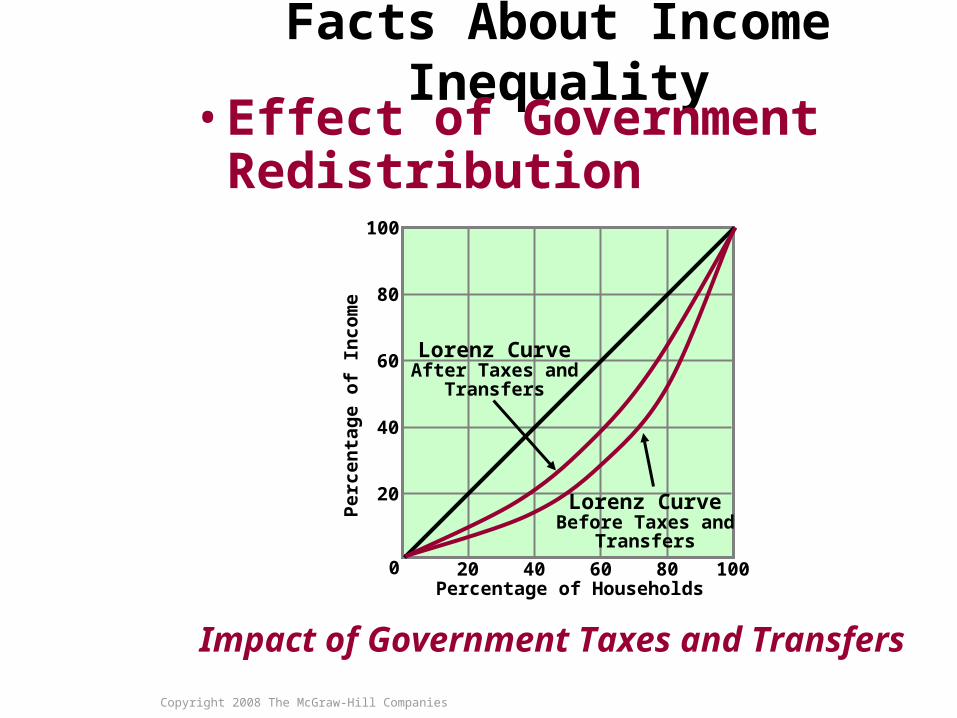
Facts About Income Inequality• Effect of Government
Redistribution
20 40 60 80 100
20
40
60
80
100
0
Lorenz CurveBefore Taxes and
Transfers
Percentage of Households
Per
cen
tag
e o
f In
co
me
Lorenz CurveAfter Taxes and
Transfers
Impact of Government Taxes and Transfers
Copyright 2008 The McGraw-Hill Companies32-14
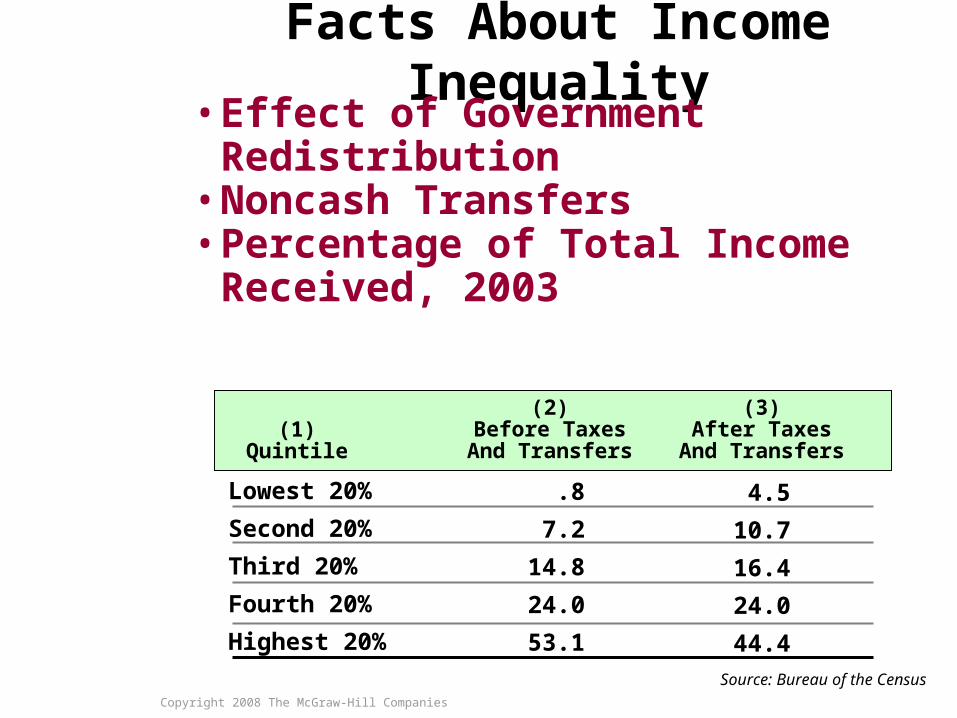
Facts About Income Inequality• Effect of Government
Redistribution• Noncash Transfers• Percentage of Total Income
Received, 2003
(1)Quintile
(2)Before TaxesAnd Transfers
Lowest 20%
Second 20%
Third 20%
Fourth 20%
Highest 20%
.8
7.2
14.8
24.0
53.1
Source: Bureau of the Census
(3)After Taxes
And Transfers
4.5
10.7
16.4
24.0
44.4
Copyright 2008 The McGraw-Hill Companies32-15
Causes of Income Inequality• Ability
• Education and Training
• Discrimination
• Preferences and Risks
• Unequal Distribution of Wealth
• Market Power
• Luck, Connections, and Misfortune
Copyright 2008 The McGraw-Hill Companies32-16
Income Inequality Over Time
• Rising Income Inequality Since 1970
• Causes of Growing Inequality– Greater Demand for Highly Skilled
Workers
– Demographic Changes
– International Trade, Immigration, and Decline in Unionism

Copyright 2008 The McGraw-Hill Companies32-17
Causes of Income Inequality
GLOBAL PERSPECTIVE
GuatemalaBrazil
South AfricaMexico
United StatesItaly
SwedenGermany
0 10 20 30 40 50
48.3
46.9
44.7
43.1
29.9
26.8
22.2
22.1
Source: World Bank, World Development Indicators, 2005
Percentage of Total Income Received by the Top One-Tenth of Income Receivers, Selected Nations

Copyright 2008 The McGraw-Hill Companies32-18
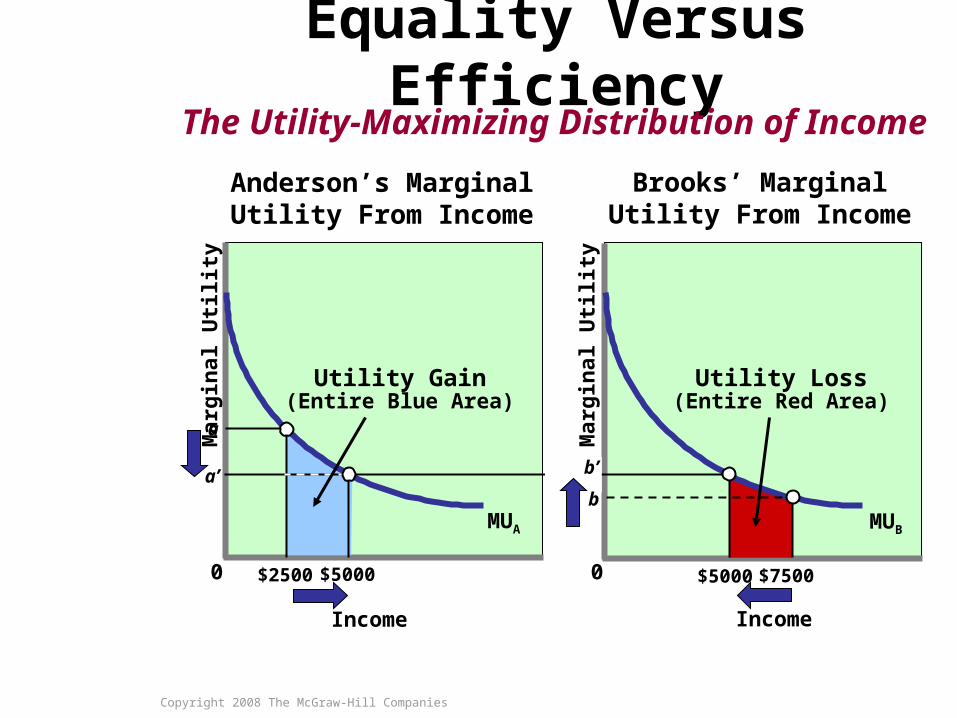
Equality Versus Efficiency
• The Case for Equality: Maximizing Total Utility
• The Case for Inequality: Incentives and Efficiency
• The Equality-Efficiency Tradeoff
Copyright 2008 The McGraw-Hill Companies32-19
Equality Versus EfficiencyThe Utility-Maximizing Distribution of Income
Anderson’s MarginalUtility From Income
Brooks’ MarginalUtility From Income
0 0M
arg
inal
Uti
lity
Mar
gin
al U
tilit
y
Income Income
$5000 $5000$2500 $7500
MUBMUA
a
a’ b’
b
Utility Gain(Entire Blue Area)
Utility Loss(Entire Red Area)
Copyright 2008 The McGraw-Hill Companies32-20
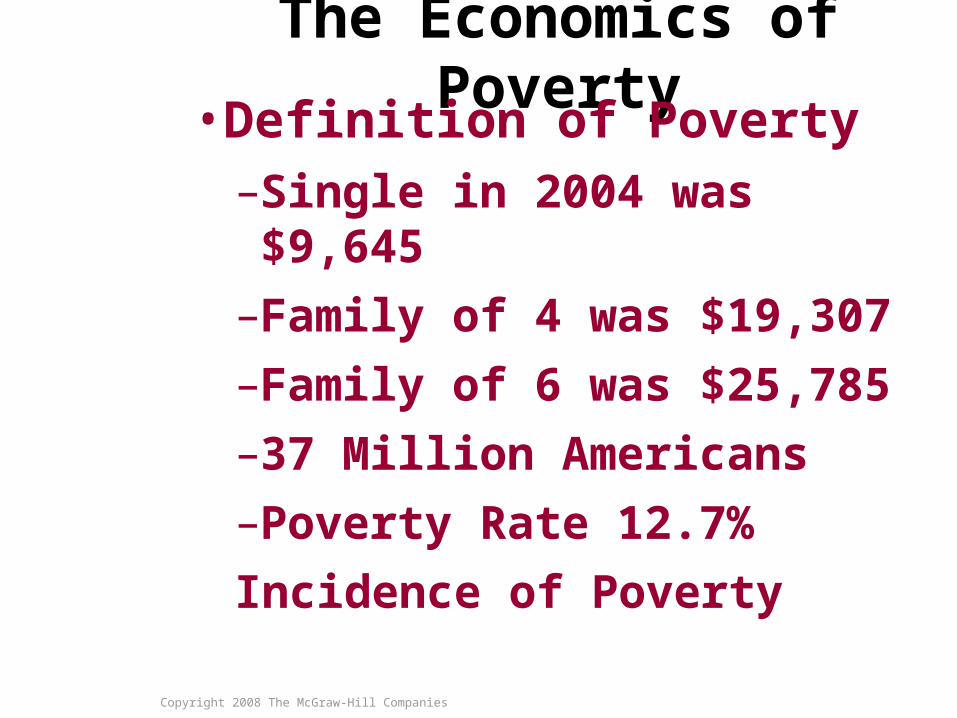
The Economics of Poverty• Definition of Poverty
–Single in 2004 was $9,645
–Family of 4 was $19,307
–Family of 6 was $25,785
–37 Million Americans
–Poverty Rate 12.7%
Incidence of Poverty
Copyright 2008 The McGraw-Hill Companies32-21
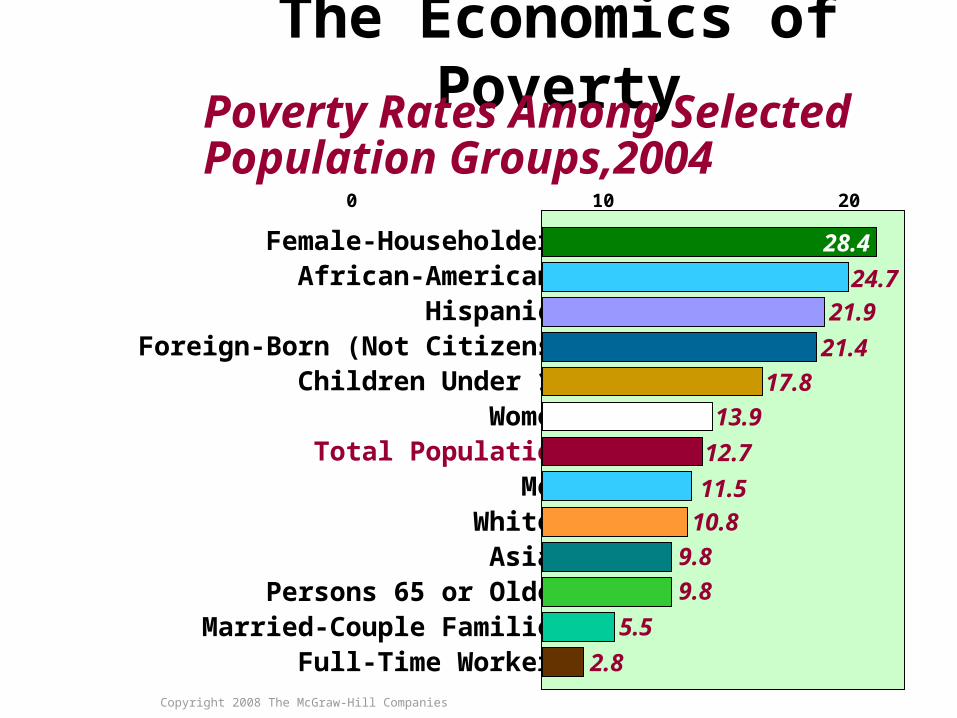
The Economics of Poverty
Female-HouseholdersAfrican-Americans
HispanicsForeign-Born (Not Citizens)
Children Under 18Women
Total PopulationMen
WhitesAsian
Persons 65 or OlderMarried-Couple Families
Full-Time Workers
0 10 20 30
24.7
21.9
21.4
17.8
13.9
12.7
11.5
10.8
9.8
9.8
5.5
2.8
28.4
Poverty Rates Among Selected Population Groups,2004
Copyright 2008 The McGraw-Hill Companies32-22
The Economics of Poverty• Poverty Trends
–Fell Between 1959 and 1969
–Stable in 1970s
–Rose in the Early 1980s
–Up and Down Late 1990s and 2000s
–Rose with Recession 2001 - 2004

Copyright 2008 The McGraw-Hill Companies32-23
Measurement Issues
• Should we use income or consumption?
• Many poor by income may have assets to fall back on
• Non-cash benefits are not counted as income
Copyright 2008 The McGraw-Hill Companies32-24
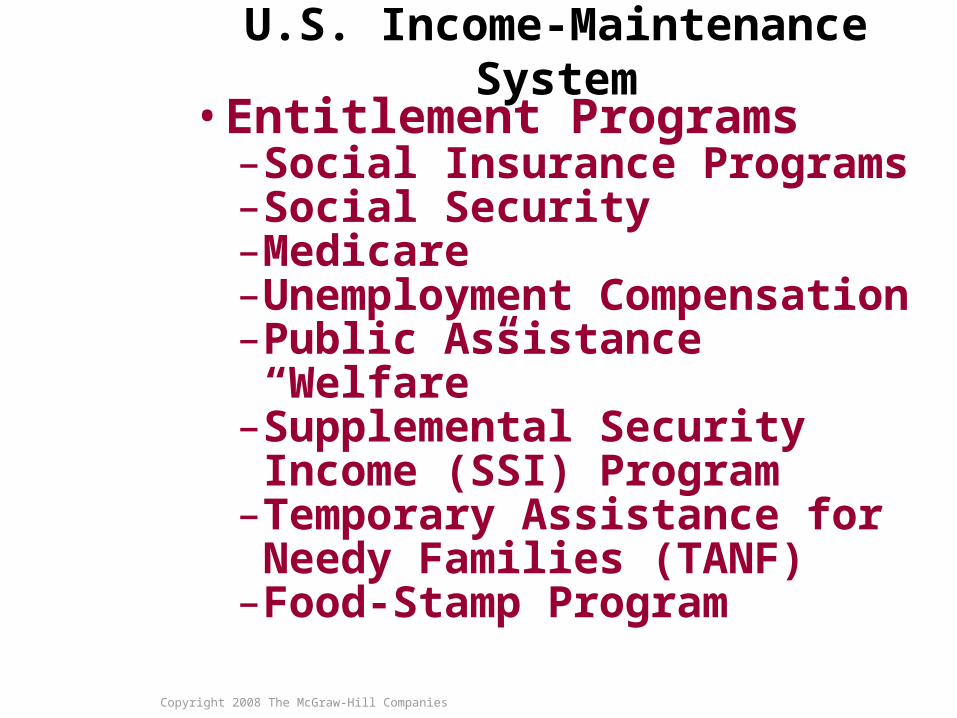
U.S. Income-Maintenance System
• Entitlement Programs–Social Insurance Programs–Social Security –Medicare–Unemployment
Compensation–Public Assistance “Welfare”–Supplemental Security
Income (SSI) Program–Temporary Assistance for
Needy Families (TANF)–Food-Stamp Program
Copyright 2008 The McGraw-Hill Companies32-25
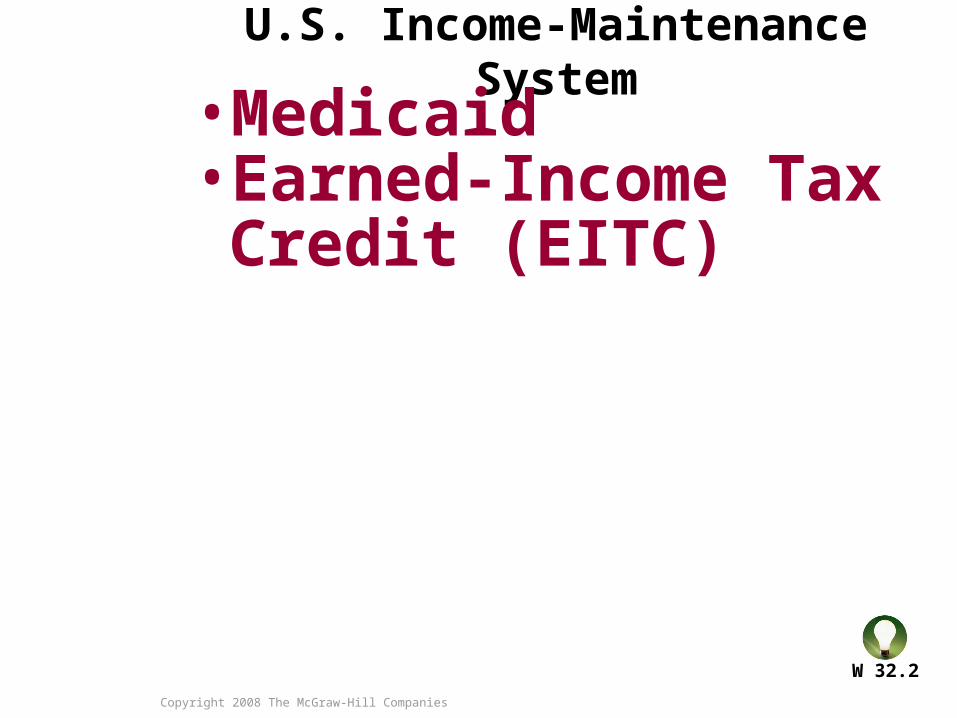
U.S. Income-Maintenance System
• Medicaid• Earned-Income Tax
Credit (EITC)
W 32.2
Copyright 2008 The McGraw-Hill Companies32-26
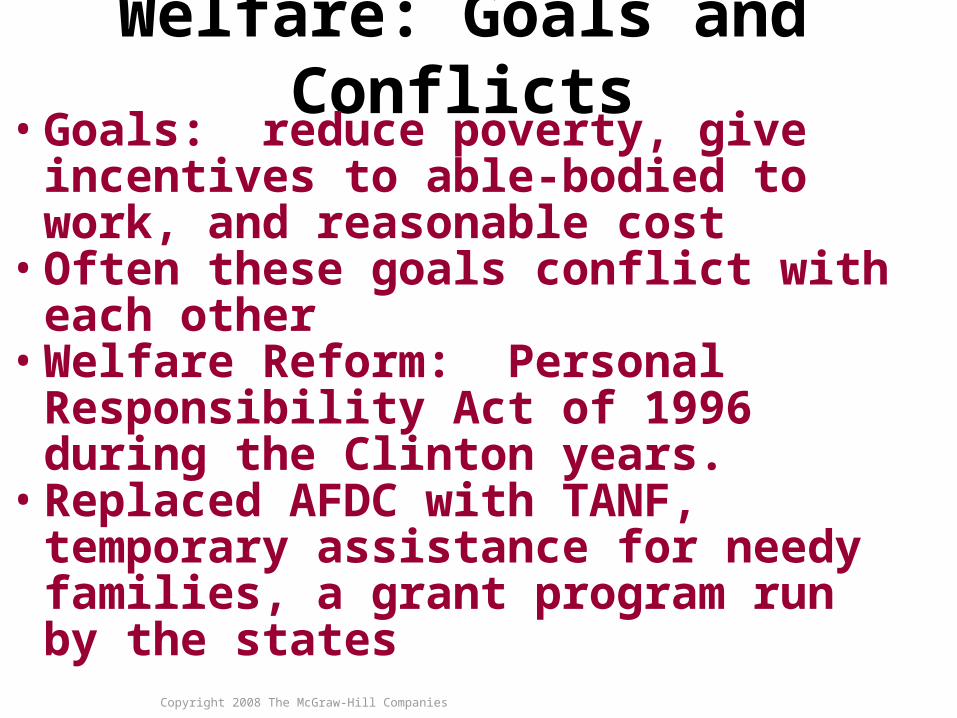
Welfare: Goals and Conflicts• Goals: reduce poverty, give
incentives to able-bodied to work, and reasonable cost
• Often these goals conflict with each other
• Welfare Reform: Personal Responsibility Act of 1996 during the Clinton years.
• Replaced AFDC with TANF, temporary assistance for needy families, a grant program run by the states

Copyright 2008 The McGraw-Hill Companies32-27
TANF
• Several reforms, including a lifetime limit of 5 years, able bodied must work after getting TANF for 2 years
• See page 629 for more reforms• Attempting the end the “culture of welfare” that
some felt existed• Number on welfare dropped from over 12 million
in 1996 to 4.5 million in 2005• About half this drop is attributed to welfare
reform, rest to other factors

Copyright 2008 The McGraw-Hill Companies32-28
U.S. Family Wealth and Its Distribution
• Family Wealth Rose Rapidly and Became More Unequal Between 1995 and 2004
Last
Word
Median and Average Family Wealth, 1995-2004 In 2004 Dollars
Year Median Average
1995199820012004
$70,80083,10091,70093,100
$260,800327,500421,500448,200
Copyright 2008 The McGraw-Hill Companies32-29
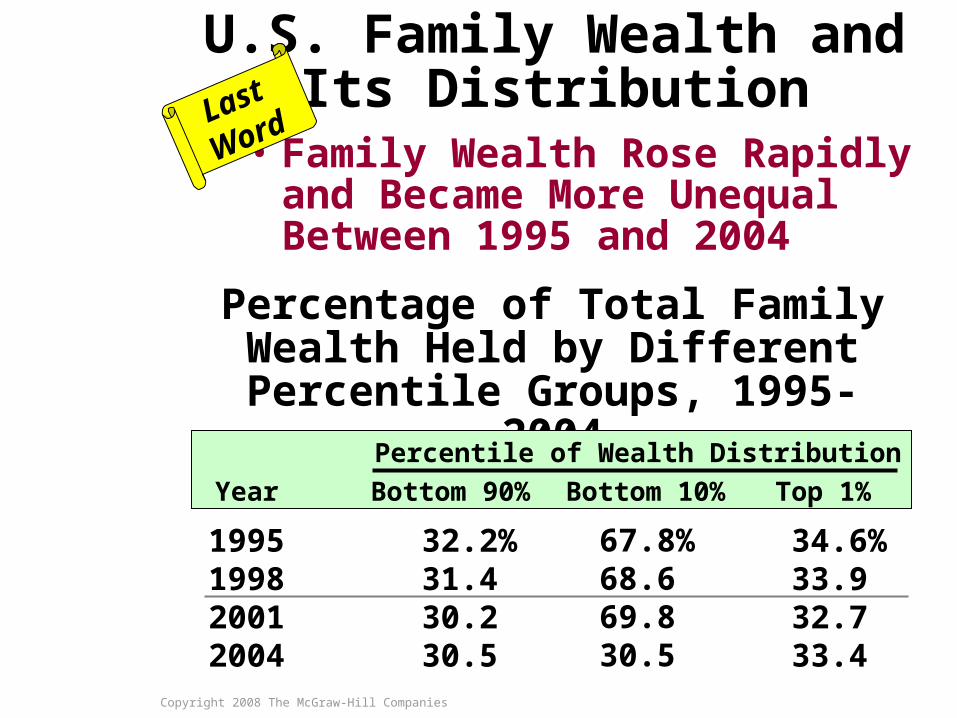
U.S. Family Wealth and Its Distribution
• Family Wealth Rose Rapidly and Became More Unequal Between 1995 and 2004
Last
Word
Percentage of Total Family Wealth Held by Different
Percentile Groups, 1995-2004
1995199820012004
32.2%31.430.230.5
34.6%33.932.733.4
Year Bottom 90% Top 1%Bottom 10%
Percentile of Wealth Distribution
67.8%68.669.830.5
Copyright 2008 The McGraw-Hill Companies32-30
Key Terms• income inequality• Lorenz curve• Gini ratio• income mobility• noncash transfers• equality-efficiency t
radeoff• poverty rate• entitlement progra
ms• social insurance pr
ograms• Social Security• Medicare
• unemployment compensation
• public assistance programs
• Supplemental Security Income (SSI)
• Temporary Assistance for Needy Families (TANF)
• food-stamp program
• Medicaid• earned-income tax
credit (EITC)

![[Www.intercambiosvirtuales.org]Principios de Economia, N. Gregory Mankiw (McGraw-Hill) 29-32](https://img.pdfslide.net/doc/110x75/55cf8f66550346703b9c0106/wwwintercambiosvirtualesorgprincipios-de-economia-n-gregory-mankiw-mcgraw-hill.jpg)