Embed Size (px)
Citation preview

Copyright © 2010 Family Wealth Alliance, LLC. All rights reserved.
Building Bridges
Landscape, Comparisons
& Implications

Copyright © 2010 Family Wealth Alliance, LLC. All rights reserved.
Competitive Landscape: Families & Firms
Fee Charging Alternatives
Outsourcing/Collaboration: Family Office Services
Three Take-a-Ways forYour Business

Copyright © 2010 Family Wealth Alliance, LLC. All rights reserved.
Executive Summary: Market Heft, Resilient MFOs, Hesitant SFOs
Family Office Market Has Heft in the North American Landscape Estimated 140 Multifamily Offices (MFOs) with Aggregate $375 billion AUAs Approximately 2,500 Single-Family Offices (SFOs) with Aggregate $1.5 trillion AUAs MFOs Average AUAs at $3.5 billion; SFOs only $450 million Total Pie of 50k Households > $30 million Estimated at $12 trillion; MFOs & SFOs: 15% Mkt.
MFOs Resilient in Face of Turmoil, Enjoy Scale & Recognition AUAs Down Only 9.2% (S&P down 37% in 2008)), Client Relationships Up 8%,
with Employee Headcount Up 9%, while Client Attrition Rates are Low at 2.6% Average Client Relationship is $51.5 Million Scale Advantage, Deeper Talent Pool, & Gaining Marketplace Recognition
SFOs Hesitant, Not Trusting Alternatives, Have Panache of Being Private Cite Challenge of Keeping Next Generation Onboard, Family Governance Issues Not as Willing to Outsource, Not Trusting Alternatives Available Panache Still There, Intimacy & Privacy, Multi-Gen. Skills Advantage

The Landscape is Changing
Copyright © 2010 Family Wealth Alliance, LLC. All rights reserved. 4
Client Net
Worth
Complexity
Enhanced Financial
Planner
Multi- Family Office
External Chief
Investment Office
External Family Office
Enh. FP
MFO
SFO Ext. FO
Single Family Office
PrivateTrust
Company
PTC
CFO
Closed Family
Office
Virtual Family Office
VFO
JVO
Joint Venture Family Office
Ext. CIO
Degree of Delegation
Trust
What the Wealthy Want Is Not Changing
Objective Advice
Stability of Relationship Management
Stability of Ownership
Open Architecture for Implementation
Competency and Consistency of Delivery
Breadth of Service Offerings
5 Copyright © 2010 Family Wealth Alliance, LLC. All rights reserved.

Ten Family Office Services 1. Portfolio Management
2. Record Keeping & Reporting
3. Estate & Wealth Transfer
4. Comprehensive Financial Planning
5. Tax & Compliance Work
6. Risk Management
7. Trust Company Services
8. Life Management
9. Family Meetings & Education
10. Strategic Philanthropy & Adm.
ServicesMost Offered
ServicesLeast Offered
Copyright © 2010 Family Wealth Alliance, LLC. All rights reserved. 6

79 Firms Participating » Down from 83 Last
Year Median of 38 Client Relationships » Up
8.6% $286.3 Billion under Advisement » Down 9.2% $51.5 Million Mean Relationship Size Employee Headcount Up 8.6% Minimum Annual Fee (Mean) » $78,000, Up 11.4% Attrition Rates » 2.6% Clients » 1.7% Assets
2009 MFO Study at a Glance
Copyright © 2010 Family Wealth Alliance, LLC. All rights reserved. 7

Copyright © 2010 Family Wealth Alliance, LLC. All rights reserved. 8
Highlights of MFO Research
Storm Damage Appears Relatively Minor Firms Facing a New Competitive Landscape Surge in Hiring of Relationship Managers MFO Executives Remain Highly Optimistic Evidence of Fee Compression Margins also Compressed, Perhaps
Temporarily Merger Activity Is Picking Up Again Building Bridges with Single-Family Offices
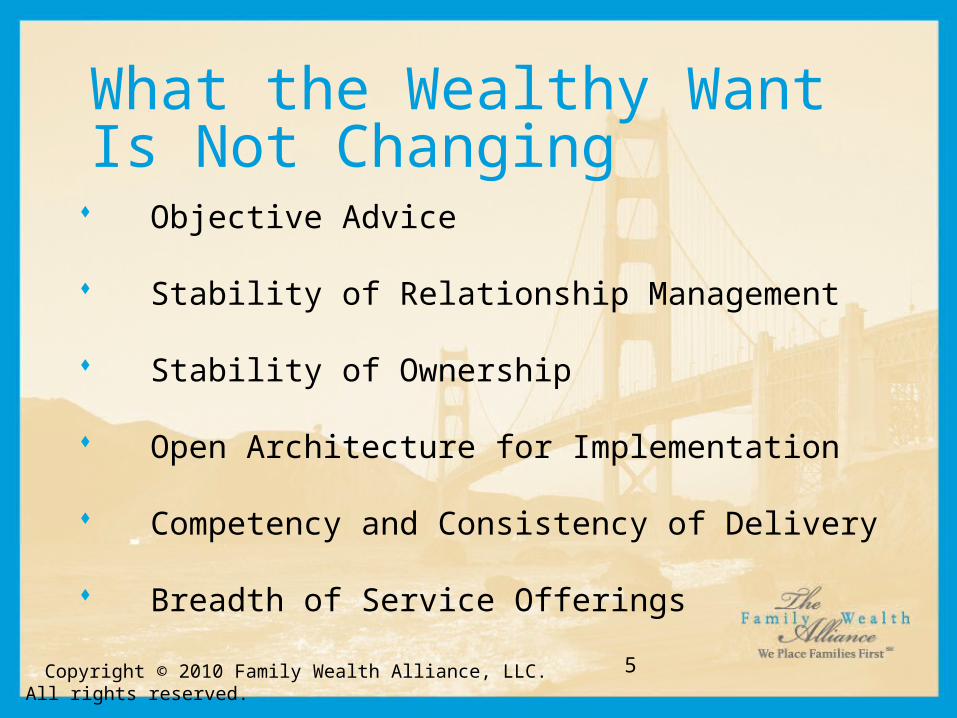
A Shift from Asset-Based Fees to an Annual Retainer
Asset Based Fees
Percent of Net Worth
Annual Retainer
HourlyRate
9 Copyright © 2010 Family Wealth Alliance, LLC. All rights reserved.

2008 %∆ 2007Revenue per $ Assets (bps) 60 -3.2 62
Expense per $ Assets (bps) 57 35.7 42
Profit Margin (%) 13.1% -42.3 22.7%
Operating Ratios for MFOs
Copyright © 2010 Family Wealth Alliance, LLC. All rights reserved. 10

Your Top 3 Competitors, Today and 3 Years AgoRank Today Rank 3 Years Ago
Goldman Sachs 1 1
Bessemer Trust 2 4
GenSpring 2 8
Northern Trust 4 3
J.P. Morgan 5 6
U.S. Trust 15 2
Merrill Lynch 27 5
Morgan Stanley 29 9
New Competitive Landscape
Copyright © 2010 Family Wealth Alliance, LLC. All rights reserved. 11

30 Single-Family Offices Participating to
Date Range of Assets Supervised = $450,000 to $2B Chief Executive Is a Family Member at 44.8% Average of 2.5 Generations, 14 Households Served Family Households Not Served = 6.1% Median Age of Family Office = 12 Years Youngest = 1 Year, Oldest =100 Years One in Six (16.7%) Part of an Operating Business
2009 SFO Study Interim Report
Copyright © 2010 Family Wealth Alliance, LLC. All rights reserved. 12

An Overlay of Stress from Plunging Markets
Strong Underlying Concern about Sustainability
Single-Family Offices Inherently Unstable
Fighting the Reality of ‘Generational Decay’
You Are in a Scale Business, Like It or Not
Not Immune from Advisory Firm Economics
Recognition of Challenges They Face
Openness to Partnering & New Solutions
The View from 10,000 Feet
Copyright © 2010 Family Wealth Alliance, LLC. All rights reserved. 13

Copyright © 2010 Family Wealth Alliance, LLC. All rights reserved. 14
Top Challenges: SFOs & MFOsFor the MFOs:Human Capital
Business Development
Managing Growth
Technology, Client Reporting
Marketplace Awareness
Profitability
Managing Client Expectations
Economic Turmoil
Invest. Client Portfolios
Operational Efficiencies
For the SFOs:1. Gen./Family Relationships
2. Investments
3. Human Capital
4. Justifying Expenses/Budget
5. Sustainability & Strategy
6. Financial/Generational Plan.
7. Consolid. Reporting/Tech.
8. Liquidity & Cash Management
9. Compliance, Tax and Legal
10. Managing Growth

Copyright © 2010 Family Wealth Alliance, LLC. All rights reserved. 15
Of the MFOs:Advice on Private Equity
Trustee Services
Advice on Job Search
Property-Casualty Risk Review
Gold Investments
Partnership Accounting
Enhanced Tax Reporting
Foundation Consulting
Family Education
Rising Expectations:What Clients are Asking For Now
Of the SFOs: Aircraft Management
Managing Newly Acquired Business
Family Investment Partnership
More Family Communication
Estate Planning
Foundation Management
Family Education

Copyright © 2010 Family Wealth Alliance, LLC. All rights reserved. 16
Overall Strengths (S) & Achilles Heels (A) MFOs SFOs
1. Client Trust/Office Integrity S S
2. Financial Planning S A
3. Scale S A
4. Investment Management S A
5. Fiduciary Management A S
6. Family Ed. & Communication A S
7. Client & Office Intimacy A S
8. Inter/Intra-Family Interaction A S
9. Consolidated Reporting. A A
10. Security A A
Complementary Skills

Copyright © 2010 Family Wealth Alliance, LLC. All rights reserved. 17
Comparison of Scalability: I
Mean Size of Participating MFOs
@ $3.8 Billion AUAs
Mean Size of Participating SFOs
@ $450 Million AUAs

MFO AUAs* SFO AUAs*
Tier Assets Per Employee Per Employee
I >$5B $182.6M $100.2M+
II $1B->$5B 94.1 83.4 - 100.2
III $0.5B-<$1B 90.3 54.3 - 83.4
IV <$0.5B 26.1 18.7
Comparisons of Scalability: II … but Research Is Inconclusive that Scale Translates into Efficiencies
* Sample From Participating MFOs & SFOs Only
Copyright © 2010 Family Wealth Alliance, LLC. All rights reserved. 18

Tier Assets________________________________
I >$1B 28.0 45.9
II $0.5B-<$1B 39.0 41.2
III $100M-<$0.5B 40.0-51.0 71.5
IV <$100 40.0-62.0 231.6
Mean MFO*Fees in BPs
Mean SFO*Costs in BPs
However, the Data Suggests MFOs Do Have the Early Advantage in Fees vs. Costs.
Comparisons of Scalability: III
* Sample From Participating MFOs & SFOs Only
19 Copyright © 2010 Family Wealth Alliance, LLC. All rights reserved.

Copyright © 2010 Family Wealth Alliance, LLC. All rights reserved. 20
Strategic Trends: I What are these Barriers to Collaboration?
1. Blurred Lines: Families & Their Advisors are Confused
2. Privacy & Control: “We Keep the Jet”
3. Family Indecision: Poor Communication & Governance
4. Lack of Culture Fit: Between SFOs & MFOs
5. No Def. of Success: MFO’s Profit vs. SFO’s Sustainability
6. Continued Human Capital Shortage: Especially RMs
7. Inefficiencies: MFOs & SF0s Dealing with Outsourcers

Copyright © 2010 Family Wealth Alliance, LLC. All rights reserved. 21
Strategic Trends: II
Key Drivers of Collaboration Will be the Following:
1. Scale Advantages2. Human Capital Requirements3. Demands of Family Members4. Complementary Nature of MFOs & SFOs5. Necessity of Sustainability

Copyright © 2010 Family Wealth Alliance, LLC. All rights reserved. 22
Implications of Current Landscape
MFOs Courting SFOs: Teenage Girls Not Yet
Dating Differences of Perspective & Def. Of Success
Not Yet Fully Understood MFOs Better Off Courting More Established
SFOs SFOs Largely in Denial, Not Trusting
Alternatives Outsource Providers Confused by Lack of
Courting Period of Transition Will Last for a While Will Necessities Overcome Mis-
Understandings? Will Venus & Mars Ever Hook-Up?

What Business are You In?
Source: Marketing Myopia by Theodore Leavitt © 1960 in Harvard Business Review
Your Firm
1. Manf. Trains & Track?
2. Railroading?
3. Transportation Biz?
4. Logistics, Warehousing& Delivery?
Be careful not to repeat the same mistake the railroad companies made in too narrowly defining their business!
Copyright © 2010 Family Wealth Alliance, LLC. All rights reserved. 23

Trends & ImplicationsCompensation Services Providers Threats
1970s Commissions Estate Planning Deregulation
1980s Technology
1990s Fee Only Complacency
2000s MFOs
2010s
Banks, Ins. Cos,& Wire Houses
Private Banks& Mutual Funds
Financial Planning
Financial Planners
Asset-BasedFees
Family Office
Annual Retainer
Trust & Scalability
Human Capital
Challenges/
Fee andCommissions
Investment Management
TheCollaborators
Family Wealth
Copyright © 2010 Family Wealth Alliance, LLC. All rights reserved. 24

Copyright © 2010 Family Wealth Alliance, LLC. All rights reserved. 25
Ten Crosscurrents in Family Wealth
1. More Choices for Families2. Renewed Focus on Family Gov.3. Nurturing Non-Financial Wealth4. Wanted: Objective Advice5. The Standards of Stewardship6. Concern: Sustainability of SFOs7. Turmoil: Traditional Providers8. Firms are Nat’ Driven by Scale9. Family Wealth is Going Global10. Families Remain Confused
1. Families: Confusion to Understanding2. Family Governance is More Practiced3. NextGen Remains an Enigma4. Deceit Remains & Fueled: Human Greed5. Commissions Become Extinct 6. Obj. Adv. the Norm, Best Advice Wins7. Savvy Competitors Learn to Collaborate8. Cycle Repeats of Consol. & Spins-Offs9. Prof. Desig. & Career Track in FW10. Global Is Common, Efficiencies Aren’t
GenSpring Family Office’s 20th Anniversary Compendium of Thought Leaders’ Views on Major Trends: The Alliance Authorship of the Above by Invitation
Current Landscape Landscape in 20 Years

Copyright © 2010 Family Wealth Alliance, LLC. All rights reserved.
Competitive Landscape: Families & Firms
Fee Charging Alternatives
Outsourcing/Collaboration: Family Office Services
Three Take-a-Ways forYour Business

Copyright © 2010 Family Wealth Alliance, LLC. All rights reserved.
Customized Consulting
Private FamiliesFirmsM&A Advisory
Involvement Offering At 3 Levels:
Executive Leader Advocate
Proprietary Research 6th Annual MFO Study 2nd Annual SFO Study 1st Private Client Survey
Unique Events40minus Leadership SummitThe Alliance Spring EventThe Alliance Fall ForumRegional Workshops

Copyright © 2010 Family Wealth Alliance, LLC. All rights reserved.
Building Bridges
Thank You!