Embed Size (px)
Citation preview
Copyright © 2011 TeamQuest Corporation. All Rights Reserved.
TeamQuest and the TeamQuest logo are registered trademarks in the US, EU and elsewhere.All other trademarks and service marks are the property of their respective owners.
Increasing Value and ROI from Capacity ManagementA Maturity Model
David WagnerBusiness Development Principal
TeamQuest Corporation
January 27, 2011
Economic Challenges andCapacity Management
Copyright © 2011 TeamQuest Corporation. All Rights Reserved.
This presentation / paper is based upon:
• March 2010: Capacity Management: A “GPS” for Keeping IT on the Right Path; BMC Viewpoint Magazine; David Wagner, Solution Labs
• January 2009: Whitepaper: Economic Challenge and Capacity Management – Increasing Value and ROI from Capacity Management: A Maturity Model; David Wagner, Solution Labs
• 2005 – 2009: Multiple PodCasts and blog entries: David Wagner (BMC and Solution Labs)
• October 12, 2005: Addressing Power and Thermal Challenges in the Data Center, BMC Viewpoint Magazine and SearchDataCenter TechTarget; Charles Rego, Architect, Intel and David Wagner, BMC
Introduction
Copyright © 2011 TeamQuest Corporation. All Rights Reserved.
• Initial Observations• Historical Perspective• Results• Implications, Challenges and Future Risks
• A New Capacity Management Maturity Model• Technical Dimensions• Business Dimensions
• Elevating Maturity and Value – Tips and Techniques• Steps and approaches• Identifying Stakeholders and Achieving Business Alignment• Quantifying Value
• Capacity Management: Summary
Outline
Copyright © 2011 TeamQuest Corporation. All Rights Reserved.
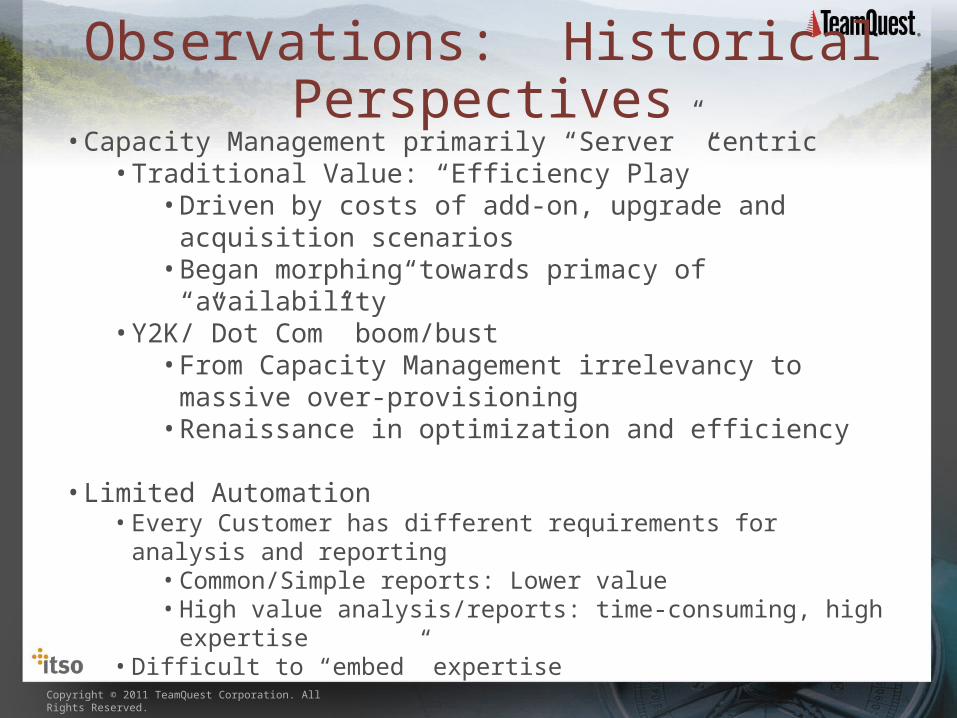
• Capacity Management primarily “Server” centric• Traditional Value: “Efficiency Play”
• Driven by costs of add-on, upgrade and acquisition scenarios• Began morphing towards primacy of “availability”
• Y2K/”Dot Com” boom/bust• From Capacity Management irrelevancy to massive over-
provisioning• Renaissance in optimization and efficiency
• Limited Automation• Every Customer has different requirements for analysis and reporting
• Common/Simple reports: Lower value• High value analysis/reports: time-consuming, high expertise
• Difficult to “embed” expertise
Observations: Historical Perspectives
Copyright © 2011 TeamQuest Corporation. All Rights Reserved.
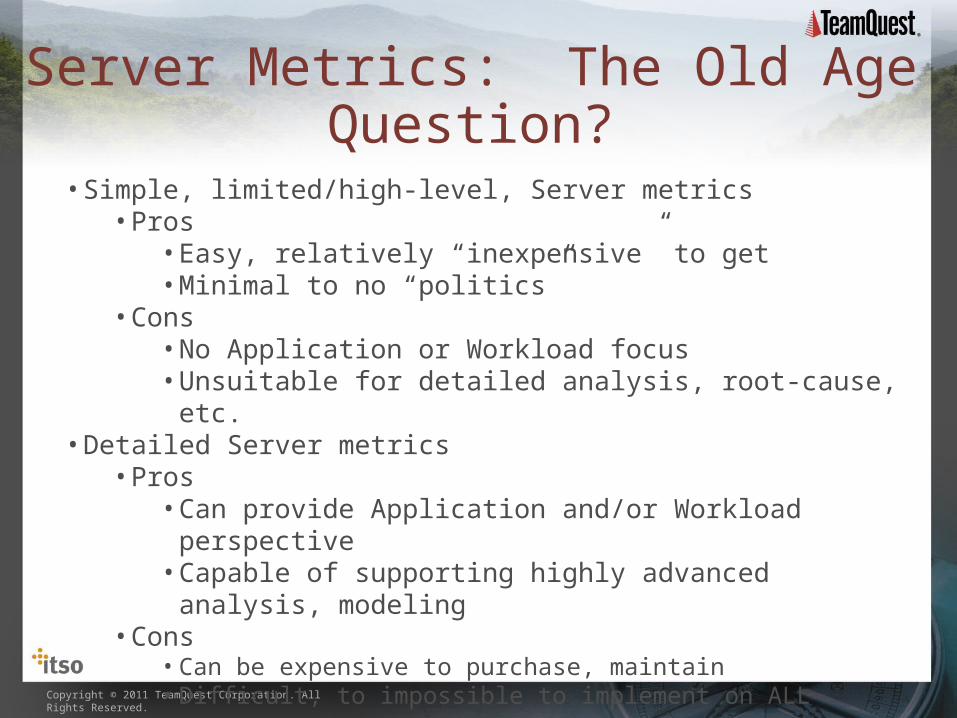
• Simple, limited/high-level, Server metrics• Pros
• Easy, relatively “inexpensive” to get• Minimal to no “politics”
• Cons• No Application or Workload focus• Unsuitable for detailed analysis, root-cause, etc.
• Detailed Server metrics• Pros
• Can provide Application and/or Workload perspective• Capable of supporting highly advanced analysis, modeling
• Cons• Can be expensive to purchase, maintain• Difficult, to impossible to implement on ALL servers
Server Metrics: The Old Age Question?
Copyright © 2011 TeamQuest Corporation. All Rights Reserved.
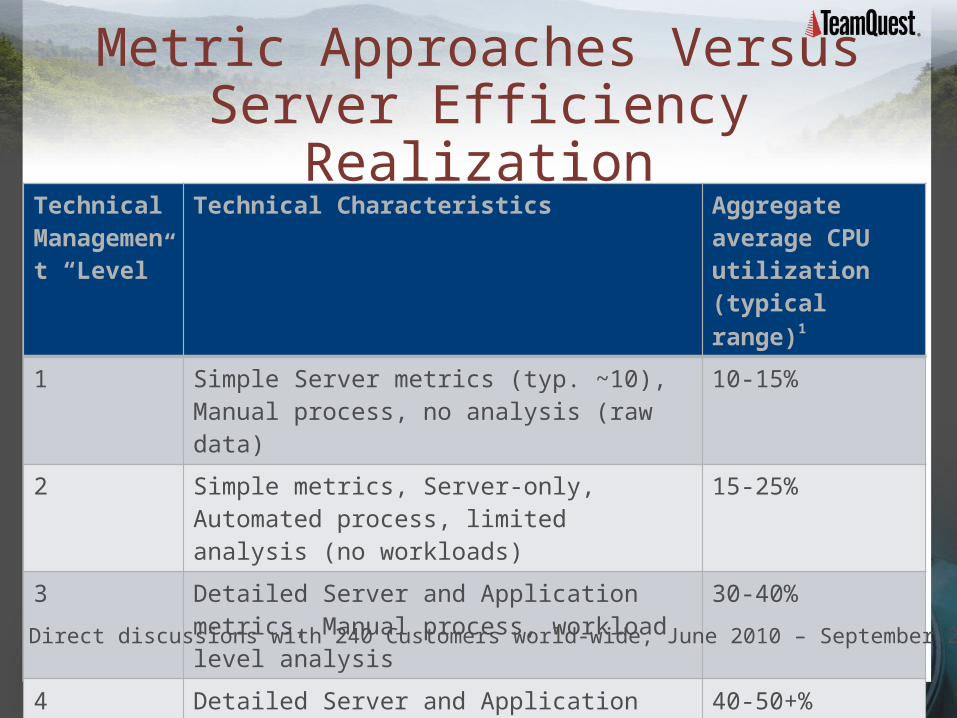
Technical Management “Level”
Technical Characteristics Aggregate average CPU utilization (typical range)1
1 Simple Server metrics (typ. ~10), Manual process, no analysis (raw data)
10-15%
2 Simple metrics, Server-only, Automated process, limited analysis (no workloads)
15-25%
3 Detailed Server and Application metrics, Manual process, workload level analysis
30-40%
4 Detailed Server and Application metrics, Automated process, workload level analysis
40-50+%
5 Detailed Server and Application metrics, Automated process, predictive analysis
60+%
1Source: Direct discussions with 240 Customers world-wide, June 2010 – September 2011
Metric Approaches Versus Server Efficiency Realization
Copyright © 2011 TeamQuest Corporation. All Rights Reserved.
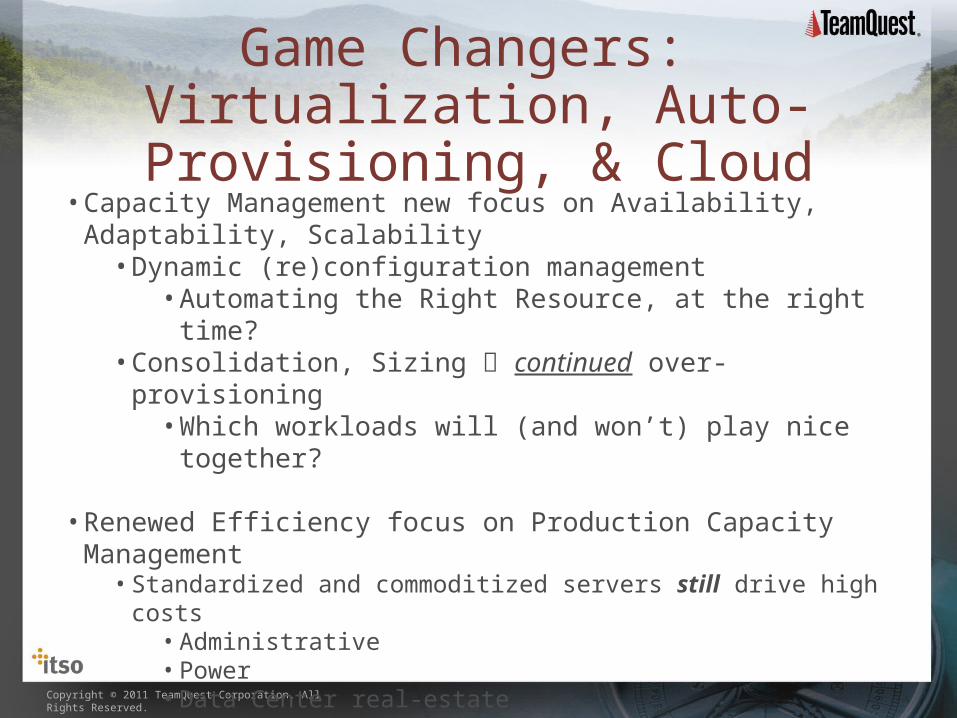
• Capacity Management new focus on Availability, Adaptability, Scalability• Dynamic (re)configuration management
• Automating the Right Resource, at the right time?• Consolidation, Sizing continued over-provisioning
• Which workloads will (and won’t) play nice together?
• Renewed Efficiency focus on Production Capacity Management• Standardized and commoditized servers still drive high costs
• Administrative• Power• Data Center real-estate• SW Licenses …
• Ongoing maintenance of Availability and Efficiency
Game Changers: Virtualization, Auto-
Provisioning, & Cloud
Copyright © 2011 TeamQuest Corporation. All Rights Reserved.
Game Changers: Virtualization, Auto-
Provisioning, & Cloud• Measurement and Management Challenges
• Large scale, virtualized, dynamically changing server configurations• Complex, multi-tiered applications spanning ever more infrastructure• Virtualized Storage
• Implications• Difficult, costly to instrument everything, everywhere in sufficient detail• Difficult to group measurements tracking constant change• Traditional Capacity Management on ever-decreasing subset of Servers
• Lower perceived value• Increased Service Risk• Reduced overall IT efficiency
Copyright © 2011 TeamQuest Corporation. All Rights Reserved.
• Infrastructure Dimension• Servers• Storage• Network• Data Center equipment
• Service Dimension• Applications• Transactional Response Time and Throughput
• Business Dimension• Financial• Time to Market• KPIs
A New Multi-Dimensional Capacity Management Model
Copyright © 2011 TeamQuest Corporation. All Rights Reserved.
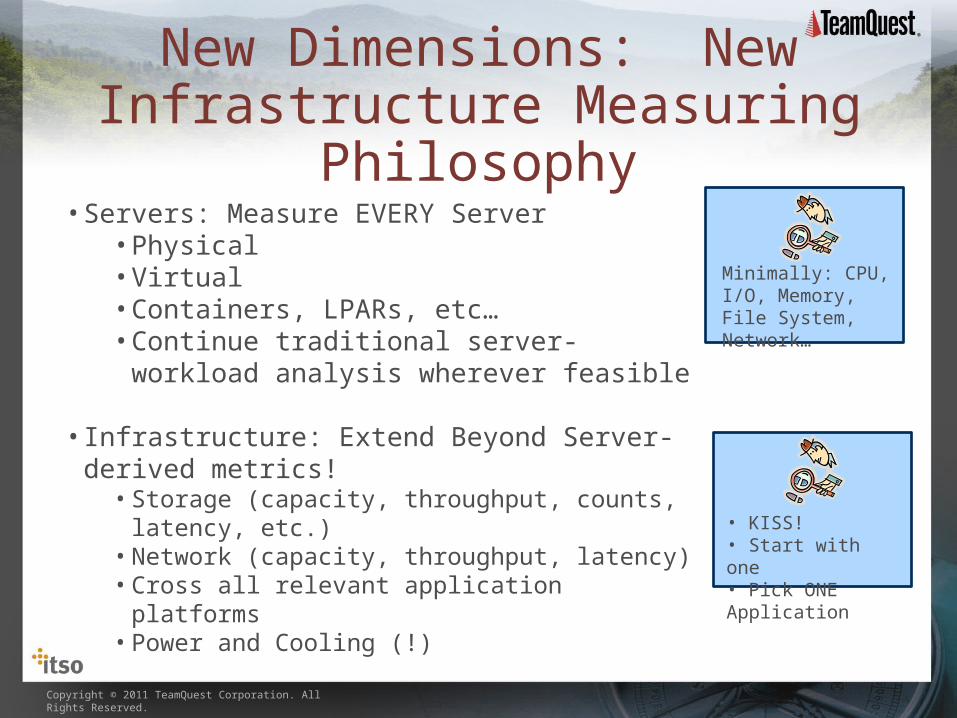
• Servers: Measure EVERY Server• Physical• Virtual• Containers, LPARs, etc…• Continue traditional server-workload analysis
wherever feasible
• Infrastructure: Extend Beyond Server-derived metrics!• Storage (capacity, throughput, counts, latency, etc.)• Network (capacity, throughput, latency)• Cross all relevant application platforms• Power and Cooling (!)
Minimally: CPU, I/O, Memory, File System, Network…
• KISS!• Start with one• Pick ONE Application
New Dimensions: New Infrastructure Measuring
Philosophy
Copyright © 2011 TeamQuest Corporation. All Rights Reserved.
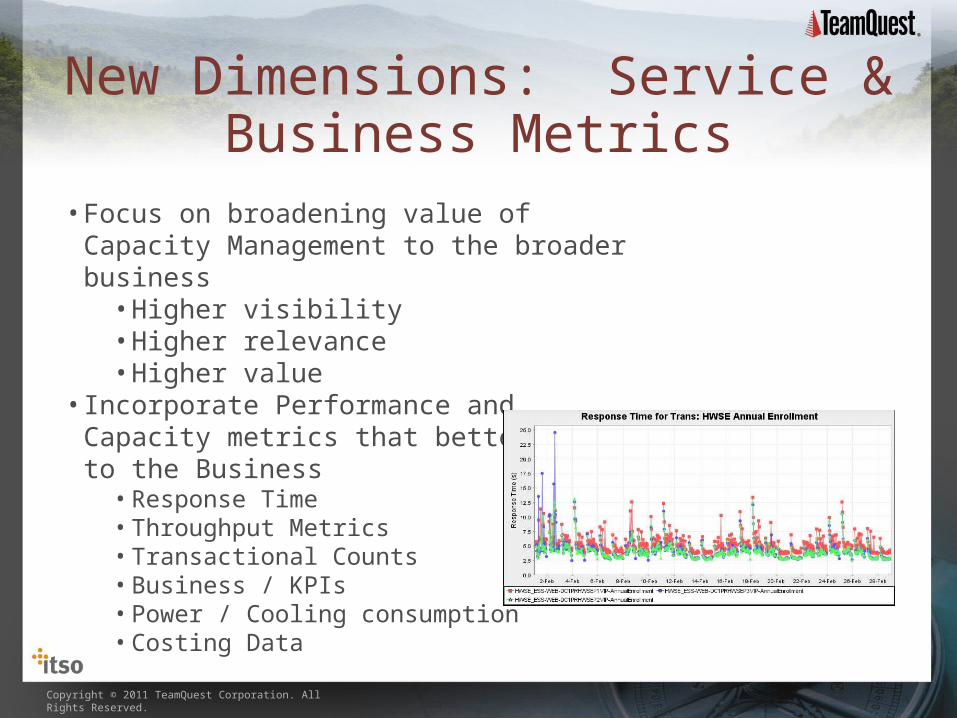
• Focus on broadening value of Capacity Management to the broader business• Higher visibility• Higher relevance• Higher value
• Incorporate Performance and Capacity metrics that better align to the Business• Response Time• Throughput Metrics• Transactional Counts• Business / KPIs• Power / Cooling consumption• Costing Data
New Dimensions: Service & Business Metrics
Copyright © 2011 TeamQuest Corporation. All Rights Reserved.
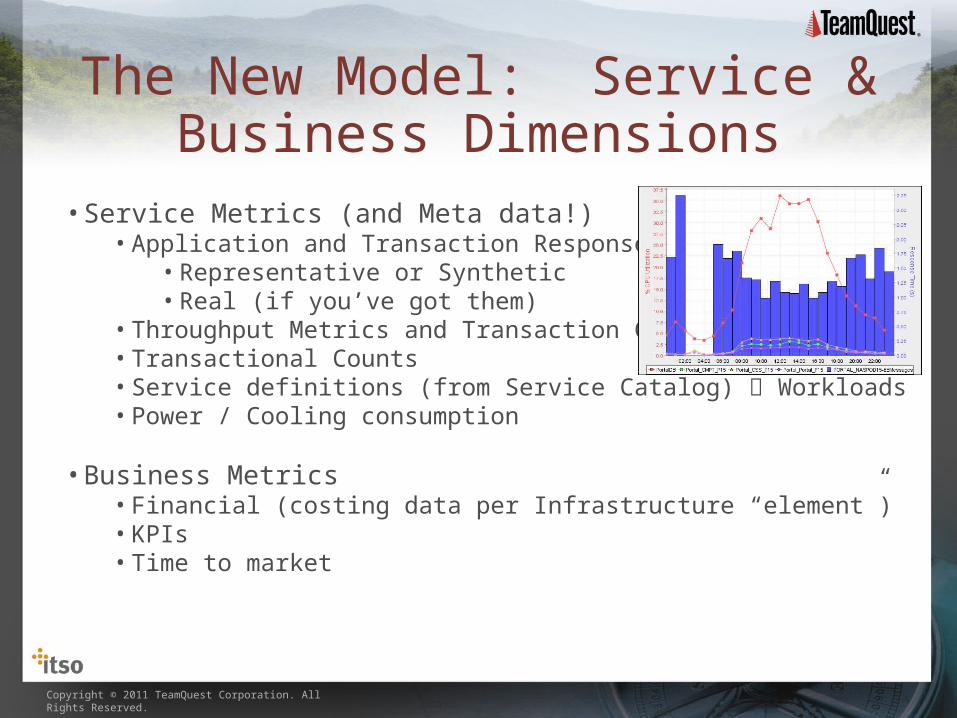
• Service Metrics (and Meta data!)• Application and Transaction Response Times
• Representative or Synthetic• Real (if you’ve got them)
• Throughput Metrics and Transaction Counts• Transactional Counts• Service definitions (from Service Catalog) Workloads• Power / Cooling consumption
• Business Metrics• Financial (costing data per Infrastructure “element”)• KPIs• Time to market
The New Model: Service & Business Dimensions
Copyright © 2011 TeamQuest Corporation. All Rights Reserved.
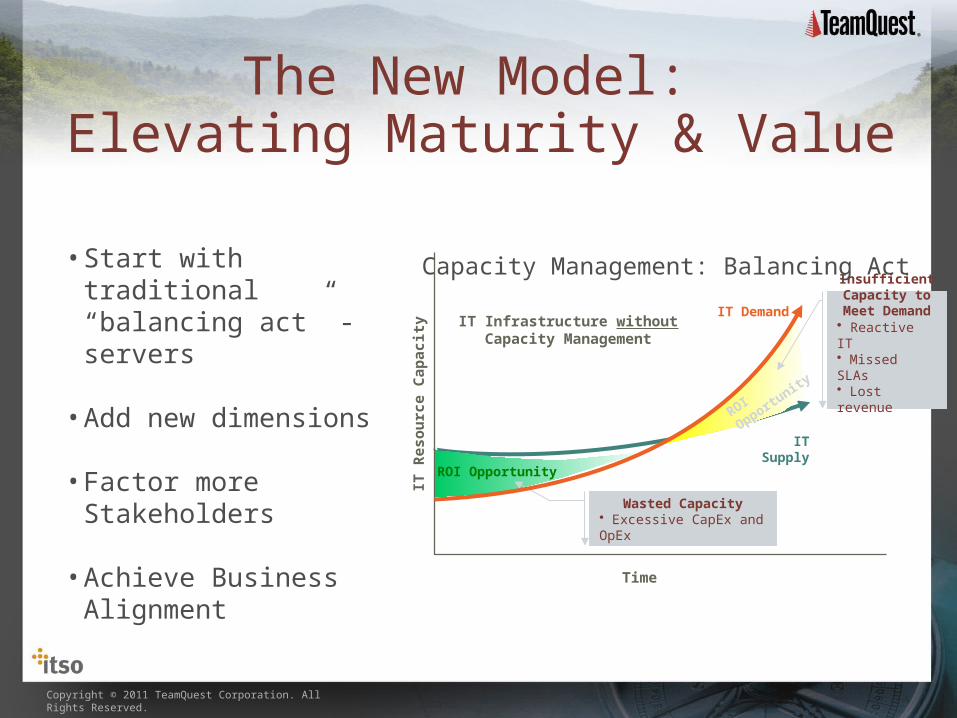
• Start with traditional“balancing act” - servers
• Add new dimensions
• Factor more Stakeholders
• Achieve Business Alignment
IT Supply
IT R
esou
rce
Capa
city
Time
IT Infrastructure without Capacity Management
ROI Opportunity
ROI Opportu
nity
Wasted Capacity• Excessive CapEx and OpEx
Insufficient Capacity to Meet
Demand• Reactive IT• Missed SLAs• Lost revenue
IT Demand
Capacity Management: Balancing Act
The New Model: Elevating Maturity & Value
Copyright © 2011 TeamQuest Corporation. All Rights Reserved.
• First, Measure Everything– “Raw” Server Metrics
• Lightweight data collection• “Monitors”
– PA / CP Performance data– All data must be kept in historical repository(ies) for at least a year!
• Next, Automate whatever reporting you are doing• Next define and automate analysis
– Exception Management– Problem identification– Proactive Forecasting– Sizing
• Finally Evaluate Predictive Modeling
Traditional Balancing Act: Increase Server Efficiency

Copyright © 2011 TeamQuest Corporation. All Rights Reserved.
• Conduct an enterprise wide tool and metric-source “audit”–Monitors (NW, Server, Storage, Application, Response time, etc.)–Other Management Tools (Scheduling, Batch, Output, Database,
etc.)– Finance Tools
• Follow complete Application “lifecycle”–Business “owners” -> Application Developers -> Test ->
Production–Determine stakeholder “performance desires”, metrics,
deliverables
• Talk to senior management–Measurability – what are their important metrics?–Accountability – what are the results they want to see?
Quick Tips to Increase Capacity Management value
Take Our Capacity Management Maturity Assessmentwww.teamquest.com/maturity
Copyright © 2011 TeamQuest Corporation. All Rights Reserved.
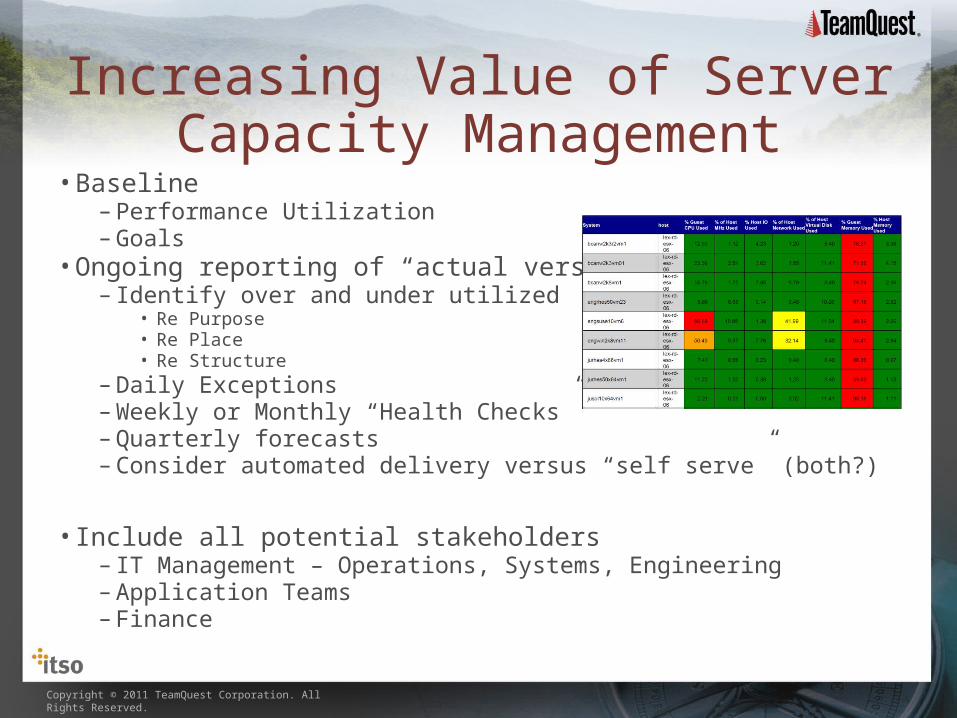
• Baseline– Performance Utilization–Goals
• Ongoing reporting of “actual versus plan”– Identify over and under utilized
• Re Purpose• Re Place• Re Structure
–Daily Exceptions–Weekly or Monthly “Health Checks”–Quarterly forecasts–Consider automated delivery versus “self serve” (both?)
• Include all potential stakeholders– IT Management – Operations, Systems, Engineering–Application Teams– Finance
Increasing Value of Server Capacity Management
Copyright © 2011 TeamQuest Corporation. All Rights Reserved.
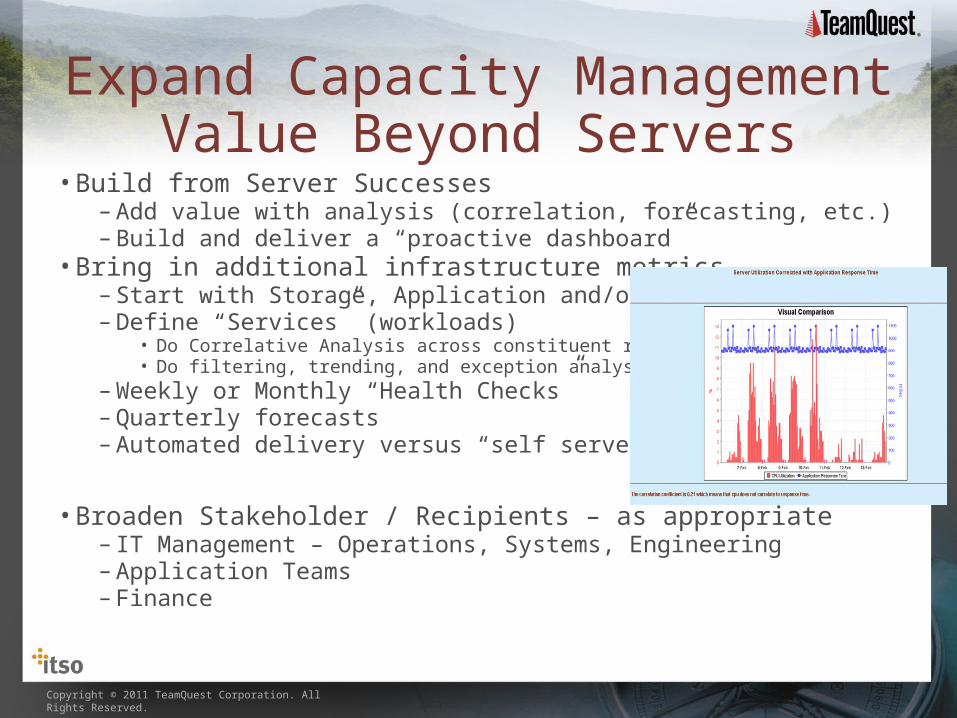
• Build from Server Successes–Add value with analysis (correlation, forecasting, etc.)–Build and deliver a “proactive dashboard”
• Bring in additional infrastructure metrics– Start with Storage, Application and/or Network–Define “Services” (workloads)
• Do Correlative Analysis across constituent resource metrics• Do filtering, trending, and exception analysis
–Weekly or Monthly “Health Checks”–Quarterly forecasts–Automated delivery versus “self serve” (both?)
• Broaden Stakeholder / Recipients – as appropriate– IT Management – Operations, Systems, Engineering–Application Teams– Finance
Expand Capacity Management Value Beyond Servers
Copyright © 2011 TeamQuest Corporation. All Rights Reserved.
• Consider automated reporting versus SharePoint versus “portal”• Application Development and Test Teams – a feedback loop
– Performance and Capacity, by application (workload)–Use correlation to/across their metrics of interest– Trends
• Operational Teams – reduces performance/capacity issues– Integrate and correlate monitoring data–Analyze for “longer wave” abnormalities–Daily Capacity Exception “advance notification”
• Finance and Business Management Teams – utilization “transparency”–Automated monthly reports–Aggregate utilization by “bucket of interest” (platform, application,
etc.)• Include as many different types of metric as possible
–Correlate financials, if available
Delivering Value to Additional Stakeholders
Copyright © 2011 TeamQuest Corporation. All Rights Reserved.
• Conceptual example–Under Condition(s) A …
• Associated with other Conditions B, C, …–At time N
• Mapped to other cycles M, O, …–With Situation X
• Correlated to other states Y, Z, …
– Then Proactively and on Exception basis identify:• Potential performance / capacity issues – when and where• Potential impact of the issues• Stakeholders and next steps
• Keys to Success– Span broad coverage of infrastructure– Embed analytic “expertise”–Map to applications and services– Integrate with other ITIL Disciplines (Service Management,
CMDB, Asset, etc…)
Business Alignment: Capacity “Decision Support”
Copyright © 2011 TeamQuest Corporation. All Rights Reserved.
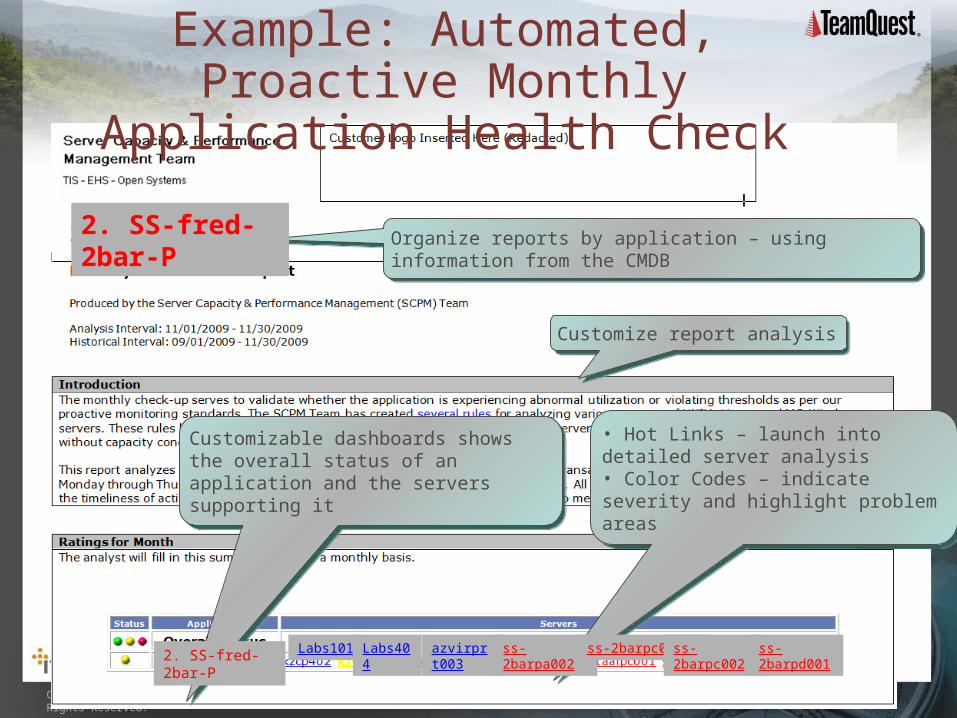
Organize reports by application – using information from the CMDBOrganize reports by application – using information from the CMDB
Customize report analysisCustomize report analysis
Customizable dashboards shows the overall status of an application and the servers supporting it
Customizable dashboards shows the overall status of an application and the servers supporting it
• Hot Links – launch into detailed server analysis• Color Codes – indicate severity and highlight problem areas
• Hot Links – launch into detailed server analysis• Color Codes – indicate severity and highlight problem areas
2. SS-fred-2bar-P
2. SS-fred-2bar-P
ss-2barpa002 ss-2barpc001 ss-2barpc002 ss-2barpd001Labs101 azvirprt003Labs404
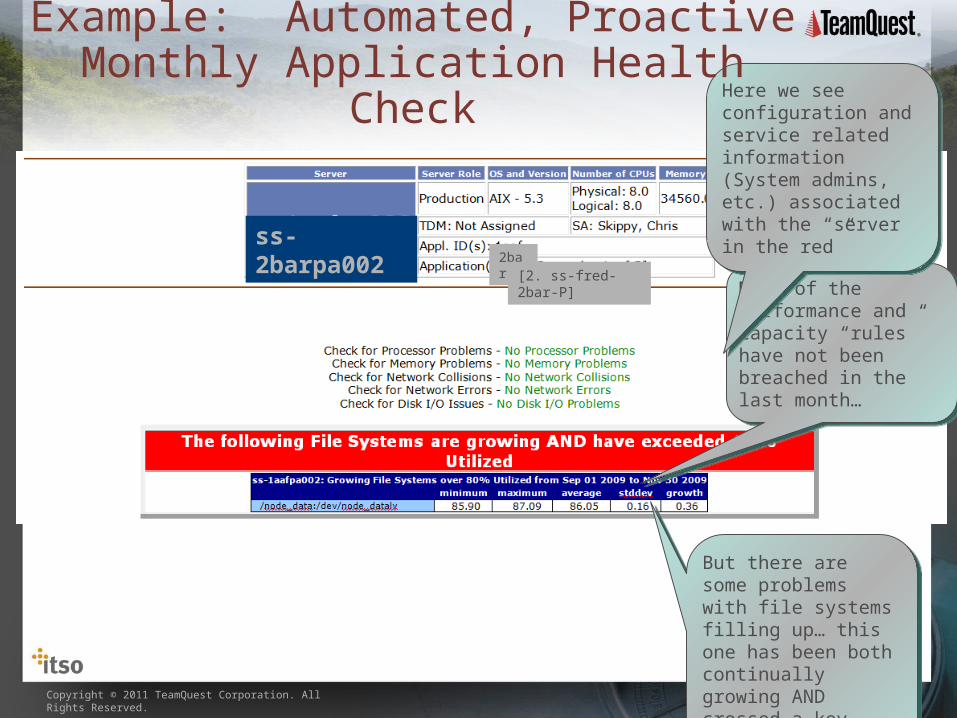
Example: Automated, Proactive Monthly Application Health
Check
Copyright © 2011 TeamQuest Corporation. All Rights Reserved.
But there are some problems with file systems filling up… this one has been both continually growing AND crossed a key threshold
But there are some problems with file systems filling up… this one has been both continually growing AND crossed a key threshold
ss-2barpa002
Most of the Performance and Capacity “rules” have not been breached in the last month…
Most of the Performance and Capacity “rules” have not been breached in the last month…
Here we see configuration and service related information (System admins, etc.) associated with the “server in the red”
Here we see configuration and service related information (System admins, etc.) associated with the “server in the red”
2bar[2. ss-fred-2bar-P]
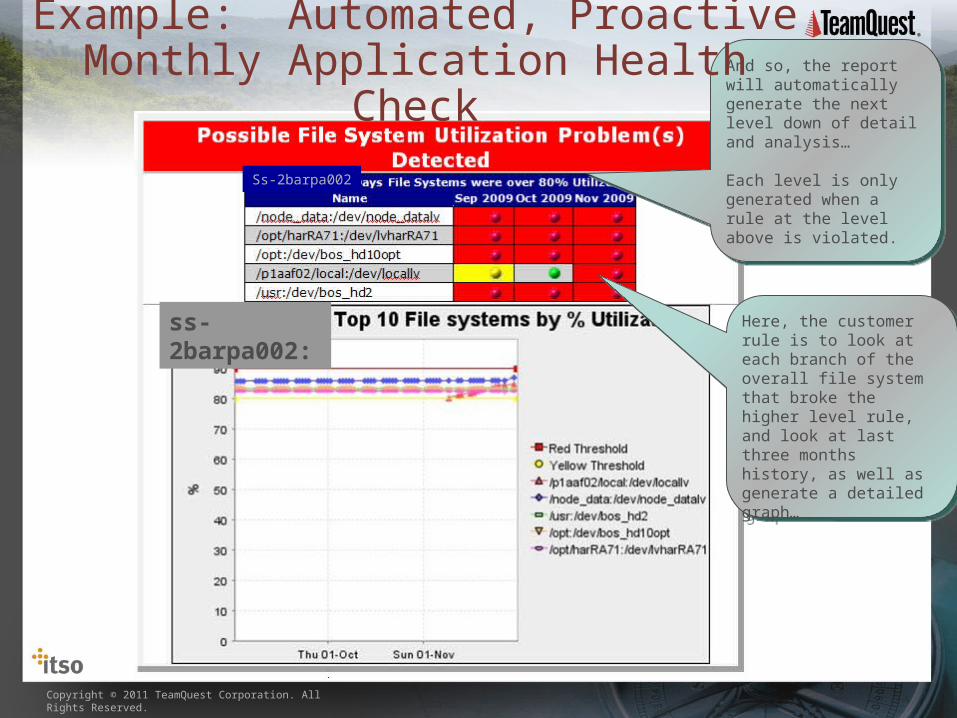
Example: Automated, Proactive Monthly Application Health Check
Copyright © 2011 TeamQuest Corporation. All Rights Reserved.
Here, the customer rule is to look at each branch of the overall file system that broke the higher level rule, and look at last three months history, as well as generate a detailed graph…
Here, the customer rule is to look at each branch of the overall file system that broke the higher level rule, and look at last three months history, as well as generate a detailed graph…
ss-2barpa002:
And so, the report will automatically generate the next level down of detail and analysis…
Each level is only generated when a rule at the level above is violated.
And so, the report will automatically generate the next level down of detail and analysis…
Each level is only generated when a rule at the level above is violated.
Ss-2barpa002
Example: Automated, Proactive Monthly Application Health Check
Copyright © 2011 TeamQuest Corporation. All Rights Reserved.
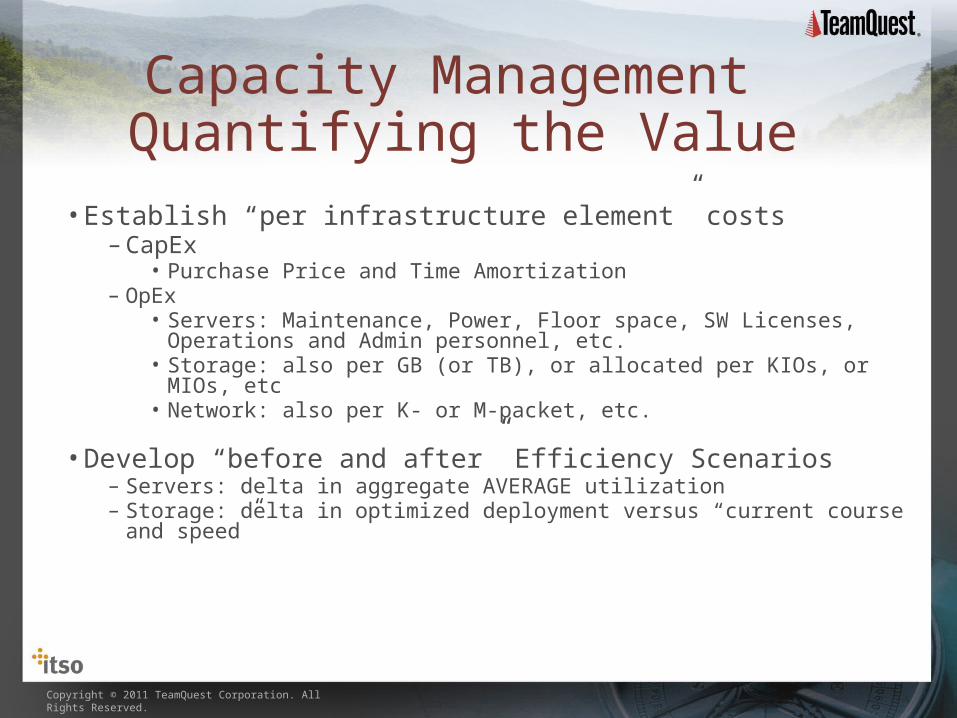
• Establish “per infrastructure element” costs–CapEx
• Purchase Price and Time Amortization– OpEx
• Servers: Maintenance, Power, Floor space, SW Licenses, Operations and Admin personnel, etc.
• Storage: also per GB (or TB), or allocated per KIOs, or MIOs, etc• Network: also per K- or M-packet, etc.
• Develop “before and after” Efficiency Scenarios– Servers: delta in aggregate AVERAGE utilization– Storage: delta in optimized deployment versus “current course and
speed”
Capacity Management Quantifying the Value
Copyright © 2011 TeamQuest Corporation. All Rights Reserved.
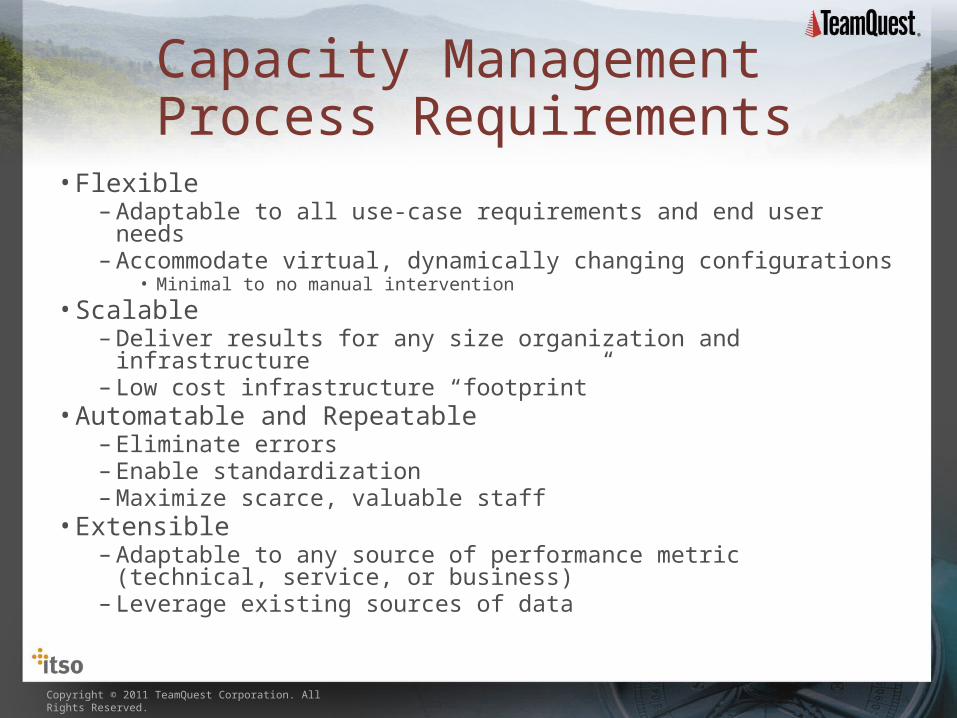
• Flexible–Adaptable to all use-case requirements and end user needs–Accommodate virtual, dynamically changing configurations
• Minimal to no manual intervention
• Scalable–Deliver results for any size organization and infrastructure– Low cost infrastructure “footprint”
• Automatable and Repeatable– Eliminate errors– Enable standardization–Maximize scarce, valuable staff
• Extensible–Adaptable to any source of performance metric (technical,
service, or business)– Leverage existing sources of data
Capacity Management Process Requirements
Copyright © 2011 TeamQuest Corporation. All Rights Reserved.
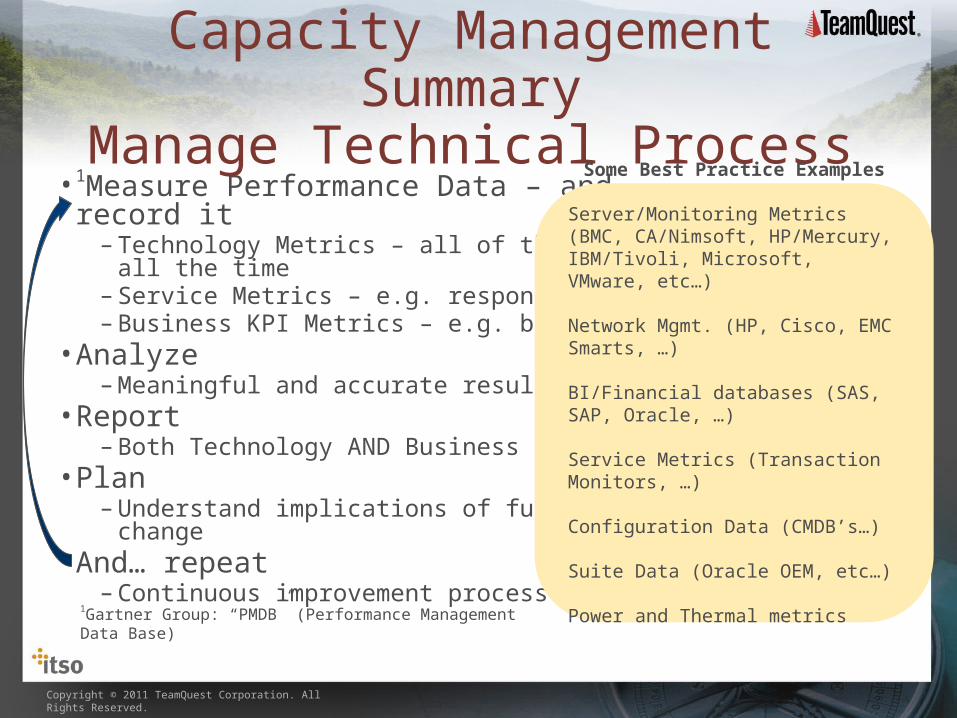
• 1Measure Performance Data – andrecord it– Technology Metrics – all of them,
all the time– Service Metrics – e.g. response times–Business KPI Metrics – e.g. business throughput
• Analyze–Meaningful and accurate results
• Report–Both Technology AND Business decision makers
• Plan–Understand implications of future demand and other change
• And… repeat–Continuous improvement process
Capacity Management Summary
Manage Technical ProcessSome Best Practice Examples
Server/Monitoring Metrics (BMC, CA/Nimsoft, HP/Mercury, IBM/Tivoli, Microsoft, VMware, etc…)
Network Mgmt. (HP, Cisco, EMC Smarts, …)
BI/Financial databases (SAS, SAP, Oracle, …)
Service Metrics (Transaction Monitors, …)
Configuration Data (CMDB’s…)
Suite Data (Oracle OEM, etc…)
Power and Thermal metrics
1Gartner Group: “PMDB” (Performance Management Data Base)
Copyright © 2011 TeamQuest Corporation. All Rights Reserved.
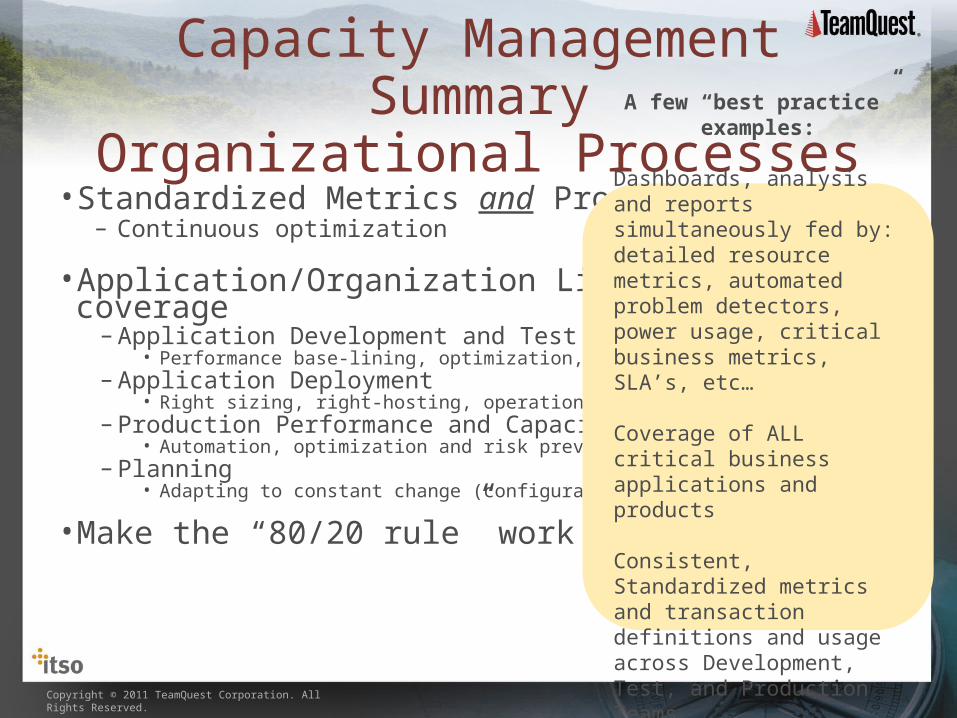
• Standardized Metrics and Processes– Continuous optimization
• Application/Organization Lifecycle coverage–Application Development and Test
• Performance base-lining, optimization, diagnosis–Application Deployment
• Right sizing, right-hosting, operational guidelines– Production Performance and Capacity Management
• Automation, optimization and risk prevention– Planning
• Adapting to constant change (configuration, demand, etc.)
•Make the “80/20 rule” work FOR you!
Capacity Management Summary
Organizational ProcessesA few “best practice” examples:
Dashboards, analysis and reports simultaneously fed by: detailed resource metrics, automated problem detectors, power usage, critical business metrics, SLA’s, etc…
Coverage of ALL critical business applications and products
Consistent, Standardized metrics and transaction definitions and usage across Development, Test, and Production Teams