Embed Size (px)
Citation preview

Copyright 2012, University Corporation for Atmospheric Research, all rights reserved
Verifying Ensembles &Probability Fcsts with MET
Ensemble Stat Tool Ensemble Mean Fields Probability Fields Rank Histograms
Point Stat and Grid Stat Tool Brier Score + Decomposition Reliability Diagrams Receiver Operating Characteristic
Diagram + Area Under the Curve Joint/Conditional factorization table
Presenter: Tara Jensen
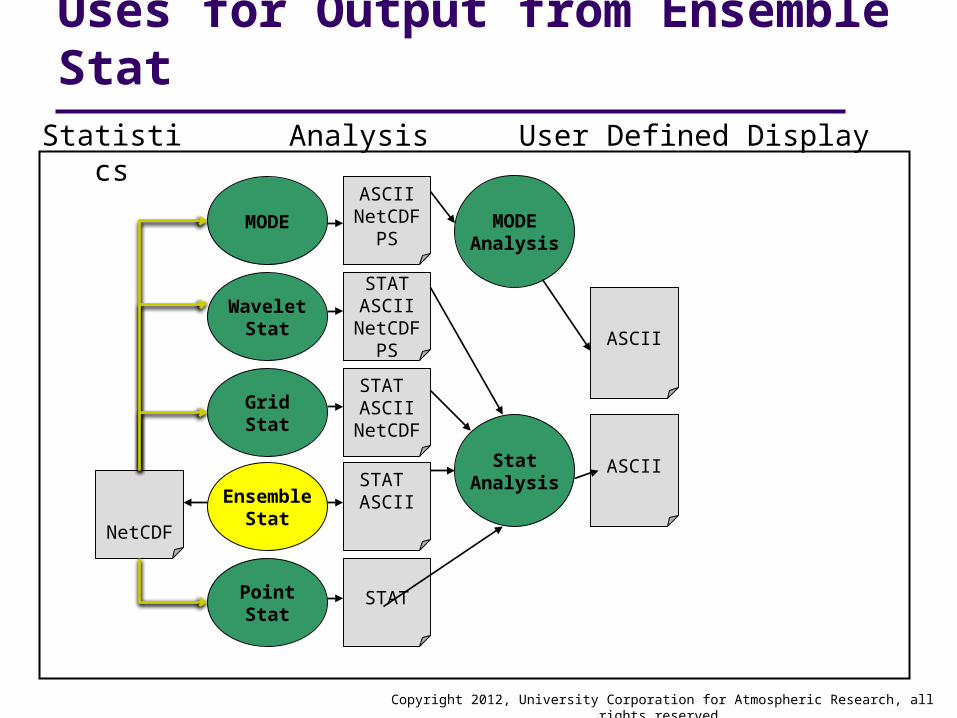
Statistics
StatAnalysis
MODEAnalysis
ASCII
ASCII
User Defined Display
Ensemble Stat Tool
UserGraphicsPackage
Analysis
UserGraphicsPackage
Copyright 2012, University Corporation for Atmospheric Research, all rights reserved
WaveletStat
MODE
GridStat
EnsembleStat
PointStat
STAT
ASCIINetCDF
PS
STAT ASCII
NetCDF
STATASCII
NetCDFPS
STAT ASCII
NetCDF
Copyright 2012, University Corporation for Atmospheric Research, all rights reserved
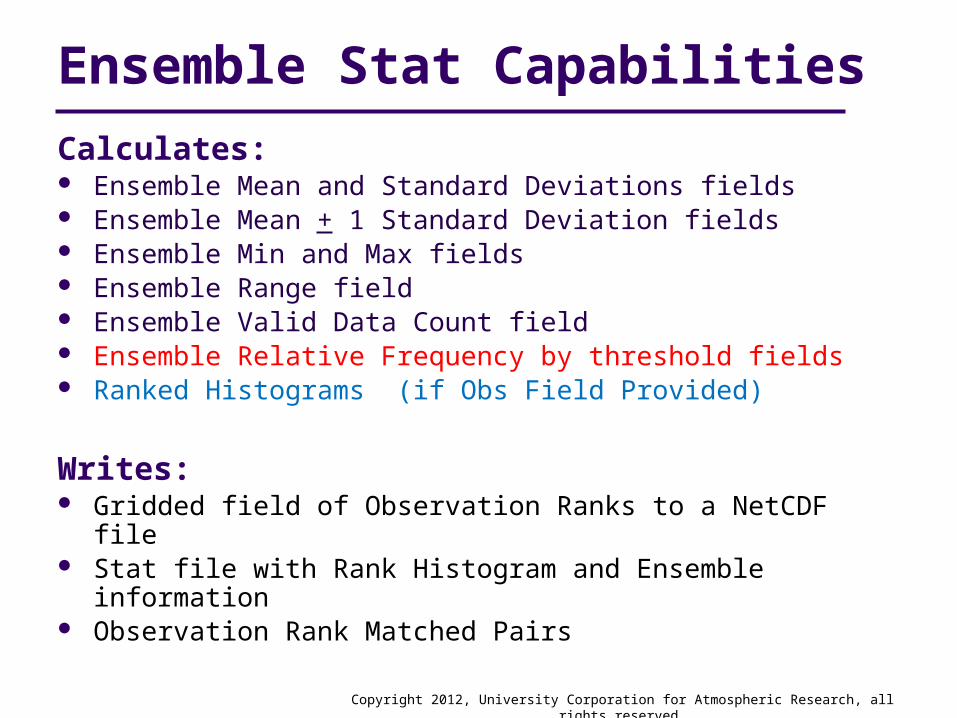
Ensemble Stat Capabilities
Calculates: Ensemble Mean and Standard Deviations fields Ensemble Mean + 1 Standard Deviation fields Ensemble Min and Max fields Ensemble Range field Ensemble Valid Data Count field Ensemble Relative Frequency by threshold fields Ranked Histograms (if Obs Field Provided)
Writes: Gridded field of Observation Ranks to a NetCDF file Stat file with Rank Histogram and Ensemble information Observation Rank Matched Pairs
Copyright 2012, University Corporation for Atmospheric Research, all rights reserved
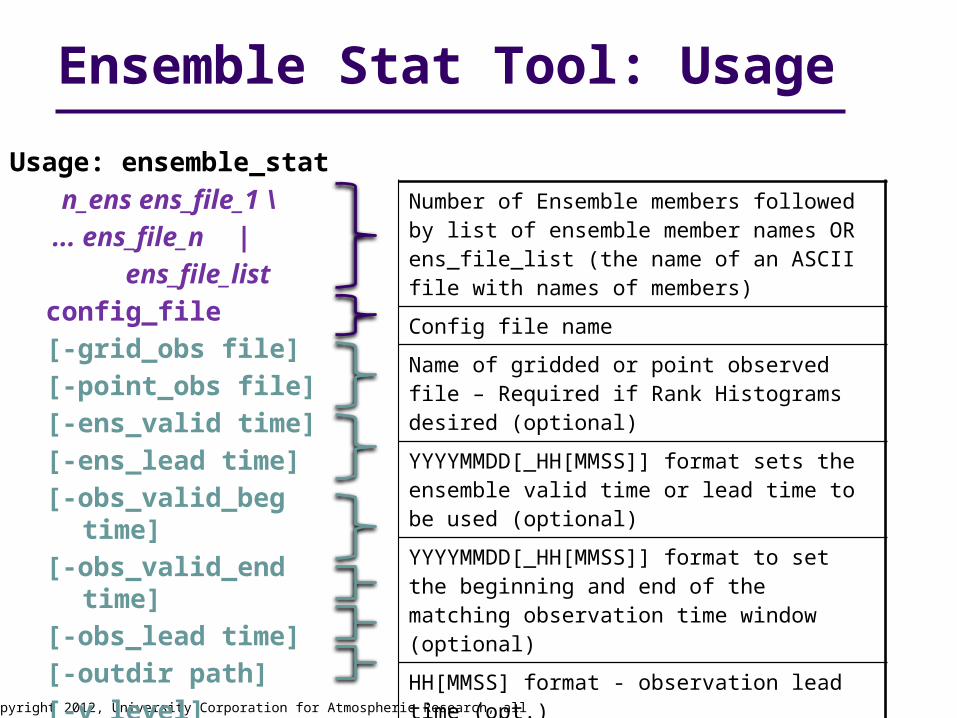
Ensemble Stat Tool: Usage
Usage: ensemble_stat
n_ens ens_file_1 \
... ens_file_n |
ens_file_list
config_file
[-grid_obs file]
[-point_obs file]
[-ens_valid time]
[-ens_lead time]
[-obs_valid_beg time]
[-obs_valid_end time]
[-obs_lead time]
[-outdir path]
[-v level]
Number of Ensemble members followed by list of ensemble member names OR ens_file_list (the name of an ASCII file with names of members)
Config file name
Name of gridded or point observed file – Required if Rank Histograms desired (optional)
YYYYMMDD[_HH[MMSS]] format sets the ensemble valid time or lead time to be used (optional)
YYYYMMDD[_HH[MMSS]] format to set the beginning and end of the matching observation time window (optional)
HH[MMSS] format - observation lead time (opt.)
Set output directory (optional)
Set level of verbosity (optional)

23 configurable parameters – set only a few:
Set Ensemble Field to Precip for calculating Ensemble Mean, Std. Dev, Ens Relative Freq fields, etc.. ens_field[ ] = [“61/A24”];
Using only the following thresholds ens_thresh[ ] = [“gt0.0 ge12.7 ge25.4”];
Set ratio of valid members (data values) to total ensemble members required for processing valid_ens_thresh = 0.5; valid_data_thresh = 0.5;
Set fcst_field and obs_field to Precip for calculating Rank Histograms fcst_field[ ] = [“61/A24”]; obs_field[ ] = [“ ”];
Copyright 2012, University Corporation for Atmospheric Research, all rights reserved
Ensemble Stat Tool: Configuration
Copyright 2012, University Corporation for Atmospheric Research, all rights reserved
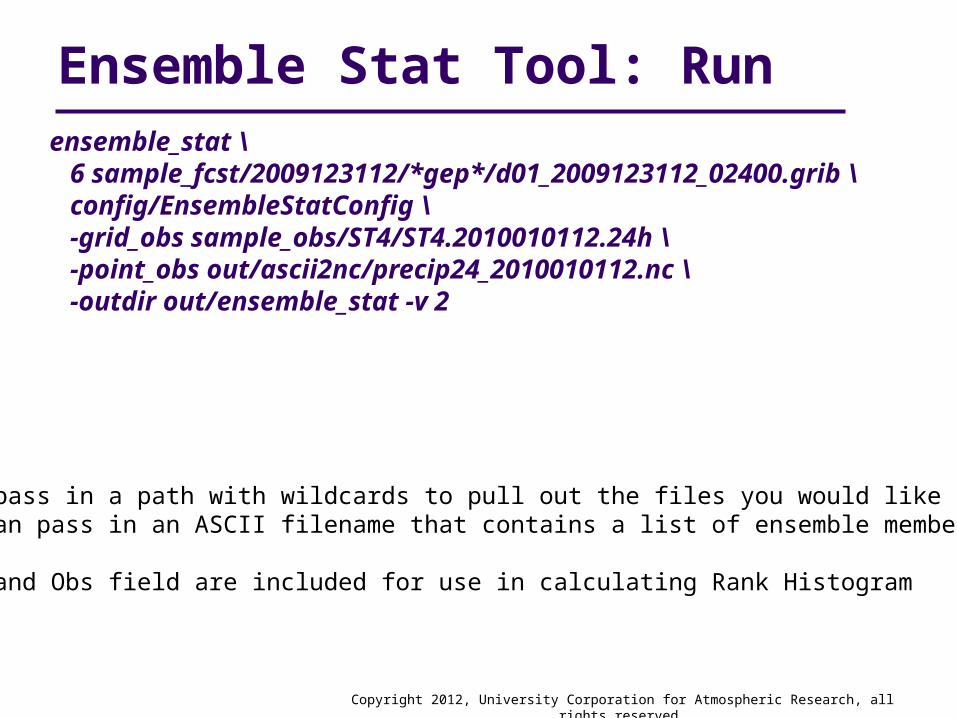
Ensemble Stat Tool: Runensemble_stat \ 6 sample_fcst/2009123112/*gep*/d01_2009123112_02400.grib \ config/EnsembleStatConfig \ -grid_obs sample_obs/ST4/ST4.2010010112.24h \ -point_obs out/ascii2nc/precip24_2010010112.nc \ -outdir out/ensemble_stat -v 2
NOTE:You can pass in a path with wildcards to pull out the files you would like to processor you can pass in an ASCII filename that contains a list of ensemble members
Gridded and Obs field are included for use in calculating Rank Histogram
Copyright 2012, University Corporation for Atmospheric Research, all rights reserved
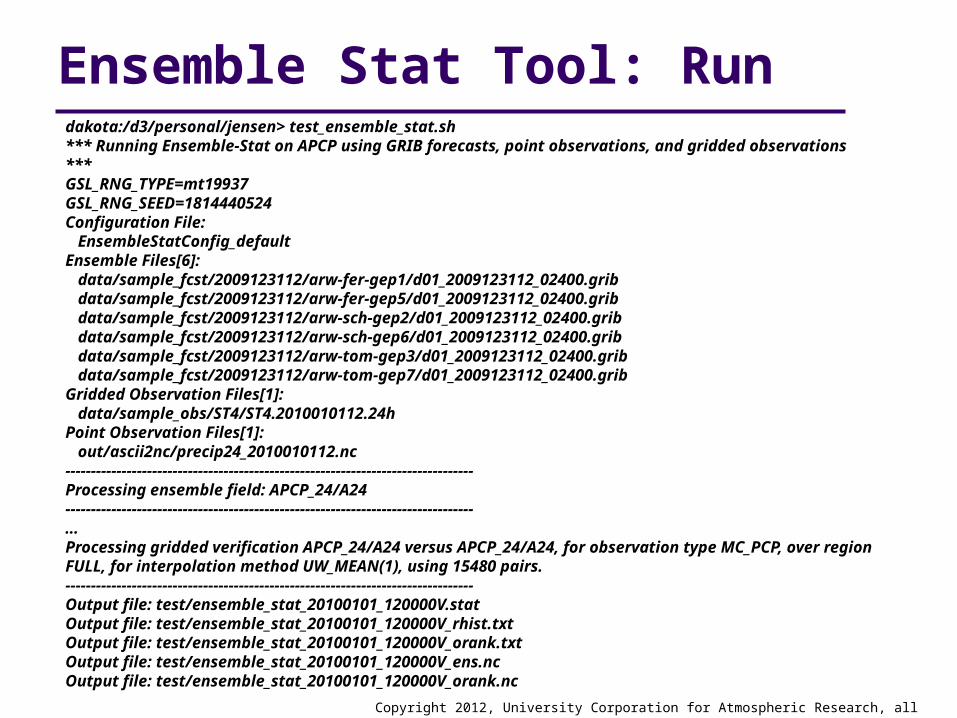
Ensemble Stat Tool: Rundakota:/d3/personal/jensen> test_ensemble_stat.sh *** Running Ensemble-Stat on APCP using GRIB forecasts, point observations, and gridded observations ***GSL_RNG_TYPE=mt19937GSL_RNG_SEED=1814440524Configuration File: EnsembleStatConfig_defaultEnsemble Files[6]: data/sample_fcst/2009123112/arw-fer-gep1/d01_2009123112_02400.grib data/sample_fcst/2009123112/arw-fer-gep5/d01_2009123112_02400.grib data/sample_fcst/2009123112/arw-sch-gep2/d01_2009123112_02400.grib data/sample_fcst/2009123112/arw-sch-gep6/d01_2009123112_02400.grib data/sample_fcst/2009123112/arw-tom-gep3/d01_2009123112_02400.grib data/sample_fcst/2009123112/arw-tom-gep7/d01_2009123112_02400.gribGridded Observation Files[1]: data/sample_obs/ST4/ST4.2010010112.24hPoint Observation Files[1]: out/ascii2nc/precip24_2010010112.nc--------------------------------------------------------------------------------Processing ensemble field: APCP_24/A24--------------------------------------------------------------------------------…Processing gridded verification APCP_24/A24 versus APCP_24/A24, for observation type MC_PCP, over region FULL, for interpolation method UW_MEAN(1), using 15480 pairs.--------------------------------------------------------------------------------Output file: test/ensemble_stat_20100101_120000V.statOutput file: test/ensemble_stat_20100101_120000V_rhist.txtOutput file: test/ensemble_stat_20100101_120000V_orank.txtOutput file: test/ensemble_stat_20100101_120000V_ens.ncOutput file: test/ensemble_stat_20100101_120000V_orank.nc
Copyright 2012, University Corporation for Atmospheric Research, all rights reserved
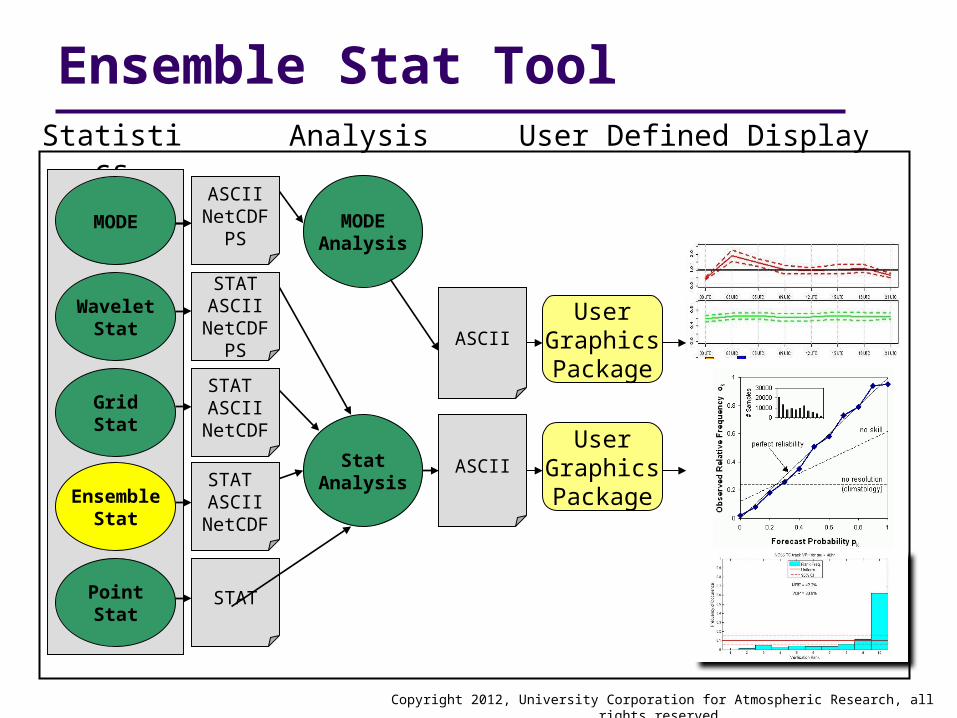
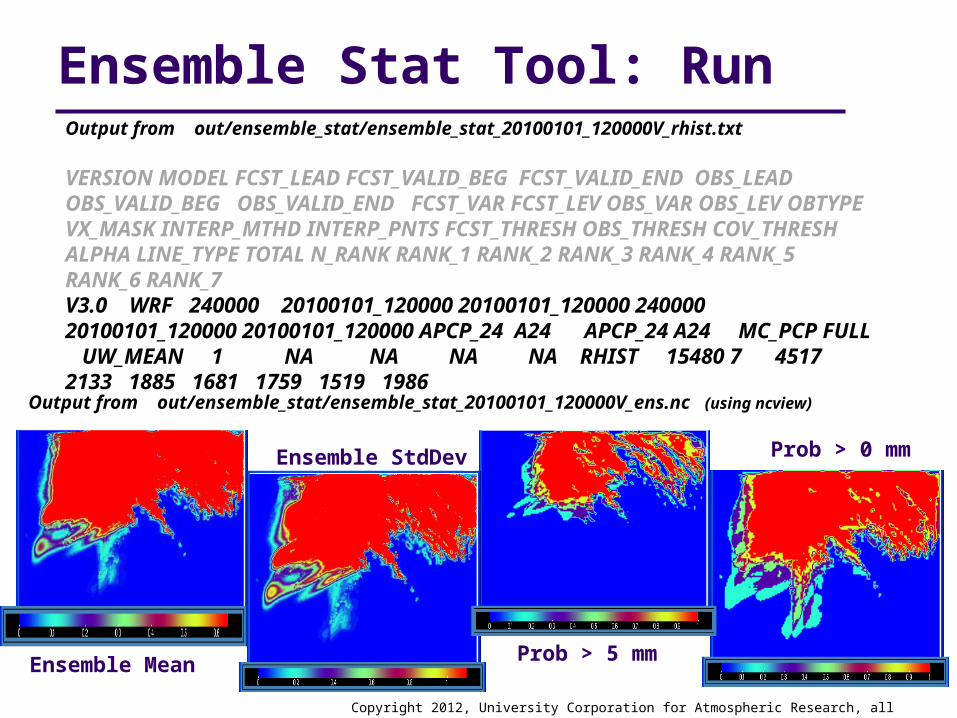
Ensemble Stat Tool: RunOutput from out/ensemble_stat/ensemble_stat_20100101_120000V_rhist.txt
VERSION MODEL FCST_LEAD FCST_VALID_BEG FCST_VALID_END OBS_LEAD OBS_VALID_BEG OBS_VALID_END FCST_VAR FCST_LEV OBS_VAR OBS_LEV OBTYPE VX_MASK INTERP_MTHD INTERP_PNTS FCST_THRESH OBS_THRESH COV_THRESH ALPHA LINE_TYPE TOTAL N_RANK RANK_1 RANK_2 RANK_3 RANK_4 RANK_5 RANK_6 RANK_7V3.0 WRF 240000 20100101_120000 20100101_120000 240000 20100101_120000 20100101_120000 APCP_24 A24 APCP_24 A24 MC_PCP FULL UW_MEAN 1 NA NA NA NA RHIST 15480 7 4517 2133 1885 1681 1759 1519 1986
Ensemble Mean
Ensemble StdDev
Prob > 5 mm
Prob > 0 mm
Output from out/ensemble_stat/ensemble_stat_20100101_120000V_ens.nc (using ncview)
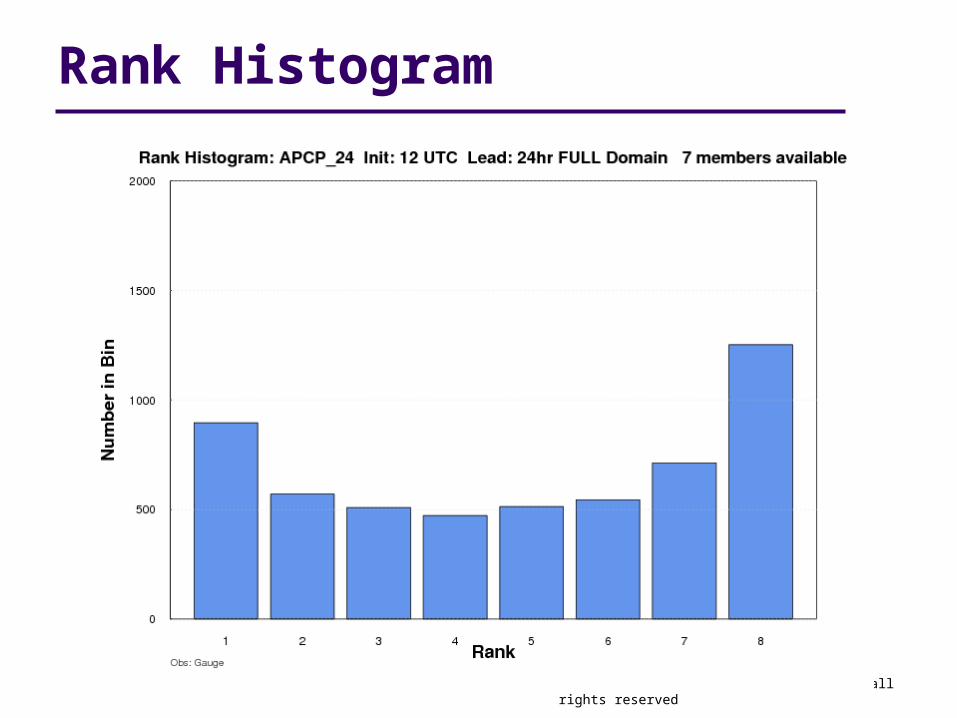
Rank Histogram
Copyright 2010, University Corporation for Atmospheric Research, all rights reserved
Statistics
StatAnalysis
MODEAnalysis
ASCII
ASCII
User Defined Display
Uses for Output from Ensemble StatAnalysis
Copyright 2012, University Corporation for Atmospheric Research, all rights reserved
WaveletStat
MODE
GridStat
EnsembleStat
PointStat
STAT
ASCIINetCDF
PS
STAT ASCII
NetCDF
STATASCII
NetCDFPS
STAT ASCII
NetCDF

Copyright 2012, University Corporation for Atmospheric Research, all rights reserved
Verifying Probabilistic Fieldsand Ensemble Relative Frequency
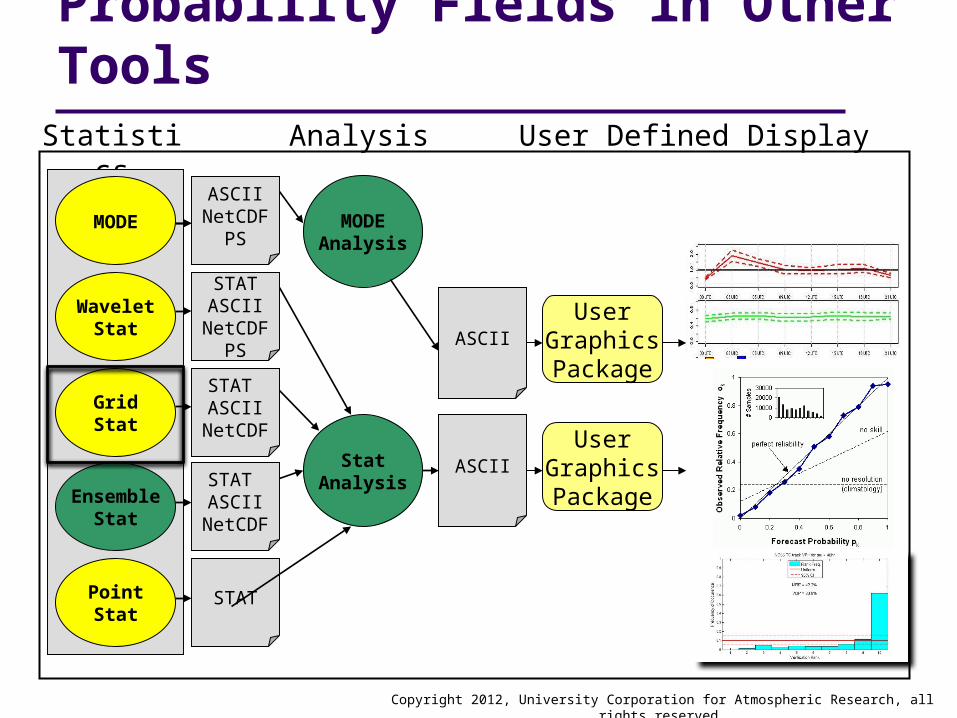
Statistics
StatAnalysis
MODEAnalysis
ASCII
ASCII
User Defined Display
Probability Fields in Other Tools
UserGraphicsPackage
Analysis
UserGraphicsPackage
Copyright 2012, University Corporation for Atmospheric Research, all rights reserved
WaveletStat
MODE
GridStat
EnsembleStat
PointStat
STAT
ASCIINetCDF
PS
STAT ASCII
NetCDF
STATASCII
NetCDFPS
STAT ASCII
NetCDF
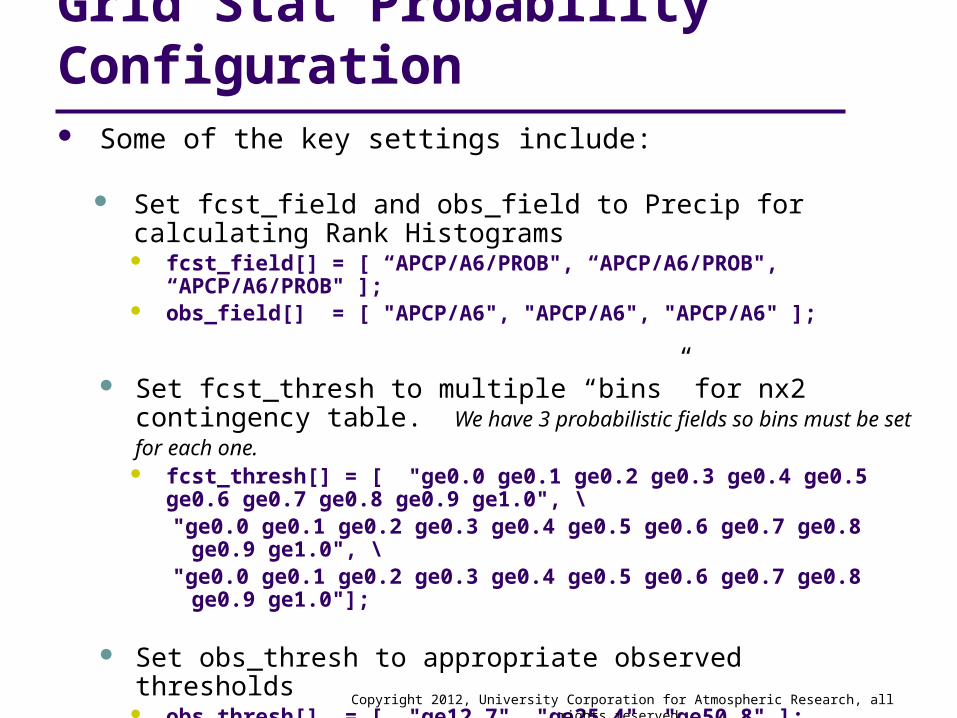
Some of the key settings include:
Set fcst_field and obs_field to Precip for calculating Rank Histograms fcst_field[] = [ “APCP/A6/PROB", “APCP/A6/PROB", “APCP/A6/PROB" ];
obs_field[] = [ "APCP/A6", "APCP/A6", "APCP/A6" ];
Set fcst_thresh to multiple “bins” for nx2 contingency table. We have 3 probabilistic fields so bins must be set for each one. fcst_thresh[] = [ "ge0.0 ge0.1 ge0.2 ge0.3 ge0.4 ge0.5 ge0.6 ge0.7 ge0.8
ge0.9 ge1.0", \"ge0.0 ge0.1 ge0.2 ge0.3 ge0.4 ge0.5 ge0.6 ge0.7 ge0.8 ge0.9 ge1.0", \"ge0.0 ge0.1 ge0.2 ge0.3 ge0.4 ge0.5 ge0.6 ge0.7 ge0.8 ge0.9 ge1.0"];
Set obs_thresh to appropriate observed thresholds obs_thresh[] = [ "ge12.7", "ge25.4", "ge50.8" ];
Copyright 2012, University Corporation for Atmospheric Research, all rights reserved
Grid Stat Probability Configuration

Grid Stat for Probability: Run
Make sure Probability Output flags set correctly in Grid-Stat Config file (output flags 7-10)
Run Grid-Stat as previously described
Output written to .stat file and, if desired, to individual text files: PCT – Probability Contingency Table Counts PSTD – Probability Contingency Table Scores
Brier Score, Reliability, Resolution, Uncertainty, Area Under ROC PJC – Joint/Continuous Statistics of Probabilistic Variables
Calibration, Refinement, Likelihood, Base Rate PRC – ROC Curve Points for Probabilistic Variables
Copyright 2012, University Corporation for Atmospheric Research, all rights reserved
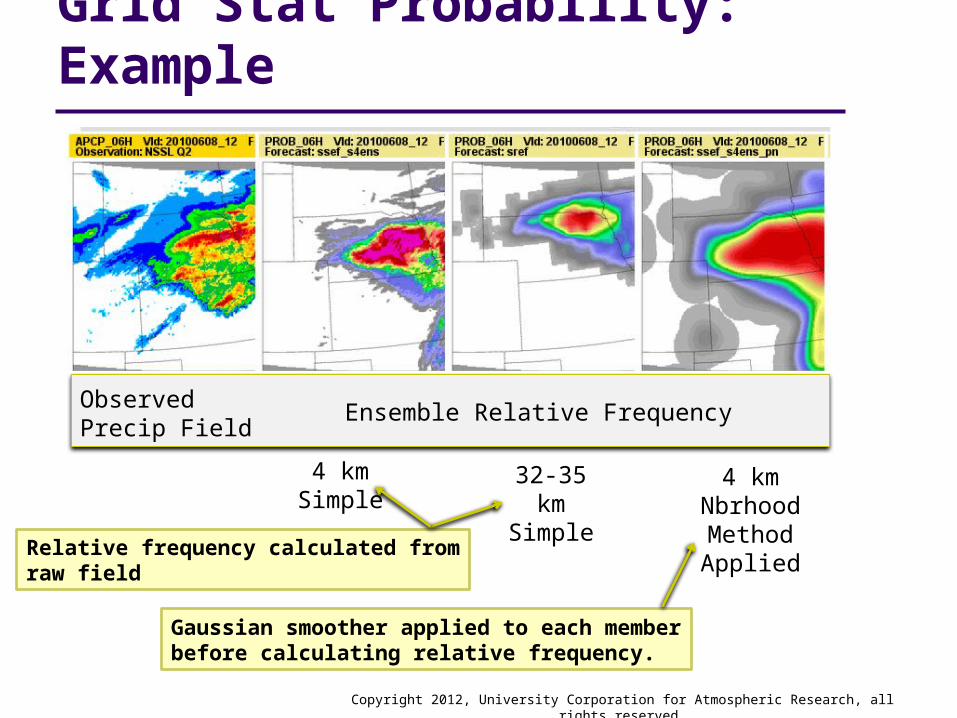
Grid Stat Probability: Example
Copyright 2012, University Corporation for Atmospheric Research, all rights reserved
ObservedPrecip Field
4 kmSimple
32-35 kmSimple
Ensemble Relative Frequency
4 kmNbrhoodMethodApplied
Gaussian smoother applied to each memberbefore calculating relative frequency.
Relative frequency calculated fromraw field
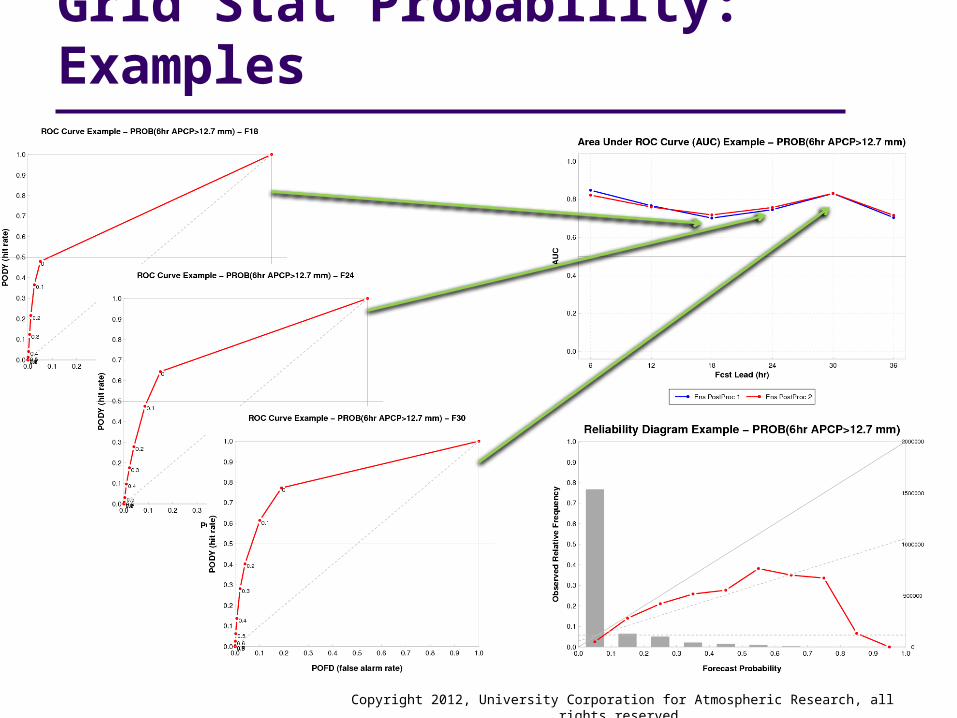
Grid Stat Probability: Examples
Copyright 2012, University Corporation for Atmospheric Research, all rights reserved
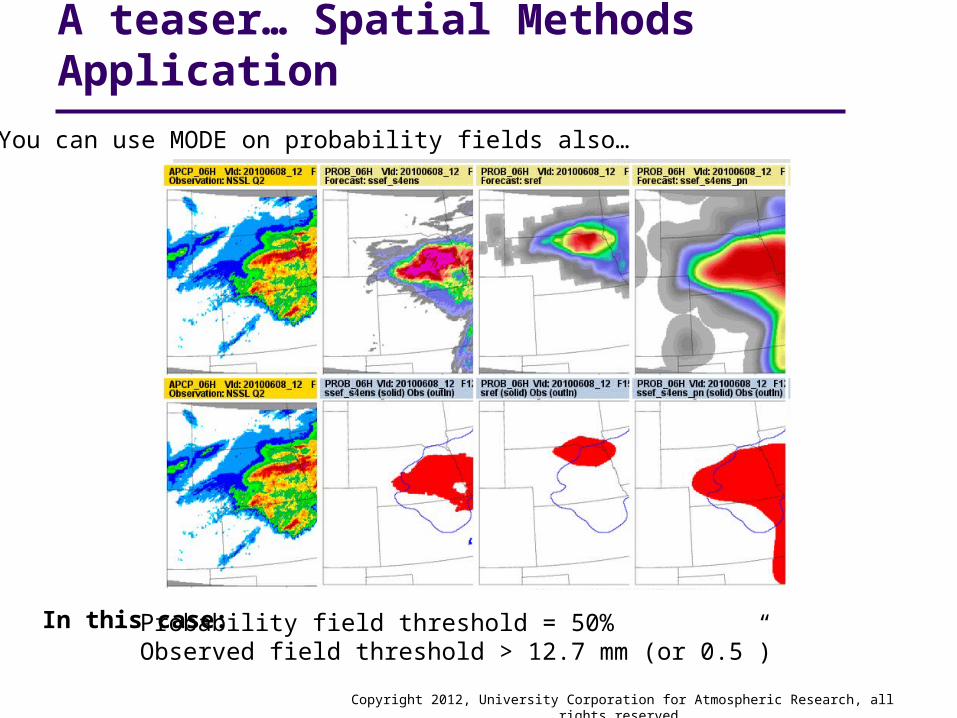
A teaser… Spatial Methods Application
Copyright 2012, University Corporation for Atmospheric Research, all rights reserved
You can use MODE on probability fields also…
Probability field threshold = 50%Observed field threshold > 12.7 mm (or 0.5”)
In this case: