Embed Size (px)
Citation preview


Copyright 2013 by Region 7 Education Service Center. All rights reserved.

For 2013 and beyond a framework of FOUR
Performance Indexes
Copyright 2013 by Region 7 Education Service Center. All rights reserved.

Performance Index 1: Student Achievement
Provides a snapshot of performance
across subjects at Level II – Satisfactory Academic Performance
Copyright 2013 by Region 7 Education Service Center. All rights reserved.
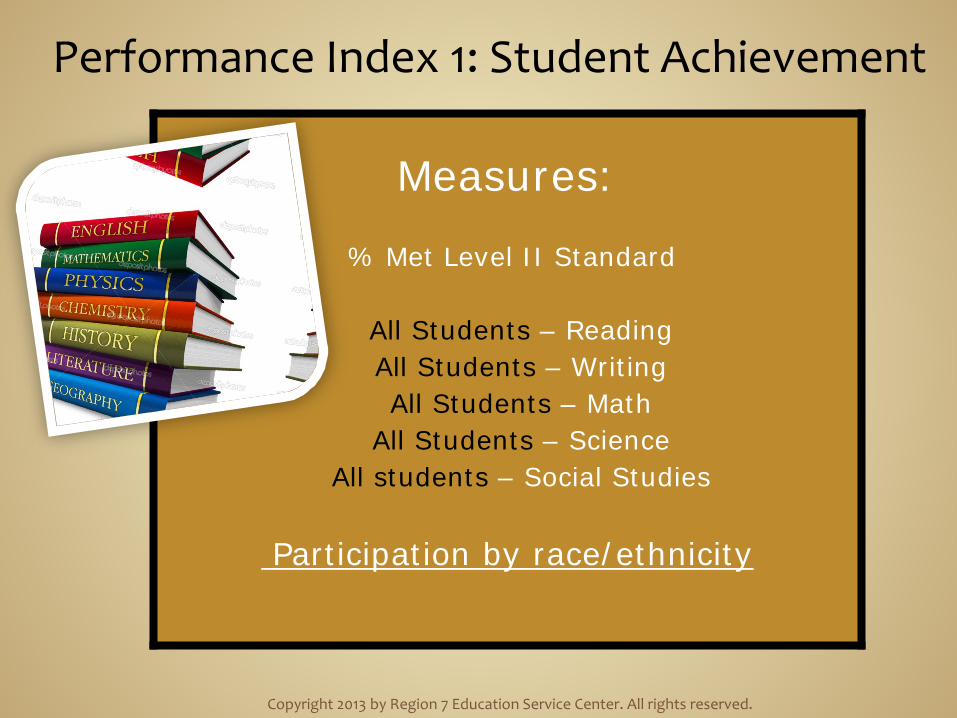
Performance Index 1: Student Achievement
Measures:
% Met Level II Standard
All Students – Reading All Students – Writing All Students – Math
All Students – Science All students – Social Studies
Participation by race/ethnicity
Copyright 2013 by Region 7 Education Service Center. All rights reserved.

Performance Index 1: Student Achievement
Includes:
STAAR STAAR-Modified, STAAR Alternate STAAR-L
Grades 3-8 and EOC English and Spanish
Grade 11 TAKS performance (2013 only)
Copyright 2013 by Region 7 Education Service Center. All rights reserved.
Performance Index 1: Student Achievement
Minimum Size:
None
Small Group analysis is applied if there are fewer than 10 tests
Copyright 2013 by Region 7 Education Service Center. All rights reserved.
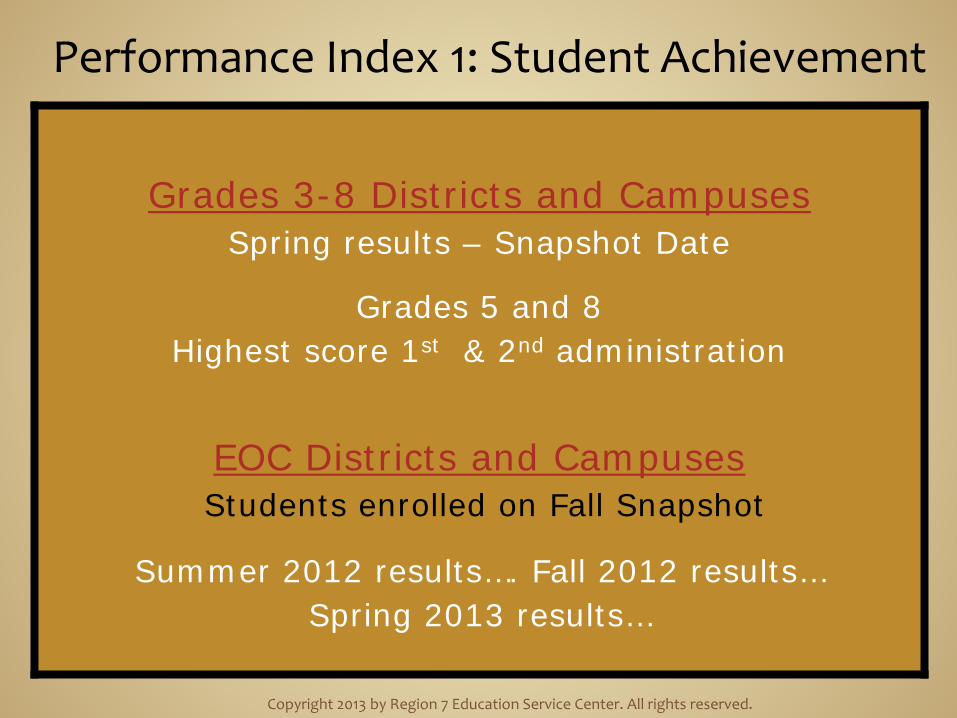
Performance Index 1: Student Achievement
Grades 3-8 Districts and Campuses
Spring results – Snapshot Date
Grades 5 and 8 Highest score 1st & 2nd administration
EOC Districts and Campuses
Students enrolled on Fall Snapshot
Summer 2012 results…. Fall 2012 results… Spring 2013 results…
Copyright 2013 by Region 7 Education Service Center. All rights reserved.
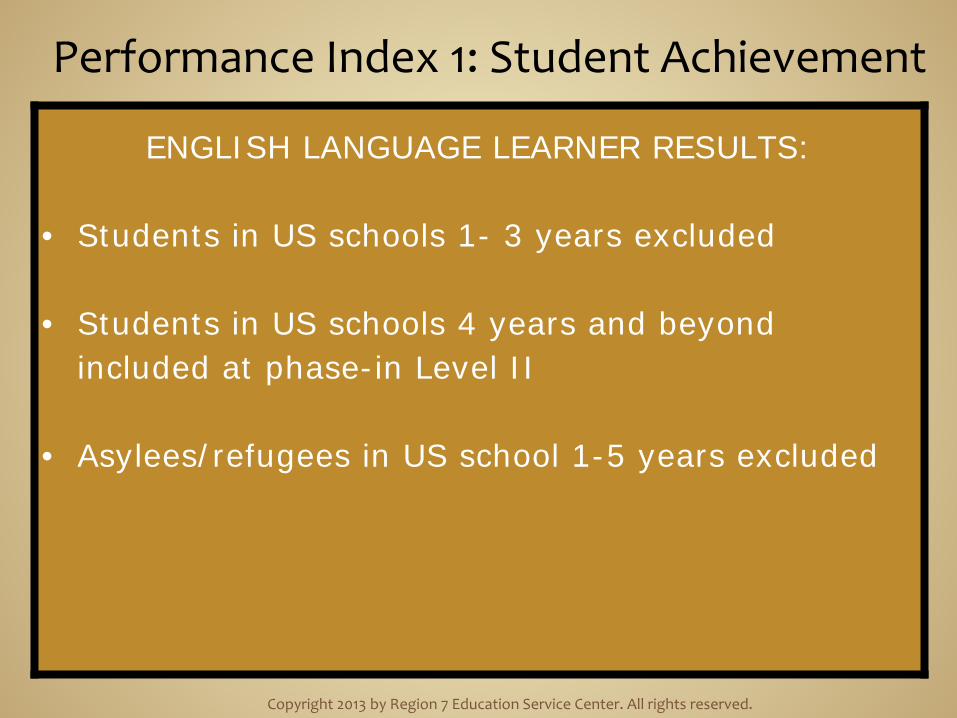
Performance Index 1: Student Achievement
ENGLISH LANGUAGE LEARNER RESULTS:
• Students in US schools 1- 3 years excluded
• Students in US schools 4 years and beyond included at phase-in Level II
• Asylees/refugees in US school 1-5 years excluded
Copyright 2013 by Region 7 Education Service Center. All rights reserved.

PERFORMANCE INDEX 2 STUDENT PROGRESS
Measures student progress
by subject and student group
Copyright 2013 by Region 7 Education Service Center. All rights reserved.

Subjects:
Reading Math Writing
Student Groups: All Students
SPED ELL
Seven Racial/Ethnic Groups
PERFORMANCE INDEX 2 STUDENT PROGRESS
Copyright 2013 by Region 7 Education Service Center. All rights reserved.

Index Targets:
District 21
High School 17
Middle School 29
Elementary 30
PERFORMANCE INDEX 2 STUDENT PROGRESS
Copyright 2013 by Region 7 Education Service Center. All rights reserved.
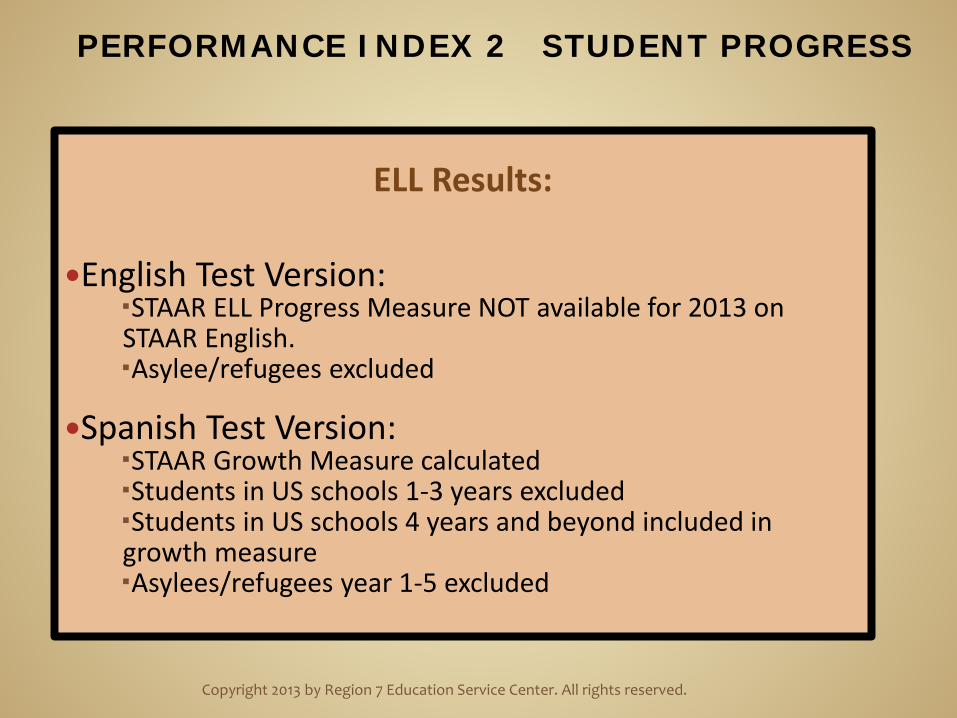
ELL Results:
English Test Version: STAAR ELL Progress Measure NOT available for 2013 on STAAR English. Asylee/refugees excluded
Spanish Test Version: STAAR Growth Measure calculated Students in US schools 1-3 years excluded Students in US schools 4 years and beyond included in growth measure Asylees/refugees year 1-5 excluded
PERFORMANCE INDEX 2 STUDENT PROGRESS
Copyright 2013 by Region 7 Education Service Center. All rights reserved.

Minimum Size:
All Students – at least 10 test results
Student Groups – 25 test results for the group
Small Group Analysis – cannot be calculated for
2013
PERFORMANCE INDEX 2 STUDENT PROGRESS
Copyright 2013 by Region 7 Education Service Center. All rights reserved.
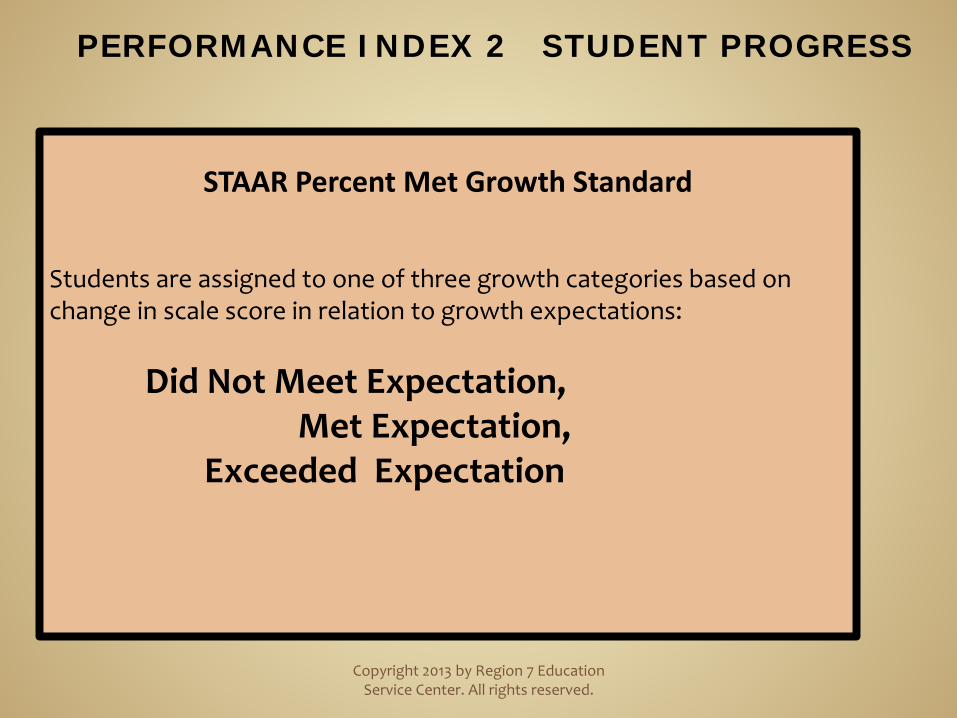
STAAR Percent Met Growth Standard
Students are assigned to one of three growth categories based on change in scale score in relation to growth expectations:
Did Not Meet Expectation, Met Expectation, Exceeded Expectation
PERFORMANCE INDEX 2 STUDENT PROGRESS
Copyright 2013 by Region 7 Education Service Center. All rights reserved.

Important Points about Index 2
Gain Score = Current-year scale score – Prior-year scale
score Grounded in STAAR performance standards & goal of
having all students achieve at or above Level II All students scoring at the 3 highest raw scores, in the
current year will be classified as having Exceeded the progress target.
Students who maintained Level III performance from the prior year to the current year will be classified as having Met or Exceeded the progress target.
A student can move to a higher performance level without having Met progress.
PERFORMANCE INDEX 2 STUDENT PROGRESS
Copyright 2013 by Region 7 Education Service Center. All rights reserved.

Copyright 2013 by Region 7 Education Service Center. All rights reserved.

Copyright 2013 by Region 7 Education Service Center. All rights reserved.

PERFORMANCE INDEX 2 Student Progress
One Point for percentage of students who Met Expectation or Exceeded Expectation in each student group (10) for
Reading grades 4-8; English I & II Reading; English II Writing Math grades 4-8 and Algebra I (2014) Writing
Copyright 2013 by Region 7 Education Service Center. All rights reserved.

PERFORMANCE INDEX 2 Student Progress
Index Target will be set at about fifth percentile One Point for percentage of students who Met Expectation or Exceeded Expectation in each student group for
Reading grades 4-8; English I & II Reading; English II Writing Math grades 4-8 and Algebra I (2014) Writing
Another Point for Percentage of student groups who Exceeded Expectations Reading grades 4-8; English I & II Reading; English II Writing Math grades 3-8 and Algebra I (2014) Writing
Copyright 2013 by Region 7 Education Service Center. All rights reserved.

PERFORMANCE INDEX 3: CLOSING PERFORMANCE GAPS
Emphasize advanced academic achievement of the ECD
and lowest race/ethnicity preforming groups
Copyright 2013 by Region 7 Education Service Center. All rights reserved.

PERFORMANCE INDEX 3: CLOSING PERFORMANCE GAPS
Copyright 2013 by Region 7 Education Service Center. All rights reserved.
Subjects:
Reading Math Writing Social Studies Science
Student Groups:
ECD Two lowest Preforming Race/Ethic Groups
(page 26)

Index Target 55 One Point
Each % of students: ECD or one of two lowest race/ethnic groups meeting Level II
PERFORMANCE INDEX 3: CLOSING PERFORMANCE GAPS
Copyright 2013 by Region 7 Education Service Center. All rights reserved.

Index 4: Postsecondary Readiness
Importance of high school diploma and CCRS
Copyright 2013 by Region 7 Education Service Center. All rights reserved.

Index 4: Postsecondary Readiness
STAAR Percent Met final Level II on One or More Tests 2014 and beyond (Final Level II performance is not included in accountability in 2013) Assessment results include all assessments evaluated in Index I Combined over All Subjects: Reading, Writing, Mathematics, Science, and Social Studies
Copyright 2013 by Region 7 Education Service Center. All rights reserved.

Index 4: Postsecondary Readiness
Index Target 75
Graduation Score:
Grade 9-12 Four-Year 2012 Graduation Rate for All Students and all student groups
OR
Grade 9-12 Five-Year 2011 Graduation Rate for All Students and all student groups,
and
RHSP/DAP Graduates for All Students and race/ethnicity student groups
Copyright 2013 by Region 7 Education Service Center. All rights reserved.

Copyright 2013 by Region 7 Education Service Center. All rights reserved.

Copyright 2013 by Region 7 Education Service Center. All rights reserved.

Copyright 2013 by Region 7 Education Service Center. All rights reserved.
Some Distinction Designations
• Top 25% Distinction
• Academic Achievement in Reading/ELA
• Academic Achievement in Mathematics

SYSTEM SAFEGUARDS
Copyright 2013 by Region 7 Education Service Center. All rights reserved.