Embed Size (px)
Citation preview
Copyright © 2013 Pearson Education, Inc. All rights reserved
Chapter 1
Statistics, Data, and Statistical Thinking

Copyright © 2013 Pearson Education, Inc. All rights reserved
1.1
The Science of Statistics

1 - 3 Copyright © 2013 Pearson Education, Inc.. All rights reserved.
Definition
Copyright © 2013 Pearson Education, Inc. All rights reserved
1.2
Two Types of Statistical Applications
1 - 5 Copyright © 2013 Pearson Education, Inc.. All rights reserved.
Definition

1 - 6
Example: Cost of physician exam
Copyright © 2013 Pearson Education, Inc.. All rights reserved.
1 - 7 Copyright © 2013 Pearson Education, Inc.. All rights reserved.
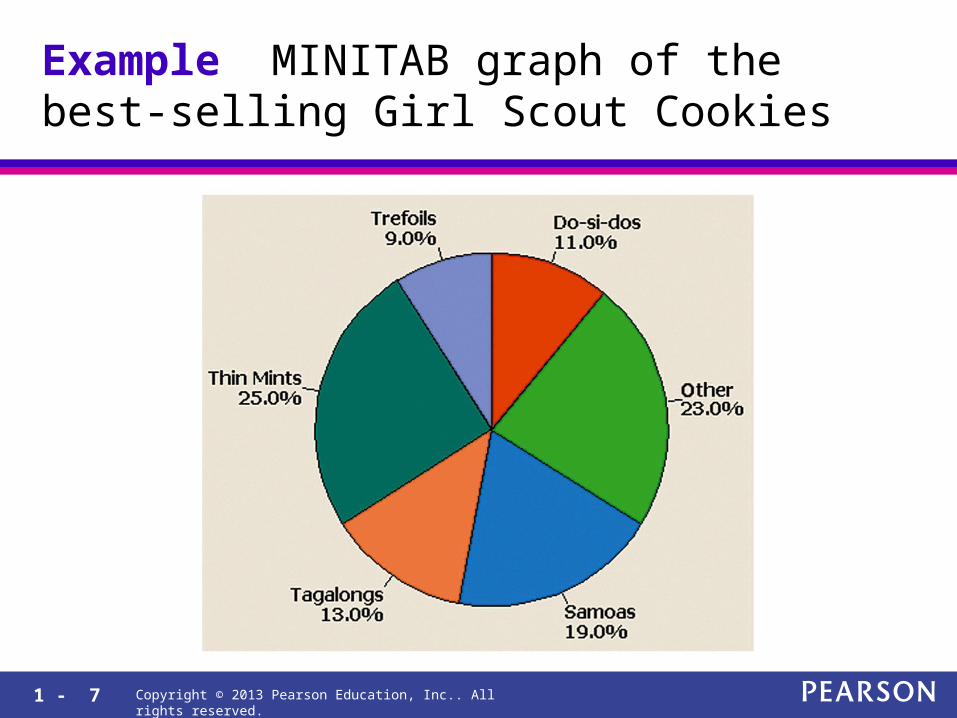
Example MINITAB graph of the best-selling Girl Scout Cookies
1 - 8 Copyright © 2013 Pearson Education, Inc.. All rights reserved.
Definition

1 - 9
Example: White blood cell count
Copyright © 2013 Pearson Education, Inc.. All rights reserved.

Copyright © 2013 Pearson Education, Inc. All rights reserved
1.3
Fundamental Elements of Statistics
1 - 11 Copyright © 2013 Pearson Education, Inc.. All rights reserved.
Definition

1 - 12 Copyright © 2013 Pearson Education, Inc.. All rights reserved.
Definition

1 - 13 Copyright © 2013 Pearson Education, Inc.. All rights reserved.
Definition
1 - 14 Copyright © 2013 Pearson Education, Inc.. All rights reserved.
Definition

1 - 15 Copyright © 2013 Pearson Education, Inc.. All rights reserved.
Figure 1.2 A sample of voter registration cards for all registered voters

1 - 16
Population: All diseased persons Sample: 25 people selected at random Experimental unit: One diseased person Variable: White blood cell count
Copyright © 2013 Pearson Education, Inc.. All rights reserved.
1 - 17 Copyright © 2013 Pearson Education, Inc.. All rights reserved.
Definition
1 - 18 Copyright © 2013 Pearson Education, Inc.. All rights reserved.
Definition
1 - 19
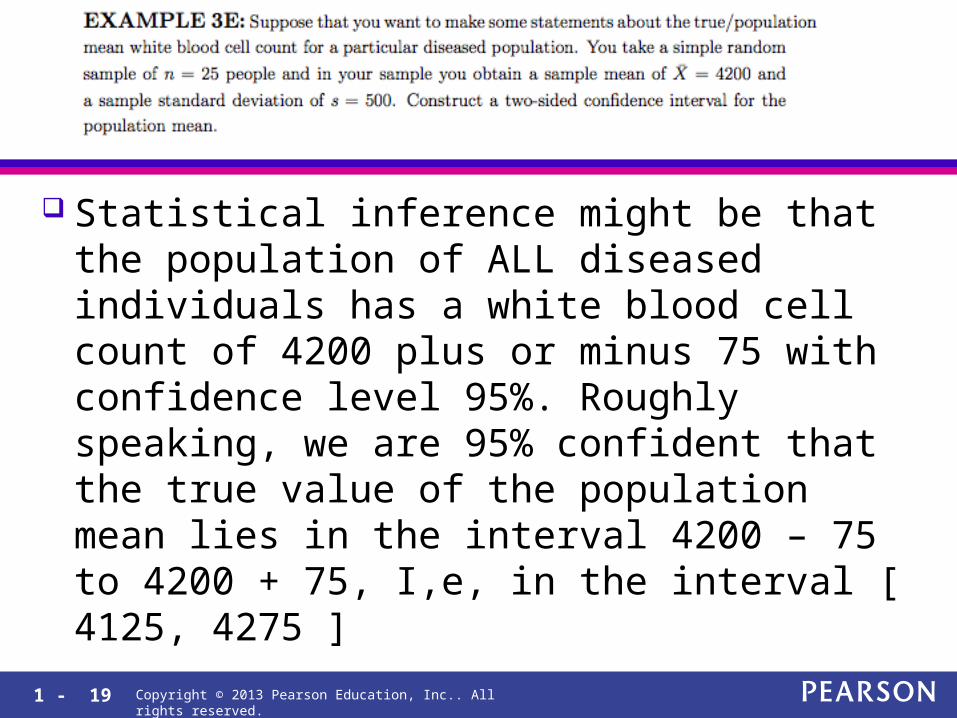
Statistical inference might be that the population of ALL diseased individuals has a white blood cell count of 4200 plus or minus 75 with confidence level 95%. Roughly speaking, we are 95% confident that the true value of the population mean lies in the interval 4200 – 75 to 4200 + 75, I,e, in the interval [ 4125, 4275 ]
Copyright © 2013 Pearson Education, Inc.. All rights reserved.

1 - 20
An example from Hockey
Copyright © 2013 Pearson Education, Inc.. All rights reserved.
1 - 21
In the previous example …..
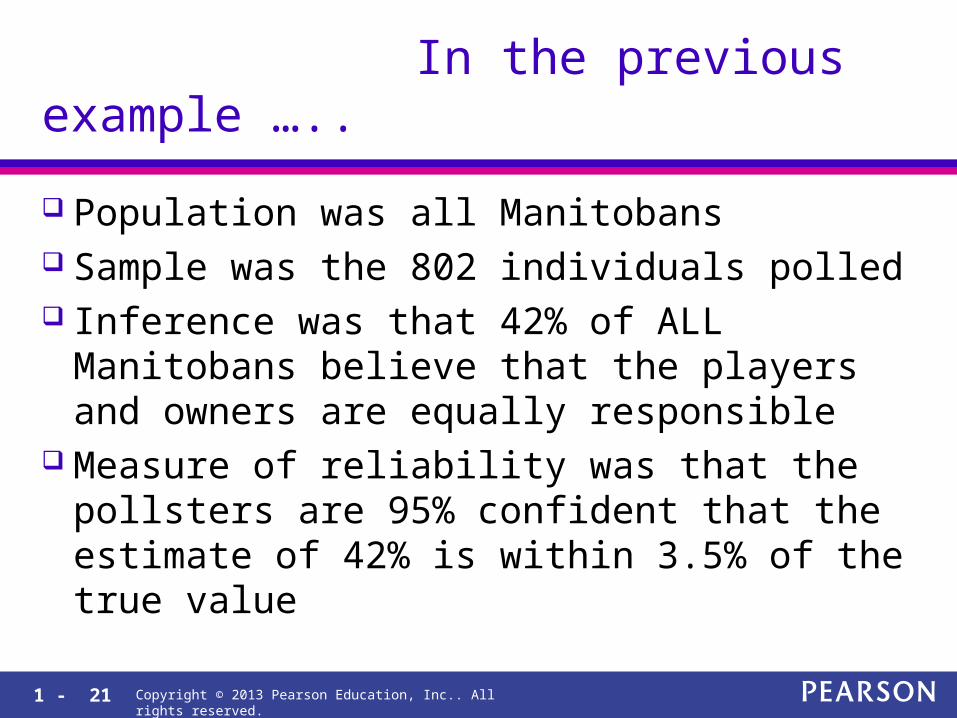
Population was all Manitobans Sample was the 802 individuals polled Inference was that 42% of ALL Manitobans
believe that the players and owners are equally responsible
Measure of reliability was that the pollsters are 95% confident that the estimate of 42% is within 3.5% of the true value
Copyright © 2013 Pearson Education, Inc.. All rights reserved.
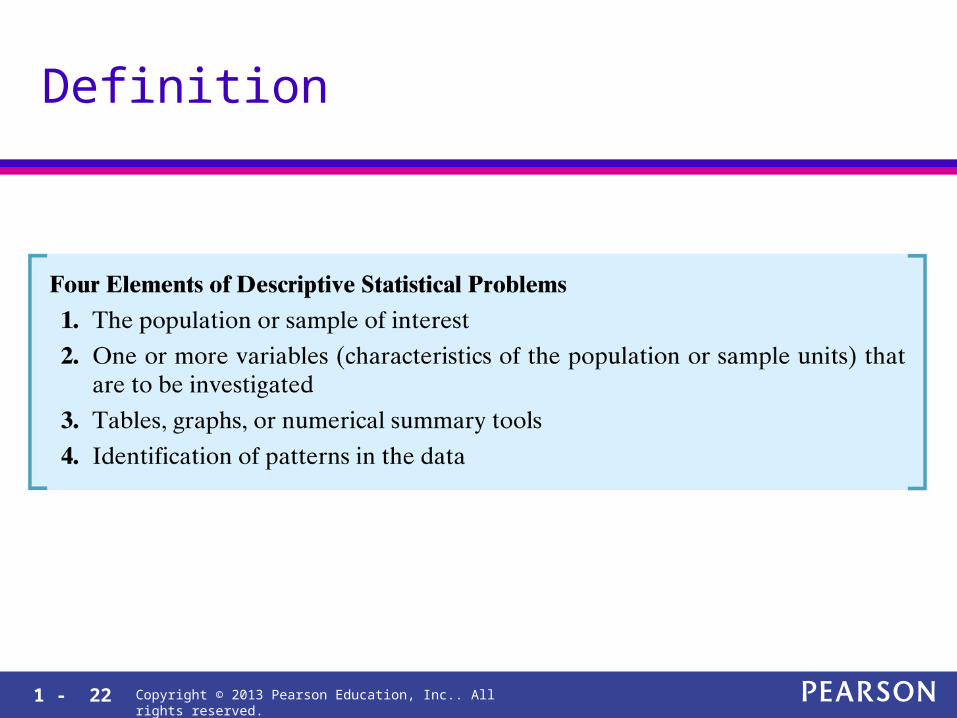
1 - 22 Copyright © 2013 Pearson Education, Inc.. All rights reserved.
Definition

1 - 23 Copyright © 2013 Pearson Education, Inc.. All rights reserved.
Definition
Copyright © 2013 Pearson Education, Inc. All rights reserved
1.4
Types of Data
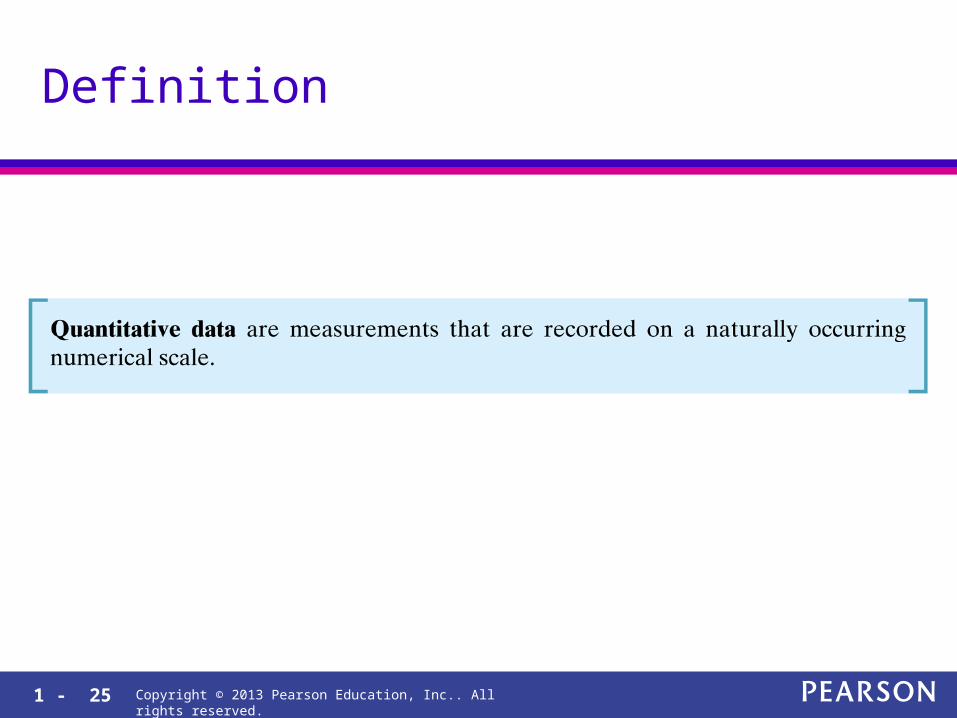
1 - 25 Copyright © 2013 Pearson Education, Inc.. All rights reserved.
Definition
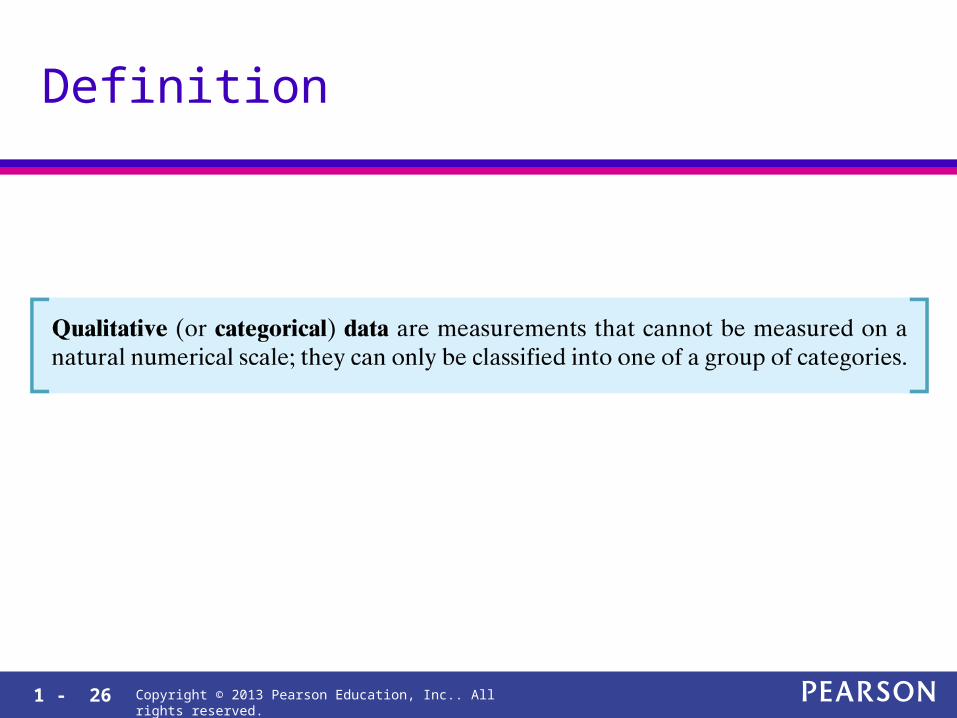
1 - 26 Copyright © 2013 Pearson Education, Inc.. All rights reserved.
Definition
1 - 27
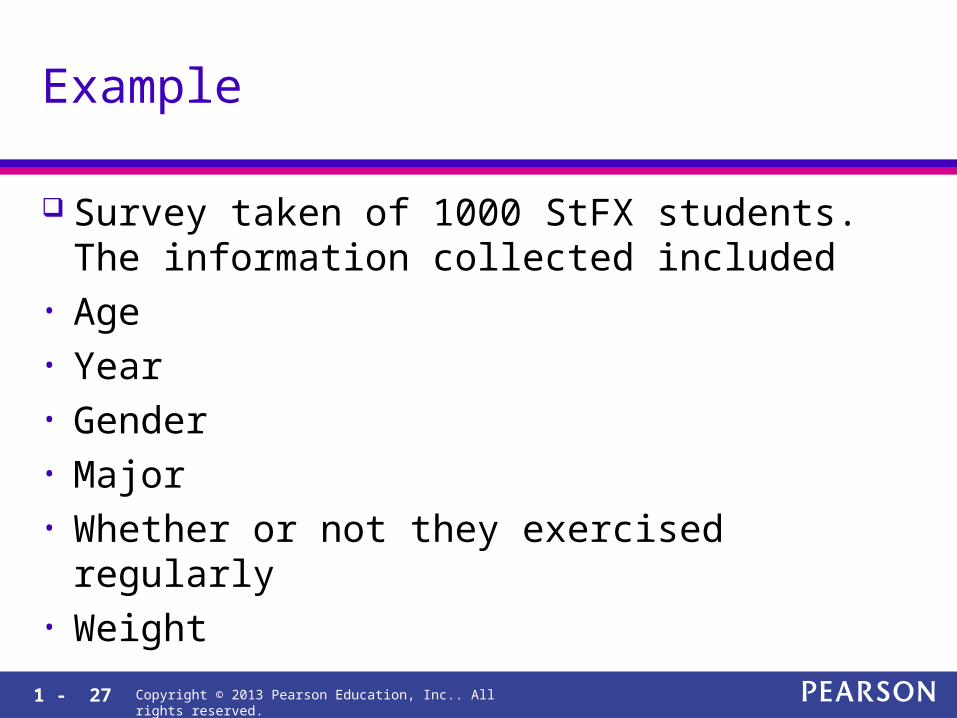
Example
Survey taken of 1000 StFX students. The information collected included
• Age• Year• Gender• Major• Whether or not they exercised regularly• Weight
Copyright © 2013 Pearson Education, Inc.. All rights reserved.

Copyright © 2013 Pearson Education, Inc. All rights reserved
1.5
Two Different Methods of Collecting Data

1 - 29 Copyright © 2013 Pearson Education, Inc.. All rights reserved.
Definition

1 - 30 Copyright © 2013 Pearson Education, Inc.. All rights reserved.
Definition

1 - 31
Example (Observational study)
In an effort to understand the link between weight gain and exercise, 100 students are followed for four years, and a record is kept of each student’s weight and the number of minutes they exercised weekly.
Copyright © 2013 Pearson Education, Inc.. All rights reserved.
1 - 32
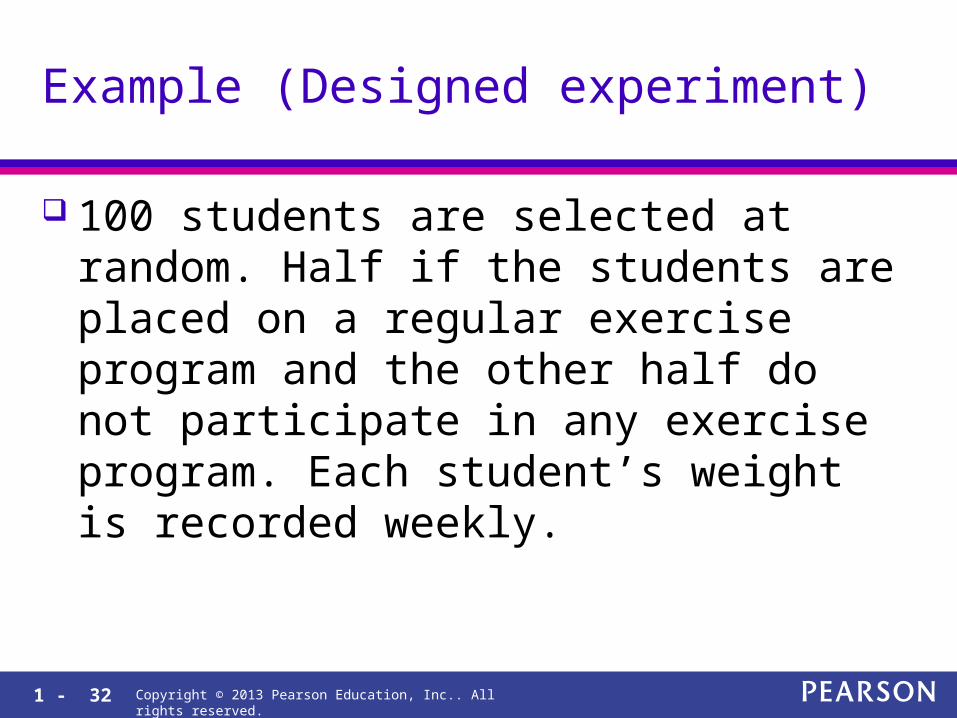
Example (Designed experiment)
100 students are selected at random. Half if the students are placed on a regular exercise program and the other half do not participate in any exercise program. Each student’s weight is recorded weekly.
Copyright © 2013 Pearson Education, Inc.. All rights reserved.
1 - 33
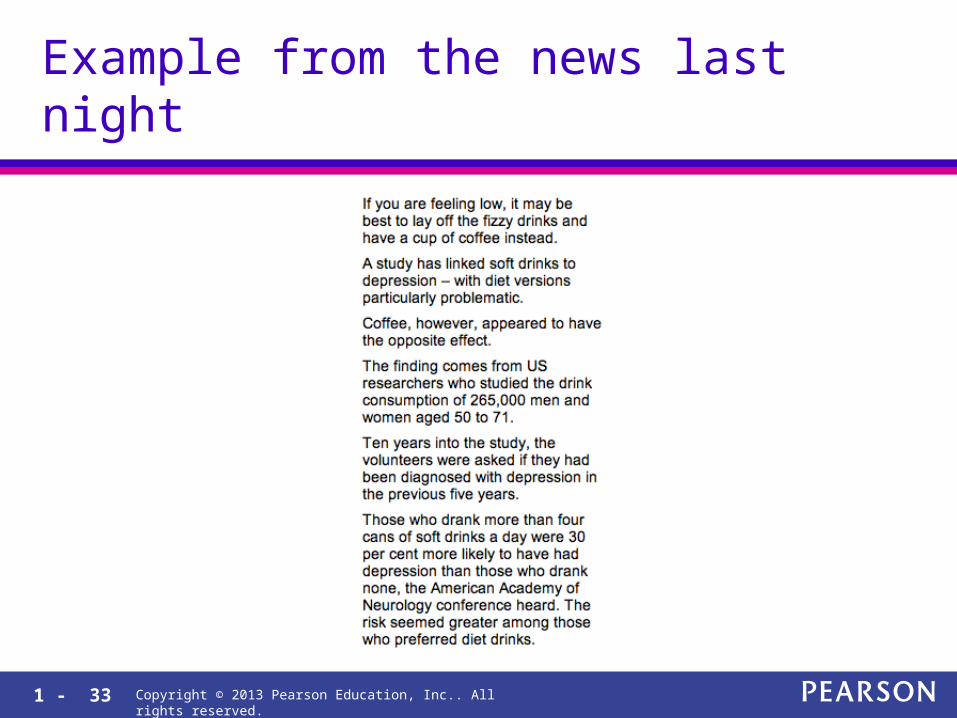
Example from the news last night
Copyright © 2013 Pearson Education, Inc.. All rights reserved.

1 - 34
Which type is best???
Each has advantages and disadvantages Usually it is easier and less expensive to do
an observational study There may be ethical considerations which
prohibit use of a designed experiment. Designed experiments often lead to results
with greater statistical significance.
Copyright © 2013 Pearson Education, Inc.. All rights reserved.

Copyright © 2013 Pearson Education, Inc. All rights reservedCopyright © 2013 Pearson Education, Inc.. All rights reserved.
International Journal of Epidemiology
1 - 36 Copyright © 2013 Pearson Education, Inc.. All rights reserved.
Definition

1 - 37 Copyright © 2013 Pearson Education, Inc.. All rights reserved.
Definition

Copyright © 2013 Pearson Education, Inc. All rights reserved
The Role of Statistics in Critical Thinking and Ethics
1.6

1 - 39 Copyright © 2013 Pearson Education, Inc.. All rights reserved.
Definition

1 - 40 Copyright © 2013 Pearson Education, Inc.. All rights reserved.
Definition
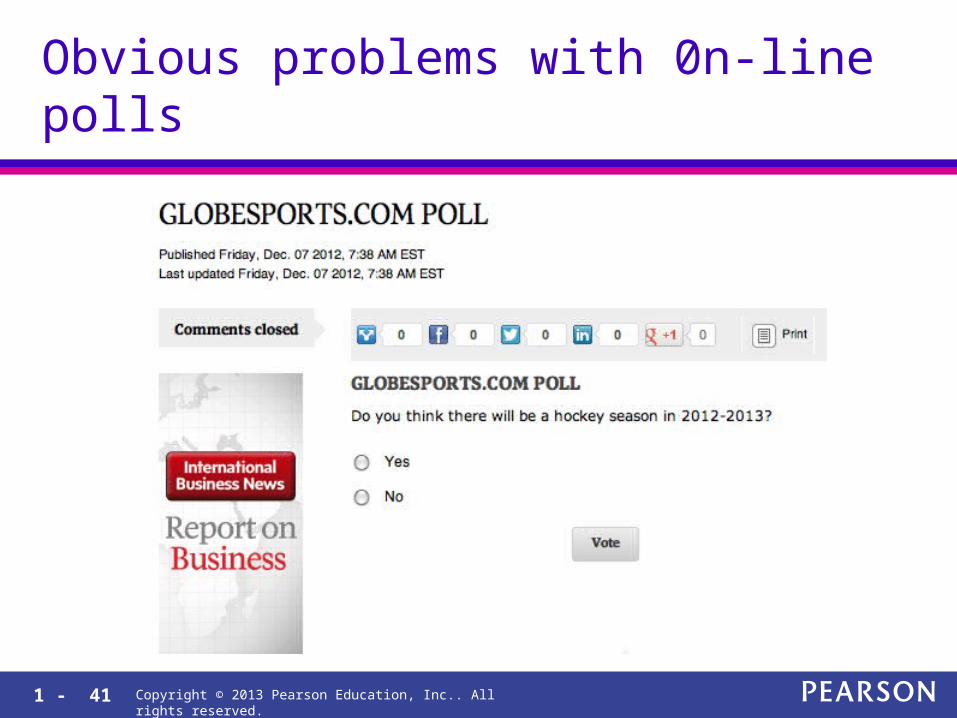
1 - 41
Obvious problems with 0n-line polls
Copyright © 2013 Pearson Education, Inc.. All rights reserved.
1 - 42 Copyright © 2013 Pearson Education, Inc.. All rights reserved.
Definition
1 - 43 Copyright © 2013 Pearson Education, Inc.. All rights reserved.
Definition