Embed Size (px)
Citation preview
Copyright © 2014 Pearson Education, Inc. publishing as Prentice Hall 6 - 1
Copyright © 2014 Pearson Education, Inc. publishing as Prentice Hall 6 - 2
Chapter 6
Relevant Information for Decision Making with a Focus
on Operational Decisions
Copyright © 2014 Pearson Education, Inc. publishing as Prentice Hall 6 - 3
When you have finished studying this chapter, you should be able to:
1.Use a differential analysis to examine income effects across alternatives and show that an opportunity-cost analysis yields identical results.
2. Decide whether to make or to buy certain parts or products.
3. Choose whether to add or delete a product line using relevant information.
Chapter 6 Learning Objectives
Copyright © 2014 Pearson Education, Inc. publishing as Prentice Hall 6 - 4
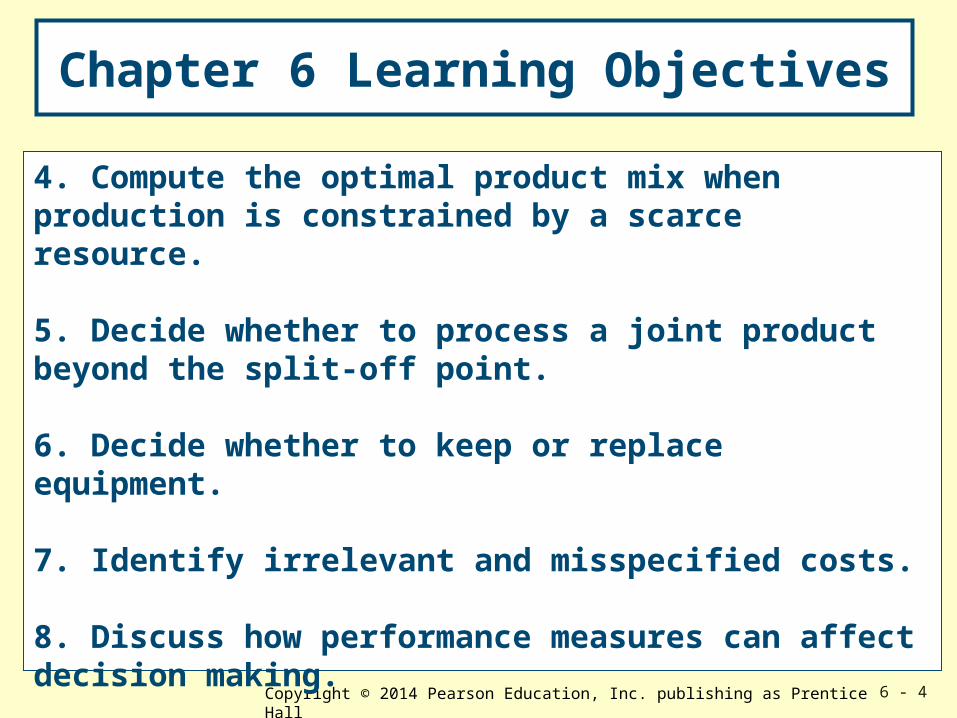
4. Compute the optimal product mix when production is constrained by a scarce resource.
5. Decide whether to process a joint product beyond the split-off point.
6. Decide whether to keep or replace equipment.
7. Identify irrelevant and misspecified costs.
8. Discuss how performance measures can affect decision making.
Chapter 6 Learning Objectives
Copyright © 2014 Pearson Education, Inc. publishing as Prentice Hall 6 - 5
Opportunity, Outlay, and Differential Costs and Analysis
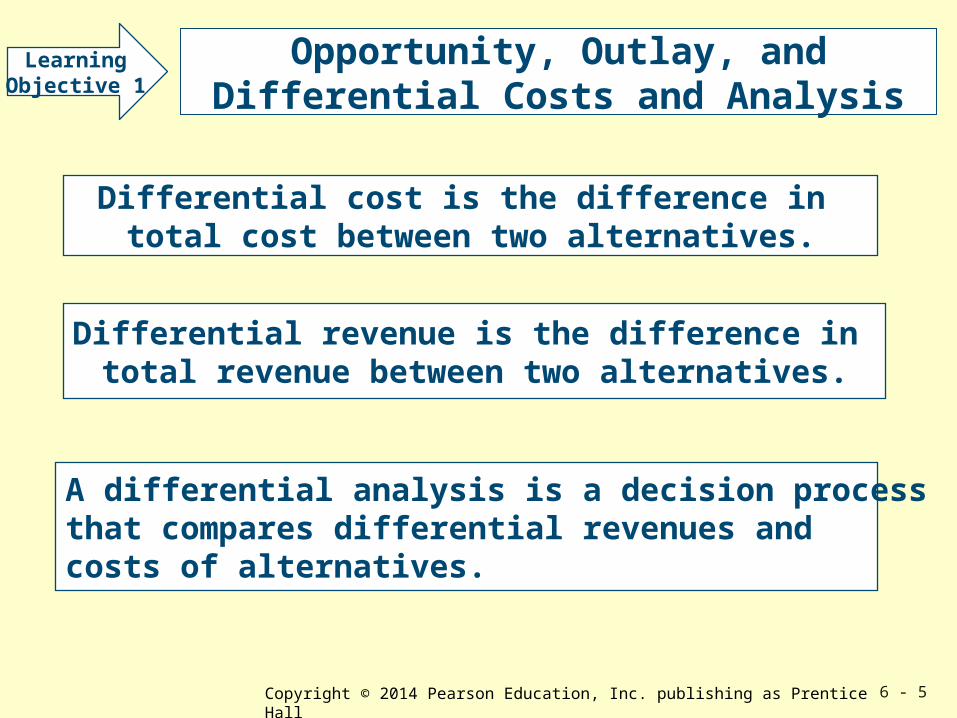
Differential cost is the difference in total cost between two alternatives.
LearningObjective 1
Differential revenue is the difference in total revenue between two alternatives.
A differential analysis is a decision process that compares differential revenues and costs of alternatives.
Copyright © 2014 Pearson Education, Inc. publishing as Prentice Hall 6 - 6
Opportunity, Outlay, and Differential Costs and Analysis
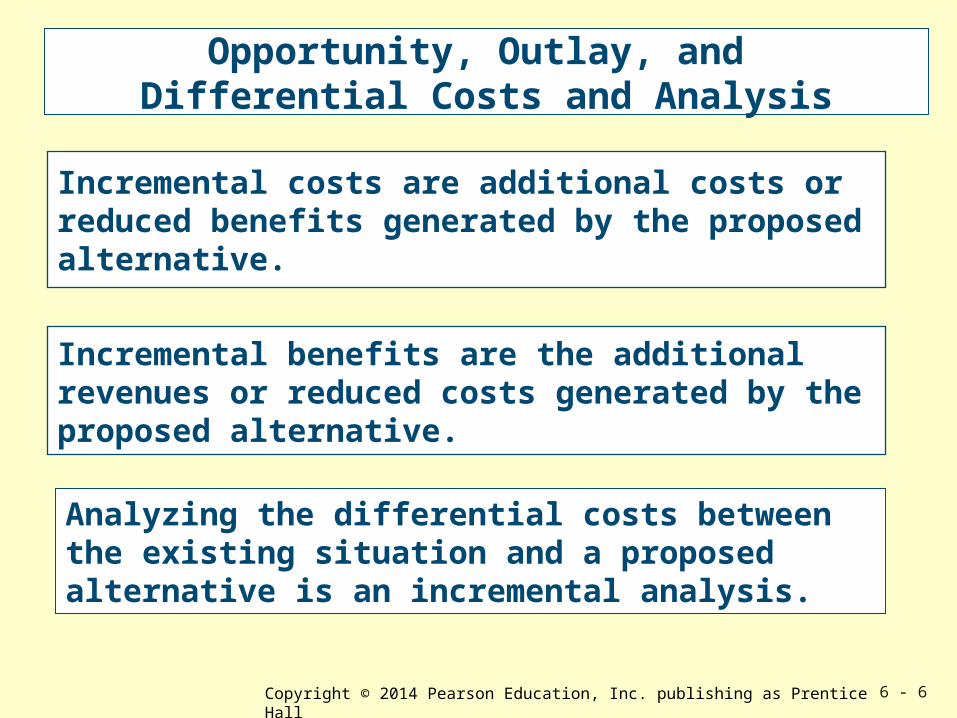
Incremental costs are additional costs or reduced benefits generated by the proposed alternative.
Incremental benefits are the additional revenues or reduced costs generated by the proposed alternative.
Analyzing the differential costs between the existing situation and a proposed alternative is an incremental analysis.

Copyright © 2014 Pearson Education, Inc. publishing as Prentice Hall 6 - 7
Opportunity, Outlay, and Differential Costs and Analysis
An outlay cost requires a cash disbursement.
An opportunity cost is the maximum availablebenefit forgone (or passed up) by using a resource that a company already owns or that it has already committed to purchase for a particular purpose.
If there are many alternative uses of resources, an incremental analysis can become cumbersome. Opportunity costs may be a viable option.
Copyright © 2014 Pearson Education, Inc. publishing as Prentice Hall 6 - 8
Opportunity, Outlay, and Differential Costs and Analysis
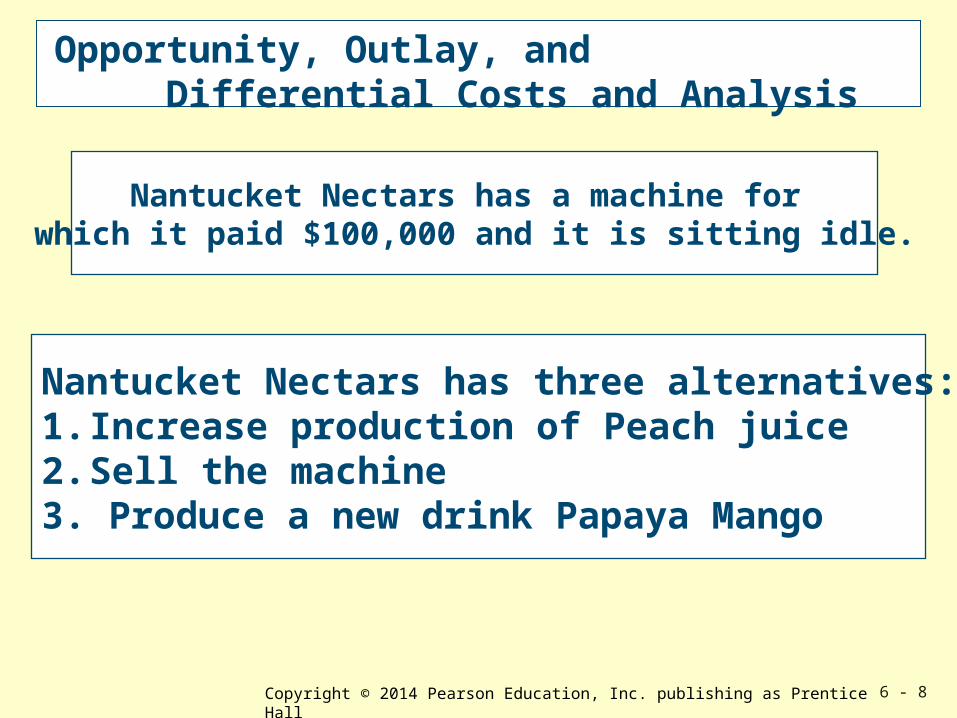
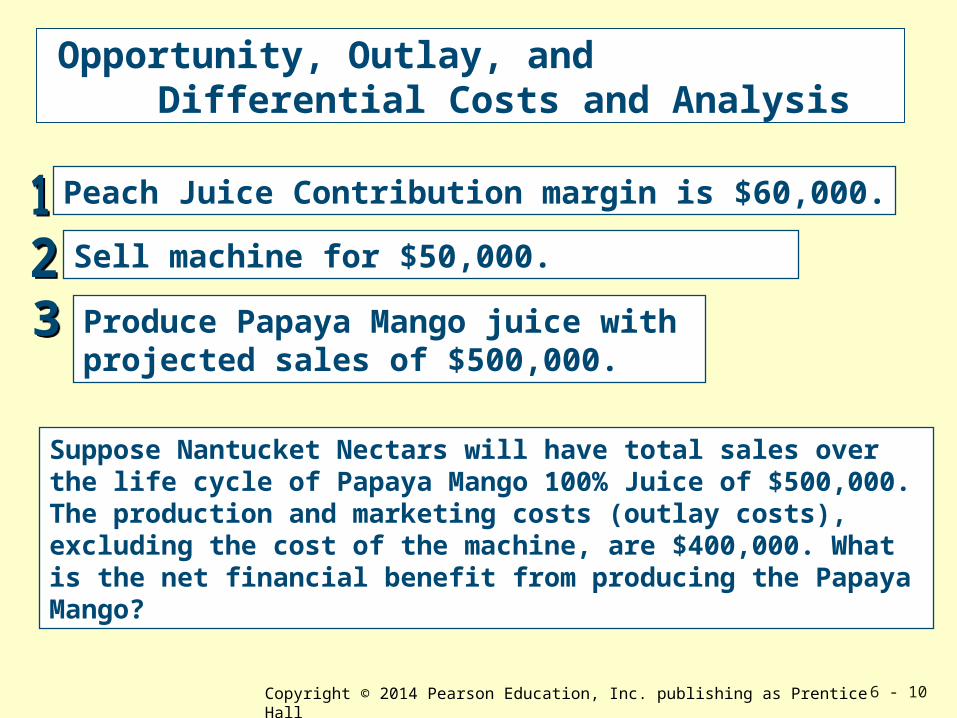
Nantucket Nectars has three alternatives:1. Increase production of Peach juice2. Sell the machine3. Produce a new drink Papaya Mango
Nantucket Nectars has a machine for which it paid $100,000 and it is sitting idle.
Copyright © 2014 Pearson Education, Inc. publishing as Prentice Hall 6 - 9
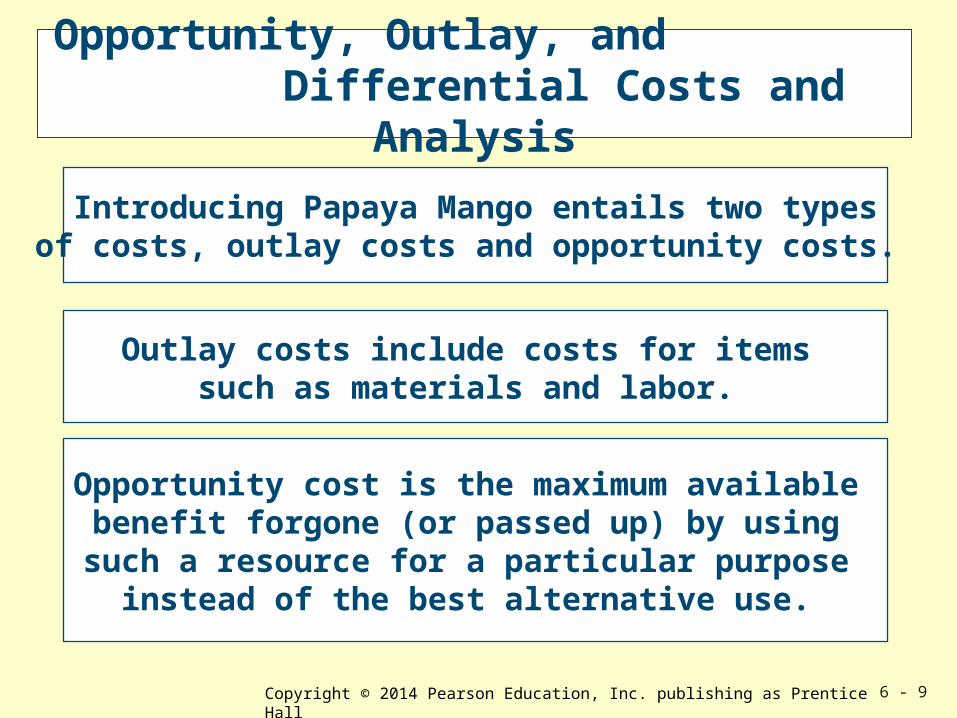
Opportunity, Outlay, and Differential Costs and Analysis
Introducing Papaya Mango entails two typesof costs, outlay costs and opportunity costs.
Opportunity cost is the maximum available benefit forgone (or passed up) by using such a resource for a particular purpose
instead of the best alternative use.
Outlay costs include costs for items such as materials and labor.
Copyright © 2014 Pearson Education, Inc. publishing as Prentice Hall 6 - 10
Opportunity, Outlay, and Differential Costs and Analysis
Sell machine for $50,000.
Peach Juice Contribution margin is $60,000.
Produce Papaya Mango juice with projected sales of $500,000.
Suppose Nantucket Nectars will have total sales over the life cycle of Papaya Mango 100% Juice of $500,000. The production and marketing costs (outlay costs), excluding the cost of the machine, are $400,000. What is the net financial benefit from producing the Papaya Mango?
Copyright © 2014 Pearson Education, Inc. publishing as Prentice Hall 6 - 11
Opportunity, Outlay, and Differential Costs and Analysis
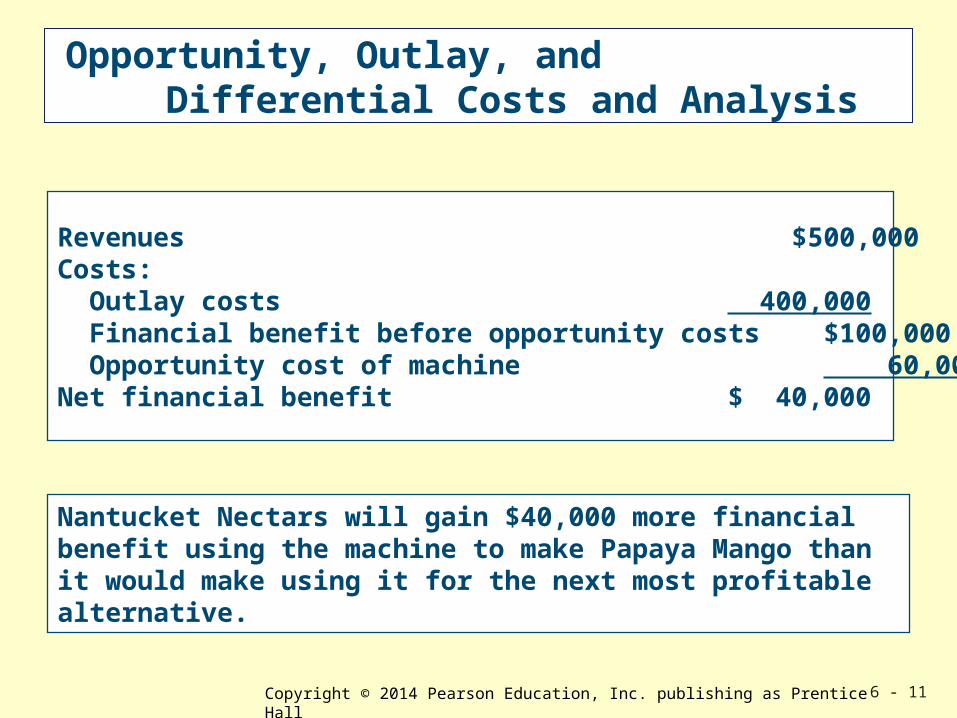
Revenues $500,000Costs: Outlay costs 400,000 Financial benefit before opportunity costs $100,000 Opportunity cost of machine 60,000Net financial benefit $ 40,000
Nantucket Nectars will gain $40,000 more financial benefit using the machine to make Papaya Mango than it would make using it for the next most profitable alternative.
Copyright © 2014 Pearson Education, Inc. publishing as Prentice Hall 6 - 12
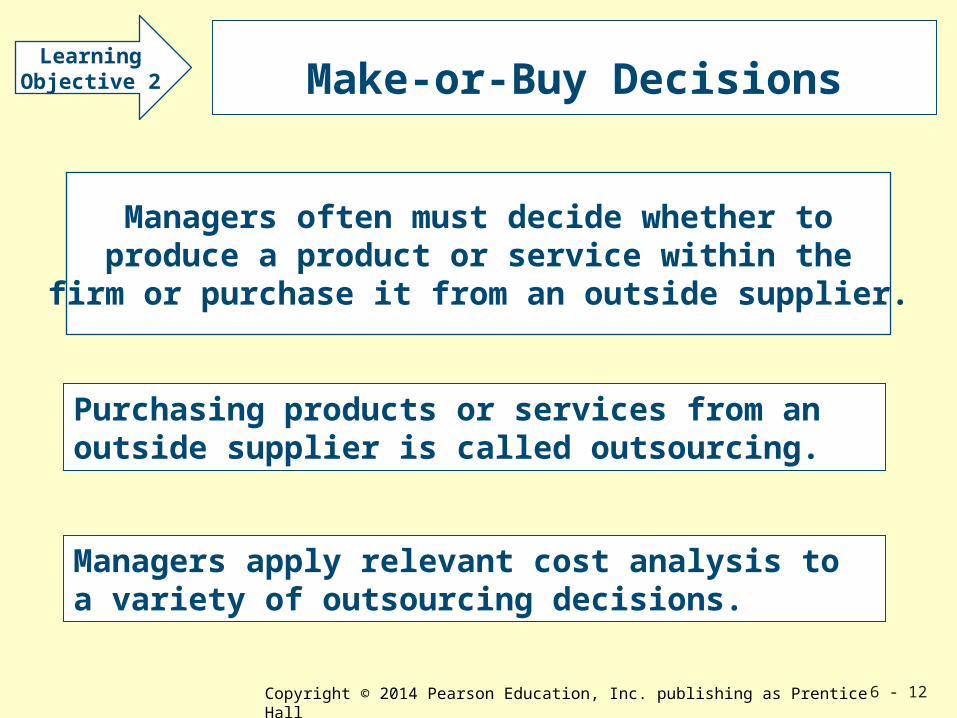
Make-or-Buy Decisions
Managers often must decide whether toproduce a product or service within the
firm or purchase it from an outside supplier.
LearningObjective 2
Purchasing products or services from an outside supplier is called outsourcing.
Managers apply relevant cost analysis to a variety of outsourcing decisions.
Copyright © 2014 Pearson Education, Inc. publishing as Prentice Hall 6 - 13
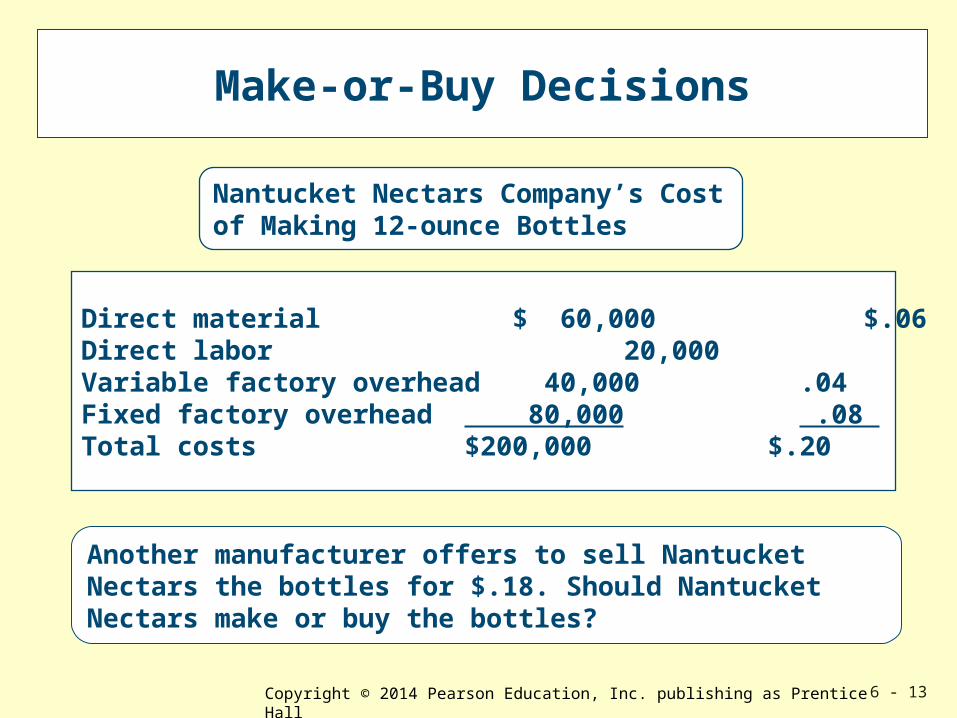
Make-or-Buy Decisions
Direct material $ 60,000 $.06 Direct labor 20,000 .02 Variable factory overhead 40,000 .04 Fixed factory overhead 80,000 .08 Total costs $200,000 $.20
Nantucket Nectars Company’s Cost of Making 12-ounce Bottles
Another manufacturer offers to sell Nantucket Nectars the bottles for $.18. Should NantucketNectars make or buy the bottles?
Copyright © 2014 Pearson Education, Inc. publishing as Prentice Hall 6 - 14
Make-or-Buy Example
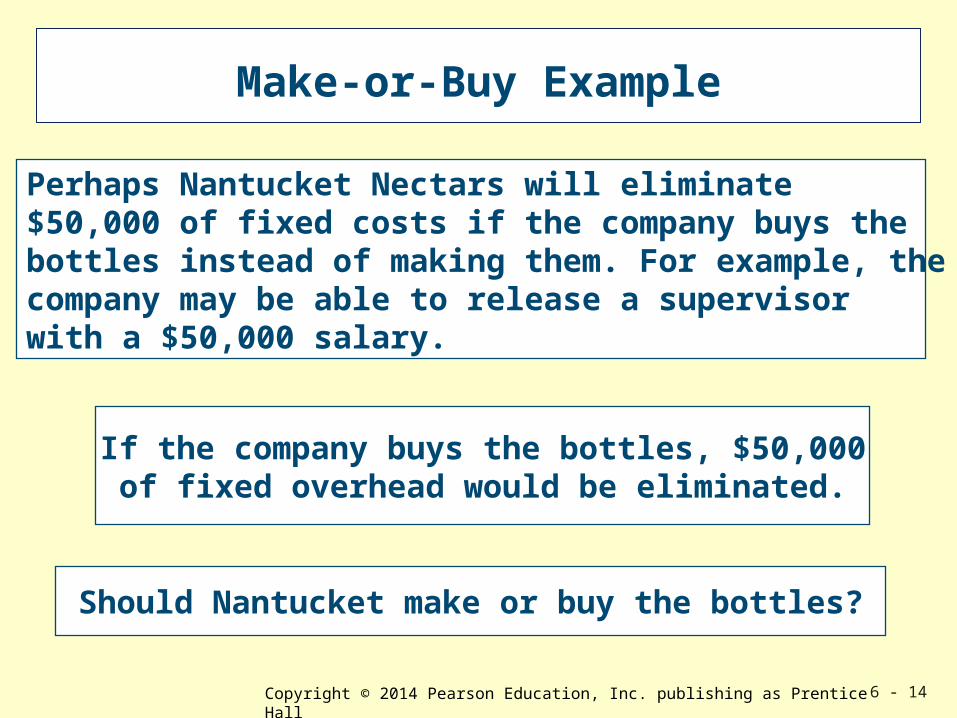
If the company buys the bottles, $50,000of fixed overhead would be eliminated.
Should Nantucket make or buy the bottles?
Perhaps Nantucket Nectars will eliminate $50,000 of fixed costs if the company buys the bottles instead of making them. For example, the company may be able to release a supervisor with a $50,000 salary.
Copyright © 2014 Pearson Education, Inc. publishing as Prentice Hall 6 - 15
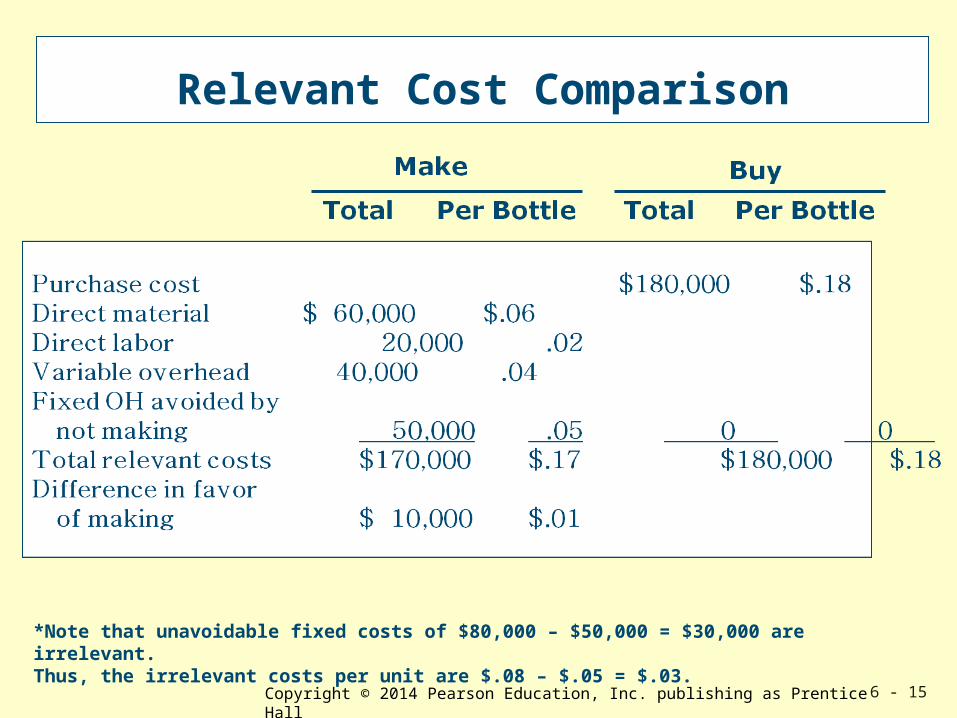
Relevant Cost Comparison
*Note that unavoidable fixed costs of $80,000 – $50,000 = $30,000 are irrelevant. Thus, the irrelevant costs per unit are $.08 – $.05 = $.03.
Copyright © 2014 Pearson Education, Inc. publishing as Prentice Hall 6 - 16
Make or Buy and the Use of Facilities
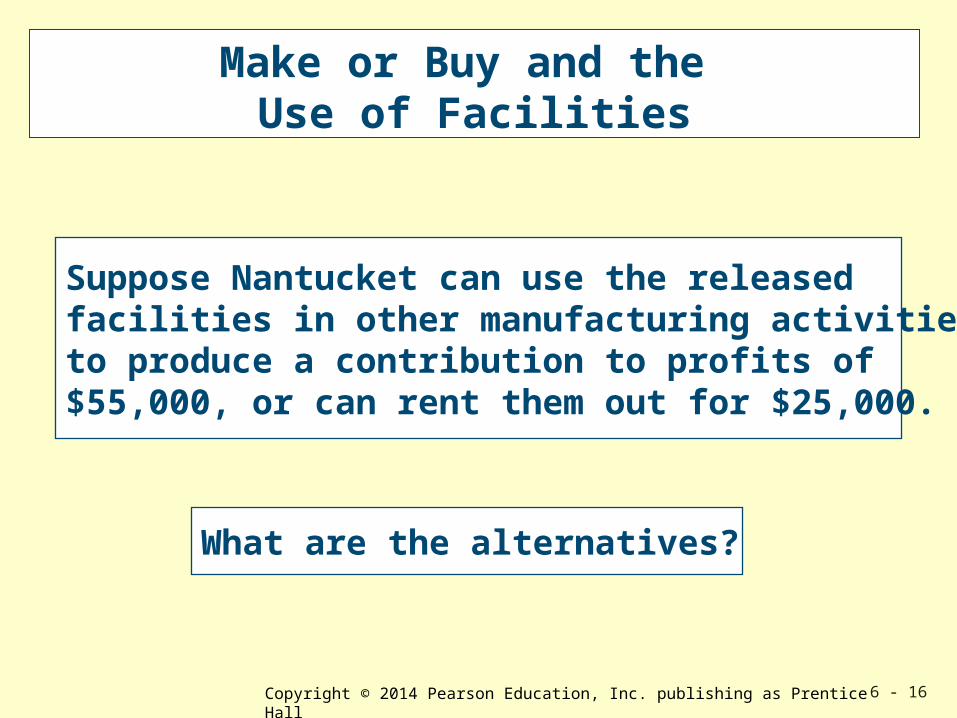
Suppose Nantucket can use the releasedfacilities in other manufacturing activitiesto produce a contribution to profits of$55,000, or can rent them out for $25,000.
What are the alternatives?
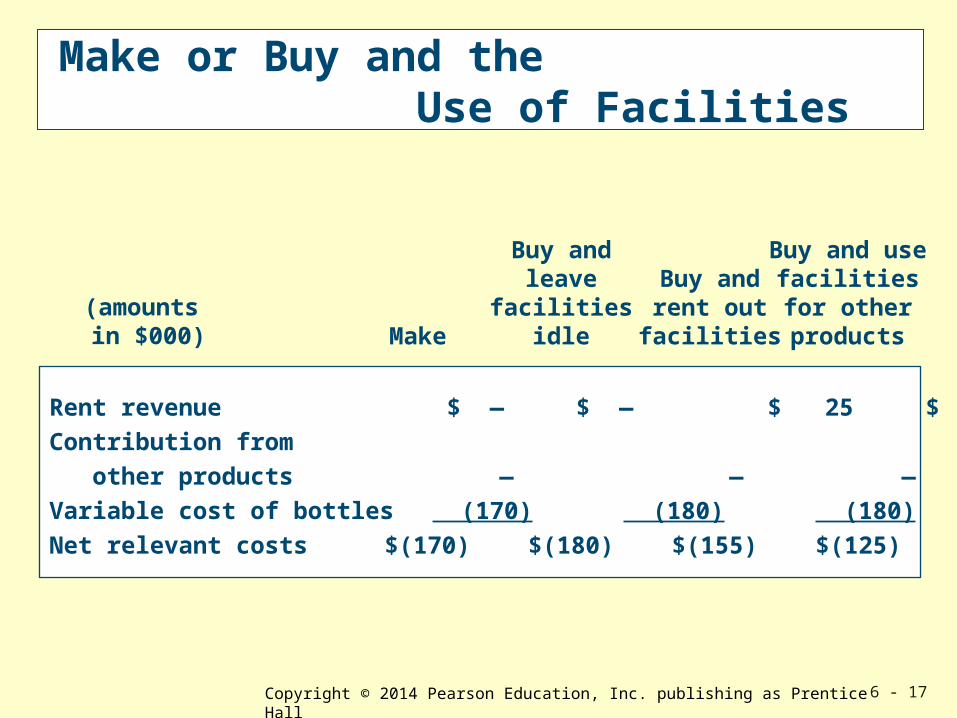
Copyright © 2014 Pearson Education, Inc. publishing as Prentice Hall 6 - 17
Make or Buy and the Use of Facilities
Rent revenue $ — $ — $ 25 $ —Contribution from other products — — — 55 Variable cost of bottles (170) (180) (180) (180) Net relevant costs $(170) $(180) $(155) $(125)
Make
Buy andleave
facilitiesidle
Buy andrent outfacilities
Buy and use facilities for other products
(amounts in $000)
Copyright © 2014 Pearson Education, Inc. publishing as Prentice Hall 6 - 18
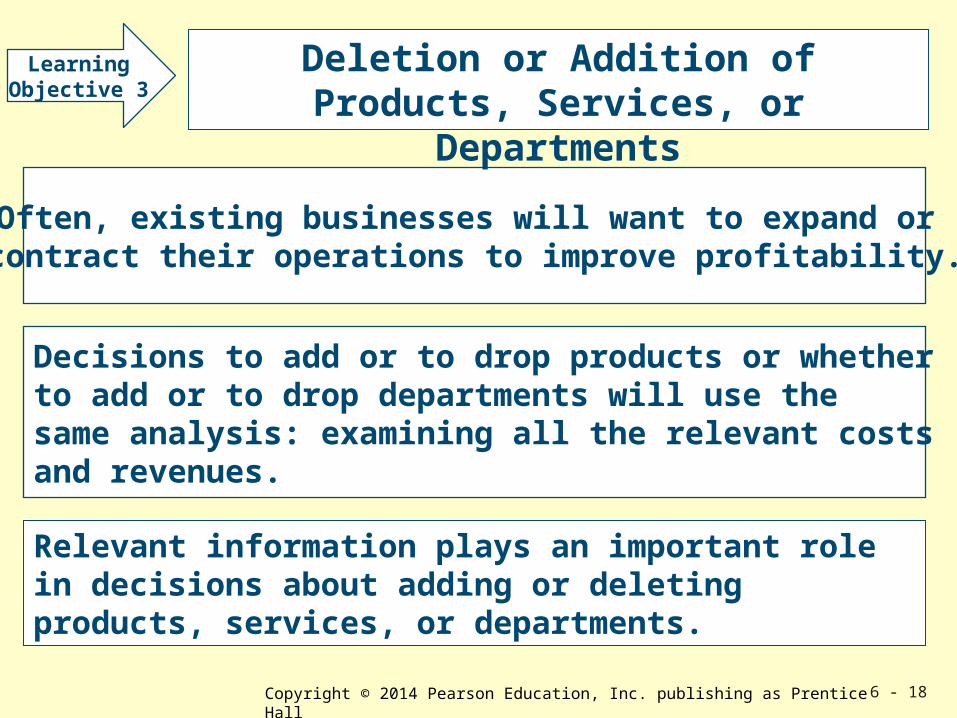
Often, existing businesses will want to expand or contract their operations to improve profitability.
LearningObjective 3
Deletion or Addition of Products, Services, or Departments
Decisions to add or to drop products or whether to add or to drop departments will use the same analysis: examining all the relevant costs and revenues.
Relevant information plays an important role in decisions about adding or deleting products, services, or departments.
Copyright © 2014 Pearson Education, Inc. publishing as Prentice Hall 6 - 19
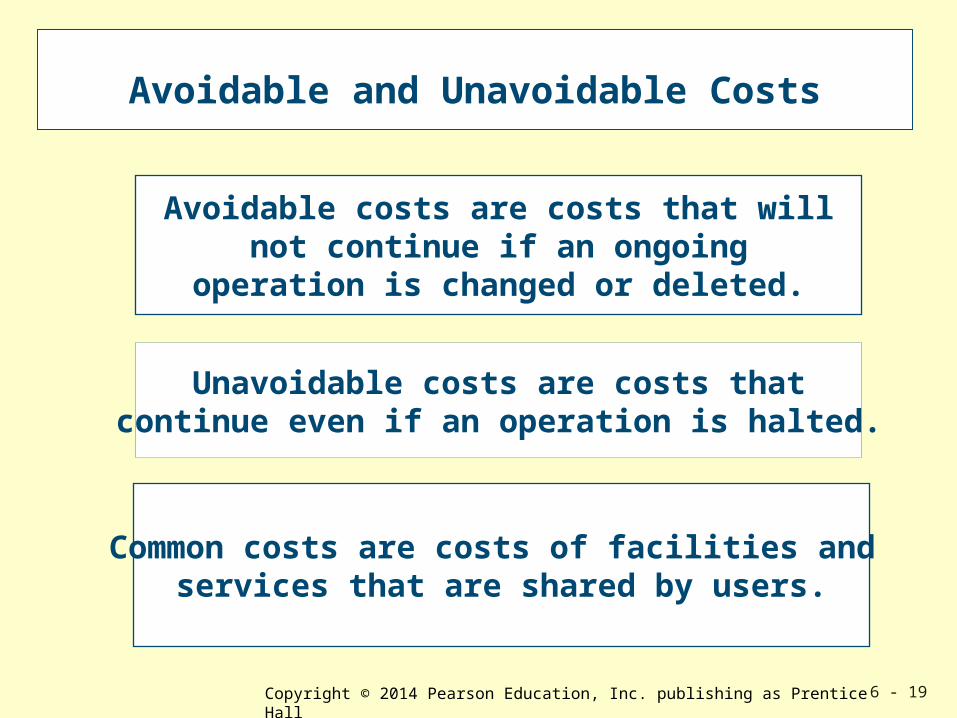
Avoidable costs are costs that willnot continue if an ongoing
operation is changed or deleted.
Unavoidable costs are costs thatcontinue even if an operation is halted.
Avoidable and Unavoidable Costs
Common costs are costs of facilities and services that are shared by users.
Copyright © 2014 Pearson Education, Inc. publishing as Prentice Hall 6 - 20
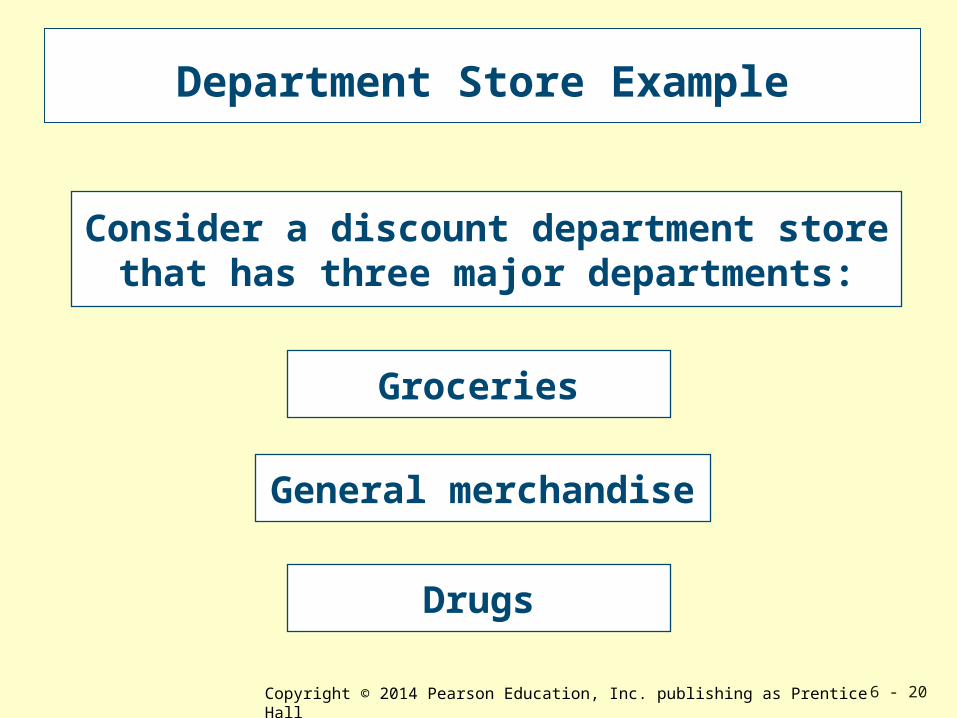
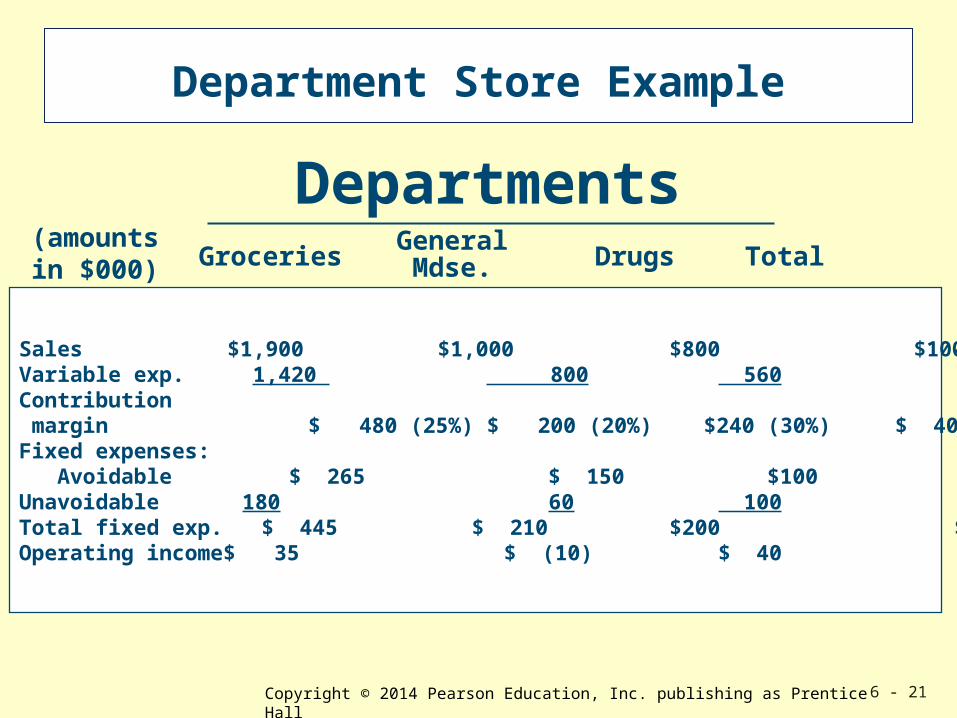
Groceries
General merchandise
Drugs
Consider a discount department storethat has three major departments:
Department Store Example
Copyright © 2014 Pearson Education, Inc. publishing as Prentice Hall 6 - 21
Sales $1,900 $1,000 $800 $100Variable exp. 1,420 800 560 60Contribution margin $ 480 (25%) $ 200 (20%) $240 (30%) $ 40 (40%)Fixed expenses: Avoidable $ 265 $ 150 $100 $ 15 Unavoidable 180 60 100 20Total fixed exp. $ 445 $ 210 $200 $ 35Operating income$ 35 $ (10) $ 40 $ 5
DepartmentsGroceries
GeneralMdse. Drugs Total
Department Store Example
(amounts in $000)
Copyright © 2014 Pearson Education, Inc. publishing as Prentice Hall 6 - 22
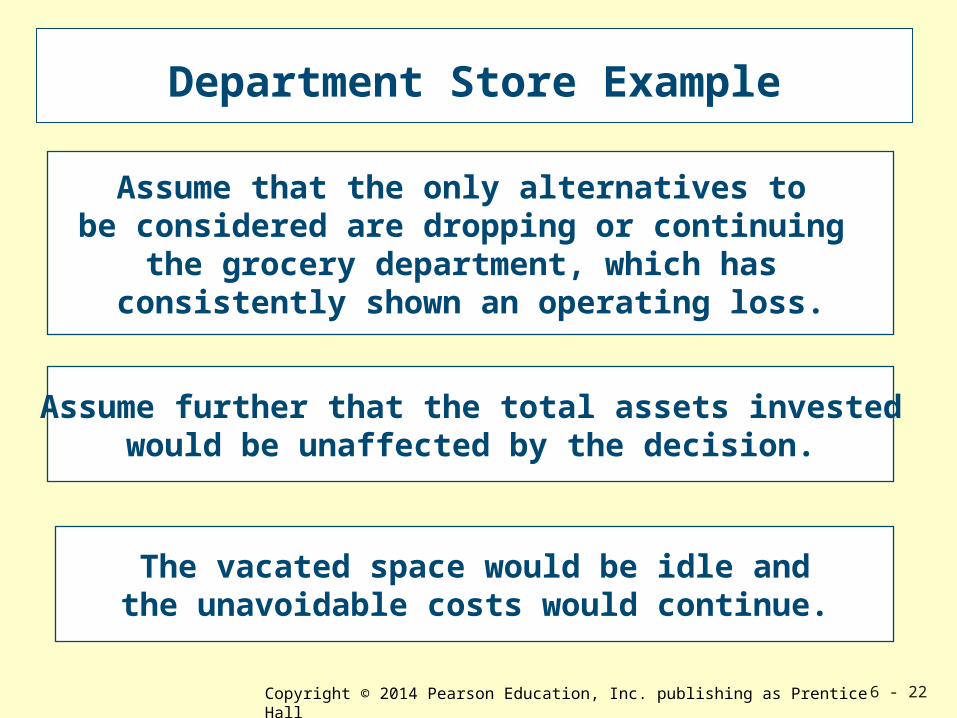
Assume further that the total assets investedwould be unaffected by the decision.
The vacated space would be idle andthe unavoidable costs would continue.
Assume that the only alternatives to be considered are dropping or continuing
the grocery department, which has consistently shown an operating loss.
Department Store Example
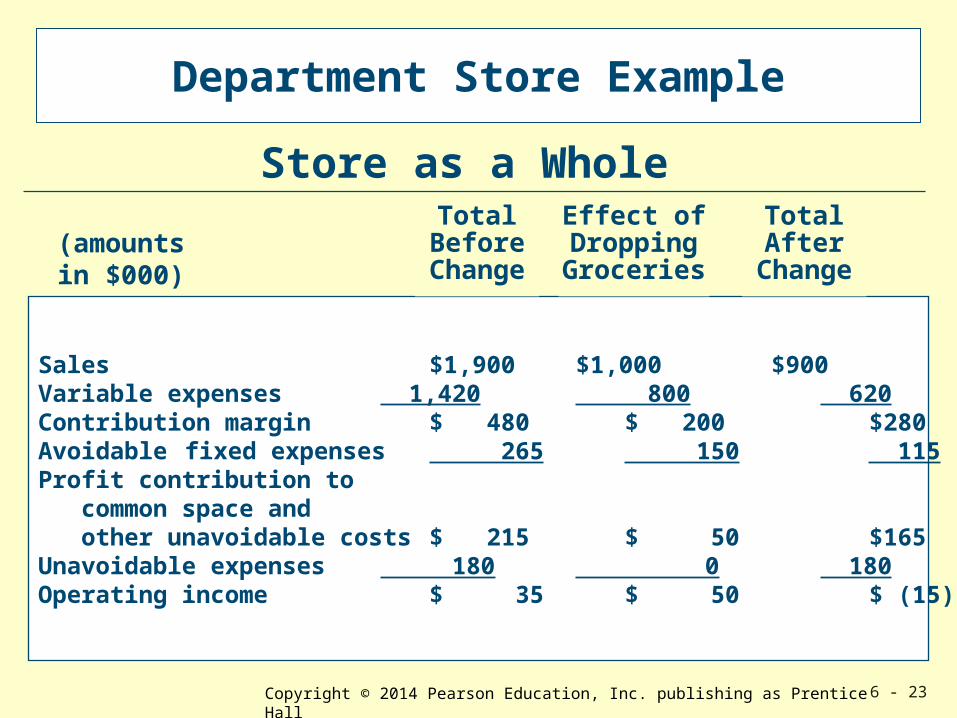
Copyright © 2014 Pearson Education, Inc. publishing as Prentice Hall 6 - 23
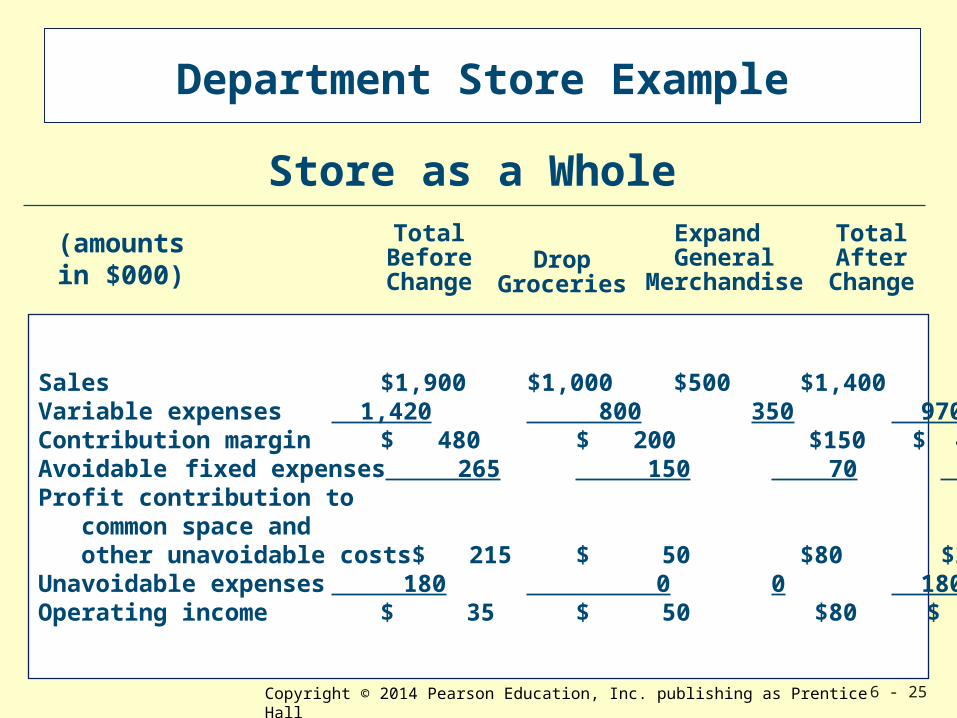
Sales $1,900 $1,000 $900Variable expenses 1,420 800 620Contribution margin $ 480 $ 200 $280Avoidable fixed expenses 265 150 115Profit contribution to common space and other unavoidable costs $ 215 $ 50 $165Unavoidable expenses 180 0 180Operating income $ 35 $ 50 $ (15)
TotalBeforeChange
Effect ofDroppingGroceries
TotalAfter
Change
Store as a Whole
Department Store Example
(amounts in $000)
Copyright © 2014 Pearson Education, Inc. publishing as Prentice Hall 6 - 24
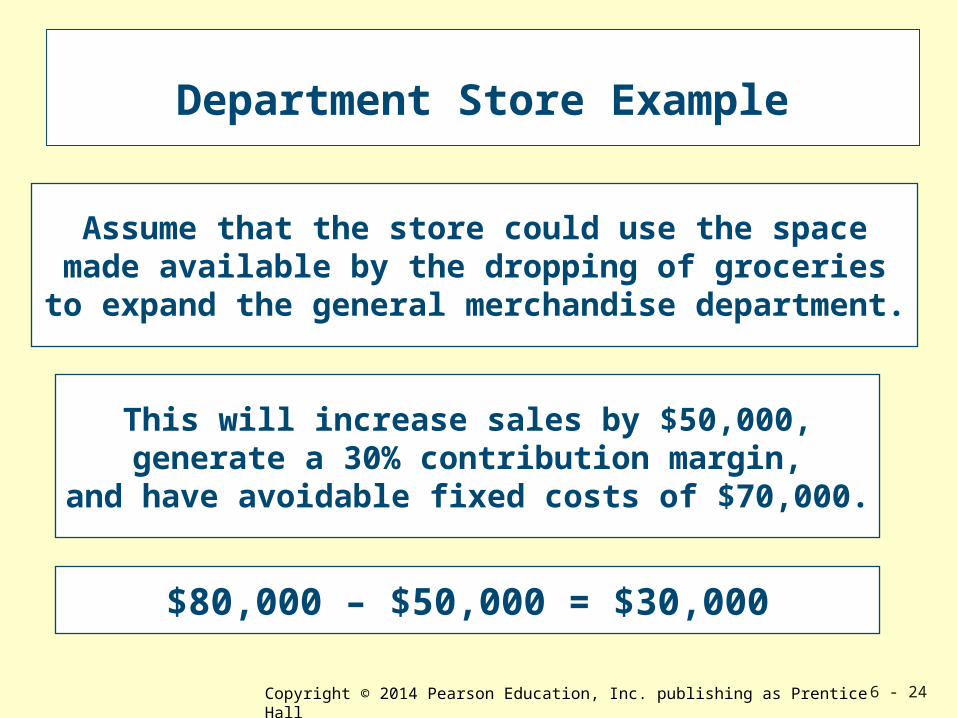
Assume that the store could use the spacemade available by the dropping of groceries
to expand the general merchandise department.
This will increase sales by $50,000,generate a 30% contribution margin,
and have avoidable fixed costs of $70,000.
$80,000 – $50,000 = $30,000
Department Store Example
Copyright © 2014 Pearson Education, Inc. publishing as Prentice Hall 6 - 25
Sales $1,900 $1,000 $500 $1,400Variable expenses 1,420 800 350 970 Contribution margin $ 480 $ 200 $150 $ 430Avoidable fixed expenses 265 150 70 185Profit contribution to common space and other unavoidable costs$ 215 $ 50 $80 $245Unavoidable expenses 180 0 0 180Operating income $ 35 $ 50 $80 $ 65
TotalBeforeChange
DropGroceries
TotalAfter
Change
Store as a WholeExpand General
Merchandise
Department Store Example
(amounts in $000)
Copyright © 2014 Pearson Education, Inc. publishing as Prentice Hall 6 - 26
Department Store Example
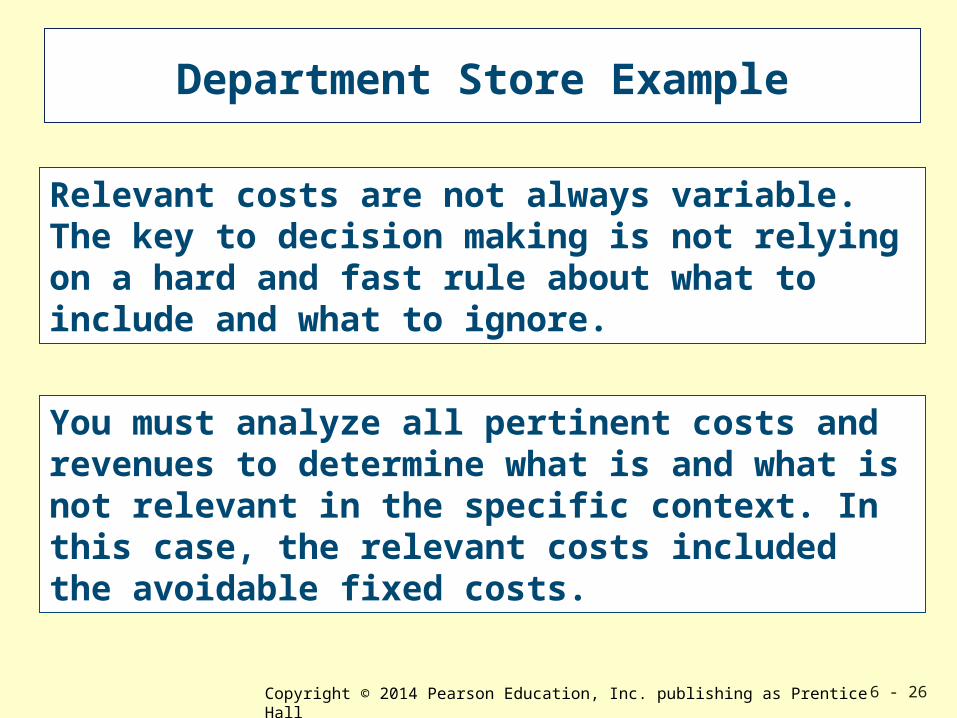
Relevant costs are not always variable. The key to decision making is not relying on a hard and fast rule about what to include and what to ignore.
You must analyze all pertinent costs and revenues to determine what is and what is not relevant in the specific context. In this case, the relevant costs included the avoidable fixed costs.
Copyright © 2014 Pearson Education, Inc. publishing as Prentice Hall 6 - 27
Department Store Example
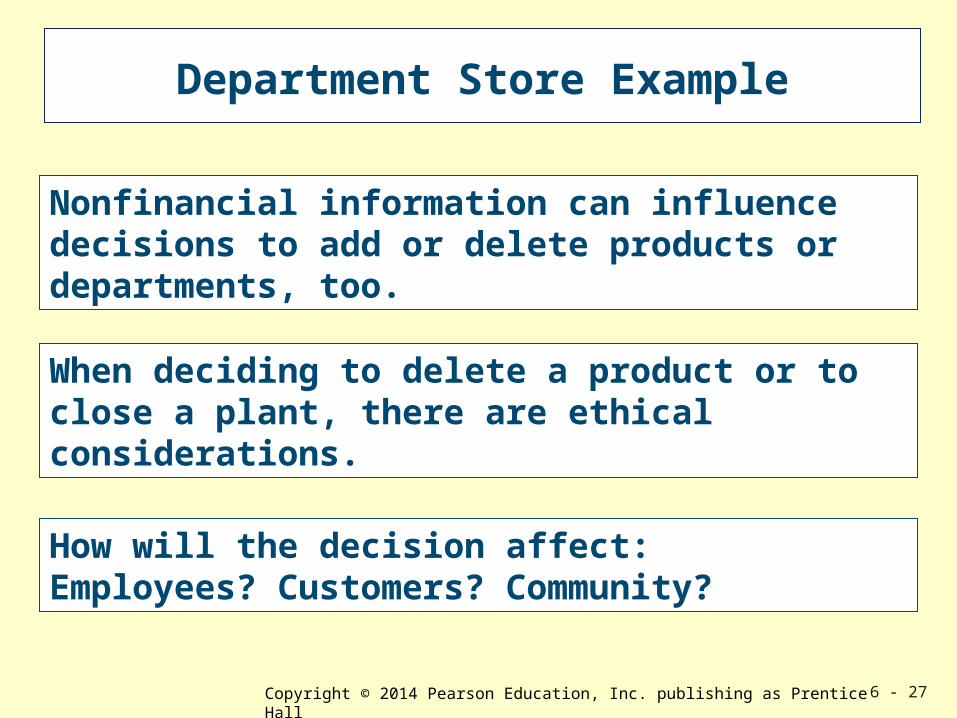
Nonfinancial information can influence decisions to add or delete products or departments, too.
When deciding to delete a product or to close a plant, there are ethical considerations.
How will the decision affect:Employees? Customers? Community?
Copyright © 2014 Pearson Education, Inc. publishing as Prentice Hall 6 - 28
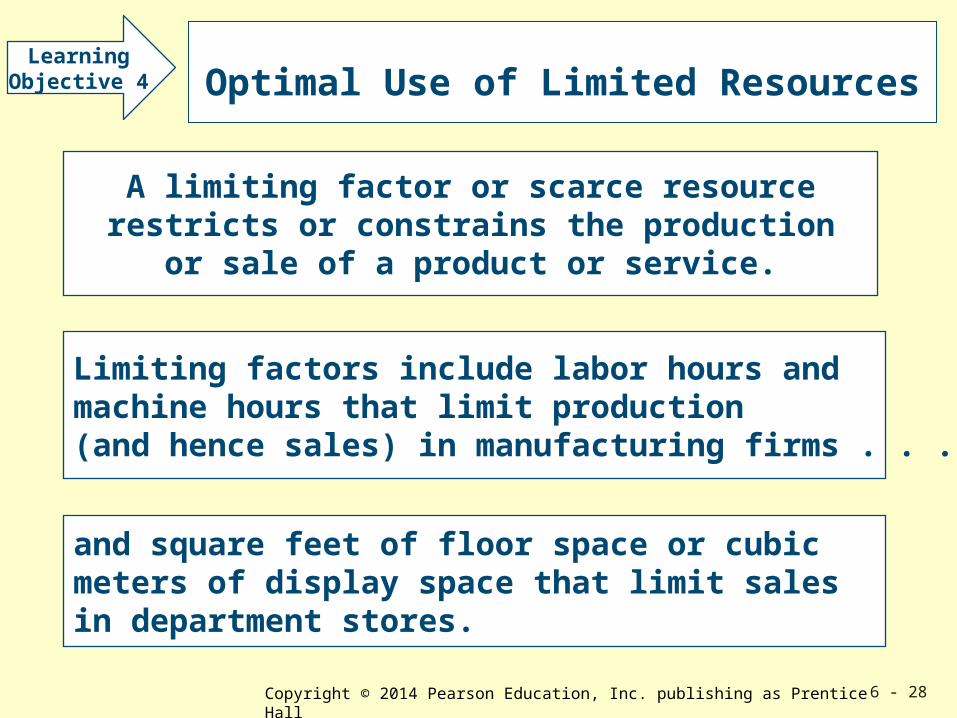
Limiting factors include labor hours and machine hours that limit production (and hence sales) in manufacturing firms . . .
A limiting factor or scarce resourcerestricts or constrains the production
or sale of a product or service.
LearningObjective 4 Optimal Use of Limited Resources
and square feet of floor space or cubic meters of display space that limit sales in department stores.
Copyright © 2014 Pearson Education, Inc. publishing as Prentice Hall 6 - 29
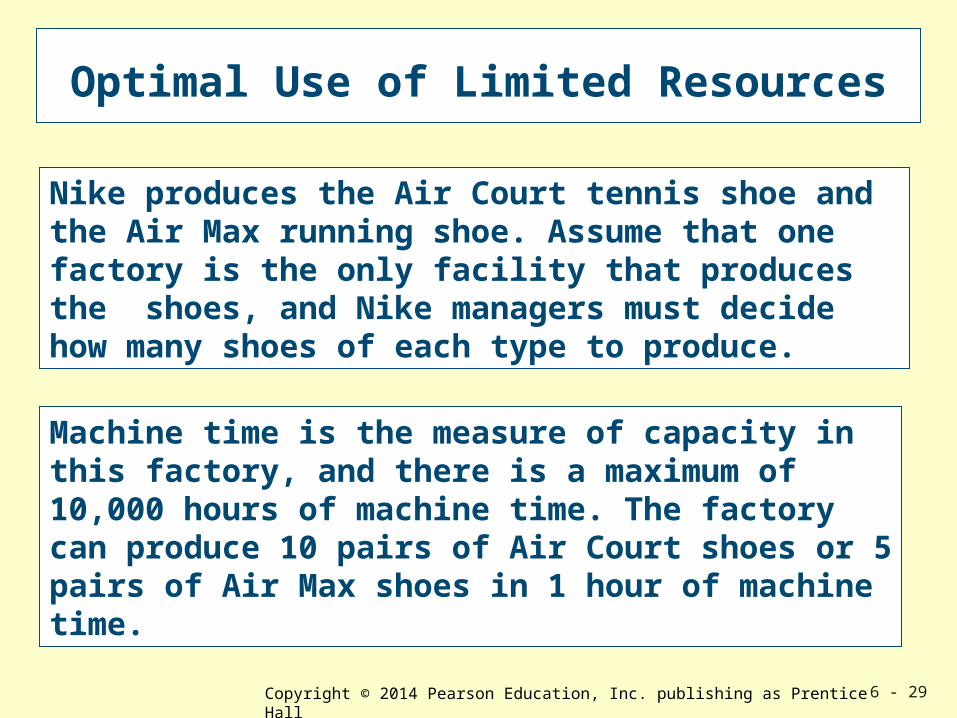
Optimal Use of Limited Resources
Nike produces the Air Court tennis shoe and the Air Max running shoe. Assume that one factory is the only facility that produces the shoes, and Nike managers must decide how many shoes of each type to produce.
Machine time is the measure of capacity in this factory, and there is a maximum of 10,000 hours of machine time. The factory can produce 10 pairs of Air Court shoes or 5 pairs of Air Max shoes in 1 hour of machine time.
Copyright © 2014 Pearson Education, Inc. publishing as Prentice Hall 6 - 30
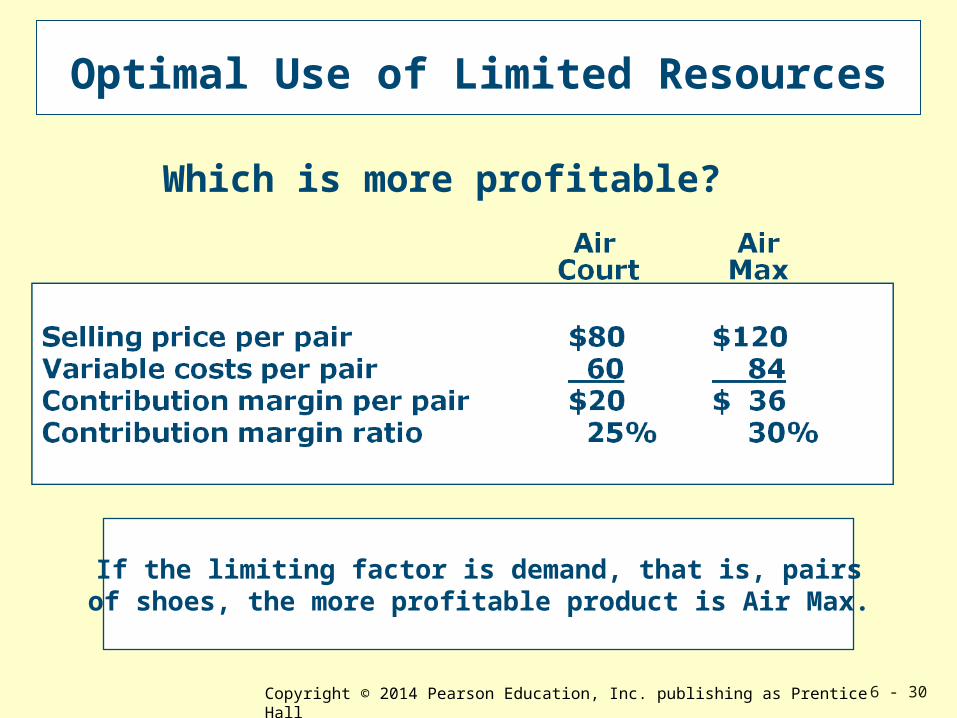
Optimal Use of Limited Resources
Which is more profitable?
If the limiting factor is demand, that is, pairsof shoes, the more profitable product is Air Max.
Copyright © 2014 Pearson Education, Inc. publishing as Prentice Hall 6 - 31
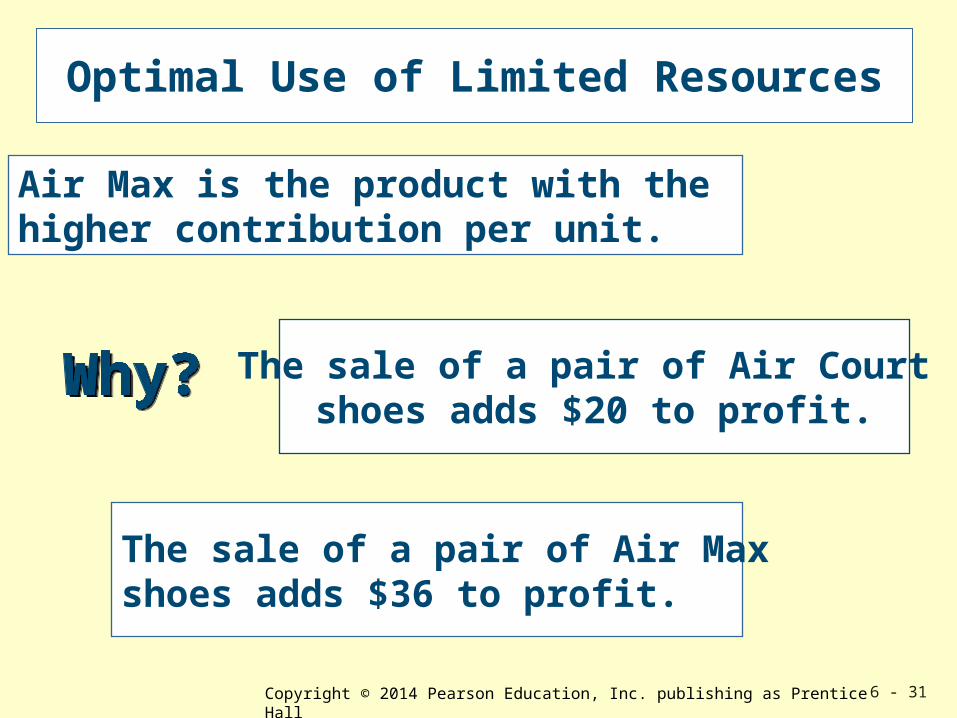
Optimal Use of Limited Resources
The sale of a pair of Air Court shoes adds $20 to profit.
The sale of a pair of Air Maxshoes adds $36 to profit.
Air Max is the product with the higher contribution per unit.
Copyright © 2014 Pearson Education, Inc. publishing as Prentice Hall 6 - 32
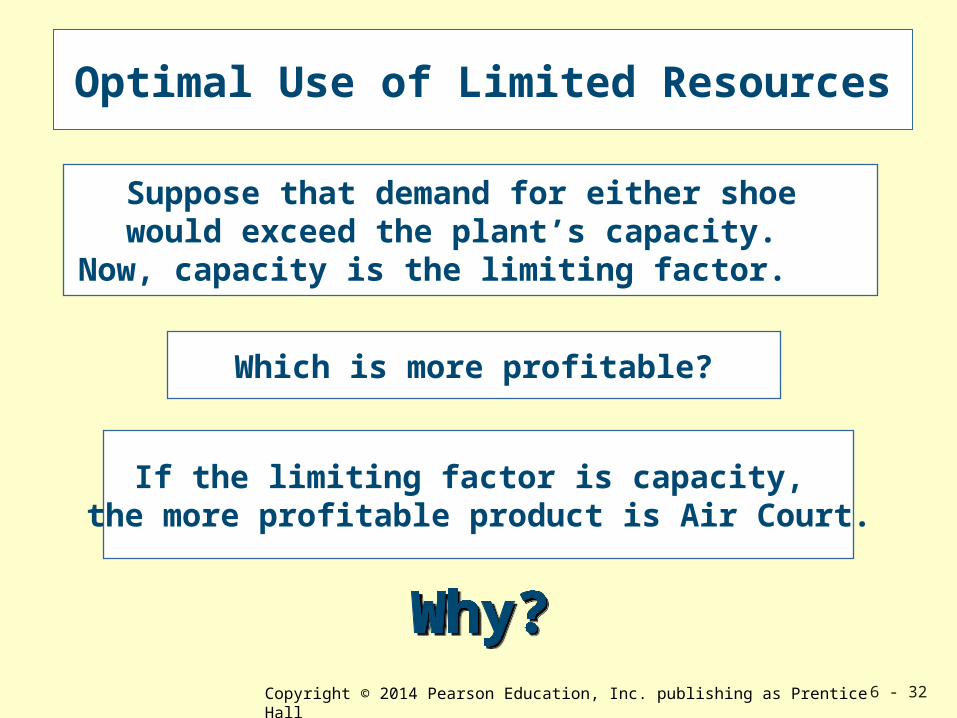
Suppose that demand for either shoe would exceed the plant’s capacity.
Now, capacity is the limiting factor.
Optimal Use of Limited Resources
Which is more profitable?
If the limiting factor is capacity, the more profitable product is Air Court.
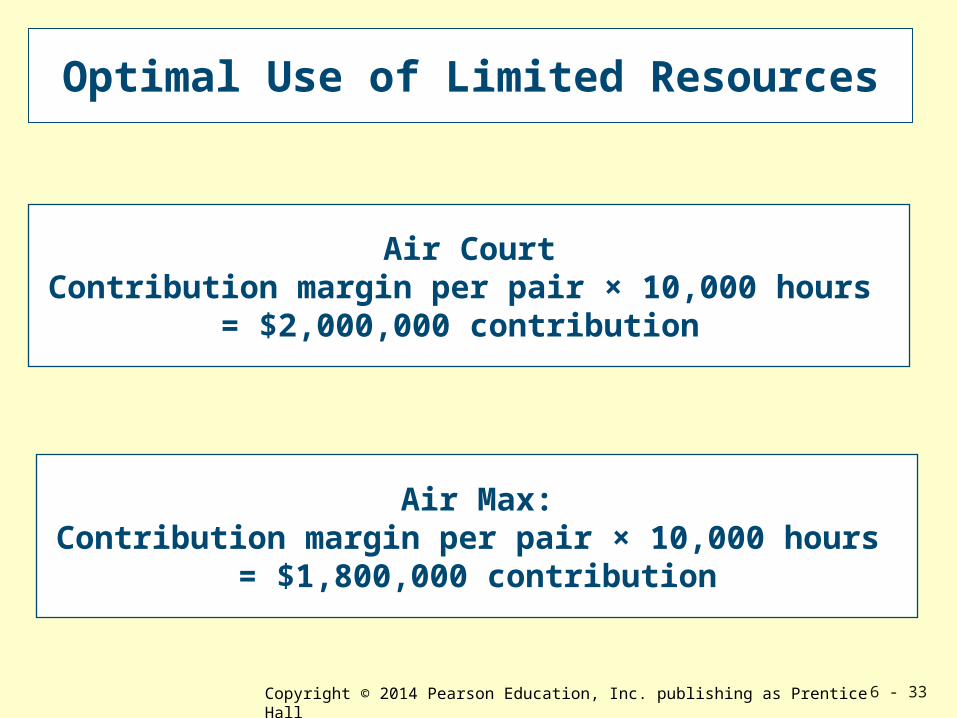
Copyright © 2014 Pearson Education, Inc. publishing as Prentice Hall 6 - 33
Optimal Use of Limited Resources
Air CourtContribution margin per pair × 10,000 hours
= $2,000,000 contribution
Air Max:Contribution margin per pair × 10,000 hours
= $1,800,000 contribution
Copyright © 2014 Pearson Education, Inc. publishing as Prentice Hall 6 - 34
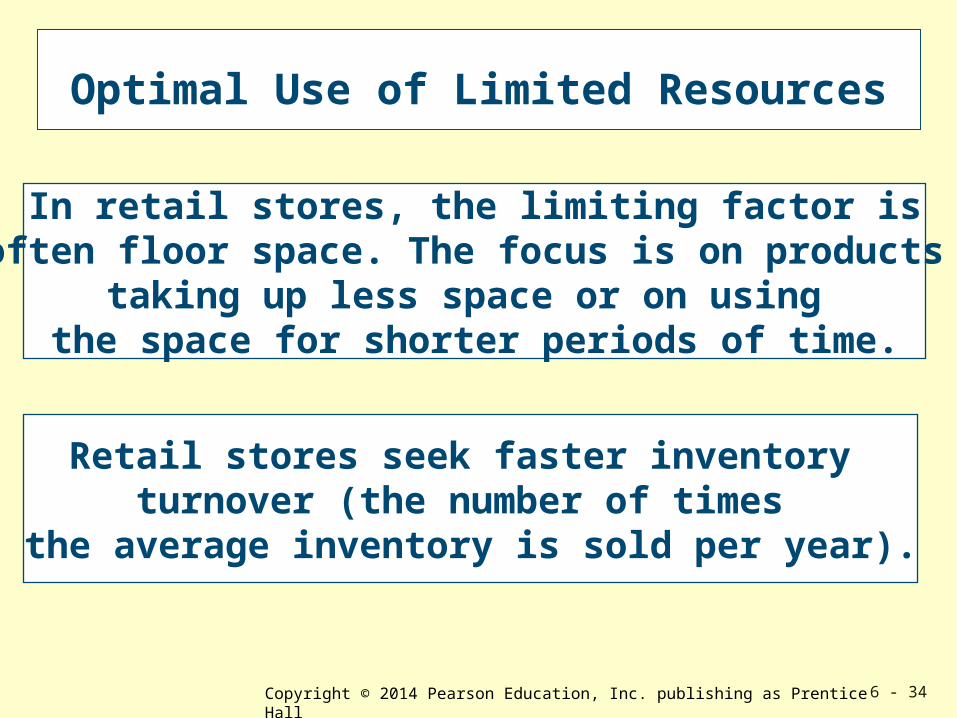
Optimal Use of Limited Resources
In retail stores, the limiting factor isoften floor space. The focus is on products
taking up less space or on using the space for shorter periods of time.
Retail stores seek faster inventory turnover (the number of times
the average inventory is sold per year).
Copyright © 2014 Pearson Education, Inc. publishing as Prentice Hall 6 - 35
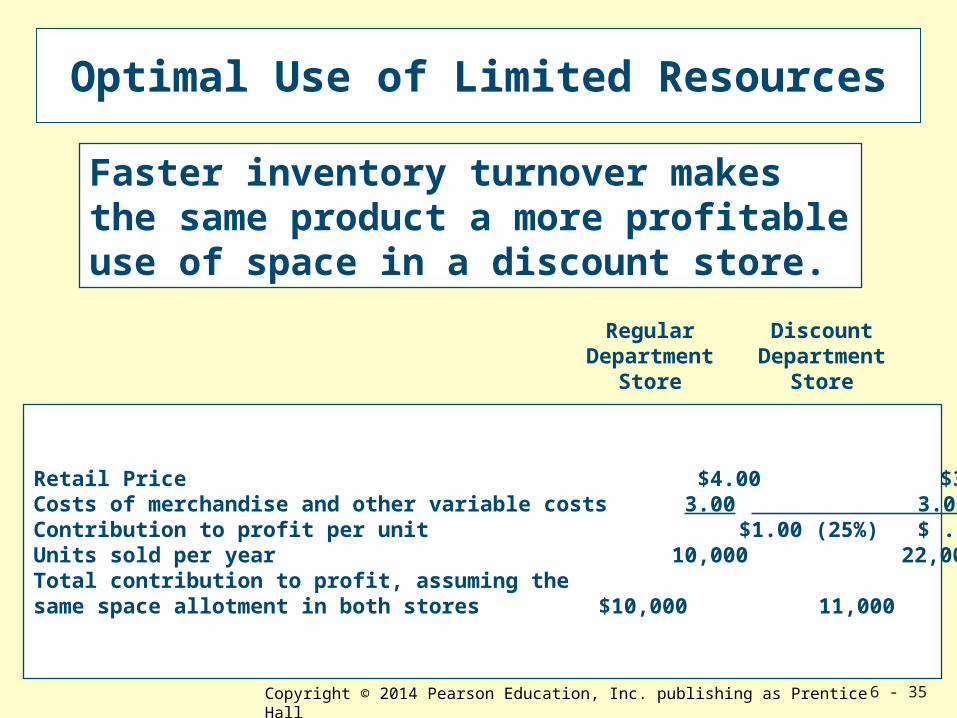
Optimal Use of Limited Resources
Retail Price $4.00 $3.50Costs of merchandise and other variable costs 3.00 3.00 Contribution to profit per unit $1.00 (25%) $ .50 (14%) Units sold per year 10,000 22,000Total contribution to profit, assuming thesame space allotment in both stores $10,000 11,000
RegularDepartment
Store
DiscountDepartment
Store
Faster inventory turnover makes the same product a more profitable use of space in a discount store.
Copyright © 2014 Pearson Education, Inc. publishing as Prentice Hall 6 - 36
Joint Product Costs
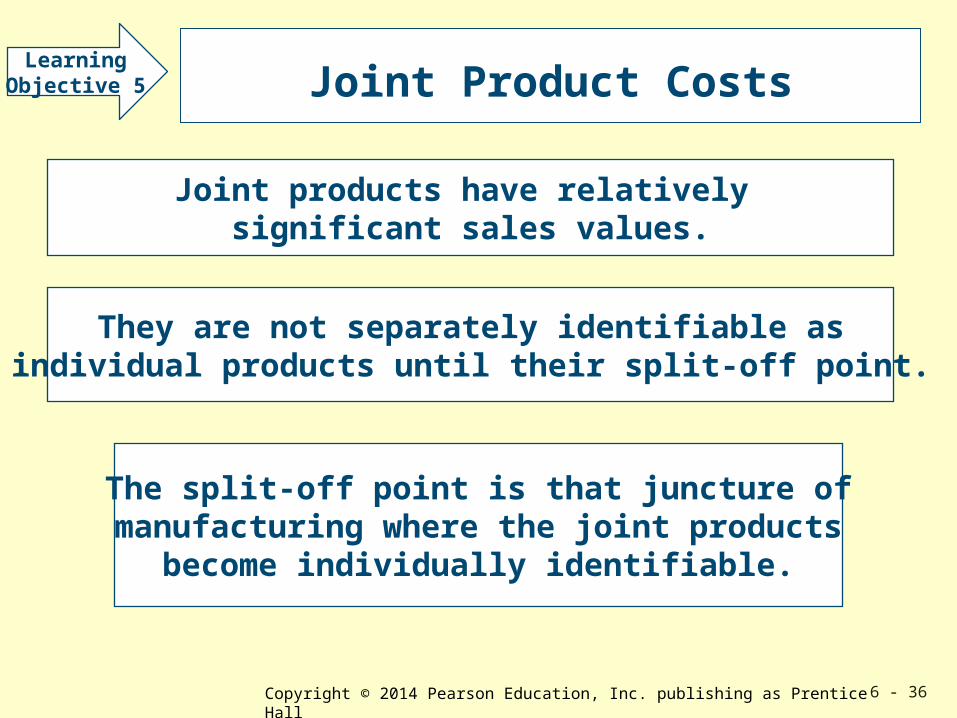
Joint products have relatively significant sales values.
They are not separately identifiable asindividual products until their split-off point.
The split-off point is that juncture ofmanufacturing where the joint products
become individually identifiable.
LearningObjective 5
Copyright © 2014 Pearson Education, Inc. publishing as Prentice Hall 6 - 37
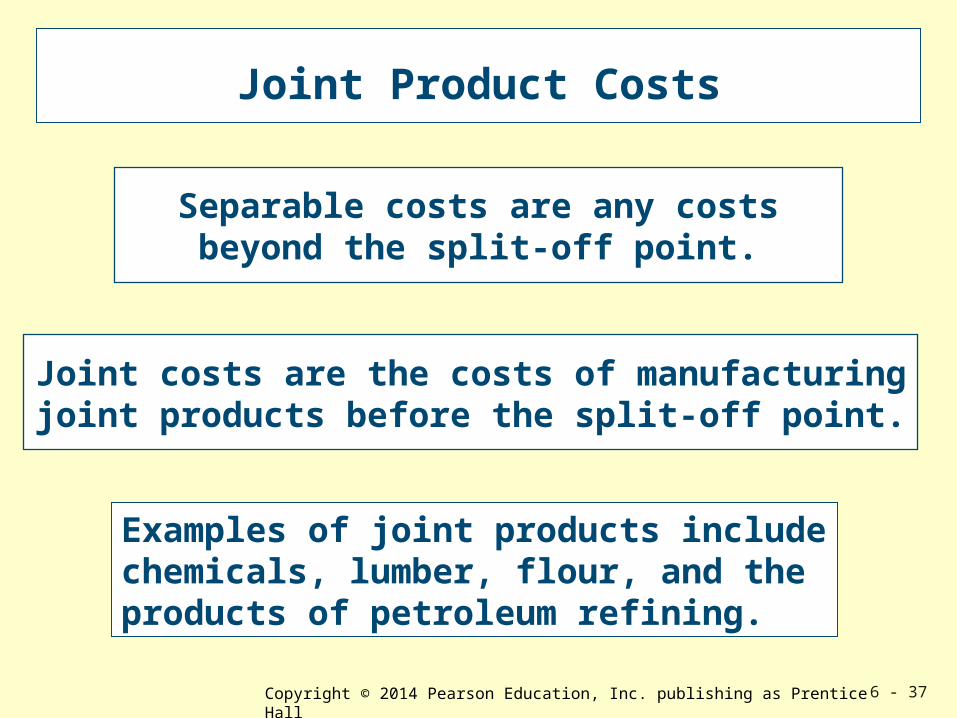
Separable costs are any costsbeyond the split-off point.
Joint costs are the costs of manufacturingjoint products before the split-off point.
Joint Product Costs
Examples of joint products include chemicals, lumber, flour, and the products of petroleum refining.
Copyright © 2014 Pearson Education, Inc. publishing as Prentice Hall 6 - 38
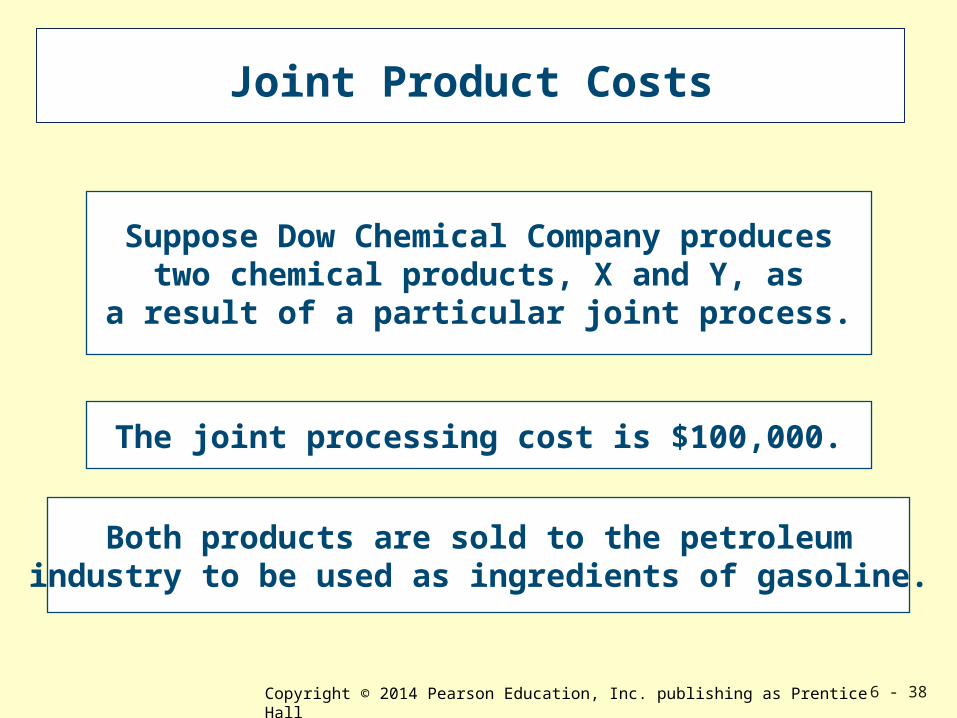
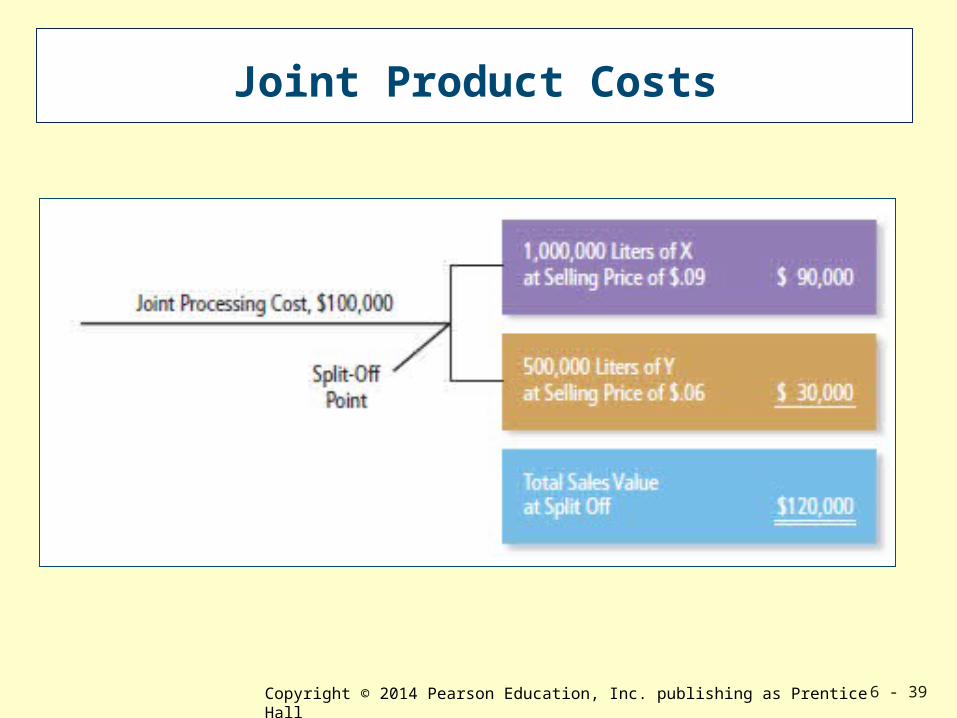
Suppose Dow Chemical Company producestwo chemical products, X and Y, as
a result of a particular joint process.
The joint processing cost is $100,000.
Both products are sold to the petroleumindustry to be used as ingredients of gasoline.
Joint Product Costs
Copyright © 2014 Pearson Education, Inc. publishing as Prentice Hall 6 - 39
Joint Product Costs
Copyright © 2014 Pearson Education, Inc. publishing as Prentice Hall 6 - 40
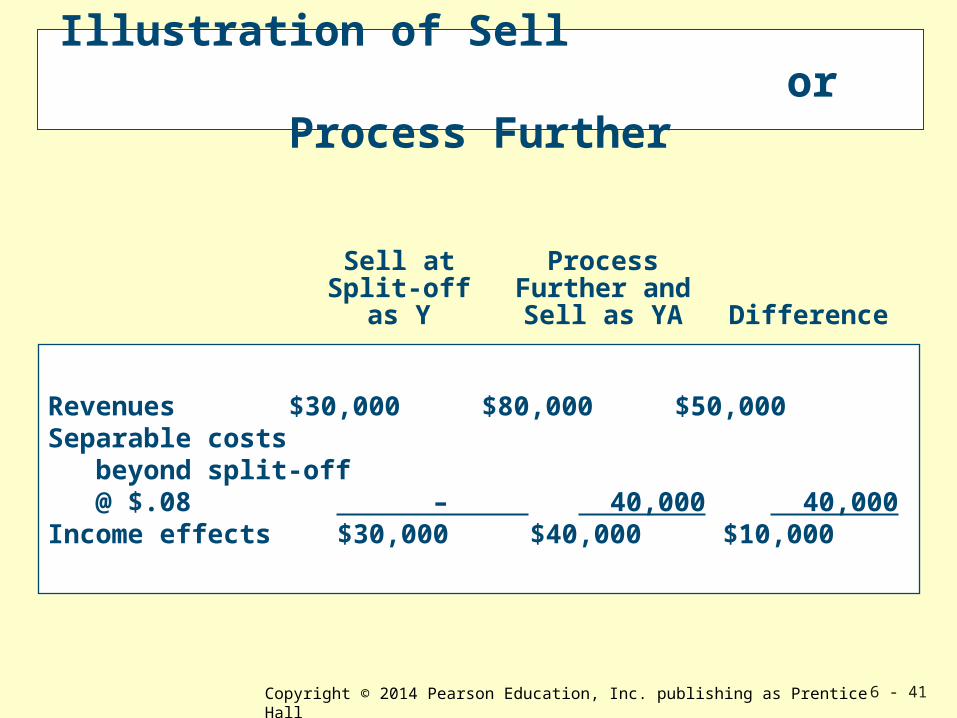
Illustration of Sell or Process Further
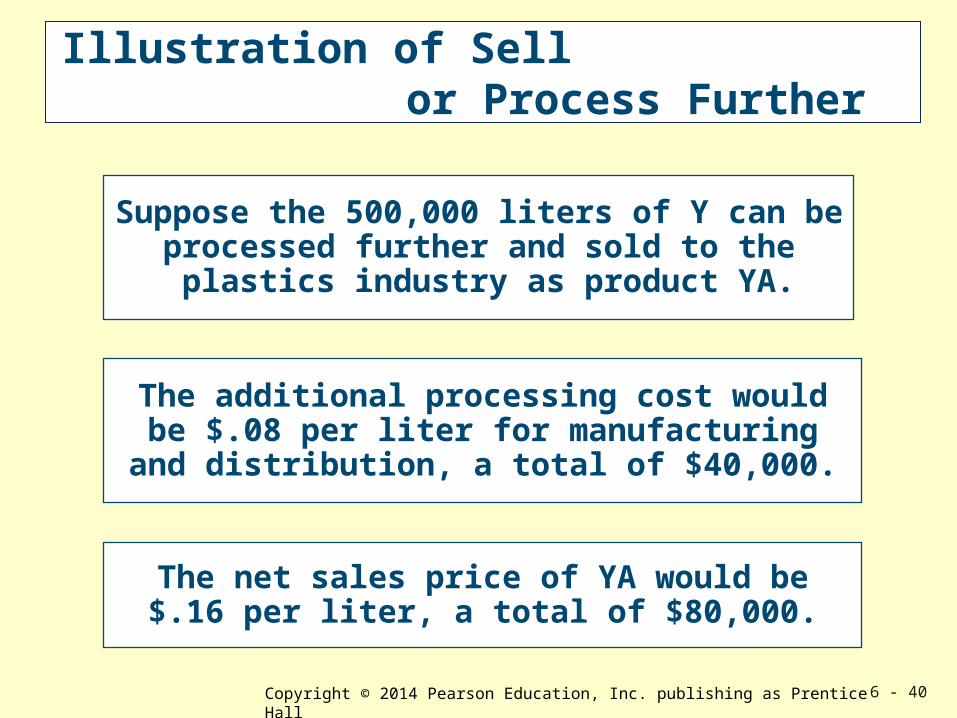
Suppose the 500,000 liters of Y can beprocessed further and sold to the plastics industry as product YA.
The additional processing cost wouldbe $.08 per liter for manufacturingand distribution, a total of $40,000.
The net sales price of YA would be$.16 per liter, a total of $80,000.
Copyright © 2014 Pearson Education, Inc. publishing as Prentice Hall 6 - 41
Illustration of Sell or Process Further
Revenues $30,000 $80,000 $50,000Separable costs beyond split-off @ $.08 – 40,000 40,000Income effects $30,000 $40,000 $10,000
Sell atSplit-off
as Y
ProcessFurther andSell as YA Difference
Copyright © 2014 Pearson Education, Inc. publishing as Prentice Hall 6 - 42
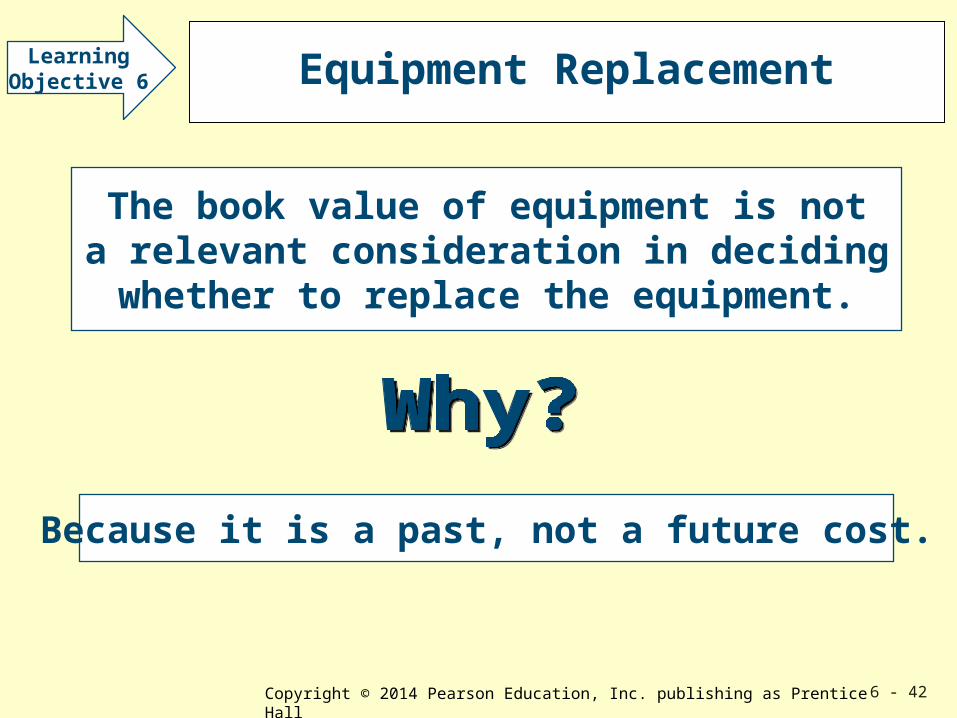
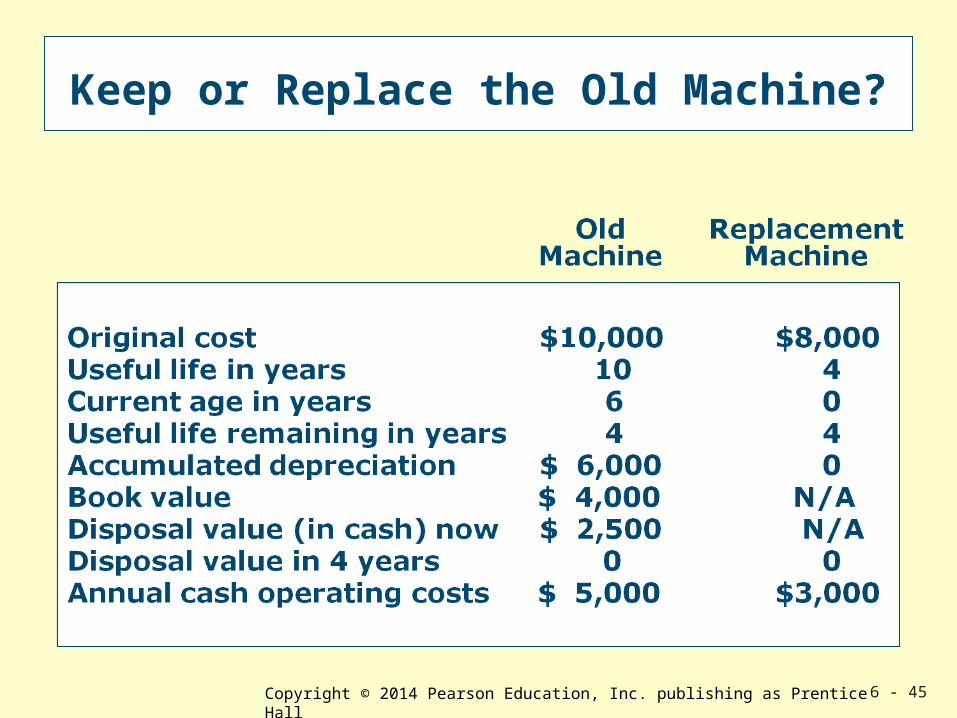
Equipment Replacement
The book value of equipment is nota relevant consideration in decidingwhether to replace the equipment.
Because it is a past, not a future cost.
LearningObjective 6
Copyright © 2014 Pearson Education, Inc. publishing as Prentice Hall 6 - 43
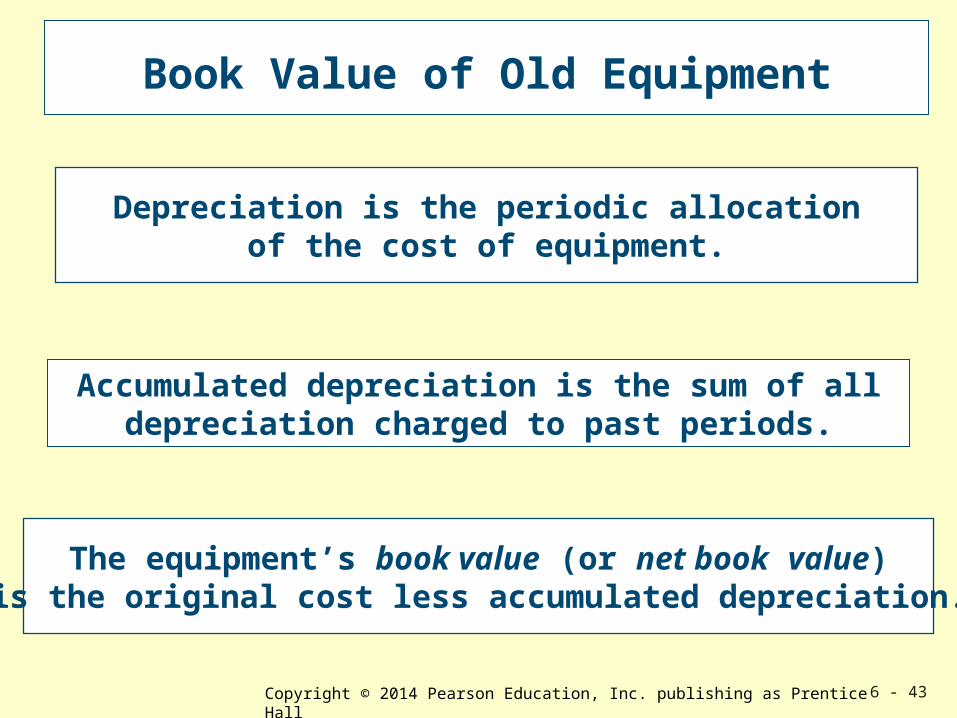
Book Value of Old Equipment
Depreciation is the periodic allocationof the cost of equipment.
The equipment’s book value (or net book value)is the original cost less accumulated depreciation.
Accumulated depreciation is the sum of all depreciation charged to past periods.
Copyright © 2014 Pearson Education, Inc. publishing as Prentice Hall 6 - 44
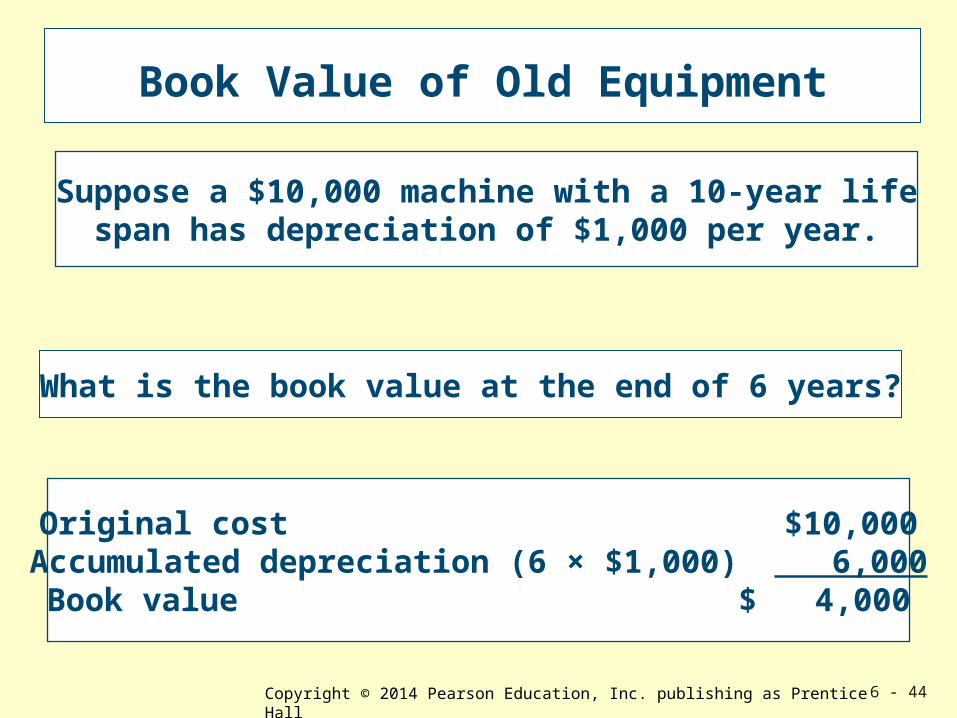
Book Value of Old Equipment
Suppose a $10,000 machine with a 10-year lifespan has depreciation of $1,000 per year.
What is the book value at the end of 6 years?
Original cost $10,000Accumulated depreciation (6 × $1,000) 6,000Book value $ 4,000
Copyright © 2014 Pearson Education, Inc. publishing as Prentice Hall 6 - 45
Keep or Replace the Old Machine?
Copyright © 2014 Pearson Education, Inc. publishing as Prentice Hall 6 - 46
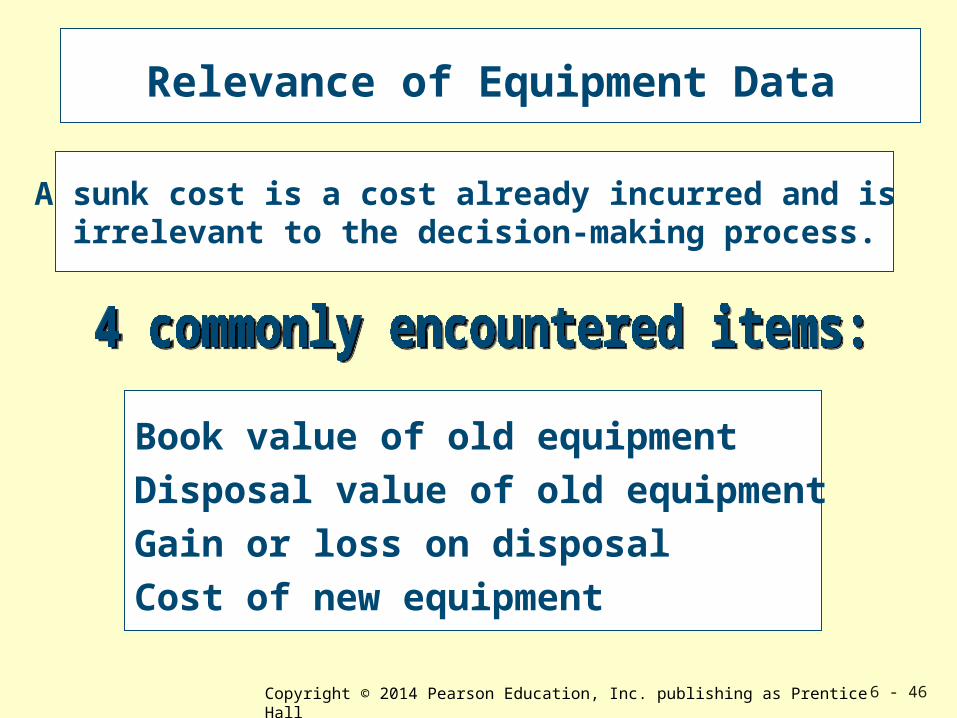
Relevance of Equipment Data
Book value of old equipmentDisposal value of old equipmentGain or loss on disposalCost of new equipment
A sunk cost is a cost already incurred and is irrelevant to the decision-making process.
Copyright © 2014 Pearson Education, Inc. publishing as Prentice Hall 6 - 47
Relevance of Equipment Data
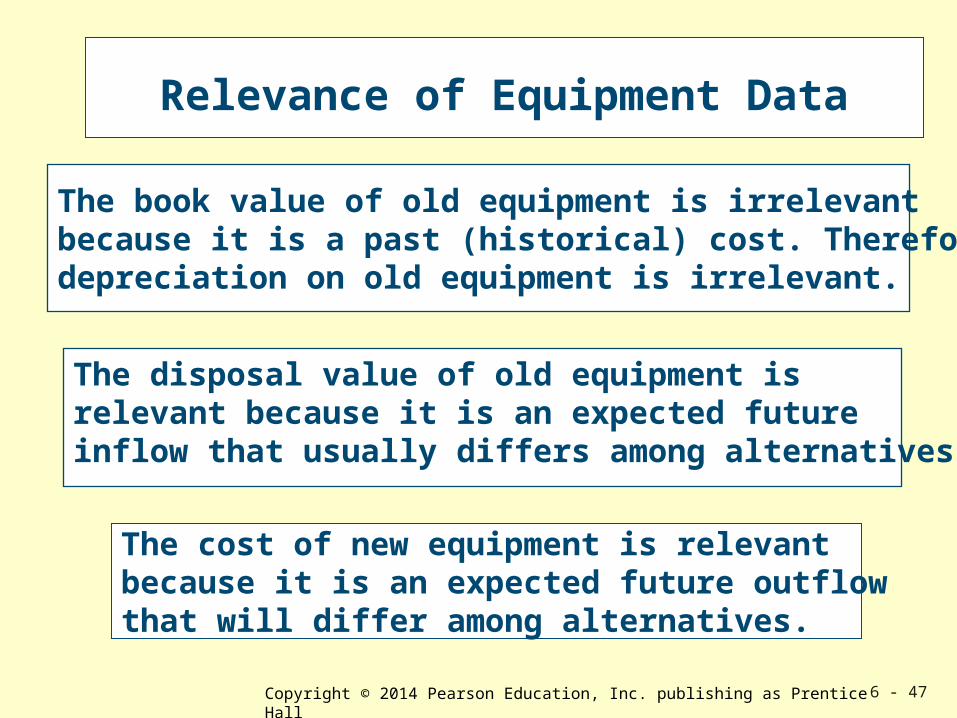
The book value of old equipment is irrelevant because it is a past (historical) cost. Therefore, depreciation on old equipment is irrelevant.
The cost of new equipment is relevantbecause it is an expected future outflowthat will differ among alternatives.
The disposal value of old equipment is relevant because it is an expected future inflow that usually differs among alternatives.
Copyright © 2014 Pearson Education, Inc. publishing as Prentice Hall 6 - 48
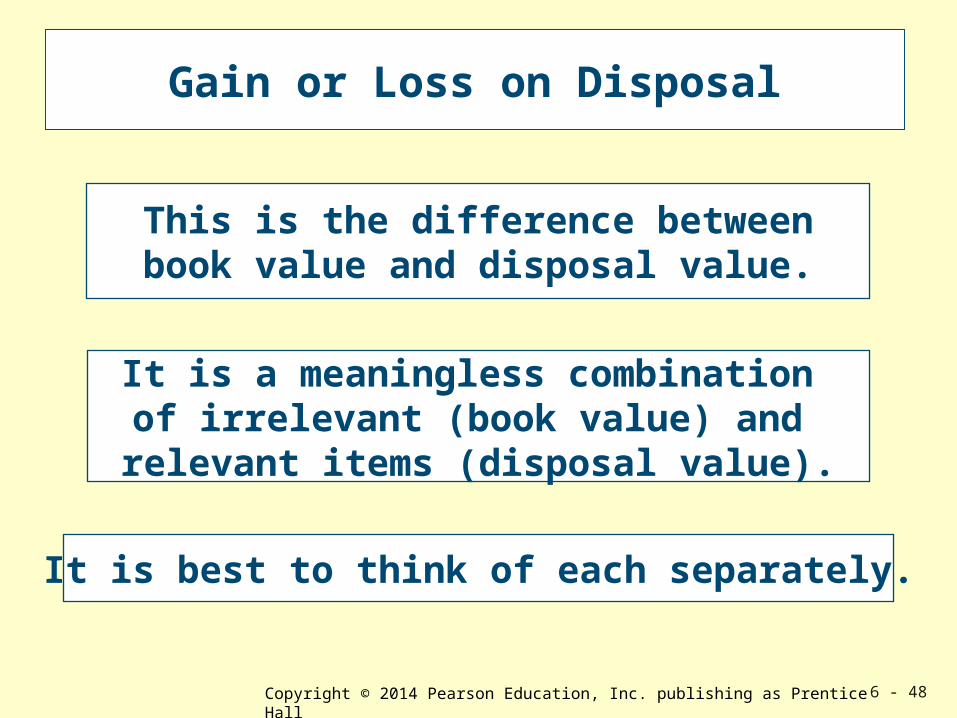
Gain or Loss on Disposal
This is the difference betweenbook value and disposal value.
It is a meaningless combination of irrelevant (book value) and relevant items (disposal value).
It is best to think of each separately.
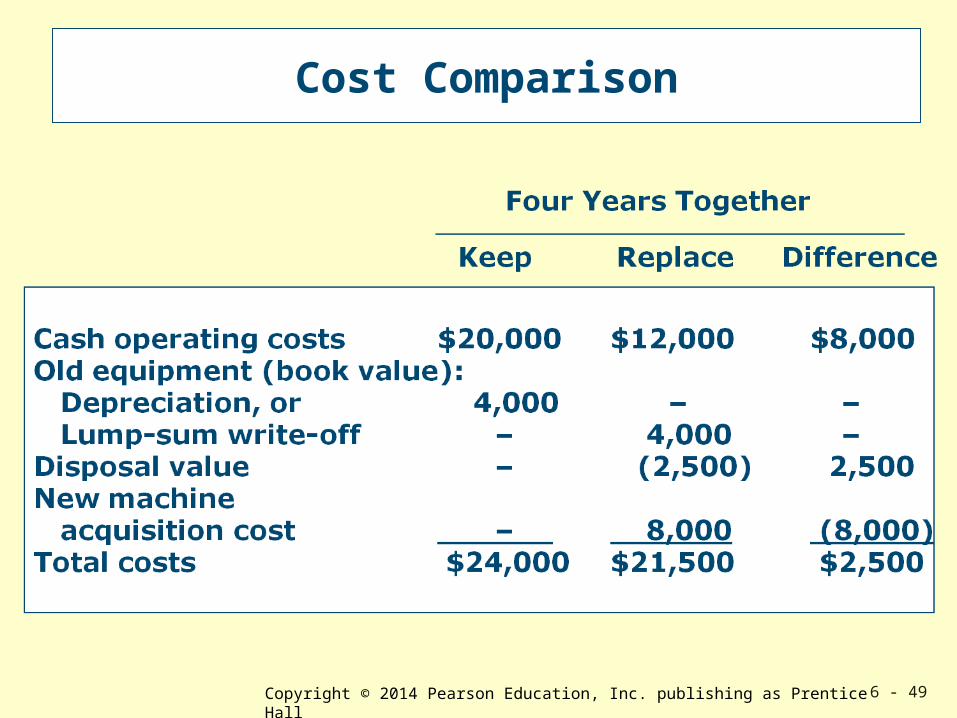
Copyright © 2014 Pearson Education, Inc. publishing as Prentice Hall 6 - 49
Cost Comparison
Copyright © 2014 Pearson Education, Inc. publishing as Prentice Hall 6 - 50
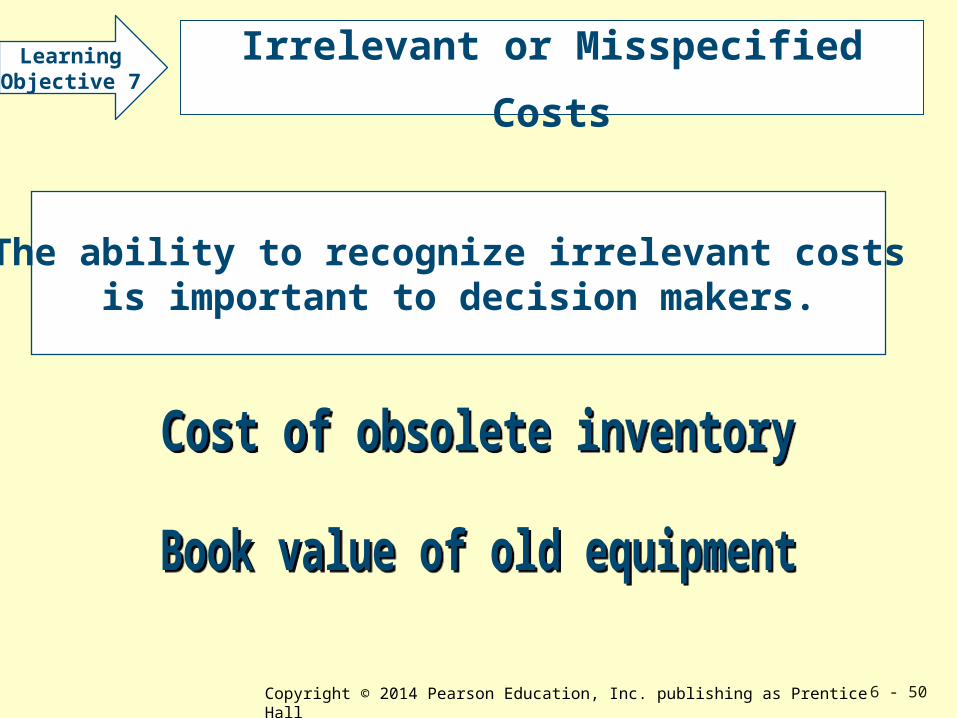
Irrelevant or Misspecified Costs
The ability to recognize irrelevant costs is important to decision makers.
LearningObjective 7
Copyright © 2014 Pearson Education, Inc. publishing as Prentice Hall 6 - 51
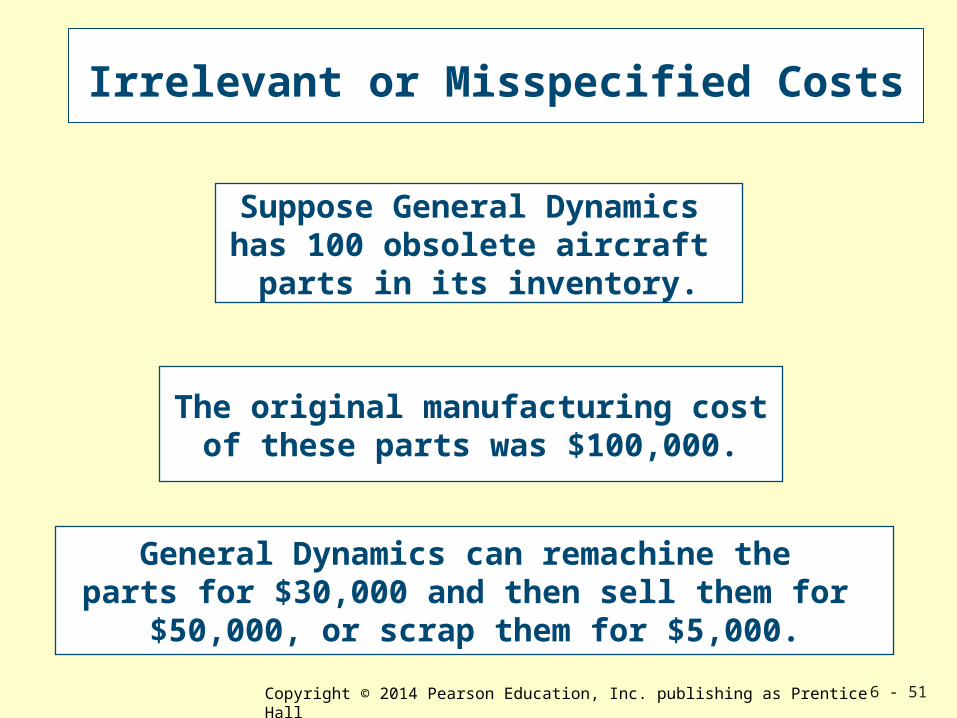
Irrelevant or Misspecified Costs
Suppose General Dynamics has 100 obsolete aircraft
parts in its inventory.
The original manufacturing costof these parts was $100,000.
General Dynamics can remachine the parts for $30,000 and then sell them for
$50,000, or scrap them for $5,000.
Copyright © 2014 Pearson Education, Inc. publishing as Prentice Hall 6 - 52
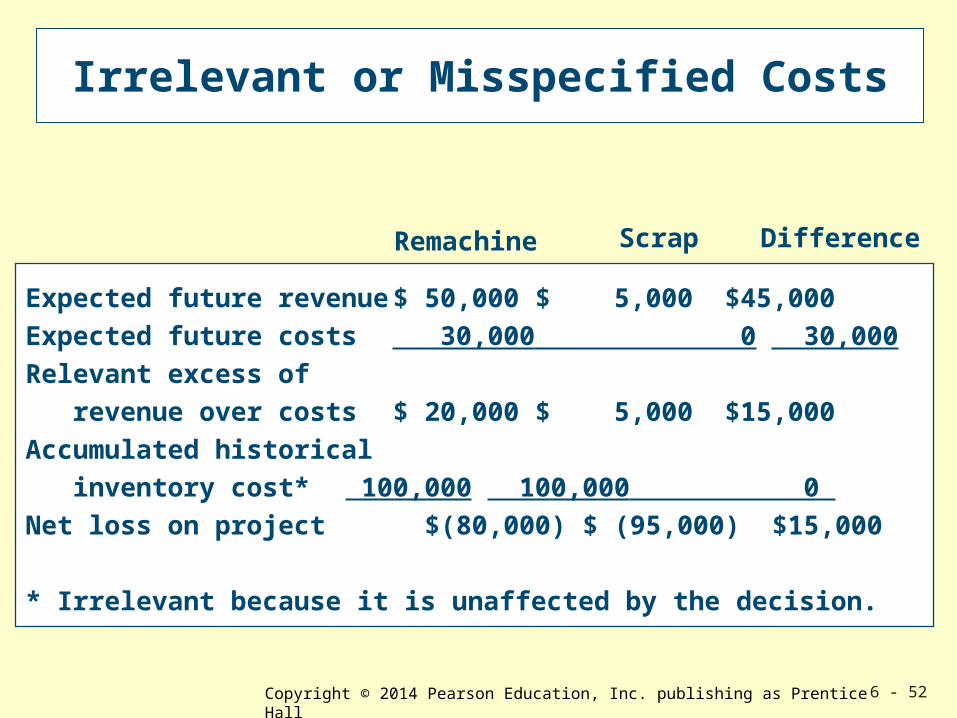
Irrelevant or Misspecified Costs
DifferenceRemachine Scrap
Expected future revenue $ 50,000 $ 5,000 $45,000Expected future costs 30,000 0 30,000Relevant excess of revenue over costs $ 20,000 $ 5,000 $15,000Accumulated historical inventory cost* 100,000 100,000 0 Net loss on project $(80,000) $ (95,000) $15,000
* Irrelevant because it is unaffected by the decision.
Copyright © 2014 Pearson Education, Inc. publishing as Prentice Hall 6 - 53
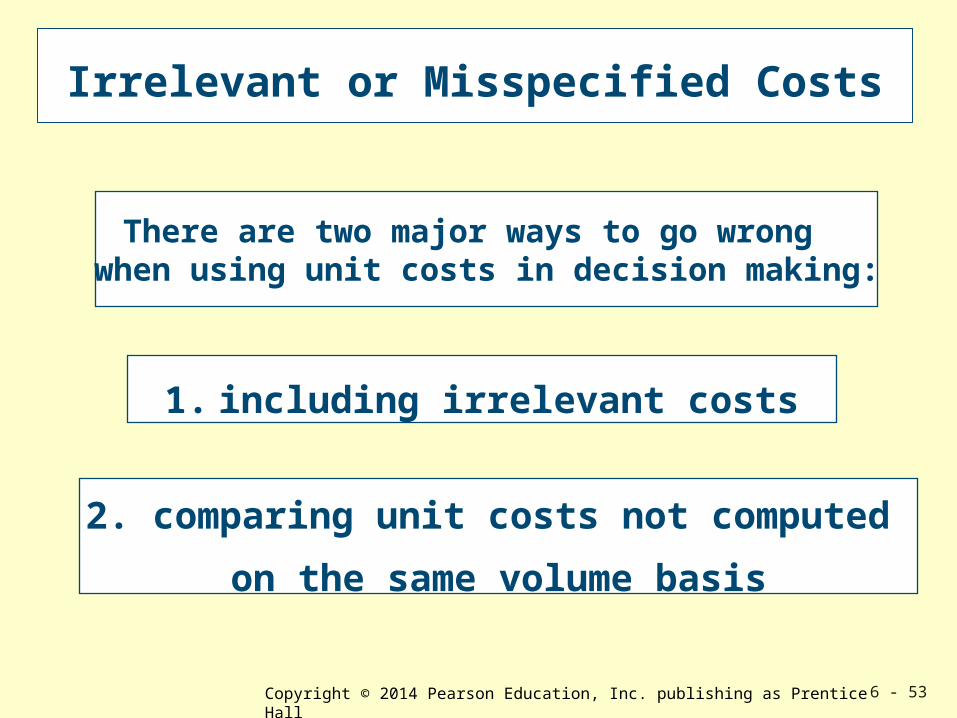
Irrelevant or Misspecified Costs
There are two major ways to go wrong when using unit costs in decision making:
1. including irrelevant costs
2. comparing unit costs not computed
on the same volume basis
Copyright © 2014 Pearson Education, Inc. publishing as Prentice Hall 6 - 54
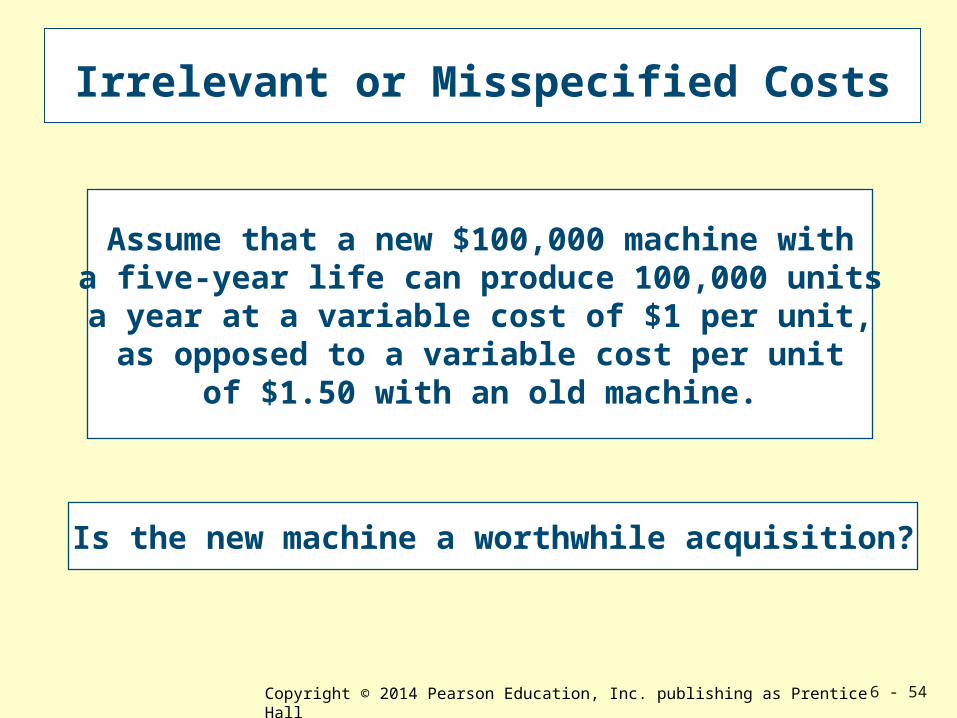
Irrelevant or Misspecified Costs
Assume that a new $100,000 machine witha five-year life can produce 100,000 units
a year at a variable cost of $1 per unit,as opposed to a variable cost per unit
of $1.50 with an old machine.
Is the new machine a worthwhile acquisition?
Copyright © 2014 Pearson Education, Inc. publishing as Prentice Hall 6 - 55
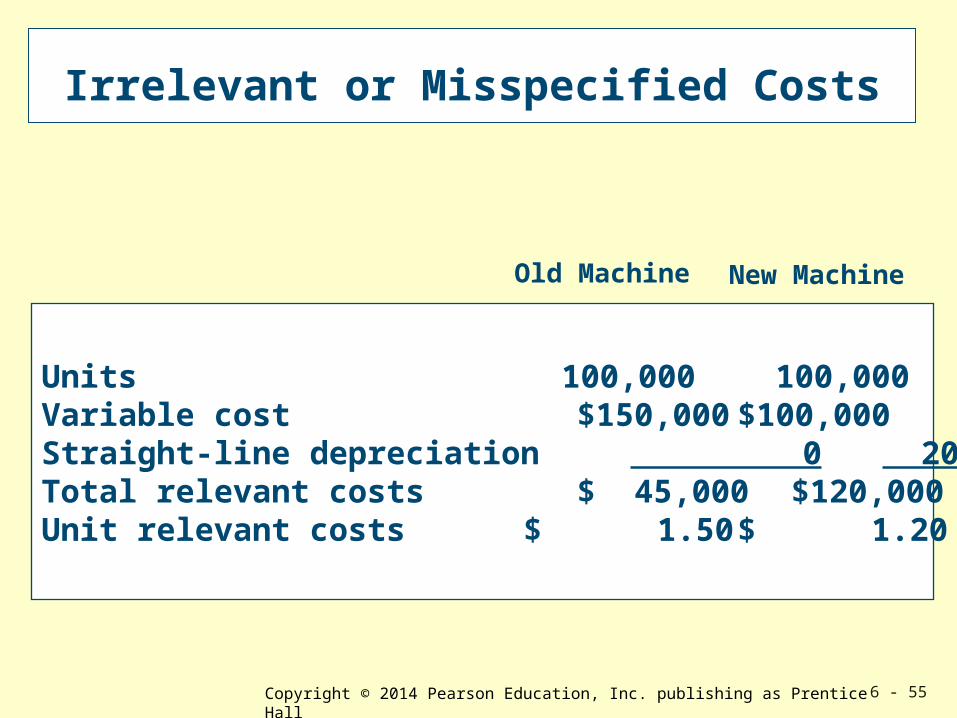
Irrelevant or Misspecified Costs
Units 100,000 100,000Variable cost $150,000 $100,000 Straight-line depreciation 0 20,000Total relevant costs $ 45,000 $120,000Unit relevant costs $ 1.50 $ 1.20
Old Machine New Machine
Copyright © 2014 Pearson Education, Inc. publishing as Prentice Hall 6 - 56
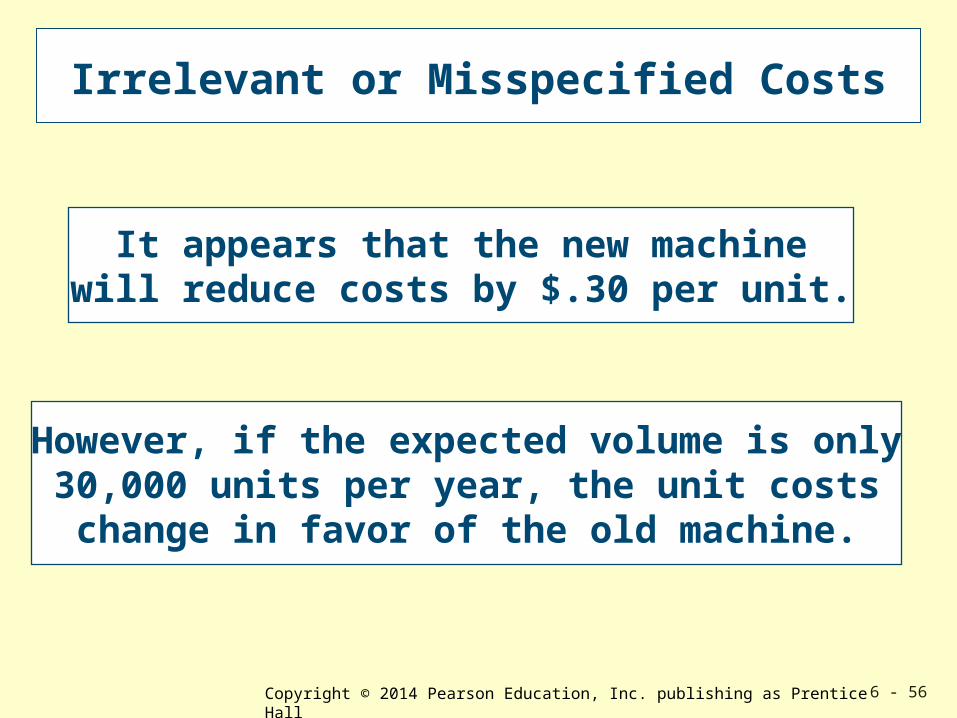
Irrelevant or Misspecified Costs
It appears that the new machinewill reduce costs by $.30 per unit.
However, if the expected volume is only30,000 units per year, the unit costschange in favor of the old machine.
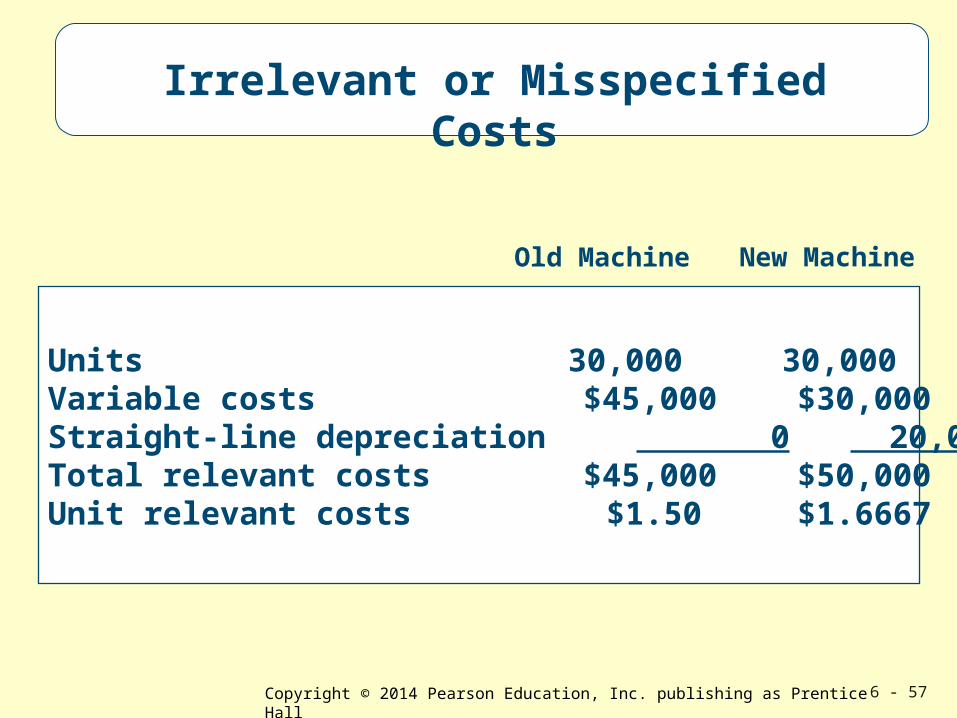
Copyright © 2014 Pearson Education, Inc. publishing as Prentice Hall 6 - 57
Units 30,000 30,000Variable costs $45,000 $30,000 Straight-line depreciation 0 20,000Total relevant costs $45,000 $50,000Unit relevant costs $1.50 $1.6667
Old Machine New Machine
Irrelevant or Misspecified Costs
Copyright © 2014 Pearson Education, Inc. publishing as Prentice Hall 6 - 58
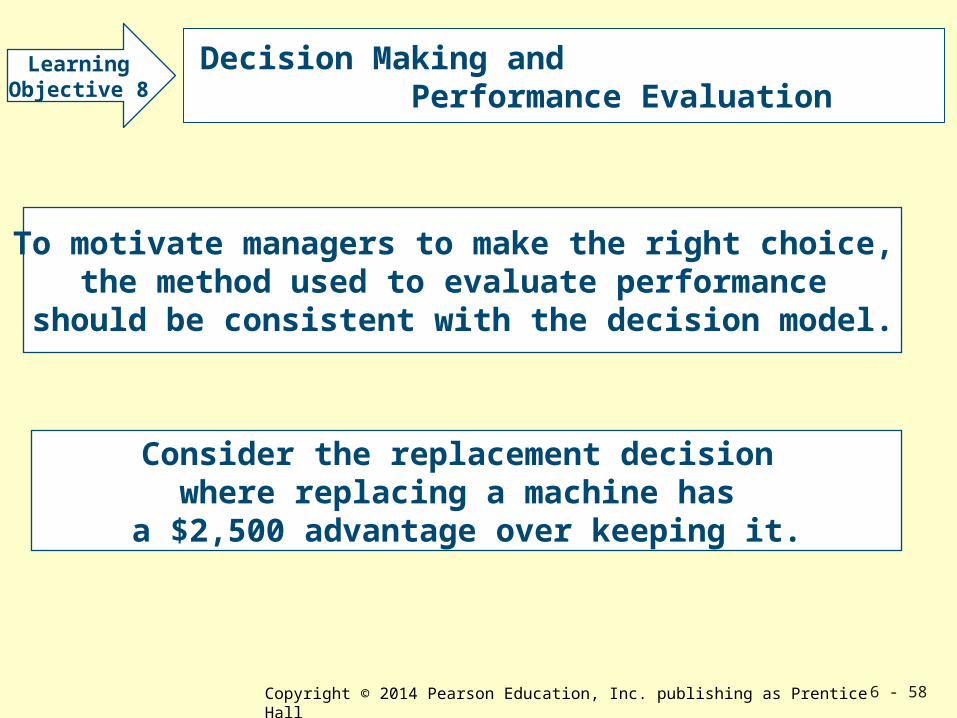
Decision Making and Performance Evaluation
To motivate managers to make the right choice, the method used to evaluate performance
should be consistent with the decision model.
LearningObjective 8
Consider the replacement decision where replacing a machine has
a $2,500 advantage over keeping it.
Copyright © 2014 Pearson Education, Inc. publishing as Prentice Hall 6 - 59
Decision Making and Performance Evaluation
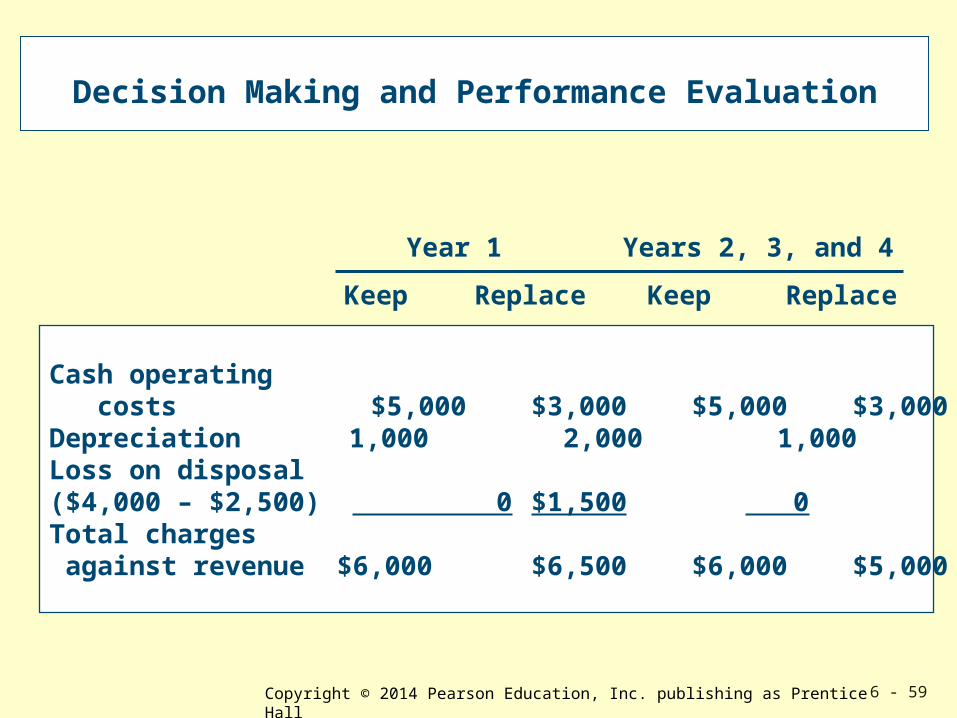
Cash operating costs $5,000 $3,000 $5,000 $3,000Depreciation 1,000 2,000 1,000 2,000Loss on disposal($4,000 – $2,500) 0 $1,500 0 0 Total charges against revenue $6,000 $6,500 $6,000 $5,000
Keep Replace Keep Replace
Year 1 Years 2, 3, and 4
Copyright © 2014 Pearson Education, Inc. publishing as Prentice Hall 6 - 60
Decision Making and Performance Evaluation
If the machine is kept rather than replaced, first-year costs will be
$500 lower ($6,500 – $6,000), and first-year income will be $500 higher.
Performance is often measured by accounting income, consider the
accounting income in the first year after replacement compared with
that in years 2, 3, and 4.
Copyright © 2014 Pearson Education, Inc. publishing as Prentice Hall 6 - 61
All rights reserved. No part of this publication may be reproduced, stored in a retrieval system, or transmitted, in any form or by any means, electronic, mechanical, photocopying, recording, or otherwise, without the prior written permission of the publisher. Printed in the United States of America.