Embed Size (px)
Citation preview

Copyright © 2015, Oracle and/or its affiliates. All rights reserved

Annual Stockholder Meeting
Jeff Henley Oracle Vice Chairman November 18, 2015
Copyright © 2015, Oracle and/or its affiliates. All rights reserved

Safe Harbor Statement Statements in this presentation relating to Oracle’s future plans, expectations, beliefs,
intentions and prospects, are “forward-looking statements” and are subject to material risks
and uncertainties. Many factors could affect our current expectations and our actual results,
and could cause actual results to differ materially. A detailed discussion of these factors and
other risks that affect our business is contained in our U.S. Securities and Exchange Commission
(SEC) filings, including our most recent reports on Form 10-K and Form 10-Q, particularly under
the heading “Risk Factors.” Copies of these filings are available online from the SEC or by
contacting Oracle’s Investor Relations Department at (650) 506-4073 or by clicking on SEC
Filings on Oracle’s Investor Relations website at http://www.oracle.com/investor. All
information set forth in this presentation is current as of November 18, 2015. Oracle undertakes
no duty to update any statement in light of new information or future events.
3 Copyright © 2015, Oracle and/or its affiliates. All rights reserved
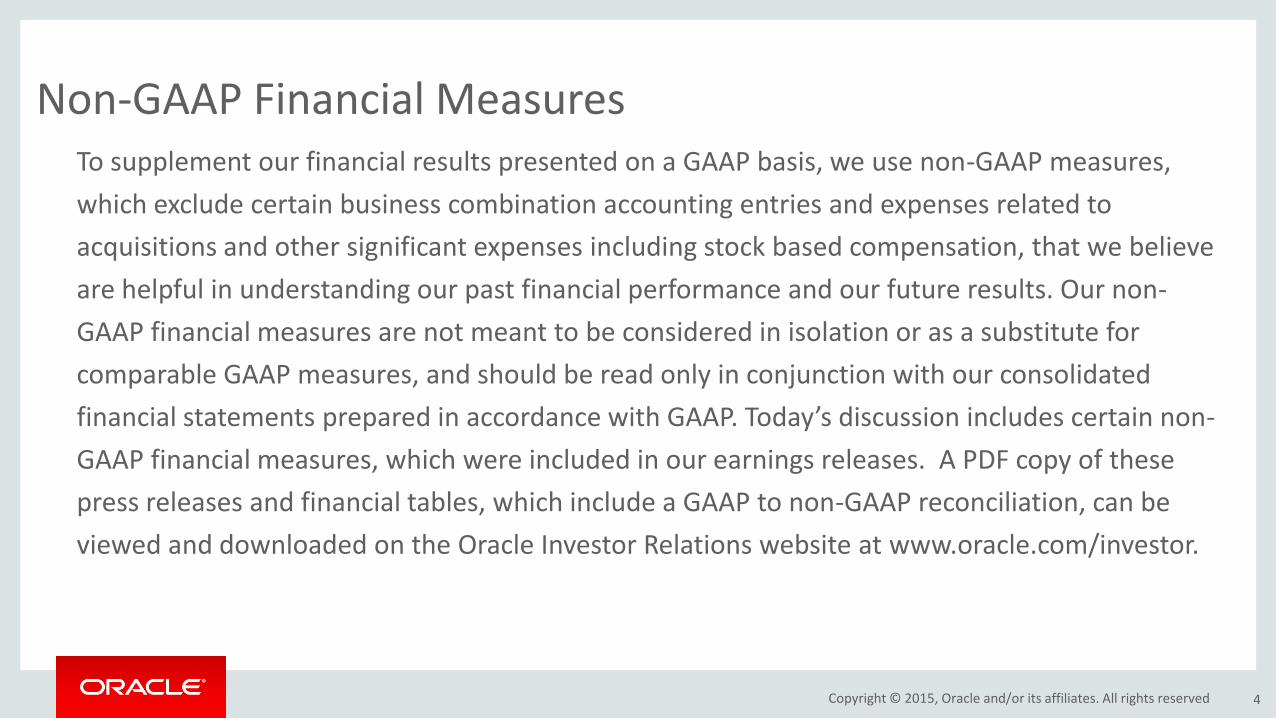
To supplement our financial results presented on a GAAP basis, we use non-GAAP measures,
which exclude certain business combination accounting entries and expenses related to
acquisitions and other significant expenses including stock based compensation, that we believe
are helpful in understanding our past financial performance and our future results. Our non-
GAAP financial measures are not meant to be considered in isolation or as a substitute for
comparable GAAP measures, and should be read only in conjunction with our consolidated
financial statements prepared in accordance with GAAP. Today’s discussion includes certain non-
GAAP financial measures, which were included in our earnings releases. A PDF copy of these
press releases and financial tables, which include a GAAP to non-GAAP reconciliation, can be
viewed and downloaded on the Oracle Investor Relations website at www.oracle.com/investor.
Non-GAAP Financial Measures
4 Copyright © 2015, Oracle and/or its affiliates. All rights reserved

5
Company Profile
• $38.2B in revenue in FY15
• 420,000 customers in 145 countries, including 100 of the Fortune 100
• $39B in R&D since 2004
• $60B on more than 100 acquisitions
• More than 25,000 partners
• More than 130,000 employees
• 18,000 customer support specialists, speaking 29 languages
• 17,000 implementation consultants
• 2.6 million students supported annually
• #1 in 50 product/industry categories
• #2 software company in the world
• #2 cloud company in the world
• #16 of 100 Top Global Brands, Interbrand 2015
• More than 17,000 patents worldwide
• 37,000 developers and engineers
• 2.5 million registered members of the Oracle Technology Network Community
• 900 independent Oracle user groups with 500,000 members
Scale Innovation
Copyright © 2015, Oracle and/or its affiliates. All rights reserved

Horizontal & Industry Applications
Cloud . . . Applications, Platform, Infrastructure
Vertical Integration of the Stack
Best of Breed Products & Cloud Services
6
Oracle Strategy
Copyright © 2015, Oracle and/or its affiliates. All rights reserved

7
Leader in Key Segments
Technology
• Application Server
• Database
• Database on Linux
• Database on Unix
• Data Warehouse
• Embedded Database
• Engineered Systems
• Middleware
Applications
• Business Analytics
• Enterprise Performance Management
• Lead Management
• Marketing Automation
• Supply Chain Execution
• Talent Management
• Talent Recruiting
Industries
• Banking
• Communications
• Financial Services
• Healthcare
• Public Sector
• Retail
Copyright © 2015, Oracle and/or its affiliates. All rights reserved

• Lower cost
• Less complexity
• More reliability
• Better security
• Rapid innovation
• Simple
Public Cloud
8
A Better Way: Cloud Computing
Copyright © 2015, Oracle and/or its affiliates. All rights reserved

On-Premise or Private Cloud
Cloud
Deploy Anywhere
Manage
Secure
Optimize Performance
Lower TCO
Move workloads between on-premises and public cloud
9
Cloud – Simple, Economical, Continuous Innovation
Copyright © 2015, Oracle and/or its affiliates. All rights reserved

Software-as-a-Service
Platform-as-a-Service
Infrastructure-as-a-Service
Data-as-a-Service
10
Oracle Cloud
Copyright © 2015, Oracle and/or its affiliates. All rights reserved
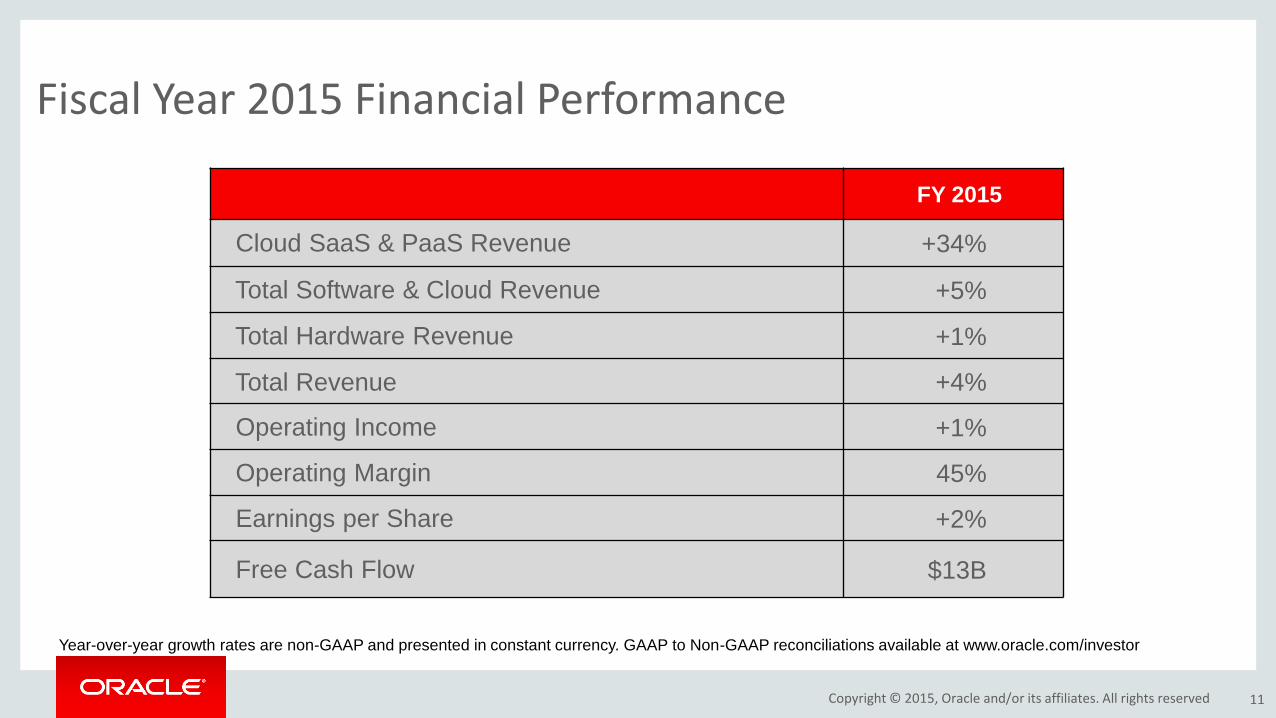
FY 2015
Cloud SaaS & PaaS Revenue +34%
Total Software & Cloud Revenue +5%
Total Hardware Revenue +1%
Total Revenue +4%
Operating Income +1%
Operating Margin 45%
Earnings per Share +2%
Free Cash Flow $13B
Year-over-year growth rates are non-GAAP and presented in constant currency. GAAP to Non-GAAP reconciliations available at www.oracle.com/investor
11
Fiscal Year 2015 Financial Performance
Copyright © 2015, Oracle and/or its affiliates. All rights reserved

Asia Pacific 15% of Revenue
EMEA 30% of Revenue
Americas 55% of Revenue
12
Revenue – FY15 Geographic Distribution
Copyright © 2015, Oracle and/or its affiliates. All rights reserved

Services 9% of Revenue
Software 77% of Revenue
Hardware 14% of Revenue
13
Revenue – FY15 Line of Business Distribution
Copyright © 2015, Oracle and/or its affiliates. All rights reserved

Services 9% of Revenue
On-Premise Software 72% of Revenue
Cloud 5% of Revenue
Hardware 14% of Revenue
14
Revenue – FY15 Line of Business Distribution
Copyright © 2015, Oracle and/or its affiliates. All rights reserved

0
10
20
30
FY10 FY11 FY12 FY13 FY14 FY15
On-Premise Software Cloud
5 Year CAGR
+ 6%
$ B
illio
n
+ 41%
15
Software Revenue is Growing 7% Five-Year Compounded Growth
Compounded annual growth rates are non-GAAP, constant currency. GAAP to Non-GAAP reconciliations available at www.oracle.com/investor
Copyright © 2015, Oracle and/or its affiliates. All rights reserved

0.0
0.5
1.0
1.5
2.0
2.5
FY10 FY11 FY12 FY13 FY14 FY15
IaaS SaaS/PaaS
+75%
+16%
16
Cloud Revenue is Growing Rapidly 41% Five-Year Compounded Growth
$ B
illio
n
Copyright © 2015, Oracle and/or its affiliates. All rights reserved
Compounded annual growth rates are non-GAAP, constant currency. GAAP to Non-GAAP reconciliations available at www.oracle.com/investor
5 Year CAGR

FY10 FY11 FY12 FY13 FY14 FY15
New Software License First Year Support Continuing Support Cloud
Source: Non-GAAP results. GAAP to Non-GAAP reconciliations are available at www.oracle.com/investor. “First Year Support” is an internal estimate and assumes 100%
software support attach, 22% pricing and all sales at the end of the quarter. “Continuing Support” is non-GAAP software support, as reported, less “First Year Support”
$28.0B $26.6B
$24.5B
$21.0B
71%
65%
$29.2B
17
$29.5B
Our Business Model Drives Recurring Revenue
Copyright © 2015, Oracle and/or its affiliates. All rights reserved

0
5,000
10,000
15,000
20,000
25,000
30,000
35,000
40,000
FY10-FY12 FY13-FY15
Dividends Buybacks
$ B
illio
n
18
Capital Allocation FY13-FY15 Buybacks & Dividends 3X of FY10-FY12
Source: Internal Analysis
Copyright © 2015, Oracle and/or its affiliates. All rights reserved

• Return on Equity (TTM) 20%
• Return on Assets (TTM) 9%
• Cash & Investment (MRQ) $56B
• Debt to Equity (MRQ) 1.31x
• Net Cash (MRQ) $14B
Above figures are based on GAAP results for the four most recent quarters including Q1 FY2016. TTM – Trailing Twelve Months; MRQ – Q1 FY2016
19
A Very Healthy Balance Sheet
Copyright © 2015, Oracle and/or its affiliates. All rights reserved

Copyright © 2015, Oracle and/or its affiliates. All rights reserved