Embed Size (px)
Citation preview

Available online at http://scik.org
Commun. Math. Biol. Neurosci. 2020, 2020:13
https://doi.org/10.28919/cmbn/4319
ISSN: 2052-2541
SMOKING HABIT: A BIO MATHEMATICAL STUDY
AMAR NATH CHATTERJEE1,∗, PRITI KUMAR ROY2
1Department of Mathematics, K.L.S. College, Nawada, Bihar, India
2Department of Mathematics, Jadavpur University, Kolkata, India
Copyright © 2020 the author(s). This is an open access article distributed under the Creative Commons Attribution License, which permits
unrestricted use, distribution, and reproduction in any medium, provided the original work is properly cited.
Abstract. Smoking habit is an addiction to both physical and psychological. Nicotine from cigarettes temporarily
experiences physical withdrawal symptoms and cravings. Because of nicotine effects on the brain, as a quick and
reliable way to boost our outlook, relieve stress, and unwind. To stop the smoking habit, you’ll need to address
both the addiction and habits. With the proper support and right planning, any smoker can kick the addiction. In
this research work, we formulate a mathematical model which analyse the smoking habit in the human population.
Here we divide the total population into three classes: potential smokers, smokers and media aware population.
We discuss the dynamical behaviour of the model. Finally, we justify our finding through numerical simulation.
Our mathematical study reflects that anti smoking campaign plays a pivotal role for reducing number of smoker as
well as smoking habit.
Keywords: potential smokers; smoking habit; stability analysis; smoking reproduction ratio.
2010 AMS Subject Classification: 93A30.
1. INTRODUCTION
Tobacco epidemic is one of the biggest health threats in the world. Worldwide around 8 million
people die due to tobacco epidemic, among which approx. 7 millions of this death are the result
∗Corresponding author
E-mail address: [email protected]
Received September 27, 20191

2 AMAR NATH CHATTERJEE, PRITI KUMAR ROY
of the direct habit of tobacco use whereas approx. 1.2 million people are the result of passive
smoking. There are more than 7000 chemicals in tobacco smoke of which 250 chemicals are
known as harmful and at least 69 chemicals are the major causes of cancer. Thus the second
hand or nonsmokers are affected by these harmful chemicals in enclosed spaces like restaurants,
offices. Approx. 65000 childrens die each year from illness attributes to second-hand smoking.
In adults, second-hand smoke causes serious cardiovascular respiratory disease, including heart
disease, lung disease. It causes pregnancy complications for pregnant women.
Good monitoring tracks the extent and character of the tobacco epidemic. Only 38% countries
of the world population monitors tobacco use. In 2015 Global Adult Tobacco Survey (GATS)
in China revealed that 26.6% of the Chinese people believes smoking causes lung cancer, heart
disease. This change has been occurred due to awareness programme by which few people un-
derstand the specific health risk of tobacco use. Anti-tobacco media campaigns protect children
and other potential smoker groups and reduces in the population of new tobacco users.
Anti Tobacco campaigning carried out in Brazil, Canada, Singapore and Thailand. Which con-
sistently gives a significant results to control the smoking habit. Mass media campaigns can
also play a pivotal role in smokers by convincing people to stop using tobacco. Within the last
2 years, around 1.7 billion people in the 39 countries are covered under the anti-tobacco mass
media campaign. Medical doctors, scientists, social workers are trying to reduce the ratio of
smokers in the total population.
Mathematicians are also working to formulate the mathematical models to find out how to
control of smoking habit. For this purpose, the first smoking model was presented by Castello et
al. [1] in which he proposed three compartments like potential smokers, chain smokers and quit
smokers. Then Sharomi and Gumel [2] improved the model by using the chain smoker class.
Zaman [3] presented the optimal campaigns in the smoking dynamics. Adhana and Mekonnen
[4] studied by adding smoking cause death rate and one more compartments exposed class in
the model proposed by Sharomi and Gumel [2]. Huo and Zhu [5] analysed a model taking into
account light smokers compartment, recovery compartment, and two relapses in the giving up
smoking model. Zeb et. al. [6] considered a delayed smoking model in which the potential
smokers are assumed to satisfy the logistic equation. Alkhudhari et al. [7] studied the effect of

SMOKING HABIT: A BIO MATHEMATICAL STUDY 3
FIGURE 1. Schematic explanation of the model (1).
smokers on temporary quitters. Verma and Bhadaurian [8] studied the dynamics of progression
of potential smoker class to the class of smokers followed by the movement of smokers to the
state in which they permanently quit smoking due to anti-smoking campaigns. Sikander et
al. [9] used Variation of Parameter Method (VPM) with an auxiliary parameter to obtain the
approximate solutions for the epidemic model for the evolution of smoking habit in a constant
population. It has been observed that media awareness model plays an important role to control
infection [10],[11],[12],[13]. Yadav et al. [14] studied the dynamics of smoking behavior under
the influence of educational programs and also the individual’s determination to quit smoking.
Veeresha et al.[15] studied fractional smoking epidemic model with the aid of a novel technique
called q-homotopy analysis transform method (q-HATM).
This article has been arranged in the following manner. Firstly we have formulated the basic
mathematical model on the basis of Smoking infection in presence of media awareness (Section
2). In Section 3, we have studied the model analytically. In section 4, we have numerically
studied the model. In the last section (Section 5) we have discussed about implication of the
results which we have found out in different sections.

4 AMAR NATH CHATTERJEE, PRITI KUMAR ROY
2. THE MODEL FORMULATION
In this article, we establish the smoking model in presence of awareness as in Figure 1. From the
schematic figure, the total human population N(t) is divided into three components, namely the
potential smokers compartment (P(t)), persistent smokers (S(t)), and the aware population is
denoted as Pm(t). Also M(t) denotes the commutative density of awareness programme driven
by the media in the region at time t. It is assumed that the habit or infection spread through
direct contact between persistent smokers and potential smokers at a rate of β .
We also assume that infection is removed at a rate of γ . After recovery, a fraction p of persistent
people will become aware and join the potential smoker class, whereas the remaining fraction
(1− p) will become persistent smoker. We also assume that the potential smokers move to aware
class at a rate of ηPM due to media campaigns. It is also assumed that some media campaign
fade or less their impact on people. We assume k′ = kµ denotes the rate of implementation of a
media campaign which is proportional to the death rate of smokers and the δ denotes the fading
rate of media campaigns are maintained at a level M0 which should be maintained in the system.
dPdt
= Λ−βPS−µP+(1− p)νS−ηPM,
dSdt
= βPS−µS−νS,
dPm
dt= ηPM−µPm + pνS,
dMdt
= k′S−δ (M−M0).(1)
Here we assume that P(0)≥ 0, S(0)≥ 0, Pm(0)≥ 0 and M(0)≥ 0. We also note that
N(t) = P(t)+S(t)+Pm(t).(2)
By combining
dNdt
=dPdt
+dSdt
+dPm
dt,
≤ Λ−µN,(3)
which implies that limt→∞ supN(t)≤ Λ
µ.
SMOKING HABIT: A BIO MATHEMATICAL STUDY 5
Here we assume that all variables and parameters to be non negative for all t ≥ 0. We study the
above model in the positive invariant set Ω defined as
Ω = (P,S,Pm,M)εR4+;0≤ P,S,Pm ≤
Λ
µ,0≤M ≤ k′
δ,(4)
the region of attraction of the model. Setting the right hand side of the equation to zero, we find
two equilibrium of the model :
• (i) Smoking Free Equilibrium E = (P,0, Pm,M),
• (ii) Smoking Present Equilibrium E∗ = (P∗,S∗,P∗m,M∗).
(A) For the Smoking free equilibrium (SFE), P = Λ
µ+ηM0, S = 0, Pm = ηM0P
µand M = M0.
(B) The Smoking Present Equilibrium (SPE),
P∗= µ+ν
β, P∗m = 1
µ[η(µ+ν
β)(M0+
k′S∗δ)+ pνS∗], M∗=M0+
k′S∗δ
, and S∗= δ [Λβ−(µ+ν)(µ+ηM0)]βδ (µ+pδ )+ηk′(µ+δ ) .
If Λβ − (µ +ν)(µ +ηM0)> 0, then S∗ > 0.
Here the smoker generation number is defined as S0 =Λβ
(µ+ν)(µ+ηM0).
The Smoking free equilibrium of the system is obtained by setting all the smokers class and
recovered classes equal to zero.
The system become smoking free, when M = M0, which means 100% programme execution in
the ideal situation.
The model exhibits SPE, E∗(P∗,S∗,P∗m,M∗).
By setting dPdt = dS
dt =dPmdt = dM
dt = 0,
we get P∗,S∗,P∗m,M∗, which is mentioned in (B). By analysing the existence of SPE, we have
following cases
Case 1: If S0 > 1, then S∗ and thus M∗ > 0, P∗m > 0. Which shows that for S0 > 0, there exist
unique positive equilibrium exist.
Case 2: If S0 = 1 then S∗ = 0,M∗ = M0 and E∗ does not exist.
Case 3: If S0 < 1 then S∗ < 0, there exist a transcritical bifurcation at S0 = 1.
3. ANALYSIS OF THE MODEL
In this section we study the stability analysis of the system at E and E∗.

6 AMAR NATH CHATTERJEE, PRITI KUMAR ROY
The Jacobian Matrix of the system is given by
J =
−(βS+µ +ηM) −βP+(1− p)ν 0 −ηP
βS βP−µ−ν 0 0
ηM pν −µ ηP
0 k′ 0 −δ
.
The Jacobian matrix for Smoking free equilibrium (E) is given by
J =
−(µ +ηM0) −β P+(1− p)ν 0 −ηP
0 β P−µ−ν 0 0
ηM0 pν −µ ηP
0 k′ 0 −δ
.
It appears that all eigen values of J are −δ , µ, −(µ +ηM0) and β P− (µ +ν).
If β P− (µ +ν)< 0, then we can easily say that all eigen values are negative.
Now,
β P− (µ +ν) < 0
⇒ Λβ
(µ +ν)(µ +ηM0)< 1
⇒ S0 < 1(5)
If S0 < 1, then all eigen values of J are negative. Hence we can conclude that SFE is asymptot-
ically stable if S0 < 1. If S0 > 1, then only one eigenvalue is positive. Hence the system at E
becomes unstable. Therefore the SFE attains a transcritical bifurcation at S0 = 1.
Remark: The smoker generation number S0 plays a pivotal role as like basic reproduction
number plays in epidemic model. This basic reproduction number represents the expected
number of secondary infection arisen from a single individual during the entire infection period
[16]. Here we rename as smoker generation number and denoted it as S0 determined by
S0 =Λβ
(µ +ν)(µ +ηM0),(6)
which represents that one smoker creates Λβ smokers in its whole life if 1(µ+ν)(µ+ηM0)
spent
in smoking class. From this it is clearly observed that as media awareness ηM0 increases, S0
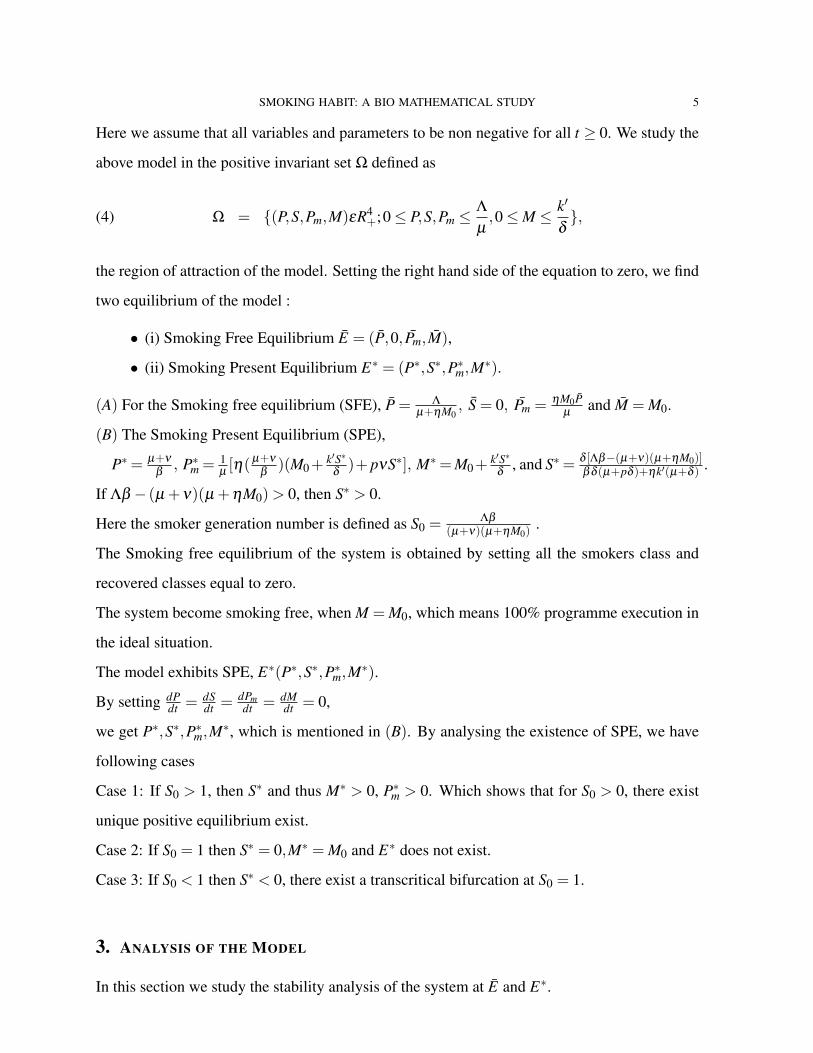
SMOKING HABIT: A BIO MATHEMATICAL STUDY 7
reduces. If the media campaigning reduces S0 increases which causes the life risk. Thus anti
smoking campaign plays a pivotal role for reducing number of smoker as well as smoking habit.
Now for the endemic equilibrium E∗, the Jacobian Matrix J∗ is given by
J∗ =
−(βS∗+µ +ηM∗) −βP∗+(1− p)ν 0 −ηP∗
βS∗ βP∗−µ−ν 0 0
ηM∗ pν −µ ηP∗
0 k 0 −δ
.
Hence the Characteristic equation is
(ξ +µ)
∣∣∣∣∣∣∣∣∣ξ +βS∗+µ +ηM∗ βP∗− (1− p)ν ηP∗
−βS∗ ξ −βP∗+µ +ν 0
0 k′ ξ +δ
∣∣∣∣∣∣∣∣∣= 0.(7)
Clearly one eigen value −µ < 0.
Other three eigen values are found by solving the characteristic polynomials for J∗ which is
given by
ξ3 +a1ξ
2 +a2ξ +a3 = 0,(8)
a1 = (µ +βS∗+ηM∗)+(µ +νδ −βP∗)+δ ,
a2 = (µ +βS∗+ηM∗)(µ +νδ −βP∗)+β2S∗2((1− p)ν ,
+ηk′P∗−βP∗)+(µ +βS∗+ηM∗+µ +νδ −βP∗)δ ,
a3 = δ (µ +βS∗+ηM∗)(µ +νδ −βP∗)
−βS∗((1− p)ν +ηk′P∗−βP∗).(9)
Here,
a1a2−a3 = (µ +βS∗+ηM∗)(µ +δν−βP∗)(1−δ )
+δP∗S∗[(1− p)ν +P∗(ηk′−β )]> 0.(10)
By using Routh-Hurwitz Criterion [17], we can say the smoking present equilibrium E∗ is
locally asymptotically stable if ai > 0, i = 1,2,3 and a1a2−a3 > 0 are satisfied.

8 AMAR NATH CHATTERJEE, PRITI KUMAR ROY
0 200 400 600 800 10000
10
20
30
40
Time (days)
P(t
)
0 200 400 600 800 10000
2
4
6
8
10
12
Time (days)
S(t
)0 200 400 600 800 1000
5
10
15
20
25
Time (days)
Pm
(t)
0 200 400 600 800 10000
5
10
15
20
25
Time (days)
M(t
)
FIGURE 2. Trajectories showing the time dependent changes in population of
the model variables when S0 < 1.
0 200 400 600 800 10000
10
20
30
40
Time (days)
P(t
)
0 200 400 600 800 10000
5
10
15
20
Time (days)
S(t
)
0 200 400 600 800 10008
10
12
14
16
18
20
Time (days)
Pm
(t)
0 200 400 600 800 10000
10
20
30
40
50
Time (days)
M (
t)
FIGURE 3. Trajectories showing the time dependent changes in population of
the model variables when S0 > 1.
Theorem 1: (i) If S0 < 1, then SFE (E∗)is locally asymptotically stable. (ii) If S0 > 1, then SFE
is unstable and the endemic equilibrium E∗ exist which is asymptotically stable if ai > 0, i =
1,2,3 and a1a2−a3 > 0.

SMOKING HABIT: A BIO MATHEMATICAL STUDY 9
0 100 200 300 4000
5
10
15
20
Time
P(t
)
0 100 200 300 4000
5
10
15
20
25
Time
S(t
)0 100 200 300 400
0
5
10
15
20
Time
Pm
(t)
0 100 200 300 4000
50
100
150
200
250
Time
M(t
)
β=0.038β=0.3
FIGURE 4. Trajectories of populations and awareness program changes for dif-
ferent values of β .
0 100 200 300 4000
2
4
6
8
Time
P(t
)
0 100 200 300 4000
5
10
15
20
25
Time
S(t
)
0 100 200 300 4000
5
10
15
Time
Pm
(t)
0 100 200 300 4000
50
100
150
200
250
Time
M(t
)
M=3M=25
FIGURE 5. Trajectories of populations and awareness program changes for dif-
ferent values of M.
4. GLOBAL STABILITY
To study the global stability of the system we consider the Lyapunov’s function as

10 AMAR NATH CHATTERJEE, PRITI KUMAR ROY
L =12(P−P∗)2 +
ω1
2(S−S∗)2 +
ω2
2(Pm−P∗m)
2 +ω3
2(M−M∗)2.(11)
Here ω1, ω2,ω3 are some positive constants to be chosen.
On differentiating L with respect to t along the solutions of given model we get
dLdt
= (P−P∗)dPdt
+ω1(S−S∗)dSdt
+ω2(Pm−P∗m)dPm
dt+ω3(M−M∗)
dMdt
= −m11(P−P∗)2−m22(S−S∗)2−m33(Pm−P∗m)2−m44(M−M∗)2 +m12(S−S∗)(P−P∗)
+m13(P−P∗)(Pm−P∗m)+m14(P−P∗)(M−M∗)+m23(S−S∗)(Pm−P∗m)
+m24(S−S∗)(M−M∗)+m34(Pm−P∗m)(M−M∗)
= −m11
2(P−P∗)2 +m12(S−S∗)(P−P∗)− m22
4(S−S∗)2
−m11
2(P−P∗)2 +m13(P−P∗)(Pm−P∗m)−
m33
3(Pm−P∗m)
2
−m11
2(P−P∗)2 +m14(P−P∗)(M−M∗)− m44
3(M−M∗)2
−m22
4(S−S∗)2 +m23(S−S∗)(Pm−P∗m)−
m33
3(Pm−P∗m)
2
−m22
4(S−S∗)2 +m24(S−S∗)(M−M∗)− m44
3(M−M∗)2
−m33
3(Pm−P∗m)
2 +m34(Pm−P∗m)(M−M∗)− m44
3(M−M∗)2(12)
Where m11 = βS∗+ µ +ηM∗, m22 = ω1µ −ω2P∗+ω1ν , m33 = ω2µ, m44 = ω3δ , m12 =
βP∗+(1− p)ν +ω1β , m13 = ω2M∗, m23 = ω2 pν , m24 = ω3k′, m34 = ω2 p∗.
Now if, m212 <
12m11m22, m2
13 <23m11m33, m2
14 <13m11m44, m2
23 <13m22m33, m2
24 <13m22m44,
m234 <
49m33m44 then dL
dt < 1, which shows the condition of negative definite.
For this condition we can say that the model in Smoking present equilibrium, E∗ is globally
asymptotically stable. On the basis of above study we have found out the condition of global
stability stated below
• (i) −βP∗+(1− p)ν +ω1β2 < 12βS∗+µ +ηM∗ω1(µ +ν)−ω2P∗.
• (ii) (ω2M∗)2 < 23βM∗+µ +ηM∗ω2µ .
• (iii) (ηP∗)2 < 13ω1(µ +ν)−ω2P∗ω2δ .

SMOKING HABIT: A BIO MATHEMATICAL STUDY 11
• (iv)(ω2 pν)2 < 13ω1(µ +ν)−ω2P∗ω2µ .
• (v) (ω3k′)2 < 13ω1(µ +ν)−ω2P∗ω3δ .
• (vi) (ω2P∗)2 < 49ω1(µ +ν)−ω2P∗ω3δ .
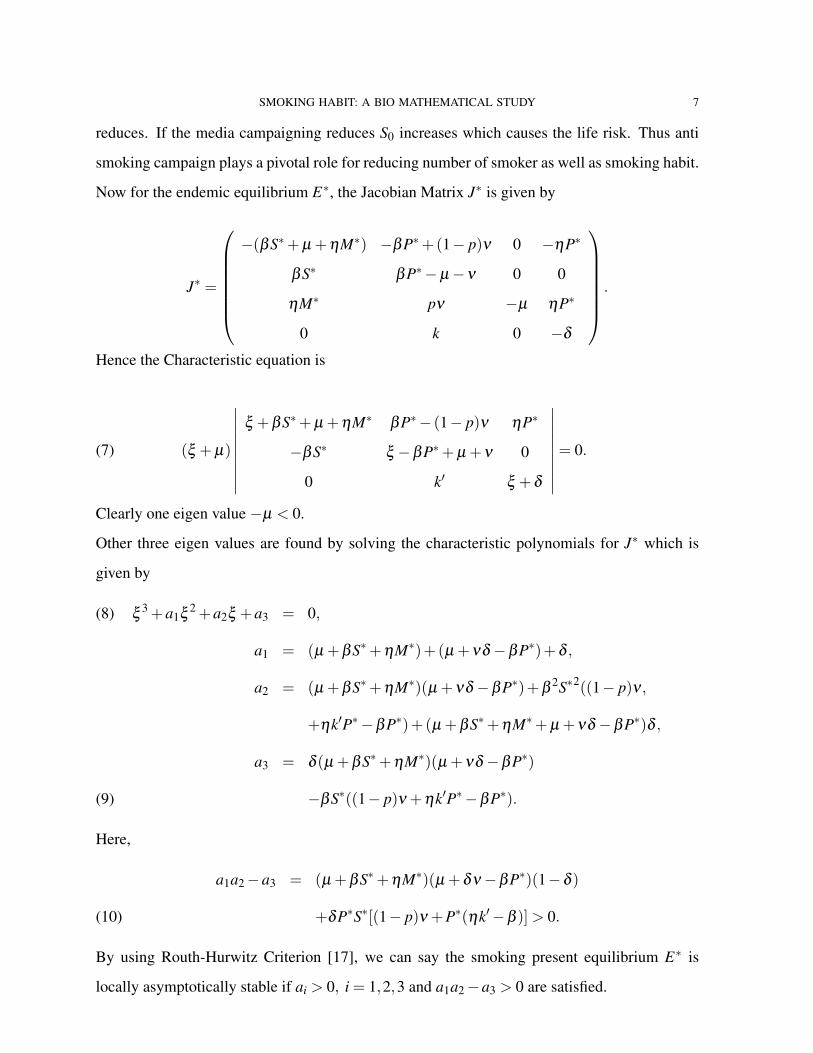
5. SENSITIVITY ANALYSIS OF S0
Using the approach in Chitnis et al. [18], we calculate the normalized forward sensitivity indices
of S0 =Λβ
(µ+ν)(µ+ηM0).
Let ϒS0p = ∂S0
∂ p ×p
S0.
Where ϒS0p denotes the sensitivity index of S0 with respect to the parameters p.
Here we get
∂S0
∂Λ=
β
(µ +ν)(µ +ηM0),
∂S0
∂β=
Λ
(µ +ν)(µ +ηM0),
∂S0
∂ µ= − βΛ
(µ +ν)2(µ +ηM0)2 × [2µ +(ν +ηM0)],
∂S0
∂ν= − βΛ
(µ +ν)2(µ +ηM0),
∂S0
∂η= − βΛM0
(µ +ν)(µ +ηM0)2 .(13)
Hence,
ϒS0β
= ϒS0Λ= 1,
ϒS0µ = − µ[2µ +ν +ηM0]
(µ +ν)(µ +ηM0),
ϒS0ν = − ν
(µ +ν),
ϒS0η = − ηM0
µ +ηM0.(14)
Since ϒS0β= ϒ
S0Λ= 1, the largest sensitivity indexes. If β or Λ reduces 1% then S0 reduces by
1%. If µ,ν or η increases then S0 reduces. Hence media coverage has the negative effect on
the S0.

12 AMAR NATH CHATTERJEE, PRITI KUMAR ROY
0.5
1
1.5
2
2.5
β
Λ
0.005 0.01 0.015 0.02 0.025 0.031
1.5
2
2.5
3
3.5
4
4.5
5
0.10.2
0.30.4
0.5
24
68
100
10
20
30
40
50
βΛ
R0
FIGURE 6. Left Panel: Contour Plot of S0 as a function of β and Λ. Right Panel:
Mesh diagram of S0 as a function of β and Λ.
0.5
1
1.5
22.5 33.5
M
η
4 6 8 10 12 14
0.02
0.04
0.06
0.08
0.1
0.12
0.14
0.16
0.18
0.2
0.10.2
0.30.4
0.5
02
46
8100
5
10
15
ηM
R0
FIGURE 7. Left Panel: Contour Plot of S0 as a function of M and η . Right
Panel: Mesh diagram of S0 as a function of M and η .
6. NUMERICAL SIMULATION
In this section, we illustrate some numerical solutions of the model 1 for different values of the
parameters as in Table 1.
For S0 < 1, Figure 2 shows that for β = 0.038 the Smoking reproduction number S0 < 1 and thus
the solution trajectories tend to the equilibrium E0. Hence the model 1 is locally asymptotically
stable. In figure 2, we use the same parameters and the initial values as previously with β =
0.03. Figure 3 shows that the number of potential smoker population decreases and approaches
at P∗. This figure also shows that the number of smokers increases initially and then it decreases
and approaches to S∗. Hence for S0 > 1 the system trajectories approaches to the smoking
present equilibrium E∗. Hence the model is locally asymptotically stable about E∗ for the
above parameter set.
Figure 4 shows the model trajectories for β = 0.038 and for 0.3. We note from the figure
that as β increases the potential smokers and aware population decreases with time and moves
to its equilibrium point. Whereas the smoker population increases with increasing value of

SMOKING HABIT: A BIO MATHEMATICAL STUDY 13
TABLE 1. List of parameters for system.
Parameters Explanation Default Units Reference
Values
Λ Recruitment rate of 0.02 day−1 [6]
potential smoker.
µ Naturally death rate. 0.02 day−1 [8]
β transmission rate 0.0038 day−1 [8]
ν Recovery rate of smoker. 0.2 day−1 [8]
η Dissemination rate by 0.02 day−1 [8]
awareness programs
k′ Implementation rate 0.002 day−1 [8]
of awareness programs
δ Depletion rate of 0.05 day−1 [8]
awareness program
β . Figure 5 shows the trajectories when β = 0.3 and M0 = 3 and 25. From this figure, it
is clearly observed that if we increase the awareness maintenance level from 3 to 25, then the
aware smoke population increases and the smoker population decreases with respect to time and
attain its equilibrium stage. Figure 6 shows the graph of S0 as a function of the rate of contact
β and recruitment rate Λ. From this figure, it clearly observed that S0 can be less than one if β
and Λ are small. As β and Λ are both large, S0 can blow up. Figure 7 shows the graph of S0 as a
function of the rate of contact M and the recruitment rate η . From this figure, it clearly observed
that S0 can be less than one if β and Λ are large. Whereas β and Λ are both attain low value,
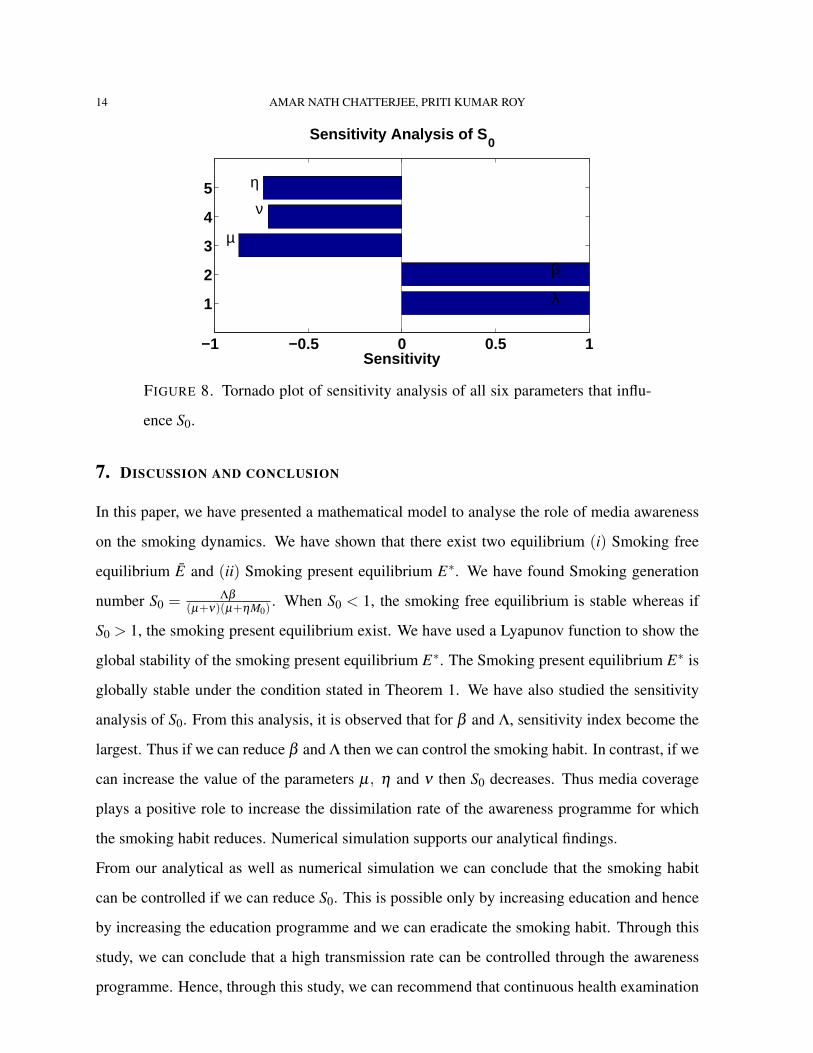
S0 can blow up. Figure 8 shows the partial rank correlation coefficient sensitivity analysis. All
relevant parameters are varied against S0 throughout the range given in Table 1. Parameters with
PRCCs > 0 will increase S0 when they are increased, while the parameters with PRCCs < 0 will
decrease S0 when the corresponding parameters increases. From this figure, it shows that β , Λ
and µ plays the most significant role to control over the epidemic. The variables β and Λ are
the parameters that have the largest impact on the outcome.
14 AMAR NATH CHATTERJEE, PRITI KUMAR ROY
−1 −0.5 0 0.5 1
1
2
3
4
5
λ
β
µ
ν
η
Sensitivity
Sensitivity Analysis of S0
FIGURE 8. Tornado plot of sensitivity analysis of all six parameters that influ-
ence S0.
7. DISCUSSION AND CONCLUSION
In this paper, we have presented a mathematical model to analyse the role of media awareness
on the smoking dynamics. We have shown that there exist two equilibrium (i) Smoking free
equilibrium E and (ii) Smoking present equilibrium E∗. We have found Smoking generation
number S0 = Λβ
(µ+ν)(µ+ηM0). When S0 < 1, the smoking free equilibrium is stable whereas if
S0 > 1, the smoking present equilibrium exist. We have used a Lyapunov function to show the
global stability of the smoking present equilibrium E∗. The Smoking present equilibrium E∗ is
globally stable under the condition stated in Theorem 1. We have also studied the sensitivity
analysis of S0. From this analysis, it is observed that for β and Λ, sensitivity index become the
largest. Thus if we can reduce β and Λ then we can control the smoking habit. In contrast, if we
can increase the value of the parameters µ, η and ν then S0 decreases. Thus media coverage
plays a positive role to increase the dissimilation rate of the awareness programme for which
the smoking habit reduces. Numerical simulation supports our analytical findings.
From our analytical as well as numerical simulation we can conclude that the smoking habit
can be controlled if we can reduce S0. This is possible only by increasing education and hence
by increasing the education programme and we can eradicate the smoking habit. Through this
study, we can conclude that a high transmission rate can be controlled through the awareness
programme. Hence, through this study, we can recommend that continuous health examination

SMOKING HABIT: A BIO MATHEMATICAL STUDY 15
programme should be organised. Anti Tobacco campaign plays an important role to control or
eradicate the smoking habit.
CONFLICT OF INTERESTS
The author(s) declare that there is no conflict of interests.
REFERENCES
[1] C. Castillo-Garsow, G. Jordan-Salivia, A. Rodriguez Herrera, Mathematical models for dynamics of tobacco
use, recovery and relapse, Technical Report Series BU-1505-M, Cornell University, Ithaca, NY, USA, 1997.
[2] O. Sharomi, A. B. Gumel, Curtailing smoking dynamics: A mathematical modeling approach, Appl. Math.
Comput. 195 (2008), 475-499.
[3] G. Zaman, Qualitative behavior of giving up smoking models, Bull. Malays. Sci. Soc. 34 (2011), 403-415.
[4] M. A. Adhana, T. T. Mekonnen, A Mathematical Model Analysis of Smoking Tobacco in the Case of Hare-
maya Town; Ethiopia, Int. J. Res. Stud. Sci. Eng. Technol. 6(2) (2019), 14-24.
[5] H. F. Huo, C-C. Zhu, Influence of Relapse in a Giving Up Smoking Model, Abstr. Appl. Anal. 2013 (2013),
Article ID 525461.
[6] A. Zeb, G. Zaman, S. Momani, Square-Root Dynamics of a Giving Up Smoking Model, Appl. Math. Model.
37 (2013), 5326-5334.
[7] Z. Alkhudhari, S. Al-Sheikh, S. Al-Tuwairqi, Global Dynamics of a Mathematical Model on Smoking, ISRN
Appl. Math. 2014 (2014), Article ID 847075.
[8] V. Verma, A. S. Bhadauria, Global Dynamics of a Mathematical Model on Smoking: Impact of Anti-Smoking
Campaign, J. Math. Model. 7(1) (2019), 49-62.
[9] W. Sikander, U. Khan, N. Ahmed, S. Tauseef Mohyud-Din, Optimal Solutions for a Bio Mathematical Model
for the Evolution of Smoking Habit, Results Phys. 7 (2017), 510-517.
[10] F. A. Basir, A. Banerjee, S. Ray, Role of Farming Awareness in Crop Pest Management - a Mathematical
Model, J. Theor. Biol. 461 (2019), 59-67.
[11] F. A. Basir, S. Ray, E. Venturino, Role of media coverage and delay in controlling infectious diseases: A
mathematical model, Appl. Math. Comput. 337 (2018), 372-385.
[12] F. A. Basir, M. A. Elaiw, S. Ray, Effect of Time Delay in Controlling Crop Pest Using Farming Awareness,
Int. J. Appl. Comput. Math. 5 (2109), 110.
[13] F. A. Basir, K. B. Blyuss, S. Ray, Modelling the Effects of Awareness-Based Interventions to Control the
Mosaic Disease of Jatropha Curcas, Ecol. Complex. 36 (2018), 92-100.
[14] A. Yadav, P. K. Srivastava, A. Kumar, Mathematical Model for Smoking: Effect of Determination and Edu-
cation, Int. J. Biomath. 8(1) (2015), 1550001.

16 AMAR NATH CHATTERJEE, PRITI KUMAR ROY
[15] P. Veeresha, D. G. Prakasha, H. M. Baskonus, Solving Smoking Epidemic Model of Fractional Order Using
a Modified Homotopy Analysis Transform Method, Math. Sci. 13 (2019), 115-128.
[16] O. Diekmann, J.A.P. Heesterbeek and J.A.J. Metz, On the Delnition and the Computation of the Basic Repro-
duction Ratio R0 in Models for Infectious Diseases in Heterogeneous Populations, J. Math. Biol. 28 (1990),
503-522.
[17] M. S. Fadali, A. Visioli, Digital Control Engineering, 2nd Ed. Chapter 4 - Stability of Digital Control Systems,
91-126, Academic Press, 2012.
[18] N. Chitnisa, J. M. Hymanb, J. M. Cushing, Determining Important Parameters in the Spread of Malaria
Through the Sensitivity Analysis of a Mathematical Model, Bull. Math. Biol. 70 (5) (2018), 1272-96.
[19] O. K. Ham, Stages and processes of smoking cessation among adolescents, West. J. Nurs. Res. 29 (2007),
301-315.