Embed Size (px)
Citation preview

Copyright
by
Isaac Sasson
2010
The Thesis Committee for Isaac Sasson Certifies that this is the approved version of the following thesis:
The Effect of Land Degradation on Fertility in West Africa:
Disaggregating the Demographic Response
APPROVED BY
SUPERVISING COMMITTEE:
Alexander A. Weinreb
Kelley A. Crews
Supervisor:
Co-Supervisor:
The Effect of Land Degradation on Fertility in West Africa:
Disaggregating the Demographic Response
by
Isaac Sasson, B.S.
Thesis
Presented to the Faculty of the Graduate School of
The University of Texas at Austin
in Partial Fulfillment
of the Requirements
for the Degree of
Master of Arts
The University of Texas at Austin
December 2010

Dedication
This thesis is dedicated to my parents, for instilling me with curiosity and giving me the
opportunity to pursue it. And to my wife, for willing to move across continents simply
because I asked her to.
v
Acknowledgements
Dr. Alexadner A. Weinreb, my advisor, deserves my deepest gratitude for his
guidance and support during the research for this thesis and throughout my entire
undergraduate and graduate education.
I would also like to thank Dr. Kelley A. Crews for co-supervising this work and
for her insight on topics outside of my primary discipline.
December 2010
vi
Abstract
The Effect of Land Degradation on Fertility in West Africa:
Disaggregating the Demographic Response
Isaac Sasson, M.A.
The University of Texas at Austin, 2010
Supervisors: Alexander A. Weinreb
Kelley A. Crews
Demographic responses to environmental stress have long been hypothesized in
classic population theory, though empirical analyses remain scarce and traditionally focus
on aggregate units of analysis. With the growing concern over environmental degradation
it remains an empirical question as to how, to what extent and in which spatial and
temporal scales populations, especially in developing countries, are directly and
indirectly affected by their immediate natural surroundings. This paper examines the link
between fertility related behavior of women at the individual level and several
environmental determinants across eight sub-Saharan West African countries. Data is
pooled from georeferenced Demographic and Health Surveys (conducted 2001-2005)
combined with long term climatic data and a time series of remotely sensed vegetation
vii
index spanning 23 years. Results consistently show little to no effect of immediate natural
resources or gross land degradation on fertility related behavior, but that effects tend to
become more pronounced in larger geographic scales. Despite data limitations these
results call for improved theoretical specificity. Questions that need to be addressed, both
theoretically and empirically, are at which spatial and temporal scales environmental
pressures induce certain types of demographic responses.
viii
Table of Contents
List of tables ....................................................................................................................... ix
List of figures .......................................................................................................................x
Chapter 1 Introduction ........................................................................................................1
Chapter 2 Population dynamics and environmental degradation .......................................4
The effect of population pressure on the environment ...............................................4
Demographic responses to environmental pressure ....................................................6 Individual and household response mechanisms ........................................................8 Methodological implications ....................................................................................11 Previouse findings and additional theoretical considerations ...................................12
Chapter 3 Land degradation and desertification ................................................................15
Chapter 4 Data and methods .............................................................................................23
Data description and preparation ..............................................................................23
Environmental measures ...........................................................................................29 Analysis.....................................................................................................................32
Chapter 5 Results ..............................................................................................................37
Chapter 6 Discussion ........................................................................................................49
Conclusion ................................................................................................................54
References ..........................................................................................................................56
ix
List of Tables
Table 1: Data sources and description of geographical and environmental
variables ........................................................................................................25
Table 2: Country populations in 2005, used for re-weighting ....................................29
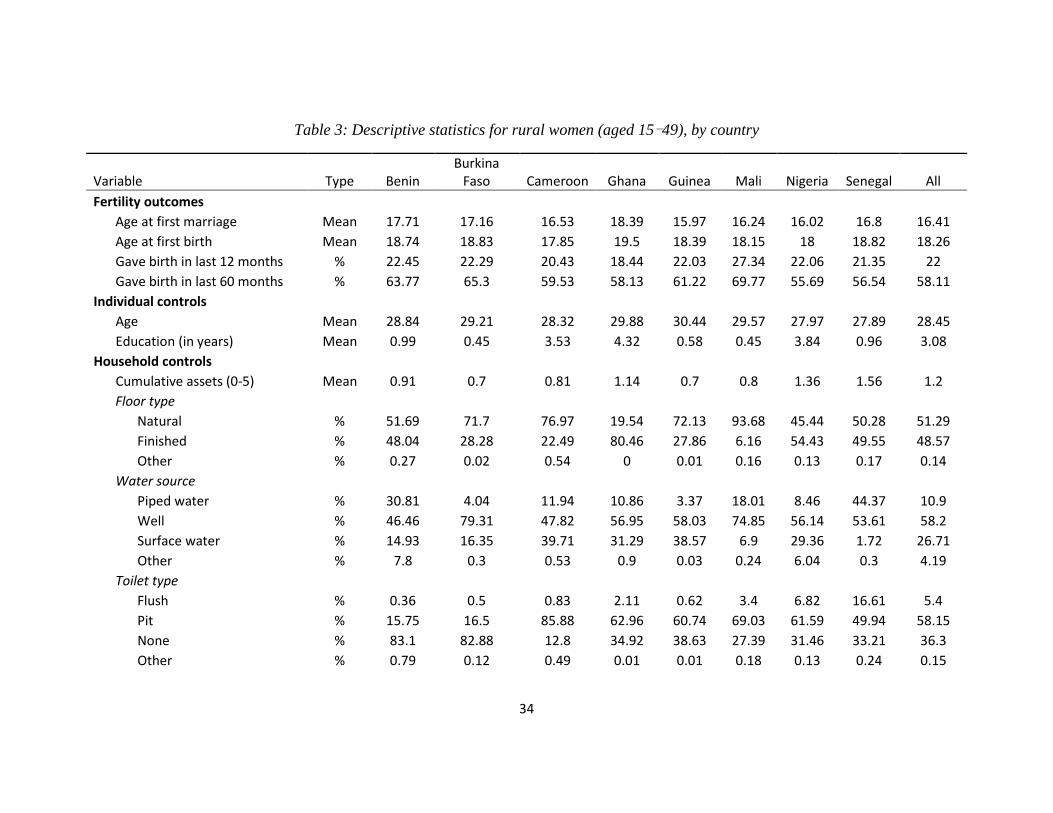
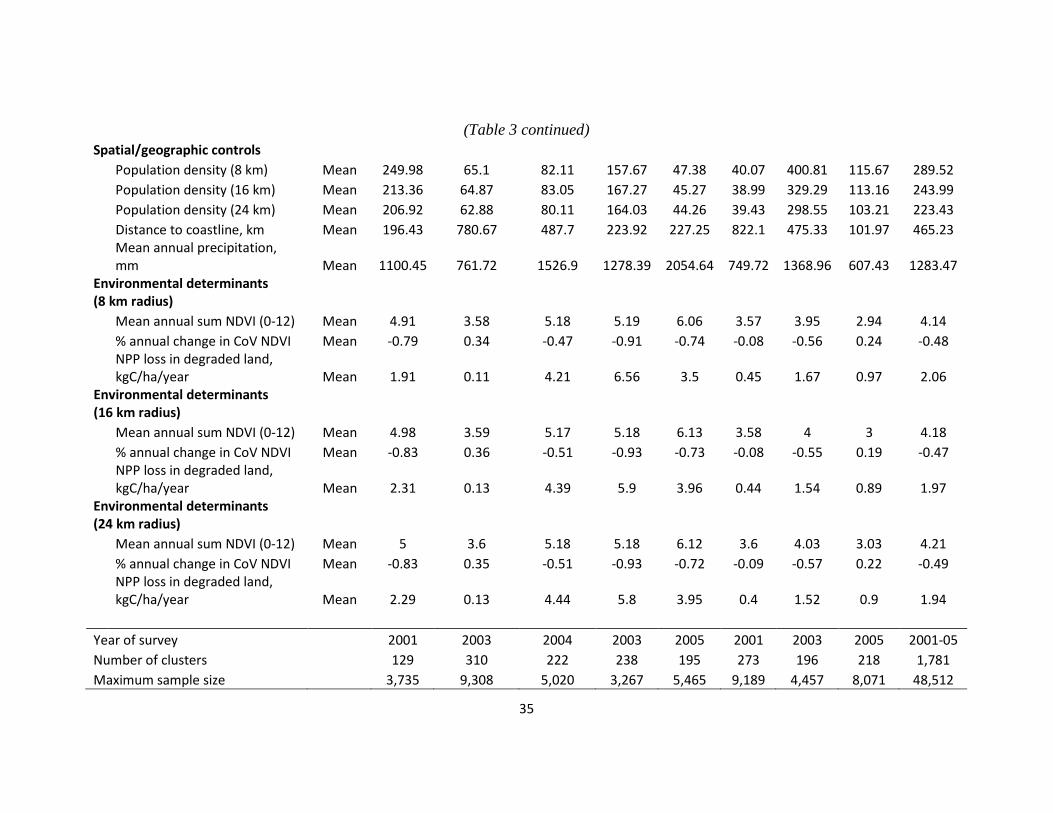
Table 3: Descriptive statistics for rural women (aged 15-49), by country..................34
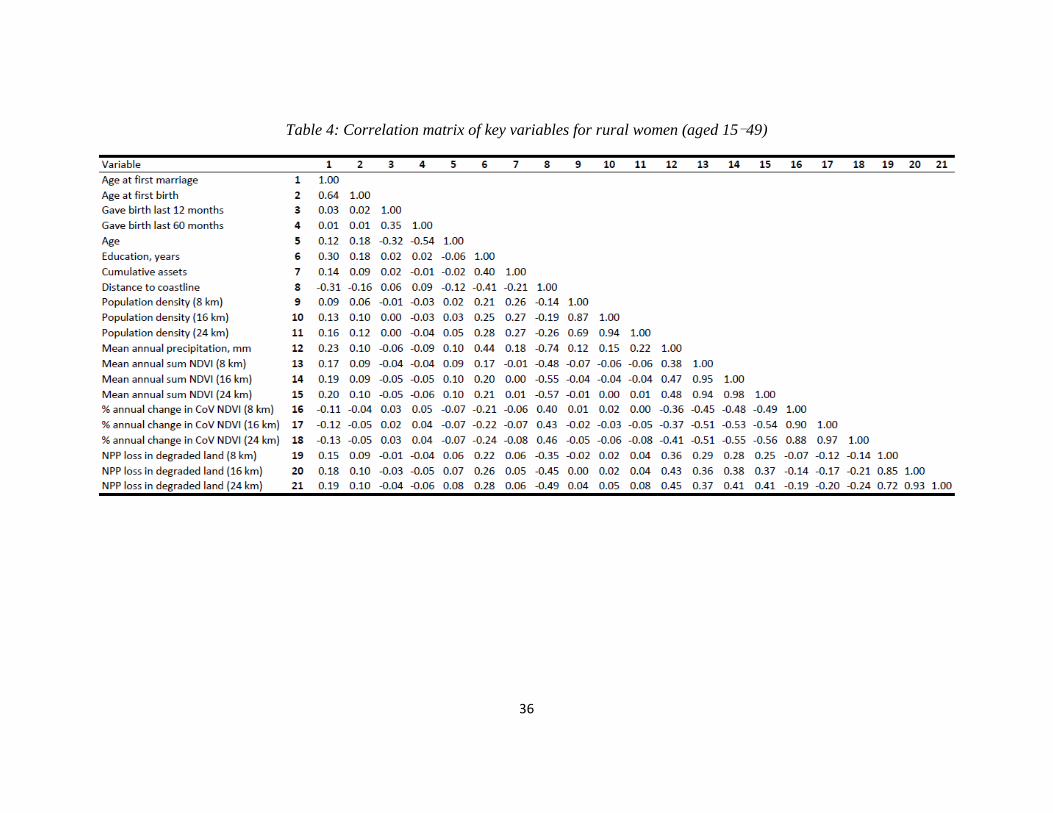
Table 4: Correlation matrix of key variables for rural women (aged 15-49) ..............36
Table 5: OLS regression models for age at first marriage/birth by country ...............41
Table 6: OLS regression model for age at first marriage, 16 km radius .....................42
Table 7: OLS regression models for age at first marriage, all models and
geographic scales ..........................................................................................43
Table 8: OLS regression model for age at first birth, 16 km radius ............................46
Table 9: Logistic regression model for probability of giving birth in previous 12
months (women ever married, aged 15‐49), 24 km ...................................47
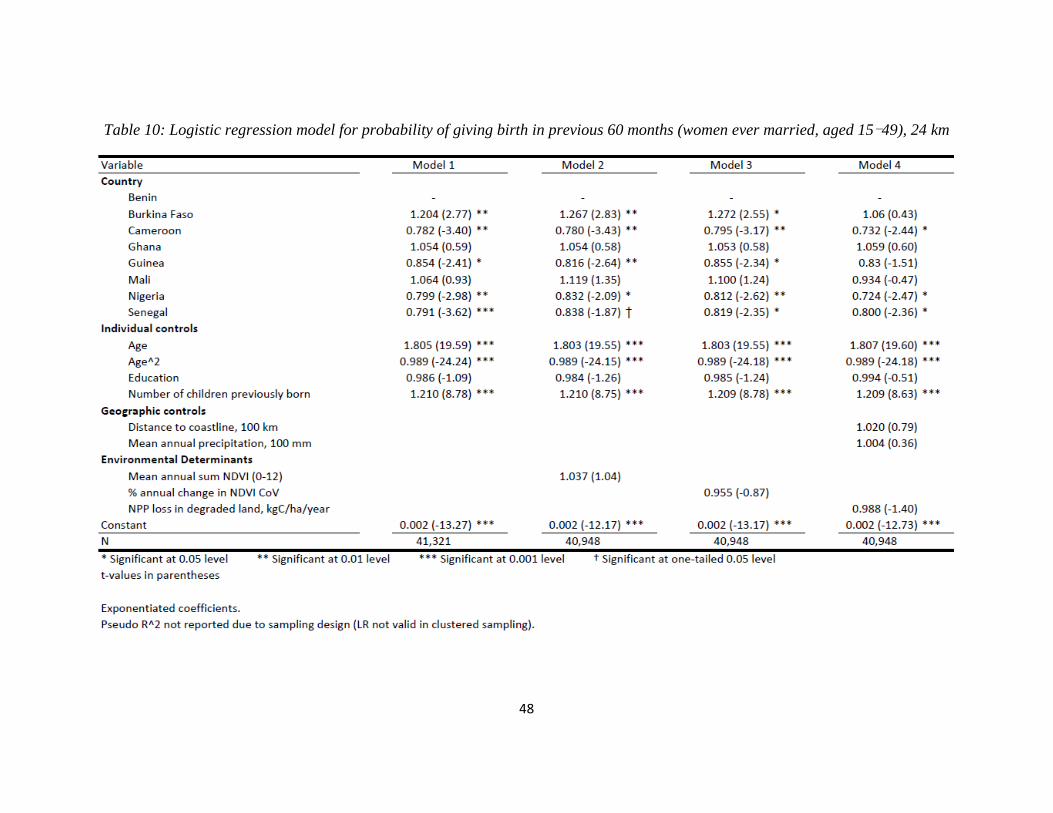
Table 10: Logistic regression model for probability of giving birth in previous 60
months (women ever married, aged 15‐49), 24 km ...................................48
x
List of Figures
Figure 1: Mean annual precipitation, West Africa 1950-2000 .....................................26
Figure 2: Mean annual sum NDVI, West Africa 1981-2003 .......................................27
Figure 3: Mean annual NPP loss in degraded lands, West Africa 1981-2003 .............28
Figure 4: Regional TFR by land degradation ...............................................................38
1
Chapter 1: Introduction
Until recently, the influence of the natural environment on population dynamics
was often neglected in demographic analyses, even though such influences lie at the core
of classic demographic thought. The key processes of fertility, mortality and migration
are implicitly assumed to be contained almost exclusively within the socio-economic
realm in the modern era. However, it remains an empirical question how populations,
especially in developing countries, are still directly and indirectly affected by their
natural surroundings. The non-social context within which population dynamics occurs
includes a variety of possible natural, geographic and spatial determinants: climate,
topography, natural resource endowments, soil quality, availability of rainfall, surface
and ground water, and proximity to shore, to name a few (Bilsborrow, 1992). These are
further complicated when supplemented by interactions with the social world in the form
of agricultural practices, land tenure and distribution, government policies, and of course
the demographic processes themselves resulting in population growth and flows affecting
their natural environment in return.
The relatively few studies that have tried to empirically question the responses of
populations to environmental change were often limited to crude, macro level units of
analysis such as regions, countries and sometimes entire continents (Bilsborrow &
DeLargy, 1990; Bilsborrow, 1992; Tiffen & Mortimore, 2002) – mainly due to the
scarcity of data at smaller scales. While some circumstantial evidence has been shown to
support the link between population dynamics and the natural environment, it often
2
suffers from an ecological fallacy, making it virtually impossible to link environmental
determinants to individual behavior and outcomes (some recent exceptions are Balk, et
al., 2004; and Hunter et al., working paper). With recent technological advancements
making it possible to monitor the human and natural environment (e.g. remote sensing,
GPS and GIS), as well as increasing availability of data from developing countries, it has
become possible to better answer these long lasting questions with finer spatial and social
resolution. This is especially important given the increased awareness of environmental
problems, whether caused or amplified by collective human action.
Using the above mentioned resources, the key link that I propose to explore in this
paper is the one between land degradation and fertility, focusing on sub-Saharan West
Africa. More specifically, I evaluate the hypothesis that individuals in areas suffering
from greater land degradation and fewer environmental resources will respond by
reducing their fertility, either directly or through postponement. Granted, land
degradation is only one form of environmental change. But it is one that is closely tied to
many environmental and social factors, as will later be shown. Likewise, it is important
to note that fertility reduction/postponement is also just one possible demographic
response to land degradation. Others include internal and international labor and
permanent migration – these may be the focus of future analyses using data pooled and
analyzed in this paper.
I will start with a review of the theoretical frameworks linking land degradation
and population dynamics, followed by the broader literature about land degradation and
3
desertification: its causes (whether a natural or human induced problem), manifestation,
issues regarding measurement and recent trends. I will then thoroughly discuss the data
and methods used to assess the effect of land degradation on fertility and marriage at the
individual level rather than some aggregate unit of analysis. These data include
Demographic and Health Surveys conducted in 8 West African countries, spanning from
2001-2005 and including GPS coordinates of sampling clusters. As indicators of long
term environmental resources and land degradation I use a set of pre-processed measures
derived from a time-series of remotely sensed vegetation index spanning from 1981-
2003. Several geographic and climatic control variables are also included. Results will
then be shown and discussed, with emphasis on the scope, scale and limitations of the
data presented, as well as theoretical implications for future research.
4
Chapter 2: Population dynamics and environmental degradation
The literature linking population dynamics and the environment can be broadly
divided to 3 theoretical foci of arguably the same interrelated ontological phenomenon:
(a) the effect of population pressure on the environment; (b) population responses to
environmental pressure; and (c) a combination of the two, or feedback loops of
population-environment dynamics. These can be further complicated by the level of
theoretical specification with regard to social units of analysis – ranging from individuals
and households to entire populations, however geographically (or otherwise) defined.
While the emphasis of this paper is on demographic responses, specifically fertility, to
environmental degradation, alternative causal directions should be considered.
Additionally, even within the framework of demographic responses there exists a
multitude of competing predictions as to the nature, direction and magnitude of possible
responses. These are developed in the following discussion.
The effect of population pressure on the environment
Jolly (1994) identifies 4 major theoretical frameworks pertaining to the
association between population growth and environmental degradation. First is the
classical economic approach which views land degradation as a direct result of high
population growth, leading to resource depletion. This approach dates back as early as
Malthus (1798) and in principle anticipates rapid population growth, unmatched by a
similar growth rate in food production, eventually resulting in major food shortage and
5
increased mortality until equilibrium is achieved once again. This simplistic model
follows an ecological logic of a limited (though variable through time and space) carrying
capacity of the land. Sustained by Neo-Malthusians, this framework is identified as the
dominant perspective in demographic literature (Hogan, 1992) – especially with regard to
sub-Saharan Africa (Kalipeni, 1996).
The neo-classical economic approach, considered as the prominent challenge to
the Malthusian theory and commonly attributed to Boserup (1965, 1981), contends that
the effect of population pressure on the environment is mediated by market inefficiencies
and technological advancements. In fact, increased population density can be seen as the
driving force of technological progress – resulting in reduced stress on the environment
and potential long term sustainability (Mortimore, 1993).
The third approach, associated with dependency theory, posits that both
population growth and environmental degradation are the result of poverty and
inequality, rather than directly linked to each other in a causal fashion. However, it
remains unclear whether and under what circumstances poverty itself is an exogenous or
endogenous factor of environmental degradation, degradation can be attributed to those in
the upper or lower tail of the inequality distribution, and institutional or market failures
play a role in this mechanism (see Duraiappah, 1994 for further discussion).
The fourth and last approach considers population growth only as an exacerbating
proximate factor of environmental degradation, rather than the underlying cause (e.g.
prevalence of polluting technologies, unfit policies etc.). Finally, Jolly suggests that these
6
frameworks are not necessarily mutually exclusive (Kalipeni, 1996) and instead may
depend on regional factors.
Demographic responses to environmental pressure
Regardless of the driving force underlying environmental degradation, once it
manifests itself, it is theorized to impose stress on nearby populations. If the stress is long
lasting (e.g. land degradation) rather than temporary (droughts, floods and other natural
disasters), individual and population level demographic responses are likely to take place.
As previously described, the Malthusian theory argues that equilibrium is to be re-
established mainly through the reduction of population levels below the environment’s
carrying capacity – or in plain words – increased mortality. The theory’s major fault, as
now widely recognized, is in disregarding alternative means of economic and
demographic responses.
One such example is through technological advancements increasing crop yield
per area unit, postulated by the Danish economist Ester Boserup (1965, 1981) and
referred to as land intensification. Once the pressure of population growth is felt in some
limited agricultural land area, the production of food will be intensified by use of
fertilizer, irrigation and other technological means (later additions include genetic
engineering of crops for example). Another economic path of increasing food production
is through extensification (Bilsborrow, 1992), in which additional agricultural land can be
appropriated by deforestation and other means of land-use change.
7
Kalipeni (1996), however, argues that there has been too much emphasis in the
literature on economic responses rather than demographic ones. A conceptual framework
of purely demographic multi-phasic response was originally suggested by Davis (1963),
albeit with the cases of modern Japan and West Europe in mind. An encompassing theory
of economic and demographic responses, directed mainly at developing countries, is
developed by Bilsborrow and Okoth-Ogendo (1992). Their multi-phasic response model
links population adjustments to land-use pressure through several paths: (1) Tenurial –
the redistribution of land ownership to accommodate growing population; (2)
Extensification – the appropriation of additional land; (3) Technological – which can be
identified with Boserup’s intensification argument; (4) Demographic – incorporating
fertility reduction through either postponement of marriage, reduction of marital fertility
or both, and finally population redistribution through internal rural-rural, rural-urban and
international migration.
As the pressure of food and resource shortage increases, and economic solutions
are unmet, demographic responses may follow in the form of fertility reduction and
voluntary or forced migration (for an interesting discussion about the boundaries and
definitions of “environmental refugees” see Suhrke, 1994). While Bilsborrow (1992)
postulates that families will tend to exhaust all other options before resorting to
demographic adjustment, it is not inevitable to find all four phases manifesting
concurrently (albeit at different rates and time scales) when external environmental
pressures are high. Bilsborrow (1987) describes the socioeconomic and institutional
contexts in which different responses, both economic and demographic, are likely to take
8
place. The geographical scales at which demographic responses should occur, however,
are absent from the theoretical literature and only implied in empirical studies by the
units of analysis for which data are available.
The problem of unmet demands for food and resources, however, is twofold: not
only is the availability of land outstripped by growing populations, it may actually be
depreciating. This is a possible outcome under both classic and neo-classic approaches.
Mortimore (1993) refers to the Malthusian outcome as the degradational pathway,
resulting in reduced fertility of cultivated soils, declining crop yield and a systematic fall
in total output which eventually translates to a starved community; The Boserupian
outcome is referred to as the conservation pathway, allowing for increased productivity
and sustainability. However, it is not at all clear that intensification is indeed sustainable.
Whether we take a generalized deterministic view or a locally mediated one, it may just
as well be true that intensification itself depreciates the fertility of the land in the long
term.
Individual and household response mechanisms
The economic and demographic responses discussed so far are largely stated at
the population level – and so are the theoretical and empirical predictions derived from
them. In order to avoid an ecological fallacy we must also consider how environmental
pressures and responses operate at the household and individual level. The main causal
mechanism underlying both economic and demographic responses, practically in all
9
theoretical approaches discussed to this point, relies on resource scarcity (be it crops,
fuel-wood or otherwise). As such it makes sense to consider the competing incentives,
rooted in and limited by a cultural setting, which operate at the micro level.
Population growth in developing countries induces two main effects: (1)
increasing the demand for food, and thus the price of arable land; (2) increasing the
number of family members per plot size through natural growth and subdivision among
heirs (Bilsborrow, 1990). Smaller family farms are also often excluded from taking the
intensification route, as their access to new technology and financial credit is limited
(others may switch to cash crops or livestock, though ironically it may require and
exhaust land resources even faster). As these family-owned plots can no longer sustain
their growing number of inhabitants, yet the prices of plots increase, many families end
up selling their lands and become landless which increases socioeconomic differentiation
(Bilsborrow, 1990). On the other hand, following the same logic, larger farms grow in
average size and introduce non-traditional crops and new farming techniques (i.e.
intensification). As families find it more and more difficult to sustain themselves, young
males may seek seasonal and permanent employment in adjacent rural or urban areas. In
the past, sub-Saharan African women were less prone for labor migration as they were
typically the ones working in the farms along with the children (Boserup, 1985). More
recently, however, it has been shown that rural-urban female migration in sub-Saharan
Africa is more likely for women who are unmarried, more educated, or have fewer
children (Brockerhoff & Eu, 1993), which may imply a change in previously gendered
migration patterns. Ultimately, as conditions increasingly worsen and once families
10
become landless, they are likely to migrate as a whole to new agricultural lands (possibly
cleared by deforestation, putting further strain on the environment) or to urban areas,
while still contributing to land-use pressure indirectly.
When it comes to fertility behavior, however, predictions may differ between the
population level and individual level theories. While fertility reduction is another
appropriate demographic response to land pressure according to the multi-phasic model, a
competing hypothesis postulates that in sub-Saharan Africa particularly there may be
social and cultural incentives to increase fertility as means to improve eligibility for land
tenure (Boserup, 1985). Women in particular may have additional incentives to bear more
children under environmental stress, as they are often responsible for housework
(including the collection of increasingly rare water and fuel-wood) and are typically
assisted by their children (Joekes, 1994). Put more formally in economic terms
(Aggarwal et al., 2001): under environmental stress children have both increasing
consumption and production utilities, the balance of which determines the demand for
additional children. In particular, Aggarwal and colleagues find – using an individual
choice model – that scarcity of fuel-wood in South-Africa has a positive effect on
fertility. Similarly, the direction of fertility change as a demographic response, both at the
population and the individual levels, is the focus of this paper and remains to be tested in
following sections.
11
Methodological implications
The conceptual frameworks presented so far allude to two main methodological
concerns. The first, and the most crucial to the aim of this paper, is the causal direction
between environmental degradation and fertility choices. While it is clear that human
populations both affect their immediate environment and are affected by it in return, the
distinction between these effects is not straightforward when using cross-sectional data
(albeit degradation is measured as a dynamic process prior to fertility). On one hand,
higher population density is linked to environmental degradation in a causal effect
(though the ecological footprint of urban areas can be far reaching, as asserted by Lambin
et al., 2001); on the other hand, fertility reduction is expected once the strain on the
environment translates back to land-use pressure on the local population. Thus, observing
varying levels of fertility in degraded lands at one time point should not necessarily
follow a uniform direction. Early in the process we expect increasing population growth
rates to increase land degradation, while later in the process we expect a reversal in this
causal mechanism, with land degradation driving fertility downwards. The question then
becomes whether the land is degraded enough to induce a certain response (i.e. fertility
decline), and whether contextual circumstances favor certain economic or demographic
responses over the others Bilsborrow (1987).
The second methodological complication lies in identifying and measuring land
degradation, however it may be defined (I address this in the following section). Relating
land-use change and degradation solely to agricultural practices encompasses only a
12
limited subset of the actual phenomenon. Land degradation in the social sciences
literature is often treated as a human-induced problem – the result of deforestation,
urbanization, globalization, overconsumption of fuel-wood and so on. An additional set
of causes exists in the geosciences literature, especially with regard to the arid and semi-
arid zones of sub-Saharan Africa, incorporating natural (and to some extent cyclical)
climatic variation consisting of short term droughts and long term desiccation (Darkoh,
1998). This makes it all the more difficult to differentiate long term human-induced
degradation from the natural and reversible “background noise”. It is also expected that
populations in these arid and semi-arid zones, characterized by higher climatic variability
than humid tropical zones, will be more resilient to ecosystem changes when institutional
socio-economic factors allow (Olsson, 1993).
Previous findings and additional theoretical considerations
Previous empirical evidence is scarce and generally regarded as circumstantial
(Bilsborrow and Okoth-Ogendo, 1992; Kalipeni, 1996). Bilsborrow and colleagues find
evidence of intensification, extensification and demographic change at the continental
and country level in a broad range of developing regions (Bilsborrow, 1987; Bilsborrow
& DeLargy, 1990; Bilsborrow, 1992; Bilsborrow & Okoth-Ogendo, 1992). Kalipeni
(1996) suggests that the onset of the fertility transition in Malawi and internal migration
patterns in the 1970’s and 80’s are tied to population pressures on the environment,
measured at the district level (though he does not have a direct measure of environmental
13
pressure and instead uses population density as the main explanatory variable). The use
of aggregate units of analysis, however, is prone to ecological fallacies as these scholars
recognize. Since both fertility transition and environmental degradation are dynamic
processes which operate over the course of years and decades, it is difficult to disentangle
the web of intervening and mediating variables. For instance, economic development
may affect both (e.g. fertility reduction and environmental degradation) over time, even
when the two are causally unrelated. Furthermore, as previously shown, competing
incentives may operate at the individual level and these do not necessarily complement
the population level predictions of fertility response. An individual based choice model
may produce contradictory results, as recently shown in the case of fuel-wood scarcity in
South-Africa during the early 1990’s (Aggarwal et al., 2001).
If we take the stance that the present is in many ways unique and exceptional in
human history (the speed of recent and contemporary demographic change suggests that
this is the case), we may also have to consider the possibility that what the future holds
cannot be fully derived from past collective experiences. In other words, the pace and
extent of environmental changes may not follow a linear and cumulative trend. The effect
of environmental degradation (whether nature or human induced) on human populations
could be aggravated under climate change (Meadows & Hoffman, 2003). Exacerbated
political tensions and conflicts, presumed to accompany massive migration in developing
countries, are all possible scenarios if such extreme climatic changes should occur (see
Suhrke, 1993; Eswaran et al., 2001).
14
To conclude, I intend to examine the demographic response of sub-Saharan West
African populations to land degradation rather than degradation itself as a population
induced phenomenon. While the two processes are conceptually interrelated, degradation
is treated as an exogenous variable in the empirical analysis presented in this paper. I take
this to be a plausible assumption with respect to individuals’ fertility choices, by which
land degradation is experienced as a structural constraint, even when at the population
level a reversed causal mechanism can be hypothesized. Specifically, I examine whether
land degradation affects individual decisions regarding fertility and marriage among rural
women in eight West African countries: Benin, Burkina Faso, Cameroon, Ghana, Guinea,
Mali, Nigeria and Senegal. These countries span over a variety of climatic conditions
ranging from humid to hyper-arid. Following the revisited multi-phasic model
(Bilsborrow & Okoth Ogendo, 1992) I evaluate the hypothesis that the higher the level of
degradation, the lower the number of children women will tend to have, and the higher
the age of first marriage (and consequently first birth). The effect of long term ecosystem
characteristics as well as environmental resource predictability will also be examined. We
now turn to discuss in further depth the definition, causes, manifestation and
measurement of land degradation in sub-Saharan West Africa and the Sahel region.
15
Chapter 3: Land degradation and desertification
The definition of land degradation is a very tricky one. Its scope depends, to some
extent, on the disciplinary affiliation of the researcher as well as on the focus of the study.
Consequently, the identification and measurement of degradation varies considerably
across the literature with regard to scale – both in terms of space and time. For these
reasons it is difficult to present a coherent picture of the causes of degradation or its
cumulative effect over time in a specific geographic region. Here I review the main
definitions and causes of degradation in the literature, their “evolution” through the
recent decades and how the consensus (if there ever was one) regarding the topic has
changed. From this discussion I will later derive the somewhat limited scope of the term
as operationalized in this study.
In the early literature land degradation was often referred to as desertification, a
term coined by the forester Aubreville in 1949 with regard to the consequences of
deforestation (Darkoh, 1998). The use of the term became common practice in the early
1970’s, often depicting a large scale encroachment of the desert (mainly relating to the
Sahara desert and the Sahel region, which suffered from extreme drought during 1965-
1973). Preliminary claims (Stebbing, 1938; Lamprey, 1975) stated that the Sahara desert
was advancing southward at a rate of several km per year, though these results were later
shown to be flawed for various reasons (Dodd, 1994; Thomas, 1997; Nicholson et al.,
1998). Nonetheless, these claims were enough to encourage the first UN Conference on
Desertification in Nairobi in 1977, which eventually adopted the following definition
16
(UNCOD, 1977): “Desertification is the diminution or destruction of the biological
potential of the land, and can lead ultimately to desert-like conditions”. A later
supplement to the definition was adopted by the UN Environmental Program (UNEP) in
1990, stating: “Desertification/land degradation, in the context of assessment, is land
degradation in arid, semi-arid and dry sub-humid areas resulting from adverse human
impact” (Hellden, 1991). Another definition by UNEP in 1992 referred to the process of
desertification as “patches of increasingly unproductive land breaking out and spreading
over hundreds of square kilometers”, and the UN International Convention to Combat
Desertification (INCD) in 1994 described land degradation as the “reduction or loss of
the biological or economic productivity and complexity of the land” (Darkoh, 1998).
Finally, a recent addition adopted by the UN specifies the causes and scope of the
problem: “land degradation in arid, semiarid and dry sub-humid areas result[s] from
various factors, including climate variations and human activities” (Nicholson et al.,
1998).
Other definitions of desertification/degradation abound. Yet, the main sources of
ambiguity are captured in the above set of definitions and include the following: whether
degradation/desertification manifests only in large scale arid, semi-arid and dry sub-
humid zones tangent to desert borders, or in sporadic patches; whether it is induced by
climatic variation, by adverse human activities, or both; and consequently, whether it is
reversible.
17
It is now commonly understood that the image of encroaching sand dunes is a
false one with regard to degradation/desertification (Eckholm, 1975; Nicholson et al.,
1998; Symeonakis & Drake, 2004). The previously held assessments of vast amounts of
land being degraded to desert-like conditions have been refuted. UNEP’s early
assessments included up to 35% of the earth’s land surface under vulnerability to
desertification (Hellden, 1991), and a “desertification-hazard map” presented at the 1977
UNCOD turned out to be no more than simply a map of the world’s drylands (Thomas,
1997). Satellite imagery in the past 3 decades have shown that the “advancement and
retraction” of the Sahara is largely the result of natural variation in rainfall, and that this
natural occurrence is to a large extent reversible (Hellden, 1991; Tucker et al., 1991;
Nicholson et al., 1998; Tucker & Nicholson, 1999). However, smaller scale and sporadic
anthropogenic induced degradation may still occur, especially when interacting with
droughts in arid and semi-arid regions.
The causes of degradation/desertification were historically highly contested,
mainly surrounding the question whether it is an anthropogenic problem or a natural one.
The natural path includes short and long term droughts resulting in reduction in
vegetation cover and ultimately loss of nutrients and land fertility through soil erosion.
The anthropogenic path is more diversified and includes ill-designed agricultural
practices (pastoral overgrazing, reduced fallow, poor irrigation practices etc.), land-use
change through deforestation and urbanization, and lastly fuel-wood cutting to supply
energy demands in developing countries (Symeonakis & Drake, 2004). The outcome
18
however is fairly similar in both routes: reduced surface vegetation, soil erosion and loss
of nutrients rendering the land practically sterile.
Geist and Lambin (2004) use a meta-analytical research design to derive the
causal patterns of desertification. They conclude that neither explanation pathway (i.e.
human vs. nature) can fully capture the multifaceted problem of degradation. Instead,
they propose a typology of proximate causes and underlying driving forces. The
proximate causes operating at the local level include mainly immediate human activities
as agricultural practices, infrastructure extension and wood extraction, as well as
increased aridity through reduced rainfall. The underlying driving forces on the other
hand include demographic factors (e.g. population growth and redistribution through
natural increment or migration), economic factors, technological advancements, cultural
practices, institutional policies, and again, climatic factors. Furthermore, they conclude
that the combination of factors has the potential to vary greatly among different
geographic regions across the globe.
An additional level of complexity is obtained when considering interrelations
between anthropogenic and natural factors, as well as feedback mechanisms. Natural
habitats in arid and semi-arid zones are believed to be highly resilient to rainfall change.
It is human practices after long periods of droughts that may drive the land to reach its
resilience threshold (Olsson, 1993; Darkoh, 1998). Interestingly, the causality does not
necessarily have to occur in one direction. While populations are driven to
overexploitation of the land in times of natural crises (i.e. droughts), they may just as well
19
affect climatic variation themselves through reduction of surface vegetation cover.
Exposure of bare land where vegetation previously existed is hypothesized to increase the
albedo (the proportion of reflected incident solar radiation by a surface) and in turn
reduce precipitation (Nicholson et al., 1998; Geist & Lambin, 2004). Large scale climatic
changes can also be induced by global greenhouse gas emissions and aggravate the
natural water stress in arid and semi-arid zones.
This leads to the third question of reversibility. As stated earlier, arid and semi-
arid environments are believed to be highly resilient to rainfall variation. It is also evident
that large scale permanent encroachment of the southern border of the Sahara has not
occurred in recent decades (ever since vegetation cover has been monitored through
remote sensing techniques). Interannual fluctuations in the Sahel region have been
attributed to change in precipitation, and were also proved to be highly reversible when
conditions improved (Nicholson et al., 1998). Thus, it is assumed that under the time
frame covered in this study (1981-2003), any long term degradation that has not been
linked to interannual rainfall variation is likely to be induced by adverse human actions
or interactions with the immediate environment. Although human populations are likely
to be affected by natural degradation just as well as by anthropogenic degradation, the
latter is believed to be prevalent through longer periods of time relative to the life course
of individuals, and thus be more likely to induce demographic responses rather than other
forms of temporary adjustments (here these include change in fertility and marriage
patterns rather than migration). Simply put, land degradation addressed in the following
20
analysis will be considered anthropogenic and largely irreversible in the scope of 2.5
decades.
The final concern is that of measurement. Due to the substantive complexity and
large geographic scale of the phenomenon it remains relatively difficult to measure the
extent of land degradation. Thanks to remote sensing technology it has become possible
to track changes in global surface vegetation cover through time, with some of the
datasets extending back to the early 1980’s. Remote sensing technology utilizes the
unique “electromagnetic signature” of various objects, comprising of absorption and
reflectance patterns at different wavelengths of electromagnetic radiation (usually
originating from the sun, though not exclusively). A commonly used measure of surface
vegetation is the Normalized Difference Vegetation Index (NDVI) which, as the name
implies, utilizes the normalized difference in surface reflectance of solar radiation
between two bands: the Visible Red and the Near Infra-Red. Green vegetation generally
absorbs at visible red and reflects at near infra-red, so the difference/ratio between the
two plays a key role in many vegetation indices. NDVI is used in many of the studies
cited through this paper. It takes the form of:
In General, the higher the contrast between the two bands the higher the amount and
vigor of surface vegetation believed to be (Chuvieco & Huete, 2010). As the leaf loses its
green color through senescence it reflects more radiation in the visible red spectrum,
21
becoming less sensitive to vegetation indices (in practice the change in leaf color is the
result of higher reflection of visible red). NDVI assumes values between -1 and 1, where
values below 0 usually indicate water, snow or cloud cover; values close to zero indicate
bare soil and value approaching 0.7 indicate dense vegetation. However, it is worth
noting that NDVI (as well as other remotely sensed indices) is sensitive to multiple
factors such as cloud cover, level of illumination, topography, location of the satellite, the
sun and the observed object, and many others requiring geographic and radiometric
corrections.
A vegetation index is, however, simply that – a measure of the amount of surface
vegetation. It is highly correlated with the net primary production (NPP) of an ecosystem
(Nicholson et al., 1998) and does not necessarily indicate long term land degradation, but
rather captures the natural interannual fluctuations associated with rainfall. For that
reason, another measure often used in combination with NDVI, especially in arid and
semi-arid regions, is rain-use efficiency (RUE) – defined as the ratio between NPP and
precipitation. In practice this measure is approximated by the ratio of NDVI to rainfall
integrated over a yearly time step, making it robust to shorter-term fluctuations. Simply
put, RUE is an indication of the actual primary productivity of an ecosystem compared to
its natural potential productivity. In longer time periods, negative deviations from the
conservative baseline RUE values have been shown to indicate degradation (Symeonakis
& Drake, 2004). It is crucial to note that land degradation is ultimately a multifaceted
phenomenon having more than a single indicator, and that the measures adopted in this
paper and discussed so far were emphasized due to their frequent use in the literature, the
22
ability to monitor long-term change in large-scale ecosystems, and ultimately the
availability of large scale data. Important measures other than vegetation cover and rain-
use efficiency include overland flow of water, soil erosion and combinations of these
indicators (Symeonakis & Drake, 2004).
23
Chapter 4: Data and methods
Data description and preparation
The following analysis is based on a combination of DHS data and several spatial
and climatic data sources. The DHS data was collected during 2001-2005 from eight
West African countries: Benin, Burkina Faso, Cameroon, Ghana, Guinea, Mali, Nigeria
and Senegal. The surveys were randomly sampled in a two-stage design where sampling
clusters often, though not necessarily, coincide with census enumeration areas (for more
details about the sampling scheme see Demographic and Health Surveys, 1996). The
surveys were designed to be representative at the national level and usually at the 1st level
administrative regions. Data from these 8 countries were pooled together to include
64,829 households and 78,068 eligible women aged 15-49. Of these, a maximum of
48,512 rural, de-jure resident women were included in the final analysis (further broken
down by age, marital status and motherhood).
The sampling clusters were georeferenced as point data, representing the centered
coordinates of the households surveyed within the cluster. The size and density of
clusters can be highly variable, as they can potentially represent a village up to a dense
neighborhood in a large city. A total of 434 cases, of the original 48,512 rural women,
were excluded from most analyses since GPS coordinates were missing for 9 out of the
1781 rural clusters. In six of the eight countries referenced here the survey also included a
section regarding HIV, and although not directly relevant to this study, it has implications
24
on the spatial accuracy of the data: due to confidentiality issues the GPS coordinates of
clusters were randomly offset by up to 2 km in urban areas and up to 5 km in rural areas.
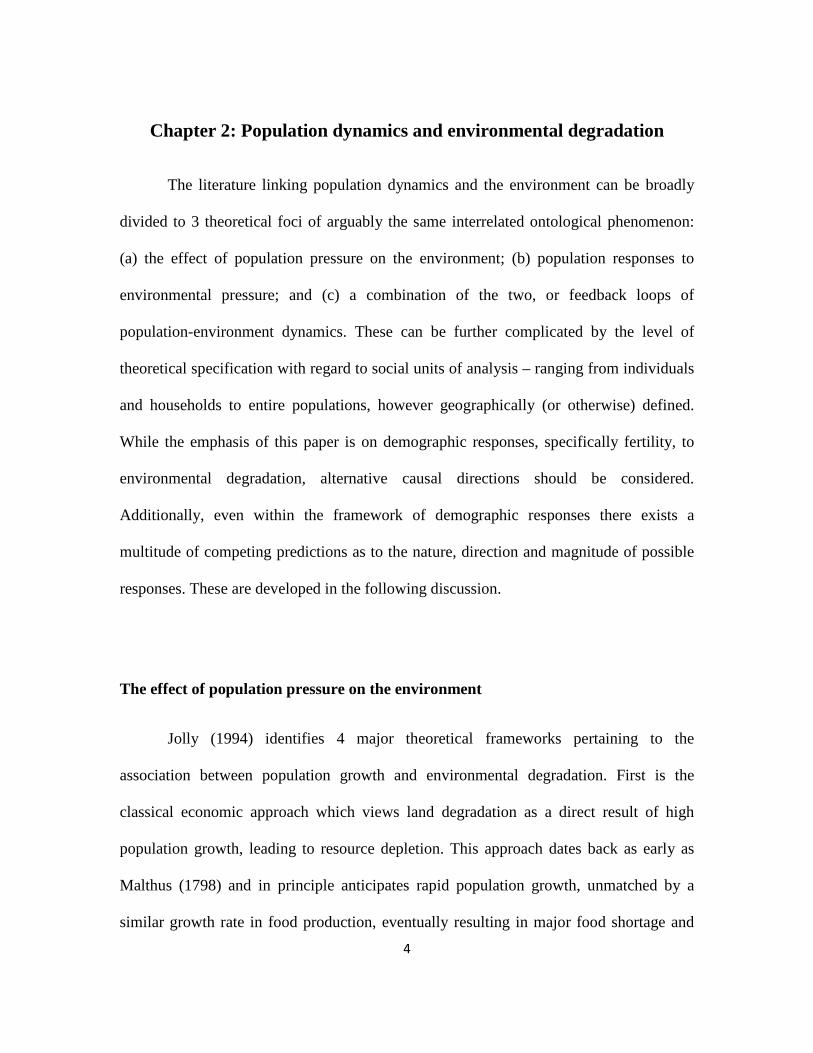
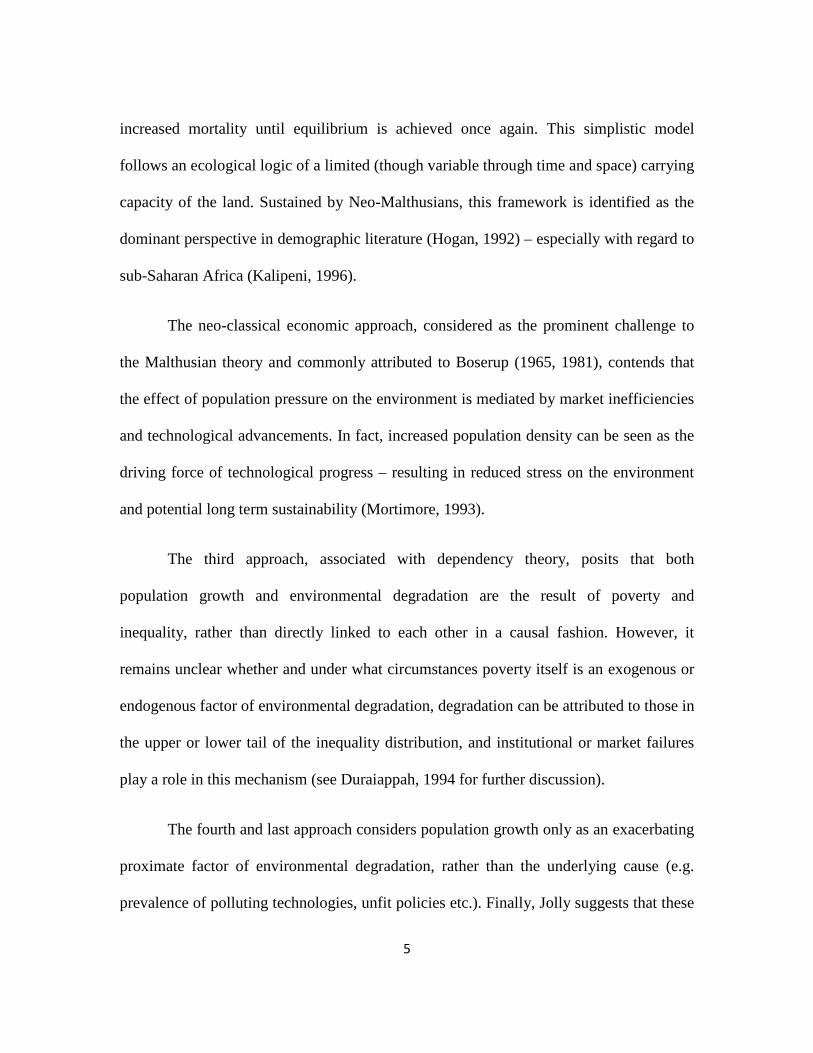
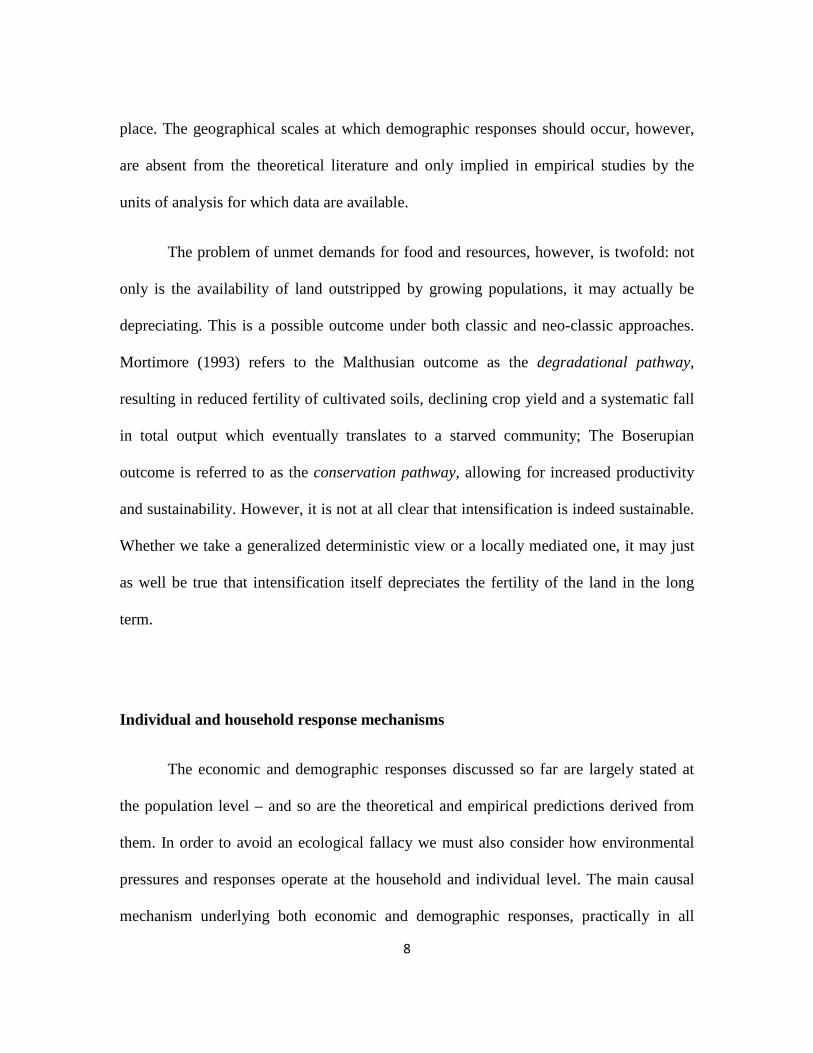
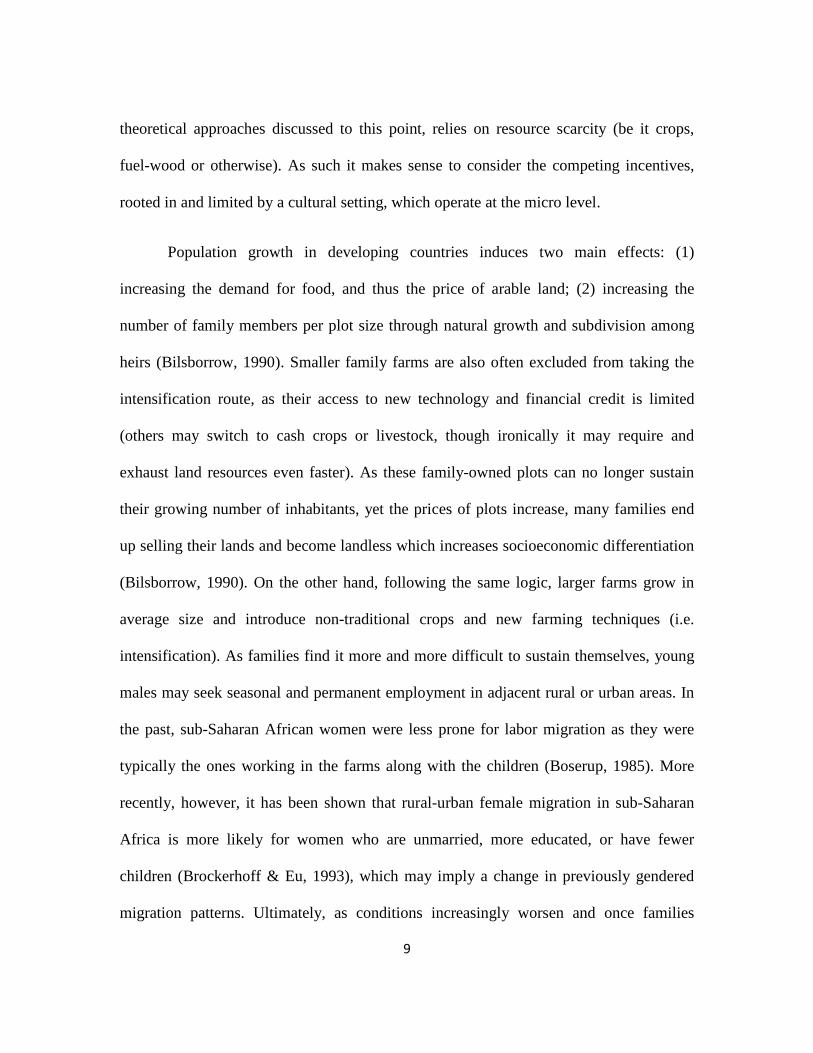
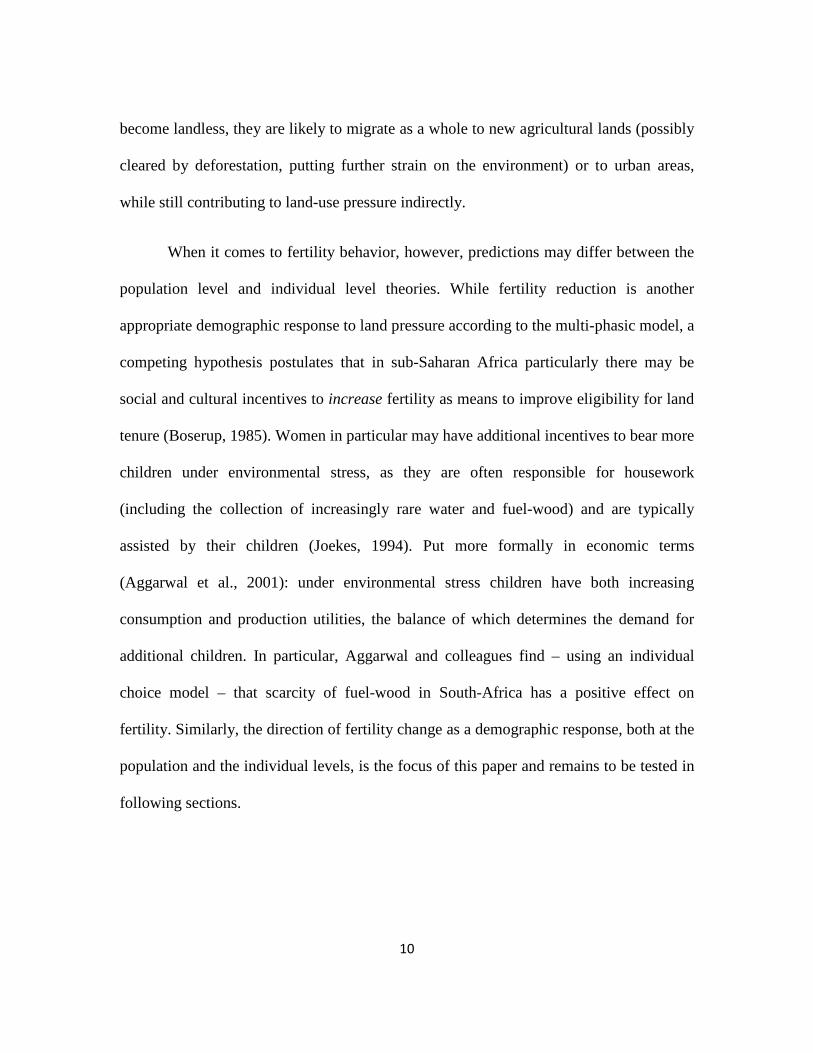
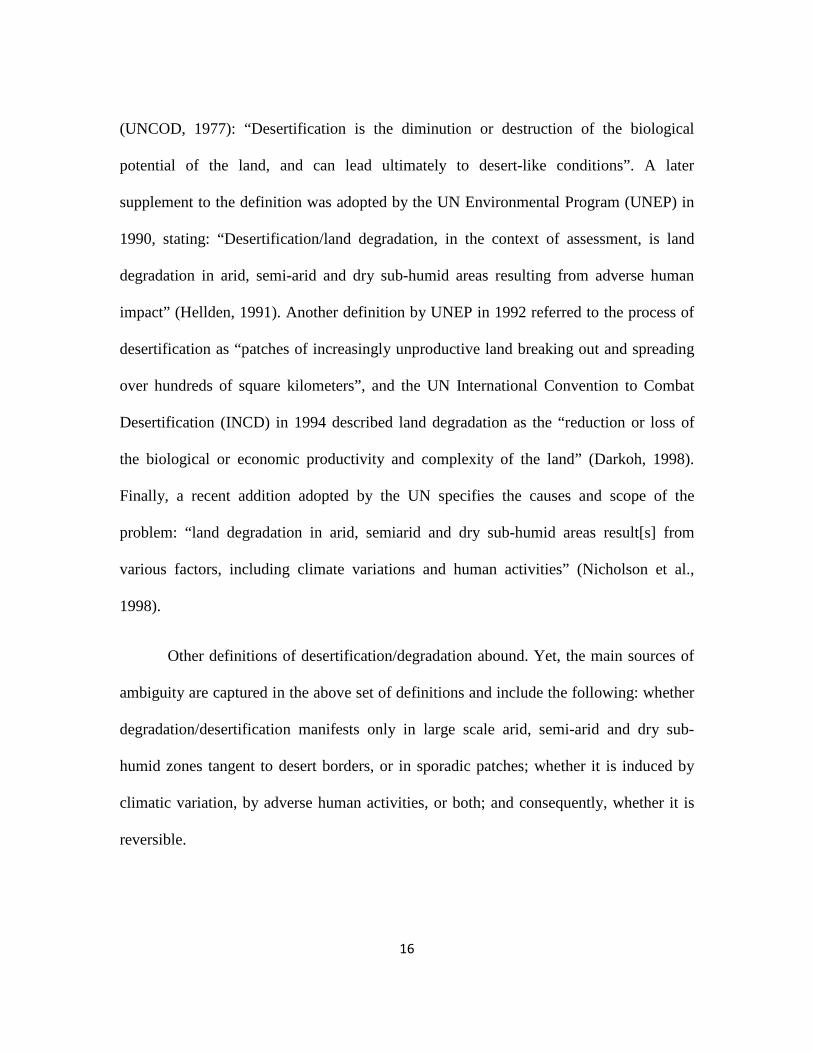
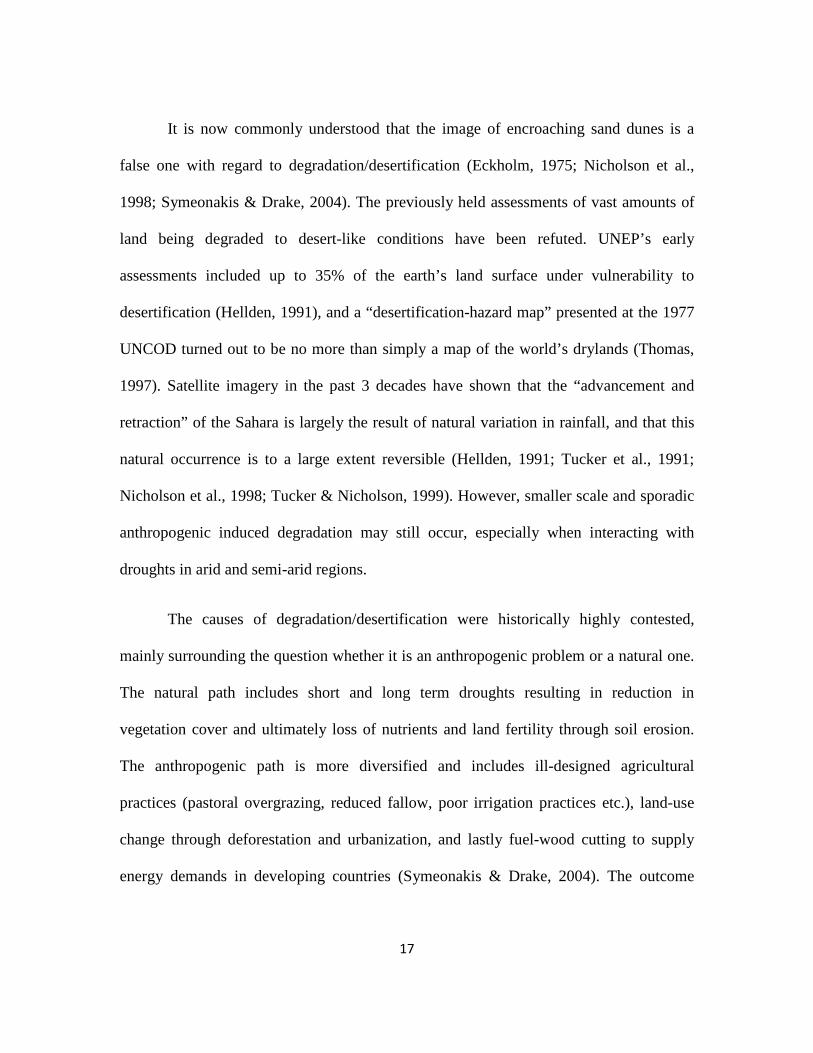
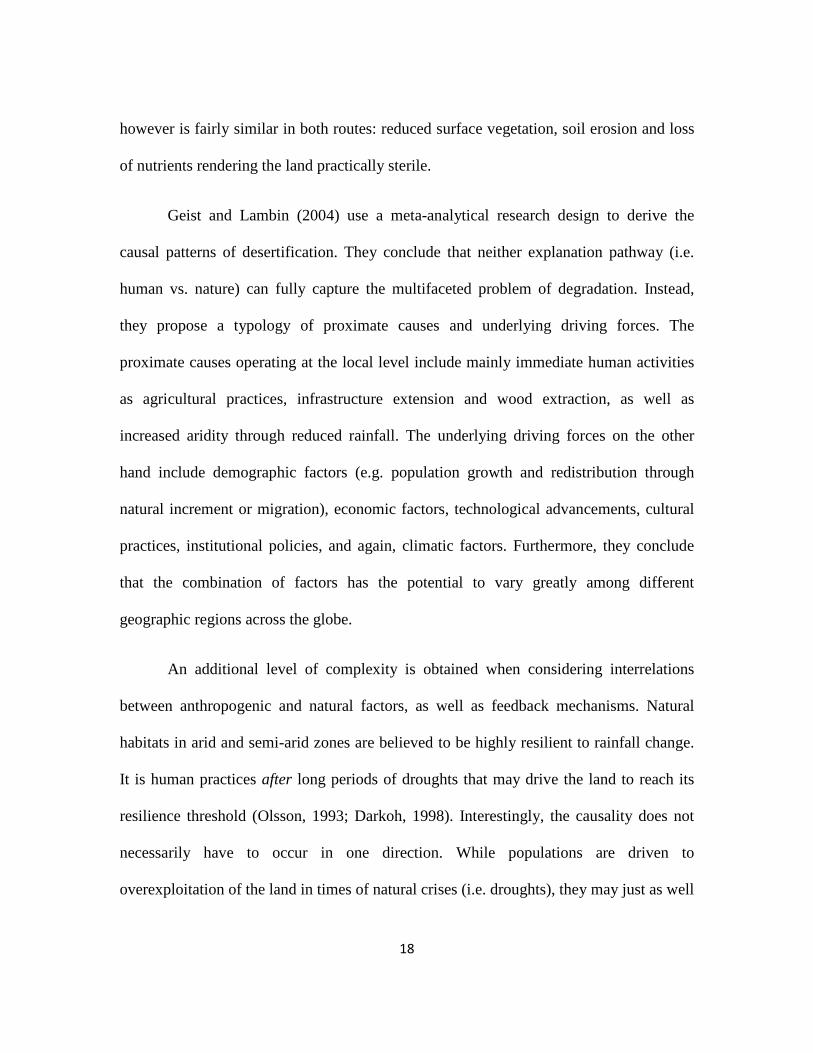
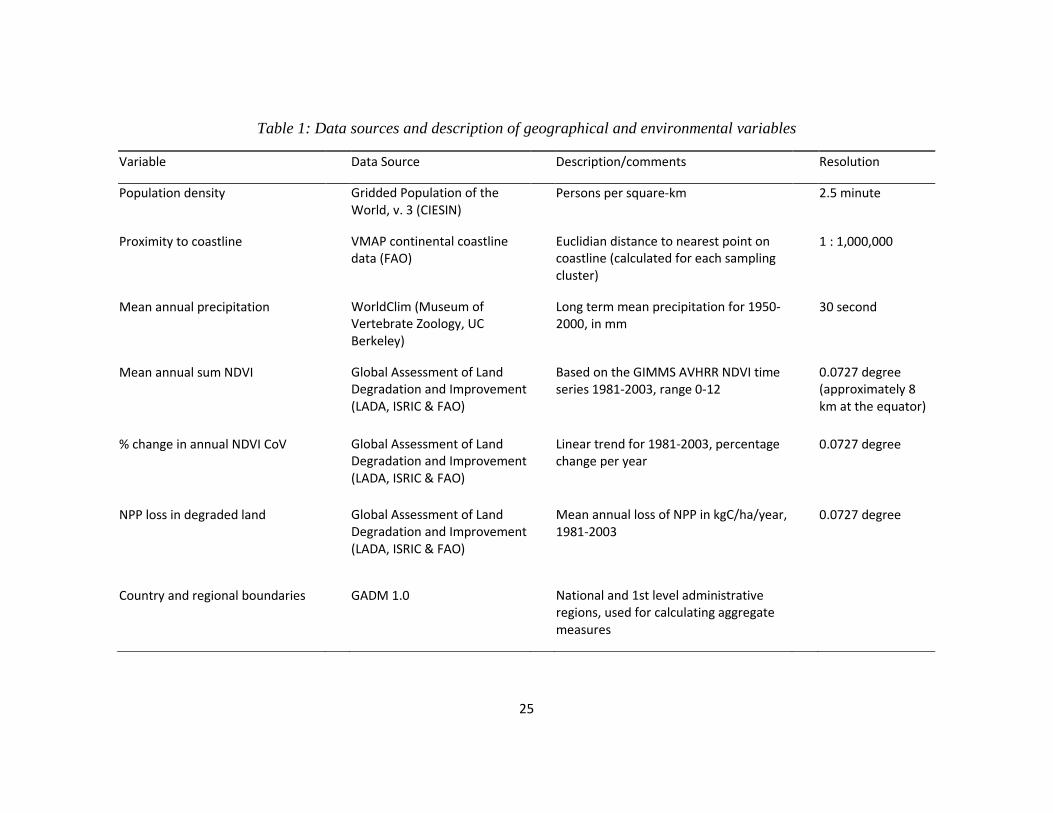
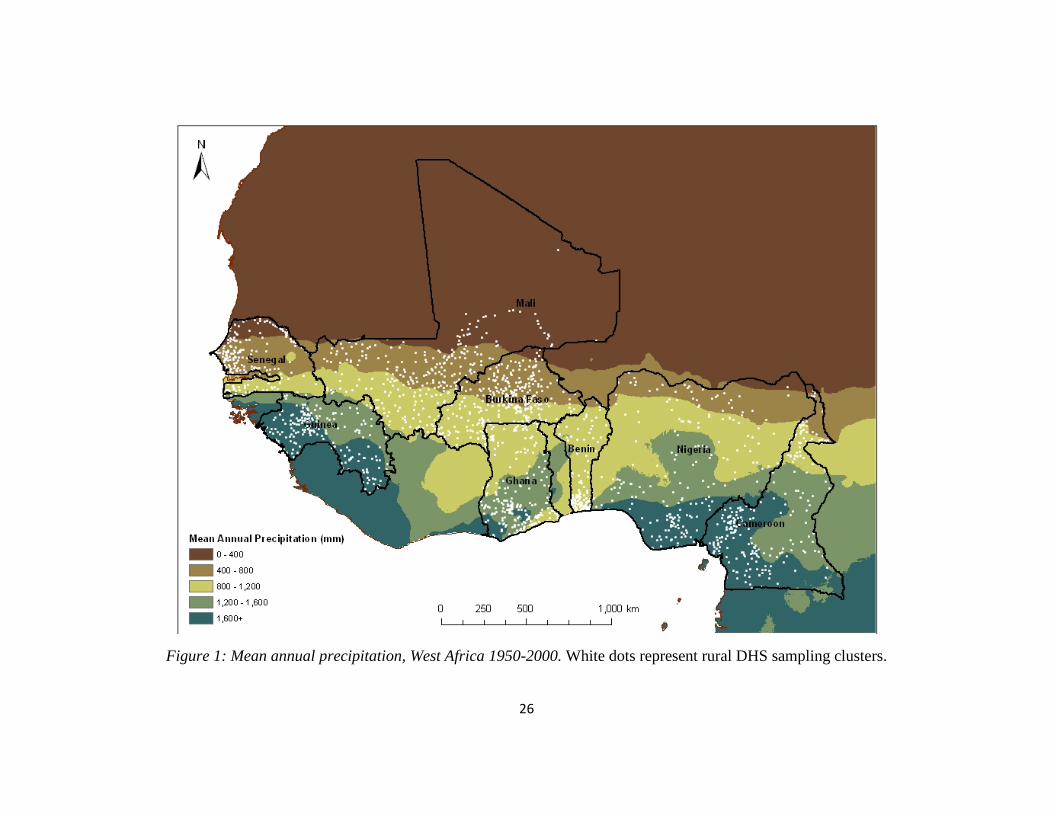
Geographical and environmental data include: gridded population density in the
year 2000, proximity of DHS sampling cluster to coastline, mean annual precipitation for
1950-2000, mean annual sum NDVI, mean annual change in NDVI coefficient of
variance, and finally, a time-series derived assessment of NPP loss in degraded lands. A
summary of the geographical and environmental variables, their sources and spatial
resolutions are shown in table 1. These variables were imposed on individual and
household data using cluster GPS coordinates. Gridded data were averaged and
calculated within a radius of 8, 16 and 24 km from the cluster, excluding water-bodies
but not spillovers across national boundaries. Though land degradation has been
hypothesized to influence individual economic and demographic decisions, it is unclear at
which geographic and temporal scales these operate. More so, the assumption that all
individuals are affected by degradation at the same geographic scale is a dubious one. For
lack of theoretical guidance multiple radii buffer zones were chosen somewhat arbitrarily
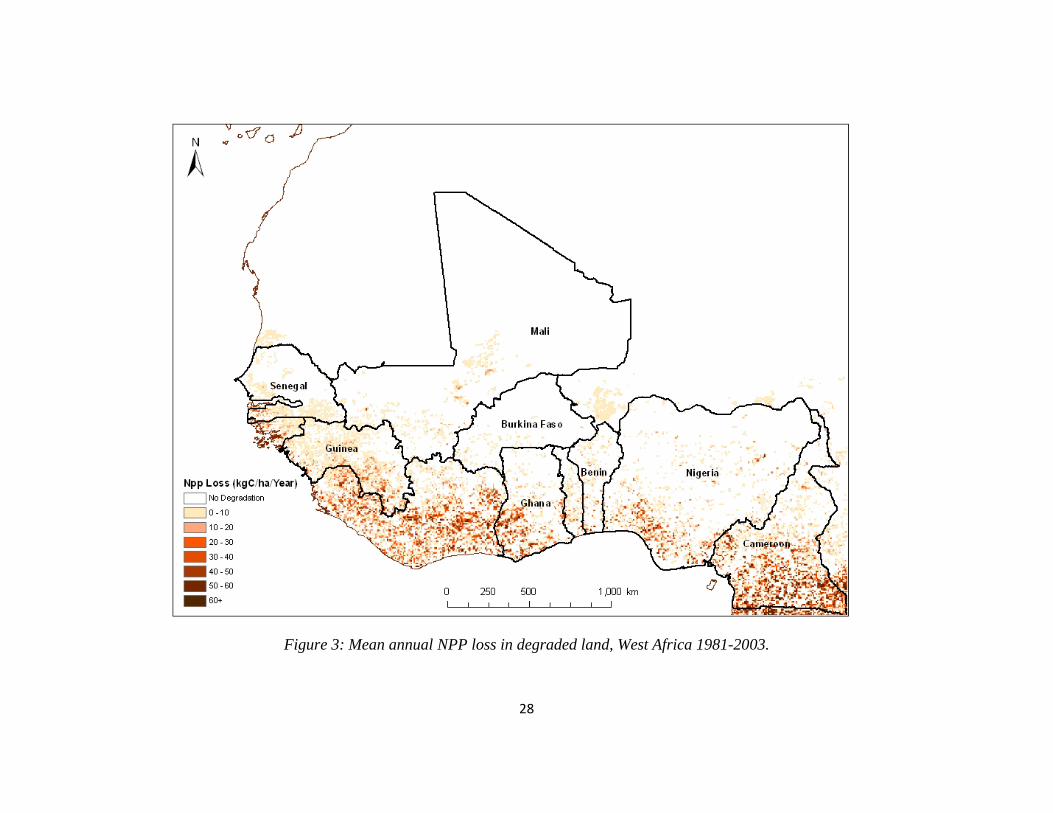
and according to limitations imposed by data resolution. The spatial distributions of key
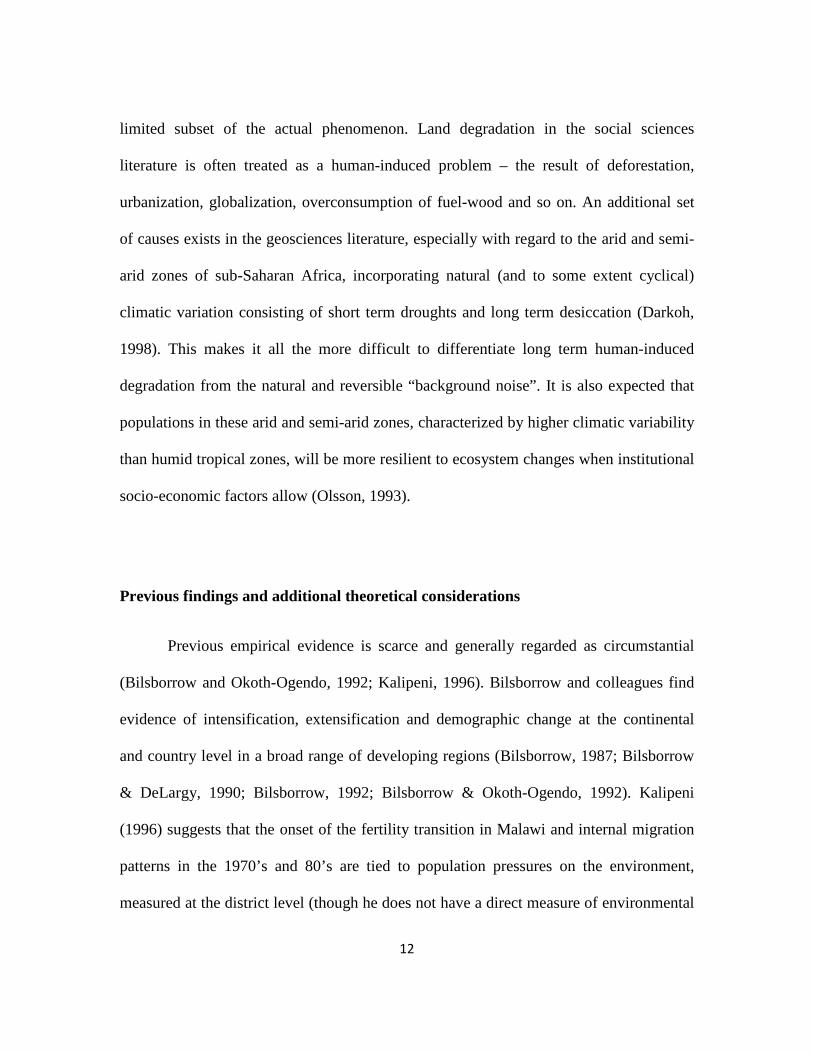
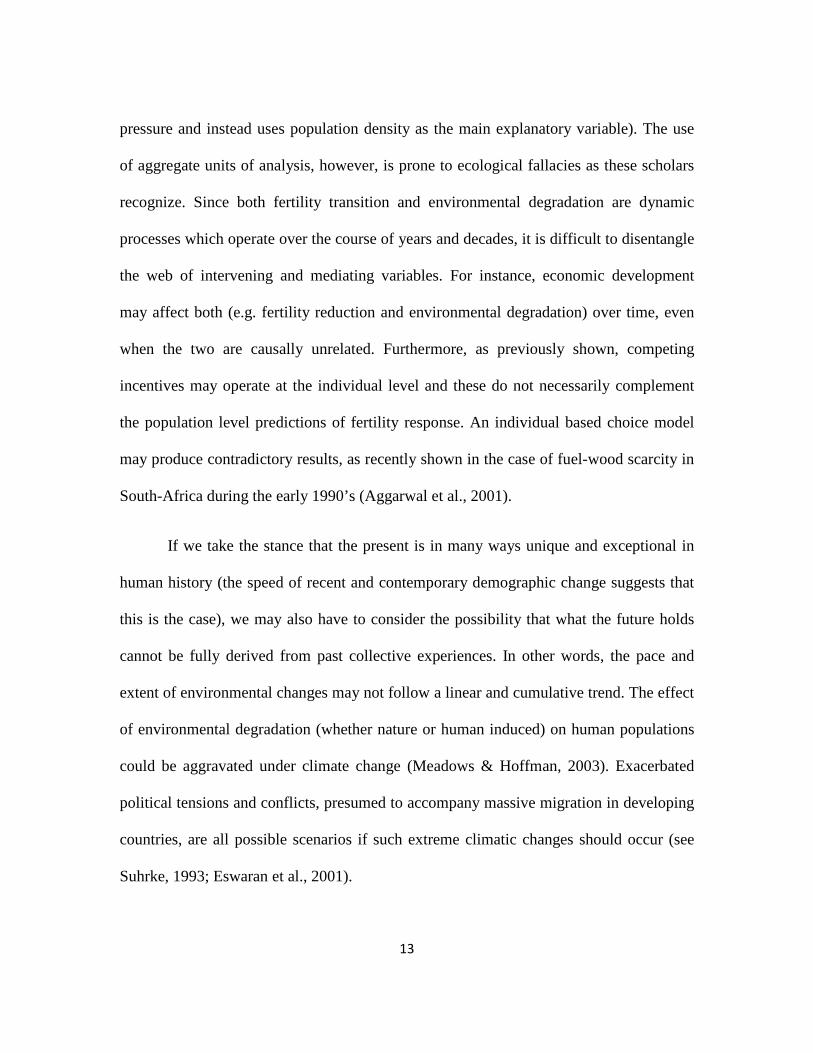
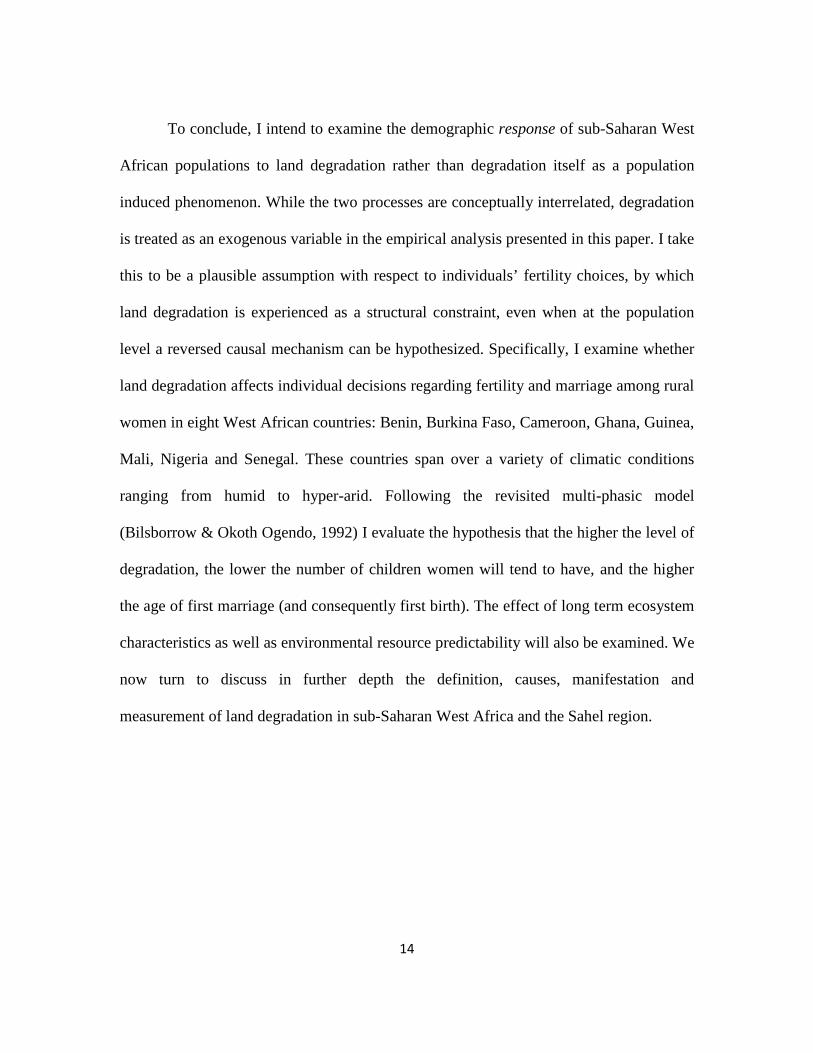
environmental variables and the locations of DHS sampling clusters are shown in figures
1-3.
25
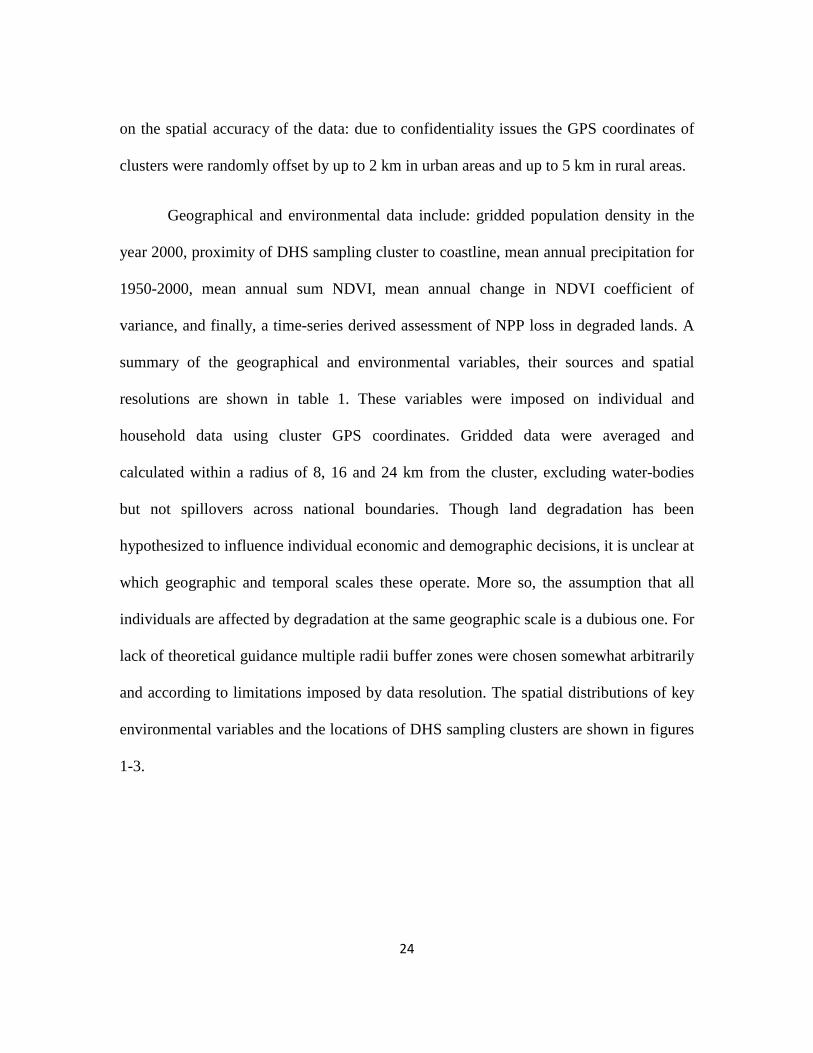
Table 1: Data sources and description of geographical and environmental variables
Variable Data Source Description/comments Resolution
Population density Gridded Population of the World, v. 3 (CIESIN)
Persons per square-km 2.5 minute
Proximity to coastline VMAP continental coastline data (FAO)
Euclidian distance to nearest point on coastline (calculated for each sampling cluster)
1 : 1,000,000
Mean annual precipitation WorldClim (Museum of Vertebrate Zoology, UC Berkeley)
Long term mean precipitation for 1950-2000, in mm
30 second
Mean annual sum NDVI Global Assessment of Land Degradation and Improvement (LADA, ISRIC & FAO)
Based on the GIMMS AVHRR NDVI time series 1981-2003, range 0-12
0.0727 degree (approximately 8 km at the equator)
% change in annual NDVI CoV Global Assessment of Land Degradation and Improvement (LADA, ISRIC & FAO)
Linear trend for 1981-2003, percentage change per year
0.0727 degree
NPP loss in degraded land Global Assessment of Land Degradation and Improvement (LADA, ISRIC & FAO)
Mean annual loss of NPP in kgC/ha/year, 1981-2003
0.0727 degree
Country and regional boundaries GADM 1.0 National and 1st level administrative regions, used for calculating aggregate measures
26
Figure 1: Mean annual precipitation, West Africa 1950-2000. White dots represent rural DHS sampling clusters.
27
Figure 2: Mean annual sum NDVI, West Africa 1981-2003. Grey dots represent rural DHS sampling clusters.
28
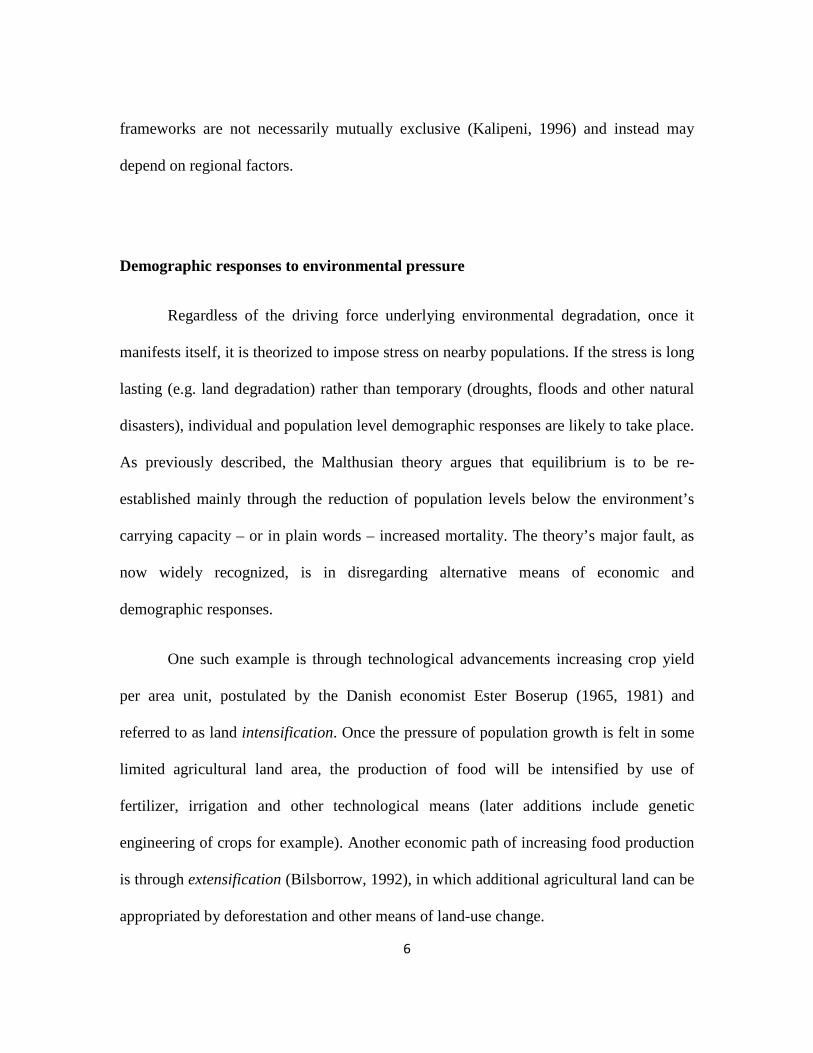
Figure 3: Mean annual NPP loss in degraded land, West Africa 1981-2003.
29
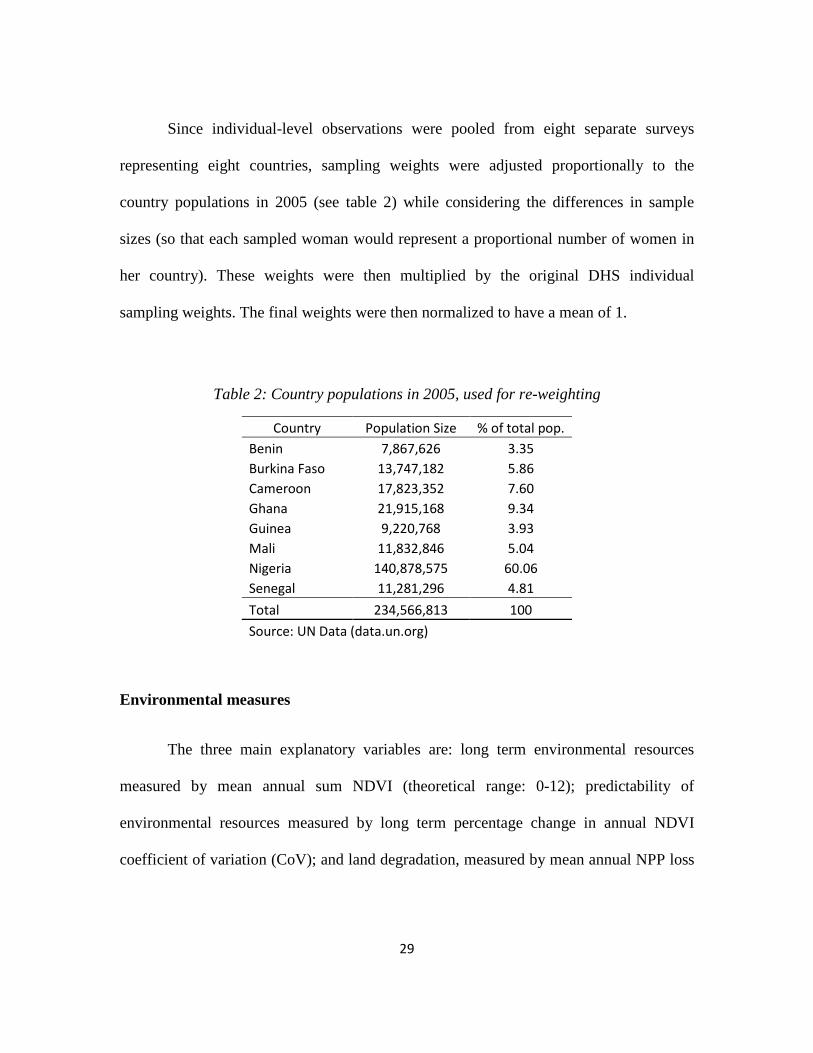
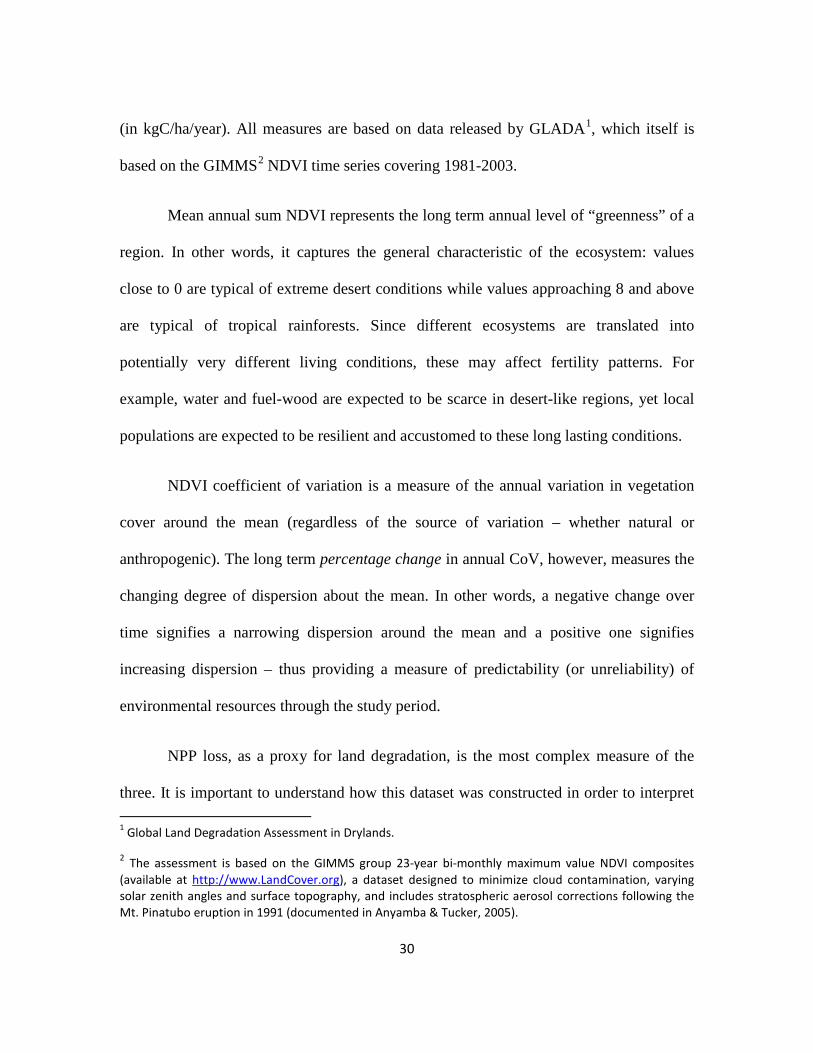
Since individual-level observations were pooled from eight separate surveys
representing eight countries, sampling weights were adjusted proportionally to the
country populations in 2005 (see table 2) while considering the differences in sample
sizes (so that each sampled woman would represent a proportional number of women in
her country). These weights were then multiplied by the original DHS individual
sampling weights. The final weights were then normalized to have a mean of 1.
Table 2: Country populations in 2005, used for re-weighting
Country Population Size % of total pop. Benin 7,867,626 3.35 Burkina Faso 13,747,182 5.86 Cameroon 17,823,352 7.60 Ghana 21,915,168 9.34 Guinea 9,220,768 3.93 Mali 11,832,846 5.04 Nigeria 140,878,575 60.06 Senegal 11,281,296 4.81
Total 234,566,813 100
Source: UN Data (data.un.org)
Environmental measures
The three main explanatory variables are: long term environmental resources
measured by mean annual sum NDVI (theoretical range: 0-12); predictability of
environmental resources measured by long term percentage change in annual NDVI
coefficient of variation (CoV); and land degradation, measured by mean annual NPP loss
30
(in kgC/ha/year). All measures are based on data released by GLADA1, which itself is
based on the GIMMS2
Mean annual sum NDVI represents the long term annual level of “greenness” of a
region. In other words, it captures the general characteristic of the ecosystem: values
close to 0 are typical of extreme desert conditions while values approaching 8 and above
are typical of tropical rainforests. Since different ecosystems are translated into
potentially very different living conditions, these may affect fertility patterns. For
example, water and fuel-wood are expected to be scarce in desert-like regions, yet local
populations are expected to be resilient and accustomed to these long lasting conditions.
NDVI time series covering 1981-2003.
NDVI coefficient of variation is a measure of the annual variation in vegetation
cover around the mean (regardless of the source of variation – whether natural or
anthropogenic). The long term percentage change in annual CoV, however, measures the
changing degree of dispersion about the mean. In other words, a negative change over
time signifies a narrowing dispersion around the mean and a positive one signifies
increasing dispersion – thus providing a measure of predictability (or unreliability) of
environmental resources through the study period.
NPP loss, as a proxy for land degradation, is the most complex measure of the
three. It is important to understand how this dataset was constructed in order to interpret 1 Global Land Degradation Assessment in Drylands.
2 The assessment is based on the GIMMS group 23-year bi-monthly maximum value NDVI composites (available at http://www.LandCover.org), a dataset designed to minimize cloud contamination, varying solar zenith angles and surface topography, and includes stratospheric aerosol corrections following the Mt. Pinatubo eruption in 1991 (documented in Anyamba & Tucker, 2005).
31
what it actually measures. The assumption underlying this estimate is that in areas where
net primary productivity is reliant on precipitation, a declining trend in rain-use
efficiency indicates land degradation. NDVI was integrated over each full-year period
and translated to NPP using MODIS data (based on the years when data from the two
sources overlap); urban areas and areas where declining productivity was attributed to
reduction in rainfall were masked; for the remaining areas where RUE declined or where
NDVI was negatively correlated with rainfall (i.e. areas believed to be irrigated) a trend
was calculated for NDVI. Ultimately, a negative trend indicates land degradation not
associated with rainfall decline. In the areas identified as degraded, NPP loss was
estimated in kg carbon per hectare per year (further details are available in Bai et al.,
2008). The main limitation of this dataset is the coarse resolution (approximately 8 km),
making it difficult to ascertain smaller scale degradation effects surrounding DHS
clusters.
While the first measure (mean annual sum NDVI) is a simple temporal
aggregation of vegetation cover, the latter two (NDVI CoV and NPP loss) are derived
from linear-trend models and as such should be considered with caution. Nonetheless,
these measures combined offer a fairly novel and independent assessment of
environmental resources and degradation compared to previous demographic literature.
32
Analysis
Multivariate linear and logistic models3
Control variables were grouped into 3 categories (or levels) and included
interchangeably in the models: individual characteristics, household characteristics, and
geographic characteristics at the cluster level. Individual characteristics included age (and
age-squared when the full range of ages was included), years of education, and parity.
Household level variables included a cumulative index of assets (electricity, radio,
were fitted to test the effects of long term
environmental resources, reliability of resources over time, and land degradation on
individual fertility and marital choices among rural women. Four dependent variables
were examined: age at first marriage, age at first birth, and probability of giving birth at
least once in the 12 and 60 months preceding the survey. Since degradation is measured
as a cumulative process over 23 years but individuals were sampled following the period
of degradation, women aged 27 and above were excluded from the analysis of age at first
marriage and first birth (as they were likely to have married prior to experiencing
significant degradation). Furthermore, as we are interested in the effects of exposure to
environmental conditions on individual choices, analyses of these two outcome variables
included only women who resided in the place in which they were surveyed at least one
year prior to marriage or first birth (the majority of which have been born there
themselves). The logistic models for probability of giving birth included all permanently
residing women, aged 15-49, who were married at some point in their lives.
3 All models were analyzed adjusting for sampling design.
33
television, refrigerator and phone), the type of floor, water source, and type of toilet.
Spatial and geographical variables included population density, mean annual
precipitation4
All models, even when not shown in the tables, included dummy variables for
countries (with Benin as the reference) to allow the intercepts to vary freely.
Conceptually, these were included for two reasons: the means of outcome variables are
expected to vary between countries; secondly, to accommodate the fact that surveys were
not conducted at the exact same time for all countries. The models were then iterated
using geographical and environmental data aggregated over 8, 16 and 24 km radii around
the sampling cluster in order to examine scale effects (for the sake of parsimony only
select results are shown in the next section). Finally, an aggregate level bivariate
association between land degradation and total fertility rate was plotted for comparison.
, and proximity to coastline which was previously suggested as a proxy for
economic development (Balk et al., 2004). See tables 3 and 4 for descriptive statistics and
a correlation matrix of key variables.
4 Precipitation was practically identical at all scales of aggregation (8, 16 and 24 km radii). This is partly due to the fact that the data was originally interpolated from an array of measurement stations (as well as aggregated temporally over 50 years), which has the effect of smoothing the data spatially. Conceptually, however, precipitation is unlikely to vary significantly at these geographic scales in any case.
34
Table 3: Descriptive statistics for rural women (aged 15-49), by country
Variable Type Benin Burkina
Faso Cameroon Ghana Guinea Mali Nigeria Senegal All Fertility outcomes Age at first marriage Mean 17.71 17.16 16.53 18.39 15.97 16.24 16.02 16.8 16.41 Age at first birth Mean 18.74 18.83 17.85 19.5 18.39 18.15 18 18.82 18.26 Gave birth in last 12 months % 22.45 22.29 20.43 18.44 22.03 27.34 22.06 21.35 22 Gave birth in last 60 months % 63.77 65.3 59.53 58.13 61.22 69.77 55.69 56.54 58.11 Individual controls Age Mean 28.84 29.21 28.32 29.88 30.44 29.57 27.97 27.89 28.45 Education (in years) Mean 0.99 0.45 3.53 4.32 0.58 0.45 3.84 0.96 3.08 Household controls Cumulative assets (0-5) Mean 0.91 0.7 0.81 1.14 0.7 0.8 1.36 1.56 1.2 Floor type Natural % 51.69 71.7 76.97 19.54 72.13 93.68 45.44 50.28 51.29 Finished % 48.04 28.28 22.49 80.46 27.86 6.16 54.43 49.55 48.57 Other % 0.27 0.02 0.54 0 0.01 0.16 0.13 0.17 0.14 Water source Piped water % 30.81 4.04 11.94 10.86 3.37 18.01 8.46 44.37 10.9 Well % 46.46 79.31 47.82 56.95 58.03 74.85 56.14 53.61 58.2 Surface water % 14.93 16.35 39.71 31.29 38.57 6.9 29.36 1.72 26.71 Other % 7.8 0.3 0.53 0.9 0.03 0.24 6.04 0.3 4.19 Toilet type Flush % 0.36 0.5 0.83 2.11 0.62 3.4 6.82 16.61 5.4 Pit % 15.75 16.5 85.88 62.96 60.74 69.03 61.59 49.94 58.15 None % 83.1 82.88 12.8 34.92 38.63 27.39 31.46 33.21 36.3 Other % 0.79 0.12 0.49 0.01 0.01 0.18 0.13 0.24 0.15
35
(Table 3 continued) Spatial/geographic controls Population density (8 km) Mean 249.98 65.1 82.11 157.67 47.38 40.07 400.81 115.67 289.52 Population density (16 km) Mean 213.36 64.87 83.05 167.27 45.27 38.99 329.29 113.16 243.99 Population density (24 km) Mean 206.92 62.88 80.11 164.03 44.26 39.43 298.55 103.21 223.43 Distance to coastline, km Mean 196.43 780.67 487.7 223.92 227.25 822.1 475.33 101.97 465.23
Mean annual precipitation, mm Mean 1100.45 761.72 1526.9 1278.39 2054.64 749.72 1368.96 607.43 1283.47
Environmental determinants (8 km radius) Mean annual sum NDVI (0-12) Mean 4.91 3.58 5.18 5.19 6.06 3.57 3.95 2.94 4.14 % annual change in CoV NDVI Mean -0.79 0.34 -0.47 -0.91 -0.74 -0.08 -0.56 0.24 -0.48
NPP loss in degraded land, kgC/ha/year Mean 1.91 0.11 4.21 6.56 3.5 0.45 1.67 0.97 2.06
Environmental determinants (16 km radius) Mean annual sum NDVI (0-12) Mean 4.98 3.59 5.17 5.18 6.13 3.58 4 3 4.18 % annual change in CoV NDVI Mean -0.83 0.36 -0.51 -0.93 -0.73 -0.08 -0.55 0.19 -0.47
NPP loss in degraded land, kgC/ha/year Mean 2.31 0.13 4.39 5.9 3.96 0.44 1.54 0.89 1.97
Environmental determinants (24 km radius) Mean annual sum NDVI (0-12) Mean 5 3.6 5.18 5.18 6.12 3.6 4.03 3.03 4.21 % annual change in CoV NDVI Mean -0.83 0.35 -0.51 -0.93 -0.72 -0.09 -0.57 0.22 -0.49
NPP loss in degraded land, kgC/ha/year Mean 2.29 0.13 4.44 5.8 3.95 0.4 1.52 0.9 1.94
Year of survey 2001 2003 2004 2003 2005 2001 2003 2005 2001-05 Number of clusters 129 310 222 238 195 273 196 218 1,781 Maximum sample size 3,735 9,308 5,020 3,267 5,465 9,189 4,457 8,071 48,512
36
Table 4: Correlation matrix of key variables for rural women (aged 15-49)
37
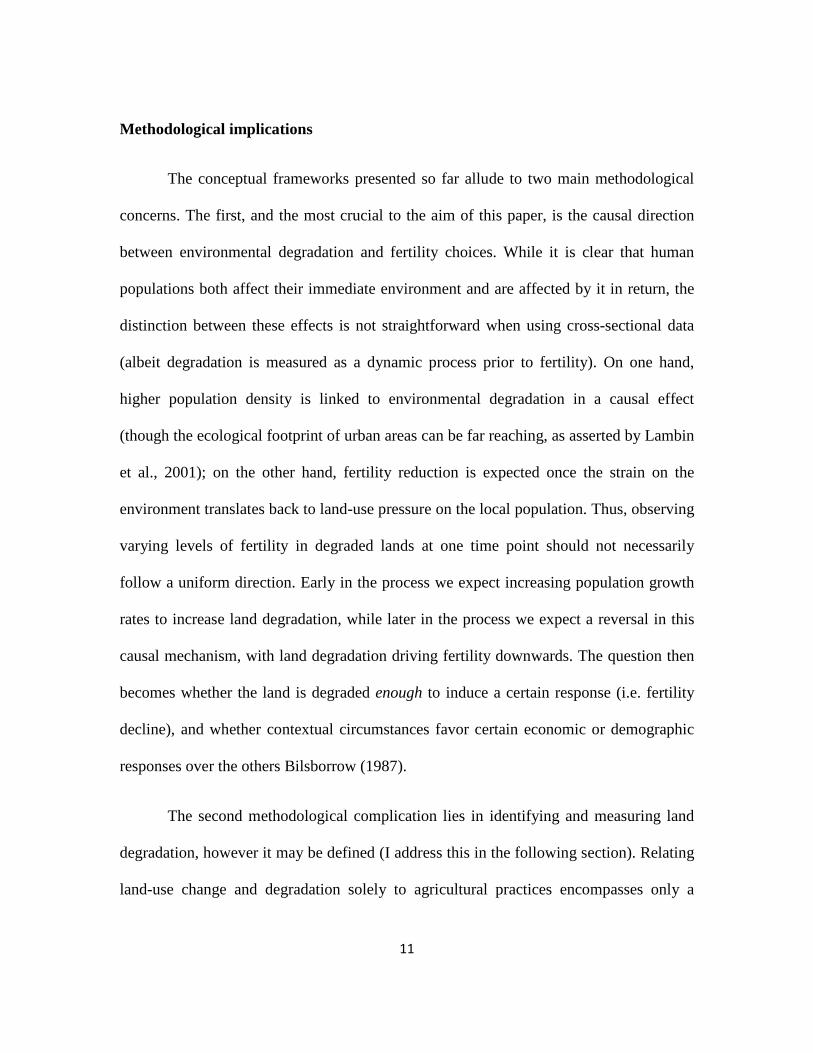
Chapter 5: Results
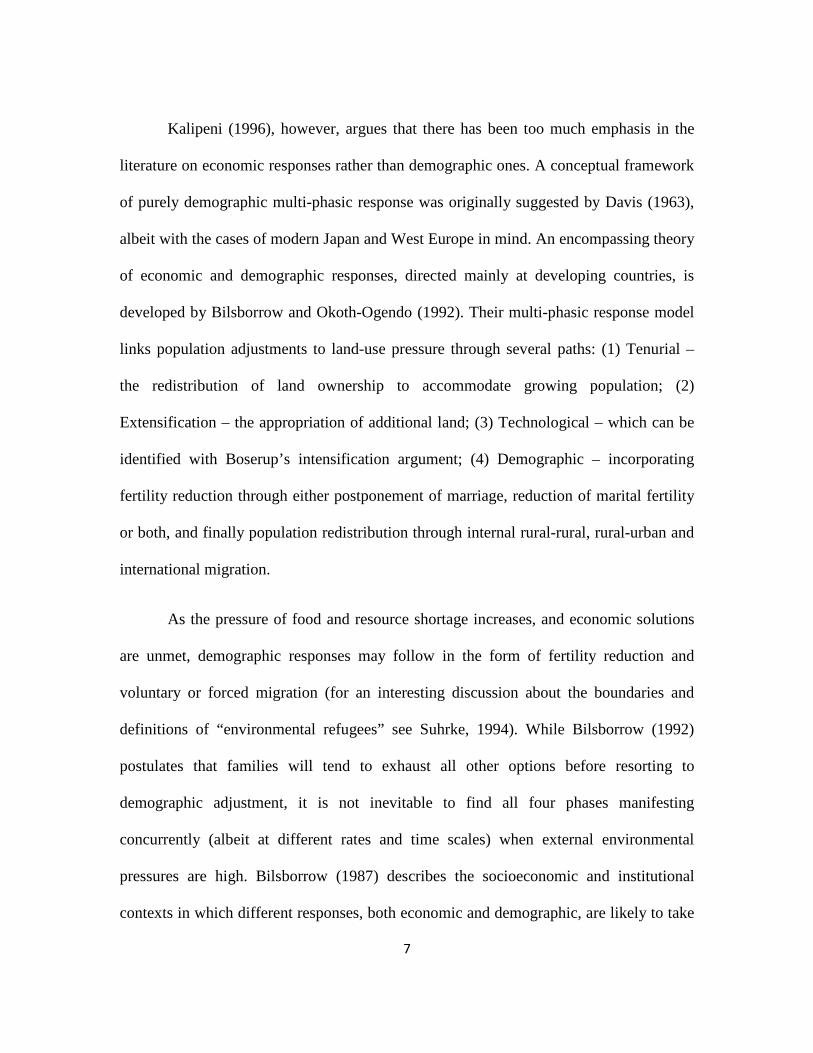
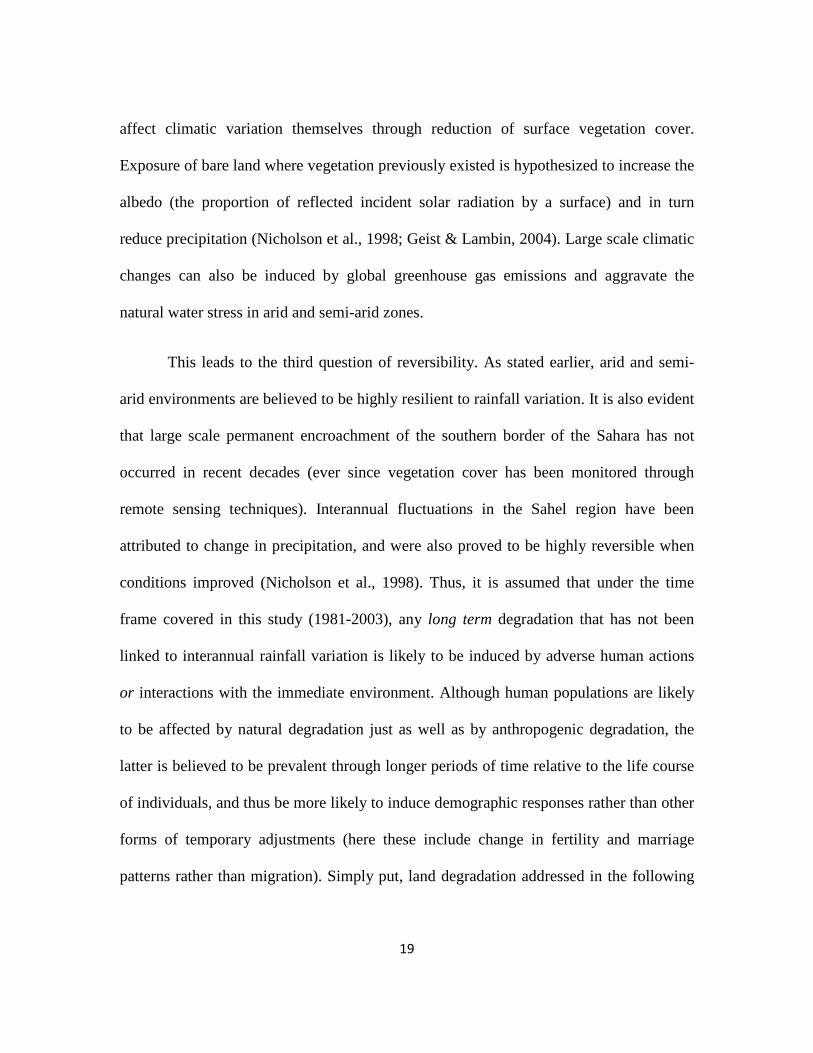
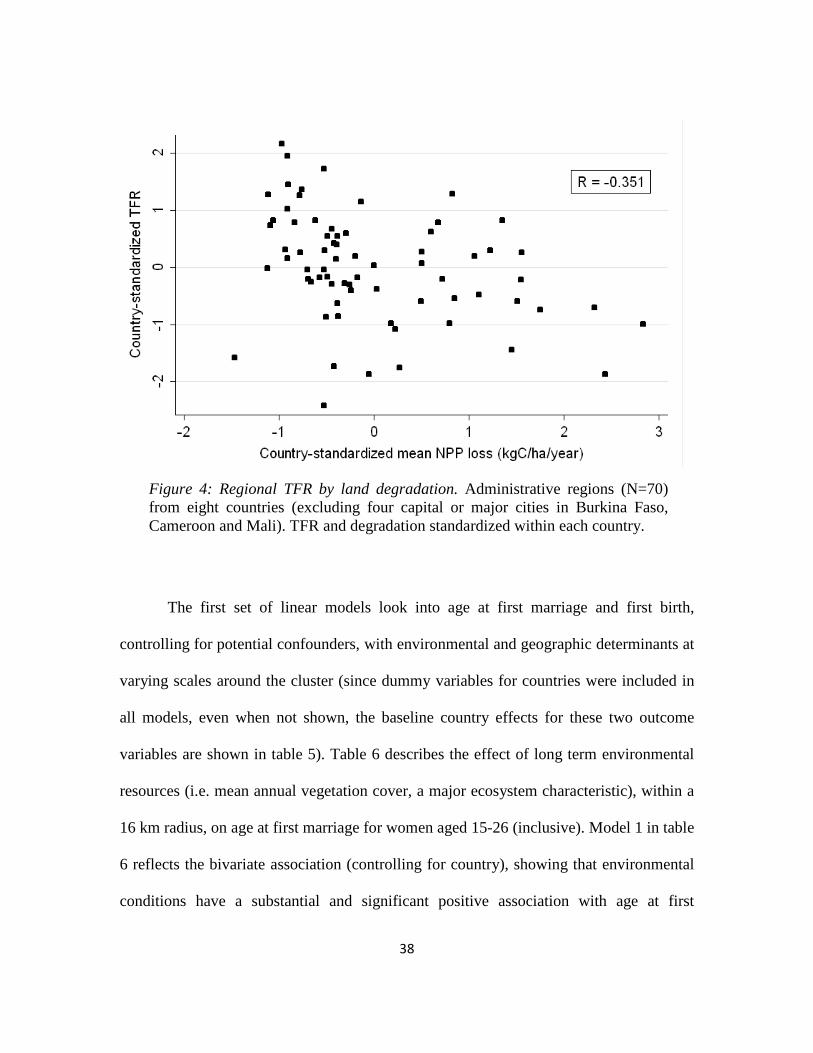
In most previous literature evidence of demographic responses to environmental
conditions typically relies on aggregate units of analysis. For that reason it is best to start
with a simple bivariate association between the main explanatory variable – land
degradation measured by NPP loss – and an aggregate measure of fertility – total fertility
rate (TFR) – measured at the regional level5
5 Regional TFR scores were taken from the DHS final reports corresponding to the 8 surveys used in this study. These scores were based on births in the 3 years preceding each survey.
. Since countries are expected to differ by
their mean TFR and relative level of degradation for various reasons, these variables were
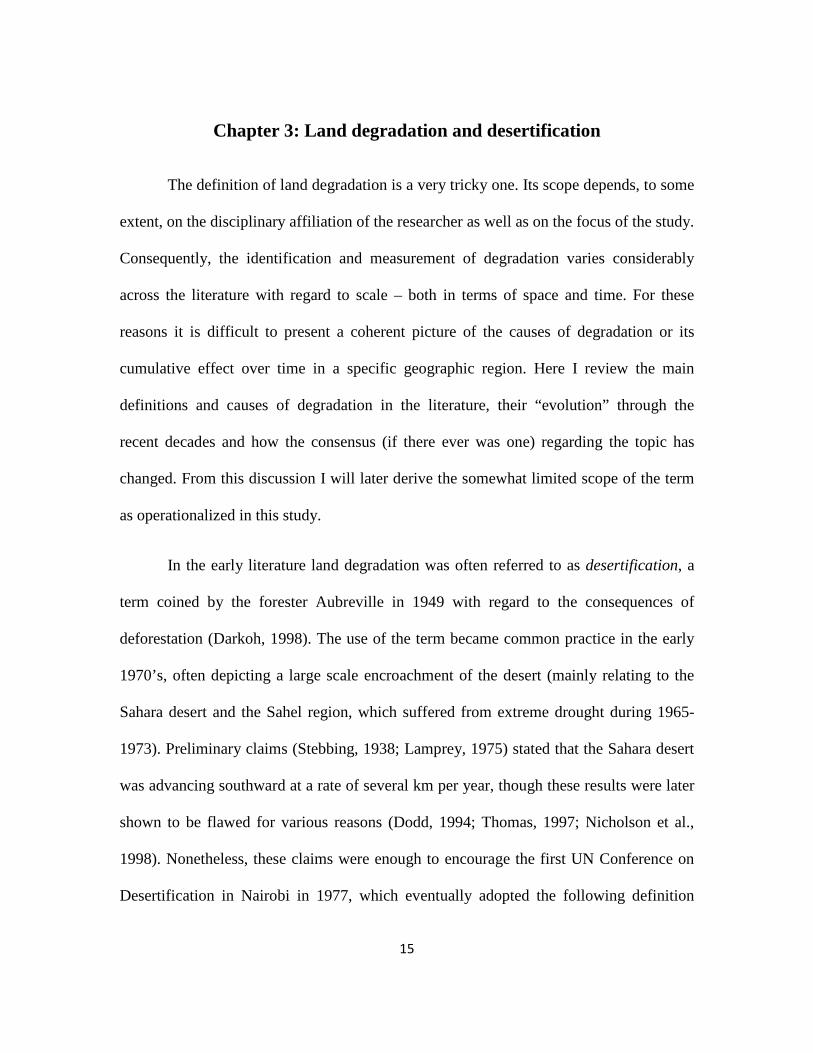
standardized at the country level to produce figure 4. There is a clear negative association
between the two variables as hypothesized by the multi-phasic response model: regions
with higher level of degradation tend to have lower fertility rates (R = -0.351; in the
unstandardized form R = -0.505). However, these tentative results are potentially
confounded by various intervening mechanisms at several geographic (and temporal)
scales, making causal inference through aggregate data highly problematic. It is not at all
clear that lower fertility in degraded regions is directly driven by individual fertility
choices as a response to land degradation (or long term resource unreliability). In order to
avoid the ecological fallacy, individual level models of fertility choices are tested,
including potential confounders operating at 3 scales: individual characteristics,
household characteristics, and general geographic characteristics of the place of
residence.
38
Figure 4: Regional TFR by land degradation. Administrative regions (N=70) from eight countries (excluding four capital or major cities in Burkina Faso, Cameroon and Mali). TFR and degradation standardized within each country.
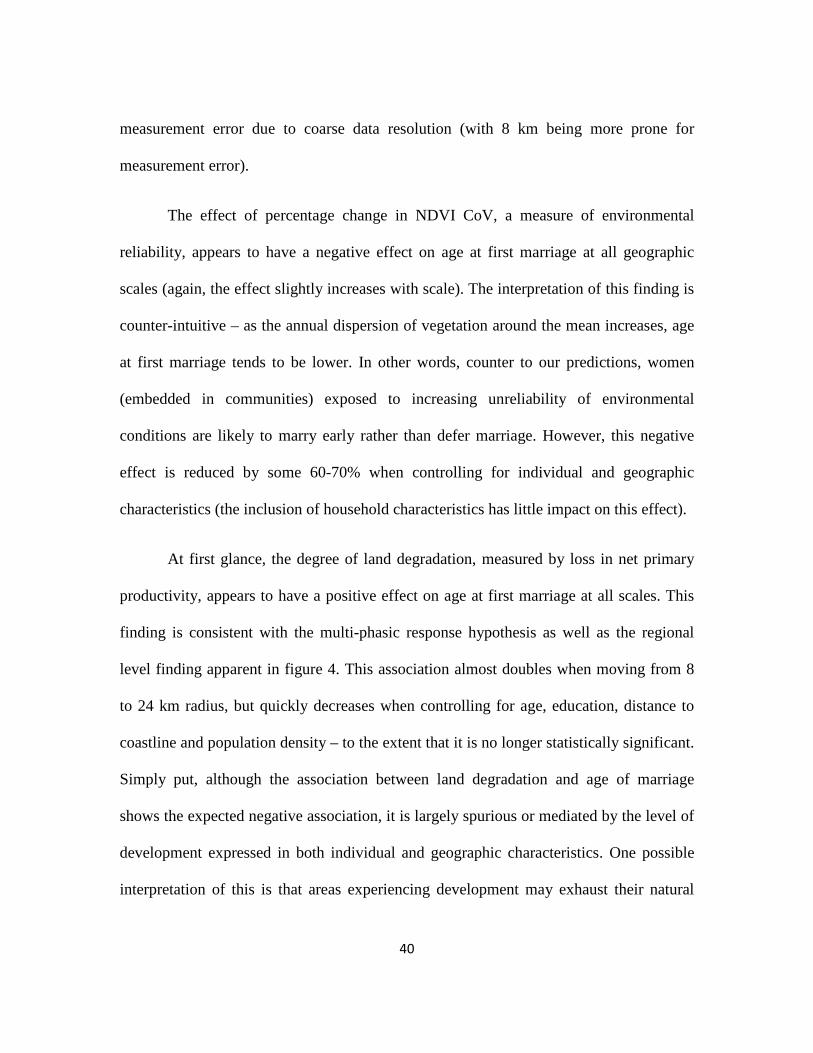
The first set of linear models look into age at first marriage and first birth,
controlling for potential confounders, with environmental and geographic determinants at
varying scales around the cluster (since dummy variables for countries were included in
all models, even when not shown, the baseline country effects for these two outcome
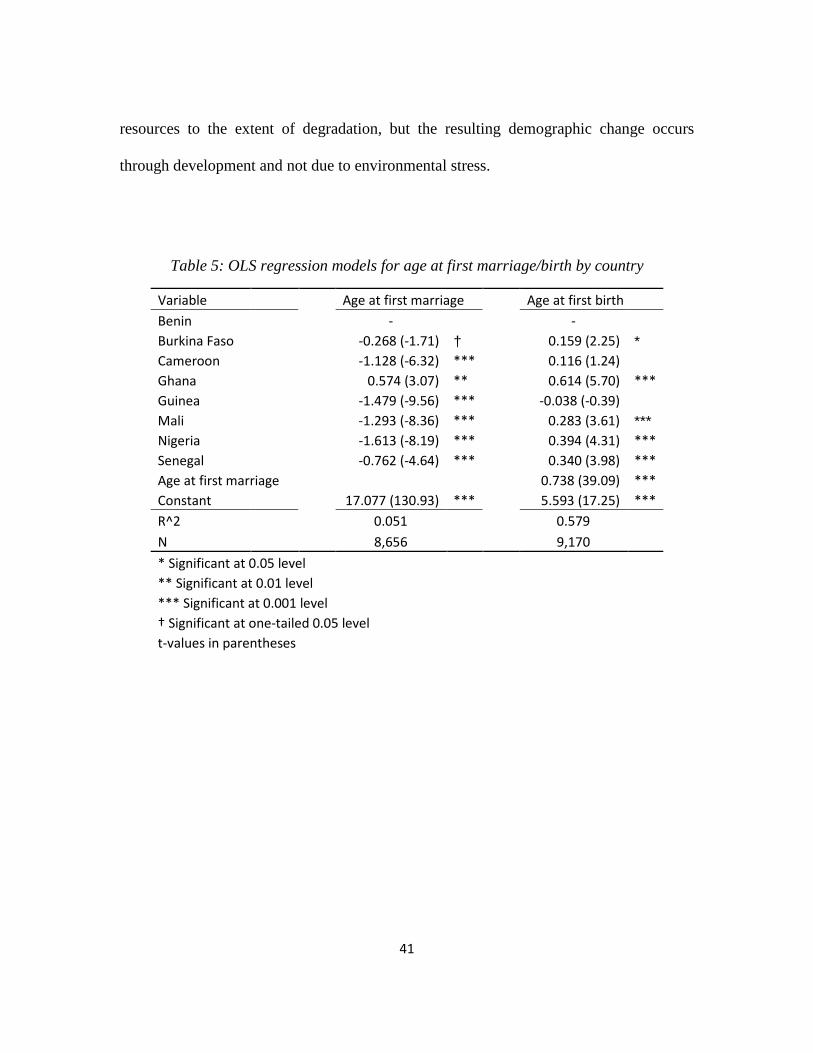
variables are shown in table 5). Table 6 describes the effect of long term environmental
resources (i.e. mean annual vegetation cover, a major ecosystem characteristic), within a
16 km radius, on age at first marriage for women aged 15-26 (inclusive). Model 1 in table
6 reflects the bivariate association (controlling for country), showing that environmental
conditions have a substantial and significant positive association with age at first
39
marriage. Model 2 shows that this association diminishes almost by half when controlling
for individual characteristics (age, education), but remains unchanged in model 3, when
including household characteristics: assets, floor type, water source and toilet type. Some
of these household characteristics, however, reflect also on the general level of
development in the place of residence (as they may depend on general infrastructure such
as electricity, piped water etc.). Finally, model 4 introduces two geographic
characteristics: distance to coastline and population density. In the study region
vegetation tends to increase when moving away from the Sahara and approaching the
coastline, and so does population density. These are believed to be proxies for economic
development (indeed most capitals and large cities in these countries are located close the
coastline) and seem to decrease the effect of vegetation cover on age at first marriage
even further, though it remains highly statistically significant. Interestingly enough, the
effect of population density is not statistically significant and nor is its interaction with
mean annual NDVI (not shown in the table).
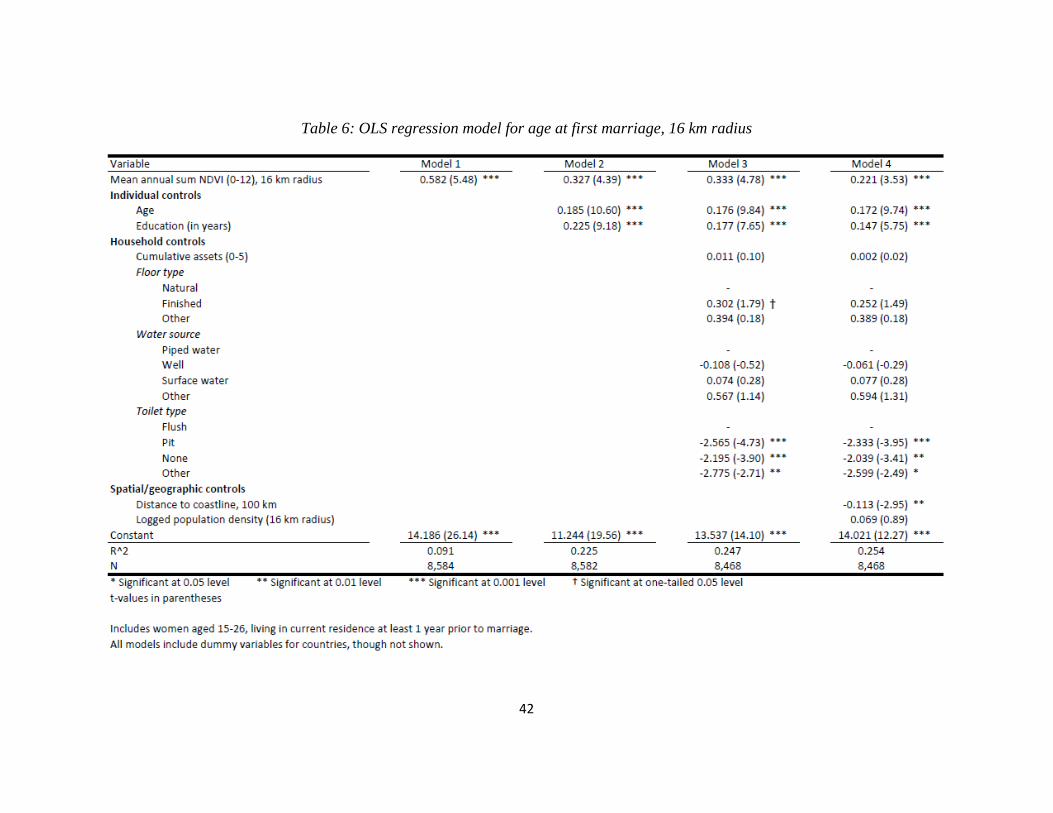
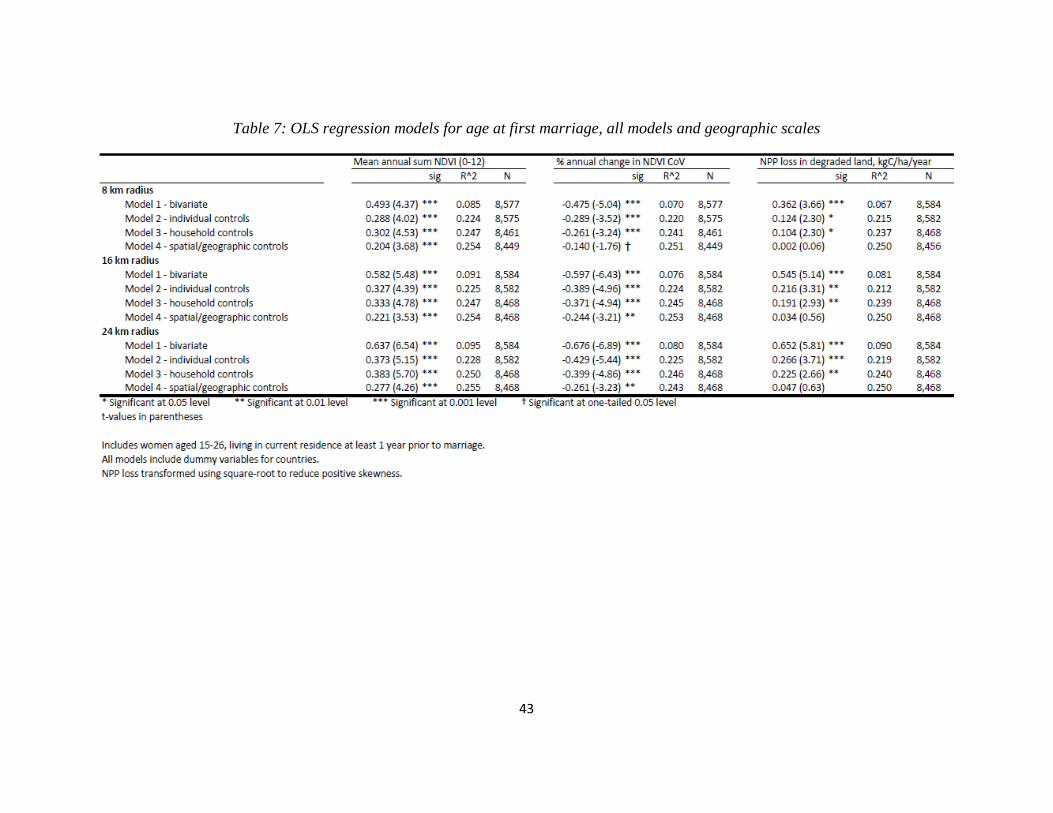
This sequence of additive models was repeated, with the same groupings of
control variables, for the three main environmental determinants – mean annual sum
NDVI, annual % change in NDVI CoV, and NPP loss – and for the 3 spatial scales (8, 16
and 24 km radii). Results for these key variables are summarized in table 7 (full models
are not shown to save space). The effect of long term vegetation cover seems to show the
same pattern, as seen in table 6, across all scales. It is also evident that the effect becomes
stronger with scale, though this is not readily interpretable and may be an artifact of
40
measurement error due to coarse data resolution (with 8 km being more prone for
measurement error).
The effect of percentage change in NDVI CoV, a measure of environmental
reliability, appears to have a negative effect on age at first marriage at all geographic
scales (again, the effect slightly increases with scale). The interpretation of this finding is
counter-intuitive – as the annual dispersion of vegetation around the mean increases, age
at first marriage tends to be lower. In other words, counter to our predictions, women
(embedded in communities) exposed to increasing unreliability of environmental
conditions are likely to marry early rather than defer marriage. However, this negative
effect is reduced by some 60-70% when controlling for individual and geographic
characteristics (the inclusion of household characteristics has little impact on this effect).
At first glance, the degree of land degradation, measured by loss in net primary
productivity, appears to have a positive effect on age at first marriage at all scales. This
finding is consistent with the multi-phasic response hypothesis as well as the regional
level finding apparent in figure 4. This association almost doubles when moving from 8
to 24 km radius, but quickly decreases when controlling for age, education, distance to
coastline and population density – to the extent that it is no longer statistically significant.
Simply put, although the association between land degradation and age of marriage
shows the expected negative association, it is largely spurious or mediated by the level of
development expressed in both individual and geographic characteristics. One possible
interpretation of this is that areas experiencing development may exhaust their natural
41
resources to the extent of degradation, but the resulting demographic change occurs
through development and not due to environmental stress.
Table 5: OLS regression models for age at first marriage/birth by country
Variable Age at first marriage Age at first birth Benin - - Burkina Faso -0.268 (-1.71) † 0.159 (2.25) * Cameroon -1.128 (-6.32) *** 0.116 (1.24) Ghana 0.574 (3.07) ** 0.614 (5.70) *** Guinea -1.479 (-9.56) *** -0.038 (-0.39) Mali -1.293 (-8.36) *** 0.283 (3.61) *** Nigeria -1.613 (-8.19) *** 0.394 (4.31) *** Senegal -0.762 (-4.64) *** 0.340 (3.98) *** Age at first marriage 0.738 (39.09) *** Constant 17.077 (130.93) *** 5.593 (17.25) *** R^2 0.051 0.579 N 8,656 9,170
* Significant at 0.05 level ** Significant at 0.01 level *** Significant at 0.001 level † Significant at one-tailed 0.05 level t-values in parentheses
42
Table 6: OLS regression model for age at first marriage, 16 km radius
43
Table 7: OLS regression models for age at first marriage, all models and geographic scales
44
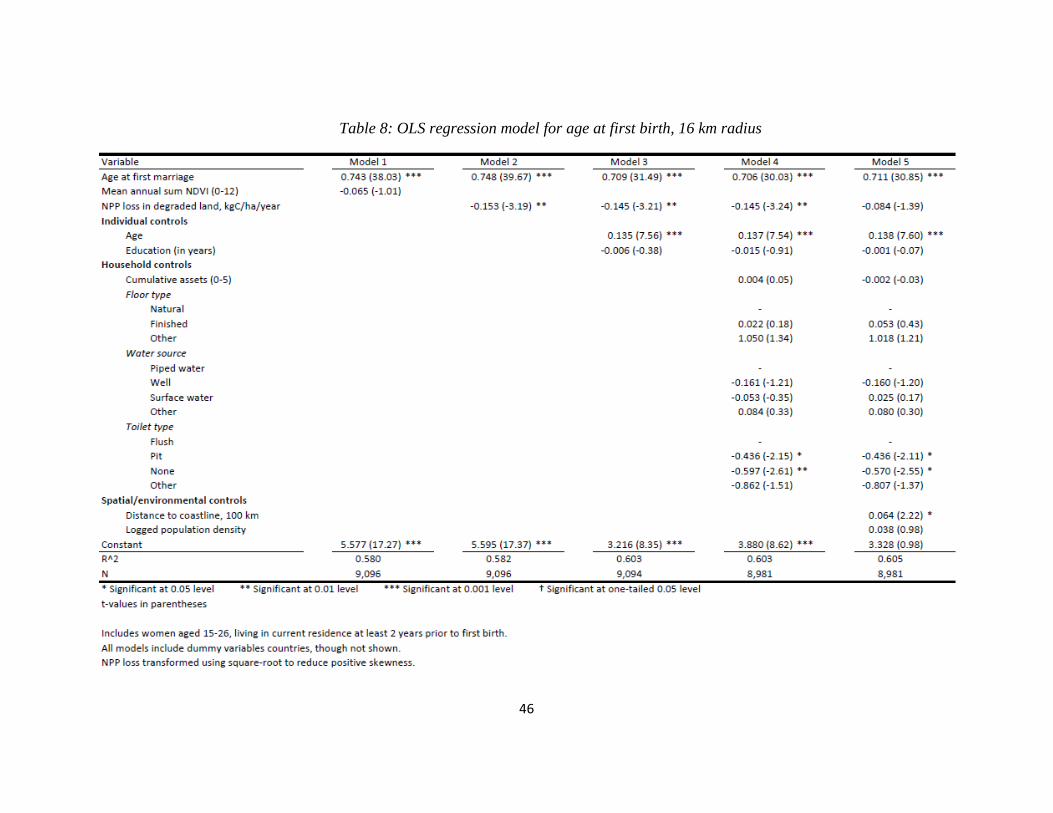
A similar set of models was used for the outcome variable of age at first birth,
with the exception of including age at first marriage as an additional regressor. This
allows estimating the effects of environmental determinants on age at first birth,
unaccounted by deferral of marriage (already tested in the previous set of models). Table
8 describes select results at 16 km radius. Since the effect of long term vegetation cover
is already non-significant (model 1) this path is not followed. Models 2 through 5
describe the usual additive sequence of control variables with land degradation being the
primary explanatory variable. The effect of land degradation, controlling for age at first
marriage, is surprisingly negative, stable and statistically significant in all models except
when including geographic covariates. The direction of this association does not support
the multi-phasic response hypothesis and model 4 suggests that the effect of land
degradation is at least partially spurious or mediated by geographic location.
The models discussed thus far do not measure fertility directly, but rather factors
related to fertility schedules which in turn may affect life-long fertility outcomes. In order
to address the actual decision process of having a child logistic regression models were
used to estimate the probability of giving birth at least once in the 12 and 60 months
preceding the surveys (tables 9 and 10 respectively). In these analyses women at all ages
(15-49) were included. Only models at 24 km radius are presented as these typically had
the largest effects of environmental determinants on outcome variables.
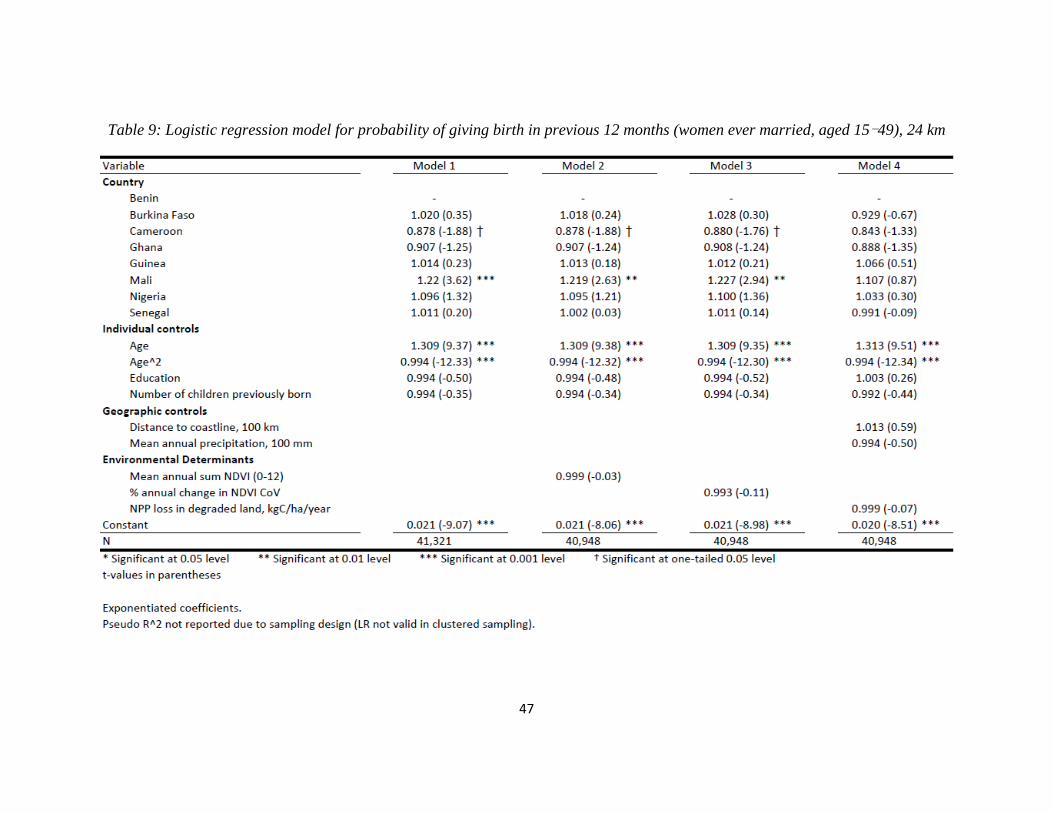
Table 9 describes 4 models of the probability of giving birth in the course of one
year preceding the survey. Model 1 includes the baseline covariates without
45
environmental determinants: dummy variables for each country (Benin as reference), age,
years of education, and parity. A quadratic term for age is also included since the full
range of ages is analyzed – it is expected that age increases the probability of giving birth
up to a certain peak, then the probability decreases going into older ages. Model 2 and 3
add to the baseline model mean annual NDVI and % change in NDVI CoV respectively.
Model 4 adds NPP loss to the baseline model as well as two additional covariates:
distance to coastline and long term mean annual precipitation. These are included as
control variables in the 4th model since the study region typically becomes more arid
when moving north from the coastline towards the Sahara, and the ideal is to compare the
effect of degradation between similar climatic regions but varying degrees of
degradation. In other words, there is no degradation north of the Sahel simply because it
is already a desert. In all models the effects of environmental determinants are negative,
but extremely small and non-significant6
The same analysis is repeated with the probability of giving birth at least once in
the previous 5 years as the outcome variable (table 10). The effect of mean annual NDVI
becomes slightly positive while the effects of percentage change in NDVI CoV and NPP
loss are still negative. Although the effects of all three environmental variables seem
larger than apparent in table 9, these results are still statistically insignificant.
.
6 Pseudo-R2 is not reported for any of the logistic models presented here since in its generalized form R2 is calculated using the likelihood ratio statistic, which is not valid under a clustered sampling design.
46
Table 8: OLS regression model for age at first birth, 16 km radius
47
Table 9: Logistic regression model for probability of giving birth in previous 12 months (women ever married, aged 15-49), 24 km
48
Table 10: Logistic regression model for probability of giving birth in previous 60 months (women ever married, aged 15-49), 24 km
49
Chapter 6: Discussion
Environmental stress, whether in the form of long term ecosystem characteristics
or in the form of a dynamic degradation processes, is hypothesized to induce economic
and demographic adaptations and responses. These pressures are expected to be more
pronounced and localized in developing countries than in developed ones, as the former
typically suffer from limited material, political and social infrastructure needed for
allocation and distribution of scarce resources. While individuals and communities are
expected to be adapted and resilient to long term environmental conditions (Olsson,
1993), they may be largely affected by (relatively) irreversible negative changes to their
immediate environments. Classic demographic theory anticipates that environmental
pressures, expressed as resource scarcity (crops, fuel-wood, etc.), will decrease the
carrying capacity of the land for human population. Once the carrying capacity is lower
equilibrium may be achieved either by fertility reduction or increased mortality. More
nuanced theories suggest that adaptation to environmental stress is not limited to fertility
and mortality responses, but may include economic adaptations as well as voluntary and
forced migration. Furthermore, fertility reduction itself may be achieved in several ways:
change in exposure to marriage (e.g. postponement), contraceptive use, change in
frequency of sexual intercourse (due to labor migration), or a combination of these
factors and others. On the other hand, micro-economic theory suggests the existence of
contradicting incentives for decreasing or increasing fertility under scarcity of
environmental resources. These are further bounded by social norms and contexts related
to gender equality, division of labor, land tenure practices and more.
50
This study in particular has focused on fertility responses to environmental
conditions: (a) long term mean vegetation as an ecosystem characteristic; and (b)
dynamic processes over a 23-years period. Dynamic processes have included the change
in resource reliability measured by change in annual dispersion of vegetation around the
annual mean (either naturally or anthropogenically induced), and land degradation
believed to be largely anthropogenic (or some combination of natural and anthropogenic
factors). Several aspects of fertility-related decisions are examined at the individual level:
deferral of marriage or first birth, and likelihood of giving additional births under varying
degrees of environmental pressures. The research method presented here is innovative
within the related subset of demographic literature in two ways: (1) using external
measures of environmental resources and land degradation based on remotely sensed
data; (2) focusing on individual level data rather than on aggregate units of analysis in
order to avoid ecological fallacy.
Findings consistently show that the effects of all three environmental
determinants (long term vegetation, reliability over time, land degradation) on outcome
variables are significantly diminished when accounting for individual and geographic
characteristics, but not as much for household characteristics. While this method of
“adding control variables until the main effects become statistically insignificant” is not
in the least statistically conservative, it does reflect on the existence of confounding or
intervening factors. This is in contrast to the relatively large negative association between
total fertility rate and land degradation found in aggregate units of analysis such as
regions. Simply put, demographic transitions occur through individual responses – and
51
these are the units of analysis we should focus on, especially when modeling historically
unique dynamic processes.
Looking at long term vegetation cover we see that the effect on outcome variables
is not consistent. With regard to deferral of marriage it is positive and significant, but not
so with regard to other outcome variables. This positive association does not necessarily
reflect a causal relationship between environmental resources and age at first marriage
(i.e. that women tend to postpone marriage when vegetation is abundant). It is more
likely to be a result of historical events related to the spatial distribution of different
populations whose characteristics were omitted from the models. Religious, ethnic and
cultural characteristics, as well as colonial histories, are likely to influence many of the
outcome and explanatory variables addressed here. These factors are not easily
incorporated into a cross-national analysis.
The effect of decreasing environmental predictability is less consistent across
outcome variables and is generally statistically insignificant. Interestingly enough, it
tends to be negatively associated with outcome variables, suggesting that increasing
environmental uncertainty may actually be associated with fertility increase rather than
reduction (again, this finding is largely statistically insignificant).
Results regarding the effect of land degradation on nuptiality and fertility
generally seem to lean towards the multi-phasic response model predictions (e.g. marital
postponement, fertility reduction) and not towards those of micro-economic theory.
However, these effects greatly diminish (to the extent of statistical non-significance) once
52
individual characteristics – and more importantly geographic characteristics – are
accounted for. Climate and proximity to coastline are highly correlated with degradation,
the latter of which may have both environmental and social interrelations with
degradation: it is both a predictor of climate and of economic development. Nonetheless,
this suggests that at least part of the circumstantial evidence linking fertility transition to
environmental pressures found in the literature may be spurious where development is
leading both degradation and a demographic transition. Granted, the underlying
conditions and mechanisms involved may be fundamentally different in other areas such
as South-America and even in other parts of sub-Saharan Africa – among those are the
extent and severity of degradation and the social context mediating economic and
demographic responses.
Interestingly, scale effects are apparent throughout the analyses presented above.
Generally, the larger the geographic scale within which environmental determinants are
measured the larger the effect on fertility outcome. This may indicate that the
geographical extent of environmental conditions is a strong factor in demographic
responses – for example, where degradation is a wide spread phenomenon it becomes
harder to utilize other economic and demographic responses such as extensification or
migration. The theory is underdeveloped with regard to the geographic scales at which
certain responses operate and others are inhibited. Alternatively, scale effects may
potentially be attributed to measurement error due to the coarse spatial resolution of
environmental data. Small scales include very few data points and are less centered about
the sampling cluster (the coordinates of which include some component of random error
53
by construction). Spatial aggregation over larger geographic scales utilizes more data
points while at the same time smoothing their values, resulting in attenuation of
extremely localized conditions7
Ultimately this study examines only responses related to fertility using limited
measures of environmental degradation, albeit with greater detail than previously
available. While it finds little evidence of change in fertility trends driven by
environmental factors, other economic and demographic responses may be operating
according to the multi-phasic response model – namely intensification, extensification
and labor or permanent migration. As Bilsborrow (1992) postulates, these are likely to
take precedence over fertility reduction. Since this paper focuses on women that have
been residing within the same rural settlement for some years prior to the survey, it
necessarily misses those rural women who have been recently displaced as well as those
who migrated to urban areas. Both internal and international migration may play a key
role here, yet migration data at the individual level is not as readily available as for
fertility.
.
7 Additional data limitations apply: the data used to measure degradation suffers from poor spatial resolution and is based on a temporal linear trend. These factors introduce measurement error that may cause further attenuation of coefficient estimates, underestimating the real effect of degradation on fertility.
54
Conclusion
Results in this paper consistently show little to no effect of environmental
determinants, particularly long-term land degradation, on a set of fertility related
outcomes in 8 countries in sub-Saharan West Africa. While the hypothesized negative
association between fertility and land degradation is evident at the regional scale, this
effect diminishes greatly when examined at smaller scales and after accounting for
individual, climatic and geographic characteristics. Despite data limitations, this potential
gap between individual level effects and circumstantial aggregate level results (often
discussed in the literature) calls for a more nuanced theory. The complex relationship
between environmental degradation and demographic transition is not necessarily
straightforward and directly causal, but instead one that runs through development (which
may or may not be sustainable in the long term). Questions that need to be addressed,
both theoretically and empirically, are at which spatial and temporal scales environmental
pressures induce certain types of demographic responses. Since individuals are also likely
to utilize response paths other than fertility reduction according to the revisited multi-
phasic response model (Bilsborrow & Okoth-Ogendo, 1992), aspects such as
urbanization and internal and international migration should be examined as well with
finer detail. Recent technological advancements such as remote sensing and GPS offer
increasingly better ways to answer such questions without the pitfalls of ecological
fallacy. Ultimately, if a gap in empirical findings between the micro and macro units of
analysis indeed exists, the causal mechanisms in population-environment dynamics may
require respecification as to the scales and modes of operation. Assumptions about the

55
locality of environmental resources and their effects on individual behavior may need to
be revisited accordingly.
56
References
Aggarwal, R., Netanyahu, S. and Romano, C., 2001. “Access to natural resources and the
fertility decision of women: the case of South Africa”. Environment and
Development Economics, Vol. 6, pp. 209-236.
Anyamba, A. and Tucker C. J., 2005. “Analysis of Sahelian vegetation dynamics using
NOAA-AVHRR NDVI data from 1981–2003”. Journal of Arid Environments,
Vol. 63, No. 3, pp. 596-614.
Bai, Z. G., Dent, D. L., Olsson, L., Schaepman, M. E., 2008. Global assessment of land
degradation and improvement. 1. Identification by remote sensing. Report
2008/01, ISRIC - World Soil Information, Wageningen.
Balk, D., Pullum, T., Storeygard, A., Greenwell, F. and Neuman, M., 2004. “A spatial
analysis of childhood mortality in West Africa”. Population, Space and Place,
Vol. 10, pp. 175-216.
Bilsborrow, R. E., 1987. “Population pressures and agricultural development in
developing countries: a conceptual framework and recent evidence”. World
Development, Vol. 15, No, 2, pp. 183-203.
Bilsborrow, R. E., 1992. “Population growth, internal migration, and environmental
degradation in rural areas of developing countries”. European Journal of
Population, Vol. 8, pp. 125-148.
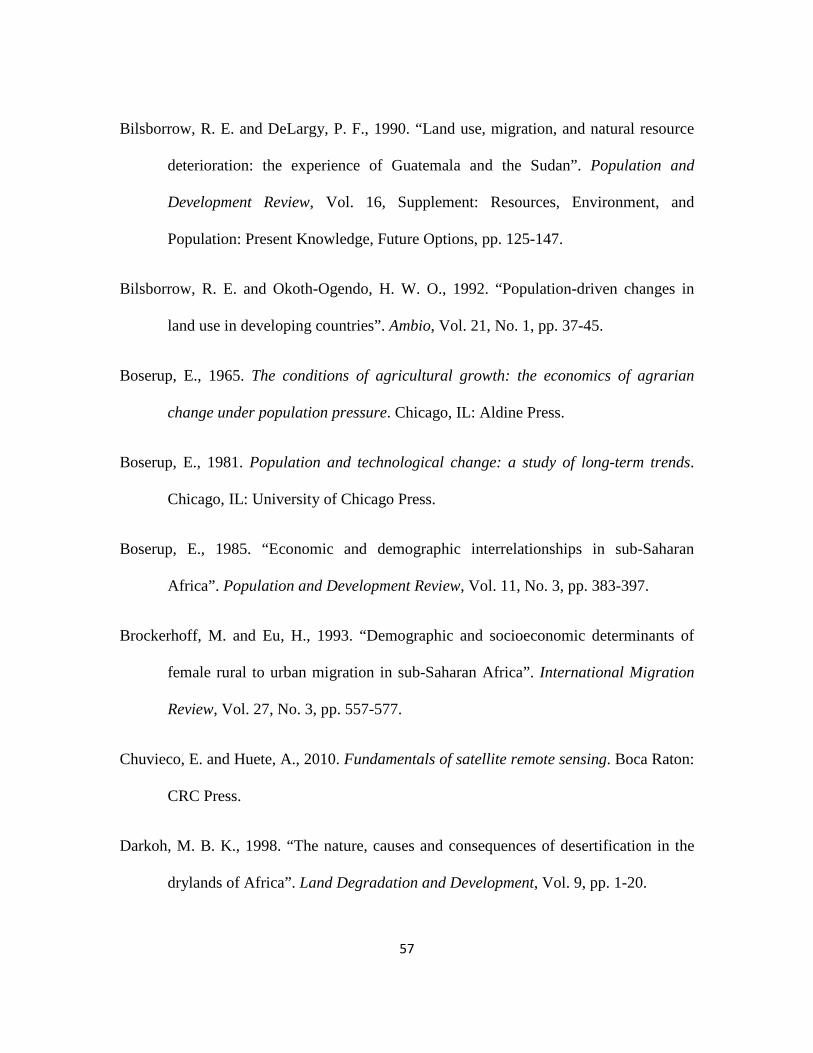
57
Bilsborrow, R. E. and DeLargy, P. F., 1990. “Land use, migration, and natural resource
deterioration: the experience of Guatemala and the Sudan”. Population and
Development Review, Vol. 16, Supplement: Resources, Environment, and
Population: Present Knowledge, Future Options, pp. 125-147.
Bilsborrow, R. E. and Okoth-Ogendo, H. W. O., 1992. “Population-driven changes in
land use in developing countries”. Ambio, Vol. 21, No. 1, pp. 37-45.
Boserup, E., 1965. The conditions of agricultural growth: the economics of agrarian
change under population pressure. Chicago, IL: Aldine Press.
Boserup, E., 1981. Population and technological change: a study of long-term trends.
Chicago, IL: University of Chicago Press.
Boserup, E., 1985. “Economic and demographic interrelationships in sub-Saharan
Africa”. Population and Development Review, Vol. 11, No. 3, pp. 383-397.
Brockerhoff, M. and Eu, H., 1993. “Demographic and socioeconomic determinants of
female rural to urban migration in sub-Saharan Africa”. International Migration
Review, Vol. 27, No. 3, pp. 557-577.
Chuvieco, E. and Huete, A., 2010. Fundamentals of satellite remote sensing. Boca Raton:
CRC Press.
Darkoh, M. B. K., 1998. “The nature, causes and consequences of desertification in the
drylands of Africa”. Land Degradation and Development, Vol. 9, pp. 1-20.
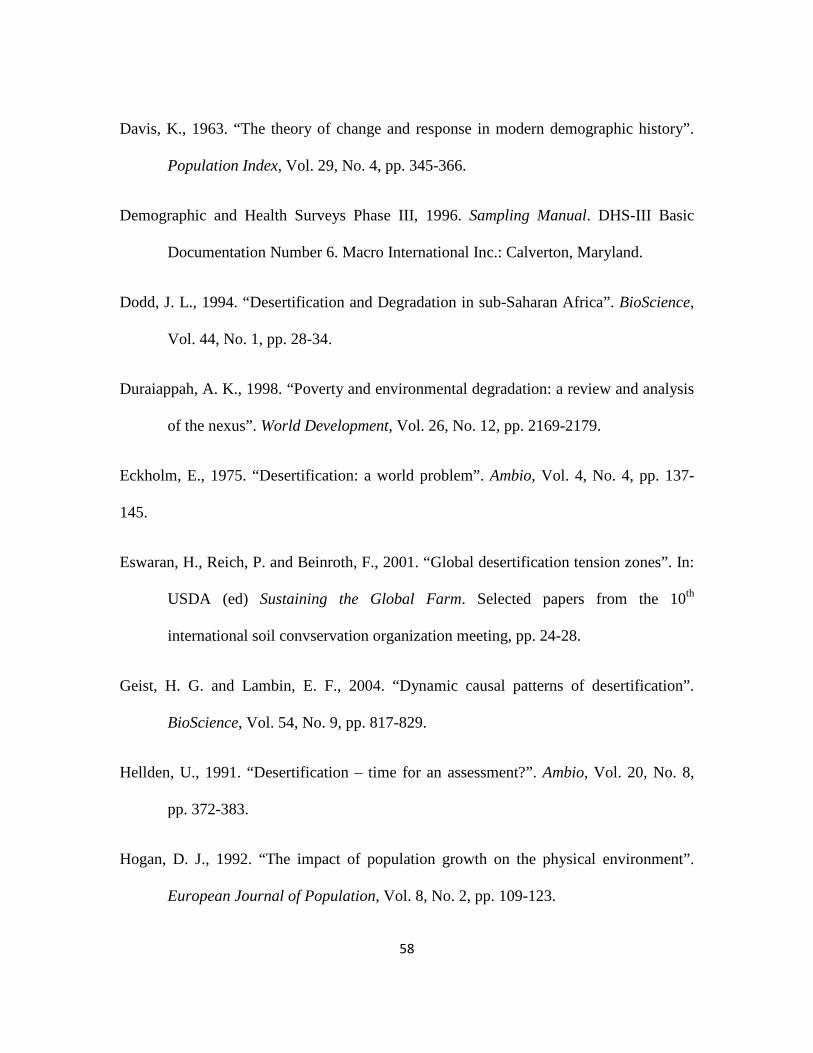
58
Davis, K., 1963. “The theory of change and response in modern demographic history”.
Population Index, Vol. 29, No. 4, pp. 345-366.
Demographic and Health Surveys Phase III, 1996. Sampling Manual. DHS-III Basic
Documentation Number 6. Macro International Inc.: Calverton, Maryland.
Dodd, J. L., 1994. “Desertification and Degradation in sub-Saharan Africa”. BioScience,
Vol. 44, No. 1, pp. 28-34.
Duraiappah, A. K., 1998. “Poverty and environmental degradation: a review and analysis
of the nexus”. World Development, Vol. 26, No. 12, pp. 2169-2179.
Eckholm, E., 1975. “Desertification: a world problem”. Ambio, Vol. 4, No. 4, pp. 137-
145.
Eswaran, H., Reich, P. and Beinroth, F., 2001. “Global desertification tension zones”. In:
USDA (ed) Sustaining the Global Farm. Selected papers from the 10th
international soil convservation organization meeting, pp. 24-28.
Geist, H. G. and Lambin, E. F., 2004. “Dynamic causal patterns of desertification”.
BioScience, Vol. 54, No. 9, pp. 817-829.
Hellden, U., 1991. “Desertification – time for an assessment?”. Ambio, Vol. 20, No. 8,
pp. 372-383.
Hogan, D. J., 1992. “The impact of population growth on the physical environment”.
European Journal of Population, Vol. 8, No. 2, pp. 109-123.
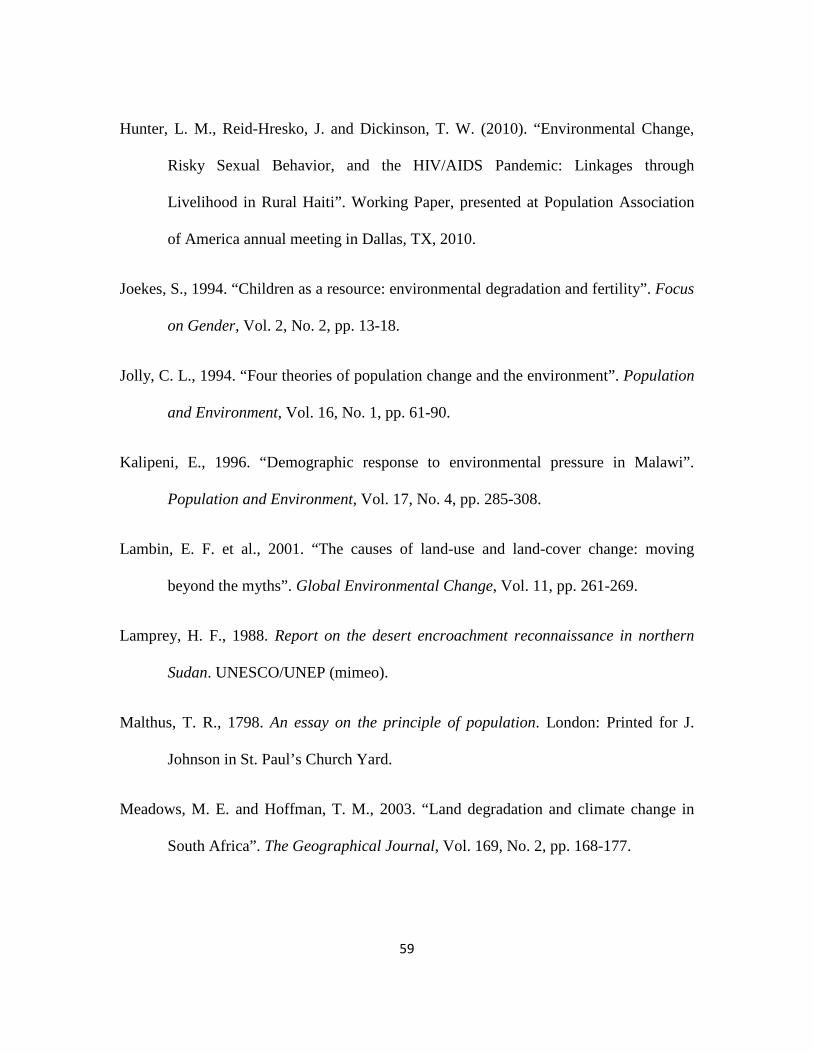
59
Hunter, L. M., Reid-Hresko, J. and Dickinson, T. W. (2010). “Environmental Change,
Risky Sexual Behavior, and the HIV/AIDS Pandemic: Linkages through
Livelihood in Rural Haiti”. Working Paper, presented at Population Association
of America annual meeting in Dallas, TX, 2010.
Joekes, S., 1994. “Children as a resource: environmental degradation and fertility”. Focus
on Gender, Vol. 2, No. 2, pp. 13-18.
Jolly, C. L., 1994. “Four theories of population change and the environment”. Population
and Environment, Vol. 16, No. 1, pp. 61-90.
Kalipeni, E., 1996. “Demographic response to environmental pressure in Malawi”.
Population and Environment, Vol. 17, No. 4, pp. 285-308.
Lambin, E. F. et al., 2001. “The causes of land-use and land-cover change: moving
beyond the myths”. Global Environmental Change, Vol. 11, pp. 261-269.
Lamprey, H. F., 1988. Report on the desert encroachment reconnaissance in northern
Sudan. UNESCO/UNEP (mimeo).
Malthus, T. R., 1798. An essay on the principle of population. London: Printed for J.
Johnson in St. Paul’s Church Yard.
Meadows, M. E. and Hoffman, T. M., 2003. “Land degradation and climate change in
South Africa”. The Geographical Journal, Vol. 169, No. 2, pp. 168-177.
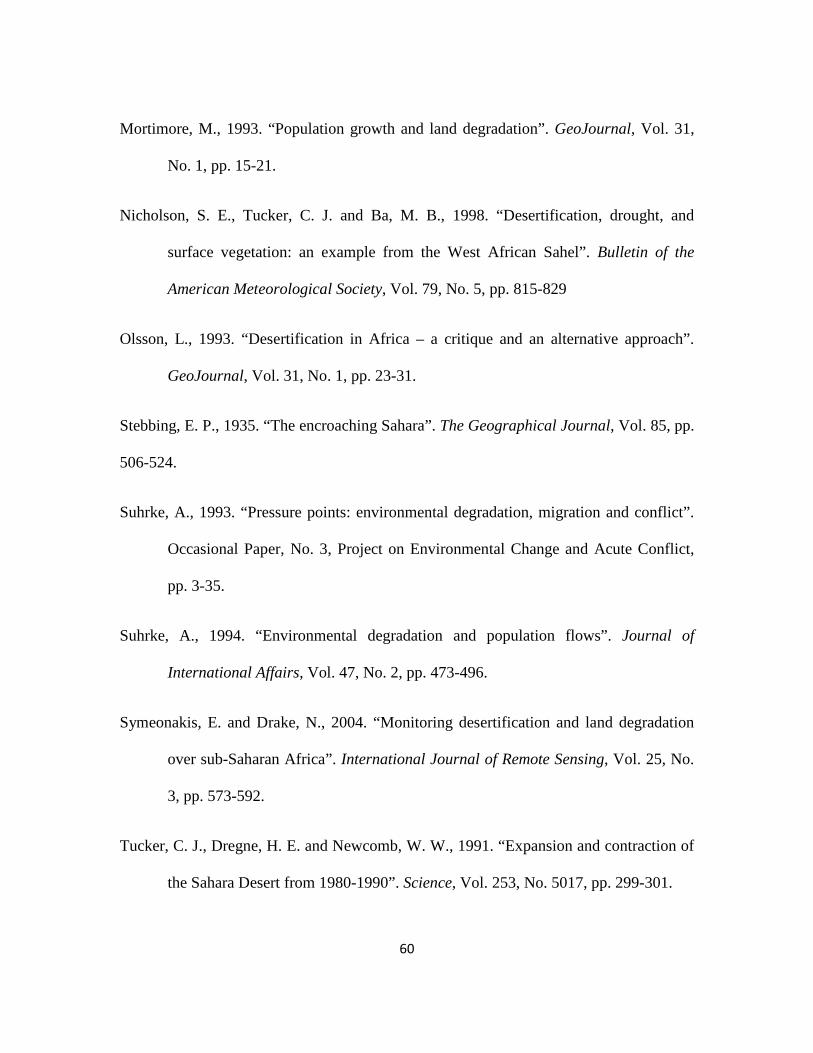
60
Mortimore, M., 1993. “Population growth and land degradation”. GeoJournal, Vol. 31,
No. 1, pp. 15-21.
Nicholson, S. E., Tucker, C. J. and Ba, M. B., 1998. “Desertification, drought, and
surface vegetation: an example from the West African Sahel”. Bulletin of the
American Meteorological Society, Vol. 79, No. 5, pp. 815-829
Olsson, L., 1993. “Desertification in Africa – a critique and an alternative approach”.
GeoJournal, Vol. 31, No. 1, pp. 23-31.
Stebbing, E. P., 1935. “The encroaching Sahara”. The Geographical Journal, Vol. 85, pp.
506-524.
Suhrke, A., 1993. “Pressure points: environmental degradation, migration and conflict”.
Occasional Paper, No. 3, Project on Environmental Change and Acute Conflict,
pp. 3-35.
Suhrke, A., 1994. “Environmental degradation and population flows”. Journal of
International Affairs, Vol. 47, No. 2, pp. 473-496.
Symeonakis, E. and Drake, N., 2004. “Monitoring desertification and land degradation
over sub-Saharan Africa”. International Journal of Remote Sensing, Vol. 25, No.
3, pp. 573-592.
Tucker, C. J., Dregne, H. E. and Newcomb, W. W., 1991. “Expansion and contraction of
the Sahara Desert from 1980-1990”. Science, Vol. 253, No. 5017, pp. 299-301.
61
Tucker, C. J. and Nicholson, S. E., 1999. “Variations in the size of the Sahara Desert
from 1980-1997”. Ambio, Vol. 28, No. 7, pp. 587-591.
Thomas, D. S. G., 1997. “Science and the desertification debate”. Journal of Arid
Environments, Vol. 37, No. 4, pp. 599-608.
Tiffen, M. and Mortimore, M., 2002. “Questioning desertification in dryland sub-Saharan
Africa”. Natural Resources Forum, Vol. 26, No. 3, pp. 218-233.
UNCOD, 1977. “Plan of action to stop desertification”. Report of the UN Conference on
Desertification in Nairobi, Vol. A/CONF 74/36. Nairobi: UNEP.


![Jean Sasson a Fatyol Mogott[1]](https://img.pdfslide.net/doc/110x75/577cc3eb1a28aba71197903d/jean-sasson-a-fatyol-mogott1.jpg)