Embed Size (px)
Citation preview

Copyright
by
Jessica Ann Brown
2016
The Dissertation Committee for Jessica Ann Brown Certifies that this is the
approved version of the following dissertation:
Longitudinal Outcomes of CTE Participation:
P-16+ Transitions in Texas and the Rio Grande Valley
Committee:
Pedro Reyes, Supervisor
Celeste D. Alexander
Ruben D. Olivarez
Victor B. Saenz
Longitudinal Outcomes of CTE Participation:
P-16+ Transitions in Texas and the Rio Grande Valley
by
Jessica Ann Brown, B.A.; M.A.T.
Dissertation
Presented to the Faculty of the Graduate School of
The University of Texas at Austin
in Partial Fulfillment
of the Requirements
for the Degree of
Doctor of Philosophy
The University of Texas at Austin
December 2016

Dedication
To my father, Martin Stanley Brown (1950-2005)
I love you.
v
Acknowledgements
For the majority of my teaching career I taught students who were overlooked by
society and schools—middle grades kids whose disadvantaged backgrounds predicted an
incomplete education. Many had no concept their life differed from others’ experiences.
Many understood hardship too well as they were already burdened with inequity. I would
have crumbled under similar weights. These kids were far more resilient. They were
amazing! Vibrant and witty (and yes, strong-willed), these students required creative
management, varied instruction, and my best efforts as a teacher. I learned, and relearned
the simplest of lessons. All students want to know more. All students want to learn if
given the chance.
My students’ faces and stories are often on my mind. I am so very thankful to
have been their teacher. I owe my drive to improve our education policies and practices
to my kids’ influence. Because of them I want to give more students a better chance to
learn.
My experiences and motivations are rooted in my instruction at Trinity
University. I was taught to be an educator, a good one at that. My undergraduate and
graduate studies forced me to think critically about the student, classroom, school, and
community. Trinity gave me the tools to teach. And, Trinity instilled in me a philosophy
of progressive education I still hold today. It is from this basis I think about policy and
change. I believe it makes me a stronger teacher and more thoughtful researcher. I owe
thanks to all the professors who provided me a wide, liberal arts education. Very special
thanks to Dr. Laura Allen, my master’s advisor and personal mentor. She has continually
provided me opportunities to grow and is an inspiration as an academic.

vi
Thank you to everyone at The University of Texas at Austin (UT) who has helped
me earn knowledge and a doctorate degree. I appreciate all the unique opportunities
which have shaped my experience. From a building within view of the Texas State
Capitol I have been able to study and practice policy. I have not taken it for granted. UT
has provided me a powerful and thorough education.
Special thanks to my committee members, Drs. Olivarez and Saenz, for their
advice and aid in my final study. Thank you to Dr. Reyes for seeing me through my
dissertation and program. And also, for providing me time at the Texas Education
Research Center (ERC). Special thanks to Dr. Celeste Alexander, Cindy Corn, and Matt
Giani—my co-workers at the ERC. Working with y’all made handling enormous
amounts of data, and enormous data issues, fun. Learning from and with you has been a
pleasure. Thank you to RGV LEAD (Rio Grande Valley Linking Economic and
Academic Development) for allowing me the opportunity to study your area and
programs during my work at the ERC. Collaborating with your group has sparked my
interest in Career and Technology Education (CTE) and renewed my enthusiasm for
serving underserved students. Lastly, thank you to the friends I have made in my time at
UT: Richard, Sandra, Vanessa, Kori, Mike, Dan, and Virginia. My studies would not
have been complete without a smart group of peers to share ideas and adventures with.
I would not be who I am today without the many women I lean on and call friend.
These ladies have been my mentors in life; teaching me style, grace, humility, strength,
and perseverance. I am continually amazed by my friends. They are truly inspiring and
empowering people. Special thanks go out to several women who have been huge
cheerleaders in my doctoral efforts. Thank you to Jenn and Emily, my mermaid and wild-
child. Our talks and visits have gotten me through rough periods and convinced me to
keep going, time and time again. Allison, Audrey, and Sarah—The Craft, you ladies are a

vii
treasure. Our group always cheers my spirit. Y’all have a special, understated way of
reminding me who I am. To all these ladies—and even more unnamed, watching with
wonder at how each of you tackle your own lives has taught me to be a wiser and more
conscientious person. It has made my own life works better. I send all of you my love and
thanks. Thank you for cheering me on in your own special ways.
To Emme, my smallest and best friend, I love you. Emme has been my constant
companion in life for over sixteen years, a brown-nosed, snuggly wonder who shares my
personality and snark. She has been napping by my computer or in my lap as I completed
every part of the Ph.D. program. My sentiments to place Emme as co-author on published
works are only half in jest; she has certainly put in the hours. I am so lucky to have such a
wonderful, darling cat to call my own.
Thank you to my family, near and far, who love me dearly. Blessings go to my
two sisters, bright and successful women in their own fields. Tammy and Amanda are
truly people I look up to. They are women who work hard and also raise wonderful,
funny kiddoes I adore. To my mother who has been an unceasing support and confidant,
thank you. Mom has spent her entire life seeking out knowledge, learning about almost
any subject she could. She is an amazing and creative artist. My mother shared with me
her many passions, and I am forever grateful for the love of learning. She was the first to
teach me colors and opened my eyes to the world. She helped set me on a path to
teaching, and keeps me grounded as I continue work in the field. I owe her many thanks
for passing down to me a critical mind; I consider it my best feature. Thank you Mom for
nurturing my mind and guiding my hand at each step in life.
I could not have completed this path without the support and confidence my
father instilled in all his daughters. Thank you Dad for taking me on adventures—the
crazy parts of nature, the dangerous escapades in the garage, the humble lessons in

viii
service, the glorious movie marathons, and the days up at your office. Thank you for
telling me I was intelligent and for believing I could do whatever I set my mind to. Thank
you for allowing me my obstinate ways. Thank you for letting me know you were proud
of me, constantly proud of me. I wish, desperately, you were here to share my joy. My
Dad, a very very dedicated 1973 graduate of The University of Texas, used to jokingly
introduce me as his only daughter who did not attend UT. I know looking down he will
be excited to finally have a family full of Longhorns. More still, I can almost hear his
big-bellied laugh as he remarks on the circuitous route I took getting here. He did always
joke I was his smartest daughter… I hope that in all things I continue to find my smarts,
but, more importantly, live life as my father’s daughter—a master of knowledge, mirth,
and compassion.
ix
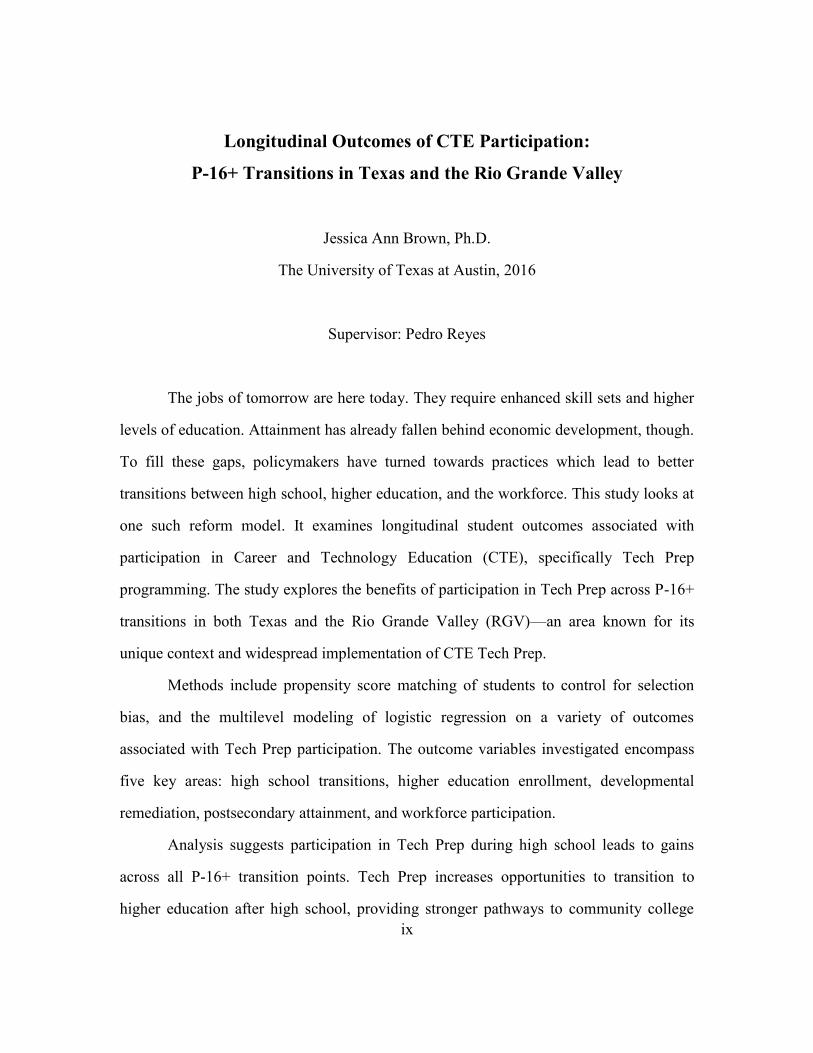
Longitudinal Outcomes of CTE Participation:
P-16+ Transitions in Texas and the Rio Grande Valley
Jessica Ann Brown, Ph.D.
The University of Texas at Austin, 2016
Supervisor: Pedro Reyes
The jobs of tomorrow are here today. They require enhanced skill sets and higher
levels of education. Attainment has already fallen behind economic development, though.
To fill these gaps, policymakers have turned towards practices which lead to better
transitions between high school, higher education, and the workforce. This study looks at
one such reform model. It examines longitudinal student outcomes associated with
participation in Career and Technology Education (CTE), specifically Tech Prep
programming. The study explores the benefits of participation in Tech Prep across P-16+
transitions in both Texas and the Rio Grande Valley (RGV)—an area known for its
unique context and widespread implementation of CTE Tech Prep.
Methods include propensity score matching of students to control for selection
bias, and the multilevel modeling of logistic regression on a variety of outcomes
associated with Tech Prep participation. The outcome variables investigated encompass
five key areas: high school transitions, higher education enrollment, developmental
remediation, postsecondary attainment, and workforce participation.
Analysis suggests participation in Tech Prep during high school leads to gains
across all P-16+ transition points. Tech Prep increases opportunities to transition to
higher education after high school, providing stronger pathways to community college
x
and greater access for traditionally disadvantaged students. When combined with
academic rigor, Tech Prep participation works to improve enrollment and expands
matriculation into four-year institutions. Importantly, Tech Prep interacts with a number
of student traits, increasing the likelihood of postsecondary attainment. RGV area
comparisons indicate significant regional variation, including greater odds of college
readiness and postsecondary enrollment.
Results are numerous and provide strong evidence for the efficacy of Tech Prep
models in the RGV, Texas, and beyond. Findings inform upon the utility of Tech Prep
programs as well as illustrate the possibilities of using longitudinal data to explore effects
of educational models on student outcomes. Moreover, implications connect to the
greater policy discussion. Knowledge gained from this study offers insight into the
current legislative stalemate over federal Perkins reauthorization. Additionally, it
provides useful guidelines for Texas as schools and districts work to develop CTE
programs in response to recent changes in graduation plans under House Bill 5.
xi
Table of Contents
List of Tables ....................................................................................................... xvi
List of Figures ...................................................................................................... xix
CHAPTER ONE: INTRODUCTION ..................................................................1
Problem Statement ...................................................................................................1
Jobs of Tomorrow ...........................................................................................1
Need for Educated Workers ............................................................................2
Education and Earnings ..................................................................................4
Intervention and Opportunity ..........................................................................6
Policy Contexts ........................................................................................................6
P-16+ Pipeline Initiatives ................................................................................7
Reforming Vocational Tracks .........................................................................8
Career and Technical Education .....................................................................8
Tech Prep Programs ........................................................................................9
Texas and the RGV LEAD Consortium .......................................................11
Focus of the Study .................................................................................................14
Research Questions .......................................................................................14
Overview of Methods ...................................................................................14
Significance of the Study .......................................................................................16
Efficacy of Advanced CTE Models ..............................................................16
Importance of Context ..................................................................................17
Growing Accountability in CTE Policies .....................................................18
CHAPTER TWO: LITERATURE REVIEW ...................................................20
Theoretical Frameworks ........................................................................................21
Traditional Theories of Human Capital ........................................................21
Transitions to an Information Economy .......................................................24
xii
Education as a P-16+ Pipeline ...............................................................................28
Connecting Partners in Education .................................................................29
Credit Based Postsecondary Transitions .......................................................31
Reforming Technical Education ...................................................................32
Historical Context of Tech Prep ............................................................................35
Federal Contexts ...........................................................................................35
Texas State Contexts .....................................................................................38
Other Programs Not the Focus of the Study ..........................................................40
Tech Prep Implementation .....................................................................................42
Origins...........................................................................................................42
Requirements ................................................................................................43
Implementation .............................................................................................45
Key Components of Tech Prep ..............................................................................52
Articulation Agreements ...............................................................................53
Career and Technical Education ...................................................................56
Tech Prep Program Outcomes ...............................................................................61
High School ..................................................................................................62
Higher Education ..........................................................................................63
Workforce Participation ................................................................................64
Limitations ....................................................................................................65
CHAPTER THREE: RESEARCH DESIGN .....................................................68
Overview ................................................................................................................68
Logic Model ..................................................................................................68
Research Questions .......................................................................................71
Data .......................................................................................................................71
Definition of Tech Prep ................................................................................71
Longitudinal Data Collection ........................................................................73
Missing Data .................................................................................................75
xiii
Sample Statistics ...........................................................................................76
Methods..................................................................................................................77
Propensity Scoring ........................................................................................78
Hierarchical Linear Regression .....................................................................86
CHAPTER FOUR: FINDINGS .............................................................................92
Tech Prep Participation ..........................................................................................93
High School Transitions ........................................................................................98
Transitioning to Higher Education ..............................................................106
Transitioning to a Community College.......................................................107
Transitioning to a University ......................................................................108
Transitioning to the Workforce ...................................................................109
Higher Education Enrollment ..............................................................................110
Enrolling in Higher Education ....................................................................115
Enrolling in a Community College .............................................................116
Enrolling in a University .............................................................................117
Developmental Remediation ................................................................................118
Participating in Developmental Coursework ..............................................123
Participating in Developmental Mathematics .............................................124
Participating in Developmental Reading ....................................................125
Participating in Developmental Writing .....................................................126
Postsecondary Attainment ...................................................................................127
Earning a Higher Education Credential ......................................................133
Earning an Associate’s Degree ...................................................................134
Earning a Bachelor’s Degree ......................................................................135
Earning a Higher Education Certificate ......................................................136
Workforce Participation .......................................................................................137
Transitioning to the Postsecondary Workforce ...........................................140
Transitioning to the Postsecondary Workforce (Two Jobs) .......................140
xiv
CHAPTER FIVE: DISCUSSION .......................................................................143
What Influences Tech Prep Participation ............................................................144
P-16+ Transitions in Texas ..................................................................................146
High School Transitions .............................................................................147
Higher Education Enrollment .....................................................................148
Developmental Remediation .......................................................................149
Postsecondary Attainment ..........................................................................150
Workforce Participation ..............................................................................151
Summary of Longitudinal Findings ............................................................152
Interactions and Impacts of Tech Prep .................................................................153
Days Absent ................................................................................................153
Gender .........................................................................................................154
Race and Ethnicity ......................................................................................155
Special Populations .....................................................................................157
Dual Credit Courses ....................................................................................158
CTE and Dual-CTE Courses .......................................................................159
Other Significant Influences ................................................................................161
Student Traits ..............................................................................................161
Campus Characteristics ...............................................................................163
Importance of RGV LEAD ..................................................................................165
The RGV Area ............................................................................................165
RGV Differences in Modeling ....................................................................167
Tech Prep and RGV LEAD Affiliations .....................................................169
Implications for the Future...................................................................................172
Better Informed Research ...........................................................................172
Challenges for Practitioners ........................................................................174
Policy Pressures and Reform ......................................................................176
The Future of Reform .................................................................................179
xv
REFERENCE MATERIALS ..............................................................................181
Appendix A: Texas Education Code....................................................................181
Appendix B: List of Variables .............................................................................187
Appendix C: Descriptive Statistics ......................................................................191
Appendix D: Sample Statistics ............................................................................200
Glossary ...............................................................................................................210
References ............................................................................................................216
xvi
List of Tables
Table 3.1: CTE and Tech Prep Status Identifiers in Data Coding .....................72
Table 3.2: Longitudinal Data Collection ...........................................................74
Table 3.3: Multiple Imputation of Variables with Missing Data .......................76
Table 3.4: Balancing Tests on PSM Covariates .................................................85
Table 3.4: Potential Variables for Explored Outcomes .....................................90
Table 4.1: Odds of Participating in a Tech Prep ................................................97
Table 4.2: Odds of Transitioning to Higher Education ....................................106
Table 4.3: Odds of Transitioning to a Community College .............................107
Table 4.4: Odds of Transitioning to a University ............................................108
Table 4.5: Odds of Transitioning to the Workforce .........................................109
Table 4.6: Odds of Enrolling in Higher Education ..........................................115
Table 4.7: Odds of Enrolling in a Community College ...................................116
Table 4.8: Odds of Enrolling in a University ...................................................117
Table 4.9: Odds of Participating in Developmental Coursework (DE) ...........123
Table 4.10: Odds of Participating in Mathematics DE ......................................124
Table 4.11: Odds of Participating in Reading DE..............................................125
Table 4.12: Odds of Participating in Writing DE ..............................................126
Table 4.13: Odds of Earning a Higher Education Credential ............................133
Table 4.14: Odds of Earning an Associate’s Degree .........................................134
Table 4.15: Odds of Earning a Bachelor’s Degree ............................................135
Table 4.16: Odds of Earning a Higher Education Certificate ............................136
Table 4.17: Odds of Transitioning to the Workforce .........................................141
Table 4.18: Odds of Transitioning to the Workforce (Two Jobs) ......................142
xvii
Table 5.1: RGV Demographic Estimates .........................................................166
Table 5.2: Probabilities Across P-16+ Transitions ..........................................171
Table C.1: Cohorts and Diploma Types ..............................................................192
Table C.2: Race/Ethnicity ....................................................................................192
Table C.3: Student Characteristics .......................................................................192
Table C.4: Special Program Membership ............................................................193
Table C.5: Passing Rates on TAKS Exit Exams..................................................193
Table C.6: Average Dual Credit, CTE, and Dual-CTE Course Credits ..............193
Table C.7: Percent Transitioning to Higher Education ........................................194
Table C.8: Percent Transitioning to the Workforce .............................................194
Table C.9: Percent Transitioning to Higher Education and the Workforce .........194
Table C.10: Salaries Transitioning to Higher Education and the Workforce ......195
Table C.11: Percent Transitioning to Only the Workforce ..................................195
Table C.12: Salaries Transitioning to Only the Workforce .................................195
Table C.13: Percent in the Workforce Five Years After Graduation ..................196
Table C.14: Percent with Credential in the Workforce Five Years After ............196
Table C.15: Salaries Credential in the Workforce Five Years After ...................196
Table C.16: Percent Without Credential in the Workforce Five Years After ......197
Table C.17: Salaries Without Credential in the Workforce Five Years After .....197
Table C.18: Total Enrollment in Higher Education .............................................197
Table C.19: College and Career Readiness, Percent Failing ...............................198
Table C.20: Developmental Enrollment by Subject ............................................198
Table C.21: Earned Postsecondary Credentials ...................................................198
Table C.22: Percent Post-Postsecondary Graduates Working .............................199
Table C.23: Percent Working and Mean Salary by Postsecondary Credential ....199

xviii
Table D.1: Means and Standard Deviations for Cohort Sample .......................200
Table D.2: Intercorrelations for Cohort Sample ...............................................201
Table D.3: Means and Standard Deviations for PSM Sample ..........................205
Table D.4: Intercorrelations for PSM Sample ..................................................206
xix
List of Figures
Figure 1.1: Educational Attainment by Race/Ethnicity .........................................3
Figure 1.2: Earnings by Education and Race/Ethnicity .........................................5
Figure 1.3: Rio Grande Valley (RGV) Area Counties ........................................11
Figure 2.1: Expected Lifetime Earnings by Education Level .............................23
Figure 3.1: Logic Model for Advanced CTE and Tech Prep Programs ..............70
Figure 3.2: Distribution of Propensity Scores Before and After PSM ................82
Figure 3.3: Balance of Covariates Before and After PSM ...................................83
1
CHAPTER ONE: INTRODUCTION
Problem Statement
The jobs, careers, and industries of tomorrow are no longer blueprints for the
future. They are here today (Organization for Economic Cooperation and Development
[OECD], 2016). At the same time, world markets have become increasingly
interconnected, interdependent, and competitive (Crist, Jacquart, & Shupe, 2002;
Hernandez, 2014; Ramsey, 1995). Global economies have shifted away from resource
and manufacturing industries. Instead, they now look towards information economies in
which knowledge, technology, and services are important drivers of growth and wealth
(Castells, 2010; OECD, 2016). Innovative industries—and their correspondingly novel
career opportunities—call for increased skill sets and higher levels of education
(Carnevale, Smith, & Strohl, 2010). Facing greater competition and transformation in
markets, America is now tasked with growing its educated labor supply.
JOBS OF TOMORROW
The need for more—and better—educated employees in the United States is
predicated on several factors inherent in the workforce today. First, there is a growing
shift in what job opportunities will be available to young workers. Today many prime-age
workforce members, those ages 25-54, are employed in jobs that require a high school
diploma or less (National Governor’s Association [NGA], 2014). These jobs are quickly
disappearing which will leave citizens unemployed or underemployed, stuck with low
and unlivable wages (Carnevale et al, 2010).
The retirement of the baby boomer generation, coupled with closures in
previously popular industries, have shaped the forecast of replacement positions as well
(Fitzsimmons, 1999; Symonds, Schwartz, & Ferguson, 2011). Estimates project that both
2
replacement and new job opportunities will necessitate higher levels of educational
attainment. Researchers predict two-thirds of positions in the next decades will require
some form of postsecondary education (Brown & Schwartz, 2014; Castellano,
Stringfield, & Stone, 2003). A quarter of anticipated jobs will entail higher education,
though not necessarily a four-year degree (Carnevale et al, 2010). These include
professions which demand either an industry recognized certificate or associate’s degree.
The STEM (Science, Technology, Engineering, and Mathematics) industry
provides an excellent example of these shifts. STEM fields are rapidly growing at the
same time resource industries (e.g., mining) and manufacturing are in decline. Job
opportunities in STEM require more education and very specific skill sets (Hart, 2005).
Employment opportunities in STEM, and other advanced fields, are in high demand,
while low skill jobs are disappearing. Indeed, currently there are already growing
shortages in STEM as well as healthcare, information, and technology industries (Gilbert,
1997; Hart, 2005; National Association of Manufacturers [NAM], 2005).
NEED FOR EDUCATED WORKERS
The demand for a more educated workforce is evident. The United States has
lagged, though, in providing opportunities for higher education and skill development
(Brown & Schwartz, 2014). While stable at 43%, the United States currently ranks fifth
amongst OECD (Organization for Economic Cooperation and Development) countries in
the percentage of adults with a higher education degree. Postsecondary attainment for
younger generations (25-34 years old) is much lower when compared to other countries;
the United States ranks 11th
(OECD, 2014). Other, developed, countries are increasing
attainment at much higher rates.
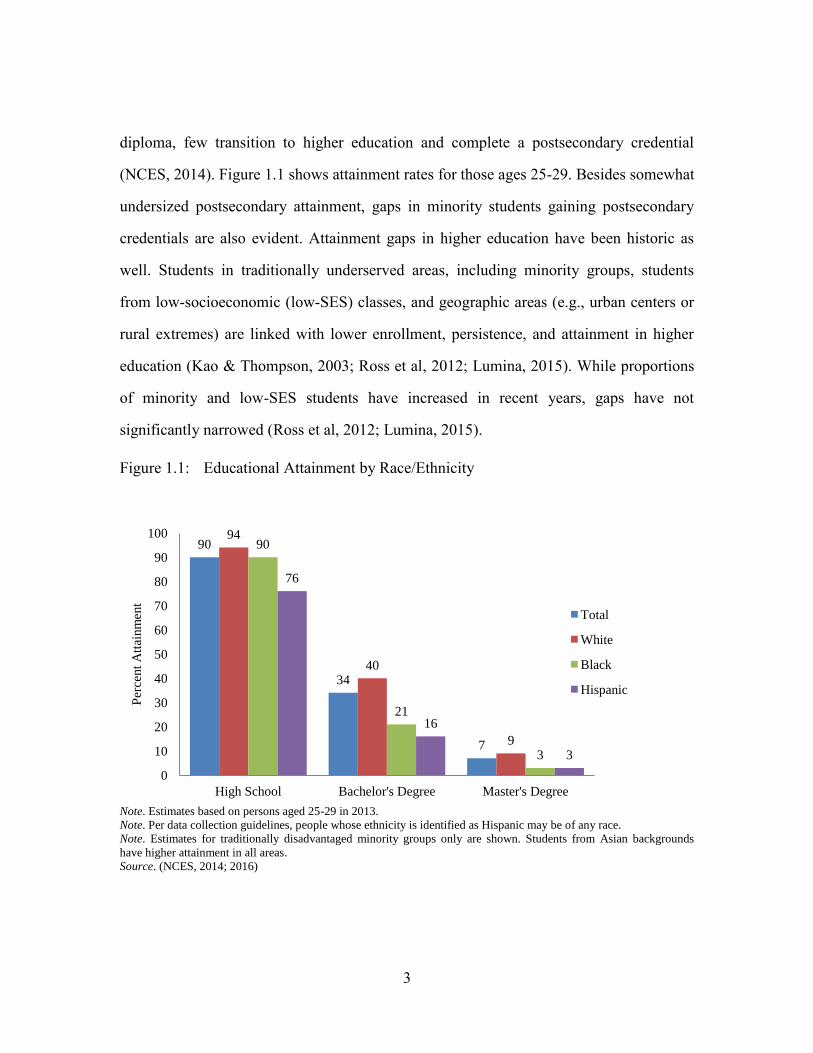
The latest estimates of educational attainment collected by the National Center for
Education Statistics (NCES) suggest that while many are completing a high school
3
diploma, few transition to higher education and complete a postsecondary credential
(NCES, 2014). Figure 1.1 shows attainment rates for those ages 25-29. Besides somewhat
undersized postsecondary attainment, gaps in minority students gaining postsecondary
credentials are also evident. Attainment gaps in higher education have been historic as
well. Students in traditionally underserved areas, including minority groups, students
from low-socioeconomic (low-SES) classes, and geographic areas (e.g., urban centers or
rural extremes) are linked with lower enrollment, persistence, and attainment in higher
education (Kao & Thompson, 2003; Ross et al, 2012; Lumina, 2015). While proportions
of minority and low-SES students have increased in recent years, gaps have not
significantly narrowed (Ross et al, 2012; Lumina, 2015).
Figure 1.1: Educational Attainment by Race/Ethnicity
Note. Estimates based on persons aged 25-29 in 2013.
Note. Per data collection guidelines, people whose ethnicity is identified as Hispanic may be of any race.
Note. Estimates for traditionally disadvantaged minority groups only are shown. Students from Asian backgrounds
have higher attainment in all areas.
Source. (NCES, 2014; 2016)
90
34
7
94
40
9
90
21
3
76
16
3
0
10
20
30
40
50
60
70
80
90
100
High School Bachelor's Degree Master's Degree
Per
cent
Att
ainm
ent
Total
White
Black
Hispanic
4
Certain barriers limit access to postsecondary enrollment. Many of these include
low college readiness, limited exposure to a college culture, lack of understanding of
hidden rules, and a shortage of financial resources. (Choy, 2001; Executive Office of the
President [EOP], 2014; National Center for Public Policy and Higher Education
[NCPPHE], 2008; Sawhill et al, 2012). At present, a relatively smaller proportion of
students are gaining a higher level of education than their parents reached, further
suggesting limited access (OECD, 2014).
An incomplete education today is a growing concern. Downtrends between
secondary and postsecondary attainment, and gaps between underserved populations of
students are meaningful in today’s economy. It corresponds to fewer job opportunities as
well as lower wages (Carnevale et al, 2010; Castellano et al, 2003).
EDUCATION AND EARNINGS
Educational attainment has a direct link to both individual and overall prosperity
(Goldberg & Smith, 2008; Hanushek & Woessmann, 2010). For individuals, there is a
positive relationship between the level of education reached and economic return. The
more education a person receives, the larger the income they are likely to make, both in
yearly wages as well as lifetime earnings (Grubb, 1999; Maguire, Starobin, & Laanan,
2012; Mincer, 1989). Levels of degree attainment also matter. Students gaining an
associate’s degree tend to earn less than those who earn a bachelor’s degree (Grubb,
1999).
The impact of a postsecondary degree on earning potential has been replicated
over numerous periods of time suggesting a long-held association between investments in
education and financial return (Greenstone, Harris, Li, Looney, & Patashnick, 2012;
Seidman & Ramsey, 1995). Gaps between college graduates, those with only a high
school diploma, and those that did not complete high school have grown wider over time.
5
The largest gaps are between those with and without a bachelor’s degree. Indeed, the
United States shows one of the largest differences in earnings internationally between
citizens with and without a postsecondary degree (OECD, 2014). For those with a high
school diploma or less, wages are particularly small. Lifetime earnings for those who did
not complete high school have decreased dramatically over time. At the same time those
with postsecondary attainment have seen growth in lifetime earnings (Greenstone et al,
2012).
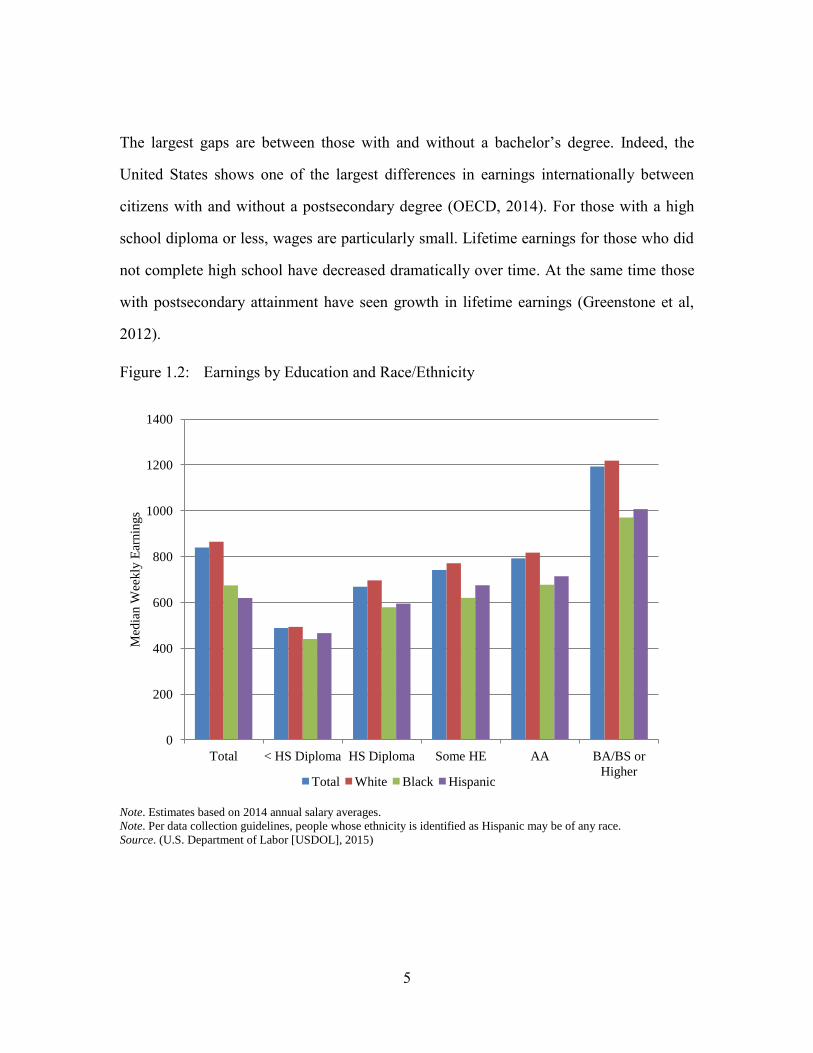
Figure 1.2: Earnings by Education and Race/Ethnicity
Note. Estimates based on 2014 annual salary averages.
Note. Per data collection guidelines, people whose ethnicity is identified as Hispanic may be of any race.
Source. (U.S. Department of Labor [USDOL], 2015)
0
200
400
600
800
1000
1200
1400
Total < HS Diploma HS Diploma Some HE AA BA/BS or
Higher
Med
ian W
eekly
Ear
nin
gs
Total White Black Hispanic
6
Gaps in earnings are observed when comparing race and ethnicity. The widest
gaps occur in higher levels of postsecondary attainment—associate or bachelor degree
credentials (see Figure 1.2). Gaps in earnings may be explained, in part, by the uneven
distribution of educational opportunity through limited access (EOP, 2014; NCPPHE,
2008). Limited access lowers the probability of attainment and correspondingly has
negative impacts on earning potential (Lumina, 2015; NCPPHE, 2008).
INTERVENTION AND OPPORTUNITY
The preponderance of research has shown that the lack of a high school degree in
this current day relegates a person to a lifetime of poorly paid, unskilled labor
opportunities (Seidman & Ramsey, 1995). Further, low postsecondary attainment levels
keep many more from experiencing high-paid, middle class job opportunities (Carnevale
et al, 2010; Castellano et al, 2003). Gaps between underserved populations extend
inequity (Lumina, 2015). Shifting economies in combination with growing demand for
skills and education in the future will further exacerbate numerous inequalities—unless
appropriate interventions are implemented.
Policy Contexts
Growing requirements for workers and new developments in industry have forced
many to rethink policy connections between education and employment. Current policies
do not successfully bridge the barriers to postsecondary education which keep certain
students from gaining the necessary skills for the jobs of tomorrow. To fill gaps and grow
economies, policymakers have turned towards practices which lead to better transitions
between high school, higher education, and the workforce.
7
P-16+ PIPELINE INITIATIVES
Commonly referred to as P-16+ pipelines, these are sets of initiatives which
address disconnects in education and attempt to integrate the system for greater
effectiveness (Bailey, 2009; Kleinman, 2001). P-16+ is so named for the span it connects:
pre-kindergarten, elementary, middle, secondary, postsecondary, and plus (i.e., graduate
studies and/or workforce participation). P-16+ research concentrates on identifying which
transitions in education have negative impacts on student potential, and what
interventions connect transition points to help students reach greater attainment (Bragg &
Durham, 2012; Callan, Finney, Kirst, Usdan, & Venezia, 2006; McClafferty, Jarsky,
McDonough, & Nunez, 2009; Mustian, Mazzotti, & Test, 2013).
One intervention has been the use of credit based transition (i.e., duel credit)
programs. These are programs, or stand alone courses, which provide early access to
higher education while students are still enrolled in high school. Dual enrollment courses
are associated with a number of benefits to students: they grant simultaneous credits
towards a diploma and a higher education credential, improve motivations and interests
through varied curriculum, expose students to college-going culture and rigor, and
prepare students with the needed information to successfully enroll and complete higher
education (Bailey et al, 2002; Kim & Bragg, 2008; King & West, 2009). In addition,
models are meant to decrease the financial burden and time to degree. Dual enrollment
encourages postsecondary attainment, making it a more realistic goal for students who
would otherwise be unable to afford the time or money (King & West, 2009; Lewis &
Overman, 2008). Credit based transition models are one of several policies meant to ease
transitions and improve alignment between high school and higher education.
8
REFORMING VOCATIONAL TRACKS
Because traditional transitions and traditional content have not served students
well in the past, many have combined credit based transition models with other reforms.
These include curricula other than the traditional academic track (Bragg, 2006).
Educators have turned to diverse options to meet requirements for achievement, ones
which also fulfill student interests and develop skills for the future. Technical coursework
has been an ideal area for implementation.
Vocational education historically focused on teaching skills at the detriment to
academic content (Brown & Schwartz, 2014; Dare, 2006). In addition, programs were
often separated and tracked away from academic paths and students, creating divisions
which exacerbated gaps and inequalities (Castellano et al, 2003; Dare, 2006). The press
for an educated workforce has demanded a new vocational learning platform. Through a
series of reforms pushed by policymakers and practitioners alike, vocational education
has been reshaped within past decades. Reform has promoted connections between
technical content and workforce demands, content and academic skills, and content with
postsecondary alignment (Aliaga, Kotamraju, & Stone, 2014).
CAREER AND TECHNICAL EDUCATION
The use of the term vocational education has fallen out of favor and been replaced
with Career and Technical Education (CTE). Along with a name change, programs and
funding have changed dramatically. The Carl D. Perkins Vocational and Technical
Education Act (later the Career and Technical Education Act) passed in 1984 and has
been reauthorized at various times from 1990-2006. Federal Perkins legislation was a
response to concerns that secondary schools were failing to develop students in the
academic and technical skills needed for a 21st century economy (Friedel, 2011; Maguire
et al, 2012). Policy mirrors market demands for increased technology and information in
9
a globalized, competitive workforce (Hershey et al, 1998). Federal legislation was the
impetus for reform to CTE including curricular improvements, modernization of
technical skills, and the expansion of programming to a wider population of students
(Friedel, 2011).
CTE has become more integrated, rigorous, and complex. It includes advanced
technology and new career paths (Ramsey, 1995). Courses and programs have—and are
still—working to integrate core academic standards alongside technical training
(Stipanovic, Lewis, & Stringfield, 2012). Newly designed CTE courses offer exposure to
career planning and job exploration; they provide industry exposure through hands-on
experiences and mentoring (Hutchins & Akos, 2013; Rojewski & Hill, 2014). Program
participation translates to both workforce training and postsecondary preparedness.
Studies suggest the use of CTE may help with high school retention and
graduation as well enhance the probability of enrollment and persistence in higher
education (Allen, 2012; Brown, 2003; Neild & Byrnes, 2014; Zinth, 2014). In addition,
students with CTE backgrounds may be better prepared to take on higher paying jobs
with or without further, postsecondary training (Mane, 1999). For the first time, technical
programs—those sneered at as vocational education in the past—have been called upon
to remedy gaps in educational transitions and attainment.
TECH PREP PROGRAMS
Important to Perkins legislation and CTE reform, has been the creation of
advanced CTE programs—in more recent updates to legislation this is termed as
Programs of Study (POS) models. These CTE programs offer integrated academic
content, technical skills and experiences, and advanced opportunities through credit based
transition models. Many advanced CTE programs offer internships, on-the-job training,
10
and/or certification possibilities through dual credit courses. One such example is Tech
Prep programming.
The goal of Tech Prep, or Technical Preparation Programming, is to create
seamless transitions between high school and higher education. Programs engage
students in career focused pathways, prepare students for college and careers, and allow
for workplace exposure and mentoring (Bragg, 2000). Tech Prep programs are part of a
regimented CTE course plan; they include a planned sequence of study in a defined field
during high school which includes postsecondary training and leaves the student with
some form of higher education credential upon completion (U.S. Department of
Education [USDOE], 2014). Tech Prep programs involve complex partnerships with high
schools, higher education providers, and local industries to fully implement and involve
students in the curriculum. Partnerships are called regional consortia and they work
articulating courses and curriculum across varying institutions. Through program
implementation, Tech Prep models have the potential to create coherent transitions in the
P-16+ pipeline while providing relevant and rigorous technical curriculum to all students.
Today Tech Prep programs are widespread. A survey of states in 2008 found that
over half (29) have active, comprehensive Tech Prep programs (Brush, 2008). Tech Prep
has been shown to equalize educational opportunities and expectations resulting in
diminished academic tracking and increased participation by all types of students (Dare,
2006; Fishman, 2015). Studies have suggested the use of Tech Prep may help with high
school retention and graduation (Cellini, 2006; Stone & Aliaga, 2003). Participation may
also lead to a greater probability of enrollment and persistence in higher education
(Bailey & Karp, 2003; Bragg, 2006). These findings are especially true for students at
greater risk of dropping out and receiving an incomplete education (Bragg, Loeb, Gong et
al, 2002; Brown, 2003). CTE Tech Prep programs are seen as promising reform models
11
which can simultaneously inspire students to train at the postsecondary level while also
keeping traditionally low performing students interested in education long enough to
learn skills and content needed to secure a quality job (Cellini, 2006; Kim, 2014).
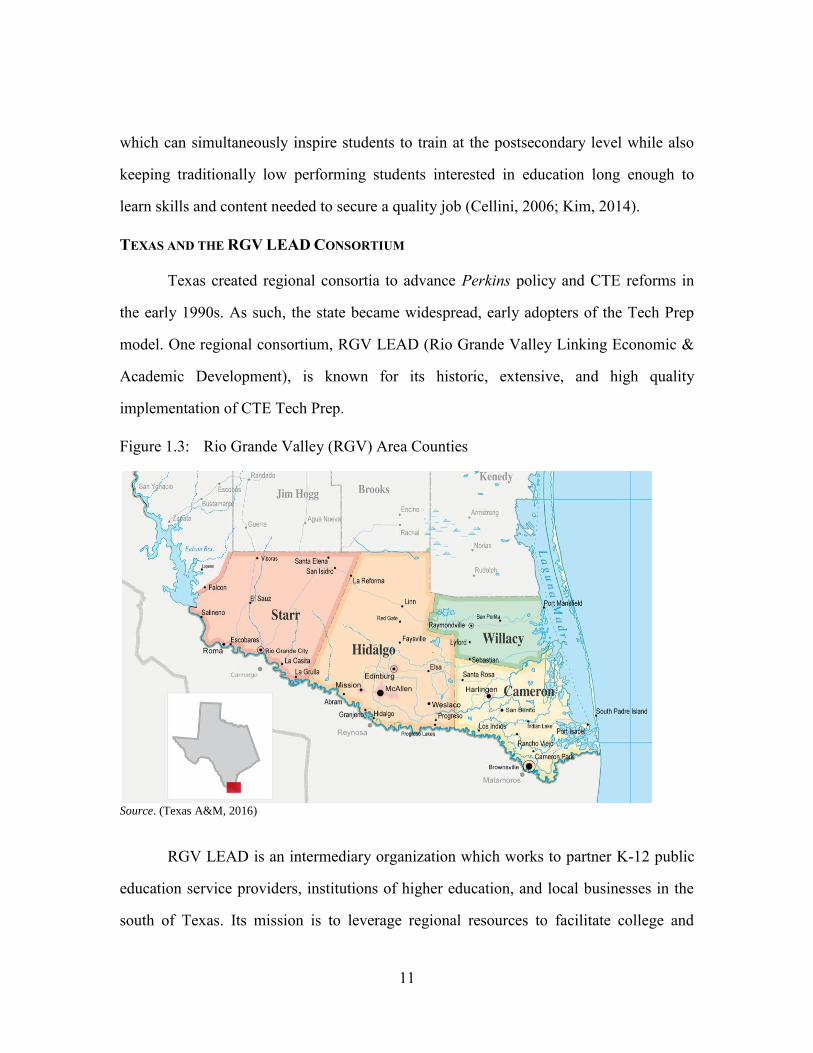
TEXAS AND THE RGV LEAD CONSORTIUM
Texas created regional consortia to advance Perkins policy and CTE reforms in
the early 1990s. As such, the state became widespread, early adopters of the Tech Prep
model. One regional consortium, RGV LEAD (Rio Grande Valley Linking Economic &
Academic Development), is known for its historic, extensive, and high quality
implementation of CTE Tech Prep.
Figure 1.3: Rio Grande Valley (RGV) Area Counties
Source. (Texas A&M, 2016)
RGV LEAD is an intermediary organization which works to partner K-12 public
education service providers, institutions of higher education, and local businesses in the
south of Texas. Its mission is to leverage regional resources to facilitate college and
12
career focused learning opportunities for students, preparing individuals for educated and
skilled positions in today’s workforce. Prime focus in this consortium is the development
of robust CTE experiences. Specifically, RGV LEAD works to implement Tech Prep
programs across the region. The partnership includes 32 Independent School Districts
(ISDs), one charter network, four regional universities and community colleges, the K-12
Education Service Center (ESC), and a number of business and professional
organizations representing the economic needs of the Texas Rio Grande Valley (RGV)
area. The alliance provides resources, funding, and support services to Tech Prep
programming in high schools, hosts scholarships for graduating students, and creates
opportunities for mentoring and early exposure in career pathways.
The K-12 public school districts (by county), charter networks, community
colleges, and universities that are members of RGV LEAD include:
Cameron County: Brownsville ISD, Harlingen CISD, La Feria ISD, Los Fresnos
CISD, Point Isabel ISD, Rio Hondo ISD, San Benito CISD, Santa Maria ISD,
Santa Rosa ISD, and South Texas ISD;
Hidalgo County: Donna ISD, Edcouch-Elsa ISD, Edinburg CISD, Hidalgo ISD,
La Joya ISD, La Villa ISD, McAllen ISD, Mercedes ISD, Mission CISD, Monte
Alto ISD, Pharr-San Juan-Alamo ISD, Progreso ISD, Sharyland ISD, Valley
View ISD, and Weslaco ISD;
Starr County: Rio Grande City CISD, Roma ISD, and San Isidro ISD;
Willacy County: Lasara ISD, Lyford CISD, Raymondville ISD, and San Perlita
ISD;
Charter Schools/Networks: IDEA Public Schools;
13
Community/Technical Colleges: South Texas College (STC), Texas Southmost
College (TSC) and Texas State Technical College (TSTC); and
Universities: The University of Texas Rio Grande Valley (UT RGV).1
The area RGV LEAD serves is particularly important. The RGV, or Valley, is a
four county area at the southernmost tip of Texas (see Figure 1.3). The Valley includes
large rural areas, very poor communities, and a higher percentage of minority populations
than the rest of Texas or the nation (U.S. Bureau of Economic Analysis (USBEA], 2016;
U.S. Census Bureau [USCB], 2016). The area hosts traditionally low levels of
educational attainment and is geographically located in areas less likely to have access to
postsecondary pathways or workforce opportunities (Allen, 2012; USCB, 2016). Support
for CTE and Tech Prep is especially significant for this disadvantaged and underserved
region.
Under the direction of RGV LEAD (formerly known as Tech Prep of the Rio
Grande Valley) CTE has been valued since the 1990s as an important tool to increase
high school retention and higher education transitions. Tech Prep programs were
developed in the area, by the consortium, at an early point during Texas-wide
implementation (Brown, 2001). RGV maintains successful Tech Prep programs in all
area high schools. Today RGV LEAD has combined efforts and also serves as the
regional P-16+ council. RGV LEAD offers support to Tech Prep as one of several
comprehensive advanced CTE POS models. In the RGV LEAD service area all POS,
including Tech Prep, are inclusive models which deliver concurrent enrollment in CTE
courses, and provide pathways to higher education attainment through early access
degree programs.
1 UT RGV was once two institutions, The University of Texas at Brownsville and The University of
Texas-Pan American. These universities were combined in 2013 to allow for greater funding and the
creation of a medical school.
14
Focus of the Study
CTE Tech Prep has enormous potential in its design. The program is meant to be
an attractive, non-traditional pathway to high school completion and higher education
attainment. Tech Prep was the first of a growing number of modern CTE models and
reforms. Practitioners today are expanding Tech Prep implementation, and also working
to provide similar CTE programs through POS. At this point in time it is important to
study the impacts of past CTE efforts in order to improve future endeavors.
RESEARCH QUESTIONS
The purpose of this study is to better understand the ways in which advanced CTE
models, such as Tech Prep, may be used to foster college and career transitions. The
focus of research explores the impacts of CTE Tech Prep participation on longitudinal
outcomes related to the P-16+ pipeline. For this study, one broad question covers the
intent of analyses. How do advanced CTE programs, such as Tech Prep programming,
affect student outcomes across the P-16+ pipeline? Specific questions guide research.
These are:
RQ1. What student- and school-level characteristics influence Tech Prep participation?
RQ2. Relative to comparable students, what impact does Tech Prep participation have
on high school transitions, higher education enrollment, developmental
remediation, postsecondary attainment, and workforce participation?
OVERVIEW OF METHODS
Given the need for more rigorous analyses of CTE research, the design of this
study aligns to criteria for research put forth by the What Works Clearinghouse standards
(Fritz et al, 2012; Nimon, 2012). Specifically, the research design meets evidence
15
standards of strong, quasi-experimental studies of comparison groups (Gemici &
Rojewski, 2007, WWC, 2014).
Using data from the TEA (Texas Education Agency), THECB (Texas Higher
Education Coordinating Board), and TWC (Texas Workforce Commission), cohorts of
high school students graduated in 2009 and 2010 are tracked through four years of
postsecondary access and five years of workforce participation. Methods for the study
consist of Propensity Score Matching (PSM) of students to control for selection bias.
PSM includes a two-step process which first models the predicted probability of all
students enrolling in Tech Prep, and then matches Tech Prep to non-Tech Prep students
using a nearest neighbor sampling technique (Austin, 2011; Guo & Fraser, 2010;
Rosenbaum & Rubin, 1983; 1984). PSM creates a quasi-experimental control group for
comparison.
Multilevel logistic regression is then used to ascertain the odds of reaching each
P-16+ longitudinal outcome, including comparison estimates of Tech Prep participation
and RGV LEAD affiliation. This type of modeling, sometimes referred to as
Hierarchical Linear Modeling (HLM), allows for more accurate statistical estimates as it
takes into consideration the clustering of students nested within schools (Nimon, 2012;
Gelman & Hill, 2007; Raudenbush & Bryk, 2002; Stevens, 2009). Analytic strategies
presented in this study work together to create a complex set of findings which host
multiple possibilities for using Tech Prep as either a targeted or comprehensive P-16+
reform.
16
Significance of the Study
The jobs of tomorrow have highlighted a pressing need for greater education
today. Educational attainment has already fallen behind economic development, though.
Existing attainment gaps paired with limited earning possibilities have created
considerable, unrelenting increases in inequality (Greenstone et al, 2012). These trends
are disquieting and require intense intervention. Reforms need to engender an educated
and employed workforce for all, paying attention to diminishing the gaps that currently
exist. The growth of advanced CTE to meet both labor and academic demands is a
promising tool. This study adds to the greater discussion on reform by providing valuable
information as to the long-term impacts of Tech Prep participation. Longitudinal
outcomes and comparisons from this study have numerous implications for both
policymakers and practitioners in the field.
EFFICACY OF ADVANCED CTE MODELS
Tech Prep works towards preparing students for the jobs of tomorrow in the
classrooms of today. Programming is aimed at reducing persistent gaps in educational
attainment through increasing transition pathways to higher education. The need to assess
the efficacy of these interventions is vital to understanding their use and potential in the
wider framework of educational reform. Research to date has been limited and many in
the field feel there is a lack of rigorous studies connecting programs to student outcomes
(Fritz, Morris, & Richler, 2012; Gemici & Rojewski, 2007; Nimon, 2012; Rojewski, Lee,
& Gemici, 2012). Further, studies most often fail to account for inherent bias in their data
or calculations (e.g., missing data) (Bozick & Dalton, 2012; Lewis & Overman, 2008;
Rojewski & Xing, 2013). Taking research critiques into consideration, this study uses
longitudinal data and quasi-experimental design methods to compare outcomes of Tech
Prep participants across a number of P-16+ transitions.
17
The efficacy of Tech Prep programming is explored within the boundaries of
current Perkins legislation as well as Texas legislative agendas. Findings are linked to the
focus of P-16+ on alignment and articulation, college and career readiness standards, and
support for educational attainment in underserved students. These connections are crucial
to understanding CTE as a comprehensive reform model. Findings also speak to targeted
reforms focused on specific students.
IMPORTANCE OF CONTEXT
Within the effort to implement enhanced CTE and P-16+ programs,
understanding the context of reform is also important. It allows for better crafted policy
and informed practitioners—those able to understand what will work in their specific
circumstances. The Valley area and RGV LEAD consortium are included in this study to
help better understand the contextual implications of reform. RGV LEAD is a well
developed example of regional consortia created under Perkins legislation and other state
policies. As such it is an ideal region from which to study the impacts of implementation
through student participation. More importantly, the geographic area of the RGV
provides a unique context to view educational reform.
The four counties making up RGV have high minority populations, increased
rates of poverty, and low levels of educational attainment. Large parts of the RGV also
fall into geographic areas with limited postsecondary and workforce support. The RGV
encapsulates virtually all characteristics which are negatively associated with
postsecondary transitions and success (Anderson, 2008; Dicker-Conlin & Rubenstein,
2007; Erisman & Looney, 2007; Fishman, 2015; McSwain & Davis, 2007). This context
provides a unique microcosm to test how reform strategies targeted at underserved
populations impact educational outcomes (Allen, 2012). In an era where underserved
groups have increasingly large gaps in educational outcomes, targeted focus is
18
increasingly important to understanding reform potential (NCPPHE, 2008; Kao &
Thompson, Lumina, 2015; 2003; Ross et al, 2012).
GROWING ACCOUNTABILITY IN CTE POLICIES
Requirements of existing accountability standards for academic achievement have
put pressures on schools to improve in all areas, including technical education (Anderson,
2008; Chadd & Drage, 2006). Perkins IV legislation made steps towards requiring
accountability practices by imposing performance indicators for CTE Tech Prep, many of
which educators thought would be too burdensome given data restrictions between K-12
and higher education (Friedel, 2011; Klein et al, 2014). Since then, CTE programs have
expanded in size and scope. CTE is often part of comprehensive school reforms.
Advanced CTE courses are now linked to initiatives such as school choice and
curriculum standards redesign (Asunda, Finnell, & Berry, 2015; Castellano, Stringfield,
& Stone, 2003; Ramsey, 1995). Further expansion and focus in CTE areas will only
increase calls for accountability and changes to both federal and state policy contexts
(Hernandez, 2014; Maguire, Starobin, Laanan, & Friedel, 2012).
The need for accurate information on the long-term impacts of CTE and Tech
Prep participation is greater than ever. Federal legislators are finally taking up the
reauthorization of Perkins legislation (Klein, 2015; Boyd, Martin, Davenport, & Smith,
2015). Proposed bills have already passed the House and are now being considered by the
Senate for approval (Stratford, 2016; Ujifusa, 2016). Upcoming changes to CTE
legislation coupled with recently changed accountability standards through the ESSA
(Every Student Succeeds Act) will force practitioners and policymakers alike to gather as
much knowledge on current and potential programs that may impact student success.
A study which follows requirements for Scientifically Based Research under
quasi-experimental methods for What Works Clearinghouse will be a welcomed addition
19
to the policy conversation (Gemici & Rojewski, 2007; WWC, 2014). It informs upon the
utility of Tech Prep programs as well as illustrates the possibilities of using longitudinal
data to explore effects of educational models on student outcomes. Additionally, the
exploration of outcomes for students participating in advanced CTE across a large state
with a diverse student population provides helpful insight into the proficiencies and
challenges faced by all states and local levels. Longitudinal outcomes and measures may
help shape greater CTE policy reform as well as inform accountability policies or
performance indicators. The analytic strategies used in this study work together to yield a
rich set of findings which strengthen the connections between advanced CTE
participation and student success.
20
CHAPTER TWO: LITERATURE REVIEW
The following review of literature develops the connections between theoretical
constructs driving educational reform and the outcomes associated with CTE Tech Prep
participation. Economic and social theories of human capital are linked to education as an
investment towards long-term success. Benefits, such as the strong relationship between
educational attainment and wages, are presented (Becker, 1993; Carnevale et al, 2010;
Grubb, 1999). Growing disparities in earning potential are coupled with current-day
changes in economy to describe the pressing need for new, and different, education
models.
In particular, the P-16+ pipeline is used to illustrate problematic transitions
between high school, higher education, and the workforce (Bailey, 2009; Kleinman,
2001; Krueger, 2001). Reforms to vocational education, the shift to Career and Technical
Education—CTE, and the development of Tech Prep programs are detailed in
chronological order and placed within the contexts of the P-16+ pipeline. Concluding a
review of CTE history and legislation, special focus is given to Tech Prep
implementation. The defining characteristics of Tech Prep are explained in relation to
other CTE and college ready initiatives. Important components include the use of
articulation agreements between high school and higher education and the extension of
coursework through dual credit opportunities.
An overview of outcomes associated with Tech Prep suggests the program is a
viable option for improving high school participation. Moreover, it has potential to boost
postsecondary enrollment and attainment (Bailey & Karp, 2003; Bragg, 2006; Cellini,
2006; Stone & Aliaga, 2003). Those who participate in Tech Prep may benefit in future
workforce earnings, whether they continue their education or not (Bishop & Mane, 2004;
21
Bragg, 2006). The chapter closes with a discussion of the limitations in the extant body of
literature which are addressed in the current study.
Theoretical Frameworks
TRADITIONAL THEORIES OF HUMAN CAPITAL
The theory driving current reforms in CTE education is to make education more
responsive to the needs of American capitalism: boosting economic competition, societal
change, and technological innovation (Hernandez, 2014; Lowell, 1995). It is grounded in
the notion that education is the best way to increase both individual and shared
productivity. Taken from an explanation of earning differentials in economist Adam
Smith’s The Wealth of Nations (1793/2008), human capital theory focuses on acquired
capacities of humans, or humans themselves. Capital refers to any addition which works
to extend the productivity of the individual in measures of economy. Shultz, a major
contributor to modern human capital theory suggests,
“People enhance their capabilities as producers and as consumers by
investing in themselves, and that schooling is the largest investment in
human capital” (1963, p. 10-11).
Traditional study of the theory calculates a person’s rate of return on investments
in human capital, including in the formula the cost to acquire the capital and its impacts
on future earnings (Maguire, Starobin, & Laanan, 2012). Economists have used such
models of human capital to study the impact of education on post collegial outcomes such
as short-term and lifetime earnings (Becker, 1963; Carnoy, 2009; Mincer, 1974, 1989).
Detractors argue human capital theory is flawed as not all advancements in
education lead to economic prosperity. In addition, critics point to numerous other factors
which impact potential earnings (Goldberg & Smith, 2008). Human capital theorists
advocate it as a useful rationale from which to study the long-term impacts of education
22
(Becker, 1993). They suggest that education and training are the most important
investment in future earnings, holding individual characteristics constant (Becker, 1963;
Grubb, 1999; Mincer, 1974). Studies based from these theories do have practical
implications. They are able to quantify disparities between educational attainment and
earning capacity (Greenstone et al, 2012; Grubb, 1999; Maguire et al, 2012).
Individual Benefits of Educational Attainment
Research has indeed linked wages to postsecondary attainment. For individuals,
there is a positive relationship between the level of education reached and economic
return (Grubb, 1999; Hanushek & Woesmann, 2010; Maguire et al, 2012). The
association between education and earnings is established, for the most part, in early
adulthood. Gaps between those with and without education are attributed to both hard and
soft skills. Hard skills are proficiencies learned in various subjects and trades while soft
skills refer to attitudes and abilities associated with learning outcomes—work ethic,
motivation, problem solving capacity, time management, etc. (Boudria, 1995; Castellano
et al, 2003; Murnane & Levy, 1996).
Studies have substantiated differences in the level of higher education attainment;
how much postsecondary education a person receives matters. Students gaining an
associate’s degree tend to earn less than those who earn a bachelor’s degree (Grubb,
1999). Though people with two-year degrees traditionally earn less than those with four-
year degrees, there are areas in which an associate’s degree has greater economic return.
Health occupations, engineering, public service, and certain technical areas are linked to
larger returns, especially compared to certain bachelor’s degrees such as humanities or
education programs (Grubb, 1999; Maguire et al, 2012).
The impact of a postsecondary degree on earnings has been replicated over
numerous periods of time suggesting a long-held association between human capital
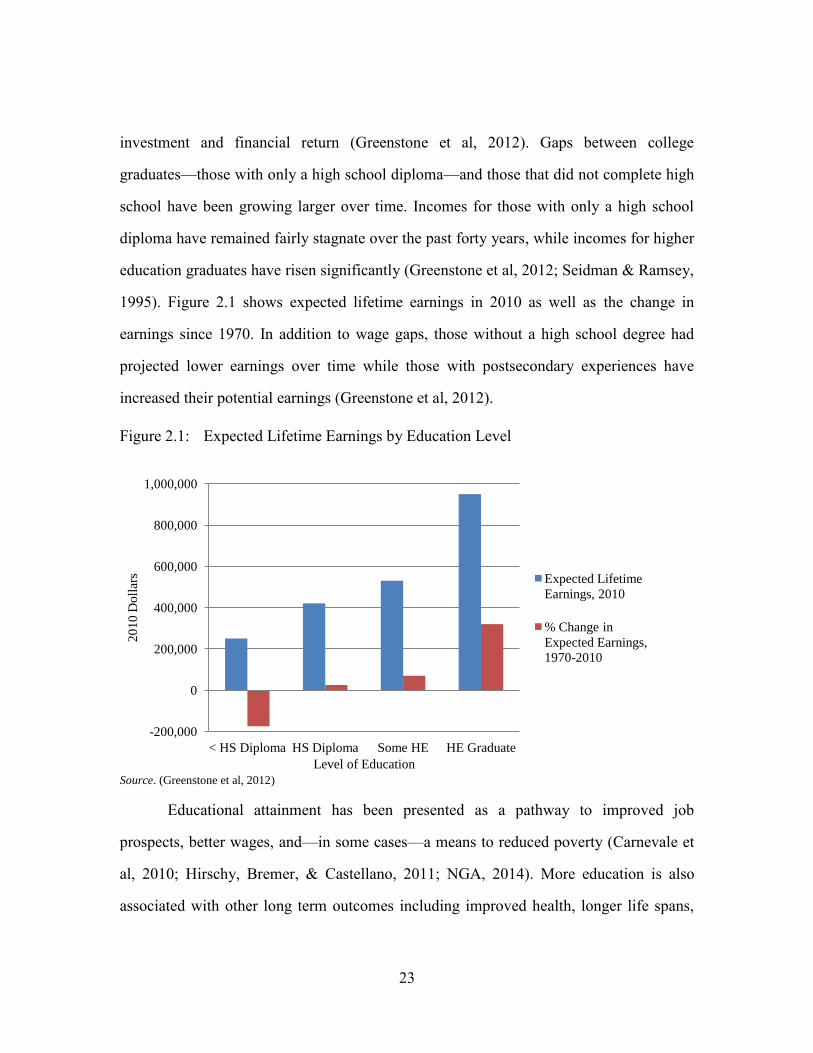
23
investment and financial return (Greenstone et al, 2012). Gaps between college
graduates—those with only a high school diploma—and those that did not complete high
school have been growing larger over time. Incomes for those with only a high school
diploma have remained fairly stagnate over the past forty years, while incomes for higher
education graduates have risen significantly (Greenstone et al, 2012; Seidman & Ramsey,
1995). Figure 2.1 shows expected lifetime earnings in 2010 as well as the change in
earnings since 1970. In addition to wage gaps, those without a high school degree had
projected lower earnings over time while those with postsecondary experiences have
increased their potential earnings (Greenstone et al, 2012).
Figure 2.1: Expected Lifetime Earnings by Education Level
Source. (Greenstone et al, 2012)
Educational attainment has been presented as a pathway to improved job
prospects, better wages, and—in some cases—a means to reduced poverty (Carnevale et
al, 2010; Hirschy, Bremer, & Castellano, 2011; NGA, 2014). More education is also
associated with other long term outcomes including improved health, longer life spans,
-200,000
0
200,000
400,000
600,000
800,000
1,000,000
< HS Diploma HS Diploma Some HE HE Graduate
20
10
Do
llar
s
Level of Education
Expected Lifetime
Earnings, 2010
% Change in
Expected Earnings,
1970-2010
24
and lower rates of crime and incarceration (Greenstone et al, 2012; Grossman &
Kaestner, 1997; Lleras-Muney, 2005; Lochner & Moretti, 2004).
Societal Benefits of Educational Attainment
There are economic benefits to both the individual and to the greater community
in educational attainment. Society benefits from groups of individuals gaining higher
levels of education. In a macroeconomic approach, governments subsidize human capital
by investing in education (Goldberg & Smith, 2008). More educated individuals are more
likely to participate in the job market, work more hours, earn more, and are less likely to
be unemployed. Educated workers translate to well-compensated tax payers (Berger &
Fisher, 2013; French & Fisher; 2009; Greenstone et al, 2012; Hanushek, Ruhose, &
Woessmann, 2015). Research has suggested the return on investment into higher
education is particularly sound; students pay back the monies spent on their education
plus more over their life-span of tax contributions (Berger & Fisher, 2013; Lynch, 2004).
Improvements to education may actually stimulate economic growth. Studies
have theorized that increases in skilled labor supplies lead to demand as employers are
attracted to areas where workers have the skills required for potential jobs (Berger &
Fisher, 2013; NGA, 2014). Indeed, the most vocal groups calling for reform are those
which stipulate shortages in skilled workers as outlined in their strategic plans for
economic development. Groups span certain geographic areas or industries such as
STEM or healthcare (Hart, 2005; Karandjeff & Schiorring, 2011; NAM, 2005;
Washington Achievement Council [WAC], 2013).
TRANSITIONS TO AN INFORMATION ECONOMY
While the link between educational attainment and earning potential has been
well established, gaps are widening more than ever (Greenstone et al, 2012). This is due,

25
in part, to the change of demands in the economy. In recent decades global economies
have shifted away from resource and manufacturing industries, and growth has occurred
in information and services. Along with this shift, the need for greater education and skill
in the workplace has become more pressing.
Markets everywhere are focusing on information technology, or information
economies, as the next step in their economic development. Information economies are
those in which knowledge, technology, and services are more important to the economic
health of a society than the manufacturing of a tangible good. In an information economy,
knowledge is seen as the raw material of value (Castells, 2010). The OECD
(Organization for Economic Cooperation and Development) measures the growth of the
information economies worldwide by tracking household expenditures, domestic
production, international trade, and business and government expenditures of what it
delineates as Information and Communication Technology (ICT) (OECD, 2016). They
have found substantial ICT growth in past years, and with it, demand for more and
different skills in the workplace.
In tandem with economic shifts towards information, the means of trade have also
changed. Each year world economies are becoming increasingly interconnected,
interdependent, and competitive (Corwin, 1995; Crist et al, 2002; Hernandez, 2014;
Ramsey, 1995). America, unfamiliar in the role of a peer rather than singular power, is
tasked with growing its educated labor supply in the face of such contexts.
Need for a Skilled Workforce
Other countries have advanced their educational systems at all levels in tandem
with economic expansion. Advances include skilled technical labor and postsecondary
attainment. Skill development in the United States has lagged in curricular reform,
though (Brown & Schwartz, 2014). Education is not currently meeting workforce
26
demands. Projected changes in economic demand will require even more skills and
educational opportunities.
Today many prime-age workforce members, those ages 25-54, are working in
jobs that require a high school diploma or less. Estimated salaries for jobs with no
skill-requirements average $25,000 (NGA, 2014). These jobs are disappearing which will
leave citizens unemployed or underemployed, stuck with low and unlivable wages
(Carnevale et al, 2010).
Other employment sectors are struggling as well. The mass retirement of current
workers, oft referred to as the baby boomer generation, is on the horizon (Fitzsimmons,
1999). While a recent recession has kept this generation in the workforce longer than
originally expected, larger numbers are starting to retire and many more will soon follow
(Symonds et al, 2011). Additionally, the latest recession has also destroyed a number of
jobs in manufacturing and natural resources that will never return (Carnevale et al, 2010).
Replacement and new job opportunities will require higher skill levels and higher
education credentials.
Estimates project two-thirds of jobs in the next decades will require some form of
postsecondary education (Brown & Schwartz, 2014; Carnevale et al, 2010; Castellano et
al, 2003). Between 25-30% of new jobs in the near future are expected to call for skilled
workers, including those filling shortages in medical fields, information technology, and
engineering industries (Gilbert, 1997). So called middle skills, or middle class jobs, many
of these jobs will require some higher education but not necessarily a four-year degree
(Carnevale et al, 2010). These include positions which necessitate either an industry
recognized certificate or associate’s degree. The average salary for these jobs is currently
$53,000 (Brown & Schwartz, 2014).
27
Projected workforce opportunities and earnings illustrate the need for greater
educational attainment. The United States currently shows one of the largest differentials
in earnings between citizens with and without a postsecondary degree (OECD, 2014).
Those gaps are made more complex by issues of race and class. Students in traditionally
underserved areas, including minority groups, students in low-socioeconomic (SES)
classes, and geographic areas (e.g., urban centers or rural extremes) are linked with lower
enrollment, persistence, and attainment in higher education (Kao & Thompson, 2003;
Ross et al, 2012). Attainment gaps in higher education are historic as well as present in
current data (Lumina, 2015). While numbers of minority and low-SES students have
increased in recent years, the gaps have not significantly narrowed (Ross et al, 2012;
Lumina, 2015).
Barriers to postsecondary enrollment for underserved students include low college
readiness, limited exposure to a college culture, lack of understanding of hidden rules of
college for first generation attendees, and a shortage of financial resources. (Choy, 2001;
NCPPHE, 2008; Seidman & Ramsey, 1995; USDOL, 2015). A recent report released by
the Center on Children and Families at the Brookings Institute, Pathways to the Middle
Class: Balancing Personal and Public Responsibilities suggests that individuals born into
low income households are much less likely to succeed at each stage of life, and less
likely to achieve middle class status by adulthood (Sawhill et al, 2012). Gaps such as
these will only increase and create further inequality if left unchecked.
Calls for Educational Change
Education has historically been seen as the great equalizer, especially in the
United States—the land of opportunity. With no shortage of anecdotal examples,
education has been touted as the means for overcoming any number of disadvantages or
28
setbacks. It is the standard by which Americans strive towards the dream of a successful,
thriving middle class lifestyle (Greenstone et al, 2012).
The preponderance of studies has shown that the lack of a high school degree in
this current day relegates a person to a lifetime of poorly paid, unskilled labor
opportunities (Seidman & Ramsey, 1995). Further, low postsecondary attainment levels
keep many more from experiencing high-paid, middle class, job opportunities (Carnevale
et al, 2010; Castellano et al, 2003). The obligation of educational reform is to create
better postsecondary educational opportunities for all.
Growing requirements for workers and developments in the workforce ahead has
forced many to rethink policy connections between education and employment. In their
set of workforce projections for the upcoming decades, Carnevale and colleagues argued,
“Experts might contest whether everyone needs some college education—
but the labor market clearly has linked middle class employability to
postsecondary education and training.” (2010, p. 110).
Failing to provide students successful pathways to increased educational
attainment is the de facto exclusion of certain Americans from reaching the dream of the
middle class.
Education as a P-16+ Pipeline
It is clear that the connection between economic growth and competitiveness
requires greater education (Amey Eddy, & Campbell, 2010). Persistent, stratifying gaps
in educational attainment coupled with lagging postsecondary enrollment and completion
rates in recent years—especially compared to other developed countries—have led many
to believe that the current high school system may not have the ability to prepare all
students academically or developmentally for college. High school providers may not be
29
the only educators falling short, though. The disconnect between secondary and
postsecondary education may be at the root of the issue (Bailey & Karp, 2003).
CONNECTING PARTNERS IN EDUCATION
Institutional Disorganization
Institutional oversight at all levels impact learning and earning. Each type of
institution has specific difficulties pertaining to moving students towards educational
attainment and job security. High schools are faced with the requirement of preparing
students for both higher education and workforce demands, all while trying to meet
accountability requirements and increasing student retention. Often, standards and
expectations do not match between high schools and other groups (Bragg & Layton,
1995). Higher education institutions are sometimes underutilized and require broader
course offerings to meet workforce demands. What’s more, there is a desperate need to
increase participation within populations of traditionally underserved students
(Karandjeff & Schiorring, 2011; Maguire et al, 2012; Washbon, 2012). The workforce
has traditionally been a silent partner in education. While they are direct beneficiaries of
education through employing skilled workers, they have historically provided little
feedback or active participation in the system. (Carnevale et al, 2010).
To make matters more difficult, secondary and postsecondary systems are
organizationally disparate and customarily lack communication (Crist et al, 2002). They
have conflicting financial systems which result in inefficiency and inequity (Bailey,
2009). Often practitioners from these levels feel they have dissimilar goals and find it
hard to work with each other to develop common curriculum or strategies (Bragg &
Layton, 1995; Parnell, 1985). These differences have worked to reinforce existing
inequalities and widen gaps in achievement and educational attainment (Bailey, 2009).
30
P-16+ Pipelines
From these contexts and concerns has come a strategy to unite the educators,
administrators, and policymakers at all levels. Commonly referred to a P-16 or P-16+
pipelines, these are sets of initiatives which address disconnects and attempt to integrate
the system for greater effectiveness (Bailey, 2009; Kleinman, 2001). P-16+ is named for
the span it connects. It links the start of pre-kindergarten (P) through elementary and
secondary education, transitioning to higher education. Higher education ends with a
four-year degree at grade 16. The plus (+) represents either further, graduate education or
workforce participation. States have created regional P-16+ Councils to promote local
participation between education, workforce, and community partners. P-16+ Councils
work to create more cohesive partnerships as well as implement strategies to align needs
at all levels (Krueger, 2001).
Research in respect to P-16+ pipelines concentrates on identifying which
transitions have a negative impact on students. Additionally studies have identified
interventions which connect transition points and help students reach greater educational
attainment (Bragg & Durham, 2012; Callan et al, 2006; McClafferty et al, 2009; Mustian
et al, 2013). Special focus has been given to identifying strategies to support underserved
populations including disabled and minority students (Fowler et al, 2014; Garrison-Wade
& Lehmann, 2009; Moran, Cooper, Lopez, & Goza, 2009; Olivia, 2004, 2008). The
common themes in these studies suggest that differences between institutional levels
persist and that to reach specific populations, greater partnerships need to be maintained.
Moreover, mindsets need to change about schooling and students for improvement to
occur (Garrison-Wade & Lehmann, 2009). .
31
CREDIT BASED POSTSECONDARY TRANSITIONS
The goal of a well connected P-16+ pipeline is to create successful initiatives
which bridge the transitions between each step, particularly from high school to higher
education (Kim, 2014). A successful reform initiative has been through the use of credit
based transition programs. These are programs which provide early access to higher
education while still within high school. They grant students simultaneous credits
towards a high school diploma and a higher education credential (Bailey & Karp, 2003).
Credit based transition courses have a number of benefits to students. Programs work to
improve motivations and interests, increase multiple skills, expose students to college-
going culture and rigor, and prepare students with the needed information to successfully
enroll and complete higher education (Bailey et al, 2002; Kim & Bragg, 2008; King &
West, 2009).
Credit based classes open up the range of courses provided to students when high
schools are limited by budgets or enrollment concerns. Students are able to enroll in more
diverse postsecondary courses rather than the narrower selection of classes offered under
traditional academic plans (Bailey et al, 2002). These advanced and more varied courses
may improve lagging motivation for both slacking seniors and those traditionally
uninterested in college (Cellini, 2006; Fowler & Luna, 2009; Kim & Bragg, 2008).
Curriculum standards are raised in credit based transition courses. They are meant
to prepare students for the rigors of college coursework. Students are expected to master
hard skills, or those academic and technical skills required by the course content, as well
as soft skills, elements which allow for better social interactions and problem solving.
Soft skills include interpersonal knowledge, observation and articulation, organization
and time management, etc. (Boudria, 1995).
32
Credit based classes expose students to realistic experiences in college settings.
Experiences may improve expectations of higher education as well as familiarize students
with the increased rigor found at the postsecondary levels. Early experience also informs
students about possible hidden rules or curriculums needed to navigate transitions
successfully (Hanson, Prusha, & Iverson, 2015). It helps to demystify college cultures
and administration. Credit based transitions may help to inform students with regard to
useful tools and support networks available in higher education settings (Bailey & Karp,
2003).
Credit based models are seen as a viable mode of creating better linkages between
high school and higher education. In addition to providing students with meaningful
inspiration, credit based transition is meant to provide a fiscal incentive as well.
Decreased financial burdens, and decreased time to degree through credits earned while
still in high school, are meant to make a postsecondary credential a more realistic goal for
those who otherwise would be unable to afford the time or money (King & West, 2009;
Lewis & Overman, 2008). The program is meant to curb the rising costs of postsecondary
attainment and work as an inexpensive option for students (Bailey et al, 2002).
REFORMING TECHNICAL EDUCATION
Traditional approaches have not served students well (Bragg, 2006). High school
students need curricular options that meet requirements for academic achievement but
also fulfill their interests and develop skills for the future (Brown & Schwartz, 2014).
Credit based transitions are a method of delivery which have potential in resolving
disconnects between K-12 and higher education curriculum standards (Kim & Bragg,
2008). Still, the need arises for a content template from which to implement credit based
transitions. Courses or programs need to be formulated and focused towards a desirable
33
opportunity for students. This has been successfully enacted through redesigning
vocational education.
Redirecting Vocational Education
Vocational schools of the past focused on teaching skills at the detriment to
academic content (Brown & Schwartz, 2014; Dare, 2006). In addition, programs were
often separated and tracked away from academic paths and students, creating divisions
which exacerbated gaps and inequalities (Castellano et al, 2003; Dare, 2006). The
growing complexity of industry and press for an educated workforce has demanded a
new vocational learning. Through a series of reforms pushed by policymakers and
practitioners alike, vocational education has been reshaped within the past decades.
Sometimes referred to as a new vocationalism movement, this reform era started in the
1980s and promoted connections between technical content and growing workforce
demands, content and academic skills, and content with postsecondary education (Aliaga
et al, 2014).
Indeed, the use of vocational education has fallen out of favor and the use of
Career and Technical Education (CTE) has taken its place (Friedel, 2011). Along with a
name change, CTE programming has been reshaped to meet the demands of both
knowledge and skills present in today’s workplace. CTE has become more integrated and
complex, introducing technology and newer career paths (Ramsey, 1995). Courses and
programs have—and are still—working to integrate core academic standards alongside
technical training (Stipanovic et al, 2012). Newly designed CTE courses offer career
planning and job exploration; they provide industry exposure through hands-on
experiences and mentoring (Hutchins & Akos, 2013; Rojewski & Hill, 2014).
Most importantly, CTE has developed comprehensive credit based transitions
programs which combine technical skills training, academic content for high school core
34
courses, and simultaneous content at the postsecondary level. Tech Prep programs are
part of a regimented CTE course plan; they include a sequence of study in a defined field
during high school which includes postsecondary training and leaves the student with
some form of higher education certificate or degree upon completion (USDOE, 2014).
Tech Prep programs involve complex partnerships with high schools, higher education
providers, and local industries to fully implement and involve students in the curriculum.
Implemented successfully, they have potential to create coherent transitions in the P-16+
pipeline while providing relevant and rigorous curriculum to all students.
CTE Education Today
The combination of academically challenging CTE and credit based programming
through Tech Prep today are a move towards progressive education ideology.
Championed best by Dewey at the very beginning of educational reform in the United
States, progressive education has always been seen as a means of integrating experience
with learning, shaping content with the changing needs and relative benefit of society
(Dewey, 2004/1909; Glassman, 2001). The combination of college and career readiness
as part of CTE training can be seen as a blend of both pragmatic and classical views on
the purposes of educating children (Herr, 1987; Shimony Russo, Ciaccio et al, 2002).
For the first time, technical programs—those sneered at as vocational education in
the past—have been called upon as a remedy to gaps in educational transitions and
attainment (Ramsey, 1995). CTE Tech Prep programs are seen as promising reforms
which can simultaneously inspire students to train at the postsecondary level while also
keeping traditionally low performing students interested in education long enough to
learn the skills and content needed to secure a quality job (Cellini, 2006; Kim, 2014).
Programs offer a non-traditional path to academic success. Today Tech Prep programs
have been shown to equalize educational opportunities and expectations resulting in
35
diminished tracking and increased participation by all types of students (Dare, 2006;
Fishman, 2015).
Studies have suggested the use of Tech Prep may help with high school retention
and graduation (Cellini, 2006; Stone & Aliaga, 2003). Participation may also lead to a
greater probability of enrollment and persistence in higher education (Bailey & Karp,
2003; Bragg, 2006). These findings are especially true for students at greater risk of
dropping out and receiving an incomplete education (Bragg et al, 2002; Brown, 2003).
Given the need to increase attainment and bridge earning gaps persistent in the
workforce, this reform is an opportunity to place students on “stable paths to solid jobs”
(Brown & Schwartz, 2014, p. 58).
Historical Context of Tech Prep
A brief history of federal and Texas State legislative policies with other related
initiatives follows in order to bring context to CTE, Tech Prep Programs, and the current
study.
FEDERAL CONTEXTS
Smith Hughes Act of 1917, PL65-347
First federal legislation, it is the beginning of government subsidies for
vocational education and started a legacy of support in the area;
Funding for vocational programming required its separation from
academic studies.
George-Reed Act of 1929, PL70-702 / George-Ellzey Act of 1934, PL73-245
George-Deen Act of 1936, PL74-673 / George-Barden Act of 1946, PL79-586
1950 Act to Incorporate the Future Farmers of America, PL740 (FFA)
George Acts along with the FFA Act from the 1930s-1950s increased
federal support to vocational education and started specific programs like
agriculture, home economics, and mechanics.

36
Vocational Education Act of 1963, PL88-210
Amended in 1968 and again in 1976, the act shifted focus to providing for
certain student groups rather than programs; it followed concurrent themes
in ESEA (Elementary and Secondary Education Act) legislation.
The Carl D. Perkins Vocational Education Act of 1984, PL98-524 (I)
Expanded, improved, and modernized vocational programming;
Specified equal access for special populations and gender;
Allowed for formula funds to be split between K-12 and higher education.
The Carl D. Perkins Vocational and Applied Technology Act of 1990, PL101-392 (II)
Goal was to eliminate repetition from high school and higher education,
and attract more students by showing a clear path to postsecondary
education and technical careers;
Required resources to be targeted at special populations including the
poor, disabled, and Limited English Proficient (LEP);
Provided for the creation of regional consortia of high school and higher
education partners;
Introduced Tech Prep Programs:
2+2 or 4+2 programs with sequential coursework and curricular
pathways that lead to a certificate or associate’s degree;
Explicitly required integration of vocational and academic curriculums.
School-to-Work Opportunities Act of 1994, PL103-239 (STWOA)
Goal was to provide for a comprehensive high school system which
transitions to either the workforce or higher education;
Included the integration of academics and applied learning, work
experience, and career guidance;
Reinforced the Tech Prep model put forth by Perkins II legislation, seen
by many as umbrella legislation to broaden Tech Prep implementation.
The Carl D. Perkins Vocational and Technical Education Act of 1998, PL10S-332 (III)
Officially repealed Smith Hughes Act;
Expanded Tech Prep to include bachelor degree granting programs (e.g.,
2+4 or 2+2+2);
Included language on performance indicators and evaluation.
37
OVAE Career Clusters, 1999
Office of Vocational and Adult Education (OVAE) in the U.S. Department
of Education officially adopted 16 career clusters for use in CTE
programs.2
The Carl D. Perkins Career and Technical Education Act of 2006, PL209-270 (IV)
Name changed to CTE;
Called for additional rigor in integrating academic and technical content;
Increased accountability with reporting measures on performance
indicators;
Introduced Programs of Study (POS):
Coherent and rigorous content aligned with academic standards
and CTE content;
Sequenced through articulation agreements, leads to a certificate,
associate, or bachelor degree, specifically may include dual credit;
Allowed states to merge their Tech Prep (Title II) and CTE (Title I) funds.
Congressional Funding, 2011
Eliminated Tech Prep as a separate funding structure under Perkins and
combined all CTE formula funds together;
States required to use funds to develop POS, most implemented plans
include Tech Prep offerings.
Presidential Executive Order 13697 amending 11155, 2015
Formally expanded the Presidential Scholars Program to include
recognition for student excellence in CTE;
Students to be recognized alongside those traditionally granted this award
for accomplishment in academics and the arts.
2 Career Clusters include: 1) Agriculture, Food, & Natural Resources; 2) Architecture & Construction; 3)
Arts, A/V Technology, & Communications; 4) Business Management & Administration; 5) Education &
Training; 6) Finance; 7) Government & Public Administration; 8) Health Sciences; 9) Hospitality &
Tourism; 10) Human Services; 11) Information Technology; 12) Law, Public Safety, Corrections, &
Security; 13) Manufacturing; 14) Marketing; 15) Science, Technology, Engineering, & Mathematics
(STEM); and 16) Transportation, Distribution, & Logistics.
38
Perkins Reauthorization, 2015-2016
In October 2015 members of the Senate Education Committee confirmed
they were drafting new Perkins legislation;
The House Education and the Workforce Subcommittee held early
hearings on the topic in November 2015;
The House passed the Strengthening Career and Technical Education for
the 21st Century Act (405-5) in September of 2016 but it has yet to be
taken up by the Senate;
Differences of opinion exist on the definition of CTE students for
funding and the level of oversight granted to the Department of
Education (DOE) for accountability purposes.
(Friedel, 2011; see also: Boyd et al, 2015; Bragg, 2006; Castellano et al, 2003; Hershey et
al, 1998; Klein et al, 2014; Klein, 2015; Lewis, 2008; Seidman & Ramsey, 1995;
Stipanovic et al, 2012; Ujifusa, 2016).
TEXAS STATE CONTEXTS
Quality Workforce Planning Committees, 1989
Built out of early federal Job Training Partnerships and other policy/grant
programs;
Created formal vocational and technical planning committees within
regions;
Members included representatives from business, training providers, K-12,
and higher education;
Committees conducted regional labor market analysis and identified target
occupations for job training and technical education.
Tech Prep Planning Consortia, 1990-1999
Established Tech Prep consortia in response to Perkins II;
Used same membership as Quality Workforce Planning Committees for
consortia;
Size of consortia ranged from one community college with eight ISDs to
10 colleges with 85 ISDs, the average consortia served multiple districts
and had one college.
39
Tech Prep Implementation, 1991
Implemented Tech Prep in a state-wide, comprehensive manner;
In the first year 25 regional consortia were given grants:
Expanded Tech Prep offerings at 57 two-year colleges and over 950 ISDs.
State Level Articulation Guidelines, 1993
TEA (Texas Education Agency) and THECB (Texas Higher Education
Coordinating Board) adopted joint guidelines on state level articulation
agreements for Tech Prep plans:
Texas Tech Prep programs required 4+2 model;
Tech Prep and other vocational education indicator codes added to state
K-12 data collection system – PEIMS (Public Education Information
Management System);
Indicator Codes added to higher education data:
Degrees (AA) completed as part of Tech Prep were flagged in
graduation files;
Enhanced skills certificates were created to provide recognition in
attainment of skills, also flagged in graduation files.
Texas Tech Prep Act of 1999, HB2401
Prior to codified Texas law:
56 of 57 colleges offered Tech Prep programs;
Over 700 ISDs actively participated across the state;
540 articulation agreements;
760 degree programs, 830 certificate exit points, and 370 enhanced
skills certificates offered;
Act established the official parameters of Tech Prep in Texas legislation
and policy;
Defined the membership and roles of Tech Prep consortia;
Codified in Texas Education Code (TEC) Chapter 61, Subchapter T (see
Appendix A for the full text).
Statewide Articulation, 2000
62 of 73 community and technical colleges (88%) voluntarily adopted the
statewide articulation agreement for eligible Tech Prep courses.
40
Texas Tech Prep Act of 2005, SB1809
Emphasized importance of Tech Prep and provided for clarified funding
structures;
Required evaluation of state Tech Prep programs.
Present Day Implementation
Texas is one of 29 states by 2008 with highly developed Tech Prep
programs;
Developed/implemented statewide K-12 standards for CTE as well as
postsecondary standards which align to high school curriculum;
Texas has 26 consortia which are overseen by the THECB, many consortia
serve dual purposes as regional P-16 Councils;
By last count in 1996, there were over 8,900 individual articulation
agreements;
Several pieces of legislation created small changes to existing Tech Prep
policy:
SB1410 in 2011 mandated evaluation of Tech Prep programs by
consortia in accordance with federal guidelines;
SB715 in 2013 defined certain terms for use by counselors;
HB5 in 2013 required Tech Prep programs to comply with
academic requirements needed to gain a diploma under the created
Foundation High School Plan (FHSP);
TEA dropped the Tech Prep indicator from its PEIMS data collection:
Variable started its phase-out with students entering the ninth
grade in the 2011-2012 school year;
Replaced by CTE and ATC (Advanced Technical Credit)—along
with dual credit—indicators in course taking.
(Brown, 2001: see also: Bush, 2008; Nelson, 1994; Schneider, 2008; TEA, 2016;
TECHS, 2016)
Other Programs Not the Focus of the Study
There are a number of programs which include CTE, integrated academic
curriculum, credit-based transition programs, work experience, or other key components
that are seen in Tech Prep programs. Oftentimes, these programs are discussed in tandem
with Tech Prep in the extant literature. These programs include well known credit based
41
transitions such as Advanced Placement (AP) courses, International Baccalaureate (IB),
or credit-by examination. Also included are career academies or pathways, Early College
High Schools (ECHSs), youth apprenticeships, and distance learning. Because these
programs are also important reform initiatives and have their own outcomes, a brief
summary is given for the programs most often compared to Tech Prep. The focus of the
current research project does not include these programs and, as such, the study does not
cover their use or impact further.
Career academies most often are organized around one or more career clusters.
They have varied results and are dependent on program components (Castellano et al,
2003; Castellano, Sundell, Overman, & Aliaga, 2012). Some academies are actually Tech
Prep programs or have Tech Prep options (Kompelien, 1996). ECHSs, sometimes
referred to as Middle College Schools (MCSs), are intensive dual enrollment programs.
ECHSs have been found to be successful with at-risk students and are linked to higher
achievement and increased high school graduation rates. Varying to lower rates of higher
education attainment have been associated with ECHSs (Bailey & Karp, 2003; Stipanovic
et al, 2012). Youth apprenticeships were a popular notion in the 1990s based on European
models of paid apprenticeships. They were implemented in a limited fashion under
STWOA but have since fallen out of favor (Kompelien, 1996; Stipanovic et al, 2012).
Distance learning has been used as a means of boosting technical education in
underserved areas such as rural locales but is not the preferred mode of delivery (Benson
et al, 2008; Fishman, 2015; Wilson, Parr, & Parr, 2012).
42
Tech Prep Implementation
Educators in CTE have been working hard to remove the stigma associated with
vocational education. Their efforts and reforms have led to new initiatives which are far
different than the programs of yesteryear. These initiatives are not “voc-ed” renamed but
rather advanced CTE which require relevant coursework and rigorous math and science
concepts, academic objectives framed through occupational and technical contexts
(Gilbert, 1997).
ORIGINS
Tech Prep programming was the conception of the 1980s American Association
of Community Colleges president, Dale Parnell. Parnell gathered together his experiences
as a former high school principal, superintendent, and community college president,
coming to the conclusion that the education community was failing the majority of its
students (Cellini, 2006). He called this majority the neglected majority. He asked,
“When 75% or more of our high school graduates do not complete the
baccalaureate and 25% of those who begin high school do not even finish,
one must question the validity of the current educational program for the
great mass of individuals in the middle quartiles of the typical high school
student body. What kind of educational program will meet the needs of
these three out of four students? Can these students experience
excellence?” (Parnell, 1985, p. 16-17).
Noting that current students were falling further behind in a progressively more
competitive world, he set a goal of increasing educational attainment by improving
transitions between high school and higher education (Bailey et al, 2002; Cellini, 2006).
Specifically he believed in transitions between high school and community college as a
way to bridge the gap in the P-16+ pipeline. Parnell argued that community colleges had
43
spent too much of their focus on the wrong transitions (four-year institutions) and the
wrong students, those already planning to attend postsecondary education. He shifted
focus to his so-called neglected majority and put forth a program plan which would
expose students to higher education while also providing practical and relevant learning
experiences through technical education (Parnell, 1985).
The neglected majority, sometimes called the middle majority, are those students
whom are neither high nor low achieving. Most of the neglected majority fails to enroll or
complete postsecondary education. Common definitions include a range between the 25th
and 75th
percent of high school class rank, or other achievement measures (Bragg, 2000).
The initial aim of Tech Prep programs was to keep middle majority students interested in
learning and inspire students to continue their education beyond high school (Cellini,
2006).
Although Tech Prep started out as a program targeted at the neglected, middle
majority, over time it has been expanded as a reform measure which can be used to
provide college exposure to a wider set of student populations (Bragg, 2000; Cellini,
2006). Tech Prep has been explored as a program to expose students across all
spectrums—low achieving, traditionally underserved populations, special populations,
gifted students, traditional academically oriented students—to higher education while still
in high school (Bragg et al, 2002; Brown, 2003). It is argued that CTE Tech Prep, with its
combined focus on academic and technical education, has the ability to overcome racial
and class separations—and gaps—persistent in schools today (Bragg & Layton, 1995).
REQUIREMENTS
The goals of Tech Prep programs are to create better articulation between high
school and higher education, engage students in career focused pathways, prepare
students for college and careers, and allow for workplace exposure and mentoring
44
(Bragg, 2000). Traditionally, Tech Prep programs are comprised of several key
requirements which set it apart from other CTE programs:
In order to provide a smooth transition between high school and higher education,
programs must articulate, or reach concrete agreements, as to how they will
partner and provide both secondary and postsecondary content (e.g., articulation
agreements);
Programs are comprised of what is commonly referred to as a 2+2 structure. This
includes at least two years worth of secondary instruction followed by two years
of postsecondary study and credits. Other structures may include a 4+2 structure
starting earlier in high school or 2+2+2 structures which combine high school
with higher education at both community college and university levels; and
Programs must terminate in the completion of a higher education credential.
These may include an industry recognized certificate, associate’s degree, or
bachelor’s degree (Hershey et al, 1998; Kim, 2014; Parnell, 1985).3
Programs first grew under CTE reform and were further implemented by the
nation at large after Perkins II set up formalized structures and funding (Bragg, 2000;
2006). Appendix A provides the text of the TEC which is used to administrate Tech Prep
programming in Texas; the code outlines the components of Texas Tech Prep in
accordance to state and federal laws. Programs under federal purview have additional
requirements for Tech Prep:
To oversee and implement articulation agreements, regional consortia groups
consisting of high school and higher education partners need to be formed;
3 Tech Prep program plans are comprised of both high school and higher education participation, and
culminate in a postsecondary credential. Not all students who enroll in Tech Prep complete all parts of the
program, though. Some students drop out of Tech Prep. Difficulties in sharing data between secondary and
postsecondary institutions make it harder to track each student as they complete all requirements of the
Tech Prep program plan.
45
Developed programs may be structured under 2+2, 3+2 or 4+2 designs;
Program content must include curriculum which includes common core
proficiencies in math, science, and technology;
In addition to program courses, programs must provide for preparatory services
including recruitment, career counseling, and occupational assessments;
Joint, in-service professional development for all instructors and preparatory
service providers (e.g., counselors) must occur. This includes training for both
high school teachers and higher education professors; and
Equal access for all students should be provided (though earlier legislation had
regulations for targeted access for special populations) (Friedel, 2011; Office of
Career, Technical, and Adult Education [OCTAE], 2016).
IMPLEMENTATION
Regional Consortia
Federal funds for Tech Prep flow into all states’ coordinating bodies as part of
formula funding and are then given out to local consortia to administer (Bragg, 2006,
Silverberg, Warner, Fond, & Goodwin, 2004; Stone & Lewis, 2010). Consortia are
traditionally made up of multiple secondary schools, a few postsecondary institutions,
and various workforce and community stakeholders for that region (Bragg, 2006).
Consortia structures fluctuate but are usually administered by postsecondary
representatives (Hershey et al, 1998).
Though not formalized in state policy, most states reported hosting state level
planning teams to initially organize policies and consortia requirements at the start of the
implementation process (Bragg & Layton, 1995). Benefits of consortium participation
have included communication and cooperation, mobilized interest for change, employer
46
contacts, and focused need for curricular changes in math and science skills (Hershey et
al, 1998). As part of a 1998 federal evaluation of Tech Prep, researchers found that
around 70% of school districts participated in a Tech Prep consortium (Hershey et al,
1998). Today, consortia have impacted huge amounts of schools. A survey of states in
2008 found that over half (29) provide focused Tech Prep programs (Brush, 2008).
Somewhere between 10-14% of the student population is enrolled in Tech Prep or similar
advanced CTE programs of study (Bragg, 2006; Stone & Aliaga 2005).
Local Variability
Studies of implementation suggest there is a great deal of variability in both the
policies directing Tech Prep and the programs provided to students (Bragg et al 2002;
Hershey et al, 1998) The most important finding from implementation studies has been
the notion that there is no common definition of Tech Prep (Beaumont, 1995). Because of
flexibility in federal policy and funding, there has been wide variation in state and local
definitions of the program which has made evaluation and comparison difficult (Cellini,
2006; Lowell, Boggs, & Stumpf, 2005). Further, it has complicated understandings of
how additional or auxiliary policies from federal or state governments fit with the model
(Beaumont, 1995).
Statewide Implementation
Research at the state level illustrates that policy processes may facilitate CTE
Tech Prep programming by providing advanced planning and alignment opportunities
(Cantor, 1999; Corwin, 1995; Marsh, 2000). Surveys of state implementation find
differing levels of participation and an ever-growing need to expand business
relationships (D’Amico, Morgan, Katsinas, & Friedel, 2015). Finding it a viable option
for testing the waters of higher education, Tech Prep has expanded in states, though
47
differing levels of participation and commitment still exist among high school and higher
education members. (Alexson & Kemnitz, 2004; Harnish & Lynch, 2005; Waller &
Waller, 2004).
A survey of Virginia implementation found that developing an implementation
plan proved helpful. They created a needs assessment followed by the development of
curriculum and courses. Only then did Virginia roll-out Tech Prep programs. In their
needs assessment they found creating close liaisons with businesses and developing high-
tech, contextual learning opportunities were the best design options in impacting
economic development (Cantor, 1999).
Wisconsin started its policies by aligning P-16+ curriculum in 1998. They found
that gaps were not in curriculum, but in misaligned student, teacher, and professor
expectations. Policymakers worked to address negative perceptions by increasing study
skills, support, and advisement opportunities (Alexson & Kemnitz, 2004). Minnesota
worked towards implementation in a similar fashion. The state implemented Tech Prep as
part of a larger set of postsecondary transition policies. They initiated a formalized
campaign to articulate programs, identify and support best practices, and evaluate student
achievement outcomes (Crist et al, 2002). Indiana implemented its Tech Prep programs
by first funding five demonstration sites. At these sites, professional development
opportunities and visits for teachers were conducted to provide feedback. Reponses from
professionals and stakeholders were used to create a single model which was then
implemented across the state and mandated for all schools (Corwin, 1995).
Texas implementation research has found disparate ideologies on participation
and purpose. A survey of community college administrators in Texas established that
there was active participation in Tech Prep across the state, though differing perspectives
on program impact dependent on the individual institution’s level of involvement with
48
their local consortia. Institutions with more active participation in the consortia reported
greater gains for students (Brown, 2001). An overview of Texas Tech Prep consortia
found that Tech Prep programs and articulated CTE courses had increased dramatically
since their inception. Indeed, in 2003 over half of the state’s applied science degree
programs were also involved with Tech Prep, and 64% of ISDs carried Tech Prep
programs. In a scan of consortia member opinions, researchers found that K-12 partners
held higher opinions on purpose, leadership, communication, and student success.
Analysis showed community college partners were not as well versed in Tech Prep goals
and both groups had difficulties communicating during strategic planning (Waller &
Waller, 2004).
Local Implementation
Individual program studies have been popular. They often detail the myriad of
partners included in their program, the initial planning of programs, and an analysis of
implementation thus far (Addison & Lane, 1995; Haag, 2015). Like statewide studies,
local studies have shown that strong planning and communication improve program
structures and participation (Draeger, 2006). Researchers and practitioners have also
shared the tools used to create, implement, and improve programs (Addison and Lane,
1995; Otterstetter, Buser, Kappler et al, 2011). Findings suggest there are many ways to
deliver Tech Prep and that local groups work to provide programs that suit their distinct
needs.
Looking at a set of advanced technical education programs funded by the National
Science Foundation (NSF), researchers found that only half of programs used workforce
assessments in program evaluation activities; most used secondary data sources,
anecdotal information, or local surveys to find out about workforce demand (Bartlett,
Schleif, & Bowen, 2011). Addison and Lane (1995) looked at a program in Iowa which
49
created their own workforce assessments. Their career maps were made to be used by all
stakeholders; they were also used in tandem with career inventories and counseling in
Tech Prep programs.
A program for athletic healthcare in Utah outlined their model from the
application process to the rubrics they used in the project-based senior thesis component
(Otterstetter et al, 2011). Various other programs described the changes they have made
to their curriculum to include project-based learning and the creation of capstone projects
(Haskell & Haskell, 2008). In a program focused on women in engineering and
technology fields, implementation study revealed challenges at aligning responsibilities
between program partners as well as curricular alignment (Boudria, 1995). A program
focused on health science in New Jersey discussed its efforts to promote health
practitioner careers in underserved groups including minority, low-SES, and female
students (O’Sullivan, Maillet, & D’Anna, 2001). Programs in Maine and New York
relayed efforts to implement associate and bachelor degree granting programs for
students in medical technologies, mechanical engineering, or agribusiness (Fitzsimmons,
1999; Shimony et al, 2002).
One study overviewed a Tech Prep program in the RGV—Rio Grande Valley that
is part of a credit-recovery program. The College Career and Technology Academy takes
students who have dropped out or failed exit exams (ages 18-26). Using credit-recovery
and dual enrollment, the academy seamlessly transitions students to community college at
South Texas College while finishing up high school requirements. The program has been
so successful with student achievement and raising retention rates at the local high
school, several other districts have replicated the initiative (Allen, 2012).
50
Lessons From Implementation
Implementation has shown a number of successes and complications in the use of
Tech Prep models. Challenges to and within implementation have been numerous.
Barriers to implementation have included funding streams and fiscal issues which have
varied as much as programs (Bailey et al, 2002; Bragg, 2000; Bragg & Layton, 1995). A
recent survey found that targeted state dollars beyond federal funding were rare
suggesting state and local support has been dependent on federal apportionments and lack
wider investments. (Bragg, 2006).
Challenges within implementation are grouped around two issues, problems
bringing stakeholders together and limited change in curricular reform. Studies noted
mistrust and skepticism between groups which obstructed articulation of programs
(Alexson & Kemnitz, 2004; Bragg, 2000). Miscommunication and lack of common
expectations has kept programmatic and curricular changes from occurring (Bragg &
Layton, 1995). When programs have worked, administrative formalities of creating and
maintaining the consortia partnership have eaten into the time meant to work
collaboratively together (Bragg & Layton, 1995; Farmer & Farmer, 1999). Lengthy and
multiple articulation agreements have hampered efforts at institutional learning and
curricular reform (Bragg & Reger, 2002).
Indeed, in the 1998 federal evaluation, researchers found that implementation had
left gaps in curriculum reform that hindered transitions (Hershey et al, 1998). Despite
calls to integrate academic and technical education standards, little evidence from studies
has shown meaningful changes to secondary or postsecondary curriculum (Brown, 2001).
Programs are still working to incorporate academic rigor and vertically align courses with
higher education standards (Schneider, 2008). There have been improvements within
Tech Prep implementation, though. Curriculum content and standards are becoming more
51
applied, but it is a gradual process (Bragg, 2000; Bragg & Reger, 2002; Hershey et al,
1998). The program has been effective in transitioning vocational education from
teaching skills for a specific job to exploring broader career clusters which enable
students with a larger set of skills for success (Bragg, 2000).
There are other successes within Tech Prep implementation. The widespread
development of programs has led to increased P-16+ partnerships and collaborations at
all levels, especially among traditionally oriented academic and technical providers.
Further, it has worked to bring employers into the conversation (Bragg, 2000; Hershey et
al, 1998). Tech Prep has led to greater awareness around the issue of P-16+ and
transitions between high school and higher education (Bragg, 2000).
Successful Tech Prep programs have been shown to have a similar set of
structures and practices. These include: formal articulation strategies, rigorous
curriculum, meaningful links to theory and practice (i.e., relevance), and outcomes-based
curriculum (e.g., project-based learning, authentic assessment). In addition they have
opened access for all students and hosted collaboration between high school, higher
education, and the workforce (Bragg, 2000). The most comprehensive of programs
studied were those which provided professional development for all its stakeholders and
those which had well-developed preparatory services to aid instructional programs
(Bragg, 2000; Stipanovic & Stringfield, 2013).
The last federal authorization of CTE legislation, Perkins IV, had a noticeable
decline in the requirements specific to Tech Prep (Friedel, 2011). Instead, requirements
for Programs of Study (POS) were adopted. POS are very similar to Tech Prep. They
provide for articulated CTE courses and sequenced material utilizing both high school
and higher education. Also, POS offer pathways to postsecondary enrollment and the
attainment of a credential. POSs only differ from Tech Prep in the variety of programs
52
and industries they cover, and the wide population of students which may enroll. Indeed
many POS are also Tech Prep programs (Castellano, et al, 2012; Hershey et al, 1998).
Since the growth of POS, Tech Prep has fallen from named legislation. Specific
funding for the program was eliminated in 2011; funds were combined with existing CTE
formula grants for wider use. Many states chose to use funds to extend Tech Prep to more
students or other career areas (National Assessment of Career and Technology Education
[NACTE], 2014). When surveyed in 2008, over half of secondary and postsecondary
program providers reported that one of the top five POS at their institution was either
Tech Prep or a program which had been previously labeled Tech Prep (Klein et al, 2014).
Moreover, providers pointed to the foundational work of Tech Prep consortia—existing
partnerships, articulation agreements—and successful programs as a well-founded
background for implementing POS (Klein et al, 2014).
Key Components of Tech Prep
As put forth by the original conception of Tech Prep conceived by Dale Parnell in
1985, there are important components to Tech Prep which make it different than other
reforms and programs. These components include the articulation agreements used to
ease the transition between high school and higher education. They allow for partnerships
between secondary and postsecondary institutions. The other component is the
integration of academic content with CTE skills and training. College and career
readiness in advanced CTE offerings is accomplished through dual credit opportunities.
The following section defines these components further and connects their importance to
successful Tech Prep programming.

53
ARTICULATION AGREEMENTS
Tech Prep is an example of a credit based transition model (e.g., dual credit). The
goal of credit based transitions is to increase the number of high school students that go
on to college. Providing early access to college courses is meant to eliminate duplication
and align curriculum between institutions (Alexson & Kemnitz, 2004; Fowler & Luna,
2009). The earliest credit based program occurred at Syracuse University under a
program named Project Advance. Though the first program occurred at the university
level, most programs now exist at the community college level under formal articulation
policies (Fowler & Luna, 2009).
Formal articulation provides stability in the transition to a P-16+ format.
Articulation agreements authorize partnerships between high schools and institutions of
higher education. They are the written agreements which plan out pathways to college
through courses and credits at both institutions (Alexson & Kemnitz, 2004). These
agreements delineate each part of the process. They include:
What course or courses will be granted credit;
What students will be eligible to enroll;
What curriculum will be covered;
How credit will be given at both K-12 and higher education levels;
What location(s) courses will be taught at; and
Who will teach course(s) and what training requirements will the job(s) require
(Brown, 2001; Hershey et al, 1998).
Types of articulated programs are usually separated into three categories. The first
are singleton programs which include one-class courses meant to provide enrichment;
examples include a dual credit course or AP class. Articulation agreements for these
courses often focus on course-to-course equivalents matching the requirements of the
54
high school class to the postsecondary curriculum. The next level are comprehensive
programs in which students take most of their courses through a credit based program of
study; these include IB programs as well as Tech Prep. Program level articulation
provides an outline of all the courses included and delineates which will be granted only
high school credit and which will be given dual or college credit (Brown, 2001). Lastly,
enhanced comprehensive programs go a step further and provide support systems or
elective areas in addition to sequenced course structures (e.g., ECHS, career academies,
etc.) (Fowler & Luna, 2009).
Articulation requires communication between secondary and postsecondary
partners. Discussions of expectations and goals are then followed by curriculum
alignment and an outline for the sharing of resources (Amey et al, 2010; Cantor, 1999).
Articulated courses grant many benefits to students. They are meant to reduce time to
degree in higher education in addition to overall tuition costs (King & West, 2009).
Courses are geared to increase engagement and motivate students traditionally
uninterested in school or lacking drive due to senioritis (Fowler & Luna, 2009).
Working to formulate agreements has increased opportunities for institutional
sharing at all levels. In a term of Amey et al (2010) defines as “partnership capital”, both
sides share their organizational and social capital resulting in greater efficiency and
capacity to meet demand. Implementation studies suggest successful programs have well-
delineated articulation agreements. In its evaluation of early Perkins legislation,
researchers found that the focus of CTE and Tech Prep had increased formal articulation
throughout the nation; most agreements covered course-to-course or single class
alignment rather than entire program agreements (Hershey et al, 1998). Other studies also
noted that a large number of articulation agreements were formed on existing curriculum
(Bragg, 2002; Brown, 2001).
55
Local and Statewide Agreements
There are two main formats in which articulation takes place, local and statewide.
In local articulation agreements, a specific high school and higher education partnership
make an agreement for a course or set of courses. The agreement only pertains to their
unique partnership. It may also incorporate other elements in addition to the course and
curriculum layout. In an example of forming local articulation agreements, one study
described the steps a Project Lead the Way (PLTW) program took to partner its high
school and local postsecondary institutions. As they worked to create a program, the
agreement incorporated specific supports unique to their community and student
population such as family-driven opportunities to demystify higher education (Starobin &
Bivens, 2014).
Statewide articulation provides for either a list of courses or entire programs
which may be provided by partnering institutions. Statewide policies have grown over
time as individual articulation agreements have become burdensome at all levels—
secondary, postsecondary, and the state (Brown, 2001; Waller & Waller, 2004). King and
West (2009) describe the implementation of one statewide articulation program.
Policymakers held state meetings to review curriculum and courses. Participants were
granted access to the numerous local agreements to evaluate, only selecting the best
programs and individual courses to include out of individual agreements from all over the
state. The best articulation agreements were expanded to all participating institutions.
Statewide articulation agreements, in particular, are helpful in that they reduce confusion
and enhance transferable credit opportunities for students (King & West, 2009).
Implementation setbacks in Tech Prep programming have most always called for
greater time spent to articulate between partners, or the need for statewide agreements
(Bragg & Layton, 1995; Bragg & Reger, 2002; Crist et al, 2002; Farmer & Honeycutt,
56
1999; Laanan, Compton, & Friedel, 2006). Increased Tech Prep participation has been
linked to the successful use of articulation agreements, especially the growth of statewide
articulation (Bragg, 2000; Brown, 2001; Hershey et al, 1998; Waller & Waller, 2004).
CAREER AND TECHNICAL EDUCATION
Studies have suggested the use of CTE, specifically CTE Tech Prep, may help
with high school retention and graduation, as well as lead to a greater probability of
enrollment and persistence in higher education (Bishop & Mane, 2004; Kim & Bragg,
2008; Zinth, 2014). Studies link CTE to enrollment in both two- and four-year
postsecondary institutions (Neild & Byrnes, 2014). Participation may especially aid
students at greater risk of dropping out of high school (Allen, 2012). With its success,
CTE policies currently drive the growth of Tech Prep and its structured its program
content.
Congress explicitly required the integration of academic and technical content in
CTE courses with its reauthorization of Perkins II legislation in 1990. Legislation cited
the need for more advanced academic skills as they would be required for both growing
job opportunities and desired educational outcomes (Seidman & Ramsey, 1995). In doing
so, it paved the way towards college and career readiness skills in CTE classrooms. Later
additions to Perkins IV in 2006 would reify the connection by requiring academic and
technical content alignment with both secondary and postsecondary curriculum
(Stipanovic et al, 2012). Implementation of integrated academic content and rigor has
been limited. Evaluation of progress suggests gradual changes have been made but
further alignment needs to occur (Schmalzried & Harvery, 2014; Spindler, 2010; Loera,
Nakamoto, Oh & Rueda, 2013; Manley, 2011).
CTE has reformed programs to integrate better exposure to relevant career paths
and local workforce experiences. With it there has been a structured increase in career
57
assessments as tools to reach students (Rojewski & Hill, 2014). CTE courses match job
exploration, curriculum content, and internship opportunities together. These provide
exposure and mentoring experiences. Additional adult partners from the local workforce
help shape student goals and demonstrate the importance of continued learning
opportunities (Hutchins & Akos, 2013). Implementation studies have suggested
successful programs involve supplementary support services. These include career and
guidance counseling and program advisory committees which help ensure student success
(Stipanovic & Stringfield, 2013; Washbon, 2012).Today efforts remain to increase the
number and scope of CTE courses and programs beyond traditional vocational areas
(Hutchins & Akois, 2013).
CTE Students
As a greater and more diversified set of students have become involved in CTE
course-taking; the definition of a CTE student has evolved. Historically definitions of
students depended on dichotomous groupings of either vocational or academic
orientation. As academic requirements have increased for all students in recent years,
traditional definitions have become less useful (Bishop & Mane, 2004; Meer, 2007).
Expansion of CTE courses across the broader student population has made simple
groupings even less feasible. Researchers and policymakers have thus turned to
definitions reliant on the amount and type of CTE courses students complete. Common
groupings include:
CTE Students or Participants - those who complete one or more individual CTE
courses in different areas;
CTE Concentrators or High Intensity CTE Students - those who complete several
(usually three or more) grouped CTE courses in a specific area (may be in a POS
including Tech Prep); and
58
CTE Non-Concentrators - students taking several CTE courses in a variety of
occupational areas (Aliaga et al, 2014).
Grouping requirements, the numbers of courses needed to reach a specific level,
and occupational/career markers vary between programs and states (Aliaga et al, 2014;
Cox, Hernandez-Gantes, Fletcher, & Howard, 2015; Meer, 2007; Stone & Aliaga, 2005).
That considered, an average student today completes 3.6 CTE credits during their high
school career (Aliaga et al, 2014). Research using National Educational Longitudinal
Study (NELS) data found that minority, urban, and rural students were more likely to
enroll in CTE courses as well as students with lower GPAs than general academic
students (Stone & Aliaga 2005). Also, slightly more women than men were enrolled in
CTE coursework (Cox et al, 2015). Of women enrolled in CTE courses, a breakdown
study suggests that enrollment is often segregated along traditional gender lines (Eardley
& Manvell, 2006).
CTE Outcomes
CTE participation has positive influences on soft skills such as identifying and
clarifying career interests along with increased motivation and engagement (Esters &
Retallick, 2013; Qi, & Cole, 2011). Other studies have suggested participation may
decrease educational and career expectations (Kelly & Price (2009). Differences may be
due to implementation variation as students who feel supported report more engagement
in courses and are more likely to engage in career planning (Loera et al, 2013).
CTE participation has been shown to improve hard skills as well. These include
attendance, academic achievement in multiple subject areas, and the completion of higher
level academic subjects (e.g., college ready math) as well as credit accumulation and
graduation rates (Bishop & Mane, 2004; Israel, Myers, Lamm, & Galindo-Gonzalez,
2012; Neild, Boccanfuso, & Byrnes, 2015; Pierce & Hernandez, 2015; Richard, Walter,
59
& Yoder, 2013). Participation has also been associated with reducing dropout rates and
increasing postsecondary preparedness (Castellano et al, 2003; Plank, DeLuca, &
Estacion, 2008). Bishop and Mane (2004) found higher attendance and graduation rates
for CTE students, defined as those devoting at least one-sixth of their time in vocational
courses.
Gains from students in advanced CTE courses—those which integrate academic
and technical content—are similar to those in academic tracks alone, suggesting that
integrated coursework might be another, alternative path to student success and college
readiness (Bozick & Dalton, 2012; Dare, 2006). CTE participation combined with
academic course taking is associated with improved retention; a middle-range
combination of both CTE and academic courses decreases risk of high school dropout
(Plank, 2001; Plank et al, 2008).
Those involved in Career and Technical Student Organizations (CTSOs), are
associated with greater academic motivation, academic engagement, grades, career
efficacy, college aspirations, and employable skills (Alfred et al, 2006; Gentry, Hu,
Peters, & Rizza, 2008). Specifically, women and minority students gained both
psychosocial and achievement benefits from involvement (Aragon, Alfeld, & Hansen,
2013).
While CTE courses may raise achievement and promote postsecondary transitions
for regular students, they may not be sufficient to motivate students with disabilities
towards higher education (Gottfried, Bozick, Rose, & Moore, 2014). Notwithstanding,
CTE participation has been associated with higher rates of employment for high poverty
students with disabilities (Rabren, Carpenter, Dunn, & Carney, 2014).
CTE participation is related to higher earnings, compared to general education
students in both the year after high school graduation and seven years out, holding
60
individual characteristics constant (Bishop & Mane, 2004; Castellano et al, 2003).
Gender, age, degree attainment, annual earnings, and original occupational pathway are
all related to long term earning capacity (Maguire, et al, 2012). CTE increases earning
potential whether or not students go on to higher education; those in specific training
programs are the most successful in earnings (Mane, 1999; Bishop & Mane, 2004)
In studies comparing workforce outcomes between different CTE career cluster
groupings, several relationships become clear. An associate’s degree in most clusters is
linked to higher earnings including marketing and information technology (Compton et
al, 2010). Manufacturing and STEM clusters had diminished returns on earnings over
time when linked to degree attainment, suggesting the benefit of continued work
experience in the area (Maguire et al, 2012). Women who have earned an associate’s
degree tend to earn less than men in a variety of comparable CTE career clusters, even
less than men without degrees. The persistent, negative earning implications for women
involved in CTE are concurrent with wage gaps prevalent across the United States
(Eardley & Manvell, 2006; Maguire et al, 2012). In all, CTE participation is associated
with greater earning capacity. Indeed, one study used econometrics to control for track
selection; his model suggests that if CTE students had been enrolled in an academic track
instead, they would have earned less after high school (Meer, 2007).
Advanced CTE Courses, Dual-CTE
Tech Prep programs offer CTE courses which go beyond traditional high school
curriculum. They provide linkages to higher education through credit based transitions.
Advanced CTE, or dual-CTE, are those courses which provide CTE content while
aligning high school and higher education standards. Most often these are courses for
which students participate in dual enrollment (Bragg & Reger, 2002; Kim & Bragg,
2008; Stipanovic et al, 2012). A growing body of research suggests that dual enrollment,
61
or dual credit, may improve educational attainment for students who would not otherwise
continue their education past high school (Allen, 2010; An, 2013; Hoffman et al, 2009;
Kleiner & Lewis, 2009; Lerner & Brand, 2006). Dual credit is a popular option for
students in CTE courses as a way to prepare, experience, and transition to higher
education.
Researchers have noted the program connections between dual enrollment and
Tech Prep, citing their extensive use as a portion of Tech Prep program plans (Clark,
2001; Pierce, 2001). Using the Community College and Beyond data set, significant
relationships were found between dual and Tech Prep courses suggesting their prevalent,
connected use in programs (Kim, 2014). A survey of schools in 2002 reported that around
51% of schools offered dual-CTE courses, and students enrolled in such courses
represented 3% of the school populations (Lewis & Overman, 2008). Several advantages
have been identified within dual-CTE. These include higher graduation rates, greater
odds of postsecondary enrollment in either a two- or four-year institution, and increased
persistence in higher education (Wonacott, 2002; Stipanovic et al, 2012). Further,
combined dual-CTE enrollment programs may lead to improved college retention rates
for students who do continue on into higher education (Kim & Bragg, 2008; Zinth, 2014).
Tech Prep Program Outcomes
Thus far literature has covered the origins and implementation of Tech Prep as
well as associations with common component parts, articulation methods and CTE dual
credit course availability. What follows are the outcomes associated with Tech Prep
participation. Overall, research yields positive impacts on high school and postsecondary
success (Bailey & Karp, 2003; Cellini, 2006; Dare, 2006; Bragg et al, 2002; Stone &
Aliaga, 2003). Though the body of literature is not large, findings suggest Tech Prep may
62
be a useful tool in transitioning students from high school to higher education and
beyond.
HIGH SCHOOL
Firstly important in high school outcomes are the characteristics of students who
enroll in Tech Prep programs. In a study of mature, high fidelity Tech Prep programs—
those which had all the components of a comprehensive program—researchers compared
outcomes of Tech Prep students with those in general education settings. Across all eight
measured consortia, Tech Prep participants differed significantly from other students in
characteristics which made them at-risk of not completing college (e.g., first-generation
college, part-time enrollment, work and school, etc.). Students also exhibited somewhat
lower levels in categories of family income and parental education. Students did not
differ according to race or GPA (Grade Point Average). Several of the consortia also
enrolled notably more male students (Bragg et al, 2002). When linked to students
outcomes, at risk and disadvantaged students have had greater success when enrolled in
Tech Prep, school to career, and other advanced CTE programs (Brown, 2003).
Tech Prep students are generally more successful, or similar, in high school
achievements when compared to traditional academic paths (Bailey & Karp, 2003;
Cellini, 2006; Dare, 2006). The program has been associated with gains in math and
science achievement (Kim, 2014; Stone & Aliaga, 2003). Tech Prep students in several
mature consortia were found to take more math courses. In these consortia, students often
started with a lower ability level and ended high school with higher achievement in math
(Bragg et al, 2002). The New York Tech Prep model was associated with positive effects
on achievement in English, math, and science as well as overall GPA. Other studies have
found little evidence of impact on raising high school GPA (Kompelien, 1996; Stone &
63
Aliaga, 2003). Lastly, several studies have related Tech Prep participation to an increased
probability of high school graduation (Cellini, 2006; Stone & Aliaga, 2003).
HIGHER EDUCATION
The majority of peer reviewed research suggests students involved with Tech
Prep are more likely to enter higher education (Bailey & Karp, 2003). Several studies
have found that while Tech Prep is positively associated with enrollment in community
colleges, participants are less likely to enroll in four-year institutions (Bailey & Karp,
2003; Bragg et al, 2002; Cellini, 2006). This may suggest that participation may divert
students directly into two-year institutions directly following high school at the expense
of university enrollment.
A large amount of studies focus on the implementation of local programs,
providing matriculation percentages for their students. Within these studies numbers vary
widely as to how many students from Tech Prep programs enter higher education, from
19-98% with around 50% remaining in the same CTE field of study. Study of a program
in Massachusetts created to recruit women into engineering and technology fields found
that 65% of their students went on to college in those fields with an additional 10%
entering college in other majors (Boudria, 2002). A study of an athletic health care
program in Utah had particularly high results for its participants. Over the course of five
years, 98% of participants continued on to college with 85% of them in a health related
field and 45% declaring exercise science or athletic training as their major. Participant
surveys revealed the program helped them to learn about the field, enhance interests, and
find out about careers, skills, and the scientific process (Otterstetter et al, 2011).
A study of a healthcare program in Oklahoma reported only 19% of students
continuing on to higher education (McCharen, 2008). New York Tech Prep model
participants who matriculated to higher education scored better on college readiness
64
exams, required fewer remedial courses, had higher college GPAs, and higher college
persistence and attainment (Shimony et al, 2002). A large study of eight high fidelity
Tech Prep programs found wide variations. Between 28-75% of Tech Prep students
continued on to a two-year college while between 18-58% of traditional track students
attended; 5-53% of Tech Prep students attended four-year institutions compared to 17-
55% of general education students. No differences were found in the rate of degree
completion with a median of 10.5% (Bragg et al, 2002).
Within those who do transition to higher education, there seem to be modest yet
positive impacts for Tech Prep students, including the number of semester credit hours
earned (Bragg, 2006). Others disagree finding no connection between Tech Prep and
postsecondary success (Neumark & Rothstein, 2004; Neumark & Joyce, 2001). While
there is some disagreement as to the impacts of higher education enrollment and
attainment, other research has linked Tech Prep participation to increased positivity in
student goals, perceptions of postsecondary attainment, and workforce participation
(Neumark & Joyce, 2001).
WORKFORCE PARTICIPATION
Few studies have followed Tech Prep students into the workforce. In those that
did study earnings, Tech Prep participants had comparatively more workforce
participation one- and three-years after high school graduation (Bragg, 2006). In the large
study of several consortia, workforce participation was more frequent amongst Tech Prep
Tech Prep participants (Bragg et al, 2002).
Though research is limited and incomplete, favorable findings suggest Tech Prep
has a positive impact on students (Bailey & Karp, 2003; Bragg, 2006; Bragg et al, 2002).
It has been shown to actively engage students in preparing for college and career skills
while still in high school (Cellini, 2006; Stone & Aliaga, 2003). Further, it has been used
65
to expand CTE beyond traditional enrollments to broader populations of students. One
study placed its findings into an important context. Dare (2006) found that Tech Prep
students were comparable or even moderately successful in achievement when compared
to general academic students. In everyday, practical terms this means that students now
have two course pathways to succeed in school rather than the traditional route of college
prep. Tech Prep is now an additional path to success beyond traditional academic tracks
(Bailey, 2009). The use of Tech Prep to incentivize student learning, increase attainment,
and promote college success for all highlights the program as a complex reform for
today’s CTE rather than the tracking tool of prior eras in vocational education.
LIMITATIONS
The body of research to date has provided limited examples of impact or efficacy.
Many have focused instead on qualitative measures of program implementation. Within
current quantitative studies, there is space to build upon past study by advancing analytic
models and providing more accurate measures of student outcomes. A selected list of
limitations within the extant research follows.
Implementation Variation
Implementation of Tech Prep has led to varied definitions of the term and
program components (Bragg et al 2002; Hershey et al, 1998). This has made research
based on the identification of students in programs an issue. There are few easily
identifiable data points from which to select out Tech Prep students. As such researchers
use either self-report or coding from transcript data, both of which have limitations in
their reliability (Stipanovic et al, 2012). Self-report can produce discrepancies in data
while transcripts may produce incorrect estimates due to coding decisions (Aliaga et al,
2014). Research to date also has limited information on the scale and characteristics of
66
programs in relation to others, or even precise information on student characteristics. A
detailed study of wide proportion needs to be conducted allowing for multiple
comparisons rather than smaller programmatic contrast (Bailey & Karp, 2003).
Lack of Rigor
Growing numbers have critiqued the body of quantitative research in this area for
deficient sensitivity to selection bias. Of great importance has been the lack of controls
for student and school characteristics (Bozick & Dalton, 2012; Lewis & Overman, 2008;
Rojewski & Xing, 2013). To a lesser extent, discussion has been how the factors which
impact self-selection into Tech Prep should be explicitly accounted for in modeling
(Bishop & Mane, 2004; Kelly & Price, 2009).
As part of continued academic discussion, partly published in thoughtful articles
through the Career and Technical Education Research (CTER) journal, researchers in the
field have called for better development of methods to study the impact on student
outcomes (Bailey & Karp, 2003; Rojewski et al, 2012; Lambeth et al, 2009; ). Specific
calls have noted the overuse of simplistic analysis techniques—t-tests, correlation,
ANOVA—for questions and data which call for more complex inferential methods (Fritz
et al, 2012; Gemici & Rojewski, 2007; Nimon, 2012; Rojewski et al, 2012). Discussion
relates the use of hierarchical methods as the appropriate tool in most circumstances
given the nature of nested data in student, program, and school information (Cohen,
Cohen, West, & Aiken, 2003; Fritz et al, 2012). Calls for more rigorous study have also
been debated within the contexts of government funding. Authors have acknowledged
that while not all important research follows components of governmental Scientifically
Based Research (SBR) standards—these include requirements such as What Works
Clearinghouse (WWC)—greater attention needs to be given to methods in quantitative,
quasi-experimental studies (Gemici & Rojewski, 2007).
67
Calls for Research
Experts used surveys and discussion at yearly conferences to form a research
agenda for CTE and Tech Prep in upcoming years. Areas of needed research include:
A knowledge base for teaching and learning:
Curricula and program planning:
Program delivery methods;
Accountability; and
Program relevance and effectiveness (Lambeth, Joerger, & Elliot, 2009).
Research objectives under accountability explicitly relate the need for greater
understanding of student outcomes of Tech Prep programs using appropriate, multilevel
methods (Cohen et al, 2003; Fritz et al, 2012; Rojewski et al, 2012). Given the stated
limitations in current studies, it is an ideal time to assess the efficacy of Tech Prep
outcomes along P-16+ pipeline transitions.
68
CHAPTER THREE: RESEARCH DESIGN
Overview
The purpose of this study is to better understand the ways in which advanced CTE
models, such as Tech Prep, may be used to foster college and career transitions. The
focus of research explores the impacts of CTE Tech Prep participation on longitudinal
outcomes related to the P-16+ pipeline. Given the need for more rigorous assessment
within the current body of CTE research, the design of this study aligns to criteria for
research put forth by What Works Clearinghouse standards (Fritz et al, 2012; Nimon,
2012). Specifically, the research design works to meet the evidence standards of strong,
quasi-experimental studies of comparison groups (Gemici & Rojewski, 2007; WWC,
2014). Methods include propensity score matching of students to control for selection
bias, and the multilevel modeling of logistic regression on a variety of outcomes
associated with Tech Prep participation. The outcome variables investigated encompass
high school transitions, higher education enrollment, developmental remediation,
postsecondary attainment, and workforce participation. Findings are explored and
connected to current contexts, CTE research, and education policies. They create multiple
implications for both policymakers and practitioners. The analytic strategies used in this
study work together to yield a rich set of findings which strengthen the connections
between advanced CTE participation and student success.
LOGIC MODEL
A literal head-start for high school students, Tech Prep programs offer an
articulated pathway from high school to a higher education institution. As part of the
program students are granted early college access; they enroll in credit based transition
courses (e.g., dual credit) to gain exposure and credits at both institutions.
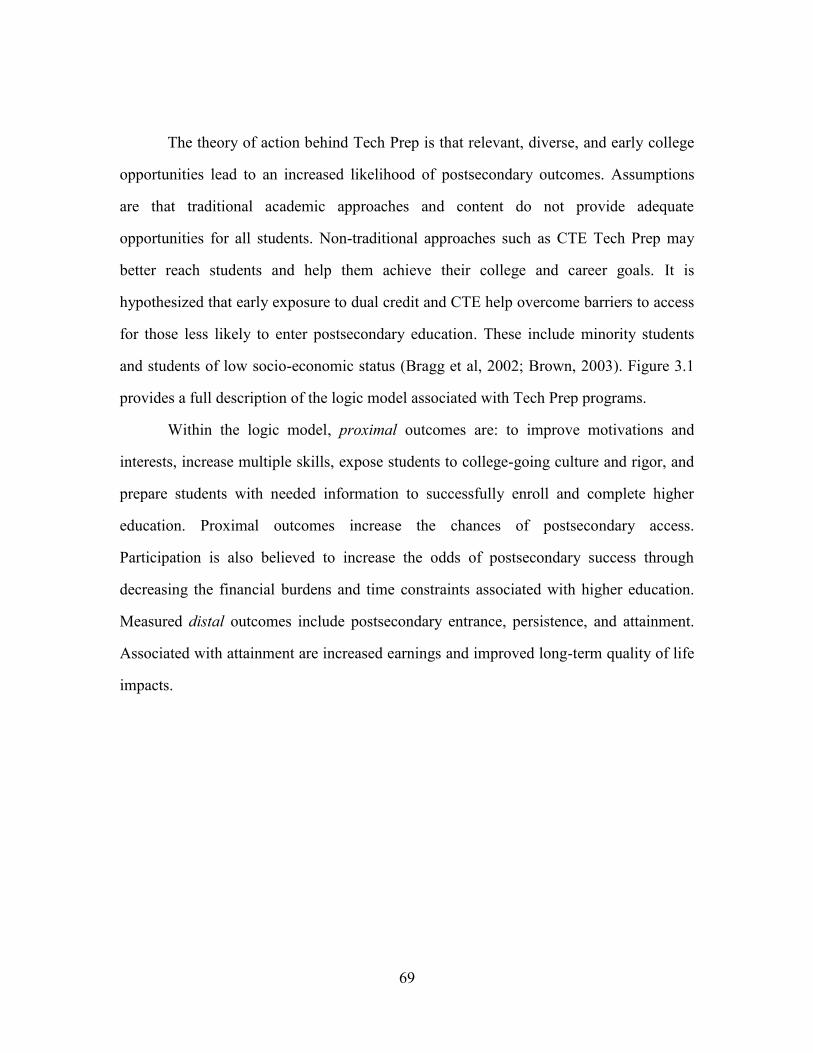
69
The theory of action behind Tech Prep is that relevant, diverse, and early college
opportunities lead to an increased likelihood of postsecondary outcomes. Assumptions
are that traditional academic approaches and content do not provide adequate
opportunities for all students. Non-traditional approaches such as CTE Tech Prep may
better reach students and help them achieve their college and career goals. It is
hypothesized that early exposure to dual credit and CTE help overcome barriers to access
for those less likely to enter postsecondary education. These include minority students
and students of low socio-economic status (Bragg et al, 2002; Brown, 2003). Figure 3.1
provides a full description of the logic model associated with Tech Prep programs.
Within the logic model, proximal outcomes are: to improve motivations and
interests, increase multiple skills, expose students to college-going culture and rigor, and
prepare students with needed information to successfully enroll and complete higher
education. Proximal outcomes increase the chances of postsecondary access.
Participation is also believed to increase the odds of postsecondary success through
decreasing the financial burdens and time constraints associated with higher education.
Measured distal outcomes include postsecondary entrance, persistence, and attainment.
Associated with attainment are increased earnings and improved long-term quality of life
impacts.
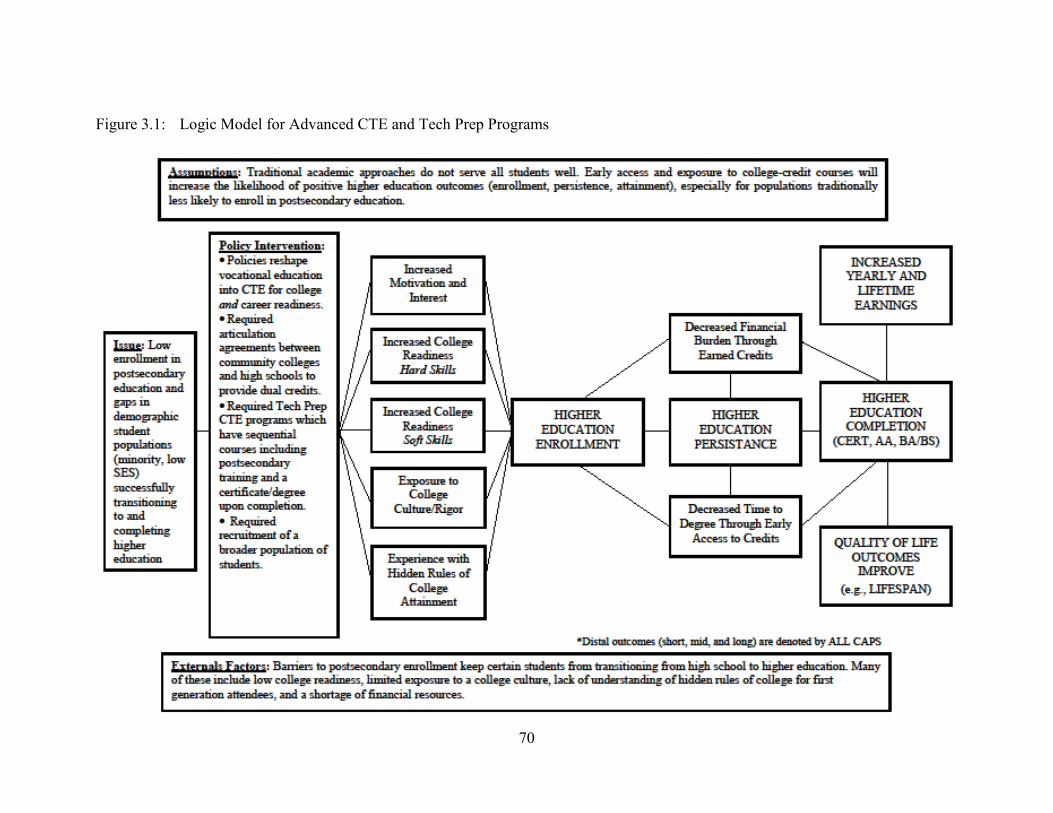
70
Figure 3.1: Logic Model for Advanced CTE and Tech Prep Programs
71
RESEARCH QUESTIONS
The study is an exploration of the longitudinal outcomes related to participation in
advanced CTE programming, Tech Prep. In addition, comparisons between the RGV
LEAD consortium area and the rest of Texas are investigated to identify impacts of
implementation. For this study, one broad question covers the intent of analyses. How do
advanced CTE programs, such as Tech Prep programming, affect student outcomes
across the P-16+ pipeline? Specific questions guide research. These are:
RQ1. What student- and school-level characteristics influence Tech Prep participation?
RQ2. Relative to comparable students, what impact does Tech Prep participation have
on high school transitions, higher education enrollment, developmental
remediation, postsecondary attainment, and workforce participation?
Data
Information for the study comes from the Texas Education Research Center
(ERC) clearinghouse.4 The ERC hosts access to high quality, longitudinal data from the
Texas Education Agency (TEA), the Texas Higher Education Coordinating Board
(THECB), and the Texas Workforce Commission (TWC). Multiple data sets from all
three state agencies are combined using a unique identifier in order to track students over
time and different settings.
DEFINITION OF TECH PREP
Past studies have had problems with identifying Tech Prep participants in their
analysis (Aliaga et al, 2014; McDavid, Boggs, & Stumpf, 2005). The data for this study
overcomes limitations of past research by the use of a unique code within the state data
4 The research presented here utilizes confidential data from the State of Texas supplied by the Texas ERC
at The University of Texas at Austin. The author gratefully acknowledges the use of these data. The views
expressed are those of the author and should not be attributed to the Texas ERC or any of the funders or
supporting organizations mentioned herein. Any errors are attributable to the author.
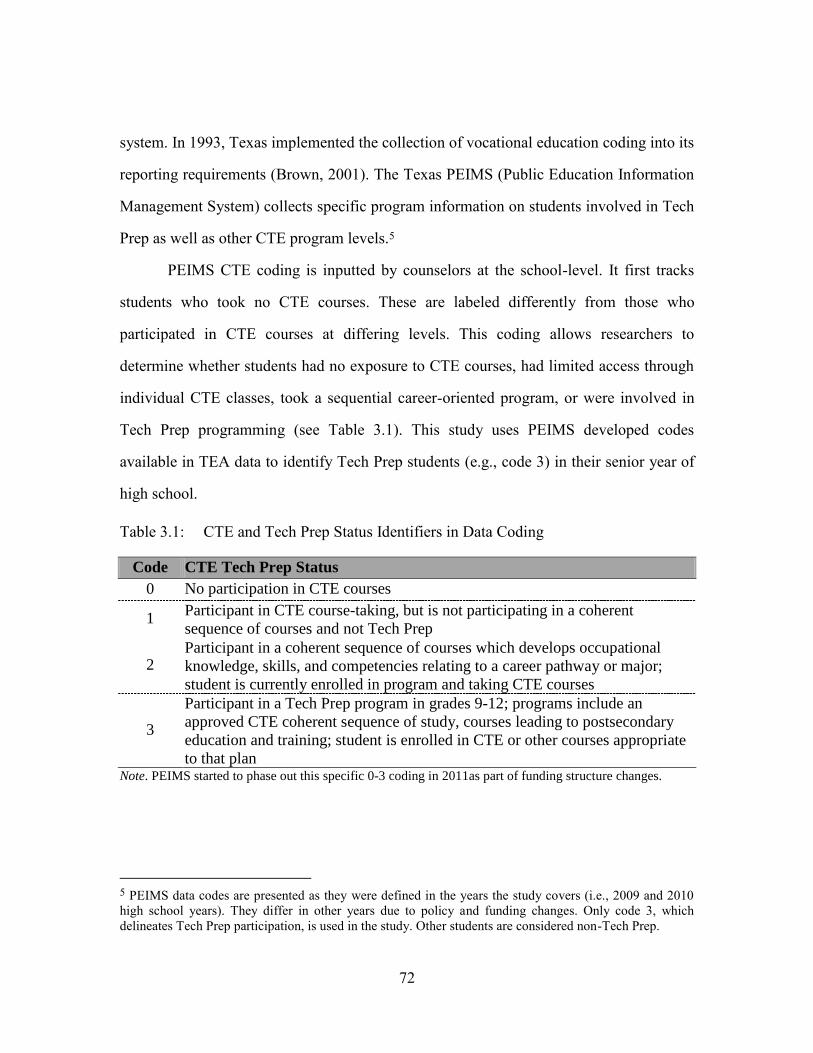
72
system. In 1993, Texas implemented the collection of vocational education coding into its
reporting requirements (Brown, 2001). The Texas PEIMS (Public Education Information
Management System) collects specific program information on students involved in Tech
Prep as well as other CTE program levels.5
PEIMS CTE coding is inputted by counselors at the school-level. It first tracks
students who took no CTE courses. These are labeled differently from those who
participated in CTE courses at differing levels. This coding allows researchers to
determine whether students had no exposure to CTE courses, had limited access through
individual CTE classes, took a sequential career-oriented program, or were involved in
Tech Prep programming (see Table 3.1). This study uses PEIMS developed codes
available in TEA data to identify Tech Prep students (e.g., code 3) in their senior year of
high school.
Table 3.1: CTE and Tech Prep Status Identifiers in Data Coding
Code CTE Tech Prep Status
0 No participation in CTE courses
1 Participant in CTE course-taking, but is not participating in a coherent
sequence of courses and not Tech Prep
2 Participant in a coherent sequence of courses which develops occupational
knowledge, skills, and competencies relating to a career pathway or major;
student is currently enrolled in program and taking CTE courses
3
Participant in a Tech Prep program in grades 9-12; programs include an
approved CTE coherent sequence of study, courses leading to postsecondary
education and training; student is enrolled in CTE or other courses appropriate
to that plan Note. PEIMS started to phase out this specific 0-3 coding in 2011as part of funding structure changes.
5 PEIMS data codes are presented as they were defined in the years the study covers (i.e., 2009 and 2010
high school years). They differ in other years due to policy and funding changes. Only code 3, which
delineates Tech Prep participation, is used in the study. Other students are considered non-Tech Prep.
73
LONGITUDINAL DATA COLLECTION
Accessing all levels of ERC data, high school cohorts have been matched against
higher education and workforce information to compile longitudinal data sets for
analysis. Records accessed include information on student demographics and high school
participation, postsecondary enrollment and course taking behaviors, higher education
graduation files, and workforce participation and wages. Data collection and coding
decisions for ERC data are relatively similar to FETPIP (Florida Education and Training
Placement Information Program) methodologies. Researchers in the CTE field have
praised FETPIP reporting methods and requirements as rigorous means of evaluating
impact measures across educational transition points (Bragg, 2000; Sambolt &
Blumenthal, 2013).
Longitudinal data for high school graduation cohorts from both 2009 and 2010
have been collected. These include basic demographic information as well as unique
personal, campus, and district identifiers to be used in multilevel analysis. TEA high
school data includes program participation (e.g., Tech Prep, special education, etc.),
accountability testing, diploma types, and information on coursework taken from four
years of high school (i.e., graduation year plus three academic years prior). Coursework
data consist of CTE, dual credit, and dual-CTE courses. Campus-level information is also
attached using the graduation year of the student. These contain accountability ratings,
school size, and demographics of the student population.
Postsecondary information taken from the THECB includes enrollment in any
community college, technical college, private university, or public university in Texas
(enrollment in higher education outside of the state is not available in the data).6
6 Prior research on Texas data compared it to information from the National Student Clearinghouse from
2008 and 2009, suggesting less than 9% of seniors leave the state for higher education (Deming, Cohods,
Jennings, & Jencks, 2016).
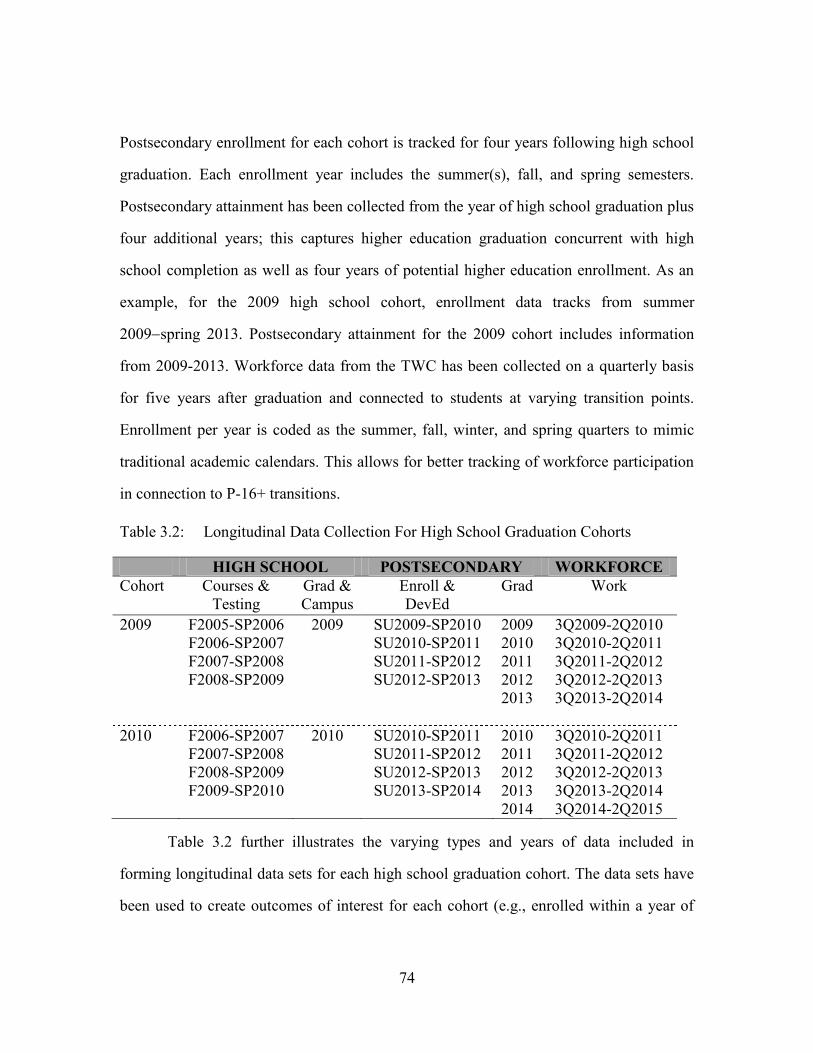
74
Postsecondary enrollment for each cohort is tracked for four years following high school
graduation. Each enrollment year includes the summer(s), fall, and spring semesters.
Postsecondary attainment has been collected from the year of high school graduation plus
four additional years; this captures higher education graduation concurrent with high
school completion as well as four years of potential higher education enrollment. As an
example, for the 2009 high school cohort, enrollment data tracks from summer
2009spring 2013. Postsecondary attainment for the 2009 cohort includes information
from 2009-2013. Workforce data from the TWC has been collected on a quarterly basis
for five years after graduation and connected to students at varying transition points.
Enrollment per year is coded as the summer, fall, winter, and spring quarters to mimic
traditional academic calendars. This allows for better tracking of workforce participation
in connection to P-16+ transitions.
Table 3.2: Longitudinal Data Collection For High School Graduation Cohorts
HIGH SCHOOL POSTSECONDARY WORKFORCE
Cohort Courses &
Testing
Grad &
Campus
Enroll &
DevEd
Grad Work
2009 F2005-SP2006
F2006-SP2007
F2007-SP2008
F2008-SP2009
2009 SU2009-SP2010
SU2010-SP2011
SU2011-SP2012
SU2012-SP2013
2009
2010
2011
2012
2013
3Q2009-2Q2010
3Q2010-2Q2011
3Q2011-2Q2012
3Q2012-2Q2013
3Q2013-2Q2014
2010 F2006-SP2007
F2007-SP2008
F2008-SP2009
F2009-SP2010
2010 SU2010-SP2011
SU2011-SP2012
SU2012-SP2013
SU2013-SP2014
2010
2011
2012
2013
2014
3Q2010-2Q2011
3Q2011-2Q2012
3Q2012-2Q2013
3Q2013-2Q2014
3Q2014-2Q2015
Table 3.2 further illustrates the varying types and years of data included in
forming longitudinal data sets for each high school graduation cohort. The data sets have
been used to create outcomes of interest for each cohort (e.g., enrolled within a year of
75
graduation, earned an associate’s degree, working after postsecondary attainment). Once
all connections and variables for each cohort had been created, both cohorts were merged
together to create the analysis sample.7 A full list of the variables are described in
Appendix B.
MISSING DATA
Limitations in the extant research have cited several issues with past quantitative
studies. These include simplistic methods as well as an inadequate discussion of missing
data (Cohen et al, 2003; Fritz et al, 2012; Rojewski & Hill, 2014). In a recent critique, 27
CTE studies were reviewed to find only three which dealt explicitly with missing data
(Gemici et al, 2012). Common methods from studies which do mention missing data
include listwise, pairwise, and complete-answer deletion methods.
As missing data may occur in both random and non-random manners, the simple
deletion of data may reduce power and bias estimates (Lee, 2012). The inclusion of more
complex methods for missing data is needed. In this study, missing data, assumed to be
Missing At Random (MAR), is replaced by the application of multiple imputation.
Multiple imputation has long been used a tool to provide accurate estimates for missing
data. Its key characteristic is the use of multiple iterations (m) of simulated values to
produce estimates for missing values (Enders, 2010; Ruben, 1987; Schafer, 1997).
Multiple imputation methods calculate missing values based off of parameter estimates
which have been computed from cases with no missing values. They predict values using
regression techniques that input independent predictors, or covariates, made up of
important student information and proposed outcome(s) of interest. The method uses
multiple iterations—imputations—to converge on the most likely estimate for each
missing data value (Ruben, 1987; 1996).
7 Over 130 individual data files from the Texas ERC were merged to create the longitudinal data sample.
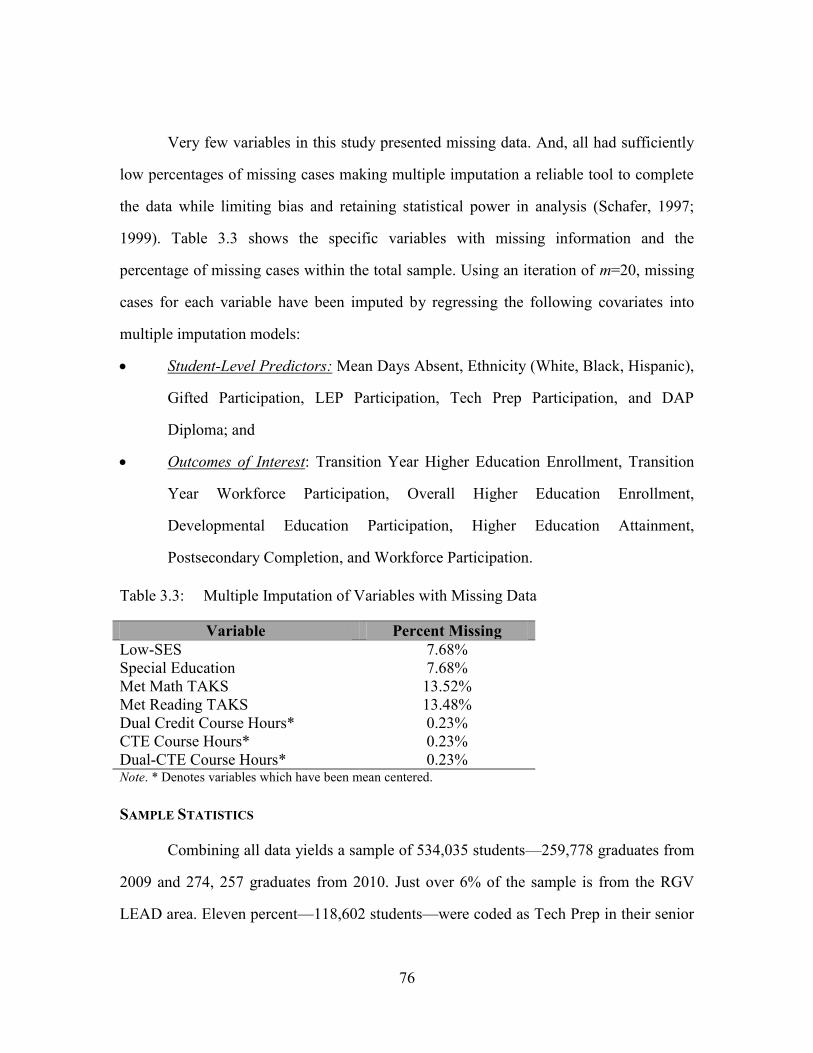
76
Very few variables in this study presented missing data. And, all had sufficiently
low percentages of missing cases making multiple imputation a reliable tool to complete
the data while limiting bias and retaining statistical power in analysis (Schafer, 1997;
1999). Table 3.3 shows the specific variables with missing information and the
percentage of missing cases within the total sample. Using an iteration of m=20, missing
cases for each variable have been imputed by regressing the following covariates into
multiple imputation models:
Student-Level Predictors: Mean Days Absent, Ethnicity (White, Black, Hispanic),
Gifted Participation, LEP Participation, Tech Prep Participation, and DAP
Diploma; and
Outcomes of Interest: Transition Year Higher Education Enrollment, Transition
Year Workforce Participation, Overall Higher Education Enrollment,
Developmental Education Participation, Higher Education Attainment,
Postsecondary Completion, and Workforce Participation.
Table 3.3: Multiple Imputation of Variables with Missing Data
Variable Percent Missing
Low-SES 7.68%
Special Education 7.68%
Met Math TAKS 13.52%
Met Reading TAKS 13.48%
Dual Credit Course Hours* 0.23%
CTE Course Hours* 0.23%
Dual-CTE Course Hours* 0.23% Note. * Denotes variables which have been mean centered.
SAMPLE STATISTICS
Combining all data yields a sample of 534,035 students—259,778 graduates from
2009 and 274, 257 graduates from 2010. Just over 6% of the sample is from the RGV
LEAD area. Eleven percent—118,602 students—were coded as Tech Prep in their senior
77
year. In a rundown of the P-16+ outcomes of the study, 57% of the sample transitioned to
some form of higher education within a year of their high school graduation; 65% of the
sample enrolled in postsecondary education within four years. Of those enrolled
(347,175), 43% took developmental education as part of their coursework. Twenty-five
percent (85,720) of enrolled students attained a postsecondary credential representing
16% of all high school students from both graduating cohorts.8 A vast majority of those
with a higher education credential entered the workforce within a year of completing
their certificate or degree, 83% or 70,954. This represents 13% of the original high school
graduate sample. A fuller explanation of the descriptive statistics and the sample,
including Tech Prep and RGV LEAD comparisons, may be found in Appendix C. These
illustrate the enrollment numbers of Texas students from these two graduating cohorts.
For the purposes of the study, this sample is utilized to explore the first research question,
asking what student- and school-level factors influence Tech Prep. In addition, the
sample is also used to create a more refined and smaller, quasi-experimental sample-set.
Methods
A variety of methods and analytic techniques are applied to the data in order to
explore outcomes and answer research questions. Descriptive analysis of inputs and
outcomes across the full data sample are viewed in Appendix C. This includes
comparisons between students participating in Tech Prep to those not, as well as those in
RGV LEAD areas compared to Texas. Comparisons across groups are not sufficient to
measure the impact of CTE participation though. A limitation of current research
includes the lack of proper controls when comparing students in advanced CTE
8 Postsecondary graduates include students with any higher education credential within the year concurrent
with high school graduation to four years after their diploma (i.e., a four-year graduation rate). This does
not include students who are enrolled in higher education and are on track to earn a degree in five or six
years, that data is yet to be collected.
78
programs, such as Tech Prep, against traditional academic tracks. Very few studies
control for observable student characteristics or school contexts which impact estimates
through selection bias (Bozick & Dalton, 2012; Lewis & Overman, 2008; Rojewski &
Xing, 2013). Remedies to control for bias include the matching of students across various
curricular programs on observable characteristics. The current study uses matched
propensity scores to create comparisons for the treatment group, Tech Prep participators.
PROPENSITY SCORING
Statistical analyses are used to control bias in observational characteristics which
differ across Tech Prep participants and other students. Limiting bias occurs through the
matching of comparable students or groups. There are many ways by which individuals
can be matched. The simplest method is to match one student to another individual if they
both share the same characteristics for all variables. This has the advantage that all
students in the treated group (i.e., Tech Prep participants) have an identical student in the
control group (i.e., students not participating in Tech Prep). The disadvantage is that
students are highly varied and the majority of cases would not have an exact match
(Rosenbaum & Rubin, 1983; West et al, 2014). To remedy this, summary matching
measures which account for differences are used.
Summary measures take many variables and turn them into one set, or measure.
Matching students on the basis of having a similar summary measure is called a
propensity score. Propensity Score Matching (PSM) is employed to create a control
group for use in comparison to Tech Prep participation. PSM modeling creates a match
based on the predicted probability a student will enroll in the treatment; in this case CTE
Tech Prep programming (Rosenbaum & Rubin, 1983; 1984). PSM is a two-step process
which first models the predicted probability of all students enrolling in Tech Prep, and
then matches Tech Prep to non-Tech Prep students to form a control and treatment group.
79
Creating a Propensity Score
First, propensity scores are developed by determining the odds of enrollment in
Tech Prep for all students. Estimated propensity scores are calculated for each student as
the probability of treatment given a number of characteristics or covariates. The formula
for propensity scores can be explained as such: e(x) is the propensity score, P is the
probability, T = 1 is the treatment indicator with values of 1 for treatment and 0 for
control, and X represents a set of observed covariates the treatment is conditional upon
(Thoemmes, 2012).
There is much discussion as to what covariates to include into the propensity
scoring model. Decisions on covariates are determined by past theory and research as
well as an effort to create a balanced model for the secondary step of matching in PSM
(Austin, 2011; Guo & Fraser, 2010; Heckman, Lalonde, & Smith, 1999). Covariates for
multivariate models are more difficult to determine given the bias inherent in many
clustered (i.e., nested) data (Hughes, Chen, Thoemmes, & Kwok, 2010; Thoemmes &
West, 2011). Where possible, it may be useful to include multivariate random slopes to
allow for matching within clusters. Where imbalanced or impractical, the use of school-
level indicators alone may better account for clustered data; they allow for balanced
measures though do not create within-cluster matches (Hughes et al, 2010; Long, Conger,
and Iatorola, 2012; West et al, 2014).
Taking into consideration past research, available data, and difficulties inherent in
matching students within campuses, the final model for propensity scoring includes both
student- and school-level indicators without random effects. This decision allows for the
inclusion of campus information while not requiring within-campus matches. It creates a

80
balanced matching of student groups (West et al, 2014). Variables included in the
modeling of propensity scores are:
Demographic Covariates: Mean Days Absent, Gender, Low-SES, Ethnicity
(Black, White, Hispanic), Gifted & Talented, LEP, and Special Education;
Academic Covariates: Met Math TAKS, Met Reading TAKS, Mean Dual Credit
Course, RHSP Diploma, and DAP Diploma; and
Campus-Level Covariates: RGV, Mean Percent White, Mean Percent Low-SES,
Acceptable Rated, Exemplary Rated, Small School, and Large School.
Matching Propensity Scores
The covariates detailed above are used to calculate propensity scores which are
then matched creating a balanced PSM sample. The estimated probability of Tech Prep
participation—the propensity score—is saved as an additional variable for all students.
Each student in the treatment group (i.e., Tech Prep participants) is matched to a student
not in the group. Using a nearest neighbor technique, a Tech Prep participant is first
selected. Their propensity score is matched to a student with the closest, or most similar,
propensity. That student enters the control group and is taken out of the pool of potential
matches (i.e., matching without replacement). The selection and matching process is
repeated until there are no longer untreated students which can be matched to a Tech Prep
participant (Austin, 2012; Haviland, Nagin, & Rosenbaum, 2007). The threshold for
matching is measured by a preset caliper so pairs will not be made between dissimilar
students (Austin, 2012; Guo & Fraser, 2010). A caliper is the maximum allowed distance,
measured in standard deviations, between propensity scores before a match will not be
made. Smaller calipers create more similar matches (West et al, 2014).
81
PSM Sample
The PSM model was calculated using probit regression then matched using the
nearest neighbor technique with no replacement and a caliper of (.001). It created a
smaller sub-sample of the original sample drawing only treatment and control matched
cases. The resulting sample size is 232,268 students, evenly split between Tech Prep and
control groups. Forty-eight percent of the sample is comprised of students graduated in
2009 (110,779) and 52% in 2010 (121,489). Nine percent of the sample represents
students from the RGV LEAD consortium area. In P-16+ outcomes, 60% of the sample
transitioned to higher education within a year of high school, 68% enrolled in higher
education within four years. Of those enrolled, 42% took some form of developmental
education. Twenty-five percent of enrolled students attained a postsecondary credential
(39,874) representing 17% of the total sample. Of those with a higher education degree or
certificate, 83% entered the workforce within a year of completing their certificate or
degree (33,225) representing 14% of the total sample.
PSM Balancing
The PSM procedure resulted in a parsimonious model, creating a balanced sample
of treated and non-treated cases. In other words, the PSM process created a sample which
controls for inherent bias allowing for improved Tech Prep comparisons. PSM
procedures call for balancing diagnostics to ensure there are no statistical differences
between the treatment and control groups on inputted covariates. These tests help to
identify correct specification of the propensity model. Diagnostics include checking the
distribution of propensity scores and covariate means before and after PSM (Rosenbaum
& Rubin, 1984).
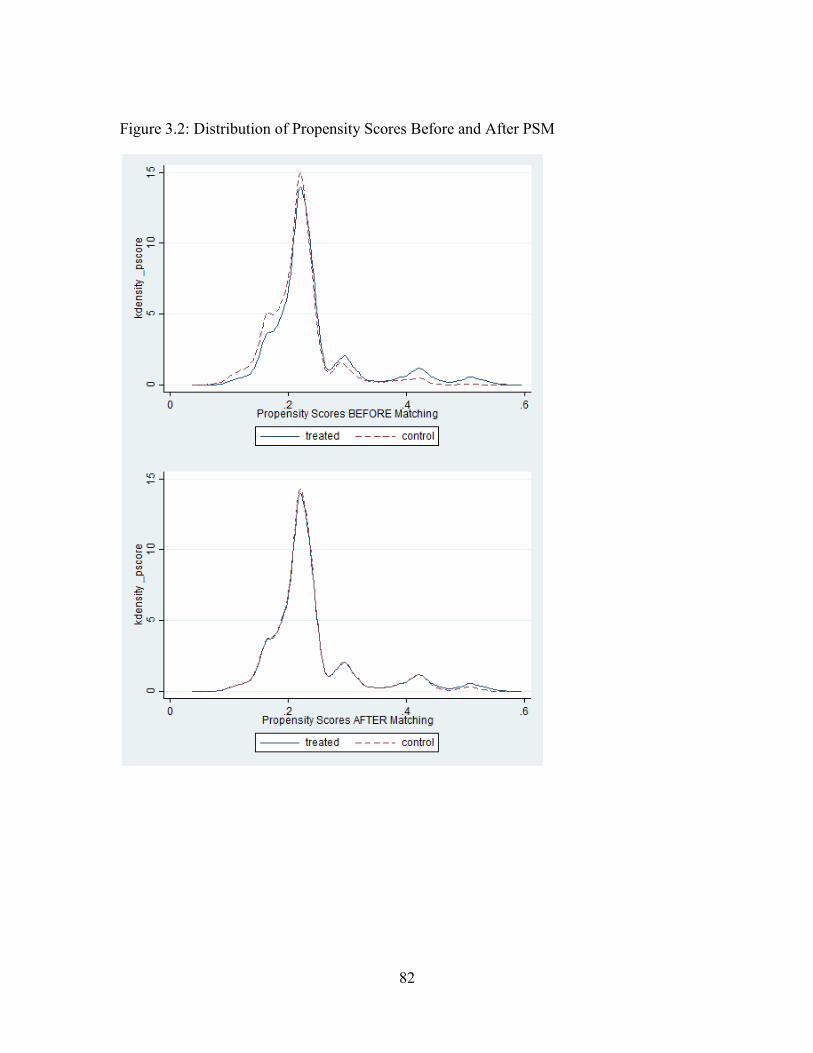
82
Figure 3.2: Distribution of Propensity Scores Before and After PSM
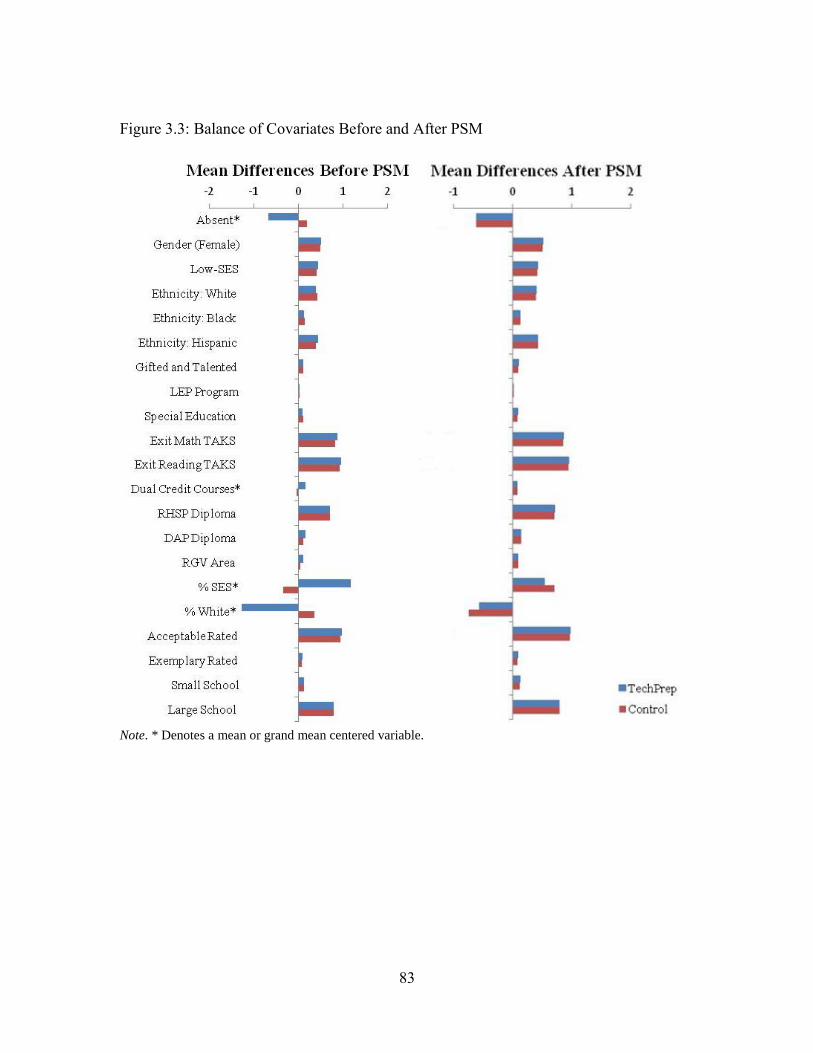
83
Figure 3.3: Balance of Covariates Before and After PSM
Note. * Denotes a mean or grand mean centered variable.
84
Figure 3.2 depicts the distribution of propensity scores both before and after PSM
procedures. The first chart shows variability between the treatment and control groups
before matching while the distribution of propensity scores after matching, in the second
chart, is evenly distributed. Figure 3.3 shows plotted bars of means for both Tech Prep
and control groups before and after PSM on 21 covariates used in creating the model. The
plots illustrate the mean difference before and after PSM for each covariate. Before
matching, some variables were unevenly distributed across groups while after, the
covariate means in both groups were closer to equal.
In addition to visual inspection, there are statistical tests to determine balance in
the PSM sample. Tests include looking at the level of standardized bias in the PSM
sample and t-tests of covariate means. Standardized bias is the difference in means
(treatment control) for the covariate divided by the standard deviation. The remaining
standardized bias in a covariate after PSM should be less than three percent (Caliendo &
Kopeinig, 2005). T-tests between covariates (treatment and control groups) are also
considered.
Before matching significant differences are expected, but after PSM covariates
should be balanced and leave no significant differences (Caliendo & Kopeinig, 2005;
Rosenbaum & Rubin, 1985). Table 3.4 shows both the standardized bias after PSM as
well as t-tests for covariate means in the matched sample. No covariate shows significant
bias or significant differences (p<.01) after matching, suggesting the PSM model is
balanced. The goal of the two-step PSM is to produce balanced distributions of cases
within the samples of treated and untreated groups (West et al, 2014). All results suggest
success in the PSM model and sample.
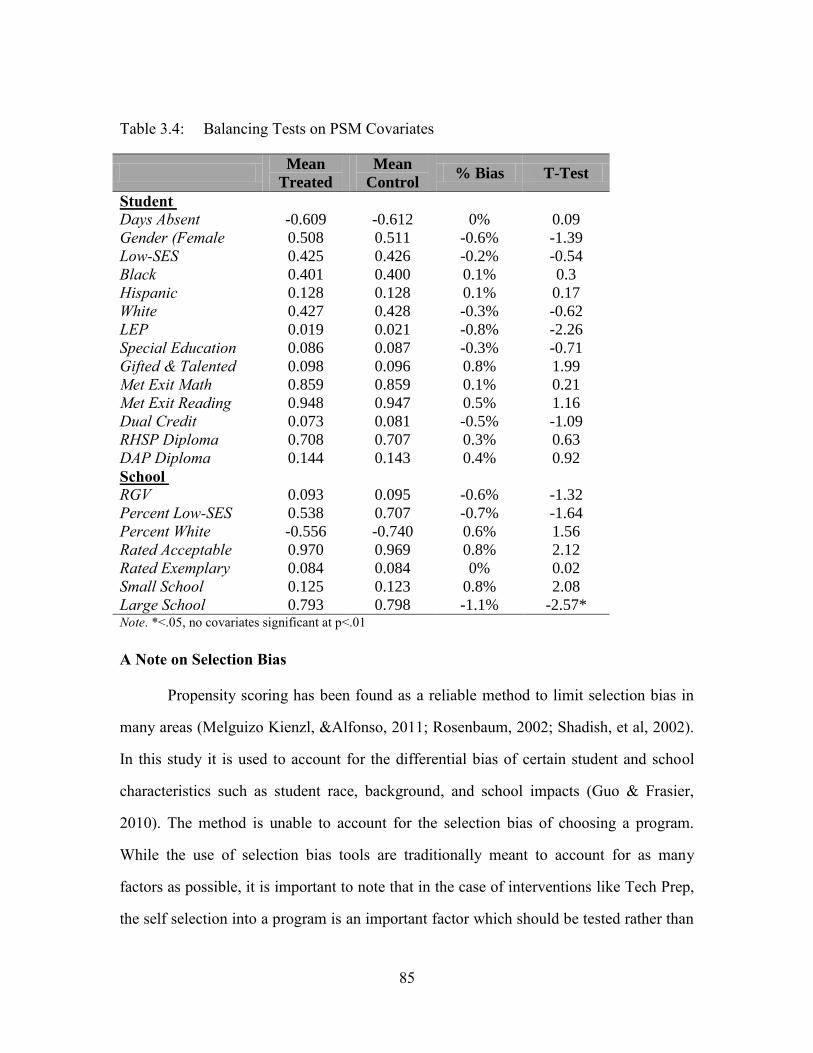
85
Table 3.4: Balancing Tests on PSM Covariates
Mean
Treated
Mean
Control % Bias T-Test
Student
Days Absent -0.609 -0.612 0% 0.09
Gender (Female 0.508 0.511 -0.6% -1.39
Low-SES 0.425 0.426 -0.2% -0.54
Black 0.401 0.400 0.1% 0.3
Hispanic 0.128 0.128 0.1% 0.17
White 0.427 0.428 -0.3% -0.62
LEP 0.019 0.021 -0.8% -2.26
Special Education 0.086 0.087 -0.3% -0.71
Gifted & Talented 0.098 0.096 0.8% 1.99
Met Exit Math 0.859 0.859 0.1% 0.21
Met Exit Reading 0.948 0.947 0.5% 1.16
Dual Credit 0.073 0.081 -0.5% -1.09
RHSP Diploma 0.708 0.707 0.3% 0.63
DAP Diploma 0.144 0.143 0.4% 0.92
School
RGV 0.093 0.095 -0.6% -1.32
Percent Low-SES 0.538 0.707 -0.7% -1.64
Percent White -0.556 -0.740 0.6% 1.56
Rated Acceptable 0.970 0.969 0.8% 2.12
Rated Exemplary 0.084 0.084 0% 0.02
Small School 0.125 0.123 0.8% 2.08
Large School 0.793 0.798 -1.1% -2.57* Note. *<.05, no covariates significant at p<.01
A Note on Selection Bias
Propensity scoring has been found as a reliable method to limit selection bias in
many areas (Melguizo Kienzl, &Alfonso, 2011; Rosenbaum, 2002; Shadish, et al, 2002).
In this study it is used to account for the differential bias of certain student and school
characteristics such as student race, background, and school impacts (Guo & Frasier,
2010). The method is unable to account for the selection bias of choosing a program.
While the use of selection bias tools are traditionally meant to account for as many
factors as possible, it is important to note that in the case of interventions like Tech Prep,
the self selection into a program is an important factor which should be tested rather than
86
merely controlled for. The theory of action behind Tech Prep suggests that programs
entice students towards involvement and participation. Random assignment into a
program, or mathematical models equivalent to random assignment, would not correctly
match program intent (Bishop & Mane, 2004; Kelly & Price, 2009). PSM measures help
provide a balanced sample from which to test the efficacy of program participation, part
of which is includes students’ decision to participate in Tech Prep.
HIERARCHICAL LINEAR REGRESSION
Inferential analysis employs the sample created by the PSM procedure to explore
impacts of participation in Tech Prep compared to the matched control group. Outcomes
are measured at varying points along the P-16+ pipeline. As students are nested within
several different structures and institutions, multilevel hierarchical modeling is applied
for all statistical procedures (Nimon, 2012; Stevens, 2009). This type of modeling,
sometimes referred to as Hierarchical Linear Modeling (HLM), allows for better
statistical estimates as it takes into consideration the clustering of students within schools.
Models also consider the effect of such clusters. Multilevel equations are able to control
for the school a student attended when identifying results, and also provide meaningful
context based on estimates of campus characteristics (Gelman & Hill, 2007; Raudenbush
& Bryk, 2002; Raudenbush, 2002; Riese & Duan, 2003; Schudde, 2011).
Nimon (2012) outlined the need for HLM in CTE studies as he overviewed the
body of current research. He established there are issues with researchers aggregating
data in ways which limit findings. Few CTE Tech Prep studies have incorporated HLM
in their analysis to provide better estimates of clustered data (Alfred et al, 2006; Field,
2003; Melguizo et al, 2011).
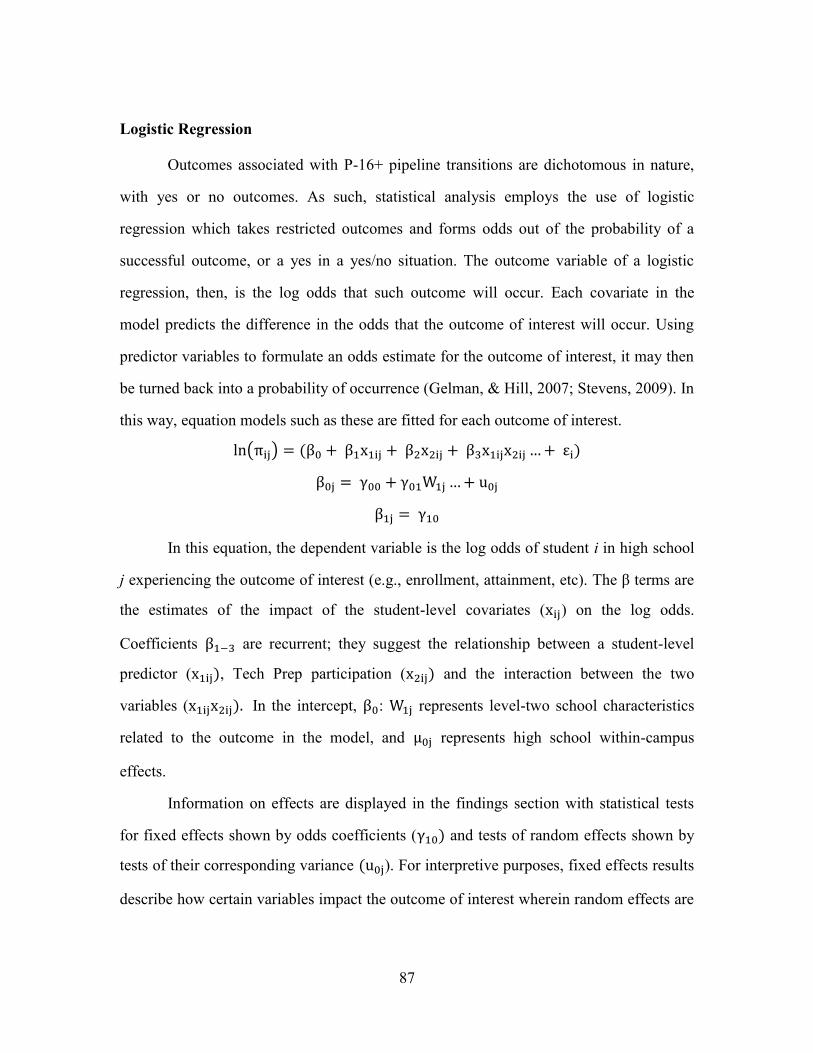
87
Logistic Regression
Outcomes associated with P-16+ pipeline transitions are dichotomous in nature,
with yes or no outcomes. As such, statistical analysis employs the use of logistic
regression which takes restricted outcomes and forms odds out of the probability of a
successful outcome, or a yes in a yes/no situation. The outcome variable of a logistic
regression, then, is the log odds that such outcome will occur. Each covariate in the
model predicts the difference in the odds that the outcome of interest will occur. Using
predictor variables to formulate an odds estimate for the outcome of interest, it may then
be turned back into a probability of occurrence (Gelman, & Hill, 2007; Stevens, 2009). In
this way, equation models such as these are fitted for each outcome of interest.
In this equation, the dependent variable is the log odds of student i in high school
j experiencing the outcome of interest (e.g., enrollment, attainment, etc). The β terms are
the estimates of the impact of the student-level covariates ( ) on the log odds.
Coefficients are recurrent; they suggest the relationship between a student-level
predictor ( , Tech Prep participation ( and the interaction between the two
variables ( In the intercept, : represents level-two school characteristics
related to the outcome in the model, and represents high school within-campus
effects.
Information on effects are displayed in the findings section with statistical tests
for fixed effects shown by odds coefficients ( and tests of random effects shown by
tests of their corresponding variance ). For interpretive purposes, fixed effects results
describe how certain variables impact the outcome of interest wherein random effects are
88
included in the model to better estimate and explain the clustering of variance between
and within schools given a certain outcome (Gelman, & Hill, 2007; Kreft, & De Leeuw,
1998).
In the findings section log odds, odds, and relevant probabilities associated with
those odds are presented for each outcome of interest, whether it is high school
transitions, higher education enrollment, developmental remediation, postsecondary
attainment, or workforce participation. They are defined and calculated as:
Log odds are the expected outcome of a logistic model: =
Odds are calculated using the equation:
Odds are calculated for coefficients estimates using: or
Probabilities are calculated using the equation:
or
Explored Outcomes
Analysis for the study is comprised of multilevel modeling of logistic regression
on a selection of 18 outcomes. The full sample of 2009 and 2010 cohorts is used to
identify factors important to Tech Prep participation (N=534,035). To explore the impacts
of Tech Prep participation at varying transition points on the P-16+ pipeline, the PSM
sample is employed (n=232,268). Special attention in modeling is given to the
relationship between Tech Prep participation and outcomes, Tech Prep in relation to other
student characteristics, and membership within the RGV LEAD area as a measure of
consortia implementation. Outcome modeling is organized into five P-16+ transition
areas. The areas and specific outcome models include:
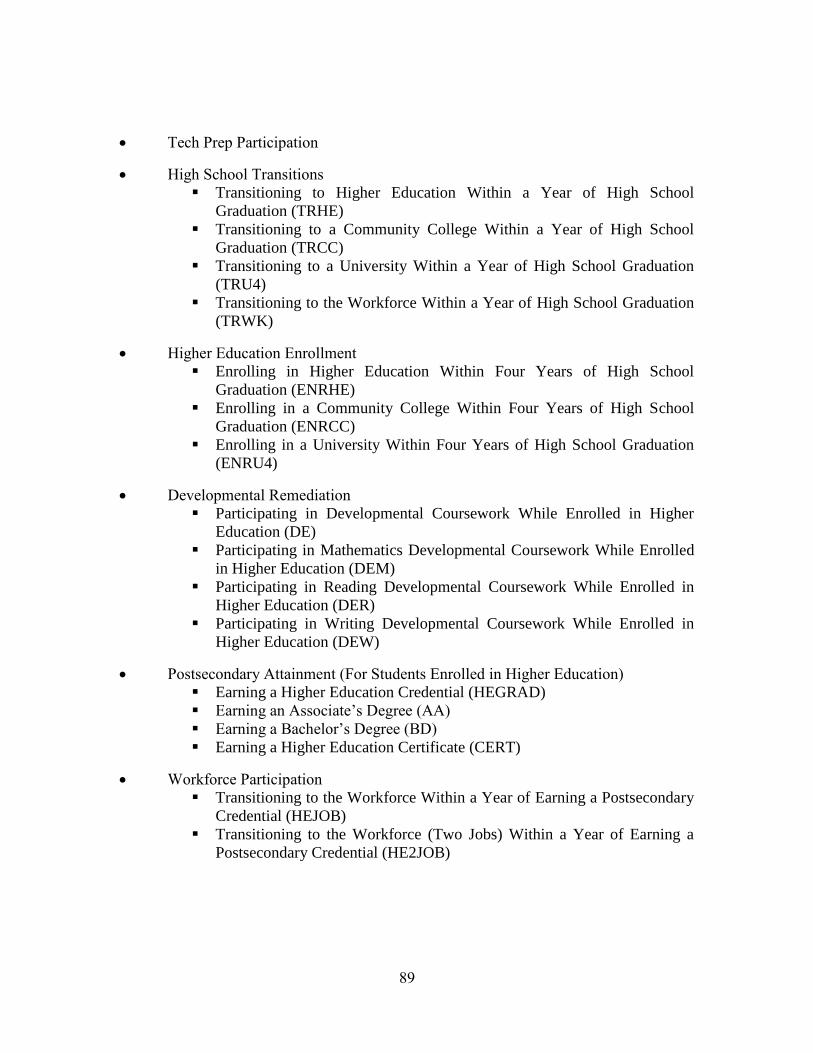
89
Tech Prep Participation
High School Transitions
Transitioning to Higher Education Within a Year of High School
Graduation (TRHE)
Transitioning to a Community College Within a Year of High School
Graduation (TRCC)
Transitioning to a University Within a Year of High School Graduation
(TRU4)
Transitioning to the Workforce Within a Year of High School Graduation
(TRWK)
Higher Education Enrollment
Enrolling in Higher Education Within Four Years of High School
Graduation (ENRHE)
Enrolling in a Community College Within Four Years of High School
Graduation (ENRCC)
Enrolling in a University Within Four Years of High School Graduation
(ENRU4)
Developmental Remediation
Participating in Developmental Coursework While Enrolled in Higher
Education (DE)
Participating in Mathematics Developmental Coursework While Enrolled
in Higher Education (DEM)
Participating in Reading Developmental Coursework While Enrolled in
Higher Education (DER)
Participating in Writing Developmental Coursework While Enrolled in
Higher Education (DEW)
Postsecondary Attainment (For Students Enrolled in Higher Education)
Earning a Higher Education Credential (HEGRAD)
Earning an Associate’s Degree (AA)
Earning a Bachelor’s Degree (BD)
Earning a Higher Education Certificate (CERT)
Workforce Participation
Transitioning to the Workforce Within a Year of Earning a Postsecondary
Credential (HEJOB)
Transitioning to the Workforce (Two Jobs) Within a Year of Earning a
Postsecondary Credential (HE2JOB)
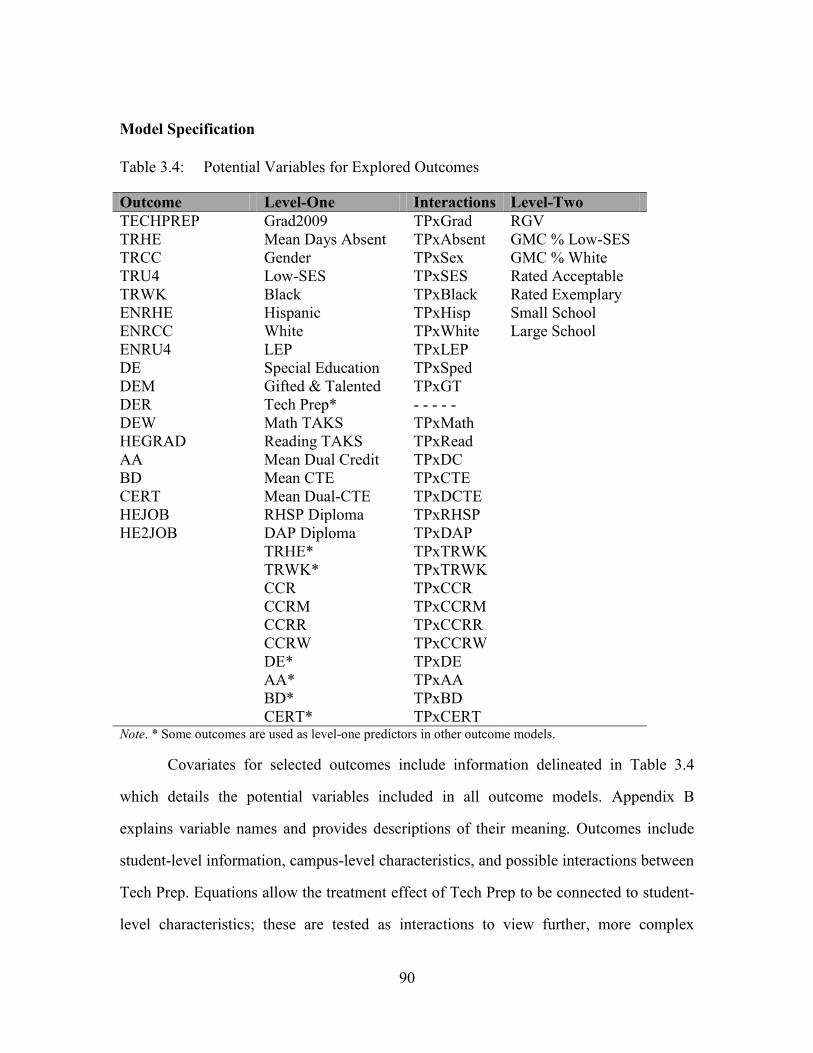
90
Model Specification
Table 3.4: Potential Variables for Explored Outcomes
Outcome Level-One Interactions Level-Two
TECHPREP Grad2009 TPxGrad RGV
TRHE Mean Days Absent TPxAbsent GMC % Low-SES
TRCC Gender TPxSex GMC % White
TRU4 Low-SES TPxSES Rated Acceptable
TRWK Black TPxBlack Rated Exemplary
ENRHE Hispanic TPxHisp Small School
ENRCC White TPxWhite Large School
ENRU4 LEP TPxLEP
DE Special Education TPxSped
DEM Gifted & Talented TPxGT
DER Tech Prep* - - - - -
DEW Math TAKS TPxMath
HEGRAD Reading TAKS TPxRead
AA Mean Dual Credit TPxDC
BD Mean CTE TPxCTE
CERT Mean Dual-CTE TPxDCTE
HEJOB RHSP Diploma TPxRHSP
HE2JOB DAP Diploma TPxDAP
TRHE* TPxTRWK
TRWK* TPxTRWK
CCR TPxCCR
CCRM TPxCCRM
CCRR TPxCCRR
CCRW TPxCCRW
DE* TPxDE
AA* TPxAA
BD* TPxBD
CERT* TPxCERT Note. * Some outcomes are used as level-one predictors in other outcome models.
Covariates for selected outcomes include information delineated in Table 3.4
which details the potential variables included in all outcome models. Appendix B
explains variable names and provides descriptions of their meaning. Outcomes include
student-level information, campus-level characteristics, and possible interactions between
Tech Prep. Equations allow the treatment effect of Tech Prep to be connected to student-
level characteristics; these are tested as interactions to view further, more complex

91
effects. In analyses of all outcomes, backwards modeling is used (Gelman & Hill, 2007;
Stevens, 2009). Base modeling starts with all student- and campus-level variables as well
as all potential interactions between Tech Prep and student-level indicators. When
interactions are found to be insignificant, the equation is trimmed to only significant
interactions and main effects. This form of modeling continues iterations until the best
fitting equation converges. Final models contain all student- and campus-level effect
estimates—regardless of significance—and significant interaction estimates.
92
CHAPTER FOUR: FINDINGS
The study is an exploration of the longitudinal outcomes related to participation in
advanced CTE programming, Tech Prep. Data collected from high school, higher
education, and workforce sources are used to track and compare outcomes. Quasi-
experimental, PSM methods are employed to further refine data in order to better explore
the impacts of Tech Prep participation. In all analyses, multilevel modeling is applied to
account for the nested structure of students in schools; these models investigate the effect
of CTE Tech Prep participation on transition points within the P-16+ pipeline.
Inferential analyses are presented in the findings section below. The first research
question of the study—what student- and school-level characteristics influence Tech Prep
participation—is examined with the full data sample from 2009 and 2010 high school
graduation cohorts (N=534,035).9 A multilevel logistic regression is used to investigate
potential factors affecting the odds of CTE Tech Prep participation.
The second research question explores the impacts of CTE Tech Prep
participation on five key areas: high school transitions, higher education enrollment,
developmental remediation, postsecondary attainment, and workforce participation.
These are calculated using a quasi-experimental sample which has been propensity
scored and matched to decrease selection bias (n=232,268). In all, 17 models are
presented which study the influence of student traits, academic indicators, and campus
characteristics on outcomes associated with the P-16+ pipeline. Models are organized
into the five areas of interest.
For all analyses, student- and school-level fixed effects are presented as well as
significant interaction terms. Random effects are discussed as they relate to remaining
9 Descriptive analysis of inputs and outcomes also utilize the full sample; tables are viewed in Appendix B.
This includes comparisons between students participating in Tech Prep to those not, as well as those in
RGV LEAD areas compared to Texas. Only inferential statistics are discussed in the findings section.
93
variance. Asterisks mark the level of significance and coefficient estimates signify either
an increase or decrease in the log odds of the expected outcome (e.g., a positive
coefficient is associated with an increase and a negative coefficient is associated with a
decrease in log odds). To put findings into a more meaningful perspective, significant
main effects and interaction terms are described in detail. Covariates are transfigured into
either odds or predicted probabilities. Descriptions of estimates hold all other variables
and estimates in the model constant. Means and standard deviations of covariates, as well
as intercorrelations tables for the samples used, are presented in Appendix D. The
findings below first describe the characteristics related to participation in Tech Prep then
move on to a detailed exploration of impacts at each progressive P-16+ transition point.
Tech Prep Participation
The odds of participation in Tech Prep are calculated using data from the
complete sample of 2009 and 2010 high school cohorts (N=534,035). The model explores
student- and school-level characteristics which impact participation. Table 4.1outlines
findings from the multilevel logistic regression calculating the odds of participation in
Tech Prep. Many factors significantly impact participation. Graduates in the 2009 cohort
are less likely to participate in the CTE program than 2010 graduates; 2009 graduates
have a 47% predicted probability of participation. The number of days absent during
senior year, while significant, has little impact on participation. Students with 20 more
absences than the average are only 1% less likely to enroll in a Tech Prep program.
Women are slightly more likely to participate than their male counterparts. And, students
of low-socioeconomic—low-SES—backgrounds are significantly more likely to enroll;
they have a 53% predicted probability of participation in Tech Prep.
94
Ethnicity has been effect-coded (e.g., dummy-coded) in all analysis models;
factors include Black, Hispanic, and White students leaving Asian and Native American
students as the reference grouping. Hispanic students are positively linked to Tech Prep
participation with a 54% probability of enrollment. A student identified as LEP (Limited
English Proficient) is significantly less likely to enroll in Tech Prep programs. Their
probability of enrollment is only 34%. Students from across the spectrum of special
programs are also significantly less likely to participate in Tech Prep programs. Special
education students have a predicted probability of enrollment of 48% while students in
Gifted and Talented (GT) programming have a 41% chance of participation. These
results suggest the largest block of participants come from students not enrolled in any
sort of targeted support or enrichment programs.
Several variables are included in the model as indicators of achievement and
academic rigor. All of these characteristics are significantly and positively linked to
participation in Tech Prep. Indicators include whether or not a student passed their
mathematics and reading exit exams. Known as the Texas Assessment of Knowledge and
Skills (TAKS), these tests are given to students in their junior year of high school; they
count towards graduation and state accountability measures. Those who passed both math
and reading TAKS are more likely to be enrolled in Tech Prep; those passing math TAKS
have a 55% predicted probability of enrollment. Enrollment in dual credit courses are
also positively linked to Tech Prep. Students taking the average number of dual credit
courses (M=0.63, or slightly above a semester-long course) have a 52% chance of
enrollment. With each additional, year-long dual credit course, the probability grows by
1-2%. Lastly, students who graduated with college ready degree plans are linked to
greater participation in Tech Prep. Students who gained the Recommended High School
95
Plan (RHSP) diploma, as well as the more advanced Distinguished Achievement Plan
(DAP) degree, both have a 54% predicted probability of enrollment in Tech Prep.
In addition to student-level characteristics, there are a host of school-level
indicators which influence participation in Tech Prep. RGV LEAD area affiliation has the
largest impact. Students from the RGV consortium have 8.62 greater odds of enrollment.
Clearly, students from RGV LEAD high schools are more likely to enroll in CTE Tech
Prep compared to students in Texas high schools at large, holding all else constant.
Characteristics of a school’s student population impact individual student
participation in Tech Prep. Both the percentage of low-SES students and the percent of
minority students negatively affect participation.10 For this and all models, both
indicators are Grand Mean (GM) centered to better interpret results. The percent of low-
SES students on a campus (GM=46.87%) results in a predicted probability of 50%, a
twenty point increase in low-SES students at a campus results in a lower possibility of
individual participation (47%). The impact of student ethnicity is even greater. Each 10
point decrease from the mean percent of white students (i.e., the converse of minority
students) results in a 4-5% point drop in the predicted probability of Tech Prep
participation. Put another way, the larger the white population of a campus, the greater
the odds of participation in Tech Prep for its students; a growing minority population at
the campus-level decreases the probability of individual Tech Prep participation.
The state accountability rating of a school, granted the year of the individual
students’ high school graduation, is only partially significant. Campuses rated Acceptable
under the Texas accountability rating system have a positive impact on Tech Prep
10 The percent of minority students at a high school campus is included in the model using the variable
percent of white students (GM centered). This number represents all white students, leaving the converse—
minority students—as its opposite. A significant, positive relationship to Percent White at the campus-level
corresponds to higher odds of participation as the average number of White students in a school rises.
Conversely this indicates the predicted probability of Tech Prep participation drops as minority enrollment
increases.
96
participation compared to schools which failed to meet accountability requirements.
Schools rated as Exemplary, the highest possible accountability rating, do not have
significant differences though. This suggests the highest performing schools do just as
well as Acceptable campuses in supporting CTE participation. Lastly, large high
schools—those with enrollments over 750 students—correspond to a greater predicted
enrollment in CTE Tech Prep, with a 56% chance of enrollment for students.
The random effects estimates show some variability in the model across schools
when accounting for all student- and school-level factors. The variance is 4.674 with a
95% confidence interval between 4.27-5.12%. This estimate suggests that, within
measurements of Tech Prep participation, there is still dissimilarity at the campus-level
which is unexplained by the present indicators. Random effects are larger for this
particular model in the study given it utilizes the full cohort sample. Variance measures
for all other models are considerably smaller as they come from a balanced PSM sample.
As a note, the model shown in Table 4.1 is not the equation used in creating
propensity scores for the PSM sample. The model, and its factors, did inform the
modeling process for propensity scoring but did not result in the final, balanced equation
used for matching.
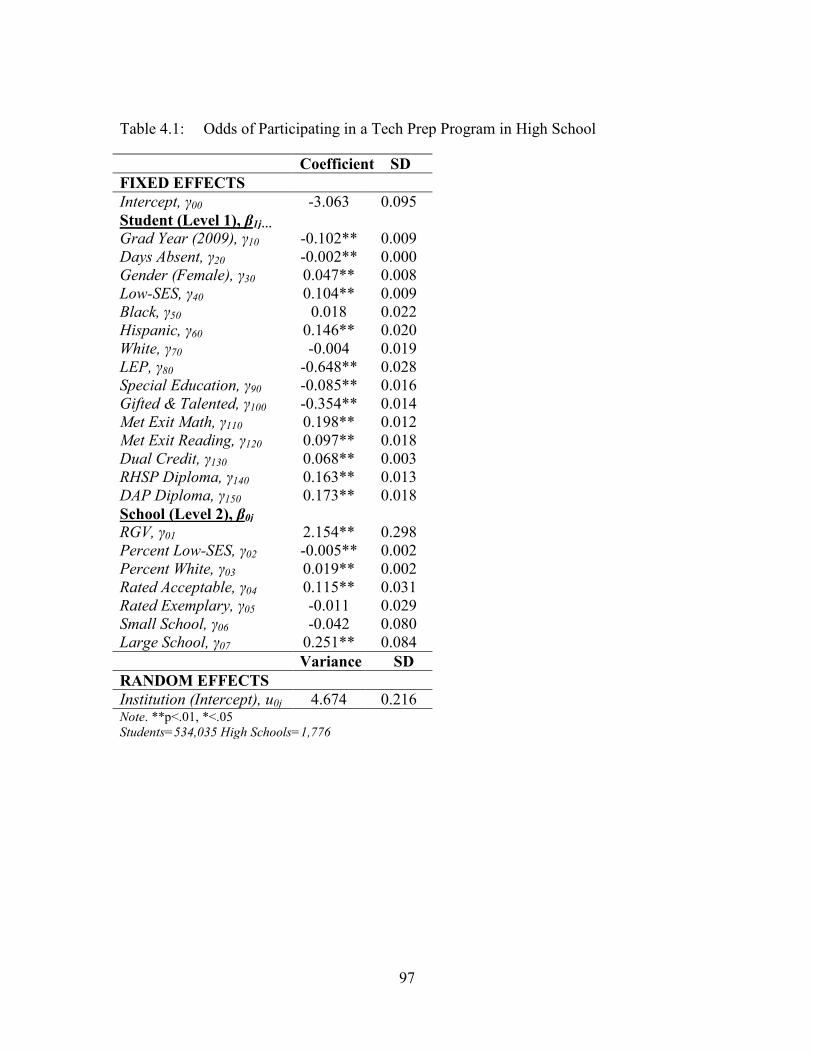
97
Table 4.1: Odds of Participating in a Tech Prep Program in High School
Coefficient SD
FIXED EFFECTS
Intercept, γ00 -3.063 0.095
Student (Level 1), β1j…
Grad Year (2009), γ10 -0.102** 0.009
Days Absent, γ20 -0.002** 0.000
Gender (Female), γ30 0.047** 0.008
Low-SES, γ40 0.104** 0.009
Black, γ50 0.018 0.022
Hispanic, γ60 0.146** 0.020
White, γ70 -0.004 0.019
LEP, γ80 -0.648** 0.028
Special Education, γ90 -0.085** 0.016
Gifted & Talented, γ100 -0.354** 0.014
Met Exit Math, γ110 0.198** 0.012
Met Exit Reading, γ120 0.097** 0.018
Dual Credit, γ130 0.068** 0.003
RHSP Diploma, γ140 0.163** 0.013
DAP Diploma, γ150 0.173** 0.018
School (Level 2), β0j
RGV, γ01 2.154** 0.298
Percent Low-SES, γ02 -0.005** 0.002
Percent White, γ03 0.019** 0.002
Rated Acceptable, γ04 0.115** 0.031
Rated Exemplary, γ05 -0.011 0.029
Small School, γ06 -0.042 0.080
Large School, γ07 0.251** 0.084
Variance SD
RANDOM EFFECTS
Institution (Intercept), u0j 4.674 0.216 Note. **p<.01, *<.05
Students=534,035 High Schools=1,776
98
High School Transitions
The study includes an exploration of the impacts of CTE Tech Prep participation
on longitudinal outcomes related to the P-16+ pipeline. The first transition in the pipeline
examines the shift from high school graduation to college and/or career participation.
This, and all other P-16+ outcomes, are explored using a PSM matched sample which
controls selection bias across students in Tech Prep and a generated control group of non-
participants (n=232,268). PSM, a quasi-experimental sampling method, allows for greater
validity in results and provides a clearer picture of Tech Prep participation compared to
similar students who did not enroll in the program.
Transitions from high school to higher education and/or workforce participation
are measured in the first year after graduation. Four outcome models are created which
encompass enrollment in any postsecondary institution, enrollment in community college
and the university level, and entry into the workforce. Models outputs are viewed in
Tables 4.2-4.5 while findings from all models are discussed below.
Student Traits
First, students in the 2009 high school cohort are found to have a greater
probability of enrollment in higher education, both overall and at the community college
and university levels. The predicted probability of transition at any institution is 52%,
with similar odds at both the individual institution types. Graduation year is not
significantly related to workforce participation.
Tech Prep participation affects transition enrollment in interesting and diverse
ways. Many of the student-level indicators interact with Tech Prep, adding complexity to
the odds of postsecondary participation. Odds of enrolling in postsecondary education
decrease for the control group (i.e., non-Tech Prep students) according to a rise in the
number of days absent. The odds of enrollment increase for students in Tech Prep
99
programs. For students not enrolled in Tech Prep, the predicted probability of transition
with an average number days absent (M=10.16) is 49%; probabilities decrease by 6% for
every 10 additional days absent. For students who participated in Tech Prep, the
probability of transitioning into higher education is greater (59%). With an additional rise
in absenteeism, probabilities grow even higher. Findings suggest Tech Prep may help
students who have trouble attending high school. The relationship with absences is
similar in the model for community college enrollment though differs for enrollment at
the university level. For the odds of enrolling at a university within a year, the probability
of Tech Prep and non-Tech Prep students is similar given an average rate of absences
(49%). An increase in the number of absences decreases the odds of enrollment for both
groups by differing levels; those in the control group maintain a 2% advantage over Tech
Prep students. The rate of attendance is strongly related to entry into the workforce upon
high school graduation. More than 20 days absent during senior year results in a near
perfect probability of workforce entry the year after high school.
Gender maintains a significant interaction with Tech Prep in all three transition
enrollment models. Women who participated in Tech Prep have a greater prospect of
attending higher education than women in the control group, 66% to 54%. The
interaction trend is analogous for community college enrollment and, though smaller in
size, similar in higher education enrollment, 53% to 52%. Gender has a very slight
impact on workforce participation with greater odds given to women entering the
transitional workforce. Students from low-SES backgrounds have a negative relationship
within each model. Predicted probabilities for low-SES students participating in higher
education range from 41-49%.
Ethnicity proves to be an important interaction. In effect-coded variables, Tech
Prep students have greater odds of participation than their control group peers. This
100
interaction is only significant in the model for overall enrollment. The probability of a
Black Tech Prep student enrolling in higher education after high school is 58% compared
to a Black student in the control group at 52%. Likewise, a Hispanic student in Tech Prep
has a 45% predicted probability of enrollment while a similar student in the control group
only has a 40% likelihood. Lastly, a White Tech Prep student has a predicted chance of
51% while their peer has a 47% probability. Of note, a white student in the control group
has a greater probability of enrollment over a Hispanic student in Tech Prep (47% versus
45%). In the modeling of community college enrollment, only Black students have a
positive interaction with Tech Prep (51% versus 47%). Main effects for ethnicity in the
university transition model are significant. Black students are slightly more likely to
enroll at the university level with 1.15 greater odds. Hispanic students have the lowest
predicted probability of enrollment at 31%, holding all else constant. Race and/or
ethnicity is positively related to workforce participation within a year of high school
graduation. All groups range from 66-70% in their predicted probability of working. The
lowest proportion of students entering the workforce after graduation are the reference
coded, Asian and Native American groups of students (42%).
LEP students in Tech Prep are more likely to enroll in higher education after high
school compared to similar control students, though both have lesser odds of enrollment
than students not labeled as LEP. Tech Prep LEP students have a predicted probability of
42% while those in the control group only have a 39% probability. At the community
college level, the trend is comparable though the probability of participation is slightly
higher, 46% compared to 45%. There is no interaction at the university level, however,
LEP is significantly and negatively associated with overall enrollment; LEP students
have only a 24% predicted probability of enrollment. Similarly, LEP students have a 32%
predicted probability of transitioning to the workforce upon high school graduation. The
101
odds related to special education students are parallel in structure although they are not
quite as low. There is a significant, positive interaction between Tech Prep and special
education status for overall and community college transition. For overall enrollment,
predicted probabilities range from 58% for Tech Prep students to 42% for special
education students in the control group. At the university level special education relates
to a 27% probability of enrollment. There is a significant interaction in the workforce
model. Special education Tech Prep students are more likely to have a job (48%) than
those in the control group (41%).
For all enrollment models, students enrolled in GT programs have a greater
propensity for postsecondary participation if they are also Tech Prep. For example, in the
community college model, GT Tech Prep students have a predicted probability of 48%
compared to 36% enrollment for the control group. Of note, the probabilities are much
higher at the university level suggesting differences in the type of institution chosen for
these students (65-67% for the university-level). Gifted students are slightly less likely to
participate in the workforce after high school graduation.
Academic Indicators
When exploring variables that point toward academic rigor and achievement,
impacts vary across postsecondary levels. For students who met the exit-level math
TAKS, there is a greater predicted probability of enrollment overall as well as at the
university level. Those meeting the requirement have a 76% chance of enrollment at a
university. Meeting the math requirement results in a slightly lower predicted probability
of enrollment at the community college-level. This suggests students who did not pass the
test are more likely to enroll at a community college than apply to a four-year university.
Reading TAKS interacts with Tech Prep. Tech Prep students who passed the reading
TAKS have a greater predicted probability of enrolling in higher education compared to
102
control students, 72% to 61%. The trend is similar at the community college-level. At the
university level, reading TAKS is merely associated with a greater probability of
transition. Math TAKS is negatively related to workforce participation while reading
TAKS is positively related.
The number of dual credit courses a student took in high school positively
impacts overall enrollment in higher education after high school. And, dual credit
interacts with Tech Prep for even greater odds of transition. Tech Prep students have a
higher likelihood of enrollment based on average dual enrollment compared to the control
group (63% to 56%). For both groups, an additional year-long course corresponds to an
increase in the predicted probability of enrollment by 6-8%. The trend is also present in
university enrollment though differences between Tech Prep and control groups are
minimal (56% to 55%). At the community college level, dual enrollment corresponds to
relatively small changes in the odds of transitional enrollment suggesting dual credit
courses are best preparing students to transition to the university level. Dual credit
coursework has significant but not meaningful impacts on workforce transitions.
CTE courses students taken during high school has varying impacts on
enrollment, especially when including Tech Prep membership in the model. When
looking at all overall postsecondary transition, CTE is significantly associated. But,
additional courses over the mean (M=5.27) do not result in substantially larger predicted
probabilities compared to those who took less CTE. At the community college level, CTE
interacts with Tech Prep to provide greater odds of enrollment. Tech Prep students have a
predicted probability of 59% compared to 51% for the control group. Additional courses
increase the odds for both groups by as much as 7% per year-long credit. At the
university level CTE has a positive interaction with Tech Prep and a negative relationship
with enrollment. Participation in Tech Prep slightly moderates the negative impact of
103
CTE but additional coursework for both groups decreases the odds of transition. CTE is
positively related to workforce entry and interacts with Tech Prep to provide even higher
predicted probabilities of working for those who were in the program. Additional CTE
courses increase the odds of working after high school by 3-4%. The number of dual-
CTE courses impacts enrollment differently at community college and university levels.
Dual-CTE is positively linked to community college enrollment though negatively relates
to university enrollment.
Taking together the differing impacts of CTE and dual-CTE, findings suggest
these types of courses push students mainly towards workforce and community college
transitions, rather than the university level. Interactions with Tech Prep provide evidence
that advanced CTE programs do increase successful transitions at all levels and may help
broaden opportunities for enrollment.
As one would expect, a college ready degree is positively related to postsecondary
transition with a few, interesting, exceptions. Overall, both RHSP and DAP diplomas
predict greater odds of enrollment in higher education post-high school. Tech Prep
students with a RHSP degree have an even greater likelihood (78%) compared to the
control group (72%). Odds of enrollment are the largest for recipients of both diploma
types at the university-level. Students with a DAP diploma are negatively associated with
enrollment at the community college-level. Tech Prep participation moderates the impact
of the association. DAP graduates who participated in Tech Prep have a positive
probability of community college enrollment (56%) compared to DAP students in the
control group (44%). College ready degrees are negatively associated with workforce
transitions. Findings suggest traditional DAP recipients have strong preferences towards
universities. Tech Prep programs may either increase the number of students who would
not otherwise have completed such an advanced degree plan, or increase the number of
104
DAP students wishing to complete community college studies as part of their continuing
Tech Prep program.
Campus Characteristics
School-level indicators are included in the model to both, control for the type of
campus a student attends, and explore the impacts of campus characteristics. Students
from RGV LEAD areas have a greater predicted probability of enrollment in all higher
education transition models, 61% in overall enrollment, 53% in community college, and
65% in university transitions. These findings suggest RGV is successful in transitioning
students to all levels of postsecondary institutions. RGV LEAD students have lower odds
of workforce participation upon high school graduation with a 43% predicted probability.
The percentage of low-SES students at a campus only slightly impacts the overall
enrollment model; increases in the percentage of students above the mean (GM=46.87%)
do not significantly decrease an individual student’s odds of enrollment. The proportion
of minority students at a campus negatively impacts community college enrollment and
workforce transitions. The percent of minority students positively impacts university
transition. All effects on transitions are minimal, though. An Exemplary performance
rating in the state accountability system is negatively associated with community college
enrollment and workforce participation, and positively associated with university
enrollment. This suggests Exemplary schools are most focused on transitioning students
to universities after high school graduation. Small schools are negatively associated with
overall enrollment. Large schools are positively associated with enrollment in higher
education. The predicted probability of transitioning to higher education for a student
from a small school, holding all else constant, is 47% compared to a students from a large
school (54%). This trend also exists in the university model though reverses for
workforce participation benefitting students from smaller schools. In all, campus-level
105
characteristics play a significant role in predicting a student’s probability of transitioning
to either college or a career after graduating from high school.
Model Variability
Lastly, random effects estimates illustrate that the models—comprehensive in
both student- and school-level characteristics—fail to explain only a small proportion of
the differences across schools. Variances range from 0.072 in the modeling of workforce
participation to 0.404 for the odds of enrollment at the university level. Overall
enrollment in postsecondary education has a computed variance of 0.172 with a 95%
confidence interval between 0.15-0.19%. These estimates suggest that, within
measurements of high school transition, there is minimal variation left un-modeled
between the schools students are graduating from.
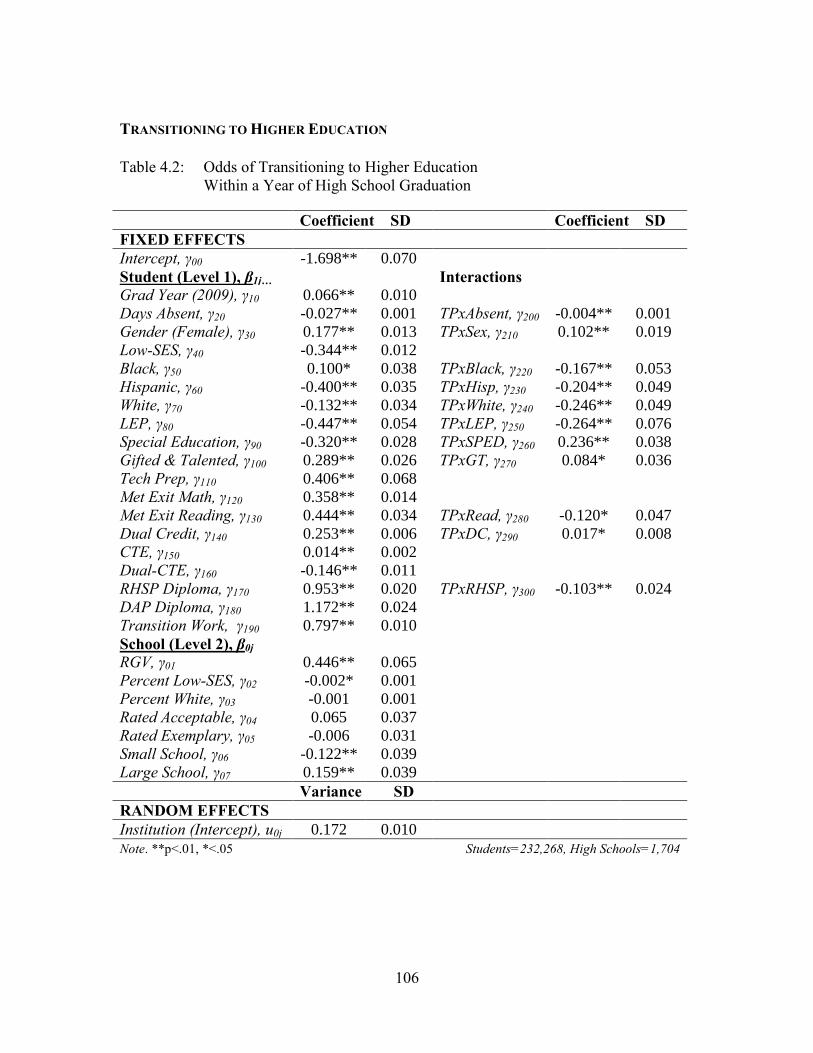
106
TRANSITIONING TO HIGHER EDUCATION
Table 4.2: Odds of Transitioning to Higher Education
Within a Year of High School Graduation
Coefficient SD Coefficient SD
FIXED EFFECTS
Intercept, γ00 -1.698** 0.070
Student (Level 1), β1j… Interactions
Grad Year (2009), γ10 0.066** 0.010
Days Absent, γ20 -0.027** 0.001 TPxAbsent, γ200 -0.004** 0.001
Gender (Female), γ30 0.177** 0.013 TPxSex, γ210 0.102** 0.019
Low-SES, γ40 -0.344** 0.012
Black, γ50 0.100* 0.038 TPxBlack, γ220 -0.167** 0.053
Hispanic, γ60 -0.400** 0.035 TPxHisp, γ230 -0.204** 0.049
White, γ70 -0.132** 0.034 TPxWhite, γ240 -0.246** 0.049
LEP, γ80 -0.447** 0.054 TPxLEP, γ250 -0.264** 0.076
Special Education, γ90 -0.320** 0.028 TPxSPED, γ260 0.236** 0.038
Gifted & Talented, γ100 0.289** 0.026 TPxGT, γ270 0.084* 0.036
Tech Prep, γ110 0.406** 0.068
Met Exit Math, γ120 0.358** 0.014
Met Exit Reading, γ130 0.444** 0.034 TPxRead, γ280 -0.120* 0.047
Dual Credit, γ140 0.253** 0.006 TPxDC, γ290 0.017* 0.008
CTE, γ150 0.014** 0.002
Dual-CTE, γ160 -0.146** 0.011
RHSP Diploma, γ170 0.953** 0.020 TPxRHSP, γ300 -0.103** 0.024
DAP Diploma, γ180 1.172** 0.024
Transition Work, γ190 0.797** 0.010
School (Level 2), β0j
RGV, γ01 0.446** 0.065
Percent Low-SES, γ02 -0.002* 0.001
Percent White, γ03 -0.001 0.001
Rated Acceptable, γ04 0.065 0.037
Rated Exemplary, γ05 -0.006 0.031
Small School, γ06 -0.122** 0.039
Large School, γ07 0.159** 0.039
Variance SD
RANDOM EFFECTS
Institution (Intercept), u0j 0.172 0.010
Note. **p<.01, *<.05 Students=232,268, High Schools=1,704
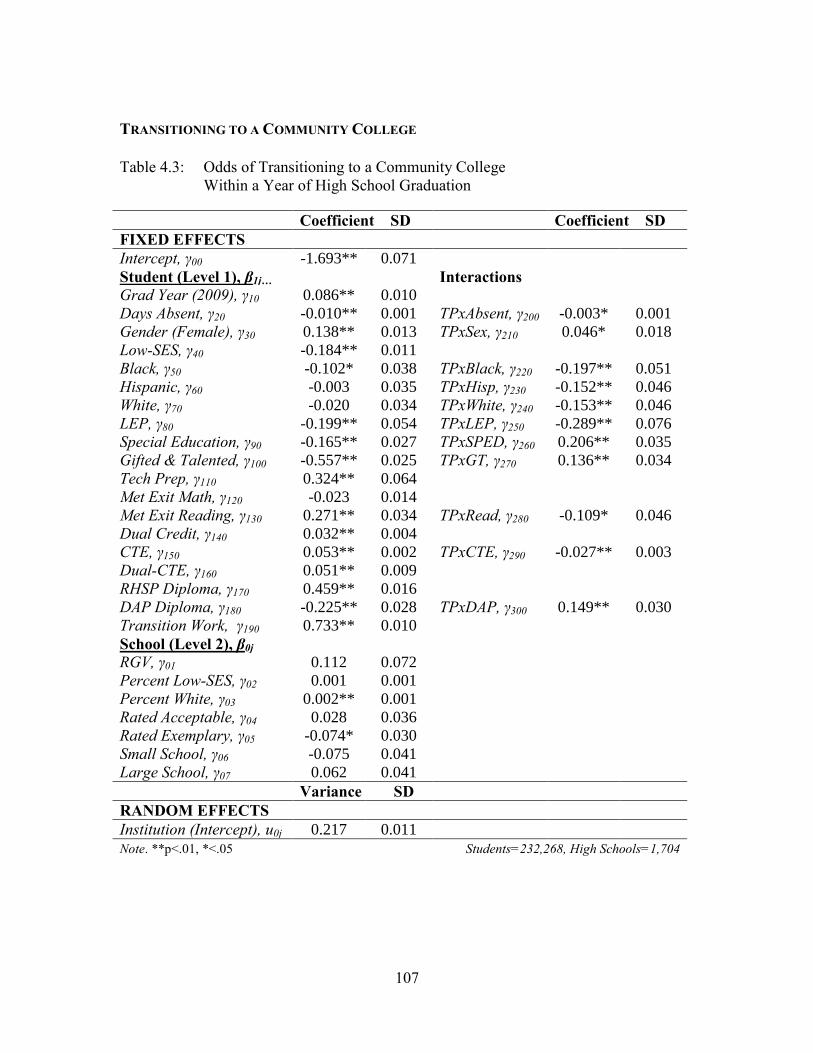
107
TRANSITIONING TO A COMMUNITY COLLEGE
Table 4.3: Odds of Transitioning to a Community College
Within a Year of High School Graduation
Coefficient SD Coefficient SD
FIXED EFFECTS
Intercept, γ00 -1.693** 0.071
Student (Level 1), β1j… Interactions
Grad Year (2009), γ10 0.086** 0.010
Days Absent, γ20 -0.010** 0.001 TPxAbsent, γ200 -0.003* 0.001
Gender (Female), γ30 0.138** 0.013 TPxSex, γ210 0.046* 0.018
Low-SES, γ40 -0.184** 0.011
Black, γ50 -0.102* 0.038 TPxBlack, γ220 -0.197** 0.051
Hispanic, γ60 -0.003 0.035 TPxHisp, γ230 -0.152** 0.046
White, γ70 -0.020 0.034 TPxWhite, γ240 -0.153** 0.046
LEP, γ80 -0.199** 0.054 TPxLEP, γ250 -0.289** 0.076
Special Education, γ90 -0.165** 0.027 TPxSPED, γ260 0.206** 0.035
Gifted & Talented, γ100 -0.557** 0.025 TPxGT, γ270 0.136** 0.034
Tech Prep, γ110 0.324** 0.064
Met Exit Math, γ120 -0.023 0.014
Met Exit Reading, γ130 0.271** 0.034 TPxRead, γ280 -0.109* 0.046
Dual Credit, γ140 0.032** 0.004
CTE, γ150 0.053** 0.002 TPxCTE, γ290 -0.027** 0.003
Dual-CTE, γ160 0.051** 0.009
RHSP Diploma, γ170 0.459** 0.016
DAP Diploma, γ180 -0.225** 0.028 TPxDAP, γ300 0.149** 0.030
Transition Work, γ190 0.733** 0.010
School (Level 2), β0j
RGV, γ01 0.112 0.072
Percent Low-SES, γ02 0.001 0.001
Percent White, γ03 0.002** 0.001
Rated Acceptable, γ04 0.028 0.036
Rated Exemplary, γ05 -0.074* 0.030
Small School, γ06 -0.075 0.041
Large School, γ07 0.062 0.041
Variance SD
RANDOM EFFECTS
Institution (Intercept), u0j 0.217 0.011
Note. **p<.01, *<.05 Students=232,268, High Schools=1,704
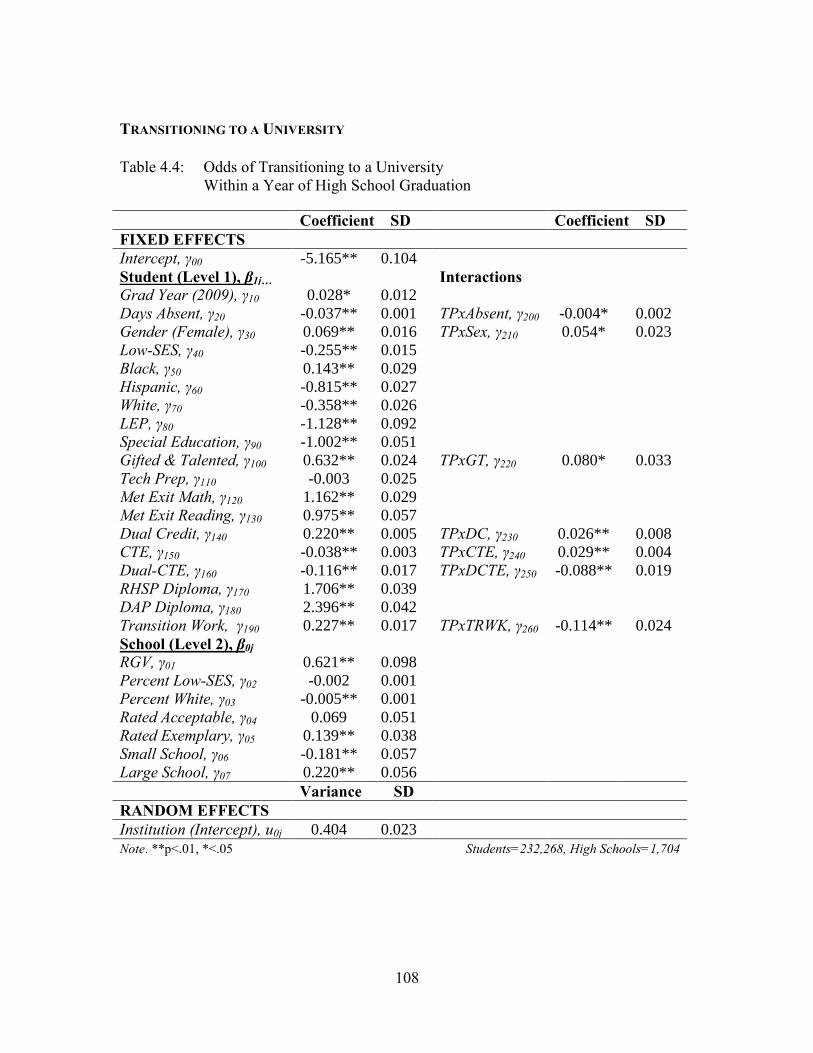
108
TRANSITIONING TO A UNIVERSITY
Table 4.4: Odds of Transitioning to a University
Within a Year of High School Graduation
Coefficient SD Coefficient SD
FIXED EFFECTS
Intercept, γ00 -5.165** 0.104
Student (Level 1), β1j… Interactions
Grad Year (2009), γ10 0.028* 0.012
Days Absent, γ20 -0.037** 0.001 TPxAbsent, γ200 -0.004* 0.002
Gender (Female), γ30 0.069** 0.016 TPxSex, γ210 0.054* 0.023
Low-SES, γ40 -0.255** 0.015
Black, γ50 0.143** 0.029
Hispanic, γ60 -0.815** 0.027
White, γ70 -0.358** 0.026
LEP, γ80 -1.128** 0.092
Special Education, γ90 -1.002** 0.051
Gifted & Talented, γ100 0.632** 0.024 TPxGT, γ220 0.080* 0.033
Tech Prep, γ110 -0.003 0.025
Met Exit Math, γ120 1.162** 0.029
Met Exit Reading, γ130 0.975** 0.057
Dual Credit, γ140 0.220** 0.005 TPxDC, γ230 0.026** 0.008
CTE, γ150 -0.038** 0.003 TPxCTE, γ240 0.029** 0.004
Dual-CTE, γ160 -0.116** 0.017 TPxDCTE, γ250 -0.088** 0.019
RHSP Diploma, γ170 1.706** 0.039
DAP Diploma, γ180 2.396** 0.042
Transition Work, γ190 0.227** 0.017 TPxTRWK, γ260 -0.114** 0.024
School (Level 2), β0j
RGV, γ01 0.621** 0.098
Percent Low-SES, γ02 -0.002 0.001
Percent White, γ03 -0.005** 0.001
Rated Acceptable, γ04 0.069 0.051
Rated Exemplary, γ05 0.139** 0.038
Small School, γ06 -0.181** 0.057
Large School, γ07 0.220** 0.056
Variance SD
RANDOM EFFECTS
Institution (Intercept), u0j 0.404 0.023
Note. **p<.01, *<.05 Students=232,268, High Schools=1,704
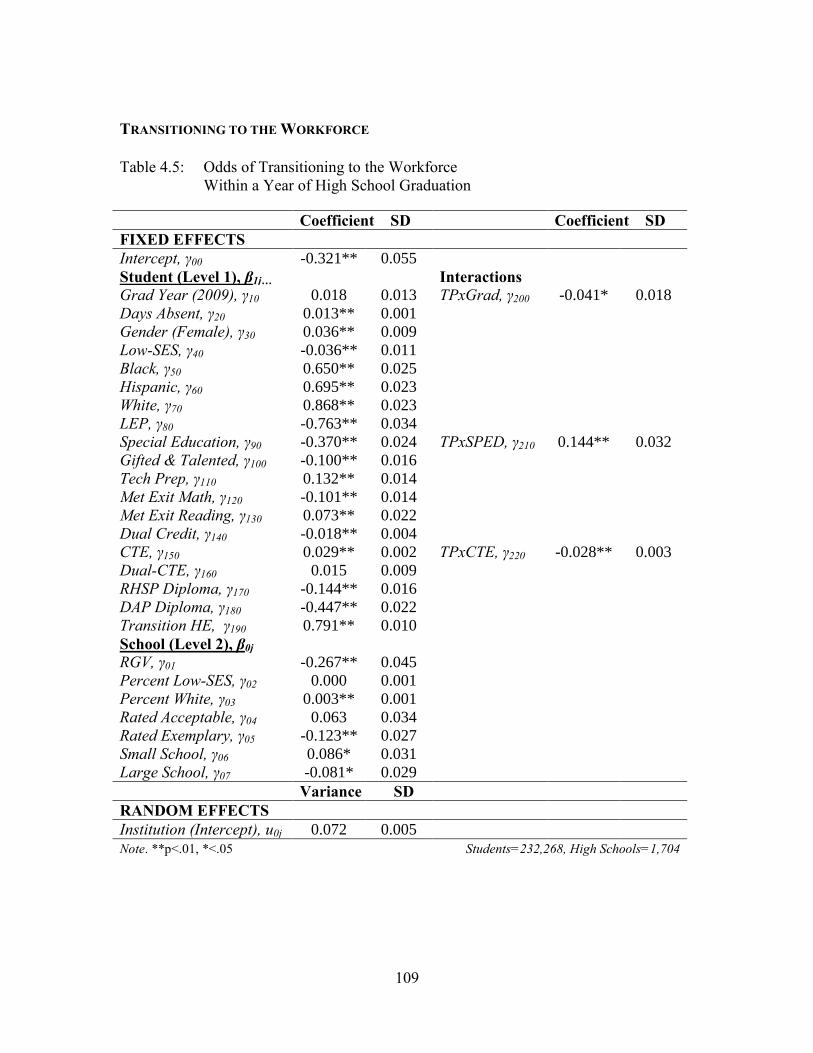
109
TRANSITIONING TO THE WORKFORCE
Table 4.5: Odds of Transitioning to the Workforce
Within a Year of High School Graduation
Coefficient SD Coefficient SD
FIXED EFFECTS
Intercept, γ00 -0.321** 0.055
Student (Level 1), β1j… Interactions
Grad Year (2009), γ10 0.018 0.013 TPxGrad, γ200 -0.041* 0.018
Days Absent, γ20 0.013** 0.001
Gender (Female), γ30 0.036** 0.009
Low-SES, γ40 -0.036** 0.011
Black, γ50 0.650** 0.025
Hispanic, γ60 0.695** 0.023
White, γ70 0.868** 0.023
LEP, γ80 -0.763** 0.034
Special Education, γ90 -0.370** 0.024 TPxSPED, γ210 0.144** 0.032
Gifted & Talented, γ100 -0.100** 0.016
Tech Prep, γ110 0.132** 0.014
Met Exit Math, γ120 -0.101** 0.014
Met Exit Reading, γ130 0.073** 0.022
Dual Credit, γ140 -0.018** 0.004
CTE, γ150 0.029** 0.002 TPxCTE, γ220 -0.028** 0.003
Dual-CTE, γ160 0.015 0.009
RHSP Diploma, γ170 -0.144** 0.016
DAP Diploma, γ180 -0.447** 0.022
Transition HE, γ190 0.791** 0.010
School (Level 2), β0j
RGV, γ01 -0.267** 0.045
Percent Low-SES, γ02 0.000 0.001
Percent White, γ03 0.003** 0.001
Rated Acceptable, γ04 0.063 0.034
Rated Exemplary, γ05 -0.123** 0.027
Small School, γ06 0.086* 0.031
Large School, γ07 -0.081* 0.029
Variance SD
RANDOM EFFECTS
Institution (Intercept), u0j 0.072 0.005
Note. **p<.01, *<.05 Students=232,268, High Schools=1,704
110
Higher Education Enrollment
Three models measure postsecondary enrollment over time (see Tables 4.6-4.8).
Each is defined by enrollment in higher education at any point within four years after
high school graduation. For students graduated in 2009 this includes attendance from the
summer of 2009 to the spring of 2013. For students graduated in 2010 the enrollment
period is between the summer of 2010 to the spring of 2014. The odds of postsecondary
enrollment are modeled for all higher education participation as well as attendance at a
community college or a four-year university (public or private).
Student Traits
Graduation year is a significant, positive main effect in all postsecondary
enrollment models. 2009 graduates are more likely to enroll overall and at both
institutional levels. Predicted probabilities for the 2009 cohort range from 51-55%,
holding all other indicators constant. Attendance is positively related to enrollment at
community colleges and negatively impacts university enrollment. Tech Prep
participation moderates the impact of student absences at the university level but not in
meaningful ways. Tech Prep positively moderates the impact of student absences in the
odds of postsecondary participation. Students participating in Tech Prep have greater
odds of higher education attendance in comparison to students in the control group.
Tech prep also interacts with gender. Female students who participated in Tech
prep have a greater likelihood of postsecondary enrollment (63%) than women in the
control group (55%). Women overall have greater odds of participation in higher
education. Gender is positively associated with enrollment in both the community college
and university models. Students from low-SES backgrounds have a negative relationship
within each model. Predicted probabilities for low-SES students participating in higher
education range from 41-48%.
111
In the overall model of higher education participation, several race/ethnicity
indicators interact with Tech Prep. Black Tech Prep students are slightly more likely to
enroll than Black students in the control group (58% versus 57%). Hispanic Tech Prep
students are technically less likely to enroll though the predicted probability of
enrollment is equivalent to the control group at 41%. White students in both groups have
low predicted probabilities of enrollment (47-48%) but higher odds of enrollment than
Hispanic students. The interaction trend for Black students is present in the community
college model but not at the university level. In both institutional models, Hispanic
students have lower odds of enrollment; the smallest expected probability is for Hispanic
students enrolling at the university level (32%).
LEP students have a low chance of enrollment at both the community college and
university level. In the overall postsecondary model, Tech Prep interacts with LEP,
allowing for somewhat larger participation. Including Tech Prep, predicted probabilities
for these students remain very low, ranging from 36-43%—the highest odds to be found
at the community college. Special education follows a somewhat similar trend of low
enrollment in specific institutional models. In the overall model for postsecondary
enrollment, Tech Prep modifies the negative relationship between special education and
enrollment. Participation in Tech Prep for special education students results in a positive
probability of enrollment (53%) compared to the control group (40%). Gifted
participation has a negative relationship with community college enrollment. GT has a
positive impact and positive interaction with Tech Prep at the university level and in the
overall model. GT Tech Prep students have a 66% chance of higher education enrollment
compared to 58% for GT students in the control grouping.
Indicators of workforce participation during the transitional year after high school
are positively associated with overall postsecondary enrollment as well as enrollment at
112
the community college. This indicates many students are working and attending higher
education at the same time. Transitional workforce participation is negatively associated
with university enrollment, even more so for Tech Prep students (44% compared to
46%). This indicates that university students are more likely to solely focus on
completing a degree, or more likely to have the means to focus on a degree without
having to take on a job.
Academic Indicators
While many rigor indicators produce significant main effects, the majority of
significant interactions between achievement indicators and Tech Prep are present in the
model predicting the odds of university enrollment. In all models, math and reading
TAKS play a significant role. Passing reading TAKS is positively associated with
enrollment in all models. Passing math TAKS is associated with overall enrollment and
enrollment at the university level; it predicts slightly lower participation at the
community college level.
Dual credit courses are also negatively associated with community college
enrollment. In the overall model, dual courses are positively related to enrollment and
interact with Tech Prep to produce even greater odds of enrollment. For example, the
predicted probability of Tech prep students taking the average dual course load is 63%
while comparable students in the control group result in a predicted probability of 56%.
An increase in a year-long course results in a 9-10% increase in the probability of
enrollment for both groups. A similar interaction trend for dual credit is present in the
university model of enrollment.
CTE and dual-CTE courses have significant interactions with Tech Prep in the
university enrollment model. Both variables are associated with somewhat lower odds of
enrollment. For CTE courses, Tech Prep serves to moderate the impact of CTE
113
coursework and limits the negative influence additional courses may have on the
predicted probability of enrollment. When viewing the relationship between dual-CTE
and university enrollment, Tech Prep participation further exacerbates the negative
relationship and creates lower odds of enrollment with each additional course. Tech Prep
also interacts with CTE courses at the community college level. In this model CTE, is
positively associated with enrollment, but Tech Prep participation slightly decreases odds
of enrollment. Dual-CTE in the community college model is also positively associated
with enrollment though there is no interaction with Tech Prep. These findings suggest
that while CTE and dual-CTE lead to greater community college participation, Tech Prep
interactions with CTE has limited impacts in preparing students for four-year institutions.
Much like transitional models of enrollment, college ready diplomas strongly
predict enrollment in postsecondary education over time. Both RHSP and DAP degree
plans are positively related to overall higher education enrollment. They are significantly
related to university enrollment with high predicted probabilities of participation, 79% for
RHSP and 88% for DAP. In community college models, DAP diplomas are negatively
associated with enrollment suggesting students who have completed the highest high
school degree plan are more likely to continue their academic careers at these types of
institutions. Predicted probabilities for DAP students at the community college level are
33%.
Campus Characteristics
A large number of school-level indicators impact enrollment. RGV LEAD is
significantly related to all models. Students from RGV area high schools, overall and at
the university level, are more likely attend higher education. Their predicted probabilities
range from 62-66%. At the community college level, RGV students are slightly less
likely to enroll over time; their predicted likelihood is 46%. These findings indicate that
114
RGV LEAD is doing its strongest work at pushing students towards four-year
institutions.
The proportions of low-SES and minority students at a campus are significant in
both the overall and university models, though the coefficients are very small. These
translate to odds which do not meaningfully impact models. Schools rated as Acceptable
under the Texas accountability system have a positive impact on overall enrollment in
higher education. Exemplary rated schools have a small, negative impact on the odds of
enrollment in a community college. Exemplary schools have a positive association with
university enrollment; the predicted probability of a student enrolling at a university is
54%, holding all else constant. Small schools are negatively associated with overall and
university enrollment, and large schools positively impact university enrollment as well
at attendance at any postsecondary institution. These trends are similar to transition
models in which Exemplary schools are best at sending students to the university level
while small schools struggle to enroll students in higher education during transitions and
over time.
Model Variability
Remaining variance in each model ranges from 0.162-0.309. The highest amount
of unexplained variance is within the university model which has a confidence interval
between 0.28-0.35%. All differences, especially in university attendance, have yet to be
explained across high school campuses (n=1,704). There remains minimal, un-modeled
variations between the schools students are complete high school at.
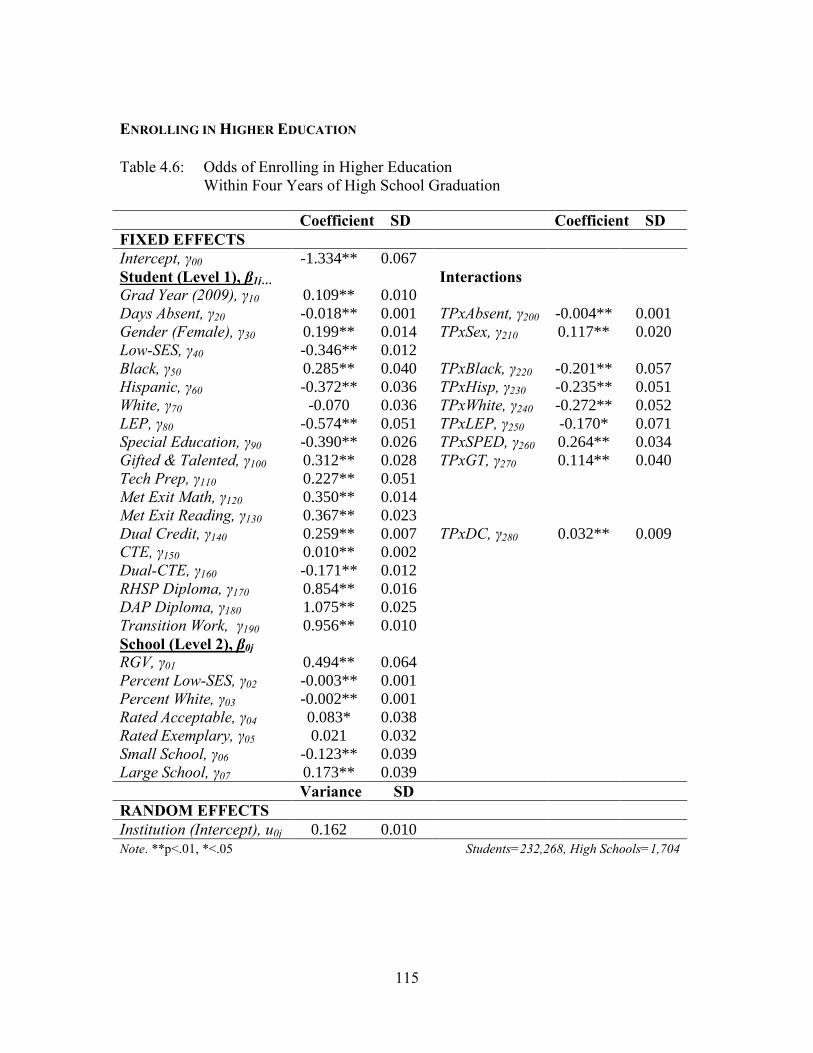
115
ENROLLING IN HIGHER EDUCATION
Table 4.6: Odds of Enrolling in Higher Education
Within Four Years of High School Graduation
Coefficient SD Coefficient SD
FIXED EFFECTS
Intercept, γ00 -1.334** 0.067
Student (Level 1), β1j… Interactions
Grad Year (2009), γ10 0.109** 0.010
Days Absent, γ20 -0.018** 0.001 TPxAbsent, γ200 -0.004** 0.001
Gender (Female), γ30 0.199** 0.014 TPxSex, γ210 0.117** 0.020
Low-SES, γ40 -0.346** 0.012
Black, γ50 0.285** 0.040 TPxBlack, γ220 -0.201** 0.057
Hispanic, γ60 -0.372** 0.036 TPxHisp, γ230 -0.235** 0.051
White, γ70 -0.070 0.036 TPxWhite, γ240 -0.272** 0.052
LEP, γ80 -0.574** 0.051 TPxLEP, γ250 -0.170* 0.071
Special Education, γ90 -0.390** 0.026 TPxSPED, γ260 0.264** 0.034
Gifted & Talented, γ100 0.312** 0.028 TPxGT, γ270 0.114** 0.040
Tech Prep, γ110 0.227** 0.051
Met Exit Math, γ120 0.350** 0.014
Met Exit Reading, γ130 0.367** 0.023
Dual Credit, γ140 0.259** 0.007 TPxDC, γ280 0.032** 0.009
CTE, γ150 0.010** 0.002
Dual-CTE, γ160 -0.171** 0.012
RHSP Diploma, γ170 0.854** 0.016
DAP Diploma, γ180 1.075** 0.025
Transition Work, γ190 0.956** 0.010
School (Level 2), β0j
RGV, γ01 0.494** 0.064
Percent Low-SES, γ02 -0.003** 0.001
Percent White, γ03 -0.002** 0.001
Rated Acceptable, γ04 0.083* 0.038
Rated Exemplary, γ05 0.021 0.032
Small School, γ06 -0.123** 0.039
Large School, γ07 0.173** 0.039
Variance SD
RANDOM EFFECTS
Institution (Intercept), u0j 0.162 0.010
Note. **p<.01, *<.05 Students=232,268, High Schools=1,704
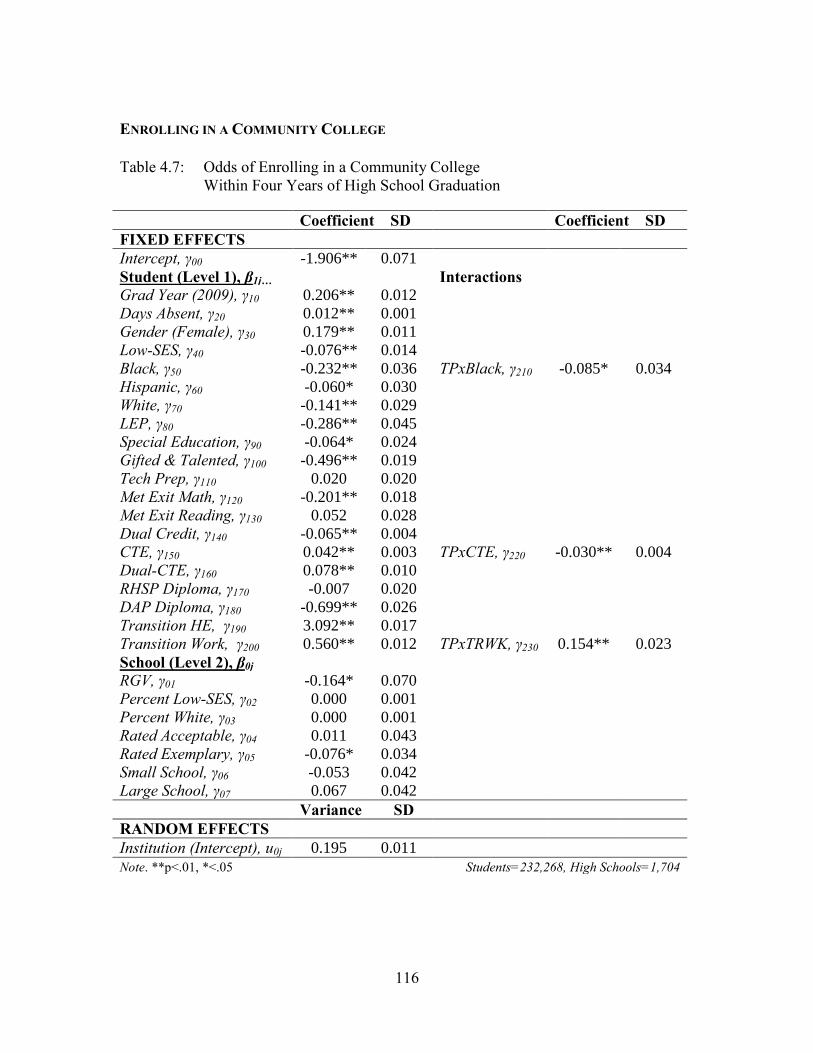
116
ENROLLING IN A COMMUNITY COLLEGE
Table 4.7: Odds of Enrolling in a Community College
Within Four Years of High School Graduation
Coefficient SD Coefficient SD
FIXED EFFECTS
Intercept, γ00 -1.906** 0.071
Student (Level 1), β1j… Interactions
Grad Year (2009), γ10 0.206** 0.012
Days Absent, γ20 0.012** 0.001
Gender (Female), γ30 0.179** 0.011
Low-SES, γ40 -0.076** 0.014
Black, γ50 -0.232** 0.036 TPxBlack, γ210 -0.085* 0.034
Hispanic, γ60 -0.060* 0.030
White, γ70 -0.141** 0.029
LEP, γ80 -0.286** 0.045
Special Education, γ90 -0.064* 0.024
Gifted & Talented, γ100 -0.496** 0.019
Tech Prep, γ110 0.020 0.020
Met Exit Math, γ120 -0.201** 0.018
Met Exit Reading, γ130 0.052 0.028
Dual Credit, γ140 -0.065** 0.004
CTE, γ150 0.042** 0.003 TPxCTE, γ220 -0.030** 0.004
Dual-CTE, γ160 0.078** 0.010
RHSP Diploma, γ170 -0.007 0.020
DAP Diploma, γ180 -0.699** 0.026
Transition HE, γ190 3.092** 0.017
Transition Work, γ200 0.560** 0.012 TPxTRWK, γ230 0.154** 0.023
School (Level 2), β0j
RGV, γ01 -0.164* 0.070
Percent Low-SES, γ02 0.000 0.001
Percent White, γ03 0.000 0.001
Rated Acceptable, γ04 0.011 0.043
Rated Exemplary, γ05 -0.076* 0.034
Small School, γ06 -0.053 0.042
Large School, γ07 0.067 0.042
Variance SD
RANDOM EFFECTS
Institution (Intercept), u0j 0.195 0.011
Note. **p<.01, *<.05 Students=232,268, High Schools=1,704
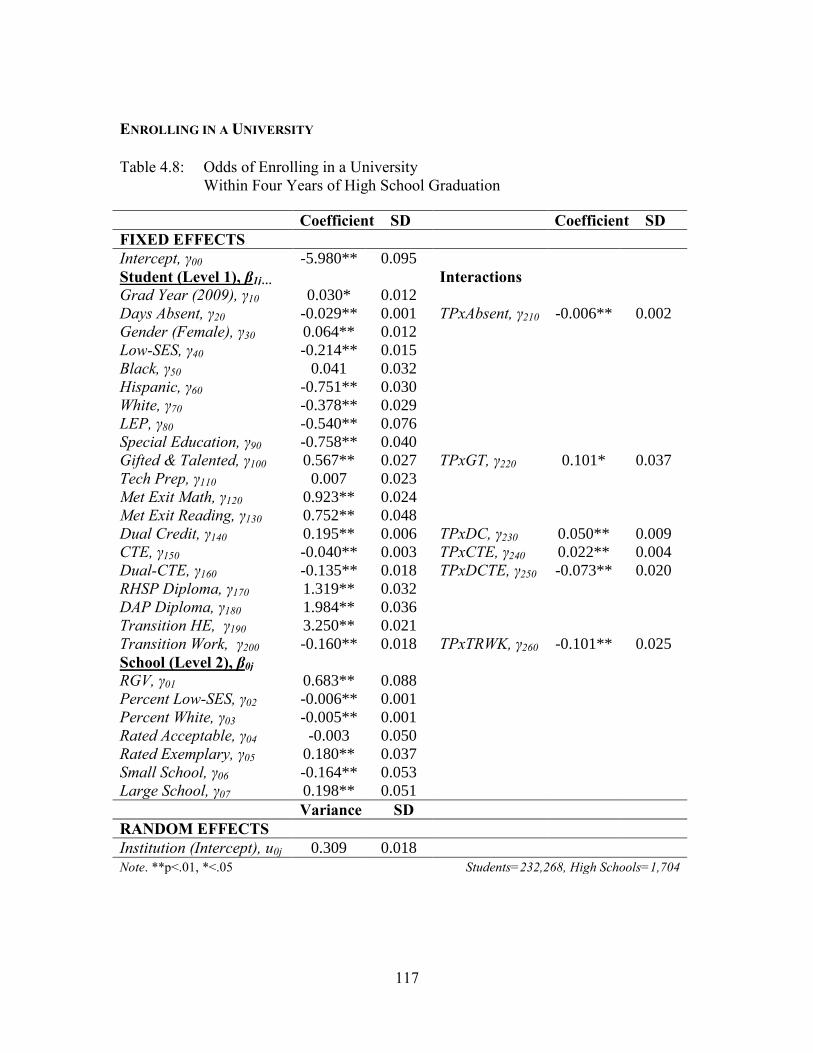
117
ENROLLING IN A UNIVERSITY
Table 4.8: Odds of Enrolling in a University
Within Four Years of High School Graduation
Coefficient SD Coefficient SD
FIXED EFFECTS
Intercept, γ00 -5.980** 0.095
Student (Level 1), β1j… Interactions
Grad Year (2009), γ10 0.030* 0.012
Days Absent, γ20 -0.029** 0.001 TPxAbsent, γ210 -0.006** 0.002
Gender (Female), γ30 0.064** 0.012
Low-SES, γ40 -0.214** 0.015
Black, γ50 0.041 0.032
Hispanic, γ60 -0.751** 0.030
White, γ70 -0.378** 0.029
LEP, γ80 -0.540** 0.076
Special Education, γ90 -0.758** 0.040
Gifted & Talented, γ100 0.567** 0.027 TPxGT, γ220 0.101* 0.037
Tech Prep, γ110 0.007 0.023
Met Exit Math, γ120 0.923** 0.024
Met Exit Reading, γ130 0.752** 0.048
Dual Credit, γ140 0.195** 0.006 TPxDC, γ230 0.050** 0.009
CTE, γ150 -0.040** 0.003 TPxCTE, γ240 0.022** 0.004
Dual-CTE, γ160 -0.135** 0.018 TPxDCTE, γ250 -0.073** 0.020
RHSP Diploma, γ170 1.319** 0.032
DAP Diploma, γ180 1.984** 0.036
Transition HE, γ190 3.250** 0.021
Transition Work, γ200 -0.160** 0.018 TPxTRWK, γ260 -0.101** 0.025
School (Level 2), β0j
RGV, γ01 0.683** 0.088
Percent Low-SES, γ02 -0.006** 0.001
Percent White, γ03 -0.005** 0.001
Rated Acceptable, γ04 -0.003 0.050
Rated Exemplary, γ05 0.180** 0.037
Small School, γ06 -0.164** 0.053
Large School, γ07 0.198** 0.051
Variance SD
RANDOM EFFECTS
Institution (Intercept), u0j 0.309 0.018
Note. **p<.01, *<.05 Students=232,268, High Schools=1,704
118
Developmental Remediation
Developmental Education (DE) provides non-credit remediation to help make
students college-ready. It is an umbrella term that defines any assistance, whether it falls
in the regular semester schedule or not, which helps prepare a student for credit-bearing
courses. Its purposes are to help provide the necessary academic supports to improve
basic skills and competencies in subject areas, usually mathematics, reading, and writing
(Collins, 2009; Lazarick, 1997). There are four equations which model developmental
enrollment within higher education. An overall DE participation model is calculated
along with participation in the three traditional subject areas.
Regression outputs for all models are in Tables 4.9-4.12. These models only
include PSM students enrolled in higher education within four years after high school
(n=157,209). DE outcomes are defined as a student taking one or more non-credit,
developmental course(s) during their enrollment in higher education. Subject area DE
outcomes are defined by a student enrolled in one or more non-credit DE course specific
to that area.
Student Traits
While many student characteristics significantly impact the predicted probability
of DE enrollment, few interact with Tech Prep participation. Most indicators produce
main effects. Like postsecondary enrollment, graduates of the 2009 high school cohort
are more likely to participate in DE courses. They have a greater predicted probability of
overall participation (52%) as well as greater odds of participation in mathematics and
reading developmental subjects. The number of days a student was absent during their
senior year significantly impacts readiness for credit-bearing courses. Students’ odds of
enrolling in DE increase with additional absences. This trend is present in the
mathematics DE model. In reading and writing, mean absences have minimal, negative
119
impacts. In the model for developmental reading, days absent interacts with Tech Prep
participation. Students in Tech Prep are significantly less likely to participate in
developmental reading, regardless of the number of days absent.
Women have 1.25 greater odds of enrolling in DE overall and between 1.15-1.31
greater odds of enrolling in reading or math DE courses. In writing DE, men are more
likely to enroll in a non-credit course with a predicted probability of 53%. In all models,
low-SES students are more likely to enroll in developmental courses. Tech Prep interacts
with low-SES in both overall and math DE models. In the overall developmental model,
Tech Prep participation has a positive impact, decreasing the chances of DE participation
(46% versus 55%). In the mathematics DE model, low-SES Tech Prep students are
slightly more likely to enroll in a course. In all DE models, Black and Hispanic students
have greater odds of participation than their White peers; Hispanic students have the
largest likelihood of DE course enrollment (66%). LEP and special education students
have high predicted probabilities of DE participation across all models, between 53-65%.
GT students have a very low chances of taking DE, 25% overall.
Enrolling in postsecondary education during the transition year after high school
is positively linked to developmental participation. This finding suggests many do not
enter higher education direct from high school ready for credit-bearing courses. Working
during the transition year is also positively associated with DE across all subject areas.
Tech Prep interacts with transitional workforce participation. Tech Prep participation
corresponds to lower probabilities of DE overall but slightly higher probabilities of math
DE.
Academic Indicators
Included in DE modeling is an additional achievement covariate, a readiness
indicator. In Texas, College and Career Ready (CCR) standards are measured as part of
120
the Texas Success Initiative (TSI). The TSI hosts complex requirements for credit- and
non-credit coursework. Meeting TSI standards are based on a variety of different high
school tests and college entrance exams.11 The readiness indicator, CCR Standard,
specifies whether a student has met TSI requirements. A student is marked not CCR if
they fail to meet the requirement at the start of any semester they are enrolled in higher
education. Readiness is calculated for the overall model and for CCR standards in each
subject area.
CCR standards are—predictably—positively related to enrollment in DE. Many
students failing to meet CCR standards enroll in developmental courses. Not all identified
as needing DE end up taking DE courses though. Those failing CCR standards have a
predicted probability of 86% for students in the control group and 84% for Tech Prep.
These numbers represent the odds of enrolling in any DE course. In mathematics
modeling, failing to meet subject CCR(M) results in a predicted probability of 84% for
math DE participation. For reading and writing, failing to meet subject standards—
CCR(R) or CCR(W)—results in higher probabilities of subject related DE, 91-95%.
Indicators of high achievement result, for the most part, in lower odds of DE
involvement. For example, both math and reading TAKS are potential tests to prove
readiness under TSI. Correspondingly, many who pass these tests are unlikely to enroll in
DE. Both TAKS measures are significantly and negatively related to DE enrollment in all
models. The number of dual credit courses a student takes decreases the chances of
overall developmental participation. Students with average dual coursework (M=0.63)
have low odds of DE which interact with Tech Prep. Control students have a predicted
11 More information on TSI and the inputs used to determine CCR variables may be found in the Glossary.
Information includes various tests used to measure TSI. For modeling, CCR Standard=1 equates to a
student who has failed to meet the TSI standards and thus is deemed in need of DE (non-credit
coursework). Students equaling CCR Standard=0 are considered college and/or career ready.
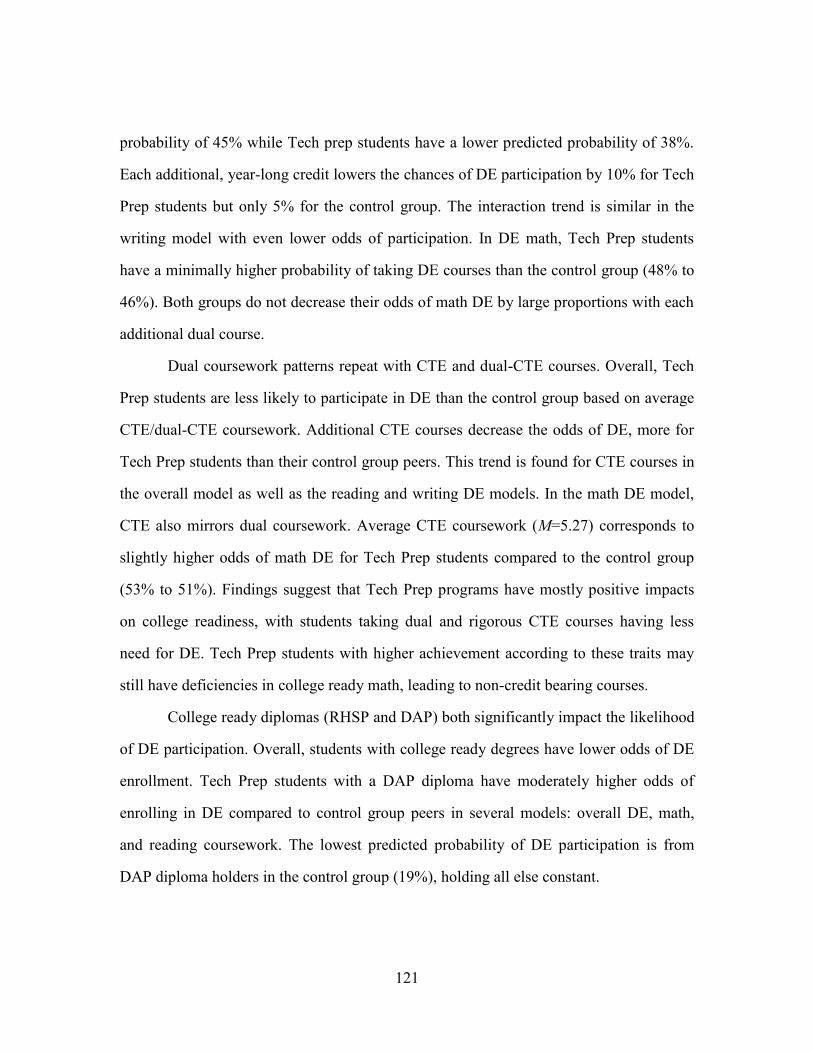
121
probability of 45% while Tech prep students have a lower predicted probability of 38%.
Each additional, year-long credit lowers the chances of DE participation by 10% for Tech
Prep students but only 5% for the control group. The interaction trend is similar in the
writing model with even lower odds of participation. In DE math, Tech Prep students
have a minimally higher probability of taking DE courses than the control group (48% to
46%). Both groups do not decrease their odds of math DE by large proportions with each
additional dual course.
Dual coursework patterns repeat with CTE and dual-CTE courses. Overall, Tech
Prep students are less likely to participate in DE than the control group based on average
CTE/dual-CTE coursework. Additional CTE courses decrease the odds of DE, more for
Tech Prep students than their control group peers. This trend is found for CTE courses in
the overall model as well as the reading and writing DE models. In the math DE model,
CTE also mirrors dual coursework. Average CTE coursework (M=5.27) corresponds to
slightly higher odds of math DE for Tech Prep students compared to the control group
(53% to 51%). Findings suggest that Tech Prep programs have mostly positive impacts
on college readiness, with students taking dual and rigorous CTE courses having less
need for DE. Tech Prep students with higher achievement according to these traits may
still have deficiencies in college ready math, leading to non-credit bearing courses.
College ready diplomas (RHSP and DAP) both significantly impact the likelihood
of DE participation. Overall, students with college ready degrees have lower odds of DE
enrollment. Tech Prep students with a DAP diploma have moderately higher odds of
enrolling in DE compared to control group peers in several models: overall DE, math,
and reading coursework. The lowest predicted probability of DE participation is from
DAP diploma holders in the control group (19%), holding all else constant.
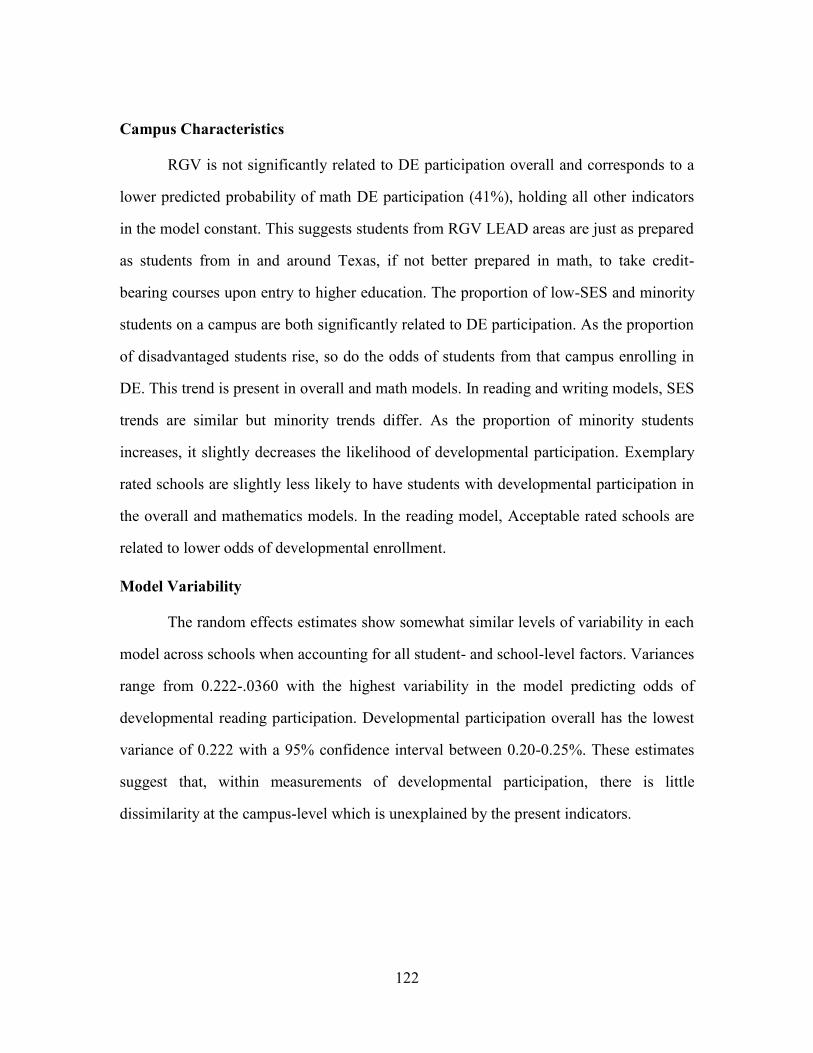
122
Campus Characteristics
RGV is not significantly related to DE participation overall and corresponds to a
lower predicted probability of math DE participation (41%), holding all other indicators
in the model constant. This suggests students from RGV LEAD areas are just as prepared
as students from in and around Texas, if not better prepared in math, to take credit-
bearing courses upon entry to higher education. The proportion of low-SES and minority
students on a campus are both significantly related to DE participation. As the proportion
of disadvantaged students rise, so do the odds of students from that campus enrolling in
DE. This trend is present in overall and math models. In reading and writing models, SES
trends are similar but minority trends differ. As the proportion of minority students
increases, it slightly decreases the likelihood of developmental participation. Exemplary
rated schools are slightly less likely to have students with developmental participation in
the overall and mathematics models. In the reading model, Acceptable rated schools are
related to lower odds of developmental enrollment.
Model Variability
The random effects estimates show somewhat similar levels of variability in each
model across schools when accounting for all student- and school-level factors. Variances
range from 0.222-.0360 with the highest variability in the model predicting odds of
developmental reading participation. Developmental participation overall has the lowest
variance of 0.222 with a 95% confidence interval between 0.20-0.25%. These estimates
suggest that, within measurements of developmental participation, there is little
dissimilarity at the campus-level which is unexplained by the present indicators.
123
PARTICIPATING IN DEVELOPMENTAL COURSEWORK
Table 4.9: Odds of Participating in Developmental Coursework
While Enrolled in Higher Education
Coefficient SD Coefficient SD
FIXED EFFECTS
Intercept, γ00 -0.602** 0.098
Student (Level 1), β1j… Interactions
Grad Year (2009), γ10 0.094** 0.013
Days Absent, γ20 0.007** 0.001
Gender (female), γ30 0.227** 0.013
Low-SES, γ40 0.182** 0.022 TPxSES, γ220 -0.091** 0.027
Black, γ50 0.395** 0.037
Hispanic, γ60 0.648** 0.035
White, γ70 0.200** 0.034
LEP, γ80 0.482** 0.080
Special Education, γ90 0.407** 0.035
Gifted & Talented, γ100 -1.099** 0.026
Tech Prep, γ110 -0.235** 0.067
Met Exit Math, γ120 -0.937** 0.036 TPxMath, γ230 0.187** 0.048
Met Exit Reading, γ130 -0.260** 0.042
Dual Credit, γ140 -0.194** 0.008 TPxDC, γ240 -0.051** 0.012
CTE, γ150 0.051** 0.003 TPxCTE, γ250 -0.037** 0.004
Dual-CTE, γ160 0.127** 0.021 TPxDCTE, γ260 0.064* 0.024
RHSP Diploma, γ170 -0.417** 0.036 TPxRHSP, γ270 0.165** 0.047
DAP Diploma, γ180 -1.465** 0.049 TPxDAP, γ280 0.358** 0.063
Transition HE, γ190 0.315** 0.020
Transition Work, γ200 0.284** 0.021 TPxTRWK, γ290 -0.082** 0.029
CCR Standard, γ210 1.788** 0.019 TPxCCR, γ300 0.085** 0.026
School (Level 2), β0j
RGV, γ01 -0.140 0.077
Percent Low-SES, γ02 0.005** 0.001
Percent White, γ03 -0.002* 0.001
Rated Acceptable, γ04 0.045 0.051
Rated Exemplary, γ05 -0.102* 0.040
Small School, γ06 0.008 0.049
Large School, γ07 0.044 0.048
Variance SD
RANDOM EFFECTS
Institution (Intercept), u0j 0.222 0.013
Note. **p<.01, *<.05 Students=157,209, High Schools=1,634
124
PARTICIPATING IN DEVELOPMENTAL MATHEMATICS
Table 4.10: Odds of Participating in Mathematics Developmental Coursework
While Enrolled in Higher Education
Coefficient SD Coefficient SD
FIXED EFFECTS
Intercept, γ00 -1.248** 0.088
Student (Level 1), β1j… Interactions
Grad Year (2009), γ10 0.106** 0.013
Days Absent, γ20 0.006** 0.001
Gender (female), γ30 0.265** 0.013
Low-SES, γ40 0.152** 0.021 TPxSES, γ220 -0.100** 0.026
Black, γ50 0.358** 0.036
Hispanic, γ60 0.633** 0.034
White, γ70 0.223** 0.034
LEP, γ80 0.120 0.066
Special Education, γ90 0.161** 0.031
Gifted & Talented, γ100 -1.014** 0.026
Tech Prep, γ110 0.119** 0.028
Met Exit Math, γ120 -0.711** 0.022
Met Exit Reading, γ130 -0.028 0.038
Dual Credit, γ140 -0.174** 0.008 TPxDC, γ230 -0.032** 0.010
CTE, γ150 0.047** 0.003 TPxCTE, γ240 -0.031** 0.004
Dual-CTE, γ160 0.160** 0.013
RHSP Diploma, γ170 -0.264** 0.025
DAP Diploma, γ180 -1.291** 0.043 TPxDAP, γ250 0.204** 0.046
Transition HE, γ190 0.310** 0.020
Transition Work, γ200 0.265** 0.020 TPxTRWK, γ260 -0.073* 0.028
CCR Math Standard, γ210 1.622** 0.014
School (Level 2), β0j
RGV, γ01 -0.365** 0.078
Percent Low-SES, γ02 0.003* 0.001
Percent White, γ03 -0.002* 0.001
Rated Acceptable, γ04 0.044 0.049
Rated Exemplary, γ05 -0.090* 0.040
Small School, γ06 -0.016 0.049
Large School, γ07 0.090 0.048
Variance SD
RANDOM EFFECTS
Institution (Intercept), u0j 0.232 0.014
Note. **p<.01, *<.05 Students=157,209, High Schools=1,634
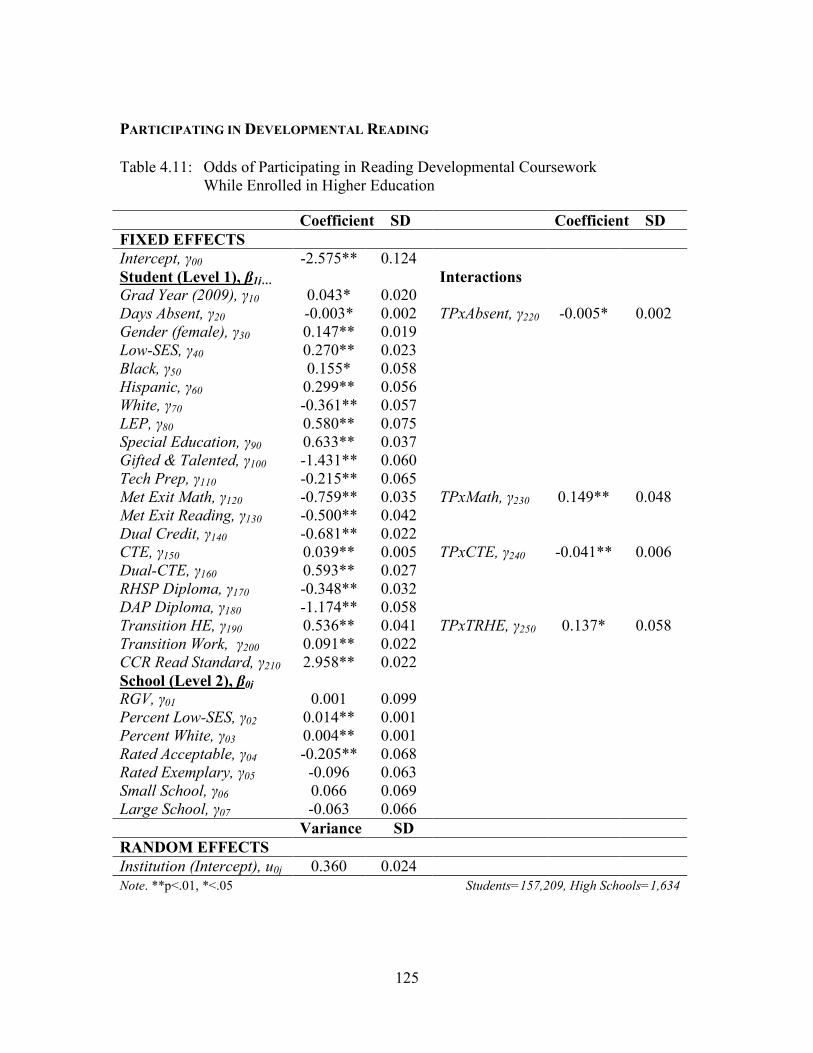
125
PARTICIPATING IN DEVELOPMENTAL READING
Table 4.11: Odds of Participating in Reading Developmental Coursework
While Enrolled in Higher Education
Coefficient SD Coefficient SD
FIXED EFFECTS
Intercept, γ00 -2.575** 0.124
Student (Level 1), β1j… Interactions
Grad Year (2009), γ10 0.043* 0.020
Days Absent, γ20 -0.003* 0.002 TPxAbsent, γ220 -0.005* 0.002
Gender (female), γ30 0.147** 0.019
Low-SES, γ40 0.270** 0.023
Black, γ50 0.155* 0.058
Hispanic, γ60 0.299** 0.056
White, γ70 -0.361** 0.057
LEP, γ80 0.580** 0.075
Special Education, γ90 0.633** 0.037
Gifted & Talented, γ100 -1.431** 0.060
Tech Prep, γ110 -0.215** 0.065
Met Exit Math, γ120 -0.759** 0.035 TPxMath, γ230 0.149** 0.048
Met Exit Reading, γ130 -0.500** 0.042
Dual Credit, γ140 -0.681** 0.022
CTE, γ150 0.039** 0.005 TPxCTE, γ240 -0.041** 0.006
Dual-CTE, γ160 0.593** 0.027
RHSP Diploma, γ170 -0.348** 0.032
DAP Diploma, γ180 -1.174** 0.058
Transition HE, γ190 0.536** 0.041 TPxTRHE, γ250 0.137* 0.058
Transition Work, γ200 0.091** 0.022
CCR Read Standard, γ210 2.958** 0.022
School (Level 2), β0j
RGV, γ01 0.001 0.099
Percent Low-SES, γ02 0.014** 0.001
Percent White, γ03 0.004** 0.001
Rated Acceptable, γ04 -0.205** 0.068
Rated Exemplary, γ05 -0.096 0.063
Small School, γ06 0.066 0.069
Large School, γ07 -0.063 0.066
Variance SD
RANDOM EFFECTS
Institution (Intercept), u0j 0.360 0.024
Note. **p<.01, *<.05 Students=157,209, High Schools=1,634

126
PARTICIPATING IN DEVELOPMENTAL WRITING
Table 4.12: Odds of Participating in Writing Developmental Coursework
While Enrolled in Higher Education
Coefficient SD Coefficient SD
FIXED EFFECTS
Intercept, γ00 -1.872** 0.112
Student (Level 1), β1j… Interactions
Grad Year (2009), γ10 -0.058** 0.019
Days Absent, γ20 -0.002* 0.001
Gender (female), γ30 -0.114** 0.018
Low-SES, γ40 0.271** 0.021
Black, γ50 0.161** 0.053
Hispanic, γ60 0.229** 0.052
White, γ70 -0.242** 0.052
LEP, γ80 0.470** 0.069
Special Education, γ90 0.522** 0.035
Gifted & Talented, γ100 -1.383** 0.056
Tech Prep, γ110 -0.060 0.032
Met Exit Math, γ120 -0.582** 0.024
Met Exit Reading, γ130 -0.450** 0.039
Dual Credit, γ140 -0.659** 0.024 TPxDC, γ220 -0.056* 0.023
CTE, γ150 0.037** 0.005 TPxCTE, γ230 -0.034** 0.006
Dual-CTE, γ160 0.619** 0.027
RHSP Diploma, γ170 -0.373** 0.030 TPxDAP, γ240 0.252* 0.089
DAP Diploma, γ180 -1.330** 0.078
Transition HE, γ190 0.153** 0.026
Transition Work, γ200 0.061** 0.020
CCR Write Standard, γ210 2.265** 0.027 TPxCCRW, γ250 0.082* 0.036
School (Level 2), β0j
RGV, γ01 -0.001 0.088
Percent Low-SES, γ02 0.011** 0.001
Percent White, γ03 0.002* 0.001
Rated Acceptable, γ04 -0.096 0.064
Rated Exemplary, γ05 -0.070 0.058
Small School, γ06 0.039 0.062
Large School, γ07 -0.022 0.060
Variance SD
RANDOM EFFECTS
Institution (Intercept), u0j 0.275 0.019
Note. **p<.01, *<.05 Students=157,209, High Schools=1,634
127
Postsecondary Attainment
The modeling of postsecondary attainment outcomes is completed for PSM
students who enrolled in higher education (n=157,209). This includes 1,634 high schools
in the sample which sent students on to a postsecondary institution. In the PSM sample,
68% enrolled in higher education within four years. Of those enrolled, 42% took some
form of developmental education. Twenty-five percent of enrolled students attained a
postsecondary credential (39,874) representing 17% of the total PSM sample. Multilevel
logistic regression is used to ascertain the odds of attaining a postsecondary credential.
The odds of gaining each type of degree and/or certificate are calculated as well.
Credential models are: Associate’s Degrees (AA), Bachelor’s Degrees (BD), and higher
education certificates. Fixed effects and coefficients for each model are located in Tables
4.13-4.16.
Student Traits
Unlike trends in enrollment, there is no significant difference between high school
graduating cohorts in gaining a postsecondary credential. The number of days a student
was absent during their senior year is negatively associated with completing a
postsecondary degree or certificate. An additional 10 days absent decreases the predicted
probability of completion by 5-10%. In the model for completing a BD, absenteeism
interacts with Tech Prep, modifying the negative impacts and increasing the probability
of earning a degree.
In all models, save postsecondary certificates, women have greater odds of
completion. Women have a 60-69% probability in overall, AA, and BD models compared
to a 46% predicted probability of completing a certificate. In all but the BD model,
gender interacts with Tech Prep to further boost women’s chances of completing a
postsecondary credential. In the overall model, women in Tech Prep have a predicted
128
probability of 77% compared to 65% in the control group. An interaction is also present
in the certificate model, moderating the negative relationship between gender and the
outcome. Women in Tech Prep have a 54% likelihood of gaining a certificate compared
to the 46% predicted probability in the control group.
In the overall and BD models, low-SES is negatively associated with gaining a
credential. In the AA and certification models, low-SES students have slightly improved
odds of completion. Black students have lower chances of gaining a postsecondary
credential with a 34% predicted probability in the overall model. Hispanic students have
lower odds of completing an overall credential or BD, but higher, positive odds of
completing an AA or certification. The highest predicted probability for Hispanic
students is in the completion of a certificate at 62%. White students do not significantly
differ than others in most models. In the odds of gaining a certificate, White students
have a greater likelihood of completion, similar to Hispanic students (64% predicted
probability).
LEP students, though less likely to enroll and more likely to need developmental
remediation, have greater odds of completing a postsecondary credential. The predicted
probability of an enrolled LEP student completing higher education is 58%, 55% for the
AA model and 64% for the certification model. The only model in which LEP students
have a lower chance of completion is in the odds of attaining a BD, with a 32% predicted
probability. These findings suggest that while LEP students struggle to gain access to
higher education, they are having success in gaining credentials once enrolled. Prior
models suggest special education students also have limited access to higher education
and increased developmental need. Unlike LEP students, though, special education
students have lower odds of completing a postsecondary credential. The only model
where special education students have a greater probability of attainment is in the odds of
129
completing a certification (58%). GT students are more likely to complete a BD and less
likely to complete an AA or certification credential. Tech Prep interacts with GT in the
AA model to modify the negative odds; Tech Prep GT students have an equal probability
(50%) of completion compared to the 39% predicted probability in the control group.
Enrolling within a year of high school is positively associated with postsecondary
attainment. Tech Prep interacts with transitional enrollment in the overall attainment
model to increase odds of a credential compared to the control group (86% versus 78%).
Working within a year of high school is negatively associated with overall attainment,
AA, and BD models resulting in lower odds of higher education completion.
Academic Indicators
Academic rigor and achievement variables provide some of the most interesting
impacts of the study thus far, especially when taken in context with other P-16+
outcomes modeled. Math TAKS is positively related to the completion of a credential in
all models; Tech Prep interacts with Math TAKS in the overall model to augment the
odds of completion. Reading TAKS is positively associated with overall completion and
both degree models, but is linked with slightly lower odds of completing a certificate.
In the overall, AA, and BD models, dual enrollment is positively related to
attainment and corresponds to an increase of 2-3% in the probability of completion with
every additional course. In both the overall and BD models, dual credit interacts with
Tech Prep to create even greater odds of attainment. For those with an average number of
dual credits, Tech Prep students have a 71% predicted probability of postsecondary
attainment compared to 53% in the control group. For the certification model, dual credit
is negatively associated with completion.
The mean number of CTE courses is negatively associated with attainment in both
overall and BD models, and positively associated with attainment in certification and AA
130
models. Tech Prep interacts with CTE in all models. Regardless of the impact to students
in the control group, students in Tech Prep have a proportionally greater probability of
completing a credential. For example, the predicted probability of a BD for a Tech Prep
student taking the mean number of CTE courses (M=5.27) is 56% compared to the
control group at 49%. Each additional, year-long CTE course results in 6% rise in the
probability of a degree for the Tech Prep group but a 1-2% decrease for the control
group. These findings, taken in context with the prior models in the study, are important.
Models of enrollment suggest that CTE has negative impacts and that Tech Prep, while
able to increase participation at some levels, has limited success in promoting access at
the university level. Models of completion suggest that Tech Prep participation is far
reaching as it promotes higher odds of attainment at all levels—including universities—
for CTE students who do transition to higher education.
Dual-CTE courses produce somewhat smaller odds of completion for most
models. In the certification model, dual-CTE is associated with greater odds of
completion and interacts with Tech Prep to increase probabilities further. Tech Prep
students have a 71% predicted probability compared to the 58% probability of the control
group. This finding may be an artifact of the Tech Prep program itself as many models
include dual-CTE courses and postsecondary certification upon completion as part of
their program structure.
Students with a college ready, RHSP diploma are less likely to complete a
certificate. In all other models, RHSP and DAP are positively related to attainment.
Interestingly, Tech Prep participation interacts with both overall and BD models but in
different ways. In the overall model, Tech Prep students with either a RHSP or DAP
diploma have greater odds of attainment compared to the control group. In the BD model,
131
Tech Prep participation slightly lowers the odds of attainment when connected to diploma
type.
Lastly, DE participation in any subject (math, reading or writing) significantly
lowers the probability of postsecondary attainment in all models save the completion of
an AA. Moreover, Tech Prep interacts with DE in the AA model to increase the odds of
attainment. Tech Prep students who took DE have a predicted probability of 57%
completion while the control group has a 56% probability. These chances are far greater
than the very low odds in other models; the predicted probability for DE students
completing a BD is 18%, holding all else constant.
Campus Characteristics
Though far removed in time from some of the outcomes, the high school campus
attended still impacts postsecondary attainment for students. The RGV LEAD area is
significantly related to overall, AA, and BD models. RGV negatively impacts the odds of
completing a postsecondary degree overall as well as an AA, but it is positively related to
the completion of a BD. The RGV predicted probability of completing an AA is 47%
while the likelihood of completing a BD is 55% (overall is 47%). These findings are
somewhat frustrating given that prior P-16+ models suggest RGV is linked to higher
enrollment. Overall, modeling shows RGV has further work to accomplish getting
students both enrolled and through higher education to a postsecondary credential.
Strengths to date include the transition and persistence of students in the university
pipeline.
The proportion of low-SES students at a campus is negatively associated with
postsecondary completion overall and in the BD model. It has small but positive impacts
on AA and certification models. In all models, changes in odds are minimal resulting in a
1-2% rise or fall in the predicted probability of completion for every 10% change in SES
132
at the campus-level. For both AA and certification models, the percentage of minority
students on a campus decreases the probability of completion. In modeling BD
completion, the percentage of minority students at the campus-level slightly increases
odds of completion. Exemplary rated schools are associated with somewhat larger odds
of completing a bachelor’s degree and lower odds of completing a certificate. Large
schools (n>750) are associated with a higher probability of postsecondary completion as
well as earning a BD and a certificate. Exemplary findings correspond with enrollment
models suggesting these campuses have particular success with the university level when
compared to those campuses labeled Acceptable, or Unacceptable, in the state
accountability system.
Model Variability
Lastly, random effects estimates illustrate that models, including both student-
and school-level characteristics, explain most of the variations across schools. Variances
range from 0.090 in the modeling of overall postsecondary attainment to 0.487 for the
odds of completing a higher education certificate. The certificate model has a 95%
confidence interval between 0.42-0.57%. No postsecondary credential model contains a
significant amount of variability remaining after modeling.
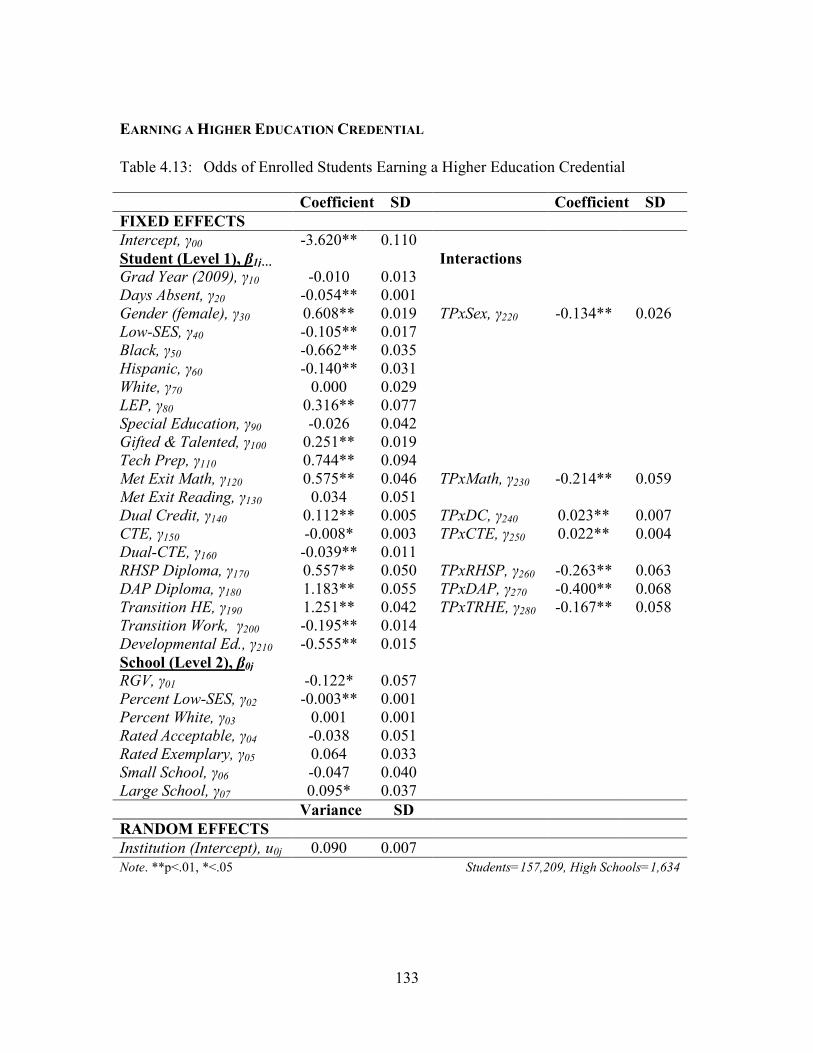
133
EARNING A HIGHER EDUCATION CREDENTIAL
Table 4.13: Odds of Enrolled Students Earning a Higher Education Credential
Coefficient SD Coefficient SD
FIXED EFFECTS
Intercept, γ00 -3.620** 0.110
Student (Level 1), β1j… Interactions
Grad Year (2009), γ10 -0.010 0.013
Days Absent, γ20 -0.054** 0.001
Gender (female), γ30 0.608** 0.019 TPxSex, γ220 -0.134** 0.026
Low-SES, γ40 -0.105** 0.017
Black, γ50 -0.662** 0.035
Hispanic, γ60 -0.140** 0.031
White, γ70 0.000 0.029
LEP, γ80 0.316** 0.077
Special Education, γ90 -0.026 0.042
Gifted & Talented, γ100 0.251** 0.019
Tech Prep, γ110 0.744** 0.094
Met Exit Math, γ120 0.575** 0.046 TPxMath, γ230 -0.214** 0.059
Met Exit Reading, γ130 0.034 0.051
Dual Credit, γ140 0.112** 0.005 TPxDC, γ240 0.023** 0.007
CTE, γ150 -0.008* 0.003 TPxCTE, γ250 0.022** 0.004
Dual-CTE, γ160 -0.039** 0.011
RHSP Diploma, γ170 0.557** 0.050 TPxRHSP, γ260 -0.263** 0.063
DAP Diploma, γ180 1.183** 0.055 TPxDAP, γ270 -0.400** 0.068
Transition HE, γ190 1.251** 0.042 TPxTRHE, γ280 -0.167** 0.058
Transition Work, γ200 -0.195** 0.014
Developmental Ed., γ210 -0.555** 0.015
School (Level 2), β0j
RGV, γ01 -0.122* 0.057
Percent Low-SES, γ02 -0.003** 0.001
Percent White, γ03 0.001 0.001
Rated Acceptable, γ04 -0.038 0.051
Rated Exemplary, γ05 0.064 0.033
Small School, γ06 -0.047 0.040
Large School, γ07 0.095* 0.037
Variance SD
RANDOM EFFECTS
Institution (Intercept), u0j 0.090 0.007
Note. **p<.01, *<.05 Students=157,209, High Schools=1,634
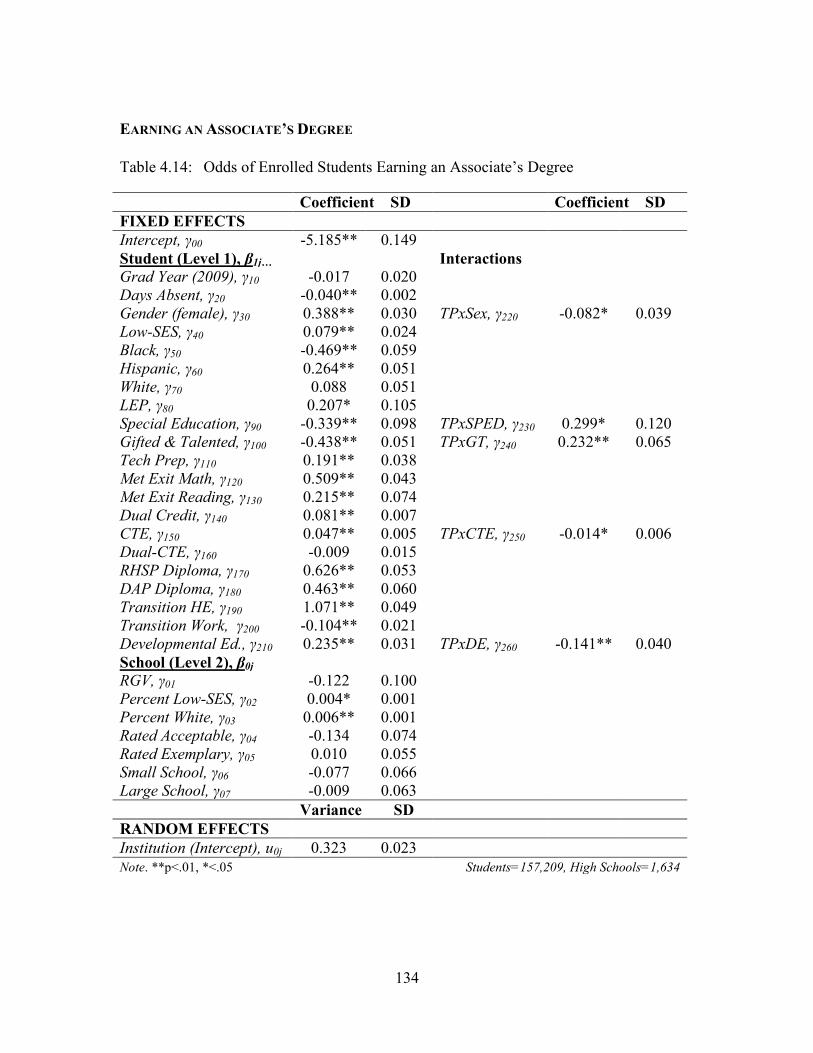
134
EARNING AN ASSOCIATE’S DEGREE
Table 4.14: Odds of Enrolled Students Earning an Associate’s Degree
Coefficient SD Coefficient SD
FIXED EFFECTS
Intercept, γ00 -5.185** 0.149
Student (Level 1), β1j… Interactions
Grad Year (2009), γ10 -0.017 0.020
Days Absent, γ20 -0.040** 0.002
Gender (female), γ30 0.388** 0.030 TPxSex, γ220 -0.082* 0.039
Low-SES, γ40 0.079** 0.024
Black, γ50 -0.469** 0.059
Hispanic, γ60 0.264** 0.051
White, γ70 0.088 0.051
LEP, γ80 0.207* 0.105
Special Education, γ90 -0.339** 0.098 TPxSPED, γ230 0.299* 0.120
Gifted & Talented, γ100 -0.438** 0.051 TPxGT, γ240 0.232** 0.065
Tech Prep, γ110 0.191** 0.038
Met Exit Math, γ120 0.509** 0.043
Met Exit Reading, γ130 0.215** 0.074
Dual Credit, γ140 0.081** 0.007
CTE, γ150 0.047** 0.005 TPxCTE, γ250 -0.014* 0.006
Dual-CTE, γ160 -0.009 0.015
RHSP Diploma, γ170 0.626** 0.053
DAP Diploma, γ180 0.463** 0.060
Transition HE, γ190 1.071** 0.049
Transition Work, γ200 -0.104** 0.021
Developmental Ed., γ210 0.235** 0.031 TPxDE, γ260 -0.141** 0.040
School (Level 2), β0j
RGV, γ01 -0.122 0.100
Percent Low-SES, γ02 0.004* 0.001
Percent White, γ03 0.006** 0.001
Rated Acceptable, γ04 -0.134 0.074
Rated Exemplary, γ05 0.010 0.055
Small School, γ06 -0.077 0.066
Large School, γ07 -0.009 0.063
Variance SD
RANDOM EFFECTS
Institution (Intercept), u0j 0.323 0.023
Note. **p<.01, *<.05 Students=157,209, High Schools=1,634
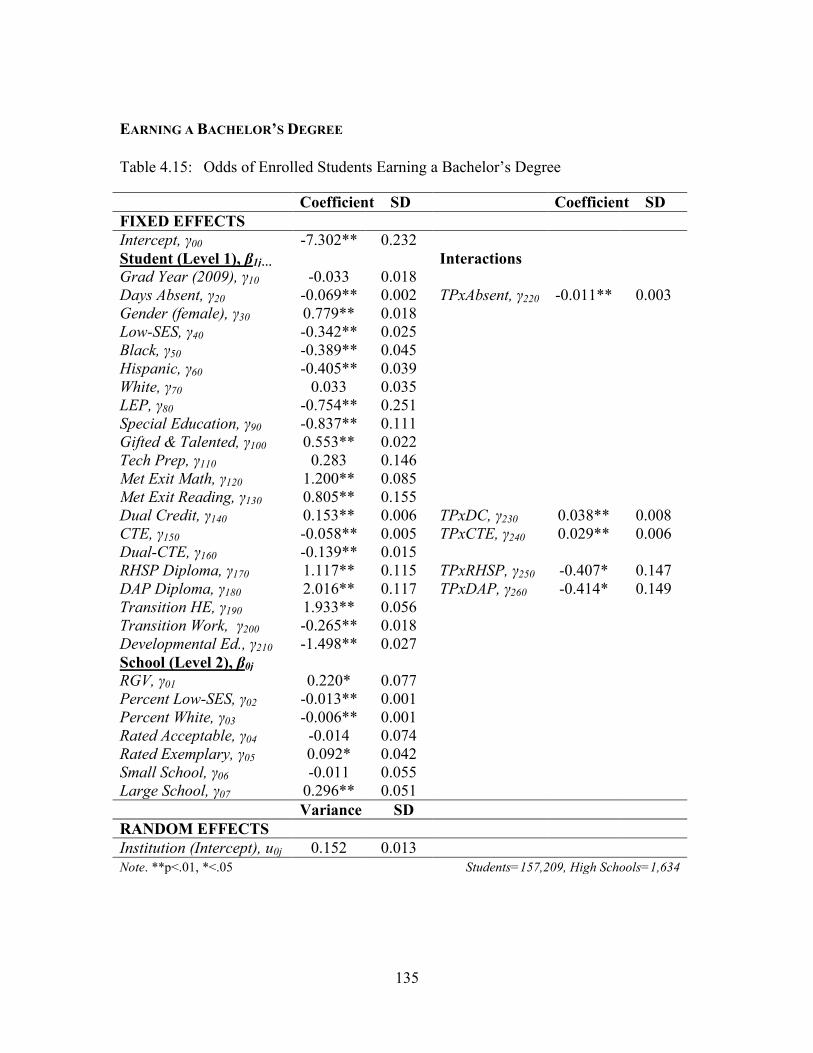
135
EARNING A BACHELOR’S DEGREE
Table 4.15: Odds of Enrolled Students Earning a Bachelor’s Degree
Coefficient SD Coefficient SD
FIXED EFFECTS
Intercept, γ00 -7.302** 0.232
Student (Level 1), β1j… Interactions
Grad Year (2009), γ10 -0.033 0.018
Days Absent, γ20 -0.069** 0.002 TPxAbsent, γ220 -0.011** 0.003
Gender (female), γ30 0.779** 0.018
Low-SES, γ40 -0.342** 0.025
Black, γ50 -0.389** 0.045
Hispanic, γ60 -0.405** 0.039
White, γ70 0.033 0.035
LEP, γ80 -0.754** 0.251
Special Education, γ90 -0.837** 0.111
Gifted & Talented, γ100 0.553** 0.022
Tech Prep, γ110 0.283 0.146
Met Exit Math, γ120 1.200** 0.085
Met Exit Reading, γ130 0.805** 0.155
Dual Credit, γ140 0.153** 0.006 TPxDC, γ230 0.038** 0.008
CTE, γ150 -0.058** 0.005 TPxCTE, γ240 0.029** 0.006
Dual-CTE, γ160 -0.139** 0.015
RHSP Diploma, γ170 1.117** 0.115 TPxRHSP, γ250 -0.407* 0.147
DAP Diploma, γ180 2.016** 0.117 TPxDAP, γ260 -0.414* 0.149
Transition HE, γ190 1.933** 0.056
Transition Work, γ200 -0.265** 0.018
Developmental Ed., γ210 -1.498** 0.027
School (Level 2), β0j
RGV, γ01 0.220* 0.077
Percent Low-SES, γ02 -0.013** 0.001
Percent White, γ03 -0.006** 0.001
Rated Acceptable, γ04 -0.014 0.074
Rated Exemplary, γ05 0.092* 0.042
Small School, γ06 -0.011 0.055
Large School, γ07 0.296** 0.051
Variance SD
RANDOM EFFECTS
Institution (Intercept), u0j 0.152 0.013
Note. **p<.01, *<.05 Students=157,209, High Schools=1,634
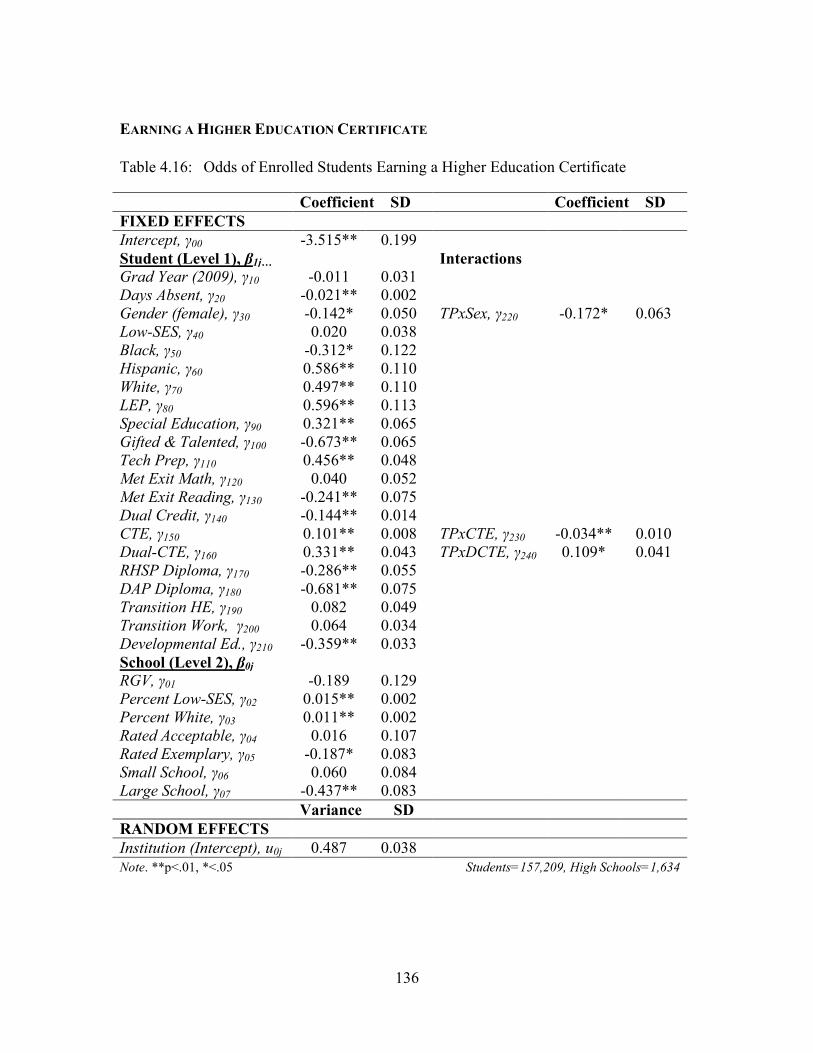
136
EARNING A HIGHER EDUCATION CERTIFICATE
Table 4.16: Odds of Enrolled Students Earning a Higher Education Certificate
Coefficient SD Coefficient SD
FIXED EFFECTS
Intercept, γ00 -3.515** 0.199
Student (Level 1), β1j… Interactions
Grad Year (2009), γ10 -0.011 0.031
Days Absent, γ20 -0.021** 0.002
Gender (female), γ30 -0.142* 0.050 TPxSex, γ220 -0.172* 0.063
Low-SES, γ40 0.020 0.038
Black, γ50 -0.312* 0.122
Hispanic, γ60 0.586** 0.110
White, γ70 0.497** 0.110
LEP, γ80 0.596** 0.113
Special Education, γ90 0.321** 0.065
Gifted & Talented, γ100 -0.673** 0.065
Tech Prep, γ110 0.456** 0.048
Met Exit Math, γ120 0.040 0.052
Met Exit Reading, γ130 -0.241** 0.075
Dual Credit, γ140 -0.144** 0.014
CTE, γ150 0.101** 0.008 TPxCTE, γ230 -0.034** 0.010
Dual-CTE, γ160 0.331** 0.043 TPxDCTE, γ240 0.109* 0.041
RHSP Diploma, γ170 -0.286** 0.055
DAP Diploma, γ180 -0.681** 0.075
Transition HE, γ190 0.082 0.049
Transition Work, γ200 0.064 0.034
Developmental Ed., γ210 -0.359** 0.033
School (Level 2), β0j
RGV, γ01 -0.189 0.129
Percent Low-SES, γ02 0.015** 0.002
Percent White, γ03 0.011** 0.002
Rated Acceptable, γ04 0.016 0.107
Rated Exemplary, γ05 -0.187* 0.083
Small School, γ06 0.060 0.084
Large School, γ07 -0.437** 0.083
Variance SD
RANDOM EFFECTS
Institution (Intercept), u0j 0.487 0.038
Note. **p<.01, *<.05 Students=157,209, High Schools=1,634
137
Workforce Participation
The last set of models estimate the odds of entering the workforce within a year of
earning a postsecondary credential. It is the furthest point on the P-16+ pipeline measured
in the study. Workforce participation is defined as working in any one of the summer,
fall, winter, or spring quarters after gaining a postsecondary credential—typically though
not always granted in the spring.12 This coding structure is set in place to capture the
largest proportion of students working within a year of higher education graduation.
Students may have earned a credential at any time point in the five postsecondary
graduation years captured in the data (i.e., the year concurrent with high school
completion plus four years post-high school). Students may have also earned more than
one degree and/or more than one type of credential. Multiple graduations are all counted.
For, the purposes of modeling, if a student worked within a year of any credential, they
are coded as a positive outcome. The sample used for modeling includes PSM matched
students who earned a postsecondary credential (n=39,874). Two models are shown, the
odds of entering the workforce after postsecondary graduation, and the odds of working
two jobs after postsecondary graduation.
Student Traits
Gender is positively associated with the odds of transitioning to the workforce
within a year of earning a postsecondary credential; women have a predicted probability
of 53%. Tech Prep interacts with gender in the model of a second job. Women in the
control group have a higher chance of working two jobs (57%) while women who
participated in Tech Prep are less likely to work in a second position (52%). All Ethnic
12 For a student coded as graduating in 2012 (regardless of the graduation date), working within a year
includes any workforce participation in the summer 2012, fall 2012, winter 2012, and/or spring2013 wage
quarters.
138
groups measured have a positive odds of employment upon graduation from higher
education. The race/ethnic group with the highest predicted probability of workforce
participation is comprised of Black students with 64%. Black students are also the most
likely to take on a second job after completing a postsecondary credential; Tech Prep
interacts with this category producing even greater odds for Black Tech Prep students
(68% versus 64%). LEP students are not more likely to work upon graduation, and
special education students have significantly lower odds of workforce participation
(44%). GT students interact with Tech Prep; those involved in Tech Prep have lower
chances of workforce participation (41%) while the control group has even odds of
employment (50%). GT students have lower odds of working a second job.
Working the year after high school is positively related to working the year after
higher education completion (students have a 71% predicted probability). Transitional
employment interacts with Tech Prep to slightly increase the odds of employment after
earning a credential; Tech Prep students have a 72% predicted probability. This trend
exists in both workforce models suggesting Tech Prep students are even more likely to
work, and work second jobs, than their control group peers.
Academic Indicators
Much like demographic or program participation variables, there are few
interactions between Tech Prep and academic covariates. Those passing the reading
TAKS have 1.28 greater odds of employment upon higher education graduation. The
average number of CTE courses is positively associated with employment though, the
likelihood of employment does not appreciably increase with additional courses. Dual-
CTE courses are negatively associated with employment. Each additional, year-long
dual-CTE course decreases the predicted probability of working by 1%. Interestingly,
139
DAP diplomas are negatively related to employment after earning a postsecondary
credential. DAP diplomas are negatively related to working a second job as well.
Students who participated in developmental coursework while enrolled in higher
education have slightly greater odds of employment after completing a postsecondary
credential. All credential types significantly and positively relate to workforce
participation. The highest predicted probability of employment is from students with a
higher education certification (63%). Tech Prep interacts with students earning a BD to
increase the overall odds of employment; the impact is relatively minimal though,
holding all else constant. Those with a BD have a predicted probability of 60%
employment and those with an AA have a predicted probability of 58%. Trends in
degree type are present in the modeling of working a second job. Students earning a
certificate have a predicted probability of 63% working a second job. Also BD (58%) and
AA (57%) have similar odds of secondary employment.
Campus Characteristics
Very few campus characteristics impact whether or not a student enters the
workforce after earning a postsecondary credential. Students from the RGV LEAD area
have lower odds of employment after completing a credential. The predicted probability
of workforce participation is 45%. This finding suggests that there are limitations to
employment for RGV students post-higher education completion. The percent of low-
SES and minority students at a campus is positively associated with post-postsecondary
employment. A 10% increase in the proportion of disadvantaged students at a high school
campus increases the odds of employment for an individual student by 1%. SES and
minority student associations are similar in the model for a second job as well.

140
Model Variability
The variance for the odds of workforce participation after earning a higher
education credential is 0.031 with a 95% confidence interval between 0.02-.05%. Some
variability—show in the random effects estimates—do persist, even in longitudinal
outcomes far removed from the student’s time spent in high school.
TRANSITIONING TO THE POSTSECONDARY WORKFORCE
TRANSITIONING TO THE POSTSECONDARY WORKFORCE (TWO JOBS)
Tables 4.17 and 4.18 describe the models for transitioning to the postsecondary
workforce as well as taking on a second position in the postsecondary workforce. These
tables are both very large and, as such, are located on the next two pages without their
corresponding headings (which are located above).
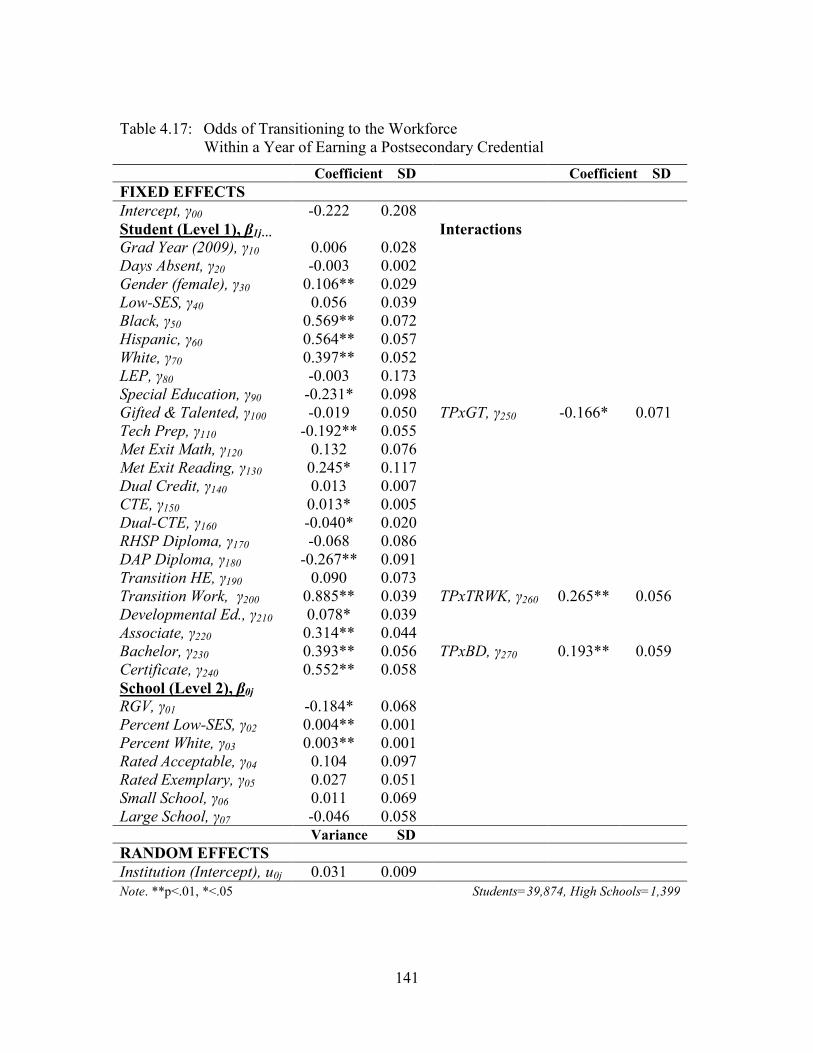
141
Table 4.17: Odds of Transitioning to the Workforce
Within a Year of Earning a Postsecondary Credential
Coefficient SD Coefficient SD
FIXED EFFECTS
Intercept, γ00 -0.222 0.208
Student (Level 1), β1j… Interactions
Grad Year (2009), γ10 0.006 0.028
Days Absent, γ20 -0.003 0.002
Gender (female), γ30 0.106** 0.029
Low-SES, γ40 0.056 0.039
Black, γ50 0.569** 0.072
Hispanic, γ60 0.564** 0.057
White, γ70 0.397** 0.052
LEP, γ80 -0.003 0.173
Special Education, γ90 -0.231* 0.098
Gifted & Talented, γ100 -0.019 0.050 TPxGT, γ250 -0.166* 0.071
Tech Prep, γ110 -0.192** 0.055
Met Exit Math, γ120 0.132 0.076
Met Exit Reading, γ130 0.245* 0.117
Dual Credit, γ140 0.013 0.007
CTE, γ150 0.013* 0.005
Dual-CTE, γ160 -0.040* 0.020
RHSP Diploma, γ170 -0.068 0.086
DAP Diploma, γ180 -0.267** 0.091
Transition HE, γ190 0.090 0.073
Transition Work, γ200 0.885** 0.039 TPxTRWK, γ260 0.265** 0.056
Developmental Ed., γ210 0.078* 0.039
Associate, γ220 0.314** 0.044
Bachelor, γ230 0.393** 0.056 TPxBD, γ270 0.193** 0.059
Certificate, γ240 0.552** 0.058
School (Level 2), β0j
RGV, γ01 -0.184* 0.068
Percent Low-SES, γ02 0.004** 0.001
Percent White, γ03 0.003** 0.001
Rated Acceptable, γ04 0.104 0.097
Rated Exemplary, γ05 0.027 0.051
Small School, γ06 0.011 0.069
Large School, γ07 -0.046 0.058
Variance SD
RANDOM EFFECTS
Institution (Intercept), u0j 0.031 0.009
Note. **p<.01, *<.05 Students=39,874, High Schools=1,399
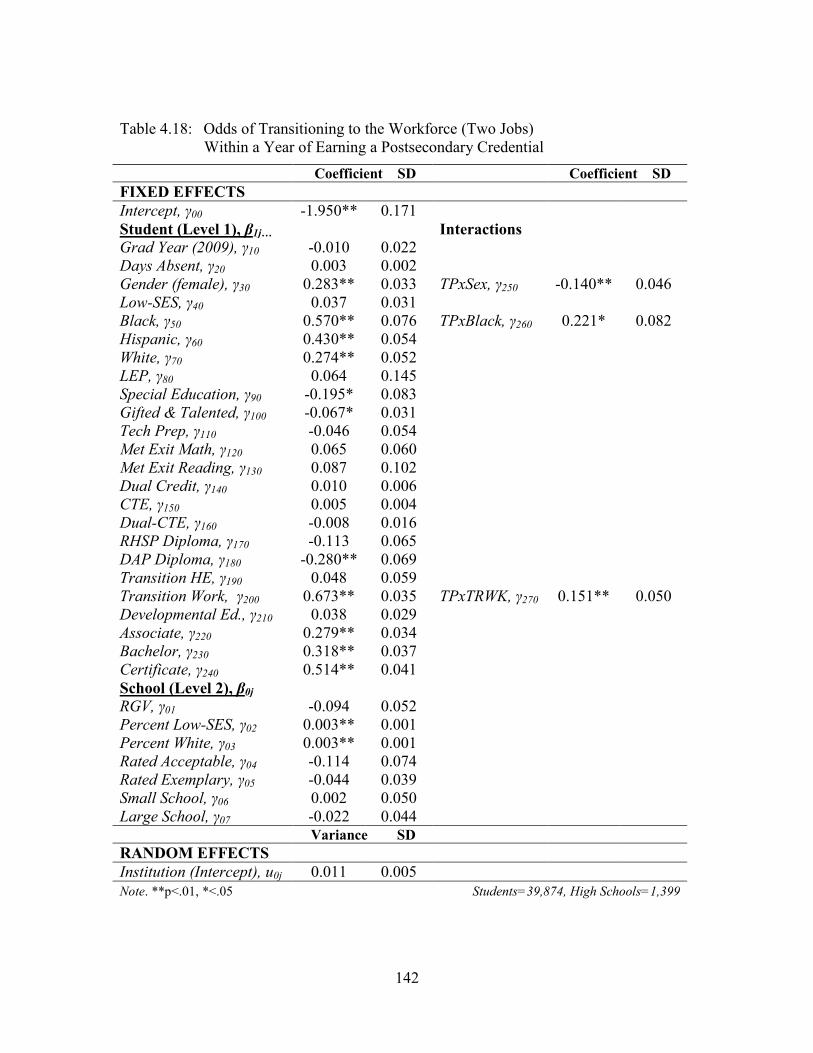
142
Table 4.18: Odds of Transitioning to the Workforce (Two Jobs)
Within a Year of Earning a Postsecondary Credential
Coefficient SD Coefficient SD
FIXED EFFECTS
Intercept, γ00 -1.950** 0.171
Student (Level 1), β1j… Interactions
Grad Year (2009), γ10 -0.010 0.022
Days Absent, γ20 0.003 0.002
Gender (female), γ30 0.283** 0.033 TPxSex, γ250 -0.140** 0.046
Low-SES, γ40 0.037 0.031
Black, γ50 0.570** 0.076 TPxBlack, γ260 0.221* 0.082
Hispanic, γ60 0.430** 0.054
White, γ70 0.274** 0.052
LEP, γ80 0.064 0.145
Special Education, γ90 -0.195* 0.083
Gifted & Talented, γ100 -0.067* 0.031
Tech Prep, γ110 -0.046 0.054
Met Exit Math, γ120 0.065 0.060
Met Exit Reading, γ130 0.087 0.102
Dual Credit, γ140 0.010 0.006
CTE, γ150 0.005 0.004
Dual-CTE, γ160 -0.008 0.016
RHSP Diploma, γ170 -0.113 0.065
DAP Diploma, γ180 -0.280** 0.069
Transition HE, γ190 0.048 0.059
Transition Work, γ200 0.673** 0.035 TPxTRWK, γ270 0.151** 0.050
Developmental Ed., γ210 0.038 0.029
Associate, γ220 0.279** 0.034
Bachelor, γ230 0.318** 0.037
Certificate, γ240 0.514** 0.041
School (Level 2), β0j
RGV, γ01 -0.094 0.052
Percent Low-SES, γ02 0.003** 0.001
Percent White, γ03 0.003** 0.001
Rated Acceptable, γ04 -0.114 0.074
Rated Exemplary, γ05 -0.044 0.039
Small School, γ06 0.002 0.050
Large School, γ07 -0.022 0.044
Variance SD
RANDOM EFFECTS
Institution (Intercept), u0j 0.011 0.005
Note. **p<.01, *<.05 Students=39,874, High Schools=1,399
143
CHAPTER FIVE: DISCUSSION
The purpose of this study is to better understand the ways in which advanced CTE
models, such as Tech Prep, may be used to foster college and career transitions. The
focus of research explores the impacts of CTE Tech Prep participation on longitudinal
outcomes related to the P-16+ pipeline. Methods consist of PSM (Propensity Score
Matching) of students to control for selection bias. PSM includes a two-step process
which first models the predicted probability of all students enrolling in Tech Prep, and
then matches Tech Prep to non-Tech Prep students using a nearest neighbor sampling
technique. PSM creates a quasi-experimental control group for comparison. Multilevel
logistic regression is then used to ascertain the odds of reaching each longitudinal
outcome. Eighteen equations are calculated, including estimates of Tech Prep
participation and models associated with five key P-16+ areas: high school transitions,
higher education enrollment, developmental remediation, postsecondary attainment, and
workforce participation.
Within analyses, student- and school-level characteristics are examined in their
relation to outcomes. Particular attention is paid to the efficacy of Tech Prep
participation. Interactions between Tech Prep and student characteristics are included to
further examine how the CTE program affects P-16+ transitions. Regional comparisons
within Texas are also incorporated into modeling. One area consortium, RGV LEAD—
known for its unique context and widespread implementation of Tech Prep, is included in
analysis at the campus-level. The within state contrast explores the impacts of a specific
implementation group compared to the outcomes of the greater Texas sample.
While the findings section above is organized by each specific P-16+ transition
point, the discussion section below focuses on significant themes across models (e.g., 18
models of overall and institution-specific outcomes). These are organized, first, into a
144
discussion of the student- and school-level characteristics which predict Tech Prep
participation. Next, the impacts of Tech Prep participation are summarized across
longitudinal outcomes. Following a breakdown of P-16+ transitions, specific Tech Prep
interactions are detailed along with other important model inputs (i.e., student- and
school-level covariates). This culminates in an examination of RGV LEAD associations.
Findings are explored and connected to CTE research, current contexts of reform and
practice, and growing education policies. They result in multiple implications for both
policymakers and practitioners.
What Influences Tech Prep Participation
The first research question of the study—what student- and school-level
characteristics influence Tech Prep participation—is examined with the full data sample
from 2009 and 2010 high school graduation cohorts (see Table 4.1). Of individual student
traits, gender is significantly related to Tech Prep. Women are slightly more likely to
participate; this is contraindicative to past research which found greater participation with
male students (Bragg et al, 2002). Hispanic students and students of low-SES
backgrounds are more likely to enroll in Tech Prep. This does follow participation rates
of other studied Tech Prep programs (Bragg et al, 2002; Brown, 2003; Stone & Aliaga,
2003). Though individual students from disadvantaged groups are more likely to
participate, greater proportions of minority or low-SES students at the campus-level
negatively affect participation. This suggests that schools serving disadvantaged
populations struggle to provide Tech Prep opportunities to their students.
Students in special populations or special programs are less likely to engage in
CTE Tech Prep. LEP, special education, and GT students all have lower odds of
participation. Negative associations indicate that the largest block of participants come
145
from students not enrolled in any sort of targeted support or enrichment programs. To this
end, Tech Prep is meeting the demand of providing opportunities for the middle
majority—students whom are neither high nor low achieving. As most of the middle
majority fails to enroll or complete postsecondary education, it is a positive indicator that
Tech Prep programs may be used to boost P-16+ attainment for these types of students
(Bragg, 2000; Cellini, 2006; Parnell, 1985). However, more recent changes to CTE
guidelines and policies press for wider enrollment by all types of students (Friedel, 2011).
These findings indicate Tech Prep in Texas is lacking inclusive CTE programming for all
its students.
Like prior studies of Tech Prep participation, students enrolled in the program are
more likely to exhibit traits of academic achievement and rigor (Cellini, 2006). Tech Prep
is associated with passing Texas State accountability exams (i.e., TAKS tests) in both
reading and mathematics. Moreover, positive associations are made between Tech Prep
and college-ready diploma plans in Texas, both RHSP and DAP. Lastly, dual credit
courses are positively connected to Tech Prep participation, increasing the predicted
probability of enrollment with each additional course taken. These findings are similar to
past studies which found CTE and Tech Prep students are generally more successful, or
at least similar, in high school achievements when compared to traditional academic
paths (Bailey & Karp, 2003; Cellini, 2006; Dare, 2006). Specifically, past studies point to
growth in math scores and higher levels of overall achievement, comparable to gains
accumulated while completing a RHSP or DAP degree (Kim, 2014; Stone & Aliaga,
2003).
Several campus-level indicators prove significant in the odds of Tech Prep
participation. An Acceptable state accountability rating has a positive impact on Tech
Prep participation compared to schools which failed to meet accountability requirements.
146
Schools rated as Exemplary, the highest accountability rating in Texas at the time of the
study, do not have significant differences. This indicates that the highest performing
schools do just as well as Acceptable campuses in supporting advanced CTE
participation. Large schools—those with enrollments over 750 students—correspond to a
greater predicted enrollment in CTE Tech Prep than others. This is perhaps due to the
greater availability of programming or resources usually found at larger schools (Lee &
Loeb, 2000; Leithwood & Jantzi, 2009). And, lastly, RGV LEAD schools have much
larger odds of Tech Prep participation when compared to Texas schools as a whole. This
suggests differences between the RGV area and the state in implementation.
In all, findings suggest Texas models of Tech Prep draw in a more diverse student
group compared to the traditional academic population. Texas Tech Prep students are
even slightly more diverse compared to past research studies (Bragg et al, 2002; Stone &
Aliaga, 2003). Results show Tech Prep as a positive tool for both middle and high
achieving campuses though low achieving campuses, and those serving high proportions
of disadvantaged students, demonstrate less success with participation. The state, like
many other implementers, has typified difficulties in including special populations of
students (Gottfried et al, 2014). However, modeling suggests Tech Prep is a promising
and viable program for P-16+ interventions.
P-16+ Transitions in Texas
The second research question explores the impacts of CTE Tech Prep
participation on longitudinal outcomes related to the P-16+ pipeline. These are calculated
using a quasi-experimental sample which has been propensity scored and matched to
decrease selection bias. The odds of each outcome occurrence are determined using
multilevel logistic regression; in all, 17 models are presented which study specific
147
impacts of student traits, academic indicators, and campus characteristics. Added to
model equations are interactions between student-level information and Tech Prep
participation. Regression models are organized into five key areas of interest: high school
transitions, higher education enrollment, developmental remediation, postsecondary
attainment, and workforce participation. Below is a brief description of significant
findings from each key area while additional sections describe Tech Prep interactions,
significant student- and school-level indicators, and the importance of RGV in P-16+
transitions.
HIGH SCHOOL TRANSITIONS
Post-high school transitions refer to the year after high school graduation and
include four models: participating in any form of higher education, attending either a
community college or university, and transitioning to the workforce. Findings are viewed
in Tables 4.2-4.5. Overall, students from disadvantaged backgrounds and low achieving
students are less likely to enter higher education, and have slightly greater odds of
working after high school. These models produce the largest amount of Tech Prep
interactions in connection with student traits.
In keeping with prior studies, Tech Prep participation results in greater odds of
enrollment in higher education for students, particularly students from disadvantaged
backgrounds (Bragg et al, 2002; Brown, 2003). Student achievement and rigor also plays
a role, especially in the transition to the university level. In all, there are differences
between postsecondary institution types as students transition from high school to higher
education. Students from disadvantaged backgrounds and lower achievement groups
(e.g., LEP, special education) are more likely to enter community colleges than
universities. These differences are often positively moderated by Tech Prep participation.
Significant interactions show Tech Prep has its best success in preparing students for
148
enrollment at two-year institutions rather than the university level. Several studies have
found that while Tech Prep is positively associated with enrollment in community
colleges, participants are somewhat less likely to enroll in four-year institutions (Bailey
& Karp, 2003; Bragg et al, 2002; Cellini, 2006). This suggests participation may divert
students directly into two-year institutions directly following high school at the expense
of university enrollment. This may be due to curriculum associated with the Tech Prep
program or better yet due to the institutionalized structures of Tech Prep itself. Programs
require partnerships between secondary and postsecondary institutions. Partnership funds,
staff, and programs may all work to push students towards the partnering community
college in order to continue a Tech Prep program or enroll for a different course of study.
Interactions with Tech Prep in this study do provide some evidence that participation
broadens opportunities and helps to increase successful transitions at all levels.
There are few impacts Tech Prep has on the decision to enter the workforce
within a year of high school graduation. Only special education and the number of CTE
courses interact with Tech Prep to increase the odds of workforce participation. Findings
provide evidence that CTE and Tech Prep participation may help prepare special
education students for career transitions (Gottfried et al, 2014; Raben et al, 2014). Other
indicators of note are the effect-coded variables; these suggest race and ethnicity have a
strong influence as to whether or not a student joins the workforce upon completing their
high school diploma.
HIGHER EDUCATION ENROLLMENT
Three models estimate the odds of enrollment in higher education up to four years
after high school graduation: overall, community college, and university attendance.
Tables 4.6-4.8 illustrate regression outputs. Many interactions between Tech Prep and
student traits impact enrollment over time; these provide for greater odds of
149
postsecondary access for Tech Prep students. Impacts are often the largest at the
community college level. In cases where students have lower odds of enrollment (e.g.,
days absent, LEP, special education), Tech Prep moderates the effect, enhancing the odds
of participation. These findings suggest that participation in Tech Prep increases
enrollment for students less likely to attend higher education due to special needs or
decreased motivation (Gottfried et al, 2014; Stone & Aliaga, 2003)
There are increases to the odds of enrolling at the university level for Tech Prep
students who participated in dual credit and CTE courses while in high school. This
suggests advanced courses, and dual coursework in particular, may improve four-year
matriculation patterns. The patterns are consistent with research that links dual credit to
positive postsecondary outcomes (Allen, 2010; An, 2013; Hoffman et al, 2009; Kleiner &
Lewis, 2009; Lerner & Brand, 2006). Dual-CTE corresponds to a negative interaction,
though. Findings suggest Texas CTE courses require more consideration, building better
connections to college and career readiness. Study interactions with dual-CTE run
counter to available research (Wonacott, 2002; Stipanovic et al, 2012). Working in the
transition year decreases odds of university enrollment over time, especially for Tech
Prep students.
DEVELOPMENTAL REMEDIATION
Developmental coursework, or DE, are split into four regression models:
participation in any form of DE, and participation in a math course, reading, and/or
writing DE course (see Tables 4.9-4.12). The majority of student traits positively impact
odds of enrollment in DE; students from disadvantaged backgrounds or those enrolled in
special programs often have the highest odds of participating in developmental
remediation.
150
Participation with Tech Prep, in past research, has been linked with greater
postsecondary preparedness (Castellano et al, 2003; Plank, DeLuca, & Estacion, 2008).
This study finds positive relationships with readiness as well. Tech Prep interacts with
indicators of achievement and rigor. While increased achievement decreases the odds of
DE, participation in Tech Prep lowers the odds of DE even further. Indicators of
achievement which Tech Prep interacts with include: dual credit, CTE, dual-CTE, and
college ready diplomas. Tech Prep is associated with greater odds of DE participation in
mathematics modeling according to dual credit, CTE courses, and DAP diplomas. This
indicates that Tech Prep students with higher achievement according to these traits may
still have deficiencies in college ready math leading to non-credit bearing courses.
Working in the transition year increases odds of developmental enrollment. Tech Prep
interacts with transition employment to decrease odds of DE participation. Overall, Tech
Prep programs have mostly positive impacts on college readiness.
POSTSECONDARY ATTAINMENT
Tables 4.13-4.16 show results for attaining a postsecondary credential including
gaining any credential, attaining an associate’s degree, earning a bachelor’s degree,
and/or obtaining a higher education certificate. These odds are calculated only for
students who enrolled in higher education. Many student traits impact attainment models
without interacting with Tech Prep. They most often have negative influences on the odds
of obtaining a higher education credential, particularly a bachelor’s degree. Students from
traditionally disadvantaged backgrounds do have somewhat greater odds of completing
an associate’s degree.
Tech Prep increases the chances of attaining a higher education credential,
especially given indicators of academic achievement and rigor. Participation in Tech Prep
interacts with gender, dual credit, CTE, and college diploma type (e.g., RHSP and DAP)
151
to stregthen the predicted probability of earning a postsecondary credential. Tech Prep
interacts with gender, special education, GT, and CTE to increase the odds of attaining an
associate’s degree. Positive interactions between Tech Prep and absences, dual credit, and
CTE are found in the bachelor’s degree model, though Tech Prep has negative impacts in
combination with diploma types. Gender, CTE, and dual-CTE all positively interact with
Tech Prep in the odds of obtaining a higher education certificate.
Past research on Tech Prep either found modest impacts in gaining semester credit
hours or no relationship between the program and postsecondary attainment (Bragg,
2006; Neumark & Joyce, 2001; Neumark & Rothstein, 2004). In this study, Tech Prep is
positively associated with a number of predictors, and participation expands the
possibility of postsecondary attainment. Specifically, Tech Prep students who transition
to higher education the year after high school have greater odds of attainment. Tech Prep
helps women to earn a degree and enhances the impacts of CTE in earning a credential at
two- and four-year institutions. Students who are involved with the program and also take
rigorous coursework in high school (e.g., dual credit courses, college ready diploma
plans, etc.) are more likely to succeed in higher education than similar students in the
control group. These findings provide evidence that Tech Prep is a viable tool for success
beyond traditional academic tracks (Bragg, 2009).
WORKFORCE PARTICIPATION
CTE participation has previously been connected to greater workforce outcomes
compared to traditional academic students in both the year after high school graduation
and seven years out (Bishop & Mane, 2004; Castellano et al, 2003). Individual traits such
as gender or degree attained also relate to long term earning capacity in connection with
CTE (Maguire, et al, 2012). This study finds similar trends in CTE Tech Prep
participation. Tables 4.17 and 4.18 describe the odds of workforce participation within a
152
year of completing a postsecondary credential. Several student traits positively impact the
odds of working after the completion of a postsecondary credential. Women have greater
odds of employment as do students from each ethnic group. Tech Prep participation is
associated with lower proportions of women and higher proportions of Black students
who take on second jobs. Achievement is, for the most part, linked to greater workforce
participation. Working within the transition year after high school leads to a greater
probability of working within the transition year after higher education—larger odds still
for Tech Prep students. Students with certificates are associated with the highest
probability of workforce participation followed by students with bachelor’s and
associate’s degrees (which share similar chances of employment). Tech Prep slightly
increases the odds of having a job after earning a bachelor’s degree.
SUMMARY OF LONGITUDINAL FINDINGS
Findings provide strong evidence for the efficacy of Tech Prep models in Texas
and beyond. Tech Prep participation increases opportunities to transition to higher
education after high school, providing stronger pathways to community college and
greater odds for traditionally disadvantaged students. When paired with increased rigor
and CTE coursework, program participation works to improve enrollment over time and
expand matriculation into four-year institutions.
Tech Prep has positive impacts on college readiness as well, decreasing the
chances of developmental remediation. Importantly, Tech Prep interacts with a number of
student traits, increasing the likelihood of postsecondary attainment at all levels. After
postsecondary graduation, Tech Prep moderates the odds of workforce participation.
Tech Prep is shown to have far reaching impacts on students long after they complete
their high school careers. Impacts vary across P-16+ transitions, institutions, and types of
153
students. Findings suggest Tech Prep is a valuable option to increase P-16+ transitions
either for targeted populations or entire campuses.
Interactions and Impacts of Tech Prep
Tech Prep was intentionally modeled using interactions across all P-16+
equations. Methods required interaction terms between Tech Prep and each student
indicator. These were first used in full models for each outcome; backwards modeling
reduced interaction terms based on significance. Analyses show final models which only
include significant interactions between Tech Prep and student-level variables. The
number and strength of these interactions vary across P-16+ transitions. Below is a
discussion of interactions which occur across multiple models and transition points.
DAYS ABSENT
The number of days a student was absent during their senior year proved to be a
significant interaction in many outcome models. All models related to the transition
between high school and higher education contain a significant interaction between days
absent and Tech Prep. For students in the control group, the odds of enrollment decrease
given additional absenteeism; odds tend to increase for students in Tech Prep. Findings
suggest Tech Prep may help draw in students who have trouble attending high school and
transition them to higher education, specifically at the community college level. The rate
of attendance is strongly related to entry into the workforce upon high school graduation.
More than 20 days absent during senior year results in a near perfect probability of
workforce entry.
Attendance is positively related to enrollment at community colleges and
negatively impacts university enrollment over time. Tech Prep participation moderates
the impact of student absences at the university level but not in meaningful ways. Tech
154
Prep significantly and positively moderates the impact of absenteeism overall, though.
Students participating in Tech Prep have greater odds of postsecondary access in
comparison to students in the control group. Students’ odds of enrolling in DE increase
with additional absences; Tech Prep decreases chances of developmental reading
participation. The number of days a student was absent during their senior year is
negatively associated with completing any postsecondary degree or certificate. Tech Prep
modifies the negative impacts of absenteeism to increase the chances of earning a
bachelor’s degree.
While prior research suggests CTE participation may lead to fewer absences
while in high school, few studies are able to connect absenteeism and Tech Prep with
postsecondary outcomes (Bishop & Mane, 2004). It is theorized that more advanced
coursework, such as those found in Tech Prep, may increase the motivations of slacking
seniors or those traditionally uninterested in college (Cellini, 2006; Fowler & Luna, 2009;
Kim & Bragg, 2008). Positive interactions between absenteeism and Tech Prep lend
credence to those theories.
GENDER
A small amount of research posits that women gain both psychosocial and
achievement benefits from CTE participation; few studies show actual gains (Aragon et
al, 2013). Women in this study show greater odds of enrollment, both in transition years
and over time. Tech Prep increases those odds at each P-16+ point. Participation in Tech
Prep results in a 10% advantage for women above those in the control group. In all
models, save postsecondary certificates, women have greater odds of attainment.
Interactions with Tech Prep advantage women further, leading to an even greater
likelihood of completing a higher education credential. Tech Prep modifies the negative
relationship with earning a certificate, creating a positive probability of attainment.
155
Gender is positively associated with the odds of transitioning to the workforce within a
year of earning a postsecondary credential; women who participated in Tech Prep are
also less likely to work a second position than their control group peers.
Tech Prep provides a consistent boost to women in all P-16+ transitions.
Interactions and main effects included, gender is one of the highest predictors of success.
These findings may be somewhat, though not altogether, specific to Texas. Conger
(2015) argues that female students have an advantage in university enrollment and
attainment. He found that Top 10% admission policies have contributed to increases in
admission given women tend to have higher grades (thus higher class rankings) in high
school. Conger found women, and specifically Black women, to have the greatest
advantage in postsecondary outcomes as a result of admissions policies.
RACE AND ETHNICITY
In several models, race and ethnicity interact with Tech Prep to modify the odds
of reaching a P-16+ transition outcome. In most instances, however, ethnicity
significantly relates to outcomes on its own. Findings suggest advanced CTE, such as
Tech Prep, may help traditionally disadvantaged minority groups bridge gaps in college
and career readiness (Kao & Thompson, 2003; Lumina Foundation, 2015). In the
transition to higher education, Tech Prep students have greater odds of participation than
their control group peers—Black Tech Prep students have greater predicted probabilities
than Black students in the control group; Hispanic students in Tech Prep have greater
odds of enrollment than their peers; White students in Tech Prep outperform White
students in the control group. In this model, White students in the control group,
nevertheless, have greater odds of enrollment than Hispanic students, even those involved
in Tech Prep. And, Black students overall, and in Tech Prep, have the highest odds of
enrollment. The relationship between Black students and Tech Prep is positive in the
156
enrollment model over time. It produces negative impacts for students in Tech Prep for
other ethnicities, though. Hispanic and White Tech Prep students are slightly less likely
to enroll over time when compared to similar students in the control group.
Overall, Black students have the greatest odds of transitioning to higher education
and enrolling over time. Importantly, Black students also have the highest predicted
probabilities of enrolling at the university level. Black students have greater odds of DE
participation and somewhat lower chances of earning a postsecondary credential. These
findings correspond to existing literature on the effects of race compared to
postsecondary outcomes; research has shown Black students comparably more likely to
attend four-year institutions (Engberg & Wolniaak, 2010).
Hispanic students have differing chances in P-16+ outcomes. Hispanic ethnicity is
negatively related to both transitional and overall postsecondary enrollment. Hispanic
students have the lowest probabilities of enrollment compared to all other groups, even in
models where Tech Prep positively influences participation. For those who do enroll,
Hispanic students are more likely to take DE courses and less likely to gain a higher
education credential. Hispanic students have slightly higher odds of attaining an
associate’s degree.
Disparities between ethnic groups display existing and persistent gaps in college
access and persistence (Ross et al, 2012). Findings show Tech Prep has limited impact on
decreasing these gaps. In particular, participation has only small successes in promoting
postsecondary education to Hispanic students. These gaps are more profound given the
current and future ethnic makeup of Texas which hosts sizeable proportions of Hispanic
students.
157
SPECIAL POPULATIONS
Special populations and programs include students from a wide spectrum of
special requirements; these include high performing students and high need students.
Included in this study are LEP, special education, and GT programs. LEP and special
education students are found to have lower odds of enrollment and greater odds of
developmental need. Tech Prep interacts with both program types to moderate the
negative impact. LEP students in Tech Prep have slightly higher probabilities of
postsecondary enrollment. Tech Prep special education students have positive
probabilities of enrollment compared to negative odds for similar students in the control
group.
For transition and total enrollment models, students in GT programs have a
greater propensity for postsecondary participation if they are also Tech Prep. Of import,
the odds are much higher at the university level suggesting differences in the type of
institution chosen by these students. Gifted students are slightly less likely to participate
in the workforce after high school graduation. GT students also have very low odds of
taking DE courses. GT students are more likely to complete a bachelor’s degree and less
likely to complete an associate’s or certification credential. Tech Prep interacts with GT
in the associate’s degree model to modify the negative odds toward an equal probability
of attainment.
These results, taken together, suggest the largest block of Tech Prep participants
come from students not enrolled in any targeted support or enrichment program. They
constitute the middle range of students, or the middle majority. Most evidence from study
outcomes support the original goals of Tech Prep which were to increase postsecondary
access and attainment to students—neither high nor low achievers—in community
college settings (Bragg, 2000; Cellini, 2006; Parnell, 1985). There is additional evidence
158
that Tech Prep works to increase attainment for a wider selection of students, especially
LEP and special education students accessing community college programs. High
spectrum students, such as GT participants, have benefits across P-16+ transitions as
well.
DUAL CREDIT COURSES
Recent reports from several states detail positive impacts of dual enrollment on
student participation in higher education (Hoffman, Vargos, & Santos, 2009; Karp &
Jeong, 2008; Kim & Bragg, 2008). In two studies of Texas students, completion of dual
credit coursework had consistent, strong, and positive relationships with postsecondary
enrollment, persistence, and attainment (Giani, Alexander, & Reyes, 2014; Struhl and
Vargas, 2012). Findings from this study align with past research. Dual credit is associated
with greater enrollment, lower developmental remediation, and higher postsecondary
attainment. Interactions with Tech Prep produce substantially greater odds of success in
P-16+ transitions.
Interactions between dual credit courses and Tech Prep are present in both
transitional and total postsecondary enrollment over time. The number of dual credit
courses a student took in high school positively impacts enrollment and interacts with
Tech Prep for even greater odds. At the community college level, dual enrollment
corresponds to minimally higher odds of transitional enrollment (and lower odds of
enrollment over time) indicating dual credit courses are best preparing students to
transition to the university level.
The number of dual credit courses a student takes decreases the chances of
developmental remediation. Students with average dual coursework have low odds of DE
participation. This interacts with Tech Prep participation to produce increasingly lower
odds with each additional dual credit course. Dual credit is positively linked to earning a
159
higher education credential overall as well as earning either an associate’s or bachelor’s
degree. Dual credit interacts with Tech Prep to produce superior chances of attainment.
For the certification model, dual credit is negatively associated with completion. In all,
Tech Prep expands the already documented potential of dual credit to promote
postsecondary access and attainment (Giani et al, 2014; Hoffman et al, 2009).
CTE AND DUAL-CTE COURSES
The number of CTE courses students took during high school has varying impacts
on enrollment, especially when including Tech Prep membership in the equation. In both
models of transition and of postsecondary enrollment over time, CTE is significant. But,
additional courses over the mean do not result in substantially larger predicted
probabilities compared to those who took less CTE. At the community college level, CTE
interacts with Tech Prep to provide for greater odds of transitional enrollment. At the
university level, models are similar between transition and enrollment over time. Tech
Prep moderates a slightly negative association between CTE and university participation,
increasing the odds of enrollment.
The number of dual-CTE courses impacts enrollment differently at community
college and university levels. Dual-CTE is positively linked to community college
enrollment though negatively relates to university enrollment. Odds of university
enrollment further decrease with Tech Prep participation.
Taken with the differing impacts of CTE and dual-CTE, findings suggest these
types of courses push students mainly towards workforce and community college
transitions rather than the university level. Several studies have found that while Tech
Prep is positively associated with enrollment in community colleges, participants are less
likely to enroll in four-year institutions (Bailey & Karp, 2003; Bragg et al, 2002; Cellini,
2006). This may suggest that participation may divert students directly into two-year
160
institutions directly following high school at the expense of university enrollment. CTE
interactions with Tech Prep provide some evidence that advanced CTE programs increase
successful transitions to community colleges and also broaden opportunities at all levels.
Tech Prep students are less likely to participate in developmental remediation
than the control group based on average CTE/dual-CTE coursework. Additional CTE
courses increase the odds of DE for control students, but decreases the odds of DE for
Tech Prep students. In mathematics models, though, Tech Prep increases the odds of
developmental participation. Findings suggest that Tech Prep programs have mostly
positive impacts on college readiness, with students taking rigorous and dual-CTE
courses having less overall need for DE participation.
The number of CTE courses taken is negatively associated with attainment in the
bachelor’s degree model, and positively associated with attainment in the certification
and associate’s degree models. Tech Prep positively interacts with CTE in all models.
Regardless of the impact to students in the control group, students in Tech Prep have a
proportionally greater likelihood of completing a credential across all models. The odds
of attainment increase with additional CTE courses. Dual-CTE courses produce
somewhat smaller odds of completion for most models. In the certification model, dual-
CTE is associated with large odds of completion and interacts with Tech Prep to increase
probabilities further. This finding may be an artifact of the Tech Prep program itself as
many models include dual-CTE courses and postsecondary certification upon completion
as part of their program structure (Friedel, 2011).
CTE is positively related to post-high school transitional workforce entry and
interacts with Tech Prep to provide increased chances of working. The average number
of CTE courses is positively associated with employment after completing a
161
postsecondary credential as well, though the predicted probability of employment does
not appreciably increase with additional courses.
Attainment results, taken in context with the prior models in the study, are
important. Models of enrollment suggest, while able to increase participation at some
levels, CTE has limited success in promoting access at the university level. Models of
completion suggest that Tech Prep participation is far reaching as it promotes higher odds
of attainment at all levels—including universities—for CTE students who do transition to
higher education. These findings follow trends in prior research which suggest both CTE
and advanced CTE class models have the capacity to increase enrollment and attainment
in postsecondary education (Wonacott, 2002; Stipanovic et al, 2012; Zinth, 2014).
Findings demonstrate that Tech Prep models which include high numbers of CTE courses
in high school are the largest benefit to students as they transition to higher education,
and—notably—as they complete a postsecondary credential.
Other Significant Influences
STUDENT TRAITS
Many student traits interact with Tech Prep across various P-16+ transition points
and differing models. Some variables only impact the outcome though, or have very
limited interactions with Tech Prep. Descriptions of these covariates are described below.
Graduates from the 2009 cohort have greater odds of transitional enrollment as well as
enrollment over time, in both community college and university settings. 2009 high
school graduates are also more likely to take developmental education courses. There are
no differences between cohorts in postsecondary attainment.
Students from low-SES backgrounds are less likely to enroll in higher education
the year after high school as well as over time. Low-SES students are more likely to need
162
developmental remediation. Socioeconomic status is negatively associated with gaining a
higher education credential.
Students identified as LEP, though less likely to enroll and more likely to need
developmental remediation, have greater odds of completing a postsecondary credential.
These findings suggest that while LEP students struggle to gain access to higher
education, they are having success in attaining postsecondary credentials once enrolled.
Special education students also have limited access to higher education and increased
developmental need. Unlike LEP students, however, special education students have
lower odds of completing a credential. Both LEP and special education students have
decreased odds of workforce participation in transition years and after completing a
postsecondary credential. Low-SES, LEP, and special education all have minimal
interactions with Tech Prep. These results mirror past research which indicate advanced
CTE programs may not be sufficient to motivate students from poverty, or students with
special needs, toward higher education (Frempong, Xin, & Mensah, 2011; Gottfried et
al, 2014; Long, Conger, & Iatarola, 2012).
Passing state accountability exams—TAKS—relates to greater enrollment during
high school transitions and over time, though some tests negatively impact the odds of
enrollment at the community college level. Those meeting both reading and math TAKS
requirements are less likely to need DE remediation and more likely to earn a higher
education degree.
College ready high school degrees (e.g., RHSP and DAP diplomas) predict
greater odds of enrollment in higher education. Findings suggest DAP recipients have
strong preferences towards universities in transitional years and in enrollment over time.
College ready diplomas are negatively associated with developmental need. RHSP and
DAP recipients have greater odds of earning a postsecondary degree but RHSP is linked
163
to lower odds of earning a certificate. In all workforce models, college ready diplomas
are associated with lower probabilities of having a job. Findings suggest the intensity of
curriculum and rigor in high school, as shown by TAKS and diploma plans, connect with
top levels of attainment. The highest intensity programs increase the odds of attainment at
the highest postsecondary levels. This comes at the expense of enrollment in lower
institutions and more basic credentials (Adelman, 2006; America Diploma Project
[ADP], 2007; Mishook et al, 2012).
CAMPUS CHARACTERISTICS
A number of school-level indicators are included in modeling. These help control
for the type of school an individual attends. They also inform upon the meaningful
campus characteristics which impact longitudinal outcomes. Prior modeling of Texas
data on postsecondary outcomes suggests there is little decay in the effects of high school
characteristics over time (Black, Lincove, Cullinane, & Veron, 2015). In other words,
persons carry both what they learn in school and the contexts of that school with them
into the future.
The proportion of low-SES and minority students on a campus negatively impacts
the chances of enrollment during the transition year between high school and higher
education. A similar relationship exists for both socioeconomic and minority rates in
enrollment over time, but it creates negligibly lower odds. As the proportion of poor
students rise, so does the likelihood of a student from that campus enrolling in DE.
Minority trends differ. As the proportion of minority students increases at a campus, it
slightly decreases the chances of developmental participation. The proportion of low-SES
students at a campus is negatively associated with postsecondary completion, creating
slightly smaller odds of gaining a credential. The percent of low-SES and minority
students at a campus is positively associated with post-postsecondary employment. Prior
164
studies of campus indicators have found mixed results similar to findings in this study.
This suggests the impacts associated with the campus population makeup are often
complex and vary according to the time period of postsecondary enrollment and the
institutional level in question (Black et al; Engberg & Wolniak, 2010; Frempong et al,
2011; Long et al, 2012).
An Exemplary performance rating in the Texas State accountability system is
negatively associated with community college enrollment and transitional workforce
participation; it is positively associated with university enrollment in the transitional year
and over time. This suggests Exemplary schools are best at transitioning students to
universities after high school graduation. The highest rated schools are also less likely to
have students participate in developmental participation. Exemplary rated schools are
associated with somewhat larger odds of completing a bachelor’s degree and have lower
odds of completing a certificate. Exemplary findings indicate these types of campuses
have particular success with the university level when compared to those campuses
labeled Acceptable, or Unacceptable, in the state accountability system. Findings are
similar to a study of postsecondary attainment in response to accountability pressures in
Texas. Researchers found positive associations between accountability ratings and
attainment, specifically in gaining a bachelor’s degree (Deming et al, 2016).
School size has been previously associated with differences in achievement,
availability of curriculum, and differing levels of program participation by its students
(Egalite & Kisida, 2016; Leithwood & Jantzi, 2009). There is a great deal of discussion
as to what size a school should be, but large schools are usually defined as those with
more than 750 students and small schools are those with less than 100 students per grade
(Lee & Loeb, 2000; Vander Ark, 2002). Large schools—750 students and above—
positively impact enrollment at any postsecondary institution. Small schools (i.e., those
165
with under 400 students) struggle to enroll students in higher education during transitions
and over time, especially at the university level. Large schools are associated with
slightly higher odds of completing a postsecondary degree, specifically a bachelor’s
degree; students from large schools are also less likely to earn a certificate. Theories as to
large campuses’ achievement include a greater variety in curriculum and programs
available at large schools as well the likelihood of available resources (e.g., money for
programs, proximity to higher education, etc.) found in more developed (i.e., larger) areas
(Leithwood & Jantzi, 2009).
Importance of RGV LEAD
The current study evaluates impacts of Tech Prep programming across Texas and
one regional consortium, RGV LEAD (Rio Grande Valley Linking Economic &
Academic Development)—and area known for its unique context and widespread
implementation of Tech Prep. All models include RGV LEAD as part of campus-level
predictors. The indicator compares the RGV area schools to the rest of Texas high
schools and students. This comparison helps assess the progress of the RGV LEAD
consortium in implementation—bringing together high school and higher education
partners to provide CTE content to students in Tech Prep programs. As the goal of RGV
LEAD, and Tech Prep, is the expansion of college and career readiness, this study tracks
outcomes related to multiple transitions along the P-16+ pipeline.
RGV LEAD AREA
The RGV, or Valley, is a four-county area located along the southernmost tip of
Texas (see Figure 1.1).13 While the largest city, Brownsville, has almost 200,000 citizens,
13 RGV is not actually a valley. It is a delta and floodplain area of the Rio Grande River. Early developers
of the RGV thought the term “valley” was a more positive descriptor for attracting potential settlers (Rio
Grande Valley Texas [RGVT], 2016).
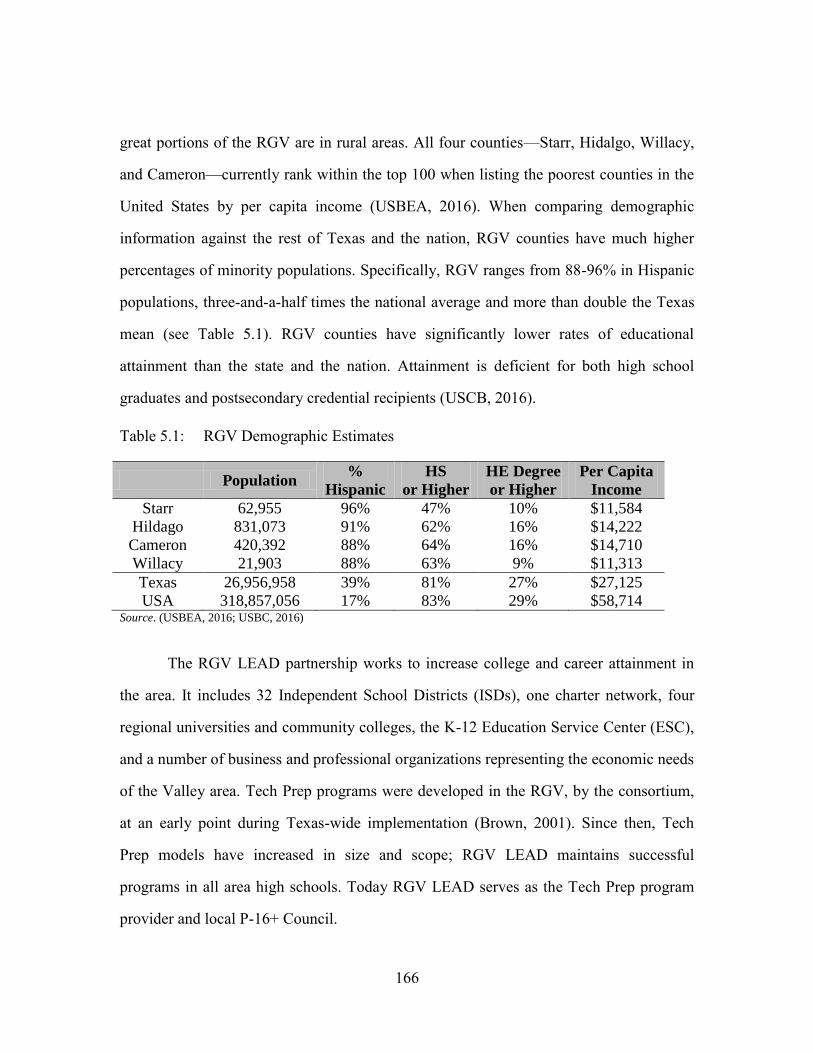
166
great portions of the RGV are in rural areas. All four counties—Starr, Hidalgo, Willacy,
and Cameron—currently rank within the top 100 when listing the poorest counties in the
United States by per capita income (USBEA, 2016). When comparing demographic
information against the rest of Texas and the nation, RGV counties have much higher
percentages of minority populations. Specifically, RGV ranges from 88-96% in Hispanic
populations, three-and-a-half times the national average and more than double the Texas
mean (see Table 5.1). RGV counties have significantly lower rates of educational
attainment than the state and the nation. Attainment is deficient for both high school
graduates and postsecondary credential recipients (USCB, 2016).
Table 5.1: RGV Demographic Estimates
Population %
Hispanic
HS
or Higher
HE Degree
or Higher
Per Capita
Income
Starr 62,955 96% 47% 10% $11,584
Hildago 831,073 91% 62% 16% $14,222
Cameron 420,392 88% 64% 16% $14,710
Willacy 21,903 88% 63% 9% $11,313
Texas 26,956,958 39% 81% 27% $27,125
USA 318,857,056 17% 83% 29% $58,714 Source. (USBEA, 2016; USBC, 2016)
The RGV LEAD partnership works to increase college and career attainment in
the area. It includes 32 Independent School Districts (ISDs), one charter network, four
regional universities and community colleges, the K-12 Education Service Center (ESC),
and a number of business and professional organizations representing the economic needs
of the Valley area. Tech Prep programs were developed in the RGV, by the consortium,
at an early point during Texas-wide implementation (Brown, 2001). Since then, Tech
Prep models have increased in size and scope; RGV LEAD maintains successful
programs in all area high schools. Today RGV LEAD serves as the Tech Prep program
provider and local P-16+ Council.
167
The RGV area and RGV LEAD consortium are particularly important to the
study. Its location and makeup provide a microcosm to some of the most pressing
demographic issues facing educational attainment and postsecondary transitions. The
RGV hosts a large percentage of minority students, high amounts of poverty, traditionally
low percentages of educational attainment, and is geographically located in areas less
likely to have access to postsecondary pathways or workforce opportunities (Lumina,
2015; Ross et al, 2012; USCB, 2016). Outcomes learned from such an area would be of
significant interest to national models of intervention as well as other state and local
reform interventions (Allen, 2012).
RGV DIFFERENCES IN MODELING
Findings from all multilevel logistic regressions show RGV LEAD areas vary
significantly from the rest of Texas. This suggests differences in implementation,
especially when controlling for the types of schools and types of students within the RGV
area. Quantitative results fit with prior qualitative reviews of Texas implementation
which indicate variability across Texas consortia (Brown, 2001; Waller & Waller, 2004).
It also holds with the larger research surveys which find variations between
implementation consortia and models (D’Amico et al, 2015; Hershey et al, 1998).
First, RGV area students are more likely to participate in Tech Prep. Students
from the RGV LEAD consortium have 8.62 greater odds of enrollment compared to
students from other Texas areas.14 This is a huge advantage in the probability of
participation, holding all else constant. RGV LEAD is the single largest predictor of Tech
Prep participation in a model with many significant covariates.
14 As a note, the modeling of Tech Prep participation is the only model using the whole sample of students
rather than the PSM sample.
168
When looking at transitions within a year of high school graduation, students
from RGV LEAD areas have greater odds of enrollment in all higher education models.
These findings indicate RGV is successful in transitioning students to all levels of
postsecondary institutions—community colleges and universities. When modeling
postsecondary enrollment over time, RGV LEAD is significantly related to all models.
Students from RGV area high schools, overall and at the university level, are more likely
attend higher education. At the community college level, RGV students are slightly less
likely to enroll over time. These findings suggest that the RGV consortium is doing its
strongest work at pushing students towards four-year institutions.
RGV is not significantly related to DE participation overall and corresponds to a
lower predicted probability of math DE participation. This indicates students from RGV
LEAD areas are just as prepared as students from in and around Texas—if not better
prepared in math—to take credit-bearing courses upon entry to higher education.
RGV negatively impacts the odds of completing a postsecondary credential.
When breaking down models into the type of credential, RGV LEAD is negatively
associated with the odds of earning an associate’s degree but has a slightly positive
relationship with the odds of earning a bachelor’s degree. These findings are somewhat
frustrating given that prior models in the study suggest RGV is linked to higher
enrollment. The positive associations between enrollment paired with negative
connections with attainment replicate prior studies. These show a limited impact of
individual Tech Prep programs/models on higher education completion (Neumark &
Joyce, 2011). Overall, modeling shows RGV has further work to accomplish getting
students both enrolled and through higher education to a postsecondary credential.
RGV LEAD students are associated with lower odds of workforce participation
upon high school graduation. In a similar manner, students from the RGV consortium
169
area have lower odds of employment after completing a postsecondary credential. These
findings suggest there are limitations to employment for RGV students in multiple P-16+
transition points. This may be symptomatic of the geographic RGV location. The area
traditionally has fewer employment resources, both for recent high school graduates and
college graduates returning to areas close to home (USCB, 2016). In addition, there may
be unique revenue streams in the area, such as employment opportunities across the
border in Mexico. These would not be included in the data and would skew workforce
participation and wages.
Strengths to date include the transitions of students to higher education within a
year of completing high school, indicators of college readiness shown by decreased need
for developmental education, and increased pathways for students into the university
pipeline. Qualitative review of Texas Tech Prep implementation reports that more active
consortia believe themselves to have greater gains in student outcomes (Brown, 2001).
RGV LEAD self identifies as a very active Tech Prep consortium and P-16+ Council.
They prove positive gains in this study according to multiple longitudinal outcomes.
TECH PREP AND RGV LEAD AFFILIATIONS
Table 5.2 illustrates the odds of obtaining each P-16+ outcome according to two
of the important factors explored in this study. The table calculates the predicted
probabilities of RGV and Tech Prep students (and combinations of the two variables) for
all P-16+ transition points. These probabilities are estimated from the overall models for
each key area. Predicted probabilities are based on RGV and Tech Prep covariates along
with the intercept, holding all other variables in the model constant—at zero.15 While
15 These estimates hold all scaled ratio variables to their average value (mean centered at zero) and hold
nominal variables to their zero classification (e.g., gender=0=male); they also include the intercept in the
calculation of the probability to create a unit-specific result, holding constant the school (and school-level
factors).
170
these numbers may seem low, it is important to keep in mind that only 68% of the PSM
sample enrolled in a postsecondary institution over time while—fewer—60% entered
higher education within a year of high school graduation. Only 17% of the sample
completed a postsecondary credential overall. Findings suggest that, at each P-16+
transition point, both Tech Prep and RGV play an important role in advancing the
possibility of success. Students involved in Tech Prep, in particular, have greater odds of
transitional enrollment into higher education; RGV LEAD affiliation strengthens the odds
of enrollment for both Tech Prep and control group students. These trends are also
present in models of postsecondary enrollment over time. When viewing transitional
workforce participation, Tech Prep alone is associated with the greatest predicted
probability of a job. RGV affiliation corresponds to lower odds of workforce
participation and negatively impacts Tech Prep students.
In Table 5.2, RGV Tech Prep students are associated with the lowest predicted
probability of developmental remediation. Both indicators decrease the odds of DE
participation. Tech Prep is associated with the highest odds of postsecondary attainment.
While RGV LEAD affiliation does not decrease these odds for Tech Prep students, the
odds of attainment for non-Tech Prep students in RGV areas is lower than for similar
students across Texas. Lastly, both Tech Prep and RGV LEAD are negatively associated
with workforce participation after the completion of a postsecondary credential.
To provide a better illustration of the estimated impacts, an example using
additional indicators is provided. A Tech Prep student from the RGV area with the
following indicators has a 92% predicted probability of earning a postsecondary
credential: female, Hispanic, met both math and reading TAKS, DAP diploma, one
course above average for dual credit and CTE courses, and from an Acceptable rated
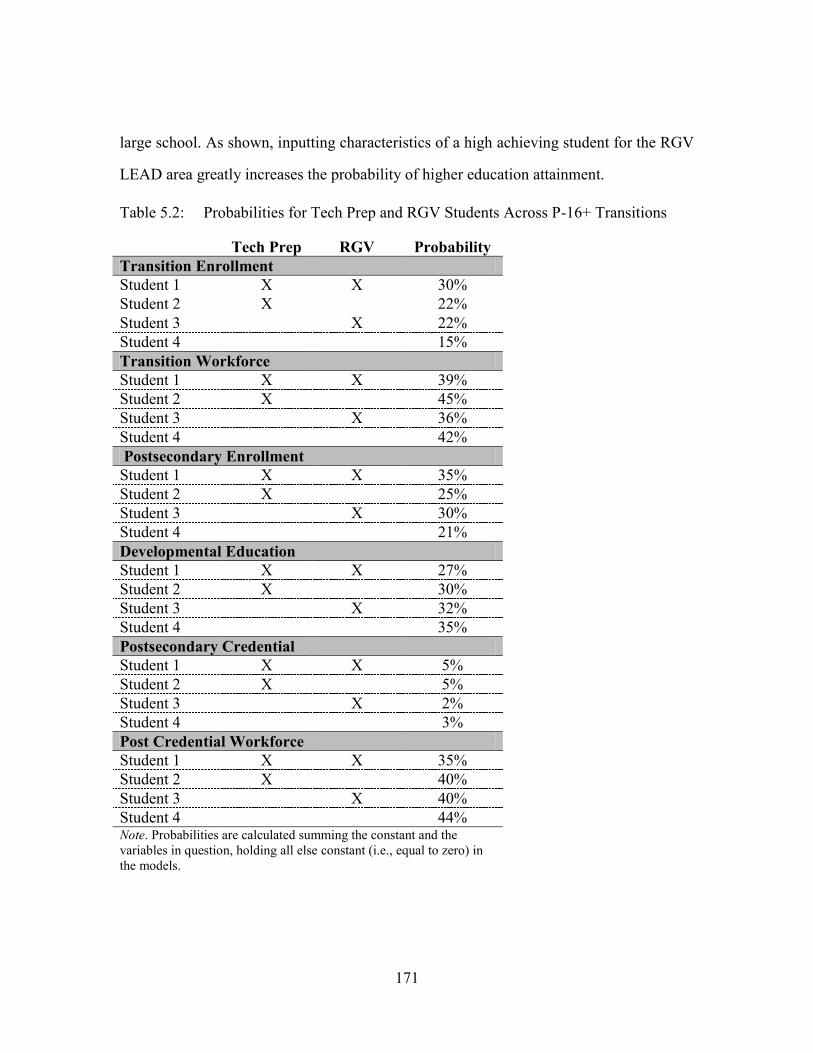
171
large school. As shown, inputting characteristics of a high achieving student for the RGV
LEAD area greatly increases the probability of higher education attainment.
Table 5.2: Probabilities for Tech Prep and RGV Students Across P-16+ Transitions
Tech Prep RGV Probability
Transition Enrollment
Student 1 X X 30%
Student 2 X 22%
Student 3 X 22%
Student 4 15%
Transition Workforce
Student 1 X X 39%
Student 2 X 45%
Student 3 X 36%
Student 4 42%
Postsecondary Enrollment
Student 1 X X 35%
Student 2 X 25%
Student 3 X 30%
Student 4 21%
Developmental Education
Student 1 X X 27%
Student 2 X 30%
Student 3 X 32%
Student 4 35%
Postsecondary Credential
Student 1 X X 5%
Student 2 X 5%
Student 3 X 2%
Student 4 3%
Post Credential Workforce
Student 1 X X 35%
Student 2 X 40%
Student 3 X 40%
Student 4 44% Note. Probabilities are calculated summing the constant and the
variables in question, holding all else constant (i.e., equal to zero) in
the models.
172
The positive outcomes associated with RGV LEAD alone suggest success in
increasing college and career opportunities, especially for students traditionally less
likely to have access to postsecondary or workforce pathways (Lumina Foundation, 2015;
Ross et al, 2012; USCB, 2016). The significant impacts of RGV LEAD, paired with Tech
Prep probabilities, indicate that the RGV LEAD implementation models are successful in
bridging transitions in the P-16+ pipeline. Geared towards underserved populations, RGV
LEAD Tech Prep helps transition students from high school to higher education and
beyond (Moran et al, 2009; Olivia, 2008).
Implications for the Future
BETTER INFORMED RESEARCH
Tech Prep works towards preparing students for the jobs of tomorrow in the
classrooms of today. Programming is aimed at reducing persistent gaps in educational
attainment through increasing transition pathways to higher education. The need to assess
the efficacy of these interventions is vital to understanding their use and potential in the
wider framework of educational reform. Research to date has been limited and many in
the field are aware of the lack of rigorous efforts connecting programs to student
outcomes (Rojewski et al, 2012).
The current study helps better inform past research and examine the impacts of
such models in preparing students for college and career outcomes. Given the specific
coding used in Texas data, this study is able to correctly identify students involved in
CTE Tech Prep. Explicit definitions provided in data are superior to past studies which
have relied on self identification or complicated coding definitions (Aliaga et al, 2014;
Bragg et al 2002; Hershey et al, 1998; Stipanovic et al, 2012). As such, it provides a more
reliable estimate for Tech Prep comparisons.
173
In addition, the study includes the use of quasi-experimental matching methods to
decrease selection bias; these create comparison groups which control for student and
school characteristics (Bozick & Dalton, 2012; Lewis & Overman, 2008; Rojewski &
Xing, 2013). Modeling in the study goes beyond simplistic methods found in many
practitioner evaluations of programs (Fritz et al, 2012; Gemici & Rojewski, 2007;
Rojewski et al, 2012). It utilizes hierarchical methods to best identify impacts of Tech
Prep, accounting for students nested within schools (Cohen et al, 2003; Nimon, 2012).
Multilevel models are able to control for the school a student attended when identifying
results, and also provide meaningful context based on estimates of campus
characteristics.
Findings from the current study add to research by replicating and extending
associations between Tech Prep and P-16+ outcomes. They find positive associations
between participation and postsecondary enrollment (Bailey & Karp, 2003; Bragg et al,
2002; Cellini, 2006). Tech Prep participation increases opportunities to transition to
higher education after high school, providing stronger pathways to community college
and greater odds for traditionally disadvantaged students. When paired with increased
rigor and CTE coursework, Tech Prep participation works to improve enrollment over
time and expands matriculation into four-year institutions. Models show varied but
favorable relationships between Tech Prep and postsecondary attainment, differing from
previous research (Neumark & Joyce, 2011). Findings also suggest there is
implementation variability in the state as RGV LEAD areas are linked, specifically, to
greater odds of enrollment (Brown, 2001; Waller & Waller, 2004). These results display
great complexity across longitudinal outcomes. They create a host of possibilities for
using Tech Prep as either a targeted or comprehensive P-16+ reform.
174
Future Exploration
Further study should follow students through even longer time points to assess
postsecondary outcomes at six year intervals, and identify enrollment in graduate studies
as part of post-postsecondary measures. Also, more detailed analysis of workforce
participation is yet to be completed. These should investigate salary differentials
according to participation. One piece of Tech Prep which was not measured in the study
is the completion of a Tech Prep program (only Tech Prep participation was included in
the current study). Additional research should combine high school and higher education
data to identify the characteristics which impact Tech Prep program completion, resulting
in a higher education credential.
The current study provides strong evidence that Tech Prep participation has
meaningful impacts on P-16+ transitions. Future research into the Texas Tech Prep
program, and similar advanced CTE models such as POS (Programs of Study), will
advance research and practice even more.
CHALLENGES FOR PRACTITIONERS
Information from this study works to inform future implementation efforts for
Tech Prep but also wider reform contexts. Findings may be linked to the focus of P-16+
alignment and articulation, college and career readiness standards, and support for
educational attainment in underserved students. These connections are vital to current
reforms in CTE which hope to expand Tech Prep models to a more diverse selection of
industries and students through similar CTE POS models.
Research suggests CTE courses and programs have—and are still—working to
integrate core academic standards alongside technical training (Stipanovic et al, 2012).
Reforms focus on incorporating academic rigor and vertical alignment between
secondary and postsecondary curriculum (Brown, 2001; Schneider, 2008). There have
175
been improvements within Tech Prep implementation. Curriculum content and standards
are becoming more applied, but it is a gradual process (Bragg, 2000; Bragg & Reger,
2002; Hershey et al, 1998). Findings from this study suggest positive impacts of CTE
Tech Prep but also persistent limitations and gaps in the program, specifically in
promoting widespread readiness at university levels and perseverance to degree
attainment. There is need for additional alignment and deeper, qualitative review of Tech
Prep in Texas to better understand what components may best work to foster success.
Importance of Context
Within the effort to implement enhanced CTE and Tech Prep, understanding the
context of reform is important. It allows for better crafted local policy and informed
practitioners—those able to understand what will work in their specific circumstances.
The Valley area and RGV LEAD consortium are included in this study to help better
understand some of the contextual implications of reform. RGV LEAD is a well
developed example of regional consortia created under federal Perkins legislation and
other state policies. As such it is an ideal region to view the impacts of Tech Prep through
student participation. More importantly, the geographic area of the RGV provides a
unique context to study educational reform for disadvantaged students.
Findings suggest that Tech Prep is a viable P-16+ model, especially in the RGV
area and particularly for its underserved population of students. This study only tells part
of the story though. Models suggest that RGV LEAD implementation of Tech Prep
differs from the state as a whole and results in significantly greater odds of completing
various P-16+ transitions. While models control for individual characteristics and
campus-level differences, these findings do not indicate why RGV LEAD is associated
with greater participation in Tech Prep or higher levels of postsecondary enrollment.
176
To better understand RGV LEAD impacts and implementation, a breakdown of
the P-16+ partnership and specific Tech Prep components should be explored. Barriers
and challenges should be compared to achievements in implementing Tech Prep over
time. Within the study, other comprehensive and targeted reform initiatives must be
connected to implementation to provide a full picture of the college ready improvements
in the area. Bright areas—those schools or districts with high levels of success in Tech
Prep—should be highlighted to find best practices. This type of qualitative review would
provide a more complete picture of implementation paired with the present quantitative
findings. In addition, a study of implementation would provide a roadmap for others
looking to create or modify their own Tech Prep programs.
POLICY PRESSURES AND REFORM
Requirements of existing accountability standards for academic achievement have
put pressures on schools to improve in all areas, including technical education (Anderson,
2008; Chadd & Drage, 2006). Perkins IV legislation took steps towards requiring
accountability practices by imposing performance indicators for CTE Tech Prep, many of
which educators thought would be too burdensome given data restrictions between K-12
and higher education (Friedel, 2011; Klein et al, 2014). Since then, CTE programs have
expanded in size and scope. CTE is often combined as part of comprehensive school
reforms. Advanced CTE courses are now linked to initiatives such as school choice and
curriculum standards redesign (Asunda et al, 2015; Castellano et al, 2003; Ramsey,
1995). Further expansion and focus in CTE areas will only increase calls for
accountability and changes to both federal and state policy contexts (Hernandez, 2014;
Maguire et al, 2012).
The need for accurate information on the long-term impacts of CTE and Tech
Prep participation is greater than ever. Accountability practices have been reshaped under
177
the ESSA (Every Student Succeeds Act) reauthorization of ESEA (Elementary and
Secondary Education Act). Upcoming CTE legislation coupled with recently changed
accountability standards will force practitioners and policymakers to gather more
information on current and potential programs that may impact student success.
Federal Legislation
Future changes to both federal and state/local CTE policies are imminent. Federal
legislators have finally taken up the reauthorization of Perkins legislation (Klein, 2015;
Boyd et al, 2015). Hearings on Perkins reauthorization started soon after the passage of
ESSA, and in September 2016 the House voted to pass a reauthorization of the
legislation. Entitled the Strengthening Career and Technical Education for the 21st
Century Act, this bill has bipartisan support and passed 405-5. The proposed legislation
provides states and local education agencies (i.e., school districts) greater freedom in
CTE goals and accountability. It allows for flexibility in spending and focuses federal
dollars based on the number of students taking CTE (Ujifusa, 2016). This differs from
past versions of Perkins which proportioned monies based on CTE programs and courses
(Friedel, 2011).
A Republican-backed Senate version of Perkins reauthorization contains language
which has currently stalled passage of the legislation. It requires the Department of
Education (DOE) to cede most of its control over federal CTE dollars and reduces most,
if not all, accountability measures. Hearings on the bill have been cancelled in the Senate.
Though unlikely, the earliest reauthorization may occur is in the lame duck session
between the 2017 election and inauguration (Stratford, 2016; Ujifusa, 2016).
The two largest points of contention which as are yet to be determined in Perkins
reauthorization are the level of accountability which CTE courses and programs will face,
and the number of CTE courses which will define a student as CTE for funding purposes.
178
Former Perkins legislation—those which first outlined Tech Prep programming—
required accountability in the form of tracking longitudinal outcomes. This has proved
difficult given existing data capacities in education (Friedel, 2011; Klein et al, 2014). The
argument for future legislation is whether to fold CTE into existing accountability
measures, much like current state accountability standards. Or, to provide for greater
flexibility and less accountability, as the ESEA reauthorization to ESSA has brought
about less accountability and oversight at the federal level (Stratford, 2016).
It is likely funding in Perkins reauthorization legislation will not be specific to
programs, but rather allotted to states and districts according to student participation. The
number of courses which define a student as a CTE participator or CTE concentrator
(e.g., enrolled in an advanced CTE program like Tech Prep) have not been finalized.
Grouping requirements, the numbers of courses needed to reach a specific level of CTE,
and occupational/career markers all vary between programs and states (Aliaga eta al,
2014; Cox et al, 2015; Meer, 2007; Stone & Aliaga, 2005). That considered, an average
student today completes 3.6 CTE credits during their high school career (Aliaga et al,
2014). This study found the average number of CTE courses for all students at 5.26 and
5.98 for the PSM sample. This suggests Texas has greater than average enrollment,
perhaps supporting positive impacts found in the study as well as enhanced future
funding possibilities.
However the new Perkins legislation is codified, the current study helps to inform
policy as it describes longitudinal impacts of Tech Prep participation across a wide and
diverse state. It is a model for additional POS which include CTE and credit based
curriculum in an effort to improve P-16+ transitions. Further, it allows for greater
planning for the future distributions of funds across models and students in relation to
CTE and advanced CTE participation.
179
State Legislation
Federal policy contexts are not the only area in which this study may inform
changes in CTE policy. The state of Texas has increased CTE participation through
reforms in its graduation plans, or diplomas. Passed in 2013 (and implemented for
incoming freshman in the 2014-2015 school year), House Bill 5 reshaped its RHSP and
DAP graduation plans into the Foundation High School Program (FHSP). This new
diploma plan involves basic courses, has possible advanced features, and requires
students to select an endorsement program (Education Service Center 20 [ESC20], 2016).
Endorsements include core and elective courses which result in the selection of a career
cluster. These new graduating requirements have pushed CTE to the forefront of reform
as all students are required take a greater number of CTE courses in fulfillment of their
career cluster. Further, it has increased opportunities to expand Tech Prep programs and
similar CTE POS, which fulfill endorsement requirements while also providing dual
enrollment opportunities.
Findings from this study are particularly important as they show Tech Prep as a
promising tool to bridge gaps in P-16+ transitions while also fulfilling new diploma
requirements. Interactions between Tech Prep and previous iterations of college ready
degrees (e.g., RHSP, DAP) impact student outcomes in several models. These outcomes,
as well as other findings, inform new graduation policies. Results from the study can be
used to plan and implement FHSP diploma programs while also increasing college
readiness in other areas linked to CTE and Tech Prep.
THE FUTURE OF REFORM
The jobs, careers, and industries of tomorrow are upon us today. Attainment has
already fallen behind economic development, though. An incomplete education will not
provide students with the skills needed in current or future economies (Carnevale et al,
180
2010; Castellano et al, 2003). To fill gaps, reforms must bridge transitions between high
school, higher education, and the workforce.
The growth of CTE and advanced CTE (i.e., Tech Prep), which utilize career-
based curriculums paired with credit based transitions, are a promising tool to meet
academic and labor demands. These strategies offer an additional pathway to higher
education beyond the traditional route of academic/college preparation. They have the
potential to engender success in a wider selection of students, those students who often
fail to enroll and succeed in traditional pathways (Dare, 2006; Parnell, 1985).
This study adds to the greater discussion on P-16+ transition models by providing
valuable information as to the long-term impacts of CTE programs. Results are numerous
and provide strong evidence for the efficacy of Tech Prep models in the RGV, Texas, and
beyond.
This study allows policymakers and practitioners alike to search out best practices
using the detailed impact models and interactions studied. These may lead to
comprehensive reforms and/or targeted Tech Prep models to reach certain students.
Findings inform on the utility of Tech Prep programs as well as illustrate the possibilities
of using longitudinal data to explore effects of educational models on student outcomes.
Additionally, the exploration of outcomes for students participating in advanced CTE
across a large state with a diverse student population provides helpful insight into the
proficiencies and challenges faced by all states and local levels. Longitudinal outcomes
and measures may help shape greater CTE policy reform as well as accountability
policies or performance indicators across the broader educational spectrum. The analytic
strategies used in this study work together to yield a rich set of findings which strengthen
the connections between advanced CTE participation and student success.
181
REFERENCE MATERIALS
Appendix A: Texas Education Code
SUBCHAPTER T. TECH-PREP EDUCATION
TITLE 3. HIGHER EDUCATION
SUBTITLE B. STATE COORDINATION OF HIGHER EDUCATION
CHAPTER 61. TEXAS HIGHER EDUCATION COORDINATING BOARD
Sec. 61.851. DEFINITIONS. In this subchapter:
(1) "Articulation agreement" means a written commitment between the participants in a
tech-prep consortium to a program designed to provide students with a nonduplicative
sequence of progressive achievement leading to degrees or certificates in a tech-prep
education program.
(2) "Junior college" means an institution of higher education that awards associate
degrees as provided by Chapter 130.
(3) "Tech-prep consortium" means a regional collaboration of school districts,
institutions of higher education, businesses, labor organizations, and other participants to
work together to effectively implement a regional tech-prep program.
(4) "Technical college" means a campus of the Texas State Technical College System
established under Chapter 135.
Added by Acts 1999, 76th Leg., ch. 1422, Sec. 2, eff. Sept. 1, 1999.
Sec. 61.852. TECH-PREP PROGRAM. (a) A tech-prep program is a program of study
that:
(1) combines at least two years of secondary education with at least two years of
postsecondary education in a nonduplicative, sequential course of study based on the
foundation high school program adopted by the State Board of Education under Section
28.025;
(2) integrates academic instruction and vocational and technical instruction;
(3) uses work-based and worksite learning where available and appropriate;
(4) provides technical preparation in a career field such as engineering technology,
applied science, a mechanical, industrial, or practical art or trade, agriculture, health
occupations, business, or applied economics;
(5) builds student competence in mathematics, science, reading, writing,
communications, economics, and workplace skills through applied, contextual academics
and integrated instruction in a coherent sequence of courses;
(6) leads to an associate degree, two-year postsecondary certificate, or postsecondary
two-year apprenticeship with provisions, to the extent applicable, for students to continue
toward completion of a baccalaureate degree; and
182
(7) leads to placement in appropriate employment or to further education.
(b) Notwithstanding Subsection (a)(1), a tech-prep consortium is encouraged to include
four years of secondary education in a tech-prep program.
Added by Acts 1999, 76th Leg., ch. 1422, Sec. 2, eff. Sept. 1, 1999.
Amended by:
Acts 2013, 83rd Leg., R.S., Ch. 211 (H.B. 5), Sec. 71(a), eff. June 10, 2013.
Sec. 61.853. REGIONAL TECH-PREP CONSORTIA: GOVERNING BOARD;
DIRECTOR; FISCAL AGENT. (a) Each regional tech-prep consortium is governed by
a governing board composed of private sector and public sector leaders in the ratio agreed
to by the participants in the consortium. A consortium at local option may consolidate
governing board members and staff with an eligible local entity to achieve administrative
efficiencies and operational coordination. The combined entity shall maintain a proper
separation of funds and comply with all applicable legal requirements involving the use
of separate funds.
(b) The governing board shall determine the policies of the tech-prep consortium in
accordance with the consortium's written bylaws. The bylaws must specify the major
relationships, decision-making and operational processes, and other significant policies of
the consortium, including the procedures for filling vacancies on the governing board.
(c) According to the terms of a written agreement between a governing board and the
fiscal agent, a consortium director shall be selected.
(d) The governing board shall select a community college, junior college, technical
college, university, regional education service center, independent school district, or other
eligible entity to act as the tech-prep consortium's fiscal agent and to provide human
resource and business office services for the consortium. The fiscal agent serves under
the terms of a written agreement between the governing board and the fiscal agent.
(e) An entity established after January 1, 2005, may not be a tech-prep consortium for
purposes of this subchapter unless the entity is established or otherwise formed after that
date as a result of an action taken under Subsection (f)(1) or (2).
(f) In accordance with rules adopted by the board, if a tech-prep consortium fails to meet
standards established under Section 61.858, that consortium:
(1) may be consolidated with an existing consortium to serve the regions formerly served
by both consortia; or
(2) may be abolished and a new consortium may be established to serve the region
formerly served by the abolished consortium and to meet the goals of the abolished
consortium's tech-prep program.
(g) In adopting rules for purposes of Subsection (f), the board shall specifically describe:
(1) the type of failure to meet standards that may result in an action being taken under
Subsection (f)(1) or (2), including whether an action may result only from a severe or
repeated deviation from a standard or from the failure to meet one or more particular
standards; and
(2) which action authorized under Subsection (f) may be taken for each type of failure to
meet standards.
Added by Acts 1999, 76th Leg., ch. 1422, Sec. 2, eff. Sept. 1, 1999.
183
Amended by:
Acts 2005, 79th Leg., Ch. 441 (S.B. 1809), Sec. 1, eff. September 1, 2005.
Sec. 61.854. TECH-PREP CONSORTIUM ALLOTMENT. (a) In each fiscal year, the
board, as the agent of the Texas Education Agency, shall allot the federal tech-prep
implementation money this state receives to the regional tech-prep consortia for regional
administration according to regionally developed plans designed to meet federal, state,
and regional goals. The board shall allot the money to tech-prep consortia in accordance
with a formula adopted by the board, after a public hearing and in consultation with
interested state entities and local consortia, that addresses the differing needs of the
consortia due to urban or rural populations, special populations, number of tech-prep
programs and students, and other factors determined by the board.
(b) An eligible tech-prep consortium that desires assistance under this section must
submit an application to the board on a form prescribed by the board for that purpose.
The form must address the formula adopted by the board under Subsection (a).
(c) If a tech-prep consortium has a completed application on file under Subsection (b),
the board shall make a payment in the amount of the consortium's allotment under
Subsection (a) to the consortium's fiscal agent.
Added by Acts 1999, 76th Leg., ch. 1422, Sec. 2, eff. Sept. 1, 1999.
Sec. 61.855. GRANTS FOR TECH-PREP EDUCATION. (a) From amounts made
available under Section 61.854, the board, in accordance with this subchapter and with a
formula adopted by the board, shall award grants to tech-prep consortia for tech-prep
programs described by Subsection (d).
(b) To be eligible for a grant, a tech-prep consortium must be composed of:
(1) a local educational agency, intermediate educational agency, area vocational and
technical education school serving secondary school students, or a secondary school
funded by the Bureau of Indian Affairs; and
(2) one of the following institutions of higher education:
(A) a nonprofit institution of higher education that offers:
(i) a two-year associate degree program or a two-year certificate program and that is
qualified as a junior college or technical college to award associate degrees under
Chapter 130 or 135, including an institution receiving assistance under the Tribally
Controlled Community College Assistance Act of 1978 (25 U.S.C. Section 1801 et seq.)
and its subsequent amendments as a tribally controlled postsecondary vocational or
technical institution; or
(ii) a two-year apprenticeship program that follows secondary instruction, if the
nonprofit institution of higher education is not prohibited from receiving assistance under
Part B, Title IV, of the Higher Education Act of 1965 (20 U.S.C. Section 1071 et seq.)
and its subsequent amendments as provided by Section 435(a) of that Act (20 U.S.C.
Section 1085(a)) and its subsequent amendments; or
(B) a proprietary institution of higher education that offers a two-year associate degree
program and that:
184
(i) is qualified as an institution of higher education under Section 102 of the Higher
Education Act of 1965 (20 U.S.C. Section 1002) and its subsequent amendments; and
(ii) is not subject to a default management agreement plan required by the United States
secretary of education.
(c) In addition to entities described by Subsection (b), a tech-prep consortium may
include:
(1) an institution of higher education that awards a baccalaureate degree; and
(2) employers or labor organizations.
(d) A tech-prep program must:
(1) be implemented under an articulation agreement between the participants in the
consortium;
(2) consist of two to four years of secondary school preceding graduation and:
(A) two or more years of higher education; or
(B) two or more years of apprenticeship following secondary instruction;
(3) have a common core of required proficiency based on the foundation high school
program adopted by the State Board of Education under Section 28.025, with
proficiencies in mathematics, science, reading, writing, communications, and
technologies designed to lead to an associate's degree or postsecondary certificate in a
specific career field;
(4) include the development of tech-prep program curricula for both secondary and
postsecondary participants in the consortium that:
(A) meets academic standards developed by the state;
(B) links secondary schools and two-year postsecondary institutions, and, if practicable,
four-year institutions of higher education through nonduplicative sequences of courses in
career fields, including the investigation of opportunities for tech-prep students to enroll
concurrently in secondary and postsecondary course work;
(C) uses, if appropriate and available, work-based or worksite learning in conjunction
with business and all aspects of an industry; and
(D) uses educational technology and distance learning, as appropriate, to involve each
consortium participant more fully in the development and operation of programs;
(5) include in-service training for teachers that:
(A) is designed to train vocational and technical teachers to effectively implement tech-
prep programs;
(B) provides for joint training for teachers in the tech-prep consortium;
(C) is designed to ensure that teachers and administrators stay current with the needs,
expectations, and methods of business and of all aspects of an industry;
(D) focuses on training postsecondary education faculty in the use of contextual and
applied curricula and instruction; and
(E) provides training in the use and application of technology;
(6) include training programs for school counselors designed to enable school counselors
to more effectively:
(A) provide information to students regarding tech-prep programs;
(B) support student progress in completing tech-prep programs;
(C) provide information on related employment opportunities;

185
(D) ensure that tech-prep students are placed in appropriate employment; and
(E) stay current with the needs, expectations, and methods of business and of all aspects
of an industry;
(7) provide equal access to the full range of tech-prep programs for individuals who are
members of special populations, including by the development of tech-prep program
services appropriate to the needs of special populations; and
(8) provide for preparatory services that assist participants in tech-prep programs.
(e) A tech-prep consortium that receives a grant under this section must use the money
awarded to develop and operate a tech-prep program described in Subsection (d).
(f) A tech-prep program may:
(1) provide for the acquisition of tech-prep program equipment;
(2) acquire technical assistance from state or local entities that have designed,
established, and operated tech-prep programs that have effectively used educational
technology and distance learning to deliver curricula and services and to develop an
articulation agreement; and
(3) establish articulation agreements with institutions of higher education, labor
organizations, or businesses located in or out of the region served by the tech-prep
consortium, especially with regard to using distance learning and educational technology
to provide for the delivery of services and programs.
Added by Acts 1999, 76th Leg., ch. 1422, Sec. 2, eff. Sept. 1, 1999.
Amended by:
Acts 2013, 83rd Leg., R.S., Ch. 211 (H.B. 5), Sec. 72(a), eff. June 10, 2013.
Acts 2013, 83rd Leg., R.S., Ch. 443 (S.B. 715), Sec. 39, eff. June 14, 2013.
Sec. 61.856. GRANT APPLICATION. (a) Each regional tech-prep consortium that
desires to obtain a grant under this subchapter must submit an application to the board at
the time and in the manner the board prescribes.
(b) An application under this section must:
(1) contain a five-year plan for the development and implementation of tech-prep
programs;
(2) show that the application has been approved by the tech-prep consortium's governing
board; and
(3) show that the entity selected as the consortium's fiscal agent has agreed to serve in
that capacity.
(c) The board shall approve the application if the application meets the requirements of
this section and Section 61.854(b).
(d) The board shall give special consideration to an application for a tech-prep program
that:
(1) provides for effective employment placement activities for students or for the transfer
of students to baccalaureate degree programs;
(2) is developed in consultation with business, industry, institutions of higher education,
and labor organizations;
(3) effectively addresses the issues of school dropout prevention, returning to school
after dropping out, and the needs of special populations;

186
(4) provides education and training in areas or skills in which there are significant
workforce shortages, including the information technology industry; and
(5) demonstrates how tech-prep programs may help students achieve high academic and
employability competencies.
(e) In awarding grants under this subchapter, the board shall ensure an equitable
distribution of assistance between urban and regional consortium participants.
Added by Acts 1999, 76th Leg., ch. 1422, Sec. 2, eff. Sept. 1, 1999.
Sec. 61.857. REPORT; REVIEW OF FIVE-YEAR PLAN. (a) Each regional tech-prep
consortium that receives a grant under this subchapter shall annually prepare and submit
to the board a written report on the effectiveness of the tech-prep programs for which the
consortium received assistance. The report must include a description of the manner in
which the consortium awarded any subgrants in the region served by the consortium.
(b) After the second year of the five-year plan required under Section 61.856(b)(1), the
consortium shall review the plan and make any changes necessary.
Added by Acts 1999, 76th Leg., ch. 1422, Sec. 2, eff. Sept. 1, 1999.
Sec. 61.858. TECH-PREP CONSORTIUM EVALUATION. (a) The board shall
develop and implement a statewide system to evaluate each tech-prep consortium. The
evaluation must include:
(1) an assessment of the consortium's performance during the past year in comparison to
the goals and objectives stated in the five-year plan contained in the consortium's grant
application to the board under Section 61.856;
(2) an identification of any concerns the board has regarding the consortium's
performance; and
(3) recommendations for improvement by the consortium in the next year.
(b) The board shall evaluate each tech-prep consortium annually. At least once every
four years, or more frequently as provided by board rule, the annual evaluation shall be
conducted on-site.
(c) Not later than November 1 of each year, the board shall provide a written report to
each tech-prep consortium with the results of the evaluation. The report must:
(1) contain the findings, concerns, and recommendations resulting from the evaluation
required under Subsections (a) and (b);
(2) communicate to the consortium the results of the board's evaluation, specifically
including the elements required by Subsection (a);
(3) identify areas in which the consortium has made improvement or should take steps to
improve its performance; and
(4) identify best practices of tech-prep consortia.
Added by Acts 2005, 79th Leg., Ch. 441 (S.B. 1809), Sec. 2, eff. September 1, 2005.
Amended by:
Acts 2011, 82nd Leg., R.S., Ch. 446 (S.B. 1410), Sec. 2, eff. September 1, 2011.
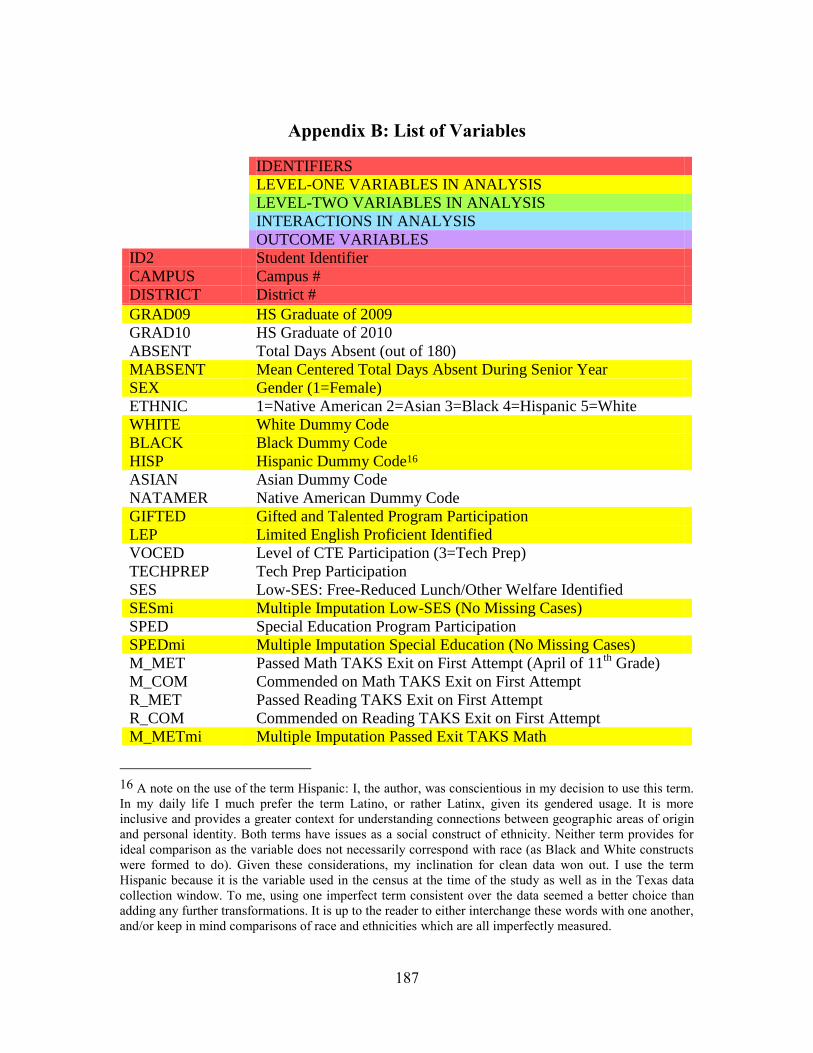
187
Appendix B: List of Variables
IDENTIFIERS
LEVEL-ONE VARIABLES IN ANALYSIS
LEVEL-TWO VARIABLES IN ANALYSIS
INTERACTIONS IN ANALYSIS
OUTCOME VARIABLES
ID2 Student Identifier
CAMPUS Campus #
DISTRICT District #
GRAD09 HS Graduate of 2009
GRAD10 HS Graduate of 2010
ABSENT Total Days Absent (out of 180)
MABSENT Mean Centered Total Days Absent During Senior Year
SEX Gender (1=Female)
ETHNIC 1=Native American 2=Asian 3=Black 4=Hispanic 5=White
WHITE White Dummy Code
BLACK Black Dummy Code
HISP Hispanic Dummy Code16
ASIAN Asian Dummy Code
NATAMER Native American Dummy Code
GIFTED Gifted and Talented Program Participation
LEP Limited English Proficient Identified
VOCED Level of CTE Participation (3=Tech Prep)
TECHPREP Tech Prep Participation
SES Low-SES: Free-Reduced Lunch/Other Welfare Identified
SESmi Multiple Imputation Low-SES (No Missing Cases)
SPED Special Education Program Participation
SPEDmi Multiple Imputation Special Education (No Missing Cases)
M_MET Passed Math TAKS Exit on First Attempt (April of 11th
Grade)
M_COM Commended on Math TAKS Exit on First Attempt
R_MET Passed Reading TAKS Exit on First Attempt
R_COM Commended on Reading TAKS Exit on First Attempt
M_METmi Multiple Imputation Passed Exit TAKS Math
16 A note on the use of the term Hispanic: I, the author, was conscientious in my decision to use this term.
In my daily life I much prefer the term Latino, or rather Latinx, given its gendered usage. It is more
inclusive and provides a greater context for understanding connections between geographic areas of origin
and personal identity. Both terms have issues as a social construct of ethnicity. Neither term provides for
ideal comparison as the variable does not necessarily correspond with race (as Black and White constructs
were formed to do). Given these considerations, my inclination for clean data won out. I use the term
Hispanic because it is the variable used in the census at the time of the study as well as in the Texas data
collection window. To me, using one imperfect term consistent over the data seemed a better choice than
adding any further transformations. It is up to the reader to either interchange these words with one another,
and/or keep in mind comparisons of race and ethnicities which are all imperfectly measured.
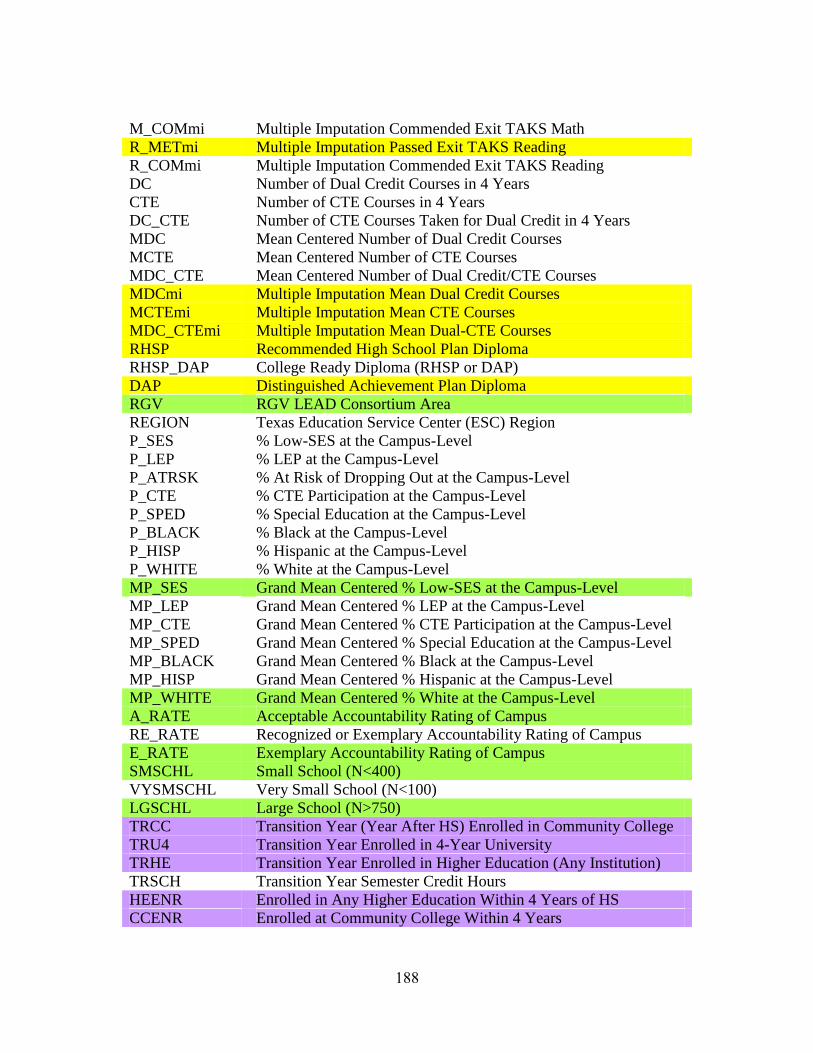
188
M_COMmi Multiple Imputation Commended Exit TAKS Math
R_METmi Multiple Imputation Passed Exit TAKS Reading
R_COMmi Multiple Imputation Commended Exit TAKS Reading
DC Number of Dual Credit Courses in 4 Years
CTE Number of CTE Courses in 4 Years
DC_CTE Number of CTE Courses Taken for Dual Credit in 4 Years
MDC Mean Centered Number of Dual Credit Courses
MCTE Mean Centered Number of CTE Courses
MDC_CTE Mean Centered Number of Dual Credit/CTE Courses
MDCmi Multiple Imputation Mean Dual Credit Courses
MCTEmi Multiple Imputation Mean CTE Courses
MDC_CTEmi Multiple Imputation Mean Dual-CTE Courses
RHSP Recommended High School Plan Diploma
RHSP_DAP College Ready Diploma (RHSP or DAP)
DAP Distinguished Achievement Plan Diploma
RGV RGV LEAD Consortium Area
REGION Texas Education Service Center (ESC) Region
P_SES % Low-SES at the Campus-Level
P_LEP % LEP at the Campus-Level
P_ATRSK % At Risk of Dropping Out at the Campus-Level
P_CTE % CTE Participation at the Campus-Level
P_SPED % Special Education at the Campus-Level
P_BLACK % Black at the Campus-Level
P_HISP % Hispanic at the Campus-Level
P_WHITE % White at the Campus-Level
MP_SES Grand Mean Centered % Low-SES at the Campus-Level
MP_LEP Grand Mean Centered % LEP at the Campus-Level
MP_CTE Grand Mean Centered % CTE Participation at the Campus-Level
MP_SPED Grand Mean Centered % Special Education at the Campus-Level
MP_BLACK Grand Mean Centered % Black at the Campus-Level
MP_HISP Grand Mean Centered % Hispanic at the Campus-Level
MP_WHITE Grand Mean Centered % White at the Campus-Level
A_RATE Acceptable Accountability Rating of Campus
RE_RATE Recognized or Exemplary Accountability Rating of Campus
E_RATE Exemplary Accountability Rating of Campus
SMSCHL Small School (N<400)
VYSMSCHL Very Small School (N<100)
LGSCHL Large School (N>750)
TRCC Transition Year (Year After HS) Enrolled in Community College
TRU4 Transition Year Enrolled in 4-Year University
TRHE Transition Year Enrolled in Higher Education (Any Institution)
TRSCH Transition Year Semester Credit Hours
HEENR Enrolled in Any Higher Education Within 4 Years of HS
CCENR Enrolled at Community College Within 4 Years
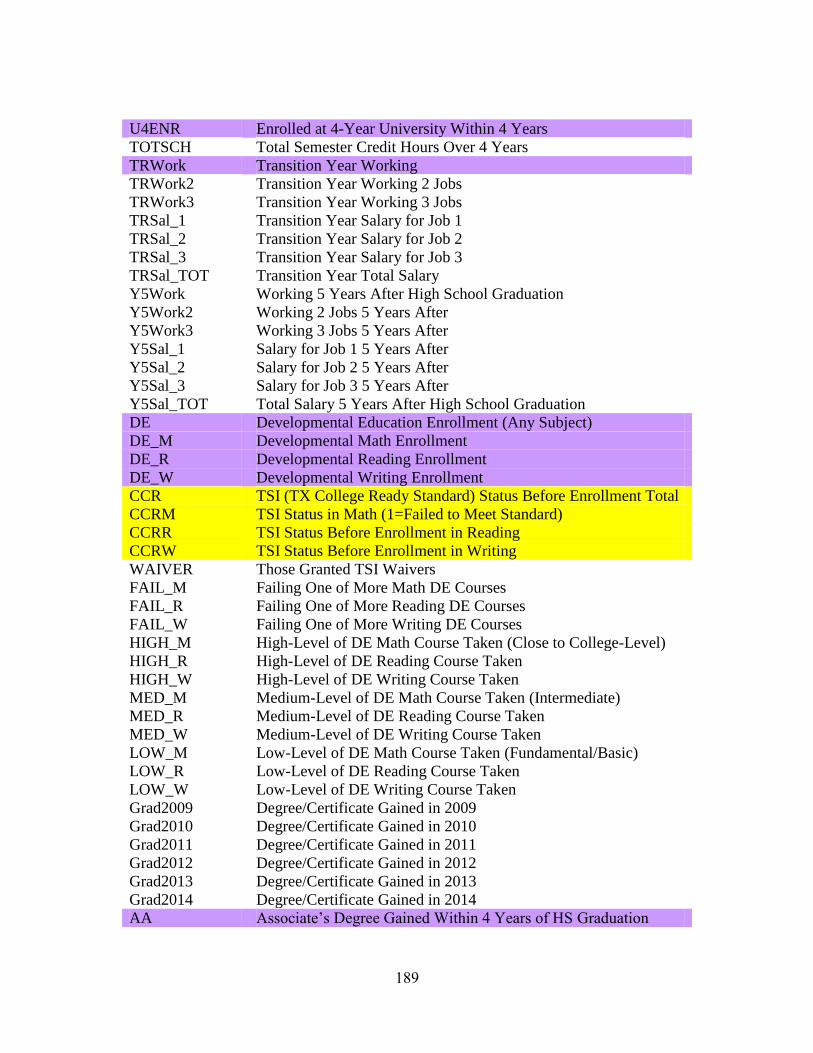
189
U4ENR Enrolled at 4-Year University Within 4 Years
TOTSCH Total Semester Credit Hours Over 4 Years
TRWork Transition Year Working
TRWork2 Transition Year Working 2 Jobs
TRWork3 Transition Year Working 3 Jobs
TRSal_1 Transition Year Salary for Job 1
TRSal_2 Transition Year Salary for Job 2
TRSal_3 Transition Year Salary for Job 3
TRSal_TOT Transition Year Total Salary
Y5Work Working 5 Years After High School Graduation
Y5Work2 Working 2 Jobs 5 Years After
Y5Work3 Working 3 Jobs 5 Years After
Y5Sal_1 Salary for Job 1 5 Years After
Y5Sal_2 Salary for Job 2 5 Years After
Y5Sal_3 Salary for Job 3 5 Years After
Y5Sal_TOT Total Salary 5 Years After High School Graduation
DE Developmental Education Enrollment (Any Subject)
DE_M Developmental Math Enrollment
DE_R Developmental Reading Enrollment
DE_W Developmental Writing Enrollment
CCR TSI (TX College Ready Standard) Status Before Enrollment Total
CCRM TSI Status in Math (1=Failed to Meet Standard)
CCRR TSI Status Before Enrollment in Reading
CCRW TSI Status Before Enrollment in Writing
WAIVER Those Granted TSI Waivers
FAIL_M Failing One of More Math DE Courses
FAIL_R Failing One of More Reading DE Courses
FAIL_W Failing One of More Writing DE Courses
HIGH_M High-Level of DE Math Course Taken (Close to College-Level)
HIGH_R High-Level of DE Reading Course Taken
HIGH_W High-Level of DE Writing Course Taken
MED_M Medium-Level of DE Math Course Taken (Intermediate)
MED_R Medium-Level of DE Reading Course Taken
MED_W Medium-Level of DE Writing Course Taken
LOW_M Low-Level of DE Math Course Taken (Fundamental/Basic)
LOW_R Low-Level of DE Reading Course Taken
LOW_W Low-Level of DE Writing Course Taken
Grad2009 Degree/Certificate Gained in 2009
Grad2010 Degree/Certificate Gained in 2010
Grad2011 Degree/Certificate Gained in 2011
Grad2012 Degree/Certificate Gained in 2012
Grad2013 Degree/Certificate Gained in 2013
Grad2014 Degree/Certificate Gained in 2014
AA Associate’s Degree Gained Within 4 Years of HS Graduation
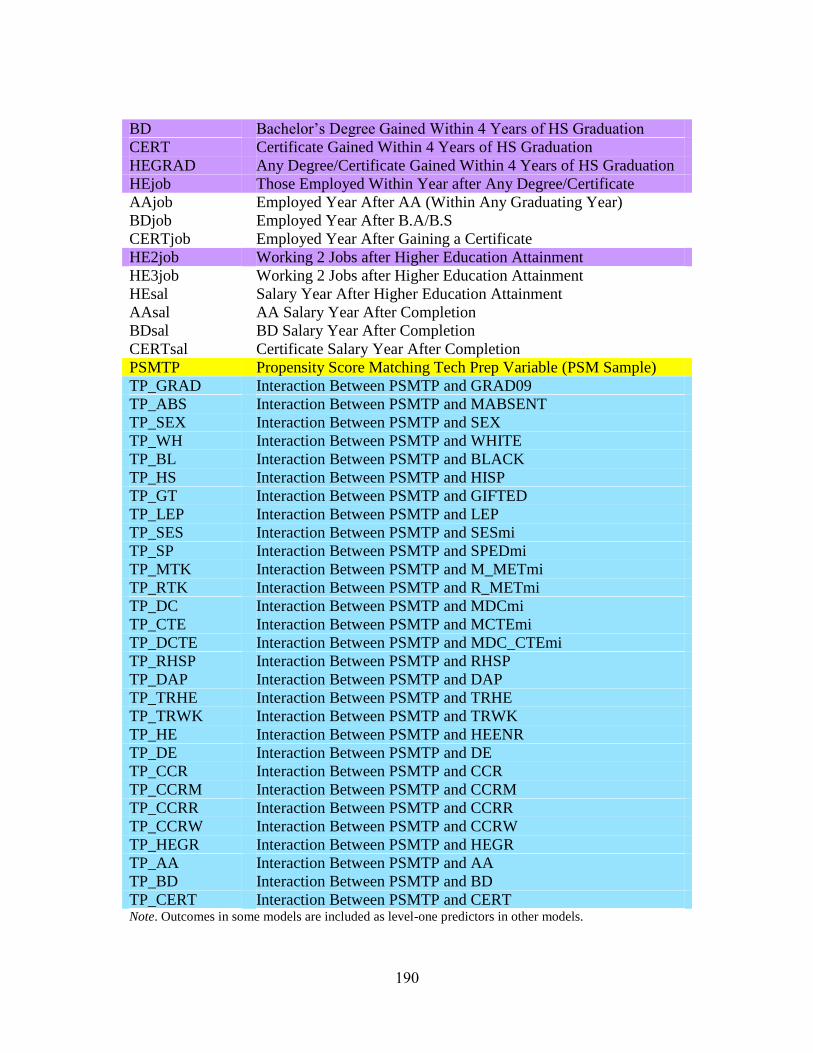
190
BD Bachelor’s Degree Gained Within 4 Years of HS Graduation
CERT Certificate Gained Within 4 Years of HS Graduation
HEGRAD Any Degree/Certificate Gained Within 4 Years of HS Graduation
HEjob Those Employed Within Year after Any Degree/Certificate
AAjob Employed Year After AA (Within Any Graduating Year)
BDjob Employed Year After B.A/B.S
CERTjob Employed Year After Gaining a Certificate
HE2job Working 2 Jobs after Higher Education Attainment
HE3job Working 2 Jobs after Higher Education Attainment
HEsal Salary Year After Higher Education Attainment
AAsal AA Salary Year After Completion
BDsal BD Salary Year After Completion
CERTsal Certificate Salary Year After Completion
PSMTP Propensity Score Matching Tech Prep Variable (PSM Sample)
TP_GRAD Interaction Between PSMTP and GRAD09
TP_ABS Interaction Between PSMTP and MABSENT
TP_SEX Interaction Between PSMTP and SEX
TP_WH Interaction Between PSMTP and WHITE
TP_BL Interaction Between PSMTP and BLACK
TP_HS Interaction Between PSMTP and HISP
TP_GT Interaction Between PSMTP and GIFTED
TP_LEP Interaction Between PSMTP and LEP
TP_SES Interaction Between PSMTP and SESmi
TP_SP Interaction Between PSMTP and SPEDmi
TP_MTK Interaction Between PSMTP and M_METmi
TP_RTK Interaction Between PSMTP and R_METmi
TP_DC Interaction Between PSMTP and MDCmi
TP_CTE Interaction Between PSMTP and MCTEmi
TP_DCTE Interaction Between PSMTP and MDC_CTEmi
TP_RHSP Interaction Between PSMTP and RHSP
TP_DAP Interaction Between PSMTP and DAP
TP_TRHE Interaction Between PSMTP and TRHE
TP_TRWK Interaction Between PSMTP and TRWK
TP_HE Interaction Between PSMTP and HEENR
TP_DE Interaction Between PSMTP and DE
TP_CCR Interaction Between PSMTP and CCR
TP_CCRM Interaction Between PSMTP and CCRM
TP_CCRR Interaction Between PSMTP and CCRR
TP_CCRW Interaction Between PSMTP and CCRW
TP_HEGR Interaction Between PSMTP and HEGR
TP_AA Interaction Between PSMTP and AA
TP_BD Interaction Between PSMTP and BD
TP_CERT Interaction Between PSMTP and CERT Note. Outcomes in some models are included as level-one predictors in other models.
191
Appendix C: Descriptive Statistics
This section includes descriptive statistics on the full sample from the 2009 and
2010 high school graduation cohorts (N=534,035). Information is broken down by Tech
Prep and control group comparisons (i.e., students not enrolled in Tech Prep programs) as
well as Texas and RGV LEAD comparisons.
These analyses are the types of information which first drew the author, I, to the
RGV area and Tech Prep subject of study. For several years, I have completed data
analysis for the RGV LEAD consortium and P-16+ Council (Brown, 2015; Brown &
Alexander, 2014). Reports included gathering longitudinal outcome information on Tech
Prep students in area programs. Data was presented as comparisons seen below but also
disaggregated to individual districts so they might see exactly how their campuses and
students in Tech Prep (compared to controls) fared once leaving high school. Information
on actual outcomes was presented but not connected with inferential analyses.
These descriptive statistics provide details as to Tech Prep participation as well as
RGV comparisons. However, they do not give sufficient information to assess the
impacts of participation on P-16+ outcomes. As such they are not included in the main
body of the findings chapter. They are presented here to give additional detail to the study
and allow for some brevity in the findings section, which is already heavy with 18
different regression models.
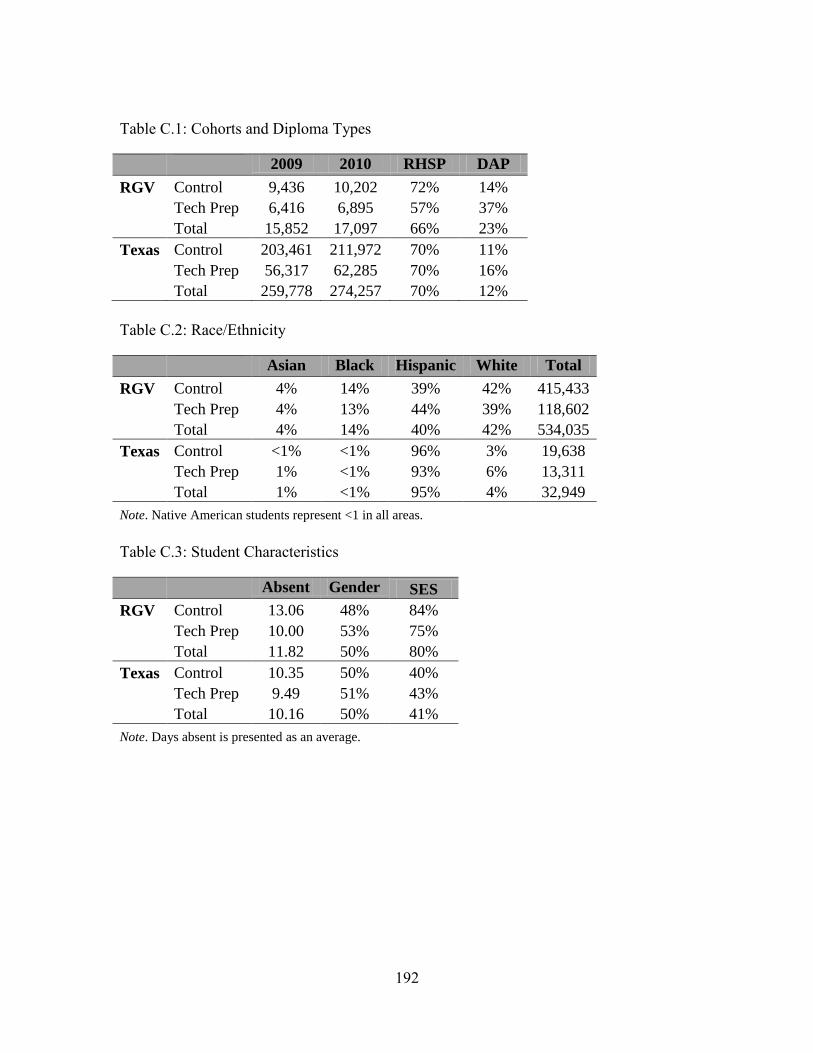
192
Table C.1: Cohorts and Diploma Types
2009 2010 RHSP DAP
RGV Control 9,436 10,202 72% 14%
Tech Prep 6,416 6,895 57% 37%
Total 15,852 17,097 66% 23%
Texas Control 203,461 211,972 70% 11%
Tech Prep 56,317 62,285 70% 16%
Total 259,778 274,257 70% 12%
Table C.2: Race/Ethnicity
Asian Black Hispanic White Total
RGV Control 4% 14% 39% 42% 415,433
Tech Prep 4% 13% 44% 39% 118,602
Total 4% 14% 40% 42% 534,035
Texas Control <1% <1% 96% 3% 19,638
Tech Prep 1% <1% 93% 6% 13,311
Total 1% <1% 95% 4% 32,949
Note. Native American students represent <1 in all areas.
Table C.3: Student Characteristics
Absent Gender SES
RGV Control 13.06 48% 84%
Tech Prep 10.00 53% 75%
Total 11.82 50% 80%
Texas Control 10.35 50% 40%
Tech Prep 9.49 51% 43%
Total 10.16 50% 41%
Note. Days absent is presented as an average.
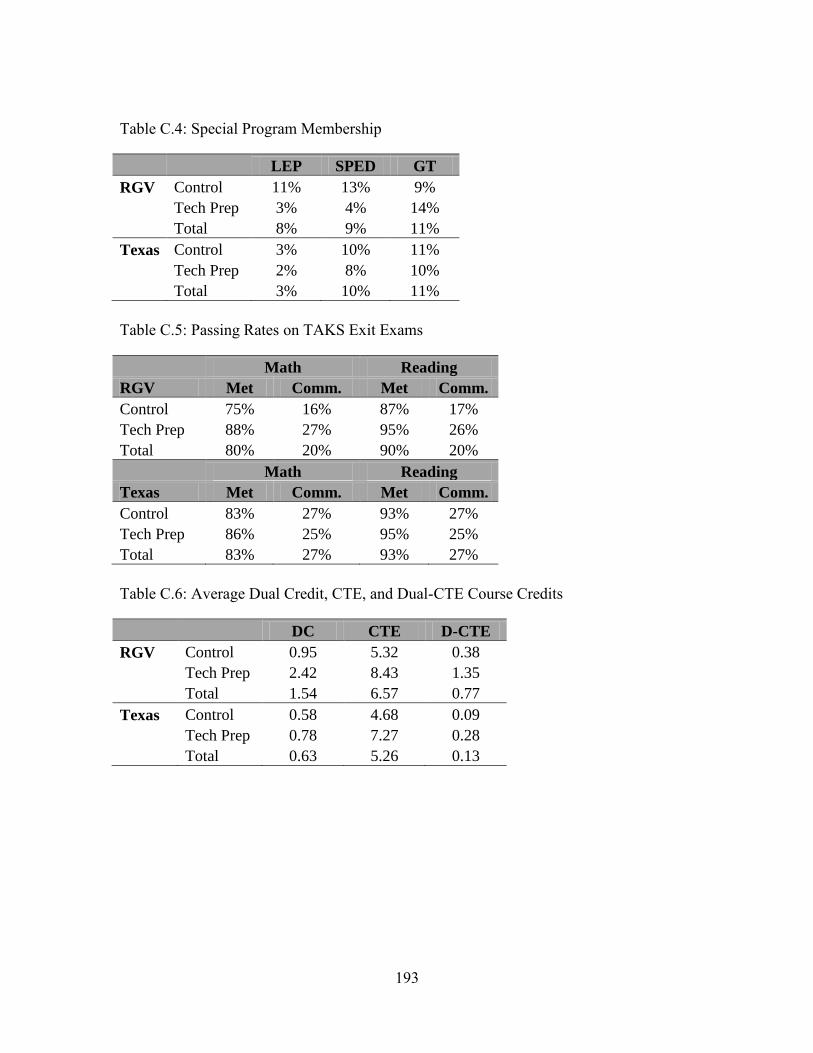
193
Table C.4: Special Program Membership
LEP SPED GT
RGV Control 11% 13% 9%
Tech Prep 3% 4% 14%
Total 8% 9% 11%
Texas Control 3% 10% 11%
Tech Prep 2% 8% 10%
Total 3% 10% 11%
Table C.5: Passing Rates on TAKS Exit Exams
Math Reading
RGV Met Comm. Met Comm.
Control 75% 16% 87% 17%
Tech Prep 88% 27% 95% 26%
Total 80% 20% 90% 20%
Math Reading
Texas Met Comm. Met Comm.
Control 83% 27% 93% 27%
Tech Prep 86% 25% 95% 25%
Total 83% 27% 93% 27%
Table C.6: Average Dual Credit, CTE, and Dual-CTE Course Credits
DC CTE D-CTE
RGV Control 0.95 5.32 0.38
Tech Prep 2.42 8.43 1.35
Total 1.54 6.57 0.77
Texas Control 0.58 4.68 0.09
Tech Prep 0.78 7.27 0.28
Total 0.63 5.26 0.13
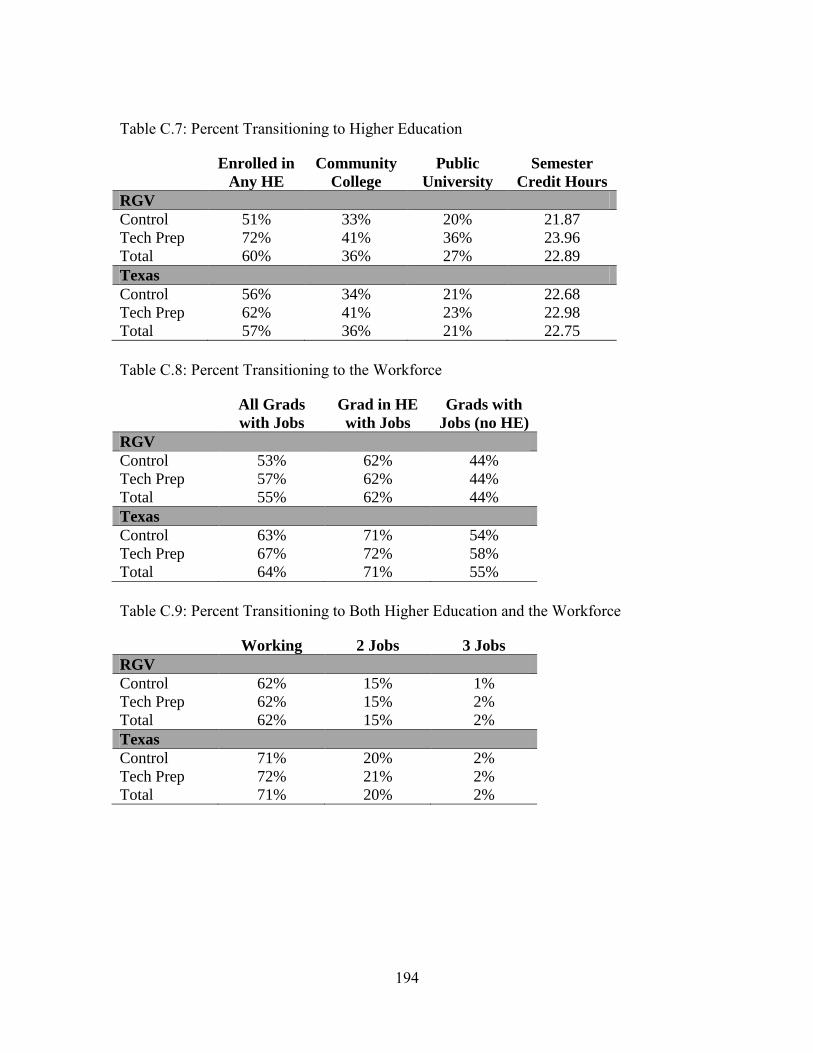
194
Table C.7: Percent Transitioning to Higher Education
Enrolled in
Any HE
Community
College
Public
University
Semester
Credit Hours
RGV
Control 51% 33% 20% 21.87
Tech Prep 72% 41% 36% 23.96
Total 60% 36% 27% 22.89
Texas
Control 56% 34% 21% 22.68
Tech Prep 62% 41% 23% 22.98
Total 57% 36% 21% 22.75
Table C.8: Percent Transitioning to the Workforce
All Grads
with Jobs
Grad in HE
with Jobs
Grads with
Jobs (no HE)
RGV
Control 53% 62% 44%
Tech Prep 57% 62% 44%
Total 55% 62% 44%
Texas
Control 63% 71% 54%
Tech Prep 67% 72% 58%
Total 64% 71% 55%
Table C.9: Percent Transitioning to Both Higher Education and the Workforce
Working 2 Jobs 3 Jobs
RGV
Control 62% 15% 1%
Tech Prep 62% 15% 2%
Total 62% 15% 2%
Texas
Control 71% 20% 2%
Tech Prep 72% 21% 2%
Total 71% 20% 2%
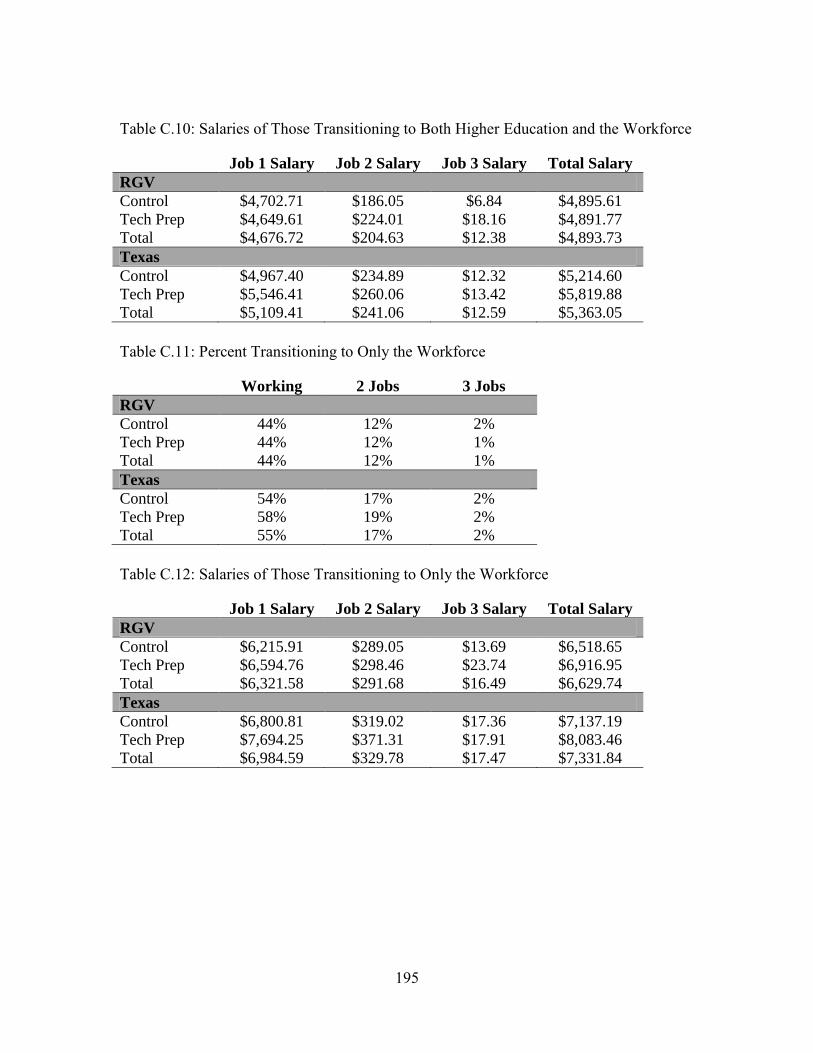
195
Table C.10: Salaries of Those Transitioning to Both Higher Education and the Workforce
Job 1 Salary Job 2 Salary Job 3 Salary Total Salary
RGV
Control $4,702.71 $186.05 $6.84 $4,895.61
Tech Prep $4,649.61 $224.01 $18.16 $4,891.77
Total $4,676.72 $204.63 $12.38 $4,893.73
Texas
Control $4,967.40 $234.89 $12.32 $5,214.60
Tech Prep $5,546.41 $260.06 $13.42 $5,819.88
Total $5,109.41 $241.06 $12.59 $5,363.05
Table C.11: Percent Transitioning to Only the Workforce
Working 2 Jobs 3 Jobs
RGV
Control 44% 12% 2%
Tech Prep 44% 12% 1%
Total 44% 12% 1%
Texas
Control 54% 17% 2%
Tech Prep 58% 19% 2%
Total 55% 17% 2%
Table C.12: Salaries of Those Transitioning to Only the Workforce
Job 1 Salary Job 2 Salary Job 3 Salary Total Salary
RGV
Control $6,215.91 $289.05 $13.69 $6,518.65
Tech Prep $6,594.76 $298.46 $23.74 $6,916.95
Total $6,321.58 $291.68 $16.49 $6,629.74
Texas
Control $6,800.81 $319.02 $17.36 $7,137.19
Tech Prep $7,694.25 $371.31 $17.91 $8,083.46
Total $6,984.59 $329.78 $17.47 $7,331.84
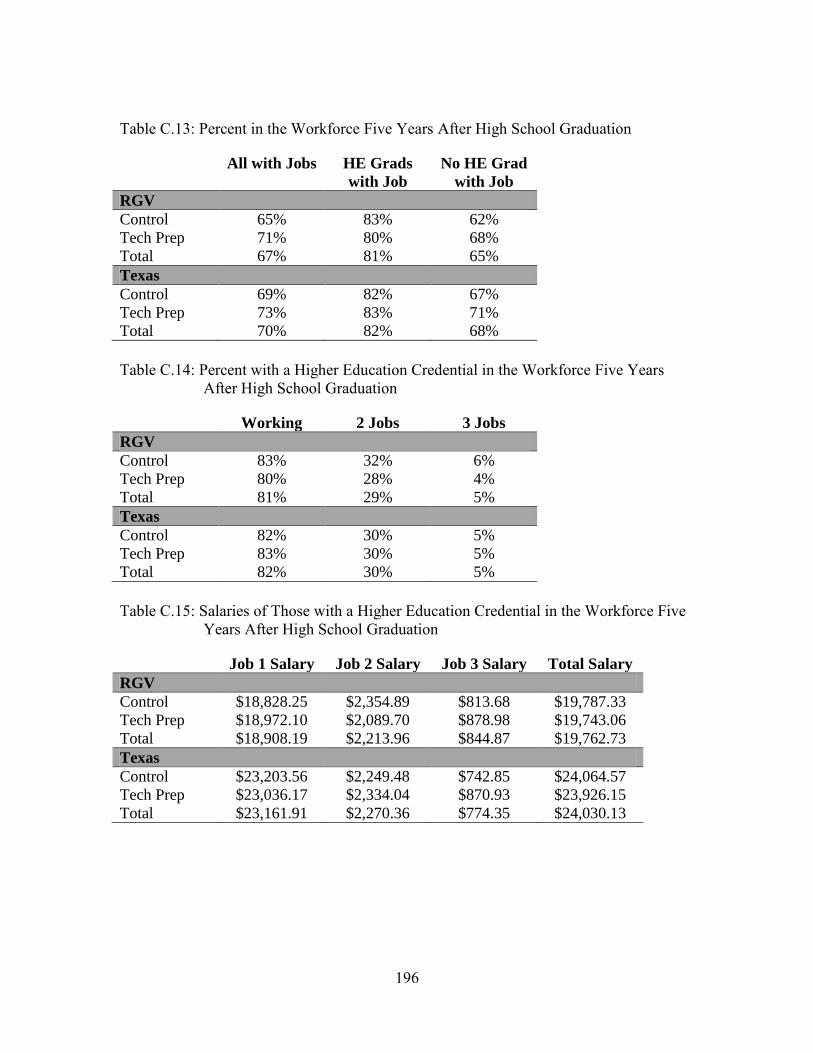
196
Table C.13: Percent in the Workforce Five Years After High School Graduation
All with Jobs HE Grads
with Job
No HE Grad
with Job
RGV
Control 65% 83% 62%
Tech Prep 71% 80% 68%
Total 67% 81% 65%
Texas
Control 69% 82% 67%
Tech Prep 73% 83% 71%
Total 70% 82% 68%
Table C.14: Percent with a Higher Education Credential in the Workforce Five Years
After High School Graduation
Working 2 Jobs 3 Jobs
RGV
Control 83% 32% 6%
Tech Prep 80% 28% 4%
Total 81% 29% 5%
Texas
Control 82% 30% 5%
Tech Prep 83% 30% 5%
Total 82% 30% 5%
Table C.15: Salaries of Those with a Higher Education Credential in the Workforce Five
Years After High School Graduation
Job 1 Salary Job 2 Salary Job 3 Salary Total Salary
RGV
Control $18,828.25 $2,354.89 $813.68 $19,787.33
Tech Prep $18,972.10 $2,089.70 $878.98 $19,743.06
Total $18,908.19 $2,213.96 $844.87 $19,762.73
Texas
Control $23,203.56 $2,249.48 $742.85 $24,064.57
Tech Prep $23,036.17 $2,334.04 $870.93 $23,926.15
Total $23,161.91 $2,270.36 $774.35 $24,030.13
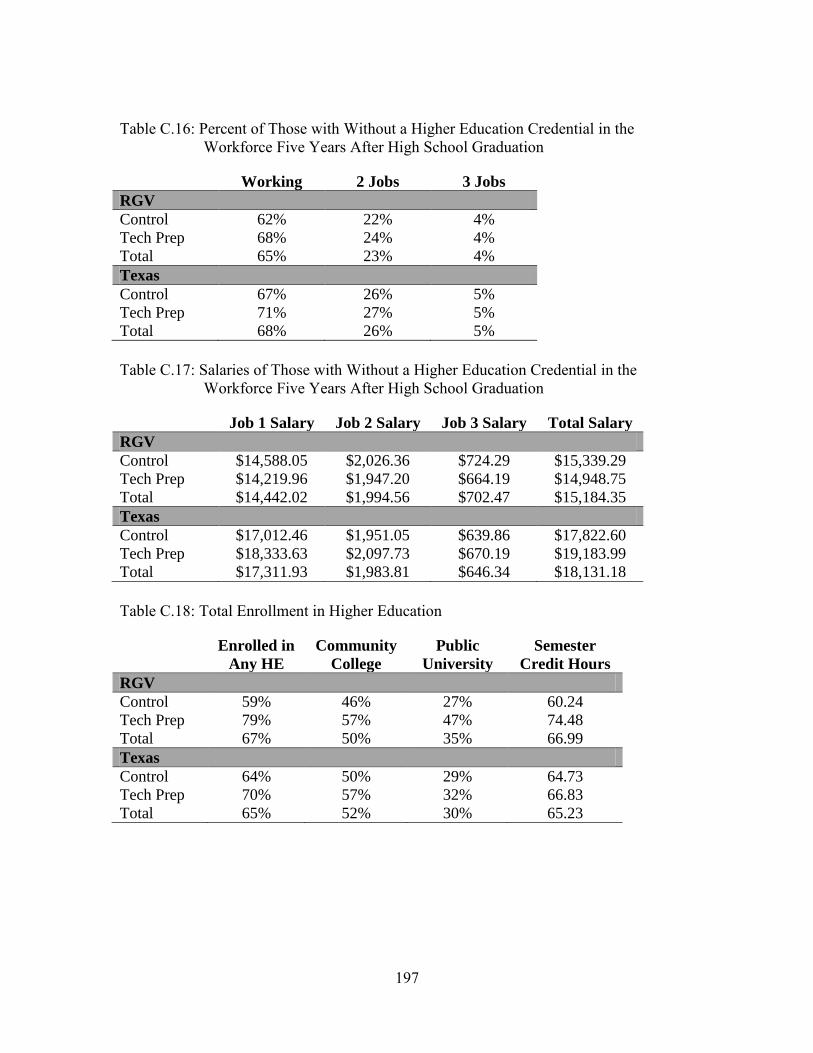
197
Table C.16: Percent of Those with Without a Higher Education Credential in the
Workforce Five Years After High School Graduation
Working 2 Jobs 3 Jobs
RGV
Control 62% 22% 4%
Tech Prep 68% 24% 4%
Total 65% 23% 4%
Texas
Control 67% 26% 5%
Tech Prep 71% 27% 5%
Total 68% 26% 5%
Table C.17: Salaries of Those with Without a Higher Education Credential in the
Workforce Five Years After High School Graduation
Job 1 Salary Job 2 Salary Job 3 Salary Total Salary
RGV
Control $14,588.05 $2,026.36 $724.29 $15,339.29
Tech Prep $14,219.96 $1,947.20 $664.19 $14,948.75
Total $14,442.02 $1,994.56 $702.47 $15,184.35
Texas
Control $17,012.46 $1,951.05 $639.86 $17,822.60
Tech Prep $18,333.63 $2,097.73 $670.19 $19,183.99
Total $17,311.93 $1,983.81 $646.34 $18,131.18
Table C.18: Total Enrollment in Higher Education
Enrolled in
Any HE
Community
College
Public
University
Semester
Credit Hours
RGV
Control 59% 46% 27% 60.24
Tech Prep 79% 57% 47% 74.48
Total 67% 50% 35% 66.99
Texas
Control 64% 50% 29% 64.73
Tech Prep 70% 57% 32% 66.83
Total 65% 52% 30% 65.23
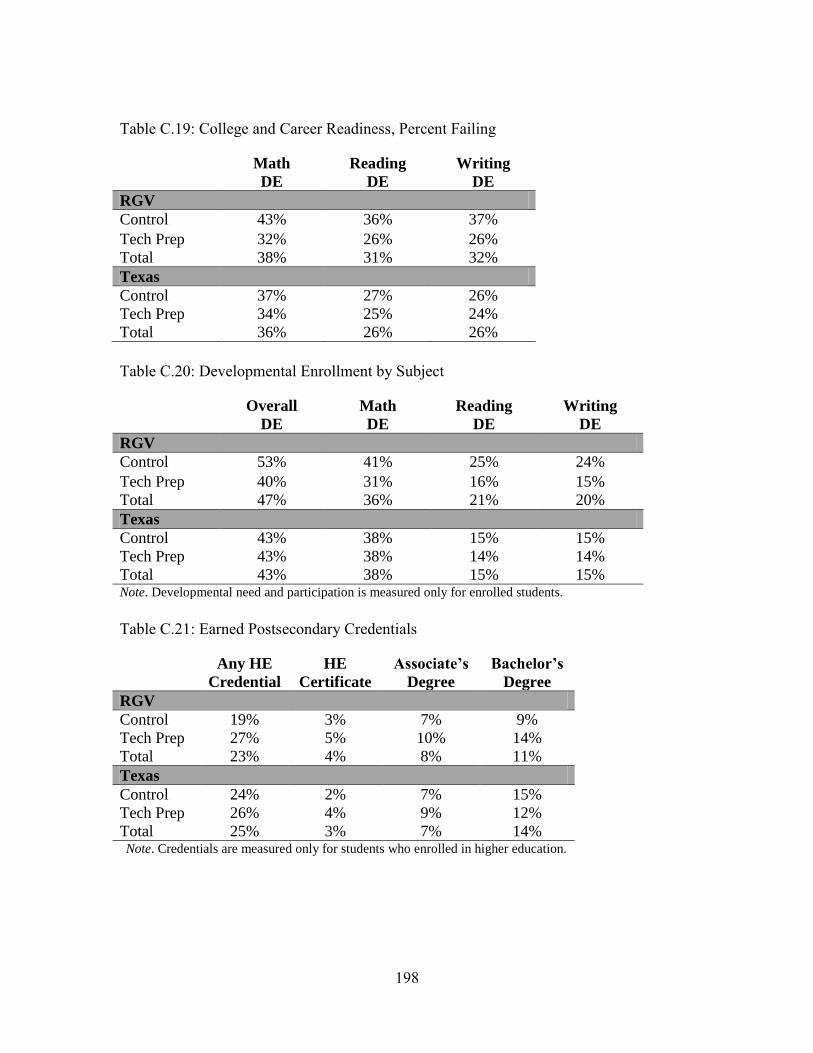
198
Table C.19: College and Career Readiness, Percent Failing
Math
DE
Reading
DE
Writing
DE
RGV
Control 43% 36% 37%
Tech Prep 32% 26% 26%
Total 38% 31% 32%
Texas
Control 37% 27% 26%
Tech Prep 34% 25% 24%
Total 36% 26% 26%
Table C.20: Developmental Enrollment by Subject
Overall
DE
Math
DE
Reading
DE
Writing
DE
RGV
Control 53% 41% 25% 24%
Tech Prep 40% 31% 16% 15%
Total 47% 36% 21% 20%
Texas
Control 43% 38% 15% 15%
Tech Prep 43% 38% 14% 14%
Total 43% 38% 15% 15% Note. Developmental need and participation is measured only for enrolled students.
Table C.21: Earned Postsecondary Credentials
Any HE
Credential
HE
Certificate
Associate’s
Degree
Bachelor’s
Degree
RGV
Control 19% 3% 7% 9%
Tech Prep 27% 5% 10% 14%
Total 23% 4% 8% 11%
Texas
Control 24% 2% 7% 15%
Tech Prep 26% 4% 9% 12%
Total 25% 3% 7% 14% Note. Credentials are measured only for students who enrolled in higher education.
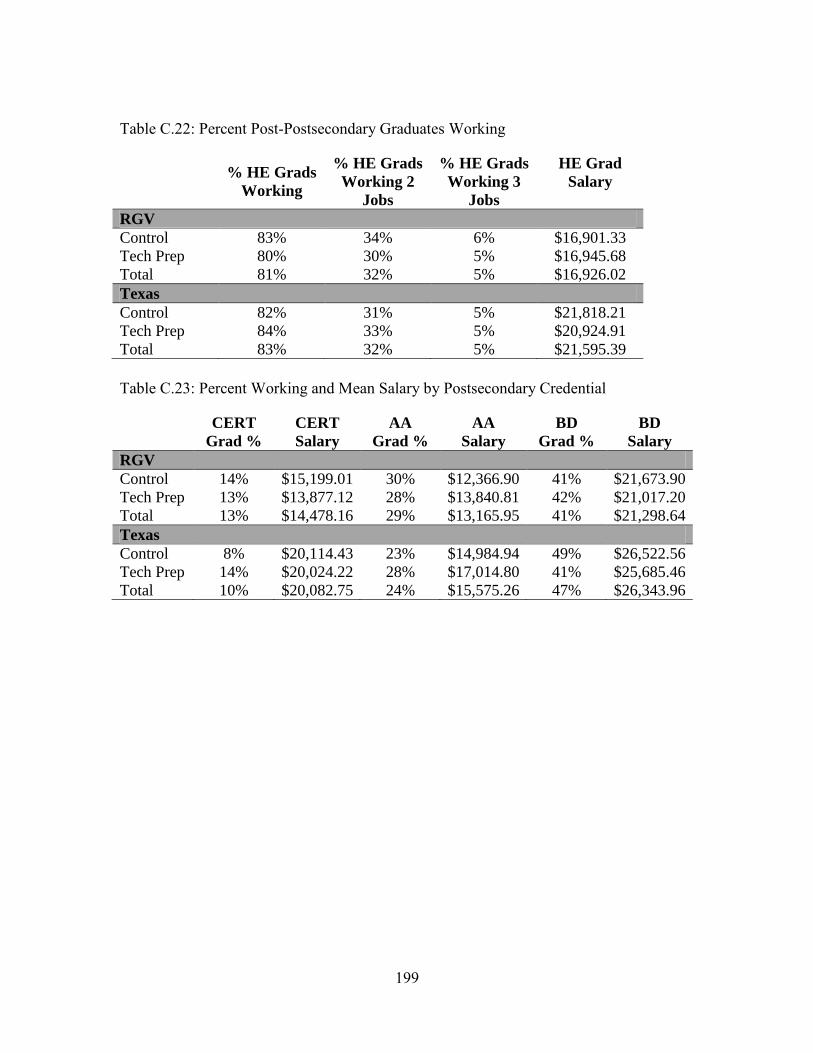
199
Table C.22: Percent Post-Postsecondary Graduates Working
% HE Grads
Working
% HE Grads
Working 2
Jobs
% HE Grads
Working 3
Jobs
HE Grad
Salary
RGV
Control 83% 34% 6% $16,901.33
Tech Prep 80% 30% 5% $16,945.68
Total 81% 32% 5% $16,926.02
Texas
Control 82% 31% 5% $21,818.21
Tech Prep 84% 33% 5% $20,924.91
Total 83% 32% 5% $21,595.39
Table C.23: Percent Working and Mean Salary by Postsecondary Credential
CERT
Grad %
CERT
Salary
AA
Grad %
AA
Salary
BD
Grad %
BD
Salary
RGV
Control 14% $15,199.01 30% $12,366.90 41% $21,673.90
Tech Prep 13% $13,877.12 28% $13,840.81 42% $21,017.20
Total 13% $14,478.16 29% $13,165.95 41% $21,298.64
Texas
Control 8% $20,114.43 23% $14,984.94 49% $26,522.56
Tech Prep 14% $20,024.22 28% $17,014.80 41% $25,685.46
Total 10% $20,082.75 24% $15,575.26 47% $26,343.96
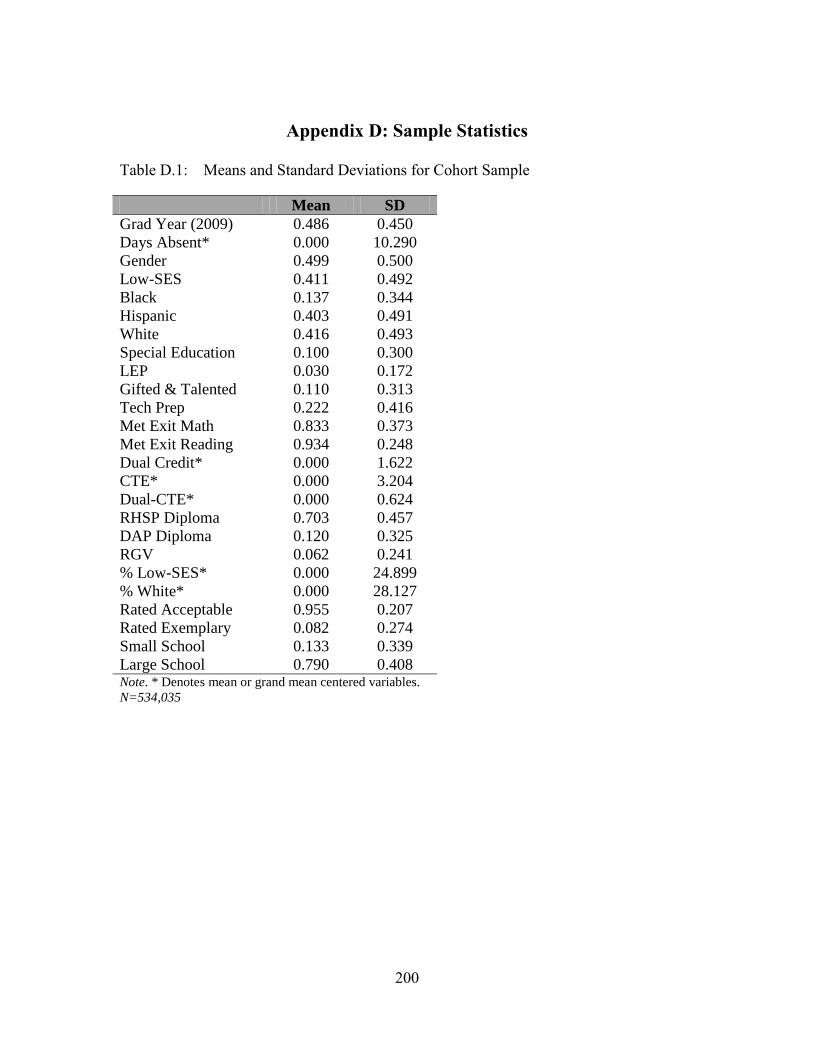
200
Appendix D: Sample Statistics
Table D.1: Means and Standard Deviations for Cohort Sample
Mean SD
Grad Year (2009) 0.486 0.450
Days Absent* 0.000 10.290
Gender 0.499 0.500
Low-SES 0.411 0.492
Black 0.137 0.344
Hispanic 0.403 0.491
White 0.416 0.493
Special Education 0.100 0.300
LEP 0.030 0.172
Gifted & Talented 0.110 0.313
Tech Prep 0.222 0.416
Met Exit Math 0.833 0.373
Met Exit Reading 0.934 0.248
Dual Credit* 0.000 1.622
CTE* 0.000 3.204
Dual-CTE* 0.000 0.624
RHSP Diploma 0.703 0.457
DAP Diploma 0.120 0.325
RGV 0.062 0.241
% Low-SES* 0.000 24.899
% White* 0.000 28.127
Rated Acceptable 0.955 0.207
Rated Exemplary 0.082 0.274
Small School 0.133 0.339
Large School 0.790 0.408 Note. * Denotes mean or grand mean centered variables.
N=534,035
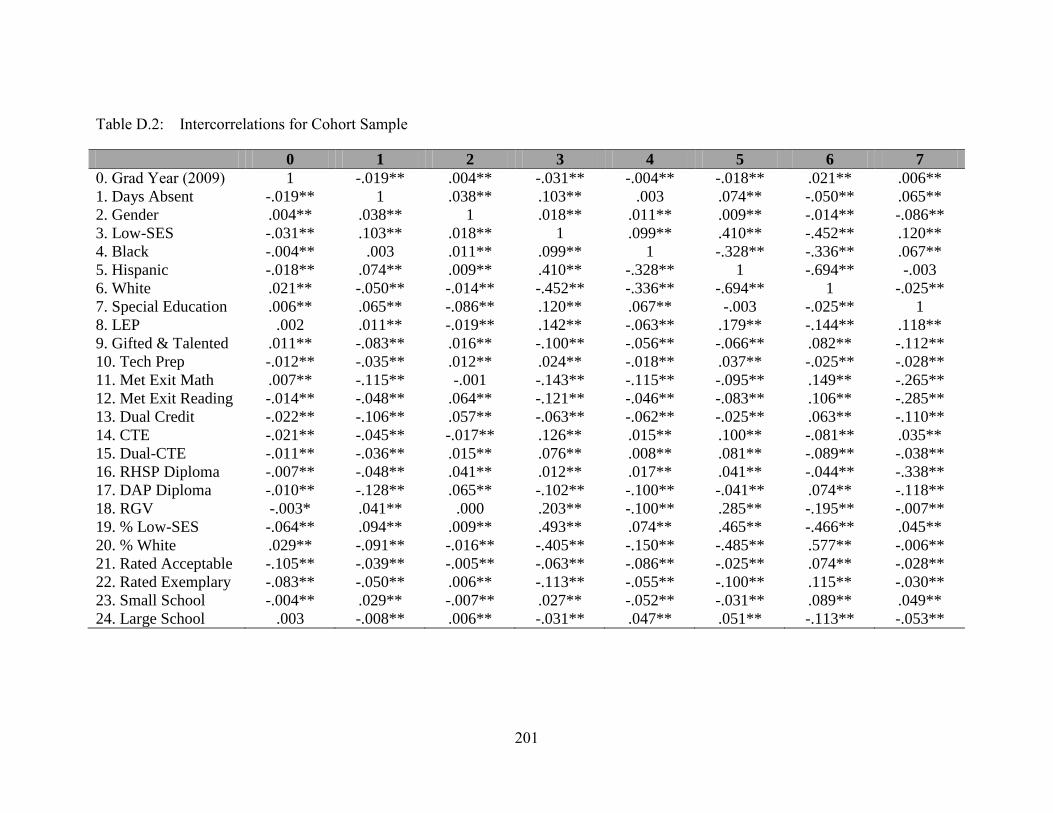
201
Table D.2: Intercorrelations for Cohort Sample
0 1 2 3 4 5 6 7
0. Grad Year (2009) 1 -.019** .004** -.031** -.004** -.018** .021** .006**
1. Days Absent -.019** 1 .038** .103** .003 .074** -.050** .065**
2. Gender .004** .038** 1 .018** .011** .009** -.014** -.086**
3. Low-SES -.031** .103** .018** 1 .099** .410** -.452** .120**
4. Black -.004** .003 .011** .099** 1 -.328** -.336** .067**
5. Hispanic -.018** .074** .009** .410** -.328** 1 -.694** -.003
6. White .021** -.050** -.014** -.452** -.336** -.694** 1 -.025**
7. Special Education .006** .065** -.086** .120** .067** -.003 -.025** 1
8. LEP .002 .011** -.019** .142** -.063** .179** -.144** .118**
9. Gifted & Talented .011** -.083** .016** -.100** -.056** -.066** .082** -.112**
10. Tech Prep -.012** -.035** .012** .024** -.018** .037** -.025** -.028**
11. Met Exit Math .007** -.115** -.001 -.143** -.115** -.095** .149** -.265**
12. Met Exit Reading -.014** -.048** .064** -.121** -.046** -.083** .106** -.285**
13. Dual Credit -.022** -.106** .057** -.063** -.062** -.025** .063** -.110**
14. CTE -.021** -.045** -.017** .126** .015** .100** -.081** .035**
15. Dual-CTE -.011** -.036** .015** .076** .008** .081** -.089** -.038**
16. RHSP Diploma -.007** -.048** .041** .012** .017** .041** -.044** -.338**
17. DAP Diploma -.010** -.128** .065** -.102** -.100** -.041** .074** -.118**
18. RGV -.003* .041** .000 .203** -.100** .285** -.195** -.007**
19. % Low-SES -.064** .094** .009** .493** .074** .465** -.466** .045**
20. % White .029** -.091** -.016** -.405** -.150** -.485** .577** -.006**
21. Rated Acceptable -.105** -.039** -.005** -.063** -.086** -.025** .074** -.028**
22. Rated Exemplary -.083** -.050** .006** -.113** -.055** -.100** .115** -.030**
23. Small School -.004** .029** -.007** .027** -.052** -.031** .089** .049**
24. Large School .003 -.008** .006** -.031** .047** .051** -.113** -.053**
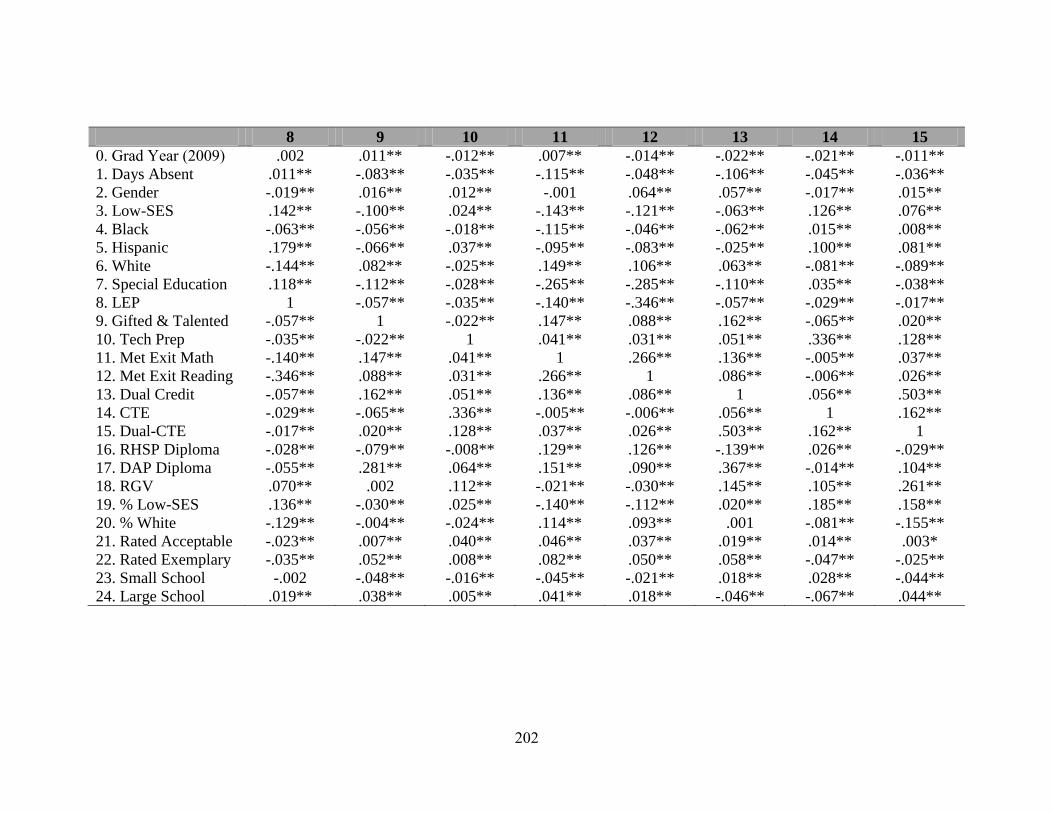
202
8 9 10 11 12 13 14 15
0. Grad Year (2009) .002 .011** -.012** .007** -.014** -.022** -.021** -.011**
1. Days Absent .011** -.083** -.035** -.115** -.048** -.106** -.045** -.036**
2. Gender -.019** .016** .012** -.001 .064** .057** -.017** .015**
3. Low-SES .142** -.100** .024** -.143** -.121** -.063** .126** .076**
4. Black -.063** -.056** -.018** -.115** -.046** -.062** .015** .008**
5. Hispanic .179** -.066** .037** -.095** -.083** -.025** .100** .081**
6. White -.144** .082** -.025** .149** .106** .063** -.081** -.089**
7. Special Education .118** -.112** -.028** -.265** -.285** -.110** .035** -.038**
8. LEP 1 -.057** -.035** -.140** -.346** -.057** -.029** -.017**
9. Gifted & Talented -.057** 1 -.022** .147** .088** .162** -.065** .020**
10. Tech Prep -.035** -.022** 1 .041** .031** .051** .336** .128**
11. Met Exit Math -.140** .147** .041** 1 .266** .136** -.005** .037**
12. Met Exit Reading -.346** .088** .031** .266** 1 .086** -.006** .026**
13. Dual Credit -.057** .162** .051** .136** .086** 1 .056** .503**
14. CTE -.029** -.065** .336** -.005** -.006** .056** 1 .162**
15. Dual-CTE -.017** .020** .128** .037** .026** .503** .162** 1
16. RHSP Diploma -.028** -.079** -.008** .129** .126** -.139** .026** -.029**
17. DAP Diploma -.055** .281** .064** .151** .090** .367** -.014** .104**
18. RGV .070** .002 .112** -.021** -.030** .145** .105** .261**
19. % Low-SES .136** -.030** .025** -.140** -.112** .020** .185** .158**
20. % White -.129** -.004** -.024** .114** .093** .001 -.081** -.155**
21. Rated Acceptable -.023** .007** .040** .046** .037** .019** .014** .003*
22. Rated Exemplary -.035** .052** .008** .082** .050** .058** -.047** -.025**
23. Small School -.002 -.048** -.016** -.045** -.021** .018** .028** -.044**
24. Large School .019** .038** .005** .041** .018** -.046** -.067** .044**
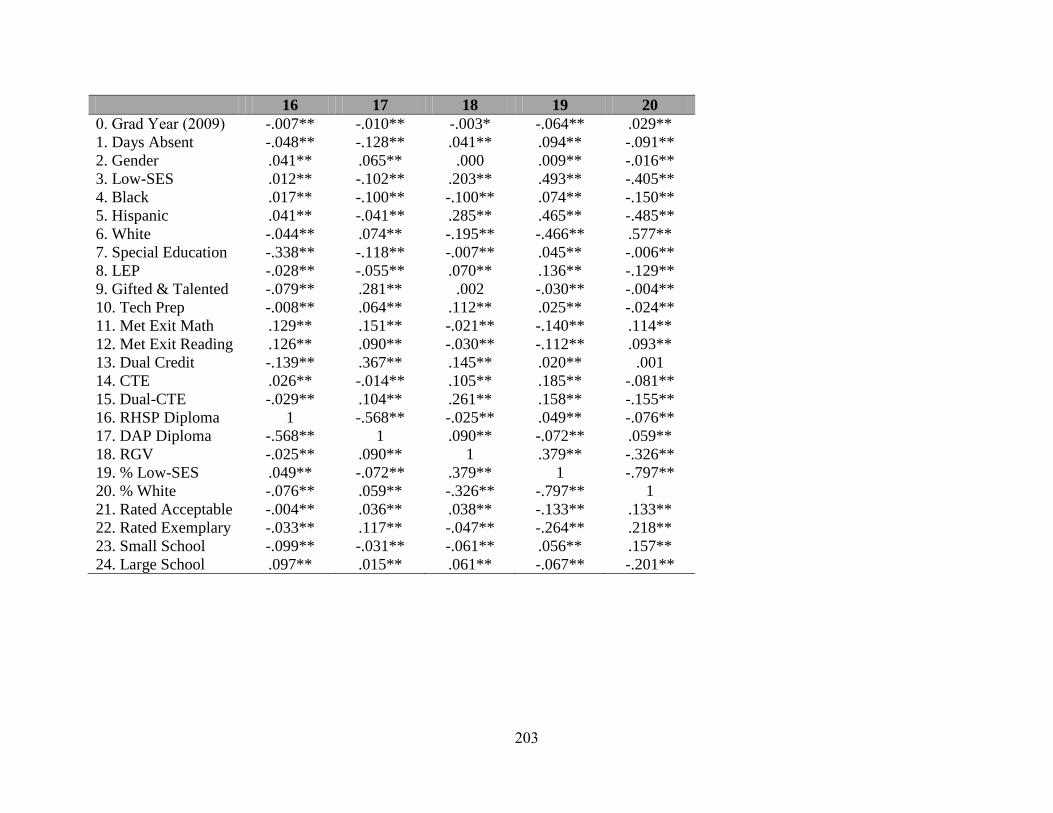
203
16 17 18 19 20
0. Grad Year (2009) -.007** -.010** -.003* -.064** .029**
1. Days Absent -.048** -.128** .041** .094** -.091**
2. Gender .041** .065** .000 .009** -.016**
3. Low-SES .012** -.102** .203** .493** -.405**
4. Black .017** -.100** -.100** .074** -.150**
5. Hispanic .041** -.041** .285** .465** -.485**
6. White -.044** .074** -.195** -.466** .577**
7. Special Education -.338** -.118** -.007** .045** -.006**
8. LEP -.028** -.055** .070** .136** -.129**
9. Gifted & Talented -.079** .281** .002 -.030** -.004**
10. Tech Prep -.008** .064** .112** .025** -.024**
11. Met Exit Math .129** .151** -.021** -.140** .114**
12. Met Exit Reading .126** .090** -.030** -.112** .093**
13. Dual Credit -.139** .367** .145** .020** .001
14. CTE .026** -.014** .105** .185** -.081**
15. Dual-CTE -.029** .104** .261** .158** -.155**
16. RHSP Diploma 1 -.568** -.025** .049** -.076**
17. DAP Diploma -.568** 1 .090** -.072** .059**
18. RGV -.025** .090** 1 .379** -.326**
19. % Low-SES .049** -.072** .379** 1 -.797**
20. % White -.076** .059** -.326** -.797** 1
21. Rated Acceptable -.004** .036** .038** -.133** .133**
22. Rated Exemplary -.033** .117** -.047** -.264** .218**
23. Small School -.099** -.031** -.061** .056** .157**
24. Large School .097** .015** .061** -.067** -.201**
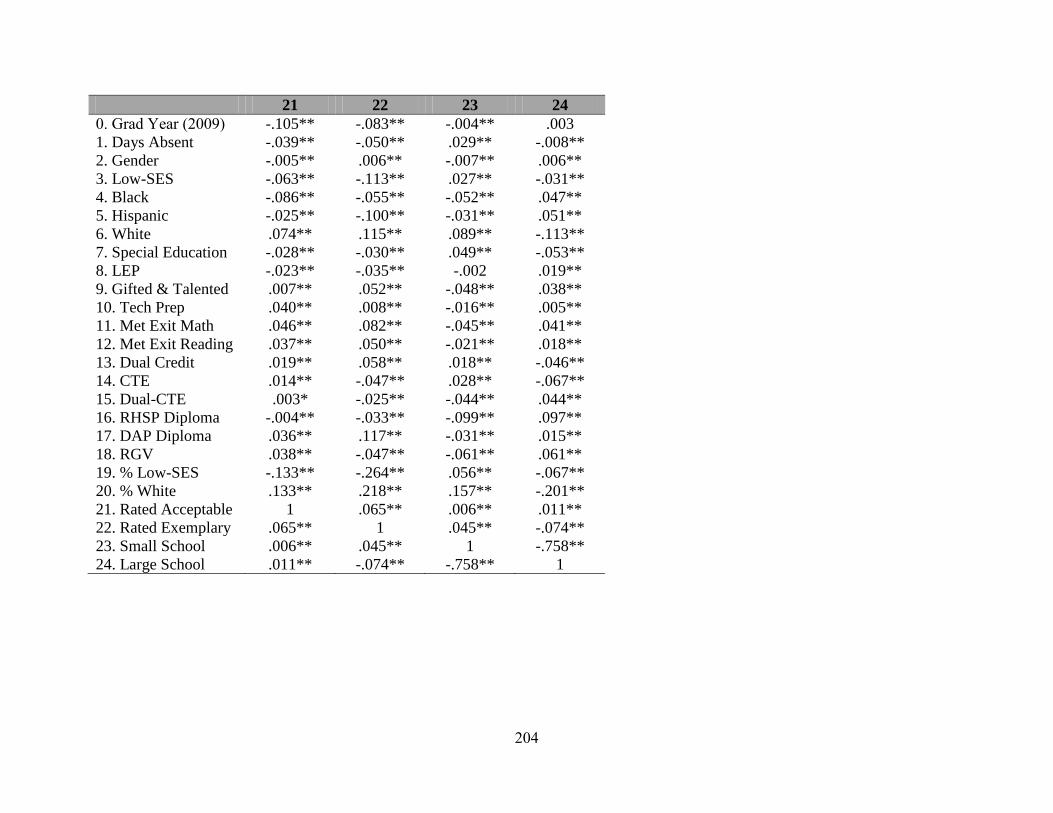
204
21 22 23 24
0. Grad Year (2009) -.105** -.083** -.004** .003
1. Days Absent -.039** -.050** .029** -.008**
2. Gender -.005** .006** -.007** .006**
3. Low-SES -.063** -.113** .027** -.031**
4. Black -.086** -.055** -.052** .047**
5. Hispanic -.025** -.100** -.031** .051**
6. White .074** .115** .089** -.113**
7. Special Education -.028** -.030** .049** -.053**
8. LEP -.023** -.035** -.002 .019**
9. Gifted & Talented .007** .052** -.048** .038**
10. Tech Prep .040** .008** -.016** .005**
11. Met Exit Math .046** .082** -.045** .041**
12. Met Exit Reading .037** .050** -.021** .018**
13. Dual Credit .019** .058** .018** -.046**
14. CTE .014** -.047** .028** -.067**
15. Dual-CTE .003* -.025** -.044** .044**
16. RHSP Diploma -.004** -.033** -.099** .097**
17. DAP Diploma .036** .117** -.031** .015**
18. RGV .038** -.047** -.061** .061**
19. % Low-SES -.133** -.264** .056** -.067**
20. % White .133** .218** .157** -.201**
21. Rated Acceptable 1 .065** .006** .011**
22. Rated Exemplary .065** 1 .045** -.074**
23. Small School .006** .045** 1 -.758**
24. Large School .011** -.074** -.758** 1
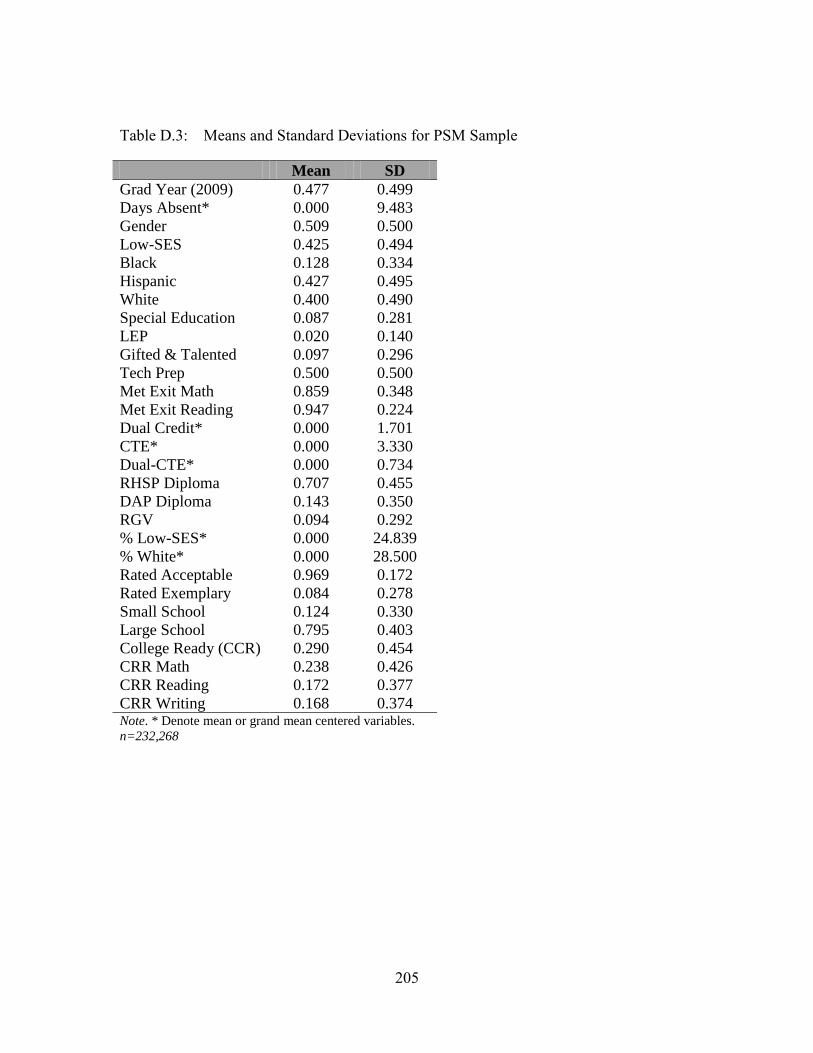
205
Table D.3: Means and Standard Deviations for PSM Sample
Mean SD
Grad Year (2009) 0.477 0.499
Days Absent* 0.000 9.483
Gender 0.509 0.500
Low-SES 0.425 0.494
Black 0.128 0.334
Hispanic 0.427 0.495
White 0.400 0.490
Special Education 0.087 0.281
LEP 0.020 0.140
Gifted & Talented 0.097 0.296
Tech Prep 0.500 0.500
Met Exit Math 0.859 0.348
Met Exit Reading 0.947 0.224
Dual Credit* 0.000 1.701
CTE* 0.000 3.330
Dual-CTE* 0.000 0.734
RHSP Diploma 0.707 0.455
DAP Diploma 0.143 0.350
RGV 0.094 0.292
% Low-SES* 0.000 24.839
% White* 0.000 28.500
Rated Acceptable 0.969 0.172
Rated Exemplary 0.084 0.278
Small School 0.124 0.330
Large School 0.795 0.403
College Ready (CCR) 0.290 0.454
CRR Math 0.238 0.426
CRR Reading 0.172 0.377
CRR Writing 0.168 0.374 Note. * Denote mean or grand mean centered variables.
n=232,268
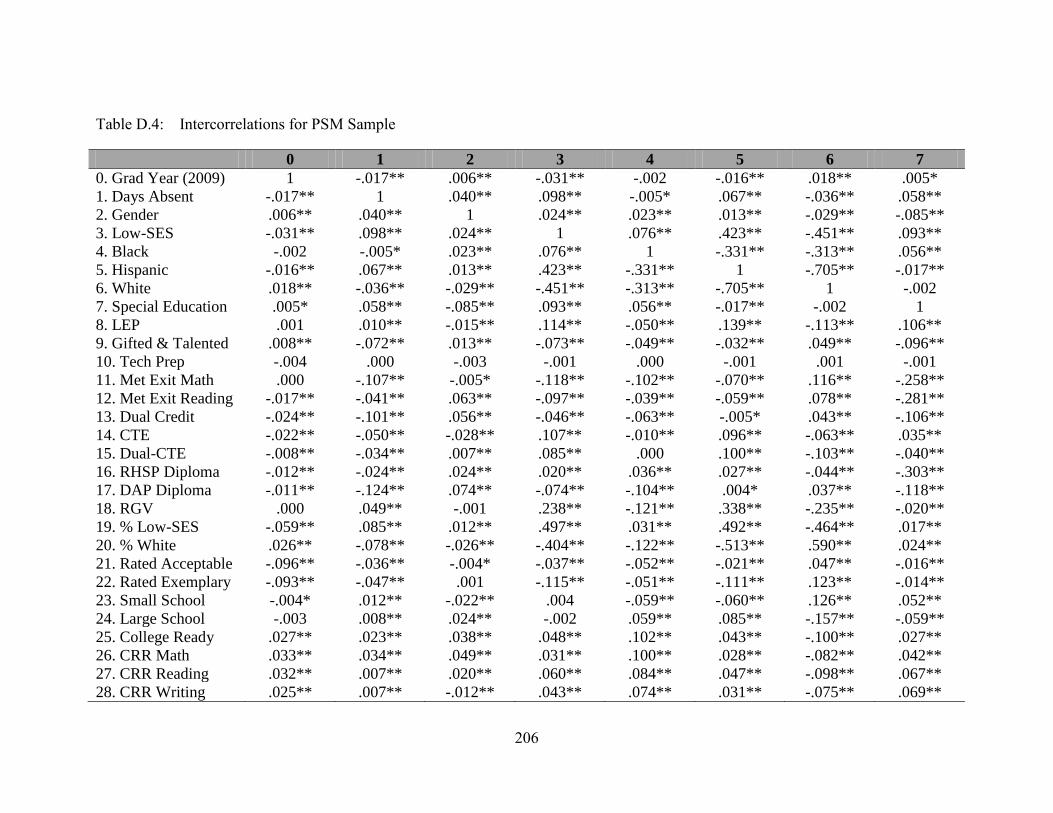
206
Table D.4: Intercorrelations for PSM Sample
0 1 2 3 4 5 6 7
0. Grad Year (2009) 1 -.017** .006** -.031** -.002 -.016** .018** .005*
1. Days Absent -.017** 1 .040** .098** -.005* .067** -.036** .058**
2. Gender .006** .040** 1 .024** .023** .013** -.029** -.085**
3. Low-SES -.031** .098** .024** 1 .076** .423** -.451** .093**
4. Black -.002 -.005* .023** .076** 1 -.331** -.313** .056**
5. Hispanic -.016** .067** .013** .423** -.331** 1 -.705** -.017**
6. White .018** -.036** -.029** -.451** -.313** -.705** 1 -.002
7. Special Education .005* .058** -.085** .093** .056** -.017** -.002 1
8. LEP .001 .010** -.015** .114** -.050** .139** -.113** .106**
9. Gifted & Talented .008** -.072** .013** -.073** -.049** -.032** .049** -.096**
10. Tech Prep -.004 .000 -.003 -.001 .000 -.001 .001 -.001
11. Met Exit Math .000 -.107** -.005* -.118** -.102** -.070** .116** -.258**
12. Met Exit Reading -.017** -.041** .063** -.097** -.039** -.059** .078** -.281**
13. Dual Credit -.024** -.101** .056** -.046** -.063** -.005* .043** -.106**
14. CTE -.022** -.050** -.028** .107** -.010** .096** -.063** .035**
15. Dual-CTE -.008** -.034** .007** .085** .000 .100** -.103** -.040**
16. RHSP Diploma -.012** -.024** .024** .020** .036** .027** -.044** -.303**
17. DAP Diploma -.011** -.124** .074** -.074** -.104** .004* .037** -.118**
18. RGV .000 .049** -.001 .238** -.121** .338** -.235** -.020**
19. % Low-SES -.059** .085** .012** .497** .031** .492** -.464** .017**
20. % White .026** -.078** -.026** -.404** -.122** -.513** .590** .024**
21. Rated Acceptable -.096** -.036** -.004* -.037** -.052** -.021** .047** -.016**
22. Rated Exemplary -.093** -.047** .001 -.115** -.051** -.111** .123** -.014**
23. Small School -.004* .012** -.022** .004 -.059** -.060** .126** .052**
24. Large School -.003 .008** .024** -.002 .059** .085** -.157** -.059**
25. College Ready .027** .023** .038** .048** .102** .043** -.100** .027**
26. CRR Math .033** .034** .049** .031** .100** .028** -.082** .042**
27. CRR Reading .032** .007** .020** .060** .084** .047** -.098** .067**
28. CRR Writing .025** .007** -.012** .043** .074** .031** -.075** .069**
207
8 9 10 11 12 13 14 15
0. Grad Year (2009) .001 .008** -.004 .000 -.017** -.024** -.022** -.008**
1. Days Absent .010** -.072** .000 -.107** -.041** -.101** -.050** -.034**
2. Gender -.015** .013** -.003 -.005* .063** .056** -.028** .007**
3. Low-SES .114** -.073** -.001 -.118** -.097** -.046** .107** .085**
4. Black -.050** -.049** .000 -.102** -.039** -.063** -.010** .000
5. Hispanic .139** -.032** -.001 -.070** -.059** -.005* .096** .100**
6. White -.113** .049** .001 .116** .078** .043** -.063** -.103**
7. Special Education .106** -.096** -.001 -.258** -.281** -.106** .035** -.040**
8. LEP 1 -.043** -.005* -.114** -.302** -.047** -.019** -.013**
9. Gifted & Talented -.043** 1 .004* .123** .073** .167** -.016** .037**
10. Tech Prep -.005* .004* 1 .000 .002 -.002 .373** .082**
11. Met Exit Math -.114** .123** .000 1 .250** .127** .003 .037**
12. Met Exit Reading -.302** .073** .002 .250** 1 .079** -.006** .025**
13. Dual Credit -.047** .167** -.002 .127** .079** 1 .060** .541**
14. CTE -.019** -.016** .373** .003 -.006** .060** 1 .160**
15. Dual-CTE -.013** .037** .082** .037** .025** .541** .160** 1
16. RHSP Diploma -.019** -.111** .001 .099** .108** -.169** -.002 -.027**
17. DAP Diploma -.041** .265** .002 .142** .083** .357** .023** .091**
18. RGV .066** .033** -.003 -.013** -.023** .175** .085** .280**
19. % Low-SES .104** .014** -.003 -.104** -.082** .063** .175** .189**
20. % White -.099** -.037** .003 .082** .063** -.026** -.072** -.180**
21. Rated Acceptable -.014** .003 .004* .033** .024** .014** .011** -.001
22. Rated Exemplary -.027** .034** .000 .067** .040** .044** -.035** -.040**
23. Small School -.008** -.032** .004* -.033** -.019** .030** .042** -.052**
24. Large School .024** .019** -.005* .028** .018** -.057** -.077** .052**
25. College Ready -.006** -.086** .021** -.120** -.020** -.086** .027** -.004
26. CRR Math -.016** -.074** .011** -.145** -.018** -.073** .016** -.008**
27. CRR Reading .022** -.061** .007** -.103** -.058** -.064** .016** .000
28. CRR Writing .020** -.049** .011** -.082** -.057** -.060** .017** .001
208
16 17 18 19 20 21 22 23
0. Grad Year (2009) -.012** -.011** .000 -.059** .026** -.096** -.093** -.004*
1. Days Absent -.024** -.124** .049** .085** -.078** -.036** -.047** .012**
2. Gender .024** .074** -.001 .012** -.026** -.004* .001 -.022**
3. Low-SES .020** -.074** .238** .497** -.404** -.037** -.115** .004
4. Black .036** -.104** -.121** .031** -.122** -.052** -.051** -.059**
5. Hispanic .027** .004* .338** .492** -.513** -.021** -.111** -.060**
6. White -.044** .037** -.235** -.464** .590** .047** .123** .126**
7. Special Education -.303** -.118** -.020** .017** .024** -.016** -.014** .052**
8. LEP -.019** -.041** .066** .104** -.099** -.014** -.027** -.008**
9. Gifted & Talented -.111** .265** .033** .014** -.037** .003 .034** -.032**
10. Tech Prep .001 .002 -.003 -.003 .003 .004* .000 .004*
11. Met Exit Math .099** .142** -.013** -.104** .082** .033** .067** -.033**
12. Met Exit Reading .108** .083** -.023** -.082** .063** .024** .040** -.019**
13. Dual Credit -.169** .357** .175** .063** -.026** .014** .044** .030**
14. CTE -.002 .023** .085** .175** -.072** .011** -.035** .042**
15. Dual-CTE -.027** .091** .280** .189** -.180** -.001 -.040** -.052**
16. RHSP Diploma 1 -.636** -.026** .037** -.065** -.012** -.040** -.080**
17. DAP Diploma -.636** 1 .091** -.012** .009** .030** .093** -.019**
18. RGV -.026** .091** 1 .458** -.395** .032** -.065** -.079**
19. % Low-SES .037** -.012** .458** 1 -.785** -.079** -.257** .017**
20. % White -.065** .009** -.395** -.785** 1 .081** .224** .210**
21. Rated Acceptable -.012** .030** .032** -.079** .081** 1 .054** .015**
22. Rated Exemplary -.040** .093** -.065** -.257** .224** .054** 1 .063**
23. Small School -.080** -.019** -.079** .017** .210** .015** .063** 1
24. Large School .081** .006** .080** -.024** -.261** .002 -.094** -.742**
25. College Ready .067** -.105** .027** .080** -.101** -.015** -.046** -.032**
26. CRR Math .043** -.095** .012** .063** -.084** -.017** -.042** -.025**
27. CRR Reading .031** -.074** .031** .078** -.094** -.012** -.033** -.021**
28. CRR Writing .019** -.060** .038** .062** -.073** -.012** -.026** -.016**
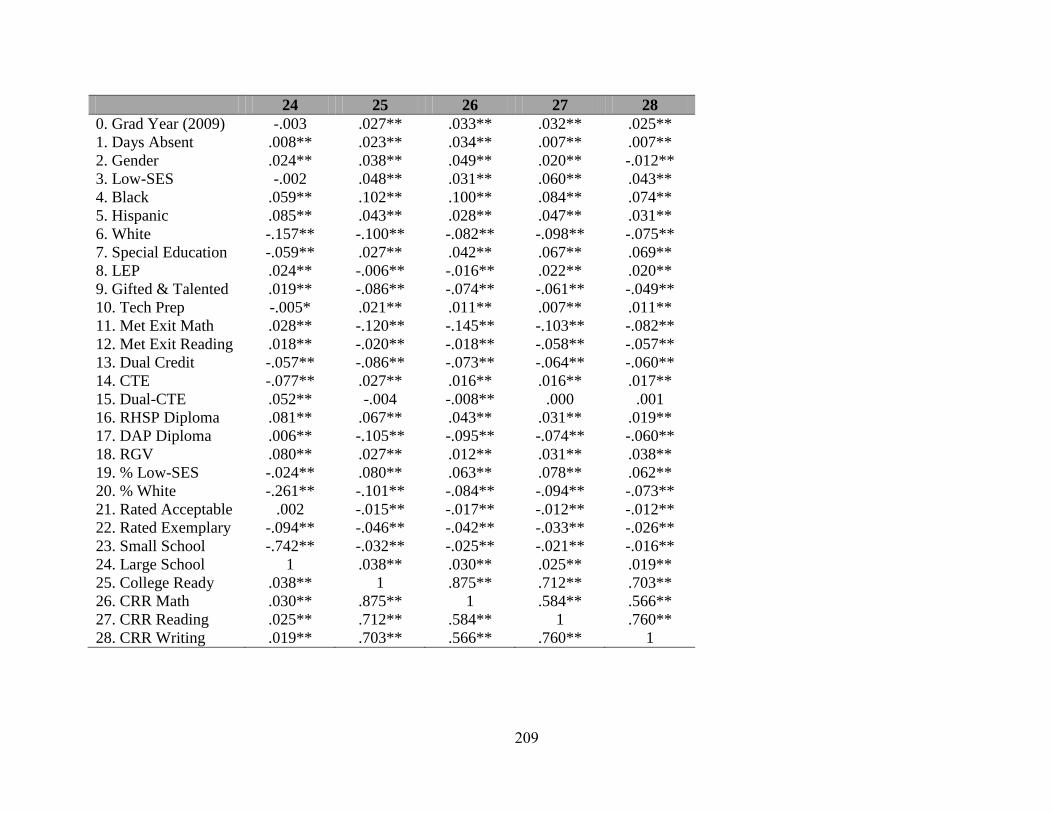
209
24 25 26 27 28
0. Grad Year (2009) -.003 .027** .033** .032** .025**
1. Days Absent .008** .023** .034** .007** .007**
2. Gender .024** .038** .049** .020** -.012**
3. Low-SES -.002 .048** .031** .060** .043**
4. Black .059** .102** .100** .084** .074**
5. Hispanic .085** .043** .028** .047** .031**
6. White -.157** -.100** -.082** -.098** -.075**
7. Special Education -.059** .027** .042** .067** .069**
8. LEP .024** -.006** -.016** .022** .020**
9. Gifted & Talented .019** -.086** -.074** -.061** -.049**
10. Tech Prep -.005* .021** .011** .007** .011**
11. Met Exit Math .028** -.120** -.145** -.103** -.082**
12. Met Exit Reading .018** -.020** -.018** -.058** -.057**
13. Dual Credit -.057** -.086** -.073** -.064** -.060**
14. CTE -.077** .027** .016** .016** .017**
15. Dual-CTE .052** -.004 -.008** .000 .001
16. RHSP Diploma .081** .067** .043** .031** .019**
17. DAP Diploma .006** -.105** -.095** -.074** -.060**
18. RGV .080** .027** .012** .031** .038**
19. % Low-SES -.024** .080** .063** .078** .062**
20. % White -.261** -.101** -.084** -.094** -.073**
21. Rated Acceptable .002 -.015** -.017** -.012** -.012**
22. Rated Exemplary -.094** -.046** -.042** -.033** -.026**
23. Small School -.742** -.032** -.025** -.021** -.016**
24. Large School 1 .038** .030** .025** .019**
25. College Ready .038** 1 .875** .712** .703**
26. CRR Math .030** .875** 1 .584** .566**
27. CRR Reading .025** .712** .584** 1 .760**
28. CRR Writing .019** .703** .566** .760** 1

210
Glossary
Advanced Technical Credit (ATC) courses that allow high schools to offer
credit for enhanced technical content which is taught at the college level by teachers with
special training.
Articulation Agreements authorize dual credit partnerships between high
schools and institutions of higher education. They are the written agreements which plan
what course or courses will be granted credit, what students will be eligible to enroll,
what curriculum will be covered, how credit will be given at both K-12 and higher
education levels, what location(s) courses will be taught at, and who will teach course(s),
and what training requirements will the job(s) require.
Associate of Arts (AA) – known as an associate’s degree, these are typically
granted after a two-year course of study or around 60 semester credit hours. Degrees
include general education requirements, electives, and work towards a specific theme or
major. Most are given out by community and technical colleges.
Bachelor of Arts or Science (BA or BS) known as a bachelor’s degree, these
are typically granted at four-year institutions after a similar length of study, around 120
semester credit hours. While BAs and BSs are the most common degrees, there are
bachelor degrees in other subjects as well. These degrees include course hours in general
education, electives, and a large number of courses in a specific major (concentrated area
of study).
Career and Technical Education (CTE) – formally known as vocational
education, CTE courses and programs focus on hands-on skills, applied sciences and
technologies, and career preparation in coordination with academic study. They are
211
usually organized into 16 Career Clusters which represent an even larger set of career
pathways.17
Carl D. Perkins Legislation are set of federal guidelines and funding allotments
given first to vocational education then to Career and Technology Education (CTE). The
first act was established in 1984; it has been reauthorized in 1990 as Perkins II, 1998 as
Perkins III, 2006 as Perkins IV, and is currently under consideration in the Congress.
Certificate – a higher education credential which is granted following completion
of a specific training program. Most commonly thought of are professional training
programs in technical areas though certificates range in any number of subject areas,
industries, levels, and opportunities. Certificates are also offered as add-ons to other
degree programs such as post-baccalaureate or postgraduate certification. Certifications
tracked in this study only refer to those below the post-baccalaureate level.
College and Career Readiness (CCR) – academic and skill standards in schools
which work towards students being prepared both for postsecondary transitions after high
school as well as career readiness.
College Readiness Standards – refer to the need for developmental education. In
Texas they are measured by the Texas Success Initiative (TSI). TSI sets minimum
requirements for math, reading, and writing at the state level though institutions may set
higher requirements. The TSI refers to both the complex set of state minimum
requirements and the tracking protocols for developmental students.18
17 Career Clusters include: 1) Agriculture, Food, & Natural Resources; 2) Architecture & Construction; 3)
Arts, A/V Technology, & Communications; 4) Business Management & Administration; 5) Education &
Training; 6) Finance; 7) Government & Public Administration; 8) Health Sciences; 9) Hospitality &
Tourism; 10) Human Services; 11) Information Technology; 12) Law, Public Safety, Corrections, &
Security; 13) Manufacturing; 14) Marketing; 15) Science, Technology, Engineering, & Mathematics
(STEM); and 16) Transportation, Distribution, & Logistics. 18 Requirements for meeting TSI obligations are as follows:
212
Developmental Education provides non-credit remediation to help make
students college-ready. It is an umbrella term that defines any assistance, whether it falls
in the regular semester schedule or not, which helps prepare a student for credit-bearing
courses. Its purposes are to help provide the necessary academic supports to improve
basic skills and competencies in subject areas, usually mathematics, reading, and writing.
Distinguished Achievement Program (DAP) – the highest graduation plan in
Texas at the time of study; includes 26 credits in the state-approved curriculum and a
combination of advanced measures (plus any additional district requirements).
Dual Career and Technology Education Credit (Dual-CTE) – refers to CTE
courses which are taken for both high school and higher education credit simultaneously.
Dual Credit – courses which allow students to simultaneously enroll in both high
school and higher education courses earning credit in both.
Foundation High School Plan (FHSP) the new graduation plan in Texas
created in 2013 under House Bill 5. Starting in 2014-2015 freshman entering Texas high
∙ A prior earned degree from an accredited institution;
∙ Transfer student from a private, independent, or out-of-state higher education institution;
∙ Active or veteran military;
∙ Grandfathered exemptions;
∙ Active exit-level state accountability tests or college entrance exam scores; portions of tests may
exempt a student from all TSI standards or only the subject area. Tests include:
∙ State of Texas Assessment of Academic Readiness (STAAR) or Texas Assessment of
Knowledge and Skills (TAKS)
∙ American College Testing (ACT) or Scholastic Assessment Test (SAT) by the College Board;
∙ Completion of college-level coursework in a subject related field including:
∙ Advanced Placement (AP)
∙ International Baccalaureate (IB)
∙ Dual Credit;
∙ Scores set at the institution or by TSI on one or more of possible college ready exams, overall or by
subject area:
∙ Texas Higher Education Assessment (THEA) or Texas Academic Skills Program (TASP)
∙ ACT ASSET or COMPASS tests
∙ Northwest Evaluation Association’s Measures of Academic Progress (MAP)
∙ College Board ACCUPLACER test (THECB, 2015).

213
schools are required to complete a new set of high school graduation plans including the
FHSP, the Foundation High School Plan plus Endorsement (FHSP+), and the Foundation
High School Plan plus Distinguished Level of Achievement (FHSP+DLA). All
graduation plans require students to choose an endorsement, or set of electives related to
a career cluster.
Hierarchical Linear Modeling – a multilevel regression modeling technique
which takes into account the hierarchical or nested structure of data. It allows for the
estimation of variance shared between groups and within groups.
Log Odds - the expected outcome of a logistic model: =
.
Minimum High School Program (MHSP) – the minimum graduation plan in
Texas at the time of study; includes at least 22 credits in the state-approved curriculum
(plus any additional district requirements)
Odds Ratio – the measure of association between a variable and an outcome of
interest. It represents the odds that an outcome will occur compared to the odds it will not
occur. Calculated as:
.
P-16+ Pipeline strategies to unite the educators, administrators, and
policymakers responsible for learning at all levels. They are sets of initiatives which
address disconnects and attempt to integrate the system for greater effectiveness. Named
for the span it connects: pre-kindergarten, elementary, middle, secondary, postsecondary,
and plus (graduate studies or workforce participation).
Probability – the likelihood an outcome will occur; expressed as a number
between 0 and 1; calculated as:
214
Propensity Score Matching – a statistical matching technique meant to limit
selection bias between treatment and control groups. The two step process includes the
creation of a propensity score—an estimation of the probability of treatment—and the
matching of students according to their expected probability using any one of a number
of matching methods (e.g., nearest neighbor). After matching, balancing tests are used to
confirm that the propensity estimation and matching resulted in an unbiased sample based
on the selected covariates.
Recommended High School Program (RHSP) – the college ready graduation
plan in Texas at the time of study; includes 26 credits in the state-approved curriculum
(plus any additional district requirements).
RGV LEAD (Rio Grande Valley Linking Economic & Academic Development)
a regional consortium which works to partner P-16+ resources and institutions. The
partnership includes 32 local school districts, one charter network, five regional
universities and community colleges, the K-12 Education Service Center (ESC), and a
number of business and professional organizations representing the economic needs of
the Texas Rio Grande Valley area. The alliance provides resources, funding, and support
services to Tech Prep programming in high schools, hosts scholarships for graduating
students, and creates opportunities for mentoring and early exposure in career pathways.
Rio Grande Valley (RGV) – a four-county area located along the southernmost tip
of Texas; the counties include Starr, Hidalgo, Willacy, and Cameron counties.
Tech Prep part of a regimented CTE course plan; programs consist of a planned
sequence of study in a defined field during high school which includes secondary training
and leaves the student with some form of postsecondary credential upon completion.
Tech Prep programs involve complex articulation agreements and partnerships with high
215
schools, higher education providers, and local industries to fully implement and involve
students in the curriculum.
Texas Assessments of Knowledge and Skills (TAKS) – The Texas State
accountability test given to students in the years between 2003-2011. The test was given
to students in grades 3, 5, 6, 7, 8, 9, 10, and 11 and consisted of mathematics and reading,
as well as writing, social studies, and science in some years. Exit-level tests were given to
students for the first time in their junior year (11th
grade). Exit tests consisted of the
following subjects: mathematics, reading, and writing. Students were required to pass
exit-level tests to graduate and were given several opportunities to retake the tests if they
failed the first sitting. For analysis in this study, the variable refers only to the first test
sitting of the exit-level tests.
Texas Education Agency (TEA) – the Texas State agency which oversees K-12
education and collects data on primary and secondary students.
Texas Education Research Center (ERC) the Texas ERC, located at The
University of Texas at Austin, is a research center that supports scientific inquiry and
data-driven policy analysis using a clearinghouse of state level information. The Texas
ERC provides access to high quality, longitudinal data from K-12, higher education, and
workforce agencies.
Texas Higher Education Coordinating Board (THECB) the Texas State
agency which oversees postsecondary education institutions and collects data on higher
education enrollment, persistence, and attainment.
Texas Workforce Commission (TWC) the state agency which oversees labor in
Texas; collects quarterly unemployment or wage data as well as conducting workforce
needs analysis.
216
References
1950 Act to Incorporate the Future Farmers of America, PL740
Adelman, C. (2006). The toolbox revisited: Paths to degree completion from high School
through college. Washington, DC: U.S. Department of Education
Alexson, R. G., & Kemnitz, C. P. (2004). Curriculum articulation and transitioning
student success: Where are we going wrong and what lessons have we learned?
Educational Research Quarterly, 28(2), 19.
Aliaga, O. A., Kotamraju, P., Stone, J. R.. (2014). Understanding participation in
secondary career and technical education in the 21st century: Implications for
policy and practice. The High School Journal, 97(3), 128-158.
doi:10.1353/hsj.2014.0002
Allen, D. (2010). Dual enrollment: A comprehensive literature review & bibliography.
New York, NY: The City University of New York. Retrieved from
http://www.cuny.edu/academics/k-to-
12/databook/library/DE_LitReview_August2010.pdf
Allen, L. (2012). Back on track through college in the Rio Grande Valley: From dropout
recovery and postsecondary success. Washington DC: Jobs For The Future.
Amey, M. J., Eddy, P. L., & Campbell, T. G. (2010). Crossing boundaries creating
community college partnerships to promote educational transitions. Community
College Review, 37(4), 333-347. doi:10.1177/0091552110365725
An, B. P. (2013). The impact of dual enrollment on college degree attainment: Do low-
ses students benefit? Educational Evaluation and Policy Analysis, 35(1), 57-75.
doi:10.3102/0162373712461933
Anderson, S. (2008). Math infusion in agricultural education and career and technical
education in rural schools. Rural Educator [H.W. Wilson - EDUC], 30(1), 1.
Aragon, S. R., Alfeld, C., & Hansen, D. M. (2013). Benefits of career and technical
student organizations' on female and racial minority students' psychosocial and
achievement outcomes. Career and Technical Education Research, 38(2), 105-
124. doi:10.5328/cter38.2.105
217
Asunda, P. A., Finnell, A. M., & Berry, N. R. (2015). Integration of the common core
state standards into CTE: Challenges and strategies of career and technical
teachers. Career and Technical Education Research, 40(1), 48-62.
doi:10.5328/cter40.1.48
Austin, P. S. (2011). An introduction to propensity score methods for reducing the effects
of confounding variables in observational studies. Multivariate Behavior
Research, 46(3), 399-424. doi:10.1080/00273171.2011.568786
Bailey, T. (2009). Bridging the high-school divide. In Ladd, H. F., & Fiske, E.B. (Eds.)
Handbook of Research in Education Finance and Policy (pp. 724-737). New
York, NY: Routledge.
Bailey, T. (2009). Challenge and opportunity: rethinking the role and function of
developmental education in community college. New Directions for Community
Colleges, 145, 11-30.
Bailey, T. R., & Karp, M. M (2003). Promoting college access and success: A review o f
credit-based transition programs. Washington DC: U.S. Department of
Education, Office of Vocational and Adult Education.
Bailey, T. R., Hughes, K. L., & Karp, M. M. (2002). What role can dual enrollment
programs play in easing the transition between high school and postsecondary
education? Journal for Vocational Special Needs Education, 24(2-3), 18.
Bartlett, K. R., Schleif, N. L., & Bowen, M. M. (2011). The use of workforce assessment
as a component of career and technical education program evaluation. Career and
Technical Education Research, 36(2), 105-118. doi:10.5328/cter36.2.105
Beaumont, R. (1995). Tech prep and school to work: Working together to foster
educational reform. The High School Journal, 79(2), 107-112.
Becker, G. S. (1964). Human capital: A theoretical and empirical analysis. New York:
Columbia University Press.
Becker, G. S. (1993). Human capital: A theoretical and empirical analysis, with special
reference to education (3rd ed.). New York: Columbia University Press.
Benson, A. D., Johnson, S. D., Duncan, J., Shinkareva, O. N., Taylor, G. D., & Treat, T.
(2008). Community college participation in distance learning for career and
technical education. Community College Journal of Research and Practice, 32(9),
665-687. doi:10.1080/10668920600859848
218
Berger, N. & Fisher, P (2012). A well-educated state is key to state prosperity.
Washington DC: Economic Analysis and Research Network.
Bishop, J. H., & Mane, F. (2004). The impacts of career-technical education on high
school labor market success. Economics of Education Review, 23(4), 381-402.
doi:10.1016/j.econedurev.2004.04.001
Black, S.E., Lincove, J., Cullinane, J., & Veron, R. (2015). Can you leave high school
behind? Economics of Education Review, 46, 52-63.
Boden, K. (2011). Perceived academic preparedness of first-generation Latino college
students. Journal of Hispanic Higher Education, 10(2), 96-106.
doi:10.1177/1538192711402211
Boudria, T. J. (2002). Implementing a project-based technology program for high school
women. Community College Journal of Research and Practice, 26(9), 709-722.
doi:10.1080/10668920290111293
Boyd, R. E., Martin, S. A., Davenport, A. F. Smith, A. B. (2015, November 2) Speaker
Ryan’s education outlook; CTE reauthorization; Department publishes cash
management/REPAYE final rules. Chicago, IL: The National Law Review.
Retrieved online from: http://www.natlawreview.com/article/speaker-ryan-s-
education-outlook-cte-reauthorization-department-publishes-cash
Bozick, R., & Dalton, B. (2013;2012;). Balancing career and technical education with
academic coursework: The consequences for mathematics achievement in high
school. Educational Evaluation and Policy Analysis, 35(2), 123-138.
doi:10.3102/0162373712453870
Bragg, D. D. (2000). Maximizing the benefits of Tech‐Prep initiatives for high school
students. New Directions for Community Colleges, 2000(111), 23-30.
doi:10.1002/cc.11103
Bragg, D. D. (2006). Transitions to college: Academic pathways from high school to the
community college. Journal of Applied Research in the Community College,
13(2), 117.
Bragg, D. D., & Durham, B. (2012). Perspectives on access and equity in the era of
(community) college completion. Community College Review, 40(2), 106-125.
Bragg, D. D., & Layton, J. D. (1995). Tech prep implementation in the United States:
The once and future role of community colleges. Community College Review,
22(4), 3-16. doi:10.1177/009155219502200402
219
Bragg, D. D., & Layton, J. D. (1995). The role of the urban community college in
educational reform. Education and Urban Society, 27(3), 294-312.
doi:10.1177/0013124595027003005
Bragg, D. D., Loeb, J. W., Gong, Y., Deng, C-P., Yoo, J., & Hill, J. L. (2002). Transition
from high school to college and work for tech prep participants in eight selected
consortia. St. Paul, MN: National Research Center for Career and Technical
Education, University of Minnesota. Retrieved from:
http://www.nccte.org/publications/infosynthesis/r%26dreportrTransition-
Bragg%20ALL.pdf
Bragg, D., & Reger, W. (2002). New lessons about tech prep implementation: Changes in
eight selected consortia since reauthorization o f the federal tech prep legislation
in 1998. St. Paul, MN: University of Minnesota, National Research Center for
Career and Technical Education.
Brown, B.L. (2003). The benefits of career and technical education. Trends and issues
alert. Clearinghouse on Adult, Career, and Vocational Education, 49.
Brown, C. G., & Schwartz, R. (2014). College prep for all? Education Next, 14(3), 56-60.
Brown, C. H. (2001). Two‐Year colleges and tech prep partnerships: A Texas
perspective. New Directions for Community Colleges, 2001(115), 51-62.
doi:10.1002/cc.30
Brown, J. (2015) RGV LEAD’s 2015 regional data report. Austin, TX: The Texas
Education Research Center.
Brown, J., & Alexander, C. (2014) RGV LEAD’s 2014 regional data report. Austin, TX:
The Texas Education Research Center.
Brush, M. (2008). 50 state comparison: Career/technical education: Tech prep or similar
focus (2+2). Denver, CO: Education Commission of the States
Caliendo, M., & Kopeinig, S. (2005, May). Some practical guidance for the
implementation of propensity score matching (IZA DP No. 1588). Berlin,
Germany: Forschungsinstitut zur Zukunft der Arbeit Institute for the Study of
Labor.
Callan, P. M., Finney, J. E., Kirst, M. W., Usdan, M. D., & Venezia, A. (2006). Claiming
common ground: State policymaking for improving college readiness and success.
San Jose, CA: National Center for Public Policy and Higher Education.
220
Cantor, J. A. (1999). Tech prep as a catalyst for community college instructional program
development. Community College Journal of Research and Practice, 23(4), 357-
369. doi:10.1080/106689299264765
Carl D. Perkins Career and Technical Education Act of 2006, PL209-270
Carl D. Perkins Vocational and Applied Technology Act of 1990, PL101-392
Carl D. Perkins Vocational and Technical Education Act of 1998, PL10S-332
Carl D. Perkins Vocational Education Act of 1984, PL98-524
Carnevale, A.P., Smith, N., & Strohl, J. (2010). Help wanted: Projections of jobs and
education requirements through 2018. Washington DC: Center on Education and
the Workforce.
Carnoy, M. (2009). Policy research in education: The economic view. In Sykes, G.,
Schneider, B., & Plank, D. N. (Eds.), Handbook of Education Policy Research.
(pp. 27-38). New York, NY: Routledge. 27-38
Castellano, M., Harrison, L., & Schneider, S. (2008). State secondary career and
technical education standards: Creating a framework from a patchwork of
policies. Career and Technical Education Research, 33(1), 25-44.
doi:10.5328/CTER33.1.25
Castellano, M., Stringfield, S., & Stone, J. R. (2003). Secondary career and technical
education and comprehensive school reform: Implications for research and
practice. Review of Educational Research, 73(2), 231-272.
doi:10.3102/00346543073002231
Castellano, M., Sundell, K., Overman, L. T., & Aliaga, O. A. (2012). Do career and
technical education programs of study improve student achievement? preliminary
analyses from a rigorous longitudinal study. International Journal of Educational
Reform, 21(2), 98.
Castells, M. (2010). The rise of the network society: The information age: Economy,
society, and culture volume I (2nd Ed.). Malden, MA: Wiley-Blackwell.
Cellini, S. R. (2006). Smoothing the transition to college? The effect of tech-prep
programs on educational attainment. Economics of Education Review, 25(4), 394-
411. doi:10.1016/j.econedurev.2005.07.006
221
Chadd, J., & Drage, K. (2006). No child left behind: Implications for career and technical
education. Career and Technical Education Research, 31(2), 79-99.
doi:10.5328/CTER31.2.79
Choy, A. (2001). Students whose parents did not go to college: Postsecondary access,
persistence, and attainment: Findings from the condition of education.
Washington DC: National Center for Education Statistics.
Clark, R. W. (2001, June). Dual credit: A report o f programs and policies that offer high
school students college credits. Seattle, WA: University o f Washington: Institute
for Educational Inquiry.
Cohen, J., Cohen, P., West, S. G., & Aiken, L. S. (2003). Applied multiple
regression/correlation analysis for the behavioral sciences (3rd ed.). NJ:
Erlbaum.
Collins, M.L. (2009). Setting up success in developmental education: How state policy
can help community colleges improve student outcomes. Boston, MA: Jobs For
the Future.
Compton, J. I., Laanan, F. S., & Starobin, S. S. (2010). Career and technical education as
pathways: Factors influencing postcollege earnings of selected career clusters.
Journal of Education for Students Placed at Risk (JESPAR), 15(1), 93-113.
doi:10.1080/10824661003635044
Conger, D. (2015). High school grades, admission policies, and the gender gap in college
enrollment. Economics of Education Review, 46, 144-147.
Corwin, S. H. (1995). Tech prep - an education that really works. Educational Horizons,
73(4), 181.
Cox, E. D., Hernández-Gantes, V. M., & Fletcher, J., Edward C. (2015). Student
participation in career academies within a school district: Who participates, what
makes a difference? Career and Technical Education Research, 40(1), 11-27.
doi:10.5328/cter40.1.11
Crist, C., Jacquart, M., & Shupe, D. A. (2002). Improving the performance of high school
students: Focusing on connections and transitions taking place in Minnesota.
Journal for Vocational Special Needs Education, 24(2-3), 41.
D'Amico, M. M., Morgan, G. B., Katsinas, S. G., & Friedel, J. N. (2015). State director
views on community college workforce development. Career and Technical
Education Research, 39(3), 191-211. doi:10.5328/cter39.3.191
222
Dare, D. E. (2006). The role of career and technical education in facilitating student
transitions to postsecondary education. New Directions for Community Colleges,
2006(135), 73-80. doi:10.1002/cc.249
Deming, D.J., Cohods, S., Jennings, J., & Jencks, C. (2016). School accountability,
postsecondary attainment, and earnings. The Review of Economics and Statistics,
0, 0. doi:10.1162/REST_a_00598.
Dewey, J. (2004). Democracy and education. Mineoloa, NY: Dover Publications, Inc.
(Original work published 1909).
Dickert-Conlin, S., & Rubenstein, R. (2007). Economic inequality and higher education:
Access, persistence, and success. New York: Russell Sage Foundation.
Draeger, M. (2006). How students benefit from high‐tech, high‐wage career pathways.
New Directions for Community Colleges, 2006(135), 81-89. doi:10.1002/cc.250
Eardley, E., & Manvell, J. (2006). Legal remedies for girls' under-representation in
nontraditional career and technical education. International Journal of Manpower,
27(4), 396-416. doi:10.1108/01437720610679232
Educational Service Center 20. (2016). House Bill 5. San Antonio, TX: Author. Retrieved
from: http://www.esc20.net/default.aspx?name=ais_sup.HB5
Egalite, A.J., & Kisida, B. (2016). School size and student achievement: A longitudinal
analysis. School Effectiveness and School Improvement, 27(3), 406-417.
doi:10.1080/09243453.2016.1190385
Elementary and Secondary Education Act of 1965, PL89-10
Enders, C. K. (2010). Applied missing data analysis. New York: Guilford Press.
Engberg, M.E., & Wolniak, G.C. (2010). Examining the effects of high school contexts
on postsecondary enrollment. Research in Higher Education, 51, 132-153.
doi:10.1007/s11162-009-9150-y
Erisman, W., & Looney, S. (2007). Opening the door to the American dream: Increasing
higher education access and success for immigrants. Washington DC: Institute
for Higher Education Policy.
Esters, L. T., & Retallick, M. S. (2013). Effect of an experiential and work-based learning
program on vocational identity, career decision self-efficacy, and career maturity.
Career and Technical Education Research, 38(1), 69-83. doi:10.5328/cter38.1.69
223
Every Student Succeeds Act of 2015, PL114-95
Executive Office of the President (2014). Increasing college opportunity for low-income
students: Promising models and a call to action. Washington DC: Author.
Exex. Order No. 13697, 80 Fed. Reg. 36689 (June 25, 2015).
Farmer, E.I, & Honeycutt, D. (1999). community college administrators and faculty
opinions of tech prep. Community College Journal of Research and Practice,
23(8), 717-725. doi:10.1080/106689299264413
Field, D. W. (2003). Applied technology proficiency of high school students in applied
and traditional courses. Journal of Vocational Education Research, 28, 15-34.
Fishman, D. (2015). School reform for rural America: Innovate with charters, expand
career and technical education. Education Next, 15(3), 8.
Fitzsimmons, J. (1999). Maine technical college system: "building bridges". Community
College Journal of Research and Practice, 23(3), 227-241.
doi:10.1080/106689299264864
Florida Department of Education (2016). FETPIP methodology. Tallahassee, FL: Author.
Retrieved from: http://www.fldoe.org/accountability/fl-edu-training-placement-
info-program/fetpip-methodology.stml#what
Fowler, C. H., Test, D. W., Cease-Cook, J., Toms, O., Bartholomew, A., & Scroggins, L.
(2014). Policy implications of high school reform on college and career readiness
of youth with disabilities. Journal of Disability Policy Studies, 25(1), 19-29.
doi:10.1177/1044207313518072
Fowler, M., & Luna, G. (2009). High school and college partnerships: Credit-based
transition programs. American Secondary Education, 38(1), 62-76.
Frempong, G., Xin, M. & Mensah, J. (2011). Access to postsecondary education: Can
schools compensate for socioeconomic disadvantage? Higher Education, 63, 19-
32. doi:10.1007/s10734-011-9422-2
Friedel, J. N. (2011). Where has vocational education gone? The impact of federal
legislation on the expectations, design, and function of vocational education as
reflected in the reauthorization of the Carl D. Perkins career and technical
education act of 2006. American Educational History Journal, 38(1-2), 37.
224
Fritz, C. O., Morris, P. E., & Richler, J. J. (2012). Effect size estimates: Current use,
calculations, and interpretations. Journal of Experimental Psychology: General.
141(1), 2-18. doi:10.1037/a0024338
Garrison-Wade, D. F., & Lehmann, J. P. (2009). A conceptual framework for
understanding students' with disabilities transition to community college.
Community College Journal of Research and Practice, 33(5), 415-443.
doi:10.1080/10668920802640079
Gelman, A., & Hill, J. (2007). Data analysis using regression and multilevel/hierarchical
models. New York, NY: Cambridge University Press.
Gemici, S., & Rojewski, J. W. (2007). Evaluating research in career and technical
education using scientifically-based research standards. Career and Technical
Education Research, 32(3), 143-159. doi:10.5328/CTER32.3.143
Gemici, S., Rojewski, J. W., & Lee, I. H. (2012). Treatment of missing data in workforce
education research. Career and Technical Education Research, 37(1), 75-99.
doi:10.5328/cter37.1.75
Gentry, M., Hu, S., Peters, S. J., & Rizza, M. (2008). Talented students in an exemplary
career and technical education school: A qualitative inquiry. Gifted Child
Quarterly, 52(3), 183-198. doi:10.1177/0016986208319300
Gentry, M., Peters, S. J., & Mann, R. L. (2007). Differences between general and talented
students' perceptions of their career and technical education experiences
compared to their traditional high school experiences. Journal of Advanced
Academics, 18(3), 372.
George-Barden Act of 1946, PL79-586
George-Deen Act of 1936, PL74-673
George-Ellzey Act of 1934, PL73-245
George-Reed Act of 1929, PL70-702
Giani, M., Alexander, C., & Reyes, P. (2014). Exploring variation in the impact of dual-
credit coursework on postsecondary outcomes: A quasi-experimental analysis of
Texas students. The High School Journal, 97(4), 200-218.
Gilbert, S. W. (1997). Integrating tech prep into science teacher preparation. School
Science and Mathematics, 97(4), 206-211. doi:10.1111/j.1949-
8594.1997.tb17368.x
225
Glassman, M. (2001). Dewey and Vgotsky: Society, experience, and inquiry in
educational practice. Educational Researcher, 30(4), 3-14.
doi:10.3102/0013189X030004003
Goldberg, J., & Smith, J. (2008). The effects of education on labor market outcomes. In
Ladd, H. F., & Fiske, E.B. (Eds.) Handbook of Research in Education Finance
and Policy (pp. 688-708). New York, NY: Routledge.
Gottfried, M. A., Bozick, R., Rose, E., & Moore, R. (2014). Does career and technical
education strengthen the STEM pipeline? comparing students with and without
disabilities. Journal of Disability Policy Studies, 1-13.
doi:10.1177/1044207314544369
Greenstone, M., Harris, M., Li, K., Looney, A, & Patashnick, J. (2012). A dozen
economic facts about k-12 education. Washington DC: The Hamilton Project.
Grossman, M, & Kaestner, R. (1997). Effects of education on health. In Behrman, J. R.,
& Nevzer, S. (Eds.) The Social Benefits of Education. Ann Arbor, MI: University
of Michigan Press.
Grubb, W. N. (1999). Learning and earning in the middle part I: The economic benefits
of a sub-baccalaureate education. Economics of Education Review, 21(4), 299-
321.
Grubb, W. N. (1999). Learning and earning in the middle part II: The economic benefits
of a sub-baccalaureate education. Economics of Education Review, 21(5), 401-14.
Guo, S., & Fraser, M. (2010). Propensity score analysis: Statistical methods and
applications. Thousand Oaks, CA: Sage Publications.
Haag, P. W. (2015). The challenges of career and technical education concurrent
enrollment: An administrative perspective. New Directions for Community
Colleges, 2015(169), 51.
Hanushek, E. A., & Woessmann, L. (2010). Education and economic growth. In Brewer,
D. J., & McEwan, P.J. (Eds.) Economics of Education, 60-67. Amsterdam:
Elsevier.
Hanushek, E. A., Ruhose, J., & Woessmann, L. (2015). Human capital quality and
aggregate income differences: Development accounting for U.S. states (NBER
Working Paper No. 21295). Cambridge, MA: National Bureau of Economic
Research.
226
Harnish, D., & Lynch, R. L. (2005). Secondary to postsecondary technical education
transitions: An exploratory study of dual enrollment in Georgia. Career and
Technical Education Research, 30(3), 169.
Hart, P.D. (2005). Rising to the challenge: Are high school graduates prepared for
college and work? A study of recent high school graduates, college instructors
and employers. Washington DC: Achieve, Inc.
Haskell, K. S., & Haskell, T. O. (2008). What differences technology makes for a high
school career center. Theory into Practice, 47(3), 252-252.
doi:10.1080/00405840802154013
Haviland, A., Nagin, D. S., & Rosenbaum, P. R. (2007). Combining propensity score
matching and group-based trajectory analysis in an observational study.
Psychological Methods, 12, 247-267.
HB2401. 76th
Legislative Session of the Texas State Legislature. (1999).
HB5. 83rd
Legislative Session of the Texas State Legislature. (2013).
Heckman, J., LaLonde, R., & Smith, J. (1999). The economics and econometrics of
active labor market programs. In O. C. Ashenfelter & D. Card (Eds.), Handbook
of Labor Economics (pp. 1865-2097). Amsterdam: Elsevier.
Herr, E. L. (1997). Education as preparation for work: Contributions of career education
and vocational education. Journal of Career Development, 13(3), 16-30.
Hershey, A.M., Silverberg, M.K., Owens, T., and Hulsey, L.K. (1998). Focus for the
Future: The Final Report of the National Tech-Prep Evaluation. Princeton, NJ:
Mathematica Policy Research, Inc.
Hirschy, A. S., Bremer, C. D., & Castellano, M. (2011). Career and technical education
(CTE) student success in community colleges: A conceptual model. Community
College Review, 39(3), 296-318. doi:10.1177/0091552111416349
Hoffman, N., Vargas, J., & Santos, J. (2009). New directions for dual enrollment:
Creating stronger pathways from high school through college. New Directions for
Community Colleges, 145, 43-58.
Hughes, J. N., Chen, Q., Thoemmes, F., & Kwok, O. M. (2010). An investigation of the
relationship between retention in first grade and performance on high stakes tests
in third grade. Educational Evaluation and Policy Analysis, 32, 166–182.
doi:10.3102/0162373710367682
227
Hutchins, B. C., & Akos, P. (2013). Rural high school youth's access to and use of
School‐to‐Work programs. The Career Development Quarterly, 61(3), 210-225.
doi:10.1002/j.2161-0045.2013.00050.x
Israel, G. D., Myers, B. E., Lamm, A. J., & Galindo-Gonzalez, S. (2012). CTE students
and science achievement: Does type of coursework and occupational cluster
matter? Career and Technical Education Research, 37(1), 3-20.
doi:10.5328/cter37.1.3
Kao, G., & Thompson, J. S. (2003). Racial and ethnic stratification in educational
achievement and attainment. Annual Review of Sociology, 29, 417-442.
Karandjeff, K., & Schiorring, E. (2011). Career and technical education (CTE) transfer
research project: Improving transfer pathways for California community college
students in CTE programs. Journal of Applied Research in the Community
College, 18(2), 42.
Karp, M. M., & Jeong, D. W. (2008). Conducting research to answer your questions
about dual enrollment. New York, NY: U.S. Department of Education.
Kelly, S. , & Price, H. (2009). Vocational education: A clean slate for disengaged
students? Social Science Research, 38, 810-825.
doi:10.1016/j.ssresearch.2009.05.002
Kim, J. (2014). Relationship of tech prep and dual credit to college readiness and
retention. College Student Journal, 48(3), 337.
Kim, J., & Bragg, D. D. (2008). The impact of dual and articulated credit on college
readiness and retention in four community colleges. Career and Technical
Education Research, 33(2), 133-158. doi:10.5328/CTER33.2.133
King, S. B., & West, D. (2009). Statewide articulation agreements between high schools
and community college career and technical programs. Community College
Journal of Research and Practice, 33(6), 527. doi:10.1080/10668920802662438
Kirst, M. W., Venezia, A., & Nodine, T. (2009). State policy to support college-going
high schools for underserved students. In State policy and early college high
schools: The case of California. Symposium conducted at American Educational
Research Association, San Deigo, CA.
228
Klein, A. (2015, October 21). Congress set to begin work on career and technical
education programs. Education Week. Retrieved online from:
http://blogs.edweek.org/edweek/campaign-k-
12/2015/10/congress_set_to_begin_work_on_.html
Klein, S., Richards, A., White, R., Staklis, S., Alfeld, C., Dailey, C.R., Charner, I., &
Poliakoff, A. (2014). Evaluation of the implementation of the Carl D. Perkins
Career and Technical Education Act of 2006: Finance, accountability, and
programs of study. Research Triangle Park, NC: RTI International.
Kleiner, B., & Lewis, L. (2009). Dual enrollment of high school students at
postsecondary institutions: 2002-2003. Washington DC: U.S. Department of
Education.
Kompelien, K. S. (1996). Focusing on coherent career plans: The fifth C of career
planning programs. Journal of Career Development, 23(1), 51-60.
doi:10.1007/BF02471269
Kreft, I., & D Leeuw, J. (1998). Introducing multilevel modeling. London: Sage.
Krueger, C. (2001). P-16: Building a cohesive education system from preschool through
postsecondary. Peer Review, 4(1).
Laanan, F. S., Compton, J. I., & Friedel, J. N. (2006). The role of career and technical
education in iowa community colleges. Community College Journal of Research
and Practice, 30(4), 293-310. doi:10.1080/10668920500479184
Lambeth, J. M., Joerger, R. M., & Elliot, J. (2009). Implications for focusing research in
career and technical education and workforce development. Career and Technical
Education Research, 34(3), 137-153. doi:10.5328/CTER34.3.137
Lazarick, L. (1997). Back to the basics: Remedial education. Community College
Journal, 11-15.
Lee, I. H. (2012). Strategies for handling missing data with maximum likelihood
estimation in career and technical education research. Career and Technical
Education Research, 37(3), 297-310. doi:10.5328/cter37.3.297
Lee, V., & Loeb, S. (2000). School size effect in Chicago elementary schools: Effects on
teachers’ attitudes and students’ achievement. American Educational Research
Journal, 37, 3–31.
Leithwood, K. & Jantzi, D. (2009). A review of empirical evidence about school size
effects: A policy perspective. Review of Education Research, 79(1), 464-490.
229
Lerner, J.B., & Brand, B. (2006). The college ladder: Linking secondary and
postsecondary education for success for all students. Washington DC: American
Youth Policy Forum.
Lewis, M. V. (2008). Effectiveness of previous initiatives similar to programs of study:
Tech prep, career pathways, and youth apprenticeships. Career and Technical
Education Research, 33(3), 165-188. doi:10.5328/CTER33.3.165
Lewis, M. V., & James R Stone III. (2013). Perspectives in HRDOrigins, chronology,
and current status of the national research center for career and technical
education: 1963-2012. New Horizons in Adult Education & Human Resource
Development, 25(2), 107.
Lewis, M. V., & Overman, L. (2008). Dual and concurrent enrollment and transition to
postsecondary education. Career and Technical Education Research, 33(3), 189-
202. doi:10.5328/CTER33.3.189
Lewis, M. V., & Stone, J. R., III. (2013). Origins, chronology, and current status of the
national research center for career and technical education: 1963-2012. New
Horizons in Adult Education & Human Resource Development, 25(2), 107.
Lleras-Muney, A. (2005). The relationship between education and adult mortality in the
United States. Review of Economic Studies, 72(1), 189–221.
Lochner, L., & Moretti, E. (2004). The effect of education on crime: Evidence from
prison inmates, arrests, and self-reports. The American Economic Review, 94(1),
155–189.
Loera, G., Nakamoto, J., Oh, Y. J., & Rueda, R. (2013). Factors that promote motivation
and academic engagement in a career technical education context. Career and
Technical Education Research, 38(3), 173-190. doi:10.5328/cter38.3.173
Long, M.C., Conger, D., & Iatorola, P. (2012). Effects of high school course-takings on
secondary and postsecondary success. American Educational Research Journal,
49 (2), 285-322).
Lowell, A. (1995). Implementing the technology preparation (tech-prep) curriculum.
Journal of Technology Studies, 21(1), 48-58.
Lumina Foundation. (2015). A stronger nation through higher education: Ten-year time
horizon brings Goal 2025into sharp focus. Indianapolis, IN: Author.
Lynch, R. (2004). Rethinking growth strategies: How state and local taxes and services
affect economic development. Washington DC: Economic Policy Institute.
230
Maguire, K. J., Starobin, S. S., Laanan, F. S., & Friedel, J. N. (2012). Measuring the
accountability of CTE programs: Factors that influence postcollege earnings
among community college students. Career and Technical Education Research,
37(3), 235-261. doi:10.5328/cter37.3.235
Mane, F. (1999). Trends in the payoff to academic and occupation-specific skills: The
short and medium run returns to academic and vocational high school courses for
non-college bound students. Economics of Education Review, 18, 417-437.
Manley, R. A. (2011). The decentralization of Perkins: History, impact, and
recommendations for future CTE legislation. Career and Technical Education
Research, 36(2), 119-152. doi:10.5328/cter36.2.119
Marsh, J. A. (2000, September). Connecting districts to the policy dialogue: A review of
literature on the relationship of districts with states, schools, and communities
(W-00-1). Seattle, WA: Center for the Study of Teaching and Policy.
McCharen, B. (2008). The success of implementing programs of study in health careers
through career clusters and pathways. Career and Technical Education Research,
33(3), 203-215. doi:10.5328/CTER33.3.203
McClafferty Jarsky, K., McDonough, P. M., & Núñez, A. (2009). Establishing a college
culture in secondary schools through P-20 collaboration: A case study. Journal of
Hispanic Higher Education,8(4), 357-373.
McDavid, J. A., Boggs, B. D., & Stumpf, D. (2005). Mississippi tech-prep coordinators:
Identifying challenges of the job. Community College Journal of Research and
Practice, 29(4), 277-288. doi:10.1080/10668920590911869
McDonald, B. M. (2011). Career satisfaction following technical education. Career and
Technical Education Research, 36(3), 155-170. doi:10.5328/cter36.3.155
McSwain, C., & Davis, R. (2007). College access for the working poor: Overcoming
burdens to succeed in higher education. Washington DC: Institute for Higher
Education Policy.
Meer, J. (2007). Evidence on the returns to secondary vocational education. Economics of
Education Review, 26, 559-573. doi:10.1016/j.econedurev.2006.04.002
Melguizo, T., Kienzl, G. S., & Alfonso, M. (2011). Comparing the educational attainment
of community college transfer students and four-year college rising juniors using
propensity score matching methods. The Journal of Higher Education, 82(3),
265-291.
231
Mincer, J. (1974). Schooling, experience, and earnings. New York, NY: Columbia
University Press for the National Bureau of Economic Research.
Mincer, J. (1989). Human capital and the labor market: A review of current research.
Educational Researcher, 18, 27-34.
Mishook, J., Gurantz, O., Borsato, G. N., Hewitson, M., Martinez, M., McGinnis, E., et
al. (2012). College readiness indicator. Providence, RI: Annenberg Institute,
Brown University. Retrieved from
http://annenberginstitute.org/sites/default/files/VUE35a.pdf
Moran, C., Cooper, C. R., López, A., & Goza, B. (2009). Developing effective P-20
partnerships to benefit Chicano/Latino students and families. Journal of Hispanic
Higher Education, 8(4), 340-356.
Murnane, R. J., & Levy, F. (1996). Teaching the new basic skills: Principles for
educating children to thrive in a changing economy. New York: Free Press.
Mustian, A., Mazzotti, V. L., & Test, D. W. (2013). Disseminating evidence-based
practices in secondary transition. Journal of Positive Behavior Interventions,
15(4), 197-204.
National Assessment of Career and Technical Education (NACTE). (2014). National
assessment of career and technical education: Final report. Washington DC: U.S.
Department of Education.
National Assessment of Career and Technical Education (NACTE). (2014). Putting
“career” in “college and career ready”: The report of the independent advisory
panel of the National assessment of career and technical education. Washington
DC: U.S. Department of Education.
National Association of Manufacturers, Manufacturing Institute’s Center for Workforce
Success, and Deloitte Consulting. (2005). 2005 skills gap report: A survey of the
American manufacturing workforce. New York: Deloitte Development LLC.
National Center for Public Policy and Higher Education. (2008). Measuring up: The
national report card on higher education. San Jose, CA: Author.
National Center on Education and the Economy. (1990). Commission on the skills of the
American workforce. America's choice: High skills or low wages: The report of
the Commission on the skills of the American workforce. Rochester, NY: Author.
National Governor’s Association. (2014). America works: Education and training for
tomorrow’s jobs. Washington DC: Author.
232
Neild, R. C., Boccanfuso, C., & Byrnes, V. (2015). Academic impacts of career and
technical schools. Career and Technical Education Research, 40(1), 28-47.
doi:10.5328/cter40.1.28
Neild, R.C., & Byrnes, V. (2014). Impacts of career and technical schools on
postsecondary outcomes: A case study of a large urban school district. Baltimore,
MD: Center for Social Organization of Schools, Everyone Graduates Center—
Johns Hopkins University.
Nelson, C. H. (1994). Tech prep in Texas: An implementation strategy. Community
College Journal of Research and Practice, 1994(18), 99–112.
Neumark, D., & Joyce, M. (2001). Evaluating school-to-work programs using the new
NLSY. Journal of Human Resources, 36(4), 666–702.
Neumark, D., & Rothstein, D., 2004. School-to-career programs and transitions to
employment and higher education. Unpublished manuscript.
Nimon, K. (2012). To aggregate or not and potentially better questions for clustered data:
The need for hierarchical linear modeling in CTE research. Career and Technical
Education Research, 37(3), 213-233. doi:10.5328/cter37.3.213
Office of Career , Technical, and Adult Education (2016). Tech prep education. U.S.
Department of Education. Washington DC: U.S. Department of Education.
Retrieved online from:
https://www2.ed.gov/about/offices/list/ovae/pi/cte/techprep.html
Organization for Economic Cooperation and Development (2014). Education at a glance
2014. Paris, France: Author. Retrieved from:
http://www.oecd.org/edu/United%20States-EAG2014-Country-Note.pdf
Organization for Economic Cooperation and Development (2016). The economic impact
of ICT: Measurement, evidence and implications. Paris, France: Author.
Retrieved from:
http://www.oecd.org/sti/theeconomicimpactofictmeasurementevidenceandimplica
tions.htm
Otterstetter, R., Buser, S., Kappler, R., Herold, K., Mullet, N., & Mullins, N. (2011). A
model for collaborative laboratory experiences between higher education and a
high school technical preparation program: Promoting higher education,
mentoring, and research. Advances in Physiology Education, 35(4), 460-463.
doi:10.1152/advan.00103.2010
233
Parnell, D. (1985). The Neglected Majority. Washington DC: American Association of
Community Colleges, 1985.
Pierce, D. R. (2001). Student pathways through high school to college. Denver, CO:
Education Commission of the States. Retrieved from
http://www.ecs.Org/c/eaminghouse/26/71/2627.htm.
Pierce, K. B., & Hernandez, V. M. (2015). Do mathematics and reading competencies
integrated into career and technical education courses improve high school
student state assessment scores? Career and Technical Education Research,
39(3), 213-229. doi:10.5328/cter39.3.213
Plank, S. (2001). Career and technical education in the balance: An analysis of high
school persistence, academic achievement, and postsecondary destinations.
Columbus, OH: National Dissemination Center for Career and Technical
Education.
Plank, S. B., DeLuca, S., & Estacion, A. (2008). High school dropout and the role of
career and technical education: A survival analysis of surviving high school.
Sociology of Education, 81(4), 345-370. doi:10.1177/003804070808100402
Qi, W., & Cole, J. S. (2011). Career and technical education students who transition to
four-year institutions: An exploratory study. Journal of the First-Year Experience
& Students in Transition, 23(2), 75.
Rabren, K., Carpenter, J., Dunn, C., & Carney, J. S. (2014). Actions against poverty: The
impact of career technical education. Career Development for Exceptional
Individuals, 37(1), 29-39. doi:10.1177/2165143414522091
Ramsey, K. A. (1995). The new vocationalism in urban school reform. Education and
Urban Society, 27(3), 260-273. doi:10.1177/0013124595027003003
Raudenbush, S. P., & Bryk, A. (2002). Hierarchical Linear Models, 2nd
ed. Thousand
Oaks, California: Sage.
Richard, E. D., Walter, R. A., & Yoder, E. P. (2013). The effect of capstone cooperative
education experiences, and related factors, on career and technical education
secondary student summative assessment scores. Career and Technical Education
Research, 38(1), 19-37. doi:10.5328/cter38.1.19
Rio Grande Valley Texas, RGVT. (2016). Rio Grande valley of south Texas. Harlingen,
TX: Author. Retrieved from: http://riograndevalleytx.us/
234
Rojewski, J. W., & Hill, R. B. (2014). Positioning research and practice in career and
technical education: A framework for college and career preparation in the 21st
century. Career and Technical Education Research, 39(2), 137-150.
doi:10.5328/cter39.2.137
Rojewski, J. W., & Xing, X. (2013). Treatment of Race/Ethnicity in career-technical
education research. Career and Technical Education Research, 38(3), 245-256.
doi:10.5328/cter38.3.245
Rojewski, J. W., Lee, I. H., & Gemici, S. (2012). Use of "t"-test and ANOVA in career-
technical education research. Career and Technical Education Research, 37(3),
263-275. doi:10.5328/cter37.3.263
Rosenbaum, P. R. (2002). Observational studies, 2nd
ed. New York, NY: Springer.
Rosenbaum, P., & Rubin, D. (1983). The central role of propensity score observational
studies for causal effects. Biometrika, 70, 41-55. doi:10.1093/biomet/70.1.41.
Rosenbaum, P., & Rubin, D. (1985). Constructing control group using multivariate
matched sampling methods that incorporate the propensity score. American
Statisticians, 39, 35-39.
Rosenbaum, P.R., & Rubin, D.B. (1984). Reducing boas in observational studies using
subclassification on the propensity score. Journal of the American Statistical
Association, 79(387), 516-524).
Ross, T., Kena, G., Rathburn, A., KewalRamani, A., Zhang, J., Kristapovich, P., &
Manning, E. (2012). Higher education: Gaps in access and persistence study
(NCES 2012-046). Washington DC: National Center for Education Statistics.
Rubin, D. B. (1996). Multiple imputation after 18+ years. Journal of the American
Statistical Association, 91, 473-489.
Rubin, D.B. (1987) Multiple imputation for nonresponse in surveys. New York: Wiley &
Sons.
Sambolt, M., & Blumenthal, D. (2013). Promoting college and career readiness: A
pocket guide for state and district leaders. Washington DC: American Institutes
for Research.
SB1410. 82nd
Legislative Session of the Texas State Legislature. (2011).
SB1809. 79th
Legislative Session of the Texas State Legislature. (2005).
235
SB715. 83rd
Legislative Session of the Texas State Legislature. (2013).
Schafer, J. L. (1997). Analysis of incomplete multivariate data. Boca Raton, FL:
Chapman & Hall.
Schafer, J.L. (1999). Multiple imputation: A primer. Statistical Methods in Medical
Research, 8(1), 3–15. doi:10.1191/096228099671525676.
Schmalzried, J. E., & Harvey, M. W. (2014). Perceptions of special education and career
and technical education collaboration and communication. Career Development
for Exceptional Individuals, 37(2), 84-96.
School-to-Work Opportunities Act of 1994, PL103-239
Seidman, P. F., & Ramsey, K. A. (1995). Vocational education and school reform: New
connections from school to work: 1. Education and Urban Society [H.W. Wilson -
EDUC], 27, 235.
Shadish, W. R., Cook, T. D., & Campbell, D. T. (2002). Experimental and quasi-
experimental designs for generalized causal inference. Boston: Houghton Mifflin.
Shimony, R., Russo, J. W., Ciaccio, L., Sanders, J. W., Rimpici, R., & Takvorian, P. M.
(2002). Medical laboratory technology: A New York state tech-prep model that
improves academic skills. The Journal of Educational Research, 95(5), 300-307.
doi:10.1080/00220670209596603
Shultz, T. W. (1963). The economic value of education. New York, NY: Columbia
University Press.
Silverberg, M., Warner, E., Fong, M., & Goodwin, D. (2004). National assessment of
vocational education: Final report to Congress. Washington DC: U.S.
Department of Education.
Smith Hughes Act of 1917, PL65-347
Smith, A. (2008). An inquiry into the nature and causes of the wealth of nations. New
York, NY: Oxford University Press. (Original work published 1793).
Spindler, M. (2010). A taxonomic description of the science integrating learning
objectives in career and technical education programs of study. Career and
Technical Education Research, 35(3), 157-173. doi:10.5328/cter35.312
236
Starobin, S. S., & Bivens, G. M. (2014). The role of secondary school and community
college collaborations to increase latinas in engineering in a rural community.
New Directions for Community Colleges, 2014(165), 17-23. doi:10.1002/cc.20087
Stevens, J. (2009). Applied Multivariate Statistics for the Social Sciences (5th ed.). New
York: Routledge.
Stipanovic, N., & Stringfield, S. (2013). A qualitative inquiry of career exploration in
highly implemented career and technical education programs of study.
International Journal of Educational Reform, 22(4), 334.
Stipanovic, N., Lewis, M. V., & Stringfield, S. (2012). Situating programs of study
within current and historical career and technical educational reform efforts.
International Journal of Educational Reform, 21(2), 80.
Stone, J. R. I., Alfeld, C., & Pearson, D. (2008). Rigor and relevance: Enhancing high
school students' math skills through career and technical education. American
Educational Research Journal [H.W. Wilson - EDUC], 45(3), 767.
Stone, J. R., Aliaga, O. A. (2005). Career and technical education and school-to-work at
the end of the 20th century: Participation and outcomes. Career and Technical
Education Research, 30(2), 125-144.
Stone, J. R., III, & Lewis, M. V. (2010). Governance of vocational education and training
in the united states. Research in Comparative and International Education, 5(3),
274.
Stratford, M. (2016, September 20). Career education bill breaks down in Senate.
Politico. Retrieved from: http://www.politico.com/tipsheets/morning-
education/2016/09/career-education-bill-breaks-down-in-senate-216421
Struhl, B., & Vargas, J. (2012, October). Taking college courses in high school: A
strategy for college readiness. Washington DC: Jobs For the Future. Retrieved
from http://www.jff.org/sites/default/files/TakingCollegeCourses_101712.pdf
Symonds, W. C., Schwartz, R. B., & Ferguson, R. (2011). Pathways to prosperity:
Meeting the challenge of preparing young Americans for the 21st century.
Cambridge, MA: Harvard University.
Texas Early College High School. (2016) Overview of early college high schools in
Texas. Austin, TX: Texas Education Agency. Retrieved from:
http://www.txechs.com/what_is_echs.php
237
Texas Education Agency (2011). Hispanics are majority in public schools. Austin, TX:
Author. Retrieved from: http://www.tea.state.tx.us/index2.aspx?id=2147499598.
Texas Education Agency. (2016)Texas science, technology, engineering and mathematics
initiative (T-STEM). Austin, TX: Author. Retrieved from: http://tea.texas.gov/T-
STEM/
Texas Higher Education Coordinating Board. (2015). CBM reporting manuals. Austin,
TX: Author. Retrieved from
http://www.txhighereddata.org/index.cfm?objectId=3874B639-B8B5-1533-
24CEAC194113B058
Texas P-16 Public Education Information Resources. (2013). Dual credit and total
enrollments, fall semesters. Austin, TX: The Texas Higher Education
Coordinating Board. Retrieved from
http://www.texaseducationinfo.org/tea.tpeir.web/topic_dualcred.aspx
Thevenot, B. (2010, February 10). Dual-credit classes in high school on the rise. The
Texas Tribune. Retrieved from: http://www.texastribune.org/2010/02/19/dual-
credit-classes-in-high-school-on-the-rise/
Thoemmes F.J., & Kim E.S. (2011). A systematic review of propensity score methods in
the social sciences. Multivariate Behavior. Research,46, 90–118.
doi:.10.1080/00273171.2011.540475
U.S. Bureau of Economic Analysis. (2014). Survey of current business, regional data,
per capita personal income. Washington DC: Author. Retrieved from:
http://www.bea.gov/scb/
U.S. Census Bureau. (2016). Quick facts. Washington DC: U. S. Department of
Commerce. Retrieved from:
http://www.census.gov/quickfacts/table/PST045215/00
U.S. Department of Education, Office of Vocational and Adult Education. (2012).
Investing in America’s future: A blueprint for transforming career and technical
education. Washington DC: Author
U.S. Department of Education: Office of Career, Technical, and Adult Education. (2016).
Tech prep education. Retrieved from:
http://www2.ed.gov/about/offices/list/ovae/pi/cte/techprep.html
238
U.S. Department of Labor Bureau of Labor and Statistics. (2015). Labor force
characteristics by race and ethnicity, 2014 (Report 1057). Washington DC:
Author.
U.S. Department of Labor Bureau of Labor and Statistics. (2015). College enrollment and
work activity of 2014 high school graduates (USDL-15-0608). Washington DC:
Author.
Ujifusa, A. (2016, October 5). Storm clouds loom over push for ed-tech law’s renewal.
Education Week, 36(7), 18-19.
Vander Ark, Tom. (2002). The case for small high schools. Educational Leadership,
59(5), 55- 59.
Vocational Education Act of 1963, PL88-210
Waller, S. K., & Waller, L. (2004). Texas tech prep environmental scan of partner
opinions: An assessment of effectiveness. Community College Journal of
Research and Practice, 28(7), 625-635. doi:10.1080/10668920390253862
Washbon, J. L. (2012). Learning and the new workplace: Impacts of technology change
on postsecondary career and technical education. New Directions for Community
Colleges, 2012(157), 43-52. doi:10.1002/cc.20005
Washington Achievement Council. (2013). A skilled and educated workforce.
Washington DC: Author.
West, S.G., Cham, H., Thoemmes, F., Renneberg, B., Schulze, J., & Weiler, M. (2014).
Propensity scores as a basis for equating groups: Basic principles and application
in clinical outcome research. Journal of Consulting and Clinical Psychology,
82(5), 906-919.
What Works Clearinghouse. (2014). Procedures and standards handbook (version 3.0).
Washington DC: The U.S. Department of Education.
Wilson, J. S., II, Parr, B. A., & Parr, K. S. (2012). Student perceptions of distance
education in a career and technical teacher education program. Career and
Technical Education Research, 37(2), 157-169. doi:10.5328/cter37.2.157
Wonacott, M.E. (2002). Dropouts and career and technical education. Myths and
realities. Clearinghouse on Adult, Career, and Vocational Education, 23.
Zinth, J.D. (2014). CTE dual enrollment: A strategy for college completion and
workforce investment. Denver, CO: Education Commission of the States