Embed Size (px)
Citation preview

Copyright
by
John Robert Kintz
2017
The Thesis Committee for John Robert Kintz
Certifies that this is the approved version of the following thesis:
Experimental Evaluation of Partial Depth Precast Concrete Deck
Panels Subjected to Shear Loading
APPROVED BY
SUPERVISING COMMITTEE:
Todd Helwig, Supervisor
Michael Engelhardt
Experimental Evaluation of Partial Depth Precast Concrete Deck
Panels Subjected to Shear Loading
by
John Robert Kintz, B.S.E.
Thesis
Presented to the Faculty of the Graduate School of
The University of Texas at Austin
in Partial Fulfillment
of the Requirements
for the Degree of
Master of Science in Engineering
The University of Texas at Austin
May 2017

Dedication
To my family, as your limitless love, guidance, and support make all things possible. To
my cousin Alex Kintz and my grandmother Jean Holtman, who inspire me to be my best
each and every day.
v
Acknowledgements
I would like to thank the Texas Department of Transportation, for the funding they
provided made this research possible and paid for my graduate education.
I would also like to thank Dr. Todd Helwig and Dr. Michael Engelhardt for the
opportunity to conduct research at the Ferguson Laboratory. Your guidance has been
invaluable, and my experience at the lab under your mentorship has helped me grow as
both an engineer and a person. Thank you also to Dr. Patricia Clayton, whose advice and
enthusiasm were very valued during my time at The University of Texas.
Thank you to the Ferguson Laboratory staff who provided assistance in many
phases of this research project. In particular, thank you David Braley, Mike Brown, John
Bacon, Dennis Phillip, Elizabeth Clayton, Michelle Damvar, and Blake Stasney.
A special thanks to Colter Roskos, whose efforts were critical to the success of this
project, and whose friendship I have greatly appreciated through every challenge and
success. Thank you also to Hossein Yousefpour, whose help, advice, and friendship were
truly valued during my time at FSEL.
I would also like to thank the students at the Ferguson Laboratory, especially Mark
Eason, who was always willing to lend a helping hand and whom I consider myself lucky
to call a friend.
To my parents Mary and Robert and my sister Rachel, thank you for your constant
love and support. Thank you also to Jessica Salazar, who helped me cherish the good times
and push through the tough ones. I couldn’t have done it without each and every one of
you.

vi
Finally, I would like to thank my Grandpops, James Kintz, who inspired me to write
with his wonderful poem:
“PRECAST CONCRETE PANELS ON CURVED BRIDGES”
Tunnels are like funnels, they pour everything into a hole;
Bridges are like a ride into the sky on the wing of a soul.
Precast concrete panels are the wind beneath their wings;
To hold them up so their tires, with a happy song sings.
The panels need to have smooth shapes;
Not bumpy, grumpy, like an apes.
Panels must be very strong;
Or to the ground before very long;
They can be decorative and pretty;
To come across like a fast ditty.
When people look at them they will say;
The Civil Engineer had a very nice day.
And will say very loud;
JOHN, YOU MAKE US VERY PROUD.
vii
Abstract
Experimental Evaluation of Partial Depth Precast Concrete Deck
Panels Subjected to Shear Loading
John Robert Kintz, M.S.E.
The University of Texas at Austin, 2017
Supervisor: Todd Helwig
Horizontally curved girder bridges are often utilized for highway interchanges and
other projects with restricted right-of-way. The large torsional demands caused by the
girder geometry often require these systems to have extensive bracing, typically in the form
of cross frames or diaphragms, to increase the torsional stiffness of the girder system during
the construction phase. The most critical stage for the bracing is during the deck placement,
when the noncomposite girders must resist the full construction load.
Partial depth precast concrete panels (PCPs) are prestressed concrete panels used
primarily as stay-in-place (SIP) formwork for straight girder systems. They are placed on
full-length extruded bedding strips epoxied to the girder top flange, and the remaining
depth of the deck is cast above. This is a time-efficient method of construction, and has
become an attractive option due to ease of constructability and deck longevity. Although
the panels have not been used on horizontally curved girder systems, there is a desire by
bridge owners and contractors to use the forms in some curved girder applications. In
addition to using the panels on curved girder applications, engaging the in-plane shear
viii
stiffness of the panels may lead to significant bracing in both straight and horizontally
curved girder applications.
A research investigation focused on measuring the behavior of PCPs acting as a
shear diaphragm, as well as to develop an adequate connection between the PCPs and the
girders was conducted at The University of Texas at Austin. Four PCP connection details
were developed and tested at two different bedding strip heights. These connections were
designed for a range of capacities, and in-plane shear load was applied until failure using
a frame mechanism assembly.
The experimental results showed that the connected PCPs had significant shear
stiffness and strength, with the panels reaching shear capacities between 91 and 154 kips
before failure depending on the connection detail that was utilized. A 46 to 70 percent
increase in shear stiffness was also observed when the bedding strip height was reduced
from 4 inches to ½ inch. All panels greatly exceeded the design capacity using the ACI
design predictions, with 7 of 8 panels eventually failing due to concrete side face breakout.
The eighth PCP failed from weld rupture in which the weld connecting the WT and the
girder flange began to unzip.
ix
Table of Contents
List of Tables ........................................................................................................ xii
List of Figures ...................................................................................................... xiii
Chapter 1: Introduction ............................................................................................1
1.1: Overview ................................................................................................1
1.2: Research Objectives ...............................................................................4
1.3: Thesis Scope ..........................................................................................4
Chapter 2: Background and Literature Review .......................................................6
2.1: Overview ................................................................................................6
2.2: Buckling and Bracing of Steel Beams ...................................................6
2.2.1: Lateral Torsional Buckling ..........................................................6
2.2.2: Methods of Beam Bracing .........................................................11
2.3: Strength and Stiffness Requirements of Bracing .................................13
2.4: Diaphragm Bracing of Beam Systems .................................................16
2.5: Stiffness and Strength of Shear Diaphragm Systems ..........................22
2.6: Permanent Metal Deck Forms as Shear Diaphragm Braces ................26
Chapter 3: Shear Frame Experimental Procedure ..................................................30
3.1: Overview ..............................................................................................30
3.2: Shear Frame Fabrication ......................................................................30
3.2.1: Shear Frame Test Setup .............................................................30
3.3: Specimen Design and Geometry ..........................................................37
3.3.1: Panel Design and Geometry ......................................................37
3.3.2: Bedding Strip Geometry ............................................................38
3.3.3: Embed Design Parameters and Geometry .................................39
3.4: Instrumentation ....................................................................................43
3.4.1: Shear Frame Instrumentation .....................................................43
3.4.2: PCP and Connection Instrumentation ........................................44
3.5: Test Procedure .....................................................................................46
3.5.1: Shear Frame Friction Test ..........................................................46
x
3.5.2: Panel Shear Tests .......................................................................47
Chapter 4: Experimental Test Results...................................................................49
4.1: Overview ..............................................................................................49
4.2: Panel Material Properties .....................................................................49
4.3: Shear Frame Behavior ..........................................................................50
4.4: Panel Ultimate Shear Strength .............................................................56
4.5: Panel Shear Stiffness............................................................................61
4.6: Embed Axial Behavior .........................................................................63
4.7: Panel Crack Behavior and Connection Yielding .................................68
4.8: Failure Modes ......................................................................................75
Chapter 5: Conclusions and Future Research ........................................................78
5.1: Overview ..............................................................................................78
5.2: Shear Loading Experiments .................................................................78
5.2.1: Stiffness and Strength Behavior ................................................79
5.2.2: Connection Detail Considerations .............................................79
5.2.3: Additional Considerations .........................................................80
5.3: Future Research ...................................................................................81
Appendix A ............................................................................................................83
A.1: PCP Connection Detail Geometries ....................................................83
A.2: PCP Design Capacity Calculations ......................................................86
A.2.1: Panel Reaction Figures .............................................................86
A.2.2 : PCP Detail A.1 Capacity Calculations ......................................88
A.2.3 : PCP Detail B.1 Capacity Calculations ......................................91
A.2.4: PCP Detail C.2 Capacity Calculations ......................................94
A.2.5: PCP Detail D.2 Capacity Calculations ......................................97
Shear Frame Test Results ..................................................................100
A.3.1: Loading Beam Twist ...............................................................100
A.3.2: Frame Lateral Displacements .................................................105
A.3.3: PCP Ultimate Capacity Results ..............................................109
xi
A.3.4: PCP Shear Stiffness Results....................................................111
A.3.5: PCP Embed Behavior Results .................................................113
PCP Ultimate Load Cracking Patterns ..............................................119
References ............................................................................................................124
Vita ......................................................................................................................126
xii
List of Tables
Table 2.1: m Values for Equation 2.8 for Different Slenderness Ratios, Load Heights and
Bracing Conditions (Helwig & Yura, 2008a) ................................................ 20
Table 2.2: Flat Soffit Shear Stiffnesses for Various Connection Methods. Rigid vs.
Eccentric Support Angle is shown as Boxed (Currah, 1993) ........................ 27
Table 3.1: Summary of PCP Design Details Used in Experimental Procedure ................ 42
Table 4.1: Concrete Cylinder Strength Test Results for all PCP Specimens .................... 50
Table 4.2: Ultimate Load Capacities for PCP Shear Tests ............................................... 60
Table 4.3: Shear Stiffness Results for PCP Ultimate Load Tests ..................................... 63
Table 4.4: Embed Strain Behavior for all PCP Connection Details ................................. 68
Table 4.5: Cracking Shear Load for Each PCP Detail ...................................................... 73
xiii
List of Figures
Figure 1.1: Horizontally Curved Steel Girders with Intermediate Cross-Frames (Haskins,
2015) ................................................................................................................. 2
Figure 1.2: PCP Deck Panel Spanning Between Girder Lines (TxDOT, 2006) ................. 3
Figure 2.1: Lateral Torsional Buckling of a Typical I-Girder Section ............................... 7
Figure 2.2: Composite Action of a Typical Steel Girder .................................................... 8
Figure 2.3: Parameters for Calculating Moment Gradient Accounting for Load Height .....
......................................................................................................................... 11
Figure 2.4: Examples of Different Bracing Methods; Adapted from (Yura & Helwig,
2014) ............................................................................................................... 13
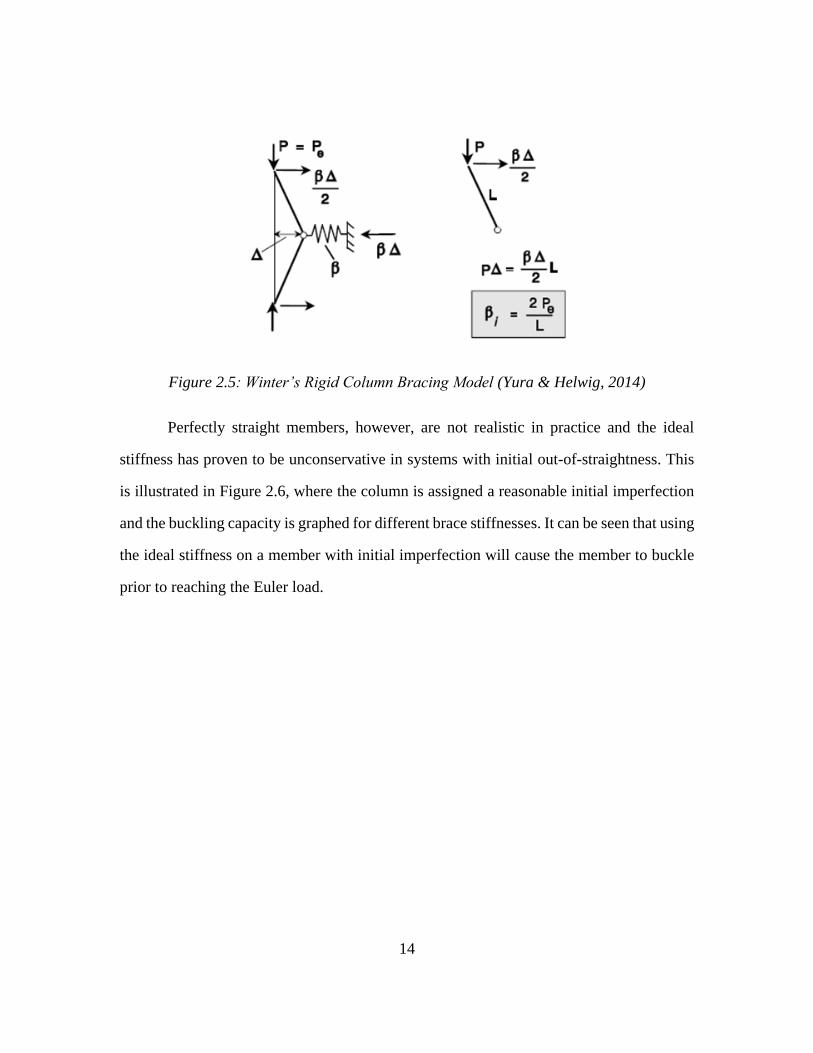
Figure 2.5: Winter’s Rigid Column Bracing Model (Yura & Helwig, 2014)................... 14
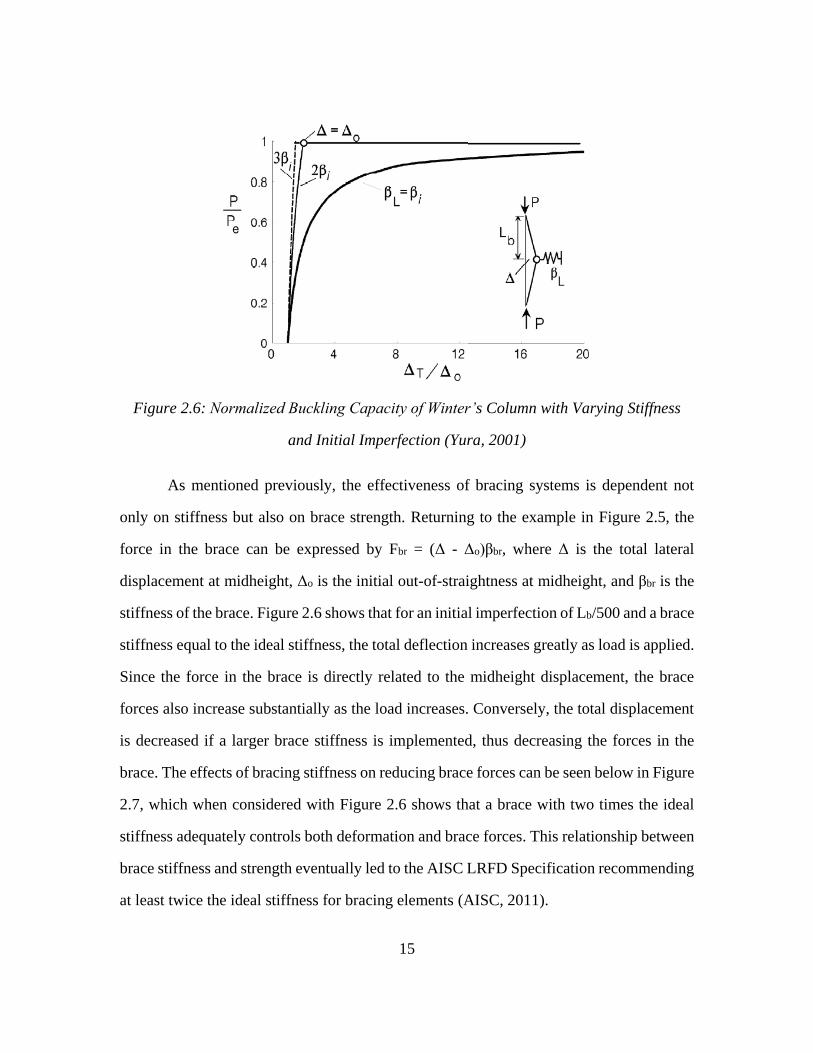
Figure 2.6: Normalized Buckling Capacity of Winter’s Column with Varying Stiffness
and Initial Imperfection (Yura, 2001) ............................................................. 15
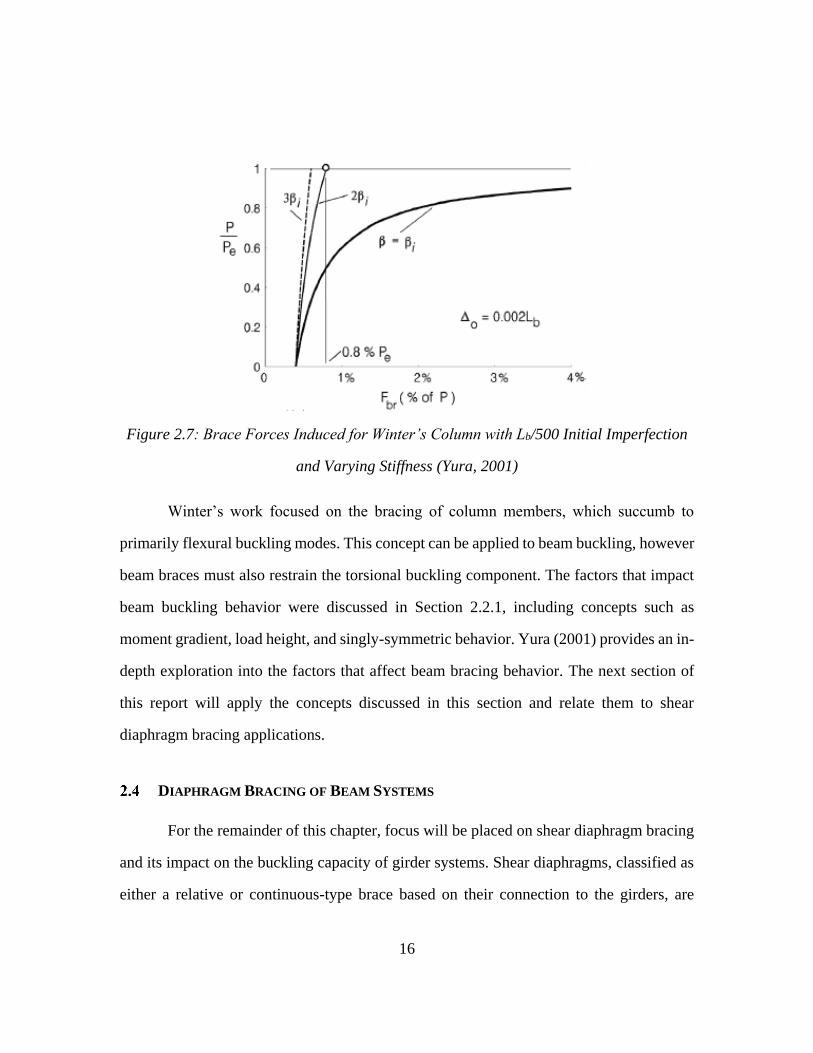
Figure 2.7: Brace Forces Induced for Winter’s Column with Lb/500 Initial Imperfection
and Varying Stiffness (Yura, 2001) ................................................................ 16
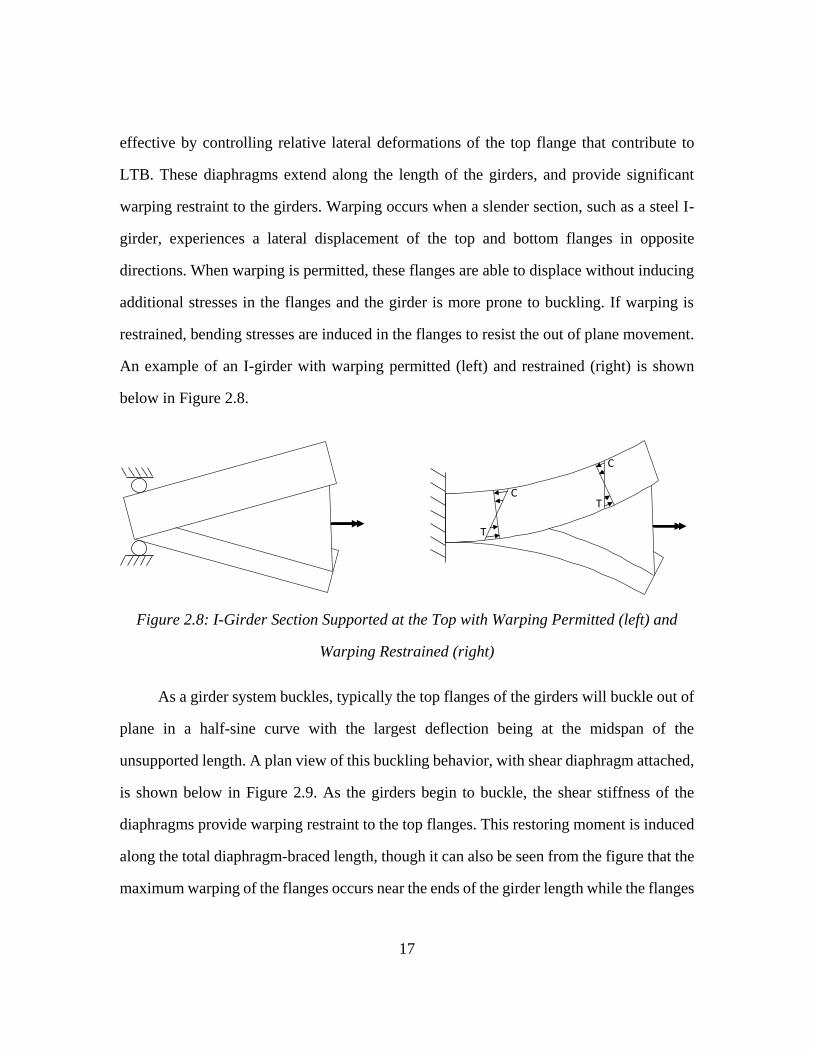
Figure 2.8: I-Girder Section Supported at the Top with Warping Permitted (left) and
Warping Restrained (right) ............................................................................. 17
Figure 2.9: Shear Diaphragm Bracing Behavior as Top Flange Warping Restraint;
Adapted from (Helwig & Yura, 2008a) .......................................................... 18
Figure 2.10: Shear Test Frame with Diaphragm ............................................................... 23
Figure 2.11: Internal Reactions of Shear Diaphragm ....................................................... 24
Figure 2.12: Diaphragm Shear Behavior .......................................................................... 25
Figure 2.13: Unstiffened PMDF Connection (left) and PMDF Connection with Stiffening
Angle/Connection Plate (right) (Roskos et al., 2017) ..................................... 28
xiv
Figure 2.14: Shear Stress-Strain Curve for an 18ga PMDF with Stiffened (X) and
Unstiffened Connections (Jetann, 2003) ......................................................... 29
Figure 3.1: Plan View of Test Setup ................................................................................. 31
Figure 3.2: Isometric View of Test Setup ......................................................................... 32
Figure 3.3: Loading Beam Cross-Section ......................................................................... 34
Figure 3.4: Pin/Needle Bearing Cross-Section ................................................................. 35
Figure 3.5: Tie-Down Beam Elevation ............................................................................. 36
Figure 3.6: PCP Formwork Geometry for Shear Frame Testing ...................................... 38
Figure 3.7: PCPs Resting on 4 Inch (left) and ½ inch (right) Polystyrene Bedding Strips
......................................................................................................................... 39
Figure 3.8: Elevation View of the Embed-WT Panel to Girder Connection .................... 40
Figure 3.9: General Plan View of the Embed-WT PCP Connection Detail ..................... 41
Figure 3.10: PCP Nomenclature Used for Experimental Documentation ........................ 41
Figure 3.11: Linear Potentiometers Located at Each Corner of the Shear Frame ............ 44
Figure 3.12: Plan View Layout of Linear Potentiometers, Shown as one WT per Corner
......................................................................................................................... 45
Figure 3.13: Configuration of Corner Potentiometers and Whitewash Application ........ 46
Figure 3.14: Isometric View of Connected PCP During Shear Testing ........................... 48
Figure 4.1: Twist Behavior of the Shear Frame for Panel Test A.1.MAX ....................... 51
Figure 4.2: Twist Behavior of the Shear Frame for Panel Test A.1.MIN ......................... 51
Figure 4.3: PCP to Girder Connection Behavior in Compression (left) and Tension (right)
Regions ........................................................................................................... 52
Figure 4.4: Force Couple Developed in the PCP for Compression Region Connections .....
......................................................................................................................... 53
Figure 4.5: Interpolation of Shear Center Displacement and LPOT Configuration ......... 53
xv
Figure 4.6: Elevation (top) and Plan (bottom) View of Abaqus Finite Element Model
Showing Shear Frame Twist and In-Plane Bending ....................................... 54
Figure 4.7: Loading Beam Shear Center Lateral Displacement for PCP Detail A.1.MAX
......................................................................................................................... 55
Figure 4.8: Loading Beam Shear Center Lateral Displacement for PCP Detail A.1.MIN ...
......................................................................................................................... 55
Figure 4.9: Shear Behavior up to Ultimate Load for PCP Detail A.1 .............................. 57
Figure 4.10: Shear Behavior up to Ultimate Load for PCP Detail B.1 ............................. 57
Figure 4.11: Shear Behavior up to Ultimate Load for PCP Detail C.2 ............................. 59
Figure 4.12: Shear Behavior up to Ultimate Load for PCP Detail D.2 ............................ 59
Figure 4.13: Shear Stiffness Behavior for PCP Detail A.1 ............................................... 61
Figure 4.14: Shear Stiffness Behavior for PCP Detail C.2 ............................................... 62
Figure 4.15: Axial Strain Measured in Relation to Panel Shear for PCP Detail A.1.MAX
......................................................................................................................... 64
Figure 4.16: Axial Strain Measured in Relation to Panel Shear for PCP Detail B.1.MAX
......................................................................................................................... 64
Figure 4.17: Axial Strain Measured in Relation to Panel Shear for PCP Detail C.2.MAX
......................................................................................................................... 66
Figure 4.18: Axial Strain Measured in Relation to Panel Shear for PCP Detail D.2.MAX
......................................................................................................................... 66
Figure 4.19: Axial Strain Comparison for PCP Details A.1.MAX and A.1.MIN ............ 67
Figure 4.20: Cracking Behavior at Ultimate Load for PCP Detail A.1.MAX .................. 69
Figure 4.21: Cracking Behavior at Ultimate Load for PCP Detail C.2.MAX .................. 70
Figure 4.22: Cracking Behavior at Ultimate Load for PCP Detail A.1.MIN ................... 71
Figure 4.23: Cracking Behavior at Ultimate Load for PCP Detail C.2.MIN .................... 72
xvi
Figure 4.24: WT Yielding for PCP Details A.1.MAX (left) and D.2.MAX (right) ......... 74
Figure 4.25: WT Yielding for PCP Details A.1.MIN (left) and D.2.MIN (right) ............ 74
Figure 4.26: Bulging Behavior at WT-PCP Connection Near Failure Capacity .............. 75
Figure 4.27: Concrete Side Face Breakout Failure and Corresponding Anchor Bar
Bending shown for PCP Detail A.1.MAX ...................................................... 76
Figure 4.28: WT to Loading Beam Weld Rupture at Northwest (left) and Southwest
(right) Corners for PCP Detail B.1.MAX ....................................................... 77
Figure 5.1: Isometric View of HSS X-Brace Model for Shear Frame Behavioral Tests ......
......................................................................................................................... 82
Figure A.1: Plan and Elevation Views of Embed-WT PCP Connection Detail A.1 ........ 83
Figure A.2: Plan and Elevation Views of Embed-WT PCP Connection Detail B.1 ........ 84
Figure A.3 Plan and Elevation Views of Embed-WT PCP Connection Detail C.2.......... 84
Figure A.4: Plan and Elevation Views of Embed-WT PCP Connection Detail D.2 ........ 85
Figure A.5: PCP Geometry Parameters ............................................................................ 86
Figure A.6: PCP Embed Connection Reactions ............................................................... 87
Figure A.7: Twist Behavior of the Shear Frame for PCP Detail A.1.MAX ................... 100
Figure A.8: Twist Behavior of the Shear Frame for PCP Detail B.1.MAX ................... 101
Figure A.9: Twist Behavior of the Shear Frame for PCP Detail C.2.MAX ................... 101
Figure A.10: Twist Behavior of the Shear Frame for PCP Detail D.2.MAX ................. 102
Figure A.11: Twist Behavior of the Shear Frame for PCP Detail A.1.MIN ................... 102
Figure A.12: Twist Behavior of the Shear Frame for PCP Detail B.1.MIN ................... 103
Figure A.13: Twist Behavior of the Shear Frame for PCP Detail C.2.MIN ................... 103
Figure A.14: Twist Behavior of the Shear Frame for PCP Detail D.2.MIN ................... 104
Figure A.15: Loading Beam Shear Center Lateral Displacement for PCP Detail A.1.MAX
....................................................................................................................... 105
xvii
Figure A.16: Loading Beam Shear Center Lateral Displacement for PCP Detail B.1.MAX
....................................................................................................................... 105
Figure A.17: Loading Beam Shear Center Lateral Displacement for PCP Detail C.2.MAX
....................................................................................................................... 106
Figure A.18: Loading Beam Shear Center Lateral Displacement for PCP Detail D.2.MAX
....................................................................................................................... 106
Figure A.19: Loading Beam Shear Center Lateral Displacement for PCP Detail A.1.MIN
....................................................................................................................... 107
Figure A.20: Loading Beam Shear Center Lateral Displacement for PCP Detail B.1.MIN
....................................................................................................................... 107
Figure A.21: Loading Beam Shear Center Lateral Displacement for PCP Detail C.2.MIN
....................................................................................................................... 108
Figure A.22: Loading Beam Shear Center Lateral Displacement for PCP Detail D.2.MIN
....................................................................................................................... 108
Figure A.23: Shear Behavior up to Ultimate Load for PCP Detail A.1 .......................... 109
Figure A.24: Shear Behavior up to Ultimate Load for PCP Detail B.1 .......................... 109
Figure A.25: Shear Behavior up to Ultimate Load for PCP Detail C.2 .......................... 110
Figure A.26: Shear Behavior up to Ultimate Load for PCP Detail D.2 .......................... 110
Figure A.27: Shear Stiffness Behavior for PCP Detail A.1 ............................................ 111
Figure A.28: Shear Stiffness Behavior for PCP Detail B.1 ............................................ 111
Figure A.29: Shear Stiffness Behavior for PCP Detail C.2 ............................................ 112
Figure A.30: Shear Stiffness Behavior for PCP Detail D.2 ............................................ 112
Figure A.31: Axial Strain Measured in Relation to Panel Shear for PCP Detail A.1.MAX
....................................................................................................................... 113
xviii
Figure A.32: Axial Strain Measured in Relation to Panel Shear for PCP Detail B.1.MAX
....................................................................................................................... 113
Figure A.33: Axial Strain Measured in Relation to Panel Shear for PCP Detail C.2.MAX
....................................................................................................................... 114
Figure A.34: Axial Strain Measured in Relation to Panel Shear for PCP Detail D.2.MAX
....................................................................................................................... 114
Figure A.35: Axial Strain Measured in Relation to Panel Shear for PCP Detail A.1.MIN
....................................................................................................................... 115
Figure A.36: Axial Strain Measured in Relation to Panel Shear for PCP Detail B.1.MIN
....................................................................................................................... 115
Figure A.37: Axial Strain Measured in Relation to Panel Shear for PCP Detail C.2.MIN
....................................................................................................................... 116
Figure A.38: Axial Strain Measured in Relation to Panel Shear for PCP Detail D.2.MIN
....................................................................................................................... 116
Figure A.39: Axial Strain Comparison for PCP Details A.1.MAX and A.1.MIN ......... 117
Figure A.40: Axial Strain Comparison for PCP Details B.1.MAX and B.1.MIN .......... 117
Figure A.41: Axial Strain Comparison for PCP Details C.2.MAX and C.2.MIN .......... 118
Figure A.42: Axial Strain Comparison for PCP Details D.2.MAX and D.2.MIN ......... 118
Figure A.43: Cracking Behavior at Ultimate Load for PCP Detail A.1.MAX ............... 119
Figure A.44: Cracking Behavior at Ultimate Load for PCP Detail B.1.MAX ............... 120
Figure A.45: Cracking Behavior at Ultimate Load for PCP Detail C.2.MAX ............... 120
Figure A.46: Cracking Behavior at Ultimate Load for PCP Detail D.2.MAX ............... 121
Figure A.47: Cracking Behavior at Ultimate Load for PCP Detail A.1.MIN ................ 121
Figure A.48: Cracking Behavior at Ultimate Load for PCP Detail B.1.MIN ................. 122
Figure A.49: Cracking Behavior at Ultimate Load for PCP Detail C.2.MIN ................. 122

xix
Figure A.50: Cracking Behavior at Ultimate Load for PCP Detail D.2.MIN ................ 123
1
CHAPTER 1: INTRODUCTION
OVERVIEW
Horizontally curved girders are frequently utilized in the bridge industry for a
variety of applications such as highway interchanges in urban settings that require a tight
radius of curvature. The girders can be subjected to significant torsional demands as a result
of gravity loads applied to the curved geometry. Many curved bridges employ either steel
I-girders or tub girders and a major design consideration is the torsional stiffness of the
system during construction. Many of these girders require extensive bracing during the
construction of the concrete deck. Although steel girders have been the most widely used
in horizontally curved girders, concrete U-beams have also been used in some applications.
The torsional stiffness of the concrete U-beams is also a major design consideration.
In the completed bridge, the cured concrete deck provides substantial restraint to
the girder systems. In general, the most critical stage to control torsional deformations and
provide overall stability occurs during placement of the concrete bridge deck during
construction. During these stages, the non-composite steel or concrete girder must support
the entire construction load. To ensure sufficient stability, traditional bracing such as cross
frames, diaphragms or lateral trusses are employed throughout the length. However, these
braces are expensive to fabricate and erect and for steel girders can result in fatigue
sensitive details that require significant inspection over the service life of the bridge. An
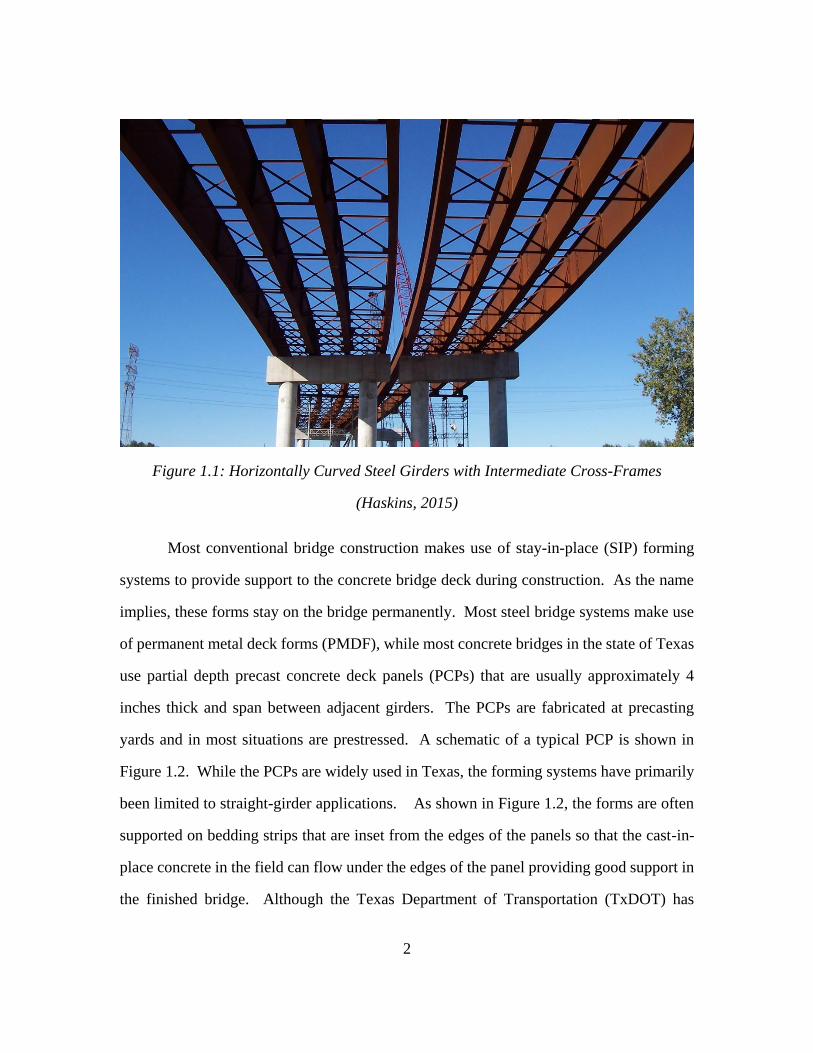
example of a horizontally curved steel system with intermediate bracing is shown below in
Figure 1.1.
2
Figure 1.1: Horizontally Curved Steel Girders with Intermediate Cross-Frames
(Haskins, 2015)
Most conventional bridge construction makes use of stay-in-place (SIP) forming
systems to provide support to the concrete bridge deck during construction. As the name
implies, these forms stay on the bridge permanently. Most steel bridge systems make use
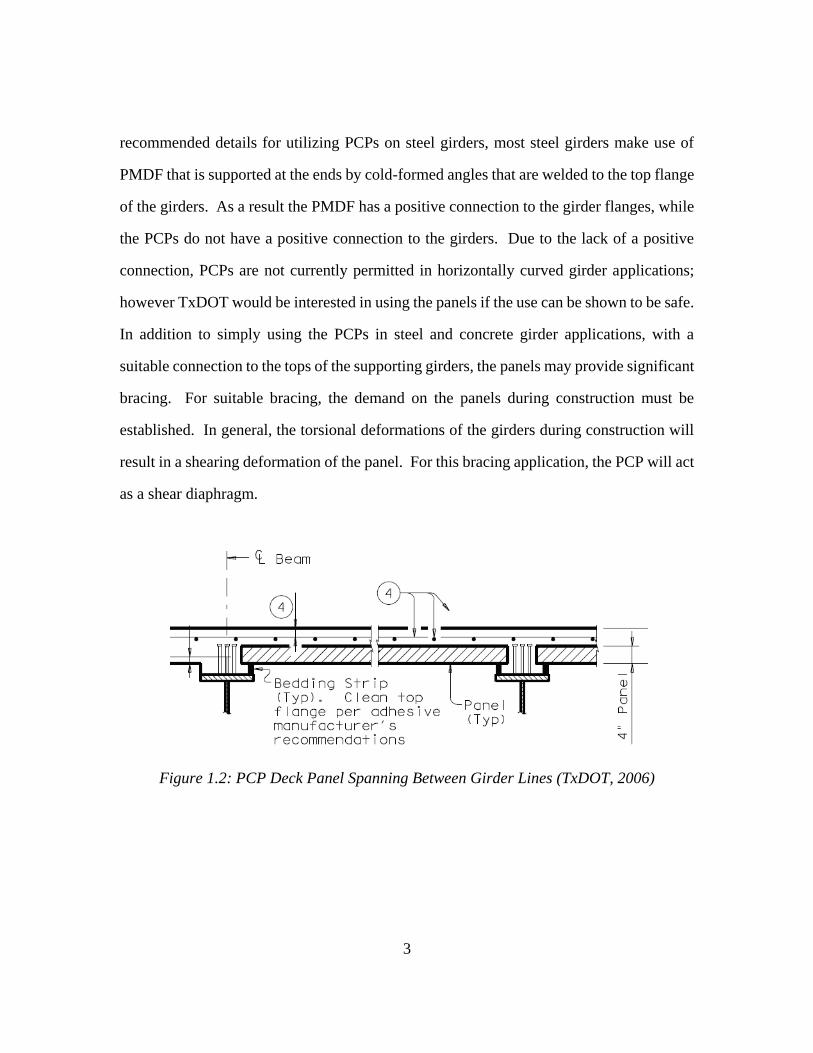
of permanent metal deck forms (PMDF), while most concrete bridges in the state of Texas
use partial depth precast concrete deck panels (PCPs) that are usually approximately 4
inches thick and span between adjacent girders. The PCPs are fabricated at precasting
yards and in most situations are prestressed. A schematic of a typical PCP is shown in
Figure 1.2. While the PCPs are widely used in Texas, the forming systems have primarily
been limited to straight-girder applications. As shown in Figure 1.2, the forms are often
supported on bedding strips that are inset from the edges of the panels so that the cast-in-
place concrete in the field can flow under the edges of the panel providing good support in
the finished bridge. Although the Texas Department of Transportation (TxDOT) has
3
recommended details for utilizing PCPs on steel girders, most steel girders make use of
PMDF that is supported at the ends by cold-formed angles that are welded to the top flange
of the girders. As a result the PMDF has a positive connection to the girder flanges, while
the PCPs do not have a positive connection to the girders. Due to the lack of a positive
connection, PCPs are not currently permitted in horizontally curved girder applications;
however TxDOT would be interested in using the panels if the use can be shown to be safe.
In addition to simply using the PCPs in steel and concrete girder applications, with a
suitable connection to the tops of the supporting girders, the panels may provide significant
bracing. For suitable bracing, the demand on the panels during construction must be
established. In general, the torsional deformations of the girders during construction will
result in a shearing deformation of the panel. For this bracing application, the PCP will act
as a shear diaphragm.
Figure 1.2: PCP Deck Panel Spanning Between Girder Lines (TxDOT, 2006)
4
RESEARCH OBJECTIVES
An investigation into the capabilities of PCPs as shear diaphragm bracing for
horizontally curved girders during the construction phase is currently being conducted at
The University of Texas at Austin with sponsorship from the TxDOT. The study includes
both full-scale laboratory testing and computational modeling. The experimental testing
consists of shear tests on the panels as well as full-scale buckling and torsion tests on steel
I-girder and tub girders. The focus of this thesis is the panel shear tests that were carried
out in the study.
Diaphragm bracing effectiveness relies not only on the stiffness of the diaphragm
itself, but also on the stiffness of the connection attaching it to the girders. An example of
this is the current practice method described in the previous section. Although the PCPs
are believed to have high in-plane shear stiffness and strength, the impact of the bedding
strip support on the stiffness is not well understood. In addition, a suitable connection
between the PCPs and the girder flanges must be developed and evaluated. While this
thesis is focused on the shear tests on the panels, a discussion of the full scale girder tests
and computational modeling will be provided in a dissertation by Roskos. The following
section provides an overview of the scope and layout of this thesis.
A total of eight shear panel tests have been carried out to date. The eight different
panels were tested using a variety of connection details.
THESIS SCOPE
The concentration of this thesis is to portray the results of a research experiment
investigating the capabilities of PCPs as shear diaphragm bracing members on straight and
horizontally curved girder systems. This thesis focuses on the in-plane shear testing of
PCPs using a proposed connection detail developed by the research team. The thesis

5
consists of five chapters. Following this introductory chapter, Chapter 2 discusses research
background and previous work relevant to this investigation. An overview of the
laboratory test setup is provided in Chapter 3. Findings from the in-plane shear tests
experiments are presented in Chapter 4 and are discussed in detail within Chapter 5. Also
included in Chapter 5 is an outline of future work that is outside the timeline of this thesis,
and recommendations for consideration for future work.
6
CHAPTER 2: BACKGROUND AND LITERATURE REVIEW
OVERVIEW
This chapter provides a summary of background information and previous research
pertinent to the scope of this thesis. Because the PCPs may be relied upon for beam bracing,
a discussion of the lateral torsional buckling (LTB) failure mode of beam members and
stability beam bracing is provided. Stiffness and strength requirements of member bracing,
particularly as it pertains to diaphragms, are considered in addition to their effect on
warping for steel systems. Given that this thesis focuses primarily on diaphragm-bracing
of beam elements, research regarding the behavior of diaphragm braced beams is
examined. One area that has been the subject of past stability research is the capability of
permanent metal deck forms (PMDFs) as a bracing element, and a summary of this research
is provided. Portions of this chapter were organized based on literature review work done
by Jetann (2003), and some figures have been adapted for use in this thesis. For a
comprehensive overview into the history of precast concrete panels and the in-plane shear
behavior of concrete, please refer to the literature review work done by McCammon
(2015), which was work carried out as part of the present study.
BUCKLING AND BRACING OF STEEL BEAMS
2.2.1 Lateral Torsional Buckling
The critical stage for lateral torsional buckling (LTB) in bridges often occurs during
construction of the concrete bridge deck. Lateral torsional buckling involves a lateral
deformation and twist of the cross section. Figure 2.1 depicts the buckled shape of a girder
in the LTB mode and also illustrates the concept of the “center of twist”, which is the

7
location where an axis passing through the web of the unbuckled girder and the buckled
girder intersect. Although most publications illustrate the LTB buckling mode as shown
in Figure 2.1, depending on the bracing and load position on the cross section, the center
of twist can also be located on the cross section of the girder.
Figure 2.1: Lateral Torsional Buckling of a Typical I-Girder Section
The elastic solution for LTB capacity of a doubly-symmetric I-girder section
subjected to uniform moment was developed by Timoshenko and Gere (1961) and is
provided in the following expression:
𝑀𝑔 =𝜋
𝐿𝑏
√𝐸𝐼𝑦𝐺𝐽 + (𝜋𝐸
𝐿𝑏)
2
𝐼𝑦𝐶𝑤 Equation 2.1
where Lb is the unbraced length, E is Young’s modulus of elasticity, Iy is the weak axis
moment of inertia, J is the torsional constant, G is the shear modulus, and Cw is the warping
constant.
φ
Center of Twist
Section A-A
M
MA
A
Δ
8
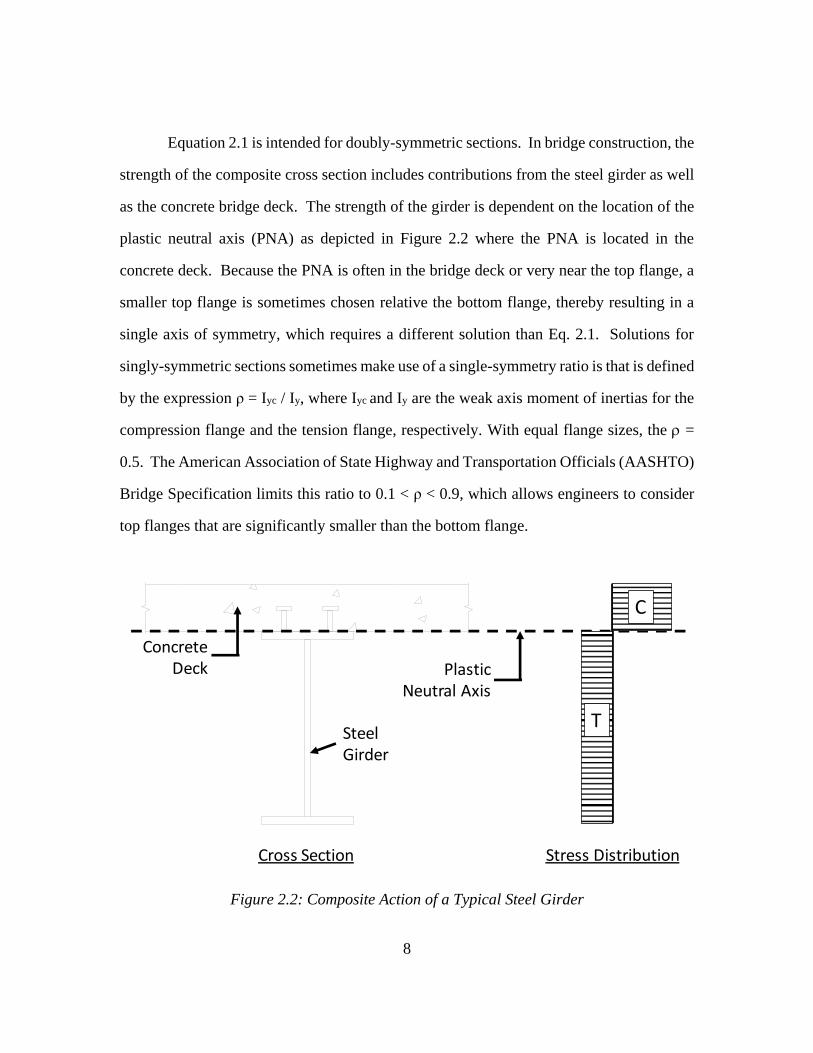
Equation 2.1 is intended for doubly-symmetric sections. In bridge construction, the
strength of the composite cross section includes contributions from the steel girder as well
as the concrete bridge deck. The strength of the girder is dependent on the location of the
plastic neutral axis (PNA) as depicted in Figure 2.2 where the PNA is located in the
concrete deck. Because the PNA is often in the bridge deck or very near the top flange, a
smaller top flange is sometimes chosen relative the bottom flange, thereby resulting in a
single axis of symmetry, which requires a different solution than Eq. 2.1. Solutions for
singly-symmetric sections sometimes make use of a single-symmetry ratio is that is defined
by the expression ρ = Iyc / Iy, where Iyc and Iy are the weak axis moment of inertias for the
compression flange and the tension flange, respectively. With equal flange sizes, the =
0.5. The American Association of State Highway and Transportation Officials (AASHTO)
Bridge Specification limits this ratio to 0.1 < ρ < 0.9, which allows engineers to consider
top flanges that are significantly smaller than the bottom flange.
Figure 2.2: Composite Action of a Typical Steel Girder
Concrete Deck
Steel Girder
Plastic Neutral Axis
C
T
Cross Section Stress Distribution
9
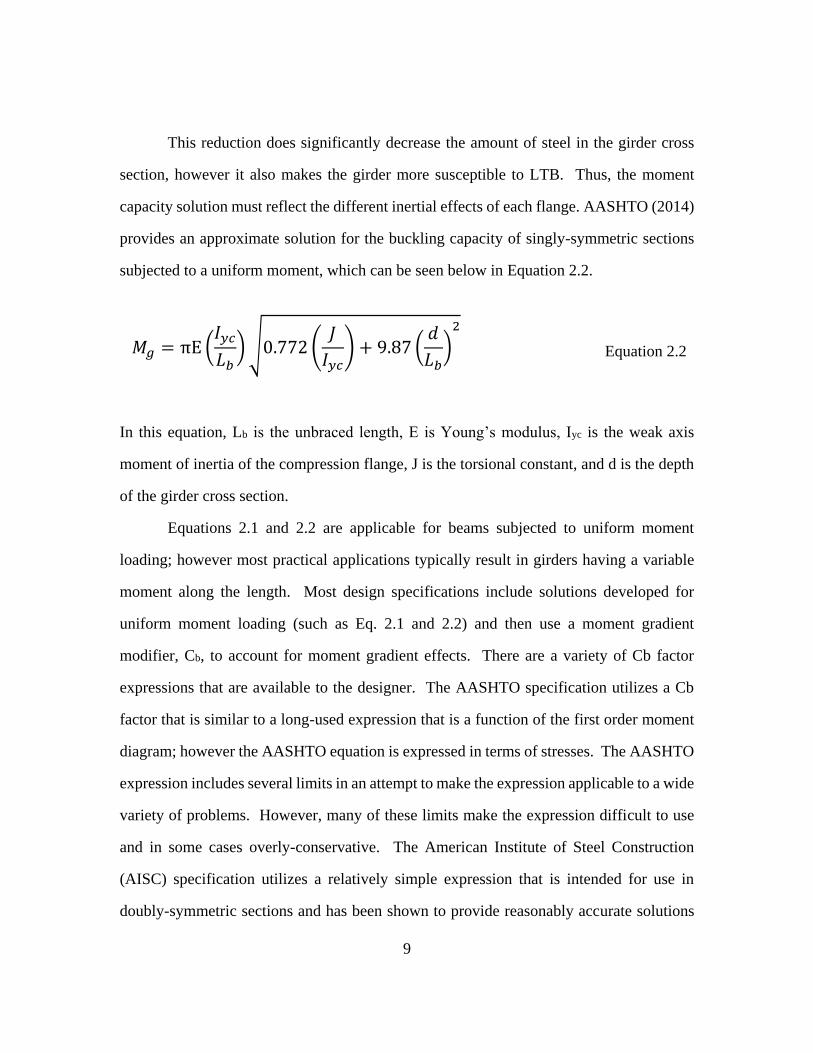
This reduction does significantly decrease the amount of steel in the girder cross
section, however it also makes the girder more susceptible to LTB. Thus, the moment
capacity solution must reflect the different inertial effects of each flange. AASHTO (2014)
provides an approximate solution for the buckling capacity of singly-symmetric sections
subjected to a uniform moment, which can be seen below in Equation 2.2.
𝑀𝑔 = πE (𝐼𝑦𝑐
𝐿𝑏) √0.772 (
𝐽
𝐼𝑦𝑐) + 9.87 (
𝑑
𝐿𝑏)
2
Equation 2.2
In this equation, Lb is the unbraced length, E is Young’s modulus, Iyc is the weak axis
moment of inertia of the compression flange, J is the torsional constant, and d is the depth
of the girder cross section.
Equations 2.1 and 2.2 are applicable for beams subjected to uniform moment
loading; however most practical applications typically result in girders having a variable
moment along the length. Most design specifications include solutions developed for
uniform moment loading (such as Eq. 2.1 and 2.2) and then use a moment gradient
modifier, Cb, to account for moment gradient effects. There are a variety of Cb factor
expressions that are available to the designer. The AASHTO specification utilizes a Cb
factor that is similar to a long-used expression that is a function of the first order moment
diagram; however the AASHTO equation is expressed in terms of stresses. The AASHTO
expression includes several limits in an attempt to make the expression applicable to a wide
variety of problems. However, many of these limits make the expression difficult to use
and in some cases overly-conservative. The American Institute of Steel Construction
(AISC) specification utilizes a relatively simple expression that is intended for use in
doubly-symmetric sections and has been shown to provide reasonably accurate solutions
10
for most practical cases. Although the expression is intended for doubly-symmetric
sections, a modifier was developed and presented in Helwig et al (1997) to include singly-
symmetric sections. The modified expression is given as follows:
𝐶𝑏 =12.5𝑀𝑚𝑎𝑥
2.5𝑀𝑚𝑎𝑥 + 3𝑀𝐴 + 4𝑀𝐵 + 3𝑀𝐶𝑅𝑚 ≤ 3.0 Equation 2.3
In this equation, Mmax is the maximum moment experienced in the unbraced length, MA,
MB, and MC are the moments at the quarter points of the unbraced length, and Rm is a
parameter accounting for singly-symmetric sections. In cases of single curvature bending,
Rm = 1.0; in cases where reverse curvature bending is present, Rm = 0.5 + 2ρ2.
The location of the load application can have a significant impact on the buckling
capacity of the girder. For example, a load applied above the shear center causes an
additional overturning torque as the girder displaces, while a load applied below the shear
center causes a restoring torque that prevents the girder from twisting. Thus, Equation 2.4
was developed to account for load height in the moment modification factor (Helwig et. al,
1997; Galambos, 1998). In this equation Cb is the moment modification factor from
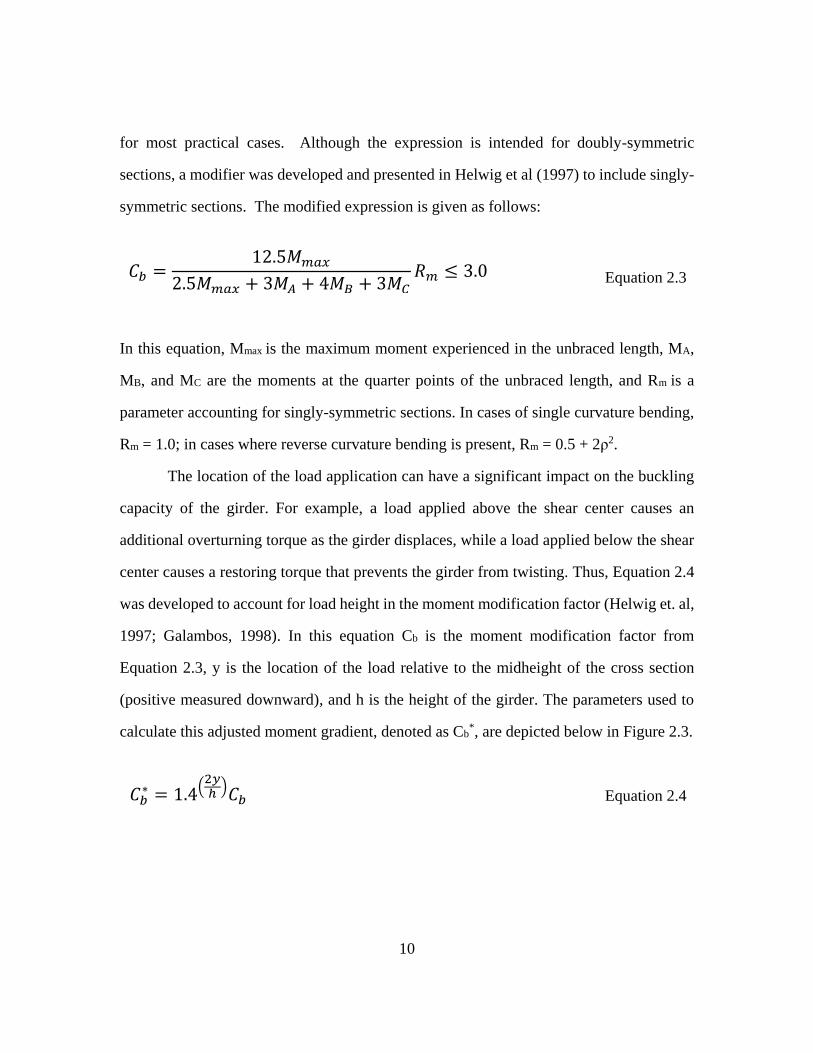
Equation 2.3, y is the location of the load relative to the midheight of the cross section
(positive measured downward), and h is the height of the girder. The parameters used to
calculate this adjusted moment gradient, denoted as Cb*, are depicted below in Figure 2.3.
𝐶𝑏∗ = 1.4
(2𝑦ℎ
)𝐶𝑏 Equation 2.4
11
Figure 2.3: Parameters for Calculating Moment Gradient Accounting for Load Height
In an effort to increase the buckling capacity of noncomposite steel girders during
construction, several methods of bracing have been utilized that allow the members to
exceed the limits derived from the aforementioned section. These braces, in addition to an
explanation into their effectiveness, are discussed in detail in the next section.
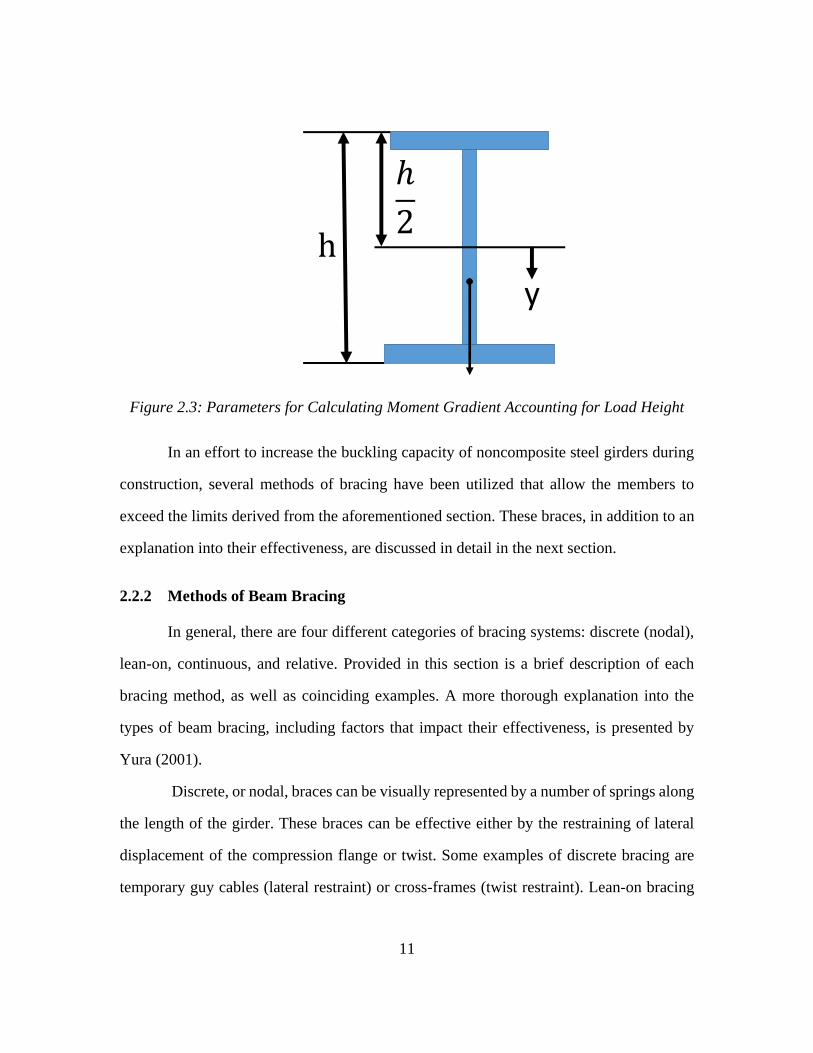
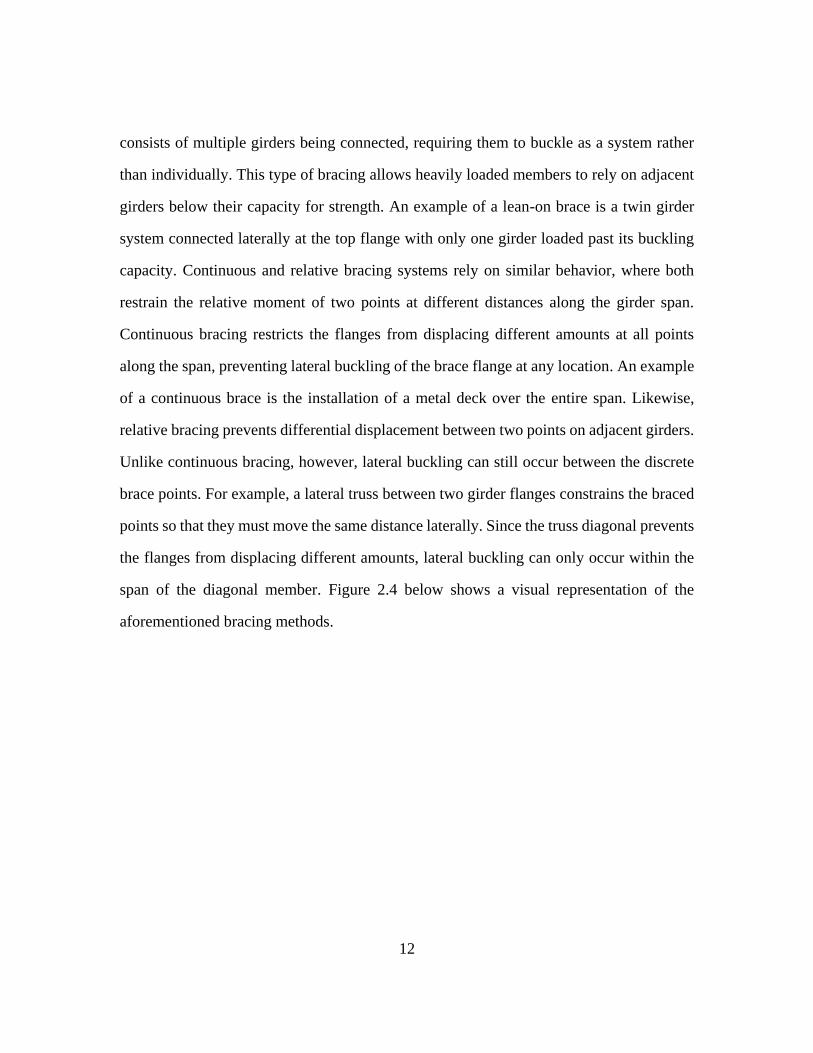
2.2.2 Methods of Beam Bracing
In general, there are four different categories of bracing systems: discrete (nodal),
lean-on, continuous, and relative. Provided in this section is a brief description of each
bracing method, as well as coinciding examples. A more thorough explanation into the
types of beam bracing, including factors that impact their effectiveness, is presented by
Yura (2001).
Discrete, or nodal, braces can be visually represented by a number of springs along
the length of the girder. These braces can be effective either by the restraining of lateral
displacement of the compression flange or twist. Some examples of discrete bracing are
temporary guy cables (lateral restraint) or cross-frames (twist restraint). Lean-on bracing
h
y
12
consists of multiple girders being connected, requiring them to buckle as a system rather
than individually. This type of bracing allows heavily loaded members to rely on adjacent
girders below their capacity for strength. An example of a lean-on brace is a twin girder
system connected laterally at the top flange with only one girder loaded past its buckling
capacity. Continuous and relative bracing systems rely on similar behavior, where both
restrain the relative moment of two points at different distances along the girder span.
Continuous bracing restricts the flanges from displacing different amounts at all points
along the span, preventing lateral buckling of the brace flange at any location. An example
of a continuous brace is the installation of a metal deck over the entire span. Likewise,
relative bracing prevents differential displacement between two points on adjacent girders.
Unlike continuous bracing, however, lateral buckling can still occur between the discrete
brace points. For example, a lateral truss between two girder flanges constrains the braced
points so that they must move the same distance laterally. Since the truss diagonal prevents
the flanges from displacing different amounts, lateral buckling can only occur within the
span of the diagonal member. Figure 2.4 below shows a visual representation of the
aforementioned bracing methods.
13
Figure 2.4: Examples of Different Bracing Methods; Adapted from (Yura & Helwig,
2014)
STRENGTH AND STIFFNESS REQUIREMENTS OF BRACING
Brace effectiveness is a function of both the brace stiffness and strength. If one
parameter is insufficient, the actual buckling capacity of the member will be significantly
less than the expected capacity of the braced system. This was first understood by Winter,
who explained the concept using a simply-supported rigid column with a hinge and
restoring spring (the brace) at midheight (Winter, 1960). Figure 2.5 shows an example of
Winter’s bracing model, from which Winter was able to derive the ideal brace stiffness
required for a perfectly straight system to buckle between the brace points.
Girder Comp. Flanges
Girders
Cross Frame
Lateral Brace
Diaphragm Fastened to Girders
Girder Comp. Flanges
Relative Brace Discrete Brace
Continuous Brace Lean-On BraceP
14
Figure 2.5: Winter’s Rigid Column Bracing Model (Yura & Helwig, 2014)
Perfectly straight members, however, are not realistic in practice and the ideal
stiffness has proven to be unconservative in systems with initial out-of-straightness. This
is illustrated in Figure 2.6, where the column is assigned a reasonable initial imperfection
and the buckling capacity is graphed for different brace stiffnesses. It can be seen that using
the ideal stiffness on a member with initial imperfection will cause the member to buckle
prior to reaching the Euler load.
15
Figure 2.6: Normalized Buckling Capacity of Winter’s Column with Varying Stiffness
and Initial Imperfection (Yura, 2001)
As mentioned previously, the effectiveness of bracing systems is dependent not
only on stiffness but also on brace strength. Returning to the example in Figure 2.5, the
force in the brace can be expressed by Fbr = (Δ - Δo)βbr, where Δ is the total lateral
displacement at midheight, Δo is the initial out-of-straightness at midheight, and βbr is the
stiffness of the brace. Figure 2.6 shows that for an initial imperfection of Lb/500 and a brace
stiffness equal to the ideal stiffness, the total deflection increases greatly as load is applied.
Since the force in the brace is directly related to the midheight displacement, the brace
forces also increase substantially as the load increases. Conversely, the total displacement
is decreased if a larger brace stiffness is implemented, thus decreasing the forces in the
brace. The effects of bracing stiffness on reducing brace forces can be seen below in Figure
2.7, which when considered with Figure 2.6 shows that a brace with two times the ideal
stiffness adequately controls both deformation and brace forces. This relationship between
brace stiffness and strength eventually led to the AISC LRFD Specification recommending
at least twice the ideal stiffness for bracing elements (AISC, 2011).
16
Figure 2.7: Brace Forces Induced for Winter’s Column with Lb/500 Initial Imperfection
and Varying Stiffness (Yura, 2001)
Winter’s work focused on the bracing of column members, which succumb to
primarily flexural buckling modes. This concept can be applied to beam buckling, however
beam braces must also restrain the torsional buckling component. The factors that impact
beam buckling behavior were discussed in Section 2.2.1, including concepts such as
moment gradient, load height, and singly-symmetric behavior. Yura (2001) provides an in-
depth exploration into the factors that affect beam bracing behavior. The next section of
this report will apply the concepts discussed in this section and relate them to shear
diaphragm bracing applications.
DIAPHRAGM BRACING OF BEAM SYSTEMS
For the remainder of this chapter, focus will be placed on shear diaphragm bracing
and its impact on the buckling capacity of girder systems. Shear diaphragms, classified as
either a relative or continuous-type brace based on their connection to the girders, are
17
effective by controlling relative lateral deformations of the top flange that contribute to
LTB. These diaphragms extend along the length of the girders, and provide significant
warping restraint to the girders. Warping occurs when a slender section, such as a steel I-
girder, experiences a lateral displacement of the top and bottom flanges in opposite
directions. When warping is permitted, these flanges are able to displace without inducing
additional stresses in the flanges and the girder is more prone to buckling. If warping is
restrained, bending stresses are induced in the flanges to resist the out of plane movement.
An example of an I-girder with warping permitted (left) and restrained (right) is shown
below in Figure 2.8.
Figure 2.8: I-Girder Section Supported at the Top with Warping Permitted (left) and
Warping Restrained (right)
As a girder system buckles, typically the top flanges of the girders will buckle out of
plane in a half-sine curve with the largest deflection being at the midspan of the
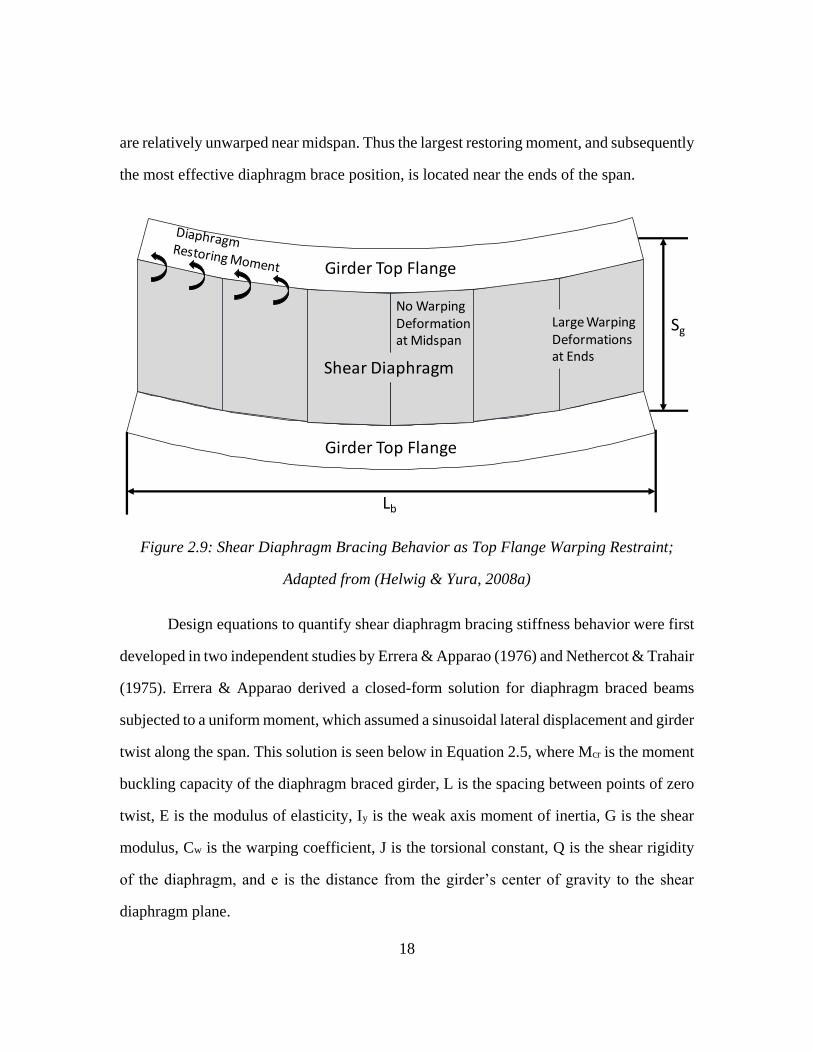
unsupported length. A plan view of this buckling behavior, with shear diaphragm attached,
is shown below in Figure 2.9. As the girders begin to buckle, the shear stiffness of the
diaphragms provide warping restraint to the top flanges. This restoring moment is induced
along the total diaphragm-braced length, though it can also be seen from the figure that the
maximum warping of the flanges occurs near the ends of the girder length while the flanges
T
TC
C
18
are relatively unwarped near midspan. Thus the largest restoring moment, and subsequently
the most effective diaphragm brace position, is located near the ends of the span.
Figure 2.9: Shear Diaphragm Bracing Behavior as Top Flange Warping Restraint;
Adapted from (Helwig & Yura, 2008a)
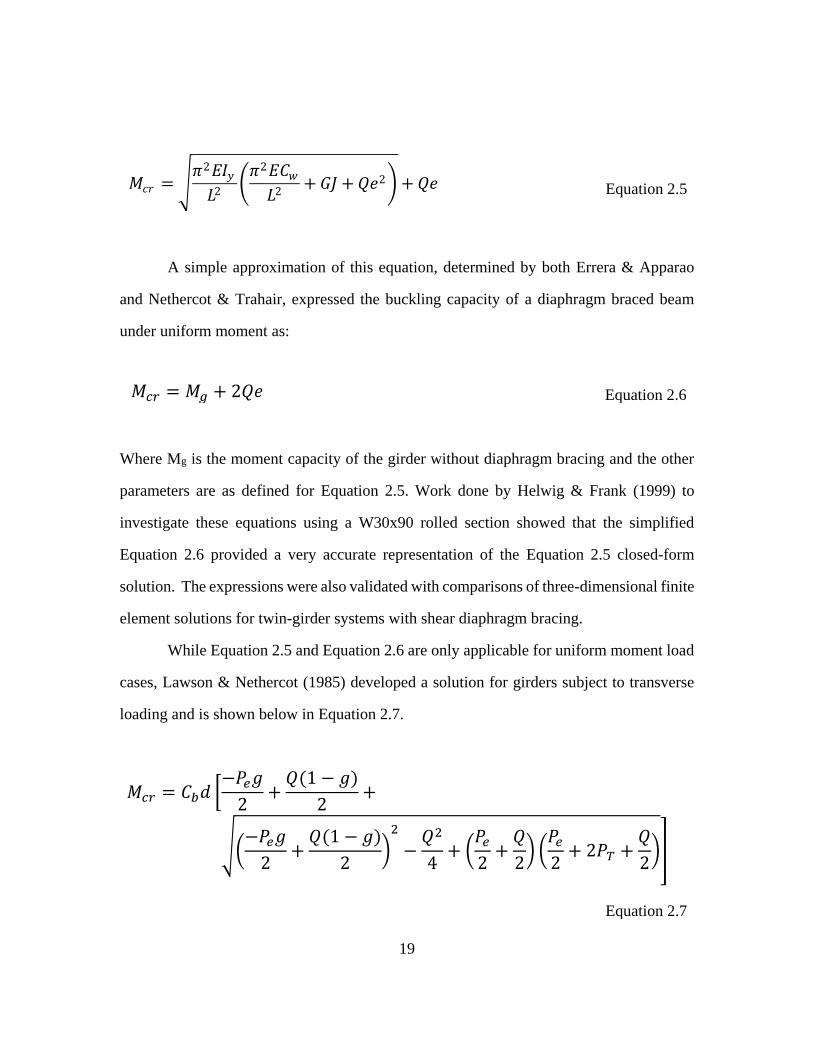
Design equations to quantify shear diaphragm bracing stiffness behavior were first
developed in two independent studies by Errera & Apparao (1976) and Nethercot & Trahair
(1975). Errera & Apparao derived a closed-form solution for diaphragm braced beams
subjected to a uniform moment, which assumed a sinusoidal lateral displacement and girder
twist along the span. This solution is seen below in Equation 2.5, where Mcr is the moment
buckling capacity of the diaphragm braced girder, L is the spacing between points of zero
twist, E is the modulus of elasticity, Iy is the weak axis moment of inertia, G is the shear
modulus, Cw is the warping coefficient, J is the torsional constant, Q is the shear rigidity
of the diaphragm, and e is the distance from the girder’s center of gravity to the shear
diaphragm plane.
Girder Top Flange
Girder Top Flange
No Warping Deformation at Midspan
Shear Diaphragm
Large Warping Deformations at Ends
Lb
Sg
19
Equation 2.5
A simple approximation of this equation, determined by both Errera & Apparao
and Nethercot & Trahair, expressed the buckling capacity of a diaphragm braced beam
under uniform moment as:
𝑀𝑐𝑟 = 𝑀𝑔 + 2𝑄𝑒 Equation 2.6
Where Mg is the moment capacity of the girder without diaphragm bracing and the other
parameters are as defined for Equation 2.5. Work done by Helwig & Frank (1999) to
investigate these equations using a W30x90 rolled section showed that the simplified
Equation 2.6 provided a very accurate representation of the Equation 2.5 closed-form
solution. The expressions were also validated with comparisons of three-dimensional finite
element solutions for twin-girder systems with shear diaphragm bracing.
While Equation 2.5 and Equation 2.6 are only applicable for uniform moment load
cases, Lawson & Nethercot (1985) developed a solution for girders subject to transverse
loading and is shown below in Equation 2.7.
𝑀𝑐𝑟 = 𝐶𝑏𝑑 [−𝑃𝑒𝑔
2+
𝑄(1 − 𝑔)
2+
√(−𝑃𝑒𝑔
2+
𝑄(1 − 𝑔)
2)
2
−𝑄2
4+ (
𝑃𝑒
2+
𝑄
2) (
𝑃𝑒
2+ 2𝑃𝑇 +
𝑄
2)]
Equation 2.7
𝑀𝑐𝑟 = √𝜋2𝐸𝐼𝑦
𝐿2(
𝜋2𝐸𝐶𝑤
𝐿2+ 𝐺𝐽 + 𝑄𝑒2) + 𝑄𝑒
20
In Lawson & Nethercot’s equation d is the depth of the girder, Pe is the Euler weak axis
buckling capacity or Pe = (π2EIy/L2), PT = GJ/d2, g is defined as the load height factor, and
all other variables are as previously defined. This equation also incorporated the moment
gradient coefficient, Cb, to account for non-uniform moment. However, later studies done
by Helwig concluded that Equation 2.7 overestimated the shear diaphragm bracing
behavior for these systems (1994).
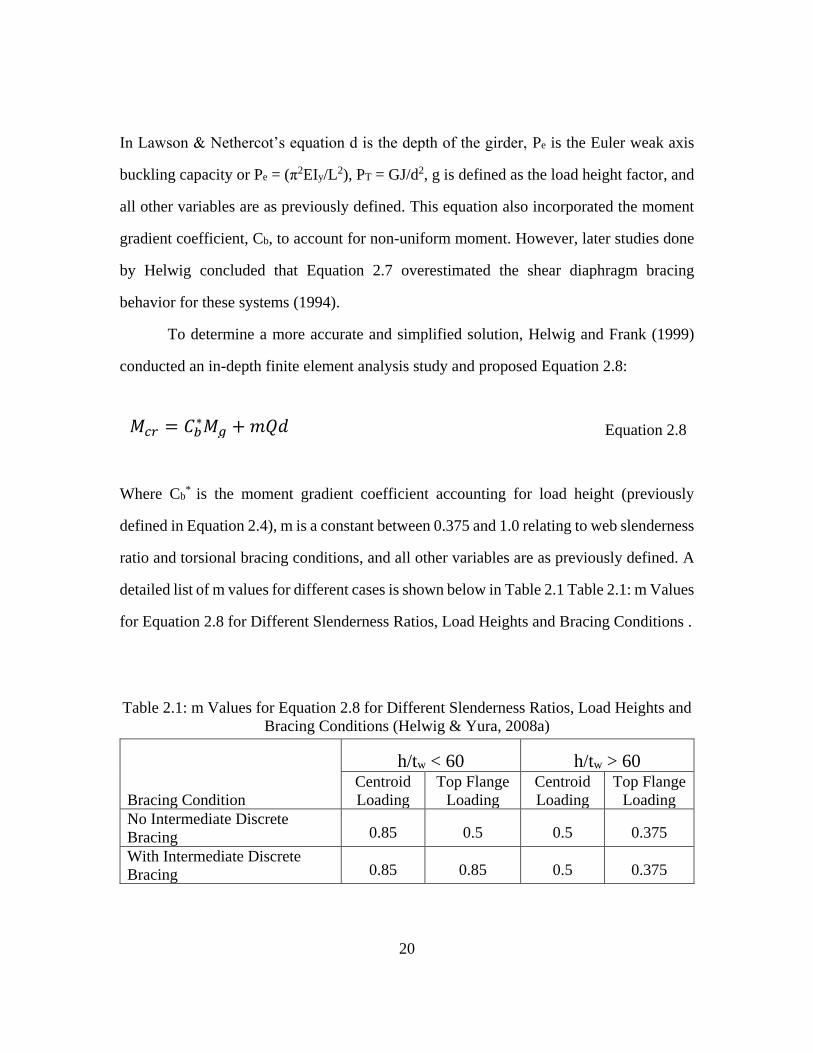
To determine a more accurate and simplified solution, Helwig and Frank (1999)
conducted an in-depth finite element analysis study and proposed Equation 2.8:
𝑀𝑐𝑟 = 𝐶𝑏∗𝑀𝑔 + 𝑚𝑄𝑑 Equation 2.8
Where Cb*
is the moment gradient coefficient accounting for load height (previously
defined in Equation 2.4), m is a constant between 0.375 and 1.0 relating to web slenderness
ratio and torsional bracing conditions, and all other variables are as previously defined. A
detailed list of m values for different cases is shown below in Table 2.1 Table 2.1: m Values
for Equation 2.8 for Different Slenderness Ratios, Load Heights and Bracing Conditions .
Table 2.1: m Values for Equation 2.8 for Different Slenderness Ratios, Load Heights and
Bracing Conditions (Helwig & Yura, 2008a)
Bracing Condition
h/tw < 60 h/tw > 60
Centroid
Loading
Top Flange
Loading
Centroid
Loading
Top Flange
Loading
No Intermediate Discrete
Bracing 0.85 0.5 0.5 0.375
With Intermediate Discrete
Bracing 0.85 0.85 0.5 0.375
21
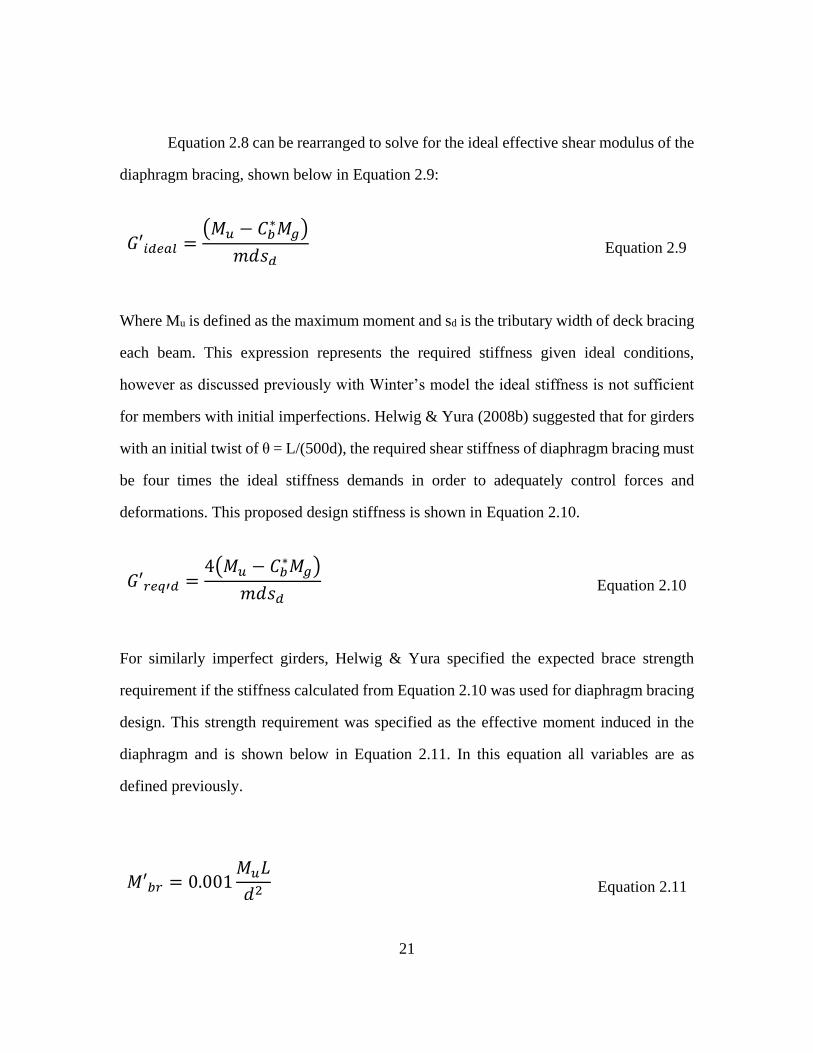
Equation 2.8 can be rearranged to solve for the ideal effective shear modulus of the
diaphragm bracing, shown below in Equation 2.9:
𝐺′𝑖𝑑𝑒𝑎𝑙 =(𝑀𝑢 − 𝐶𝑏
∗𝑀𝑔)
𝑚𝑑𝑠𝑑 Equation 2.9
Where Mu is defined as the maximum moment and sd is the tributary width of deck bracing
each beam. This expression represents the required stiffness given ideal conditions,
however as discussed previously with Winter’s model the ideal stiffness is not sufficient
for members with initial imperfections. Helwig & Yura (2008b) suggested that for girders
with an initial twist of θ = L/(500d), the required shear stiffness of diaphragm bracing must
be four times the ideal stiffness demands in order to adequately control forces and
deformations. This proposed design stiffness is shown in Equation 2.10.
𝐺′𝑟𝑒𝑞′𝑑 =4(𝑀𝑢 − 𝐶𝑏
∗𝑀𝑔)
𝑚𝑑𝑠𝑑 Equation 2.10
For similarly imperfect girders, Helwig & Yura specified the expected brace strength
requirement if the stiffness calculated from Equation 2.10 was used for diaphragm bracing
design. This strength requirement was specified as the effective moment induced in the
diaphragm and is shown below in Equation 2.11. In this equation all variables are as
defined previously.
𝑀′𝑏𝑟 = 0.001𝑀𝑢𝐿
𝑑2 Equation 2.11
22
This section provided a discussion of past research related to the buckling capacity
of both unbraced and diaphragm-braced girder systems. Also explained in this section were
the design requirements for diaphragms in girder bracing applications. The following
section provides the background on determining the stiffness and strength of shear
diaphragm systems in an experimental test procedure, as well as a discussion on the
behavior of diaphragms when subjected to shear loading.
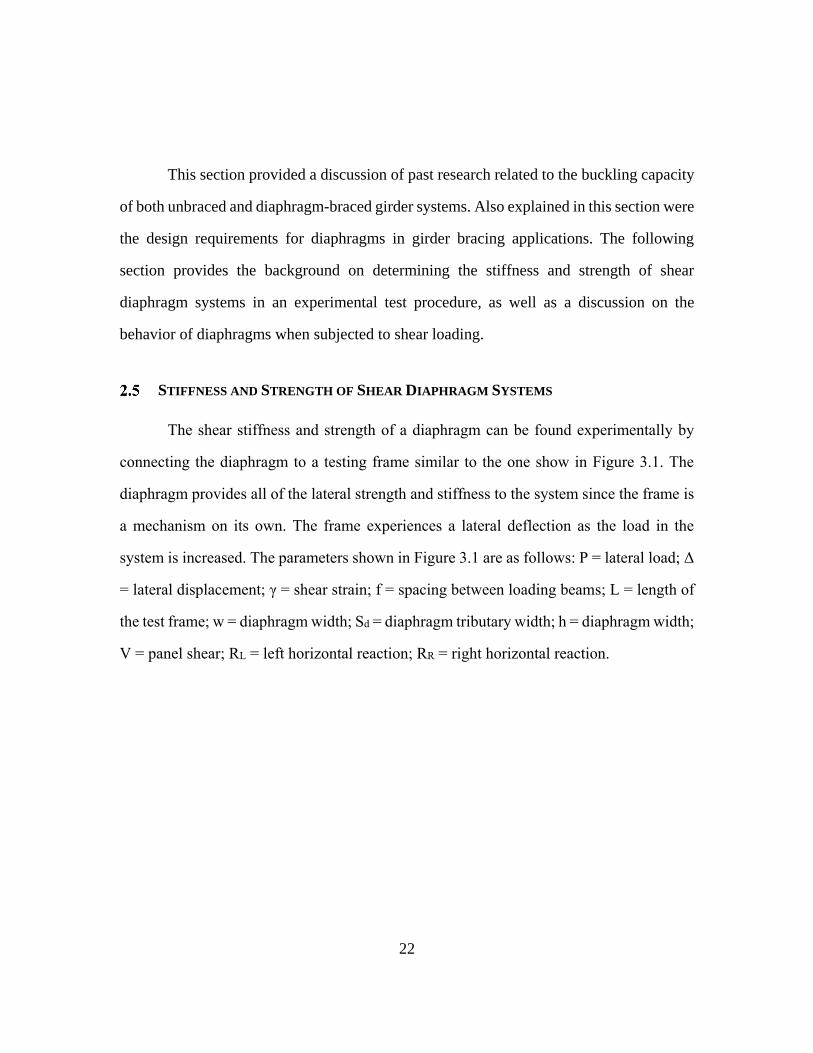
STIFFNESS AND STRENGTH OF SHEAR DIAPHRAGM SYSTEMS
The shear stiffness and strength of a diaphragm can be found experimentally by
connecting the diaphragm to a testing frame similar to the one show in Figure 3.1. The
diaphragm provides all of the lateral strength and stiffness to the system since the frame is
a mechanism on its own. The frame experiences a lateral deflection as the load in the
system is increased. The parameters shown in Figure 3.1 are as follows: P = lateral load; Δ
= lateral displacement; γ = shear strain; f = spacing between loading beams; L = length of
the test frame; w = diaphragm width; Sd = diaphragm tributary width; h = diaphragm width;
V = panel shear; RL = left horizontal reaction; RR = right horizontal reaction.
23
Figure 2.10: Shear Test Frame with Diaphragm
The shear force on the diaphragm can be found from statics by taking a cut through
the system and summing the forces in the vertical direction as shown in Figure 3.2.
Therefore, the internal shear force on the diaphragm must be V = PL/f and the
corresponding average shear stress on the diaphragm must be τ’ = V/w with units of force
per unit length (k/in). Traditionally, shear modulus, G, is defined as shear stress divided by
shear strain. For the purposes of this report, the effective shear modulus will be defined as
G’ = τ’/γ. Thus, for the system shown in Figure 3.1, the expression for G’ will be:
𝐺′ =𝑃𝐿
𝑓𝑤𝛾 (k/in) Equation 2.12
V = PL/f
P
w L
f
SdSd
V = PL/f
g
D
RL RR
h
24
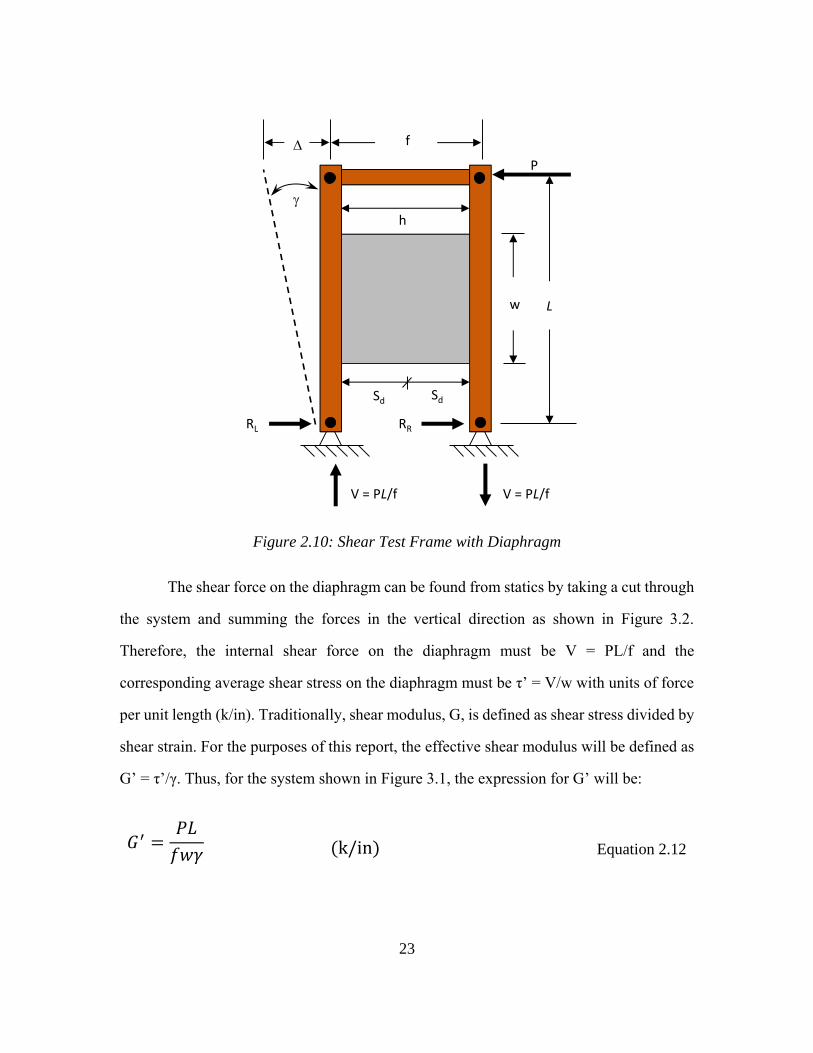
Furthermore, the diaphragm shear rigidity, Q, is expressed as follows:
𝑄 = 𝐺′𝑠𝑑 (k/rad) Equation 2.13
For the test frame, the diaphragm tributary width is simply sd = h/2, but for a bridge the
following expression must be used (Egilmez, 2005):
𝑠𝑑 =(𝑆𝑔 − 𝑏𝑡𝑓)(𝑛 − 1)
𝑛 (ft) Equation 2.14
Where, Sg = center to center spacing of girders; btf = girder top flange width; n = number
of girders.
Figure 2.11: Internal Reactions of Shear Diaphragm
V = PL/f
P
w L
h
V = PL/f
RL RR
F F
V M M
V
A A
V
M M
25
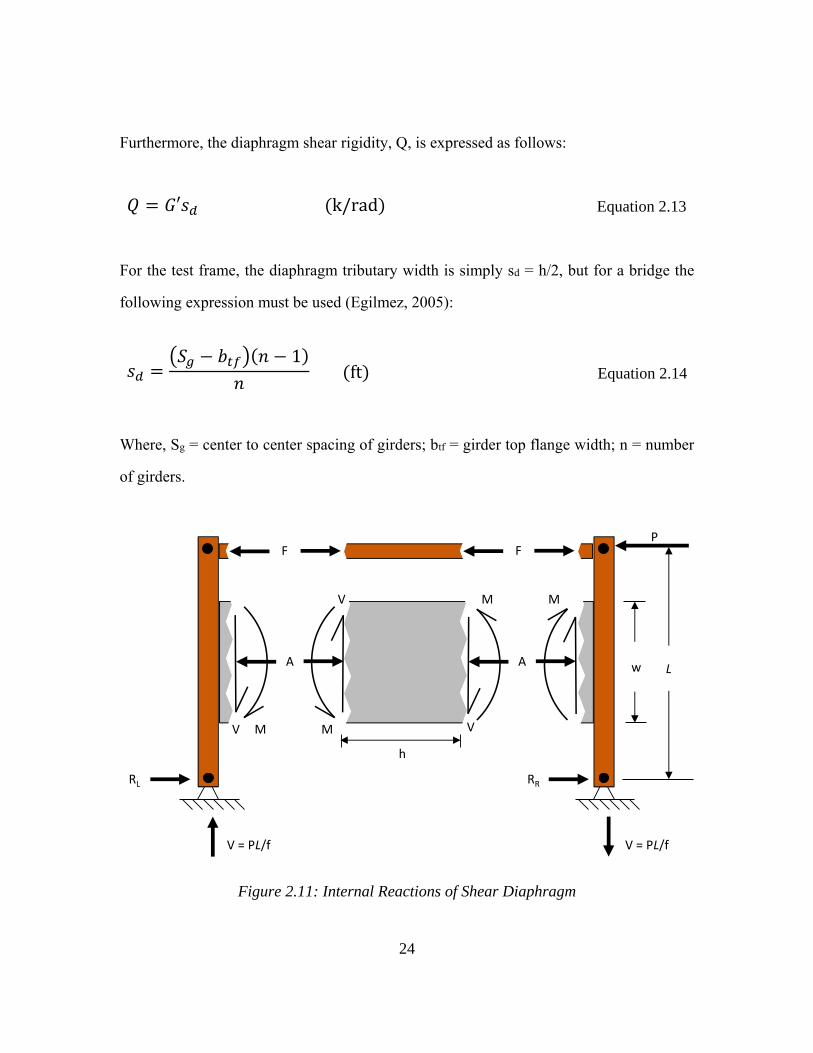
In addition to shear, the diaphragm experiences a moment, M, and can potentially
experience an axial load, A, to satisfy equilibrium. From statics, M = Vh/2 and the moment
on the left side of the diaphragm equals the moment on the right side of the diaphragm due
to symmetry. The axial load on the panel depends on the stiffness properties of the
diaphragm. For simplicity, the diaphragm can be visualized as a cross-frame with a tension
tie and a compression strut as shown in Figure 2.12. If the diaphragm has the same stiffness
in compression and in tension, then A = 0, F = P/2 (compression), and RL = RR = P/2. If
the diaphragm is stiffer in compression than it is in tension, then A > 0 (compression), F <
P/2 (compression), and RL > RR. This is the case for reinforced concrete diaphragms after
tension cracks have formed. If the diaphragm compression stiffness is much greater than
the diaphragm tension stiffness, the diaphragm behaves as a compression brace.
Figure 2.12: Diaphragm Shear Behavior
V
P
C
V
CT
T
26
The ultimate shear strength of the diaphragm is simply taken as Vult = PultL/f. Thus,
the ultimate effective shear capacity of the diaphragm is calculated as:
𝑆𝑢𝑙𝑡′ =
𝑃𝑢𝑙𝑡𝐿
𝑓𝑤 (k/in) Equation 2.15
The ultimate shear capacity of the diaphragm can be governed by the strength of the
diaphragm itself or by the strength of the connection from the diaphragm to the test frame
or by a combination of the two. The following section provides a summary of past research
on shear diaphragm bracing capabilities of permanent metal deck forms (PMDFs), as well
as the findings from these experiments.
PERMANENT METAL DECK FORMS AS SHEAR DIAPHRAGM BRACES
This section focuses on the results from previous studies regarding permanent metal
deck forms and their performance as a shear diaphragm. Extensive research has been
conducted on the viability of permanent metal deck forms, or PMDFs, as diaphragm
bracing elements. PMDFs are widely used on steel bridge systems as formwork for the
concrete deck, however researchers have investigated if they could be relied on as braces
during the construction phase where stability presents the greatest concern. A study
conducted by Currah (1993) considered the shear stiffness and strength capacities of
different types of open profile and flat soffit PMDFs. Results from this experiment
illustrated that the stiffness of the diaphragm was not the only parameter for ensuring brace
effectiveness, but that flexibility in the diaphragm-girder connection could greatly decrease
the system stiffness and strength. Diaphragm bracing by profiled sheeting is commonly
relied upon in the building industry when the sheeting is fastened directly to the
27
beams/girders. However, PMDF in the bridge industry is typically supported on cold-
formed angles that allow the contractor to vary the elevation of the forms to account for
changes in the flange thickness along the length as well as differential camber between
adjacent girders. As the eccentricity of the welded deck support angle increases with the
support angle, the connection to the girders introduces significant flexibility that impacts
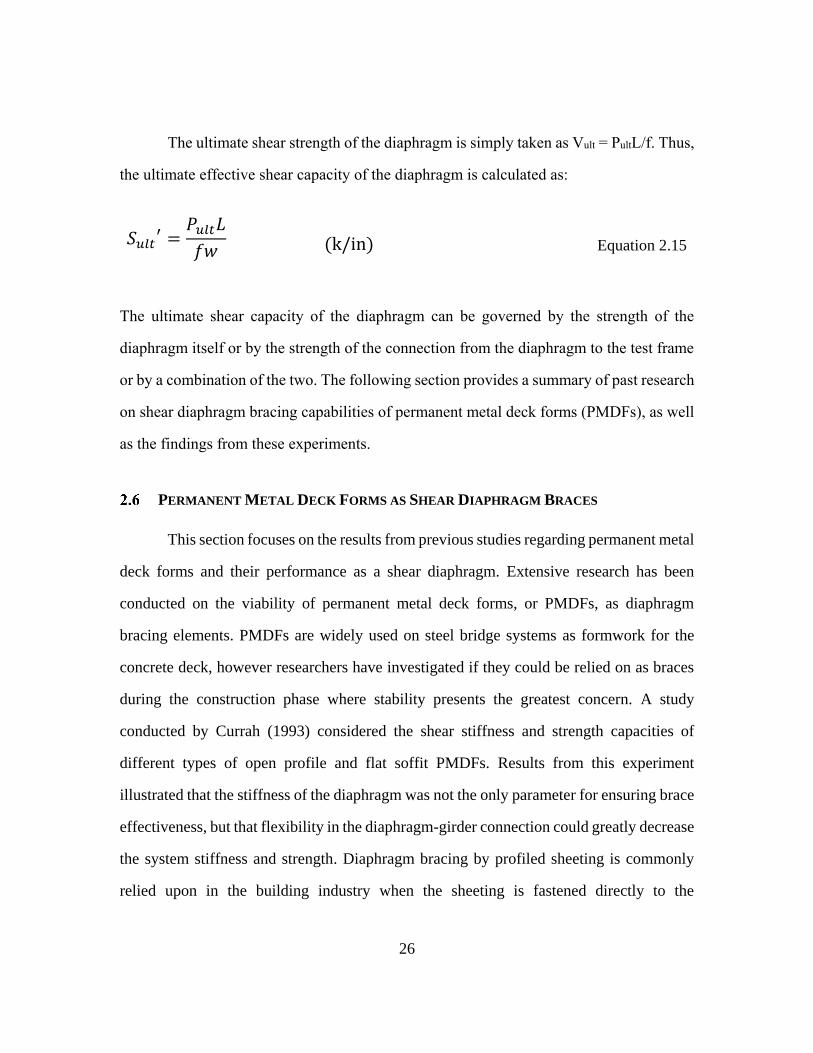
the bracing behavior of the shear diaphragm. An example of this can be seen in Table 2.2,
where four different flat soffit (LSM) PMDFs were loaded in shear and the system stiffness
was determined. The table shows the stiffness of the diaphragm as well as the effect of the
connection stiffness.
Table 2.2: Flat Soffit Shear Stiffnesses for Various Connection Methods. Rigid vs.
Eccentric Support Angle is shown as Boxed (Currah, 1993)
28
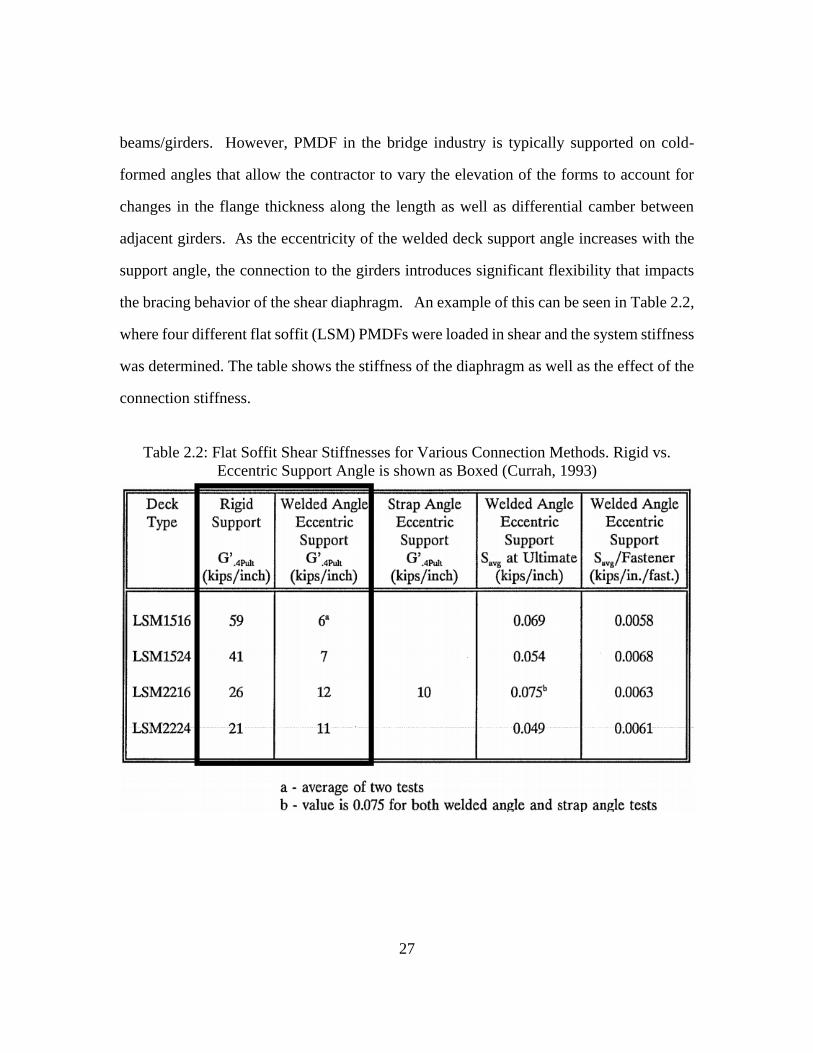
Later work completed by Jetann (2003) and Egilmez (2005) coincided with
Currah’s observation that increased eccentricity in the support angles decreased the
stiffness and strength of the PMDF system. However, these eccentricities could not be
avoided in most applications due to changes in flange thickness or differential camber
between girder lines. To counter the effect of support angle eccentricity, Egilmez utilized
a stiffening angle at the overlap of the metal decking sheets (or each end for a single sheet)
as shown in Figure 2.13. This angle was attached to the girder via a welded connection
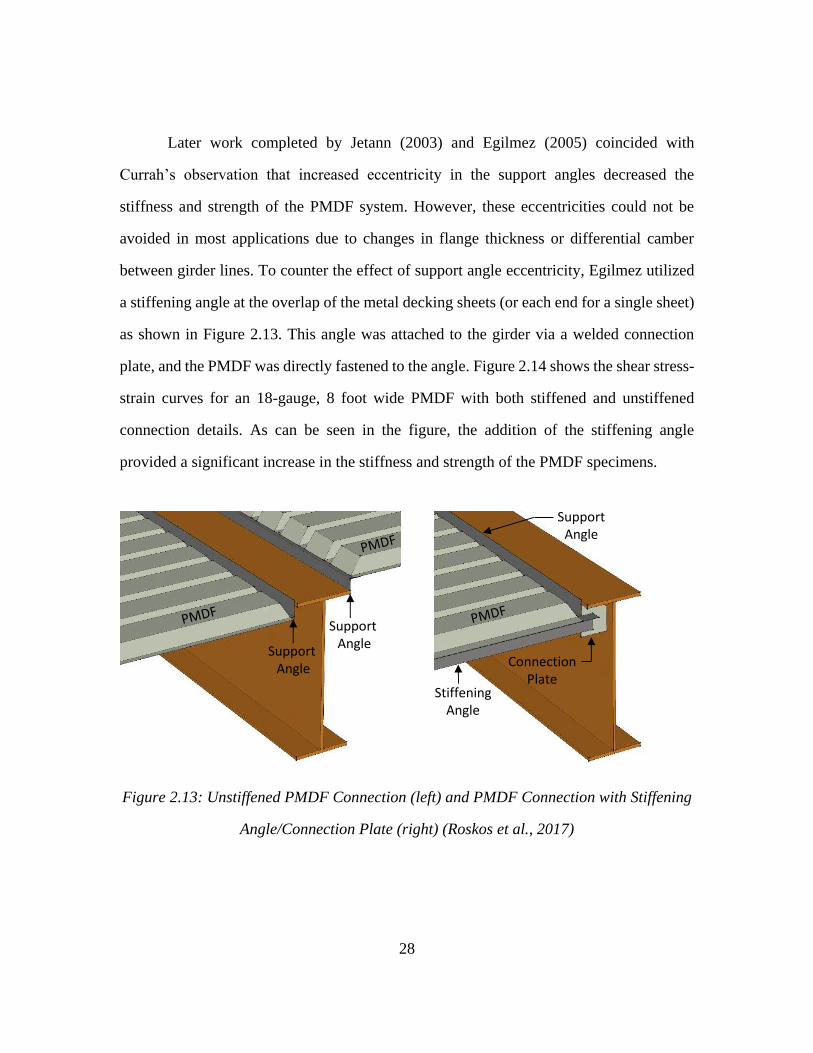
plate, and the PMDF was directly fastened to the angle. Figure 2.14 shows the shear stress-
strain curves for an 18-gauge, 8 foot wide PMDF with both stiffened and unstiffened
connection details. As can be seen in the figure, the addition of the stiffening angle
provided a significant increase in the stiffness and strength of the PMDF specimens.
Figure 2.13: Unstiffened PMDF Connection (left) and PMDF Connection with Stiffening
Angle/Connection Plate (right) (Roskos et al., 2017)
Stiffening Angle
Support Angle
Connection Plate
Support Angle
Support Angle
29
Figure 2.14: Shear Stress-Strain Curve for an 18ga PMDF with Stiffened (X) and
Unstiffened Connections (Jetann, 2003)
This purpose of this chapter was to provide a detailed summary into the
fundamental concepts of girder buckling and bracing. This chapter primarily focused on
the idea of shear diaphragm bracing, including the evolution of previous research regarding
the use of PMDFs as a bracing element. The ensuing chapters of this thesis will discuss the
experimental procedure and findings of current research stemming from the concepts
discussed in this chapter.
Although the focus of this research is on the bracing behavior of precast concrete
panels, there are some similarities with the PMDF bracing. The PCPs are typically
supported on a bedding strip to adjust the elevation of the panels and the bedding strip can
have a similar effect as the cold-formed support angle for the PMDF.
30
CHAPTER 3: SHEAR FRAME EXPERIMENTAL PROCEDURE
OVERVIEW
This chapter discusses the experimental procedure for the full-scale PCP shear
frame tests. The purpose of these tests were to develop an effective connection between the
PCPs and the top flanges of steel girder systems, as well as to empirically determine the
structural behavior of these modified PCPs when subjected to in-plane shear loading. The
fabrication of the test assembly, as well as the setup and instrumentation for each of the
PCP connection details considered, are explained within this chapter.
SHEAR FRAME FABRICATION
It should be noted that this section is abridged and is included to provide clarity for
proceeding sections. The thesis work published by McCammon discusses in detail
additional parameters considered in the behavior of the shear frame assembly (2015).
3.2.1 Shear Frame Test Setup
The shear frame was designed and fabricated with the intent to primarily subject
the PCP/connection system to pure shear deformations. To ensure accurate measurements,
the members of the test frame were designed to have large axial, flexural, and torsional
stiffness to minimize the elastic deformations of the frame during the tests. Furthermore,
the frame was designed and detailed to minimize internal friction so that the measurements
correctly reflected the strength and stiffness of the PCP/connection system.
The test apparatus was constructed at the Ferguson Structural Engineering
Laboratory (FSEL) in an orientation consistent with reality (i.e. the PCPs were placed
parallel to the earth’s surface). The frame was anchored to the FSEL reaction floor that has
31
anchors at 4 ft on center. For the purpose of discussion, the frame has been broken down
into six main parts: two reaction blocks, two loading beams, one adjustable connection
strap, one hydraulic actuator, and four tie-down beams. Figure 3.1 shows a plan view
drawing of the testing frame with the major components identified. A picture of the
assembled frame is shown in Figure 3.2.
Figure 3.1: Plan View of Test Setup
North Reaction Block
South Reaction Block
Adjustable Connecting Strap
Hydraulic Actuator
Loading Beams
Load Cell
N
Tie-Down Beams
Tie-Down Beams
Pin/Needle Bearing Assembly
Clevis
32
Figure 3.2: Isometric View of Test Setup
33
The south reaction block consisted of two 18 ft long W36x135 beams bolted
together at the flanges and supported vertically by two 18 ft long W12x65 beams located
directly above the anchors in the strong floor. A total of 40 threaded 1 inch diameter rods
pass through the webs of the W36x135 beams and both flanges of the W12x65 beams.
Each threaded rod was post-tensioned to a force of approximately 30 kips, resulting in a
total clamping force in excess of 1000 kips between the south reaction block and the strong
floor. This large force was required to keep the reaction block from sliding and/or spinning
due to the shear force and moment couple from the frame. The north reaction block
consisted of two W12x65 beams that were post-tensioned to approximately 500 kips to the
strong floor by 16 threaded 1 inch diameter rods. The W12x65s were connected by a
W12x79 spreader beam that directly resisted load from the actuator.
The two loading beams were each fabricated from a 16 ft long W12x79 rolled
section and a 16 ft long 18x1 inch steel plate that simulated the top flange of a bridge girder.
The W12x79 beams were oriented with the webs parallel to the strong floor and the 18x1
inch plates rested on top of the edge of the two flanges. These two sections were stitch
welded together, forming a closed section that had a large torsional and flexural stiffness.
The loading beams were each supported vertically by three heavy duty casters that reacted
on a ½ inch thick plate which was leveled with hydrostone and supported by the strong
floor. Figure 3.3 shows a cross-section of the loading beam assembly.
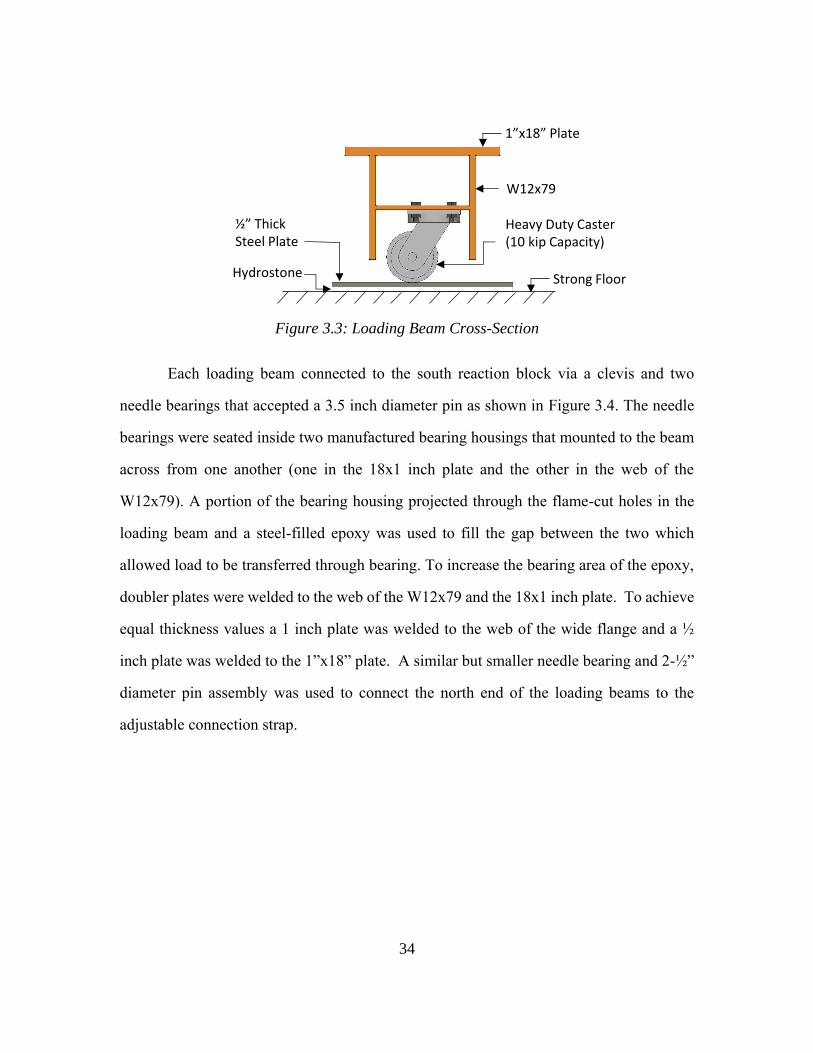
34
Figure 3.3: Loading Beam Cross-Section
Each loading beam connected to the south reaction block via a clevis and two
needle bearings that accepted a 3.5 inch diameter pin as shown in Figure 3.4. The needle
bearings were seated inside two manufactured bearing housings that mounted to the beam
across from one another (one in the 18x1 inch plate and the other in the web of the
W12x79). A portion of the bearing housing projected through the flame-cut holes in the
loading beam and a steel-filled epoxy was used to fill the gap between the two which
allowed load to be transferred through bearing. To increase the bearing area of the epoxy,
doubler plates were welded to the web of the W12x79 and the 18x1 inch plate. To achieve
equal thickness values a 1 inch plate was welded to the web of the wide flange and a ½
inch plate was welded to the 1”x18” plate. A similar but smaller needle bearing and 2-½”
diameter pin assembly was used to connect the north end of the loading beams to the
adjustable connection strap.
1”x18” Plate
W12x79
Heavy Duty Caster(10 kip Capacity)
½” Thick Steel Plate
Hydrostone Strong Floor
35
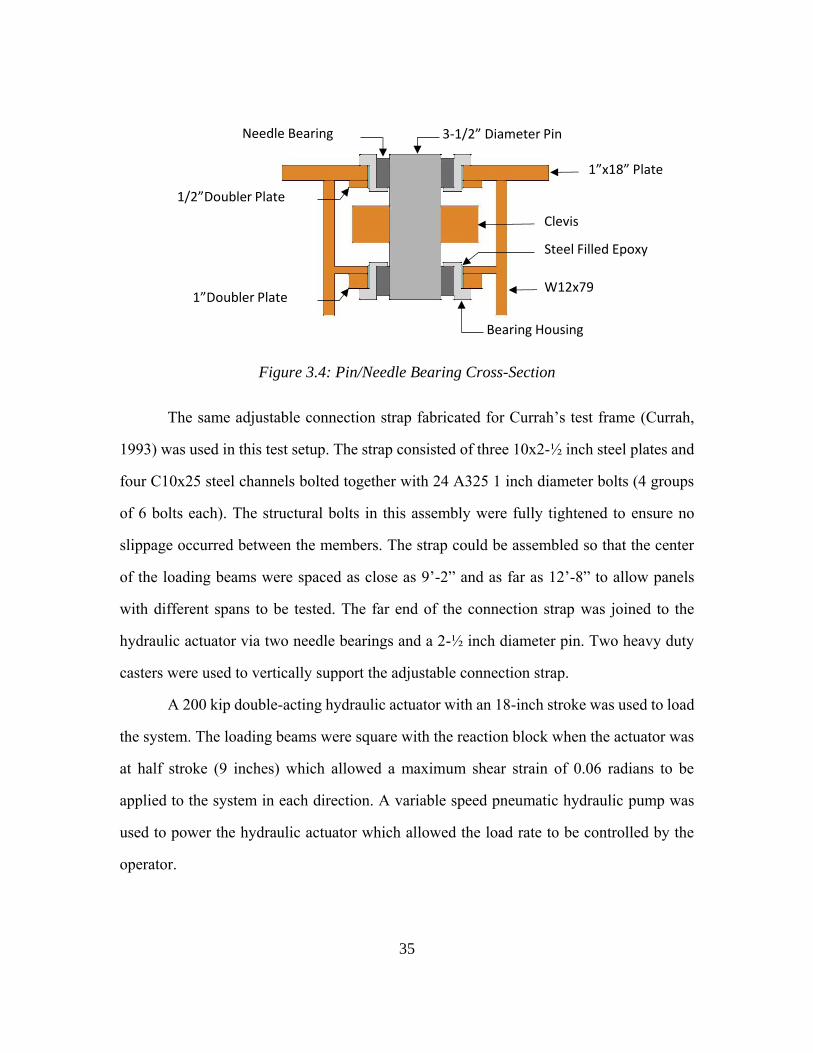
Figure 3.4: Pin/Needle Bearing Cross-Section
The same adjustable connection strap fabricated for Currah’s test frame (Currah,
1993) was used in this test setup. The strap consisted of three 10x2-½ inch steel plates and
four C10x25 steel channels bolted together with 24 A325 1 inch diameter bolts (4 groups
of 6 bolts each). The structural bolts in this assembly were fully tightened to ensure no
slippage occurred between the members. The strap could be assembled so that the center
of the loading beams were spaced as close as 9’-2” and as far as 12’-8” to allow panels
with different spans to be tested. The far end of the connection strap was joined to the
hydraulic actuator via two needle bearings and a 2-½ inch diameter pin. Two heavy duty
casters were used to vertically support the adjustable connection strap.
A 200 kip double-acting hydraulic actuator with an 18-inch stroke was used to load
the system. The loading beams were square with the reaction block when the actuator was
at half stroke (9 inches) which allowed a maximum shear strain of 0.06 radians to be
applied to the system in each direction. A variable speed pneumatic hydraulic pump was
used to power the hydraulic actuator which allowed the load rate to be controlled by the
operator.
1”x18” Plate
W12x79
Clevis
3-1/2” Diameter Pin
Bearing Housing
Needle Bearing
Steel Filled Epoxy
1/2”Doubler Plate
1”Doubler Plate
36
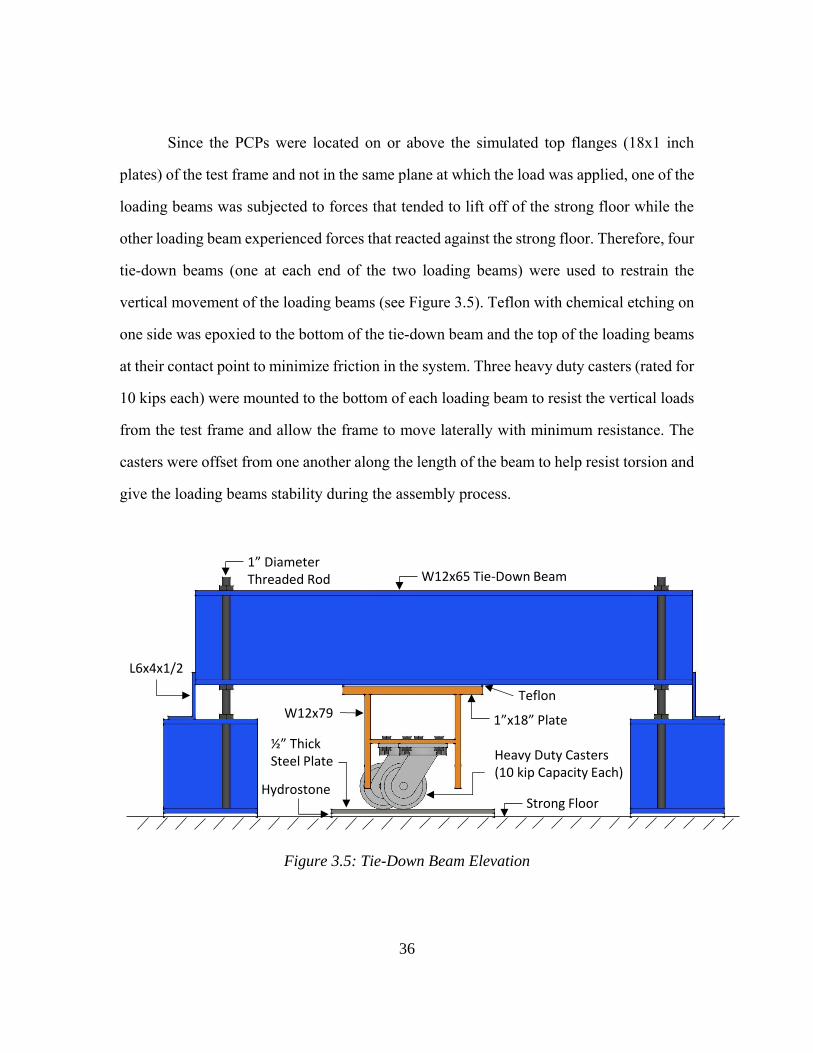
Since the PCPs were located on or above the simulated top flanges (18x1 inch
plates) of the test frame and not in the same plane at which the load was applied, one of the
loading beams was subjected to forces that tended to lift off of the strong floor while the
other loading beam experienced forces that reacted against the strong floor. Therefore, four
tie-down beams (one at each end of the two loading beams) were used to restrain the
vertical movement of the loading beams (see Figure 3.5). Teflon with chemical etching on
one side was epoxied to the bottom of the tie-down beam and the top of the loading beams
at their contact point to minimize friction in the system. Three heavy duty casters (rated for
10 kips each) were mounted to the bottom of each loading beam to resist the vertical loads
from the test frame and allow the frame to move laterally with minimum resistance. The
casters were offset from one another along the length of the beam to help resist torsion and
give the loading beams stability during the assembly process.
Figure 3.5: Tie-Down Beam Elevation
1”x18” Plate W12x79
Heavy Duty Casters(10 kip Capacity Each)
½” Thick Steel Plate
HydrostoneStrong Floor
W12x65 Tie-Down Beam
Teflon
1” DiameterThreaded Rod
L6x4x1/2

37
Care was taken in assembling the test frame in an effort to minimize friction in the
system. The loading beams and adjustable connection strap were placed on blocks and
leveled. At this point, the casters were located approximately 1 to 1-½ inches above the
strong floor (which was not perfectly level in the region of the test setup). Eight ½ inch
thick steel plates were placed under the casters and raised with three leveling screws until
the plates came into contact with the casters. Hydrostone (quick-setting grout) was then
poured between the strong floor and the steel plates and the blocks were removed from the
test frame. The result was a level surface on which the leveled test frame could move. The
tie-down beams were then placed on top of the loading beams and leveled.
SPECIMEN DESIGN AND GEOMETRY
Due to the absence of prior research on the bracing capabilities of precast concrete
panels, the PCP specimens were designed for a number of different failure modes specified
in AISC and ACI standards. These parameters were considered in addition to current
TxDOT standards on PCP design. The details of those parameters considered, as well as
the geometries selected for experimental testing, are discussed within this section.
3.3.1 Panel Design and Geometry
Typical curved steel I-girder bridges have a girder spacing between six and twelve
feet. Given that the PCPs would be required to span this distance, it was important that the
panel geometry provide a reasonable representation of what would be expected in field
applications. TxDOT standards require that precast deck panels at or exceeding a width of
five feet be cast with prestressed strands in the transverse direction, so a local precaster
was consulted for casting operations (TxDOT, 2006). Limitations of the shear frame’s
adjustable connection strap (discussed in Section 3.2.1) required a minimum panel length
38
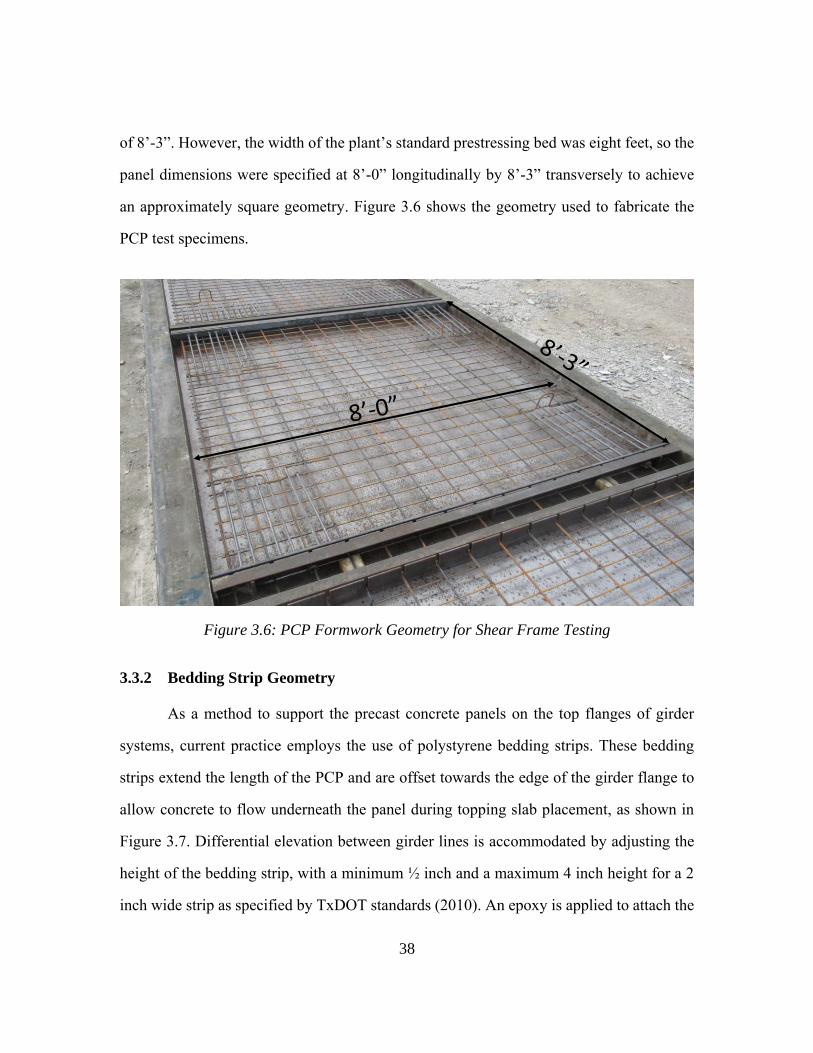
of 8’-3”. However, the width of the plant’s standard prestressing bed was eight feet, so the
panel dimensions were specified at 8’-0” longitudinally by 8’-3” transversely to achieve
an approximately square geometry. Figure 3.6 shows the geometry used to fabricate the
PCP test specimens.
Figure 3.6: PCP Formwork Geometry for Shear Frame Testing
3.3.2 Bedding Strip Geometry
As a method to support the precast concrete panels on the top flanges of girder
systems, current practice employs the use of polystyrene bedding strips. These bedding
strips extend the length of the PCP and are offset towards the edge of the girder flange to
allow concrete to flow underneath the panel during topping slab placement, as shown in
Figure 3.7. Differential elevation between girder lines is accommodated by adjusting the
height of the bedding strip, with a minimum ½ inch and a maximum 4 inch height for a 2
inch wide strip as specified by TxDOT standards (2010). An epoxy is applied to attach the
39
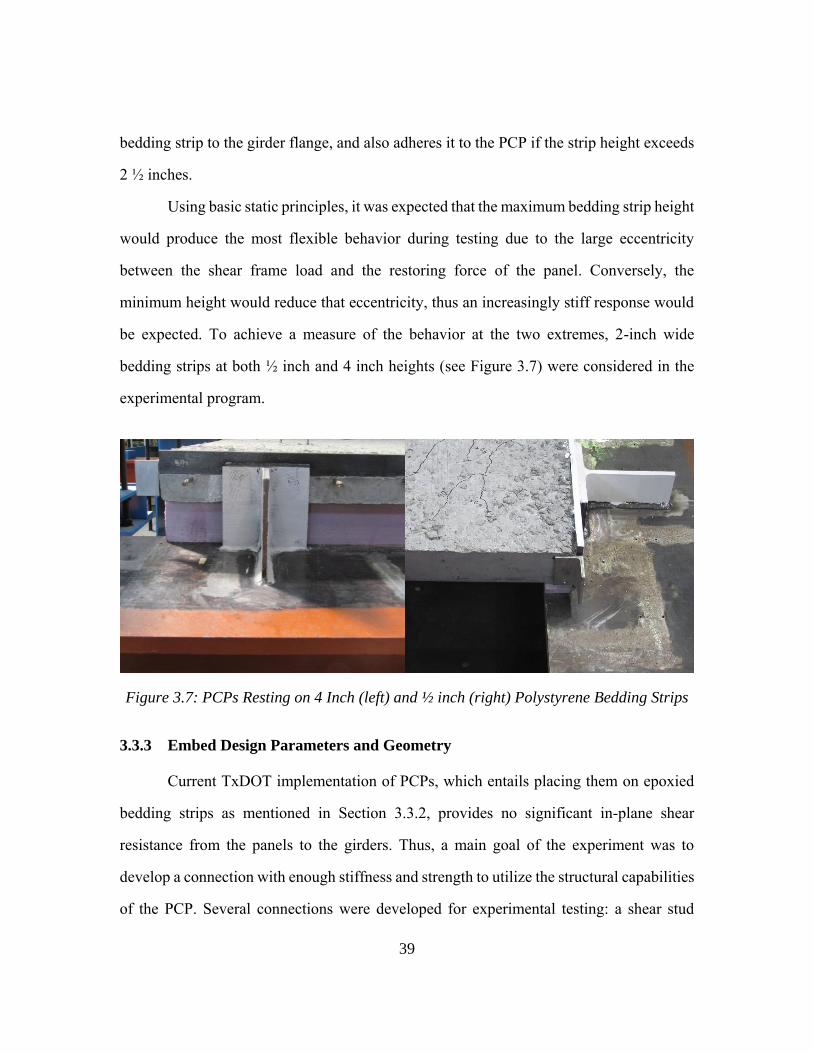
bedding strip to the girder flange, and also adheres it to the PCP if the strip height exceeds
2 ½ inches.
Using basic static principles, it was expected that the maximum bedding strip height
would produce the most flexible behavior during testing due to the large eccentricity
between the shear frame load and the restoring force of the panel. Conversely, the
minimum height would reduce that eccentricity, thus an increasingly stiff response would
be expected. To achieve a measure of the behavior at the two extremes, 2-inch wide
bedding strips at both ½ inch and 4 inch heights (see Figure 3.7) were considered in the
experimental program.
Figure 3.7: PCPs Resting on 4 Inch (left) and ½ inch (right) Polystyrene Bedding Strips
3.3.3 Embed Design Parameters and Geometry
Current TxDOT implementation of PCPs, which entails placing them on epoxied
bedding strips as mentioned in Section 3.3.2, provides no significant in-plane shear
resistance from the panels to the girders. Thus, a main goal of the experiment was to
develop a connection with enough stiffness and strength to utilize the structural capabilities
of the PCP. Several connections were developed for experimental testing: a shear stud
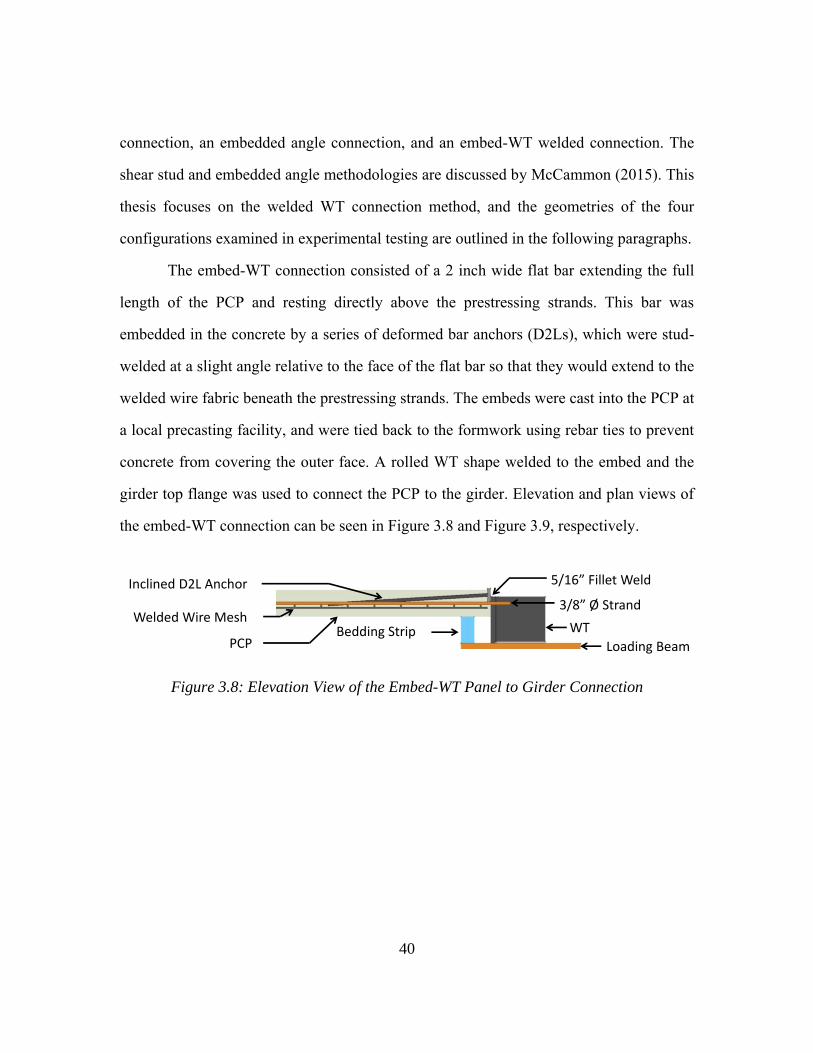
40
connection, an embedded angle connection, and an embed-WT welded connection. The
shear stud and embedded angle methodologies are discussed by McCammon (2015). This
thesis focuses on the welded WT connection method, and the geometries of the four
configurations examined in experimental testing are outlined in the following paragraphs.
The embed-WT connection consisted of a 2 inch wide flat bar extending the full
length of the PCP and resting directly above the prestressing strands. This bar was
embedded in the concrete by a series of deformed bar anchors (D2Ls), which were stud-
welded at a slight angle relative to the face of the flat bar so that they would extend to the
welded wire fabric beneath the prestressing strands. The embeds were cast into the PCP at
a local precasting facility, and were tied back to the formwork using rebar ties to prevent
concrete from covering the outer face. A rolled WT shape welded to the embed and the
girder top flange was used to connect the PCP to the girder. Elevation and plan views of
the embed-WT connection can be seen in Figure 3.8 and Figure 3.9, respectively.
Figure 3.8: Elevation View of the Embed-WT Panel to Girder Connection
Bedding Strip
Inclined D2L Anchor
Loading Beam
5/16” Fillet Weld
WTPCP
Welded Wire Mesh3/8” Ø Strand
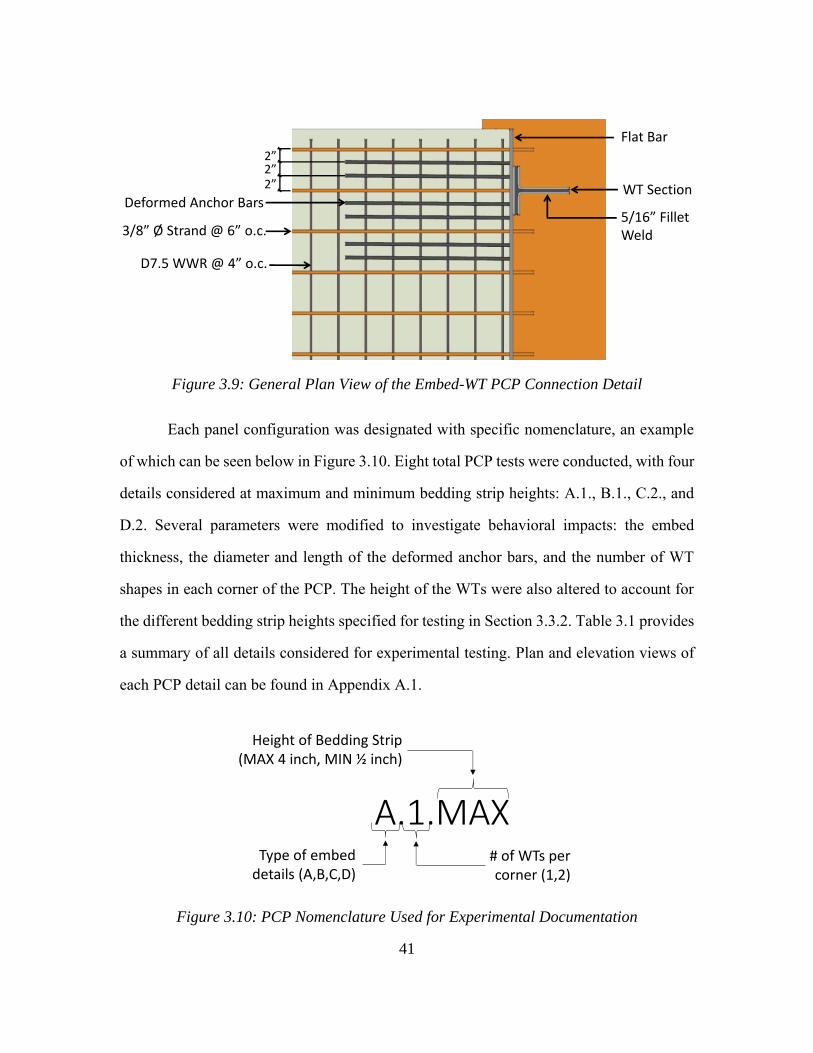
41
Figure 3.9: General Plan View of the Embed-WT PCP Connection Detail
Each panel configuration was designated with specific nomenclature, an example
of which can be seen below in Figure 3.10. Eight total PCP tests were conducted, with four
details considered at maximum and minimum bedding strip heights: A.1., B.1., C.2., and
D.2. Several parameters were modified to investigate behavioral impacts: the embed
thickness, the diameter and length of the deformed anchor bars, and the number of WT
shapes in each corner of the PCP. The height of the WTs were also altered to account for
the different bedding strip heights specified for testing in Section 3.3.2. Table 3.1 provides
a summary of all details considered for experimental testing. Plan and elevation views of
each PCP detail can be found in Appendix A.1.
Figure 3.10: PCP Nomenclature Used for Experimental Documentation
Deformed Anchor Bars
D7.5 WWR @ 4” o.c.
3/8” Ø Strand @ 6” o.c.
WT Section
Flat Bar
5/16” Fillet Weld
2”2”2”
A.1.MAXType of embed
details (A,B,C,D)# of WTs per corner (1,2)
Height of Bedding Strip (MAX 4 inch, MIN ½ inch)
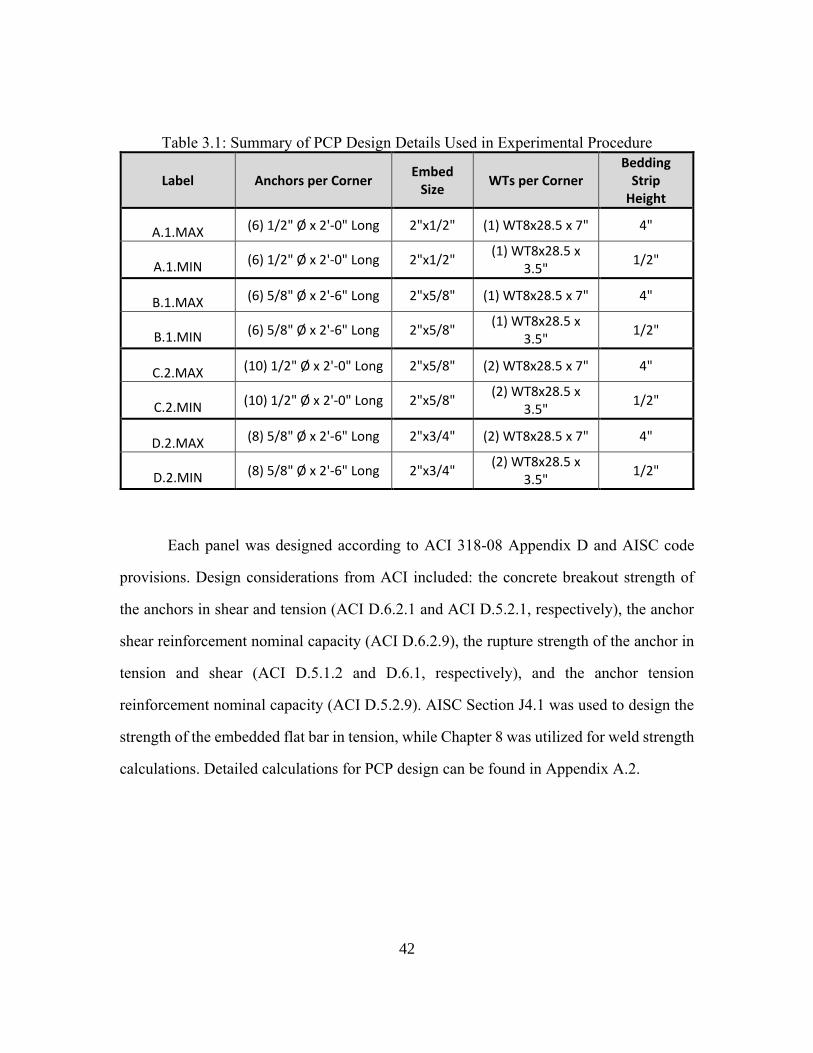
42
Table 3.1: Summary of PCP Design Details Used in Experimental Procedure
Label Anchors per Corner Embed
Size WTs per Corner
Bedding Strip
Height
A.1.MAX (6) 1/2" Ø x 2'-0" Long 2"x1/2" (1) WT8x28.5 x 7" 4"
A.1.MIN (6) 1/2" Ø x 2'-0" Long 2"x1/2" (1) WT8x28.5 x 3.5" 1/2"
B.1.MAX (6) 5/8" Ø x 2'-6" Long 2"x5/8" (1) WT8x28.5 x 7" 4"
B.1.MIN (6) 5/8" Ø x 2'-6" Long 2"x5/8" (1) WT8x28.5 x
3.5" 1/2"
C.2.MAX (10) 1/2" Ø x 2'-0" Long 2"x5/8" (2) WT8x28.5 x 7" 4"
C.2.MIN (10) 1/2" Ø x 2'-0" Long 2"x5/8" (2) WT8x28.5 x
3.5" 1/2"
D.2.MAX (8) 5/8" Ø x 2'-6" Long 2"x3/4" (2) WT8x28.5 x 7" 4"
D.2.MIN (8) 5/8" Ø x 2'-6" Long 2"x3/4" (2) WT8x28.5 x
3.5" 1/2"
Each panel was designed according to ACI 318-08 Appendix D and AISC code
provisions. Design considerations from ACI included: the concrete breakout strength of
the anchors in shear and tension (ACI D.6.2.1 and ACI D.5.2.1, respectively), the anchor
shear reinforcement nominal capacity (ACI D.6.2.9), the rupture strength of the anchor in
tension and shear (ACI D.5.1.2 and D.6.1, respectively), and the anchor tension
reinforcement nominal capacity (ACI D.5.2.9). AISC Section J4.1 was used to design the
strength of the embedded flat bar in tension, while Chapter 8 was utilized for weld strength
calculations. Detailed calculations for PCP design can be found in Appendix A.2.
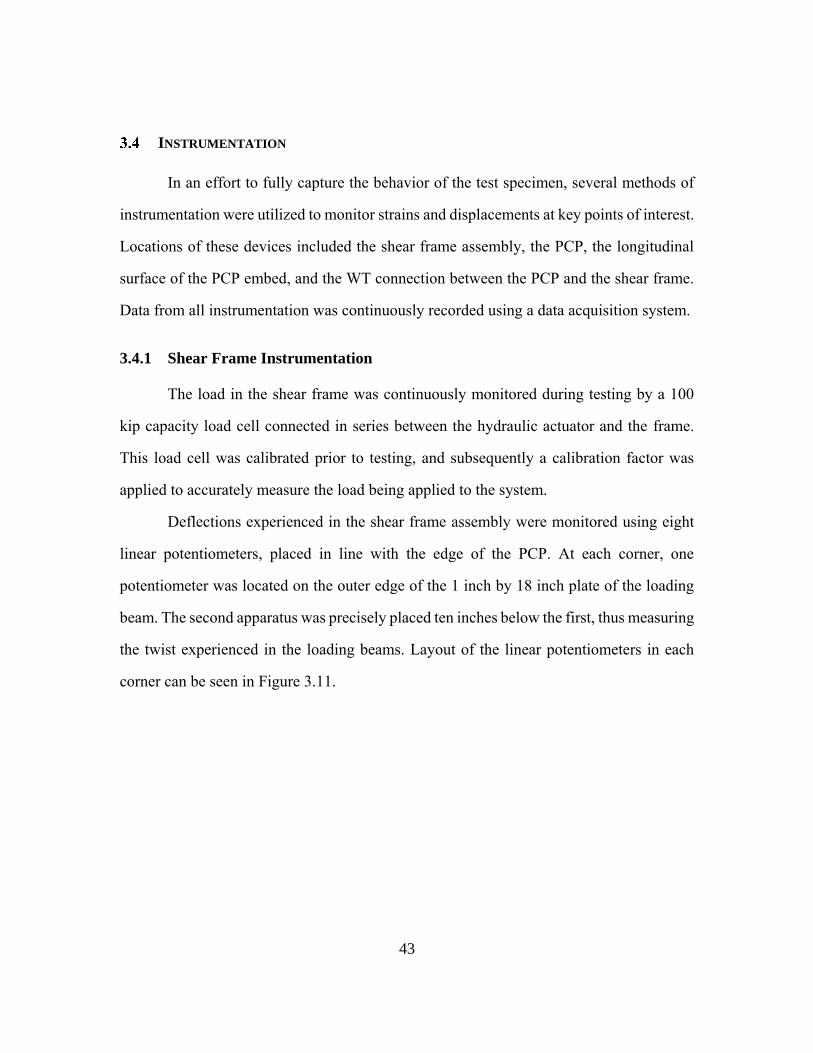
43
INSTRUMENTATION
In an effort to fully capture the behavior of the test specimen, several methods of
instrumentation were utilized to monitor strains and displacements at key points of interest.
Locations of these devices included the shear frame assembly, the PCP, the longitudinal
surface of the PCP embed, and the WT connection between the PCP and the shear frame.
Data from all instrumentation was continuously recorded using a data acquisition system.
3.4.1 Shear Frame Instrumentation
The load in the shear frame was continuously monitored during testing by a 100
kip capacity load cell connected in series between the hydraulic actuator and the frame.
This load cell was calibrated prior to testing, and subsequently a calibration factor was
applied to accurately measure the load being applied to the system.
Deflections experienced in the shear frame assembly were monitored using eight
linear potentiometers, placed in line with the edge of the PCP. At each corner, one
potentiometer was located on the outer edge of the 1 inch by 18 inch plate of the loading
beam. The second apparatus was precisely placed ten inches below the first, thus measuring
the twist experienced in the loading beams. Layout of the linear potentiometers in each
corner can be seen in Figure 3.11.
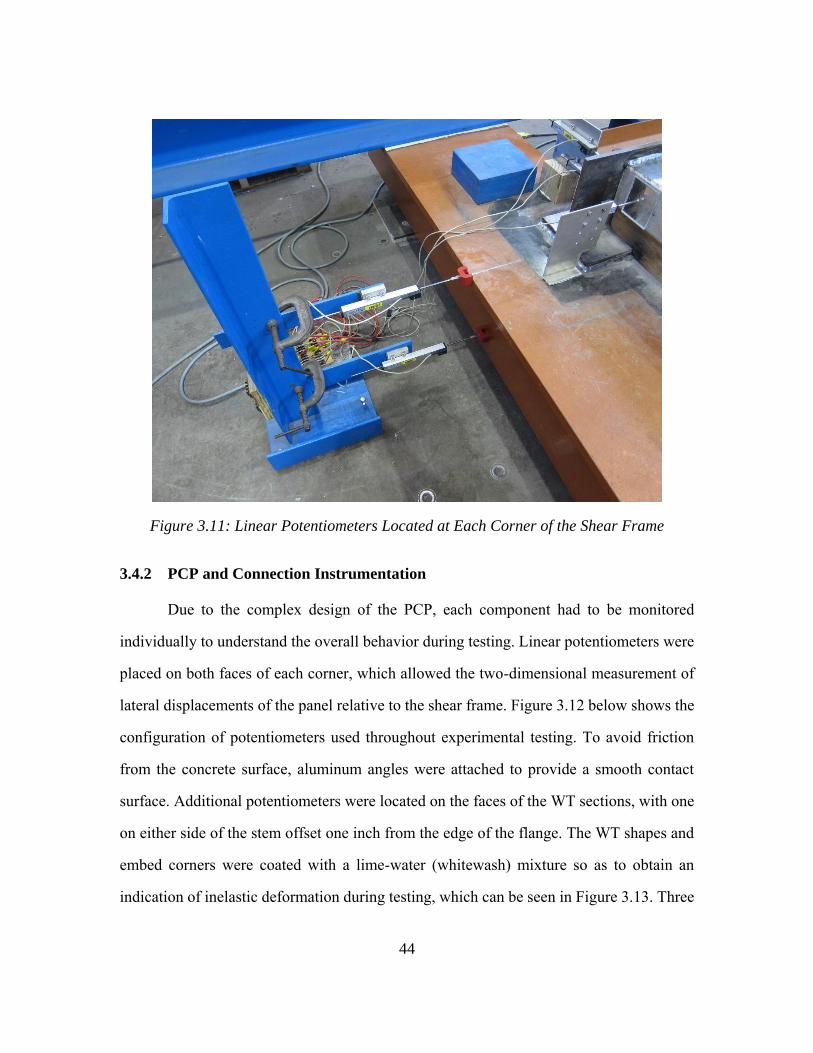
44
Figure 3.11: Linear Potentiometers Located at Each Corner of the Shear Frame
3.4.2 PCP and Connection Instrumentation
Due to the complex design of the PCP, each component had to be monitored
individually to understand the overall behavior during testing. Linear potentiometers were
placed on both faces of each corner, which allowed the two-dimensional measurement of
lateral displacements of the panel relative to the shear frame. Figure 3.12 below shows the
configuration of potentiometers used throughout experimental testing. To avoid friction
from the concrete surface, aluminum angles were attached to provide a smooth contact
surface. Additional potentiometers were located on the faces of the WT sections, with one
on either side of the stem offset one inch from the edge of the flange. The WT shapes and
embed corners were coated with a lime-water (whitewash) mixture so as to obtain an
indication of inelastic deformation during testing, which can be seen in Figure 3.13. Three
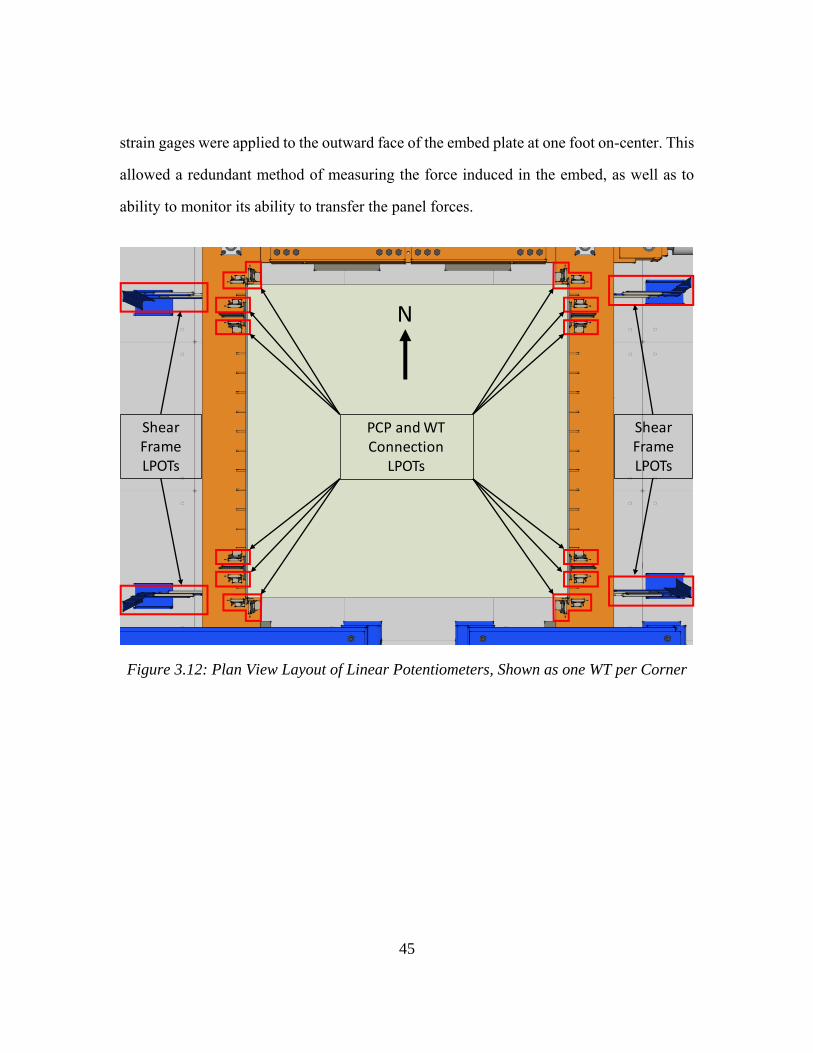
45
strain gages were applied to the outward face of the embed plate at one foot on-center. This
allowed a redundant method of measuring the force induced in the embed, as well as to
ability to monitor its ability to transfer the panel forces.
Figure 3.12: Plan View Layout of Linear Potentiometers, Shown as one WT per Corner
PCP and WT Connection
LPOTs
Shear Frame LPOTs
Shear Frame LPOTs
N
46
Figure 3.13: Configuration of Corner Potentiometers and Whitewash Application
TEST PROCEDURE
This section outlines the procedures followed for experimental tests involving the
shear frame assembly. A frame friction test was developed to determine if the test setup
performed as a pure mechanism, and the experimental method used to examine the in-plane
shear properties of the PCPs is discussed in detail within this portion.
3.5.1 Shear Frame Friction Test
To ensure that the load applied to the shear frame was being resisted solely by the
attached PCP, it was crucial that the amount of built-in resistance within the system be
minimized. This was accomplished by the approach described in Section 3.2.1. Given that
the frame was designed to act as a mechanism, a procedure was developed to determine
the force required to displace the frame.
A beam clamp was affixed to the northwest corner of the shear frame, in line with
the centerline of the actuator and the connection strap. The actuator was disconnected from
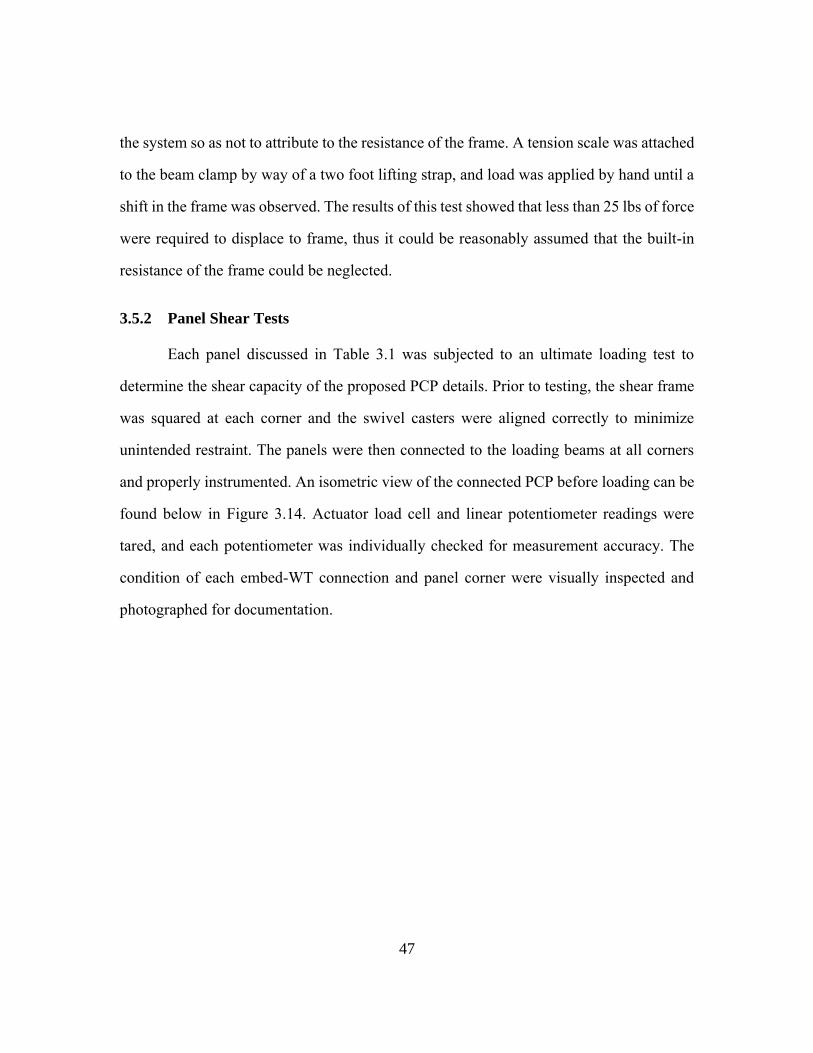
47
the system so as not to attribute to the resistance of the frame. A tension scale was attached
to the beam clamp by way of a two foot lifting strap, and load was applied by hand until a
shift in the frame was observed. The results of this test showed that less than 25 lbs of force
were required to displace to frame, thus it could be reasonably assumed that the built-in
resistance of the frame could be neglected.
3.5.2 Panel Shear Tests
Each panel discussed in Table 3.1 was subjected to an ultimate loading test to
determine the shear capacity of the proposed PCP details. Prior to testing, the shear frame
was squared at each corner and the swivel casters were aligned correctly to minimize
unintended restraint. The panels were then connected to the loading beams at all corners
and properly instrumented. An isometric view of the connected PCP before loading can be
found below in Figure 3.14. Actuator load cell and linear potentiometer readings were
tared, and each potentiometer was individually checked for measurement accuracy. The
condition of each embed-WT connection and panel corner were visually inspected and
photographed for documentation.
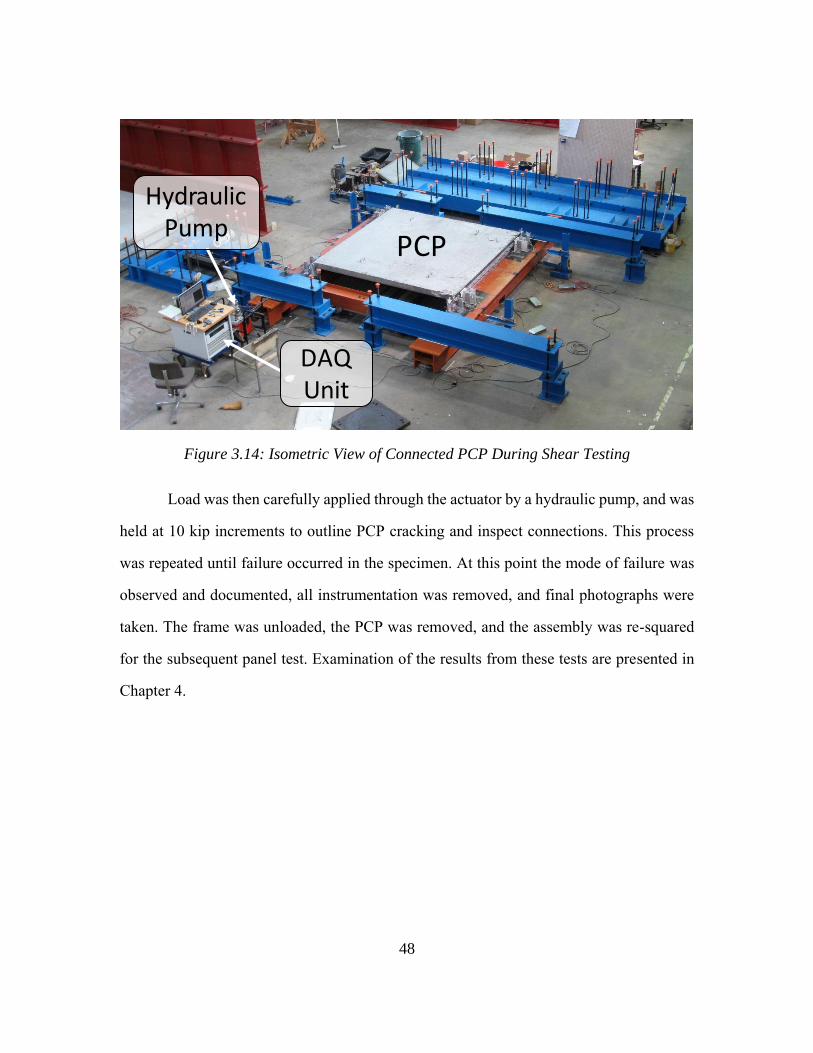
48
Figure 3.14: Isometric View of Connected PCP During Shear Testing
Load was then carefully applied through the actuator by a hydraulic pump, and was
held at 10 kip increments to outline PCP cracking and inspect connections. This process
was repeated until failure occurred in the specimen. At this point the mode of failure was
observed and documented, all instrumentation was removed, and final photographs were
taken. The frame was unloaded, the PCP was removed, and the assembly was re-squared
for the subsequent panel test. Examination of the results from these tests are presented in
Chapter 4.
PCP
Hydraulic Pump
DAQUnit
49
CHAPTER 4: EXPERIMENTAL TEST RESULTS
OVERVIEW
This chapter provides a detailed synopsis of the results gathered from the PCP shear
tests following the experimental procedure outlined in Chapter 3. The structural properties
of the PCPs tested using the shear frame assembly are highlighted, including the shear
stiffness and strength of the panels. Forces developed in the proposed embeds are
examined, in addition to crack patterns and modes of failure induced by shear loading. Also
discussed within this chapter is the behavior of the shear frame assembly during testing, as
proper understanding of frame reaction is necessary for accurate interpretation of the test
results.
PANEL MATERIAL PROPERTIES
All panels tested within the scope of this thesis were cast from the same concrete
batch. Cylinders were cast on-site, transported back to the Ferguson Laboratory, and cured
according to ASTM C31 standards. The curing period prior to cylinder strength testing was
35 days, at which time compressive strength, modulus of elasticity, and split cylinder
tensile tests were performed. Compressive strength tests, modulus of elasticity tests, and
split cylinder tests were completed in compliance with ASTM C39, ASTM 469, and ASTM
496, respectively. The results of these material tests are outlined in Table 4.1.
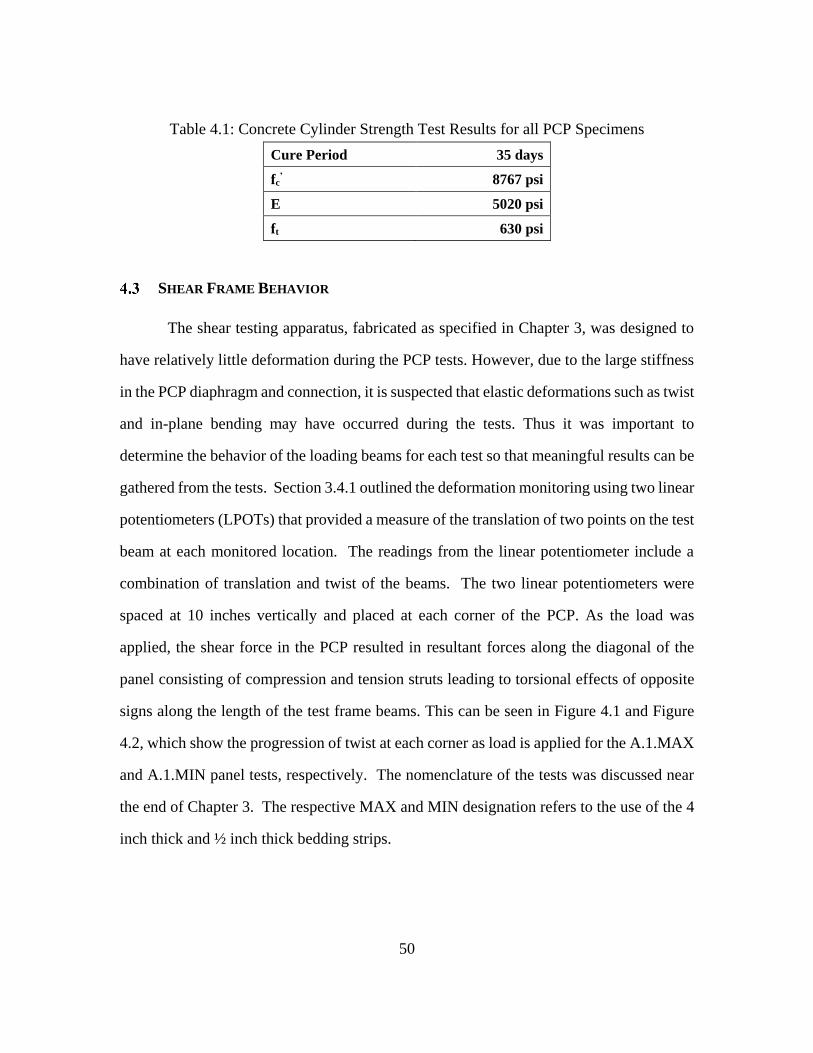
50
Table 4.1: Concrete Cylinder Strength Test Results for all PCP Specimens
Cure Period 35 days
fc’ 8767 psi
E 5020 psi
ft 630 psi
SHEAR FRAME BEHAVIOR
The shear testing apparatus, fabricated as specified in Chapter 3, was designed to
have relatively little deformation during the PCP tests. However, due to the large stiffness
in the PCP diaphragm and connection, it is suspected that elastic deformations such as twist
and in-plane bending may have occurred during the tests. Thus it was important to
determine the behavior of the loading beams for each test so that meaningful results can be
gathered from the tests. Section 3.4.1 outlined the deformation monitoring using two linear
potentiometers (LPOTs) that provided a measure of the translation of two points on the test
beam at each monitored location. The readings from the linear potentiometer include a
combination of translation and twist of the beams. The two linear potentiometers were
spaced at 10 inches vertically and placed at each corner of the PCP. As the load was
applied, the shear force in the PCP resulted in resultant forces along the diagonal of the
panel consisting of compression and tension struts leading to torsional effects of opposite
signs along the length of the test frame beams. This can be seen in Figure 4.1 and Figure
4.2, which show the progression of twist at each corner as load is applied for the A.1.MAX
and A.1.MIN panel tests, respectively. The nomenclature of the tests was discussed near
the end of Chapter 3. The respective MAX and MIN designation refers to the use of the 4
inch thick and ½ inch thick bedding strips.
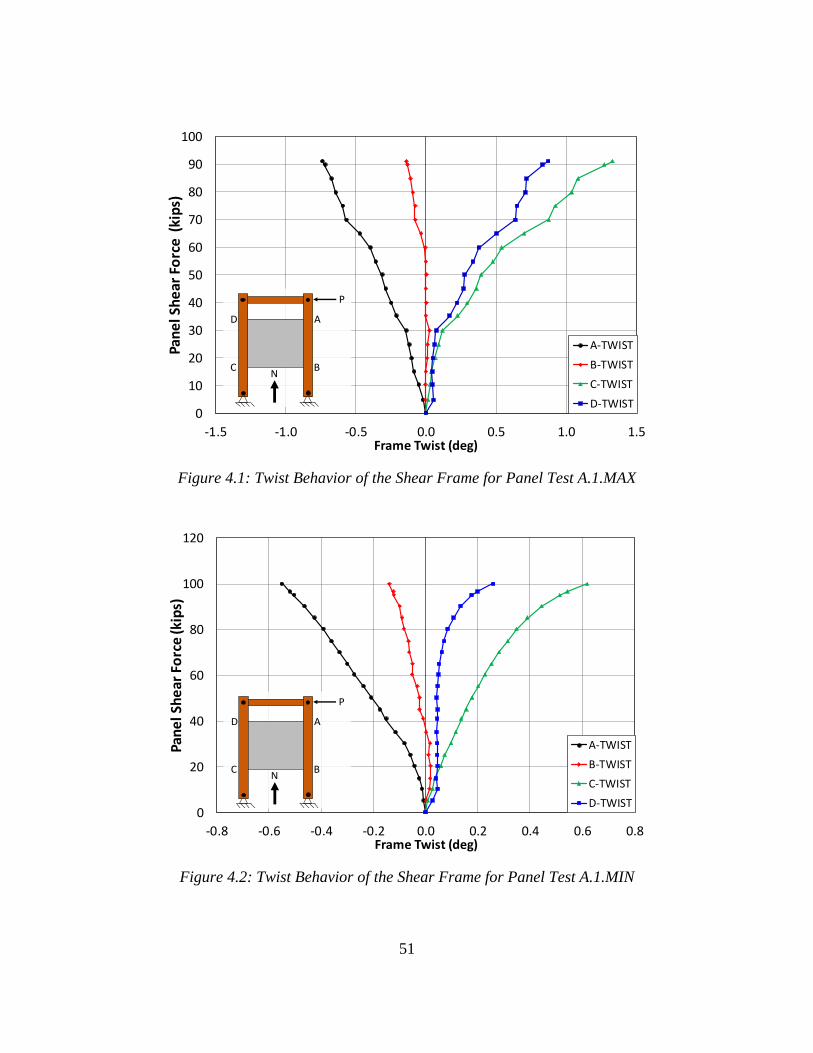
51
Figure 4.1: Twist Behavior of the Shear Frame for Panel Test A.1.MAX
Figure 4.2: Twist Behavior of the Shear Frame for Panel Test A.1.MIN
0
10
20
30
40
50
60
70
80
90
100
-1.5 -1.0 -0.5 0.0 0.5 1.0 1.5
Pan
el S
he
ar F
orc
e (
kip
s)
Frame Twist (deg)
A-TWIST
B-TWIST
C-TWIST
D-TWIST
P
A
B
D
CN
0
20
40
60
80
100
120
-0.8 -0.6 -0.4 -0.2 0.0 0.2 0.4 0.6 0.8
Pan
el S
he
ar F
orc
e (k
ips)
Frame Twist (deg)
A-TWIST
B-TWIST
C-TWIST
D-TWIST
P
A
B
D
CN
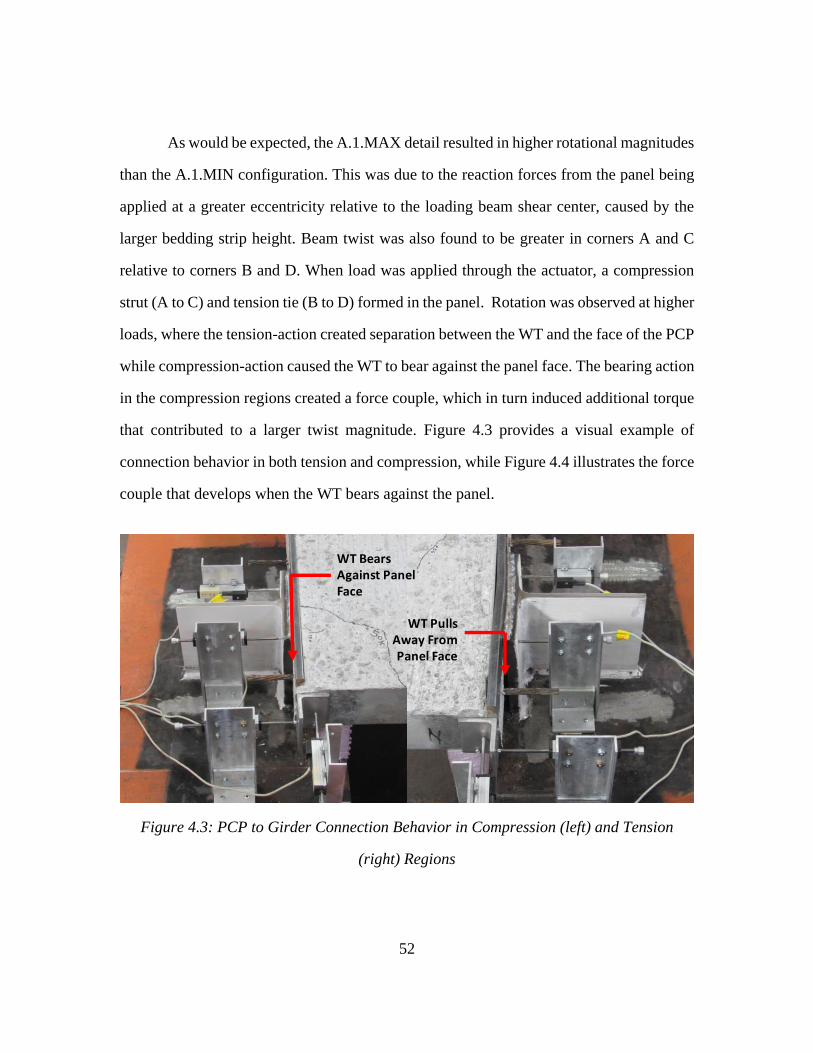
52
As would be expected, the A.1.MAX detail resulted in higher rotational magnitudes
than the A.1.MIN configuration. This was due to the reaction forces from the panel being
applied at a greater eccentricity relative to the loading beam shear center, caused by the
larger bedding strip height. Beam twist was also found to be greater in corners A and C
relative to corners B and D. When load was applied through the actuator, a compression
strut (A to C) and tension tie (B to D) formed in the panel. Rotation was observed at higher
loads, where the tension-action created separation between the WT and the face of the PCP
while compression-action caused the WT to bear against the panel face. The bearing action
in the compression regions created a force couple, which in turn induced additional torque
that contributed to a larger twist magnitude. Figure 4.3 provides a visual example of
connection behavior in both tension and compression, while Figure 4.4 illustrates the force
couple that develops when the WT bears against the panel.
Figure 4.3: PCP to Girder Connection Behavior in Compression (left) and Tension
(right) Regions
WT Pulls Away From Panel Face
WT Bears Against Panel Face
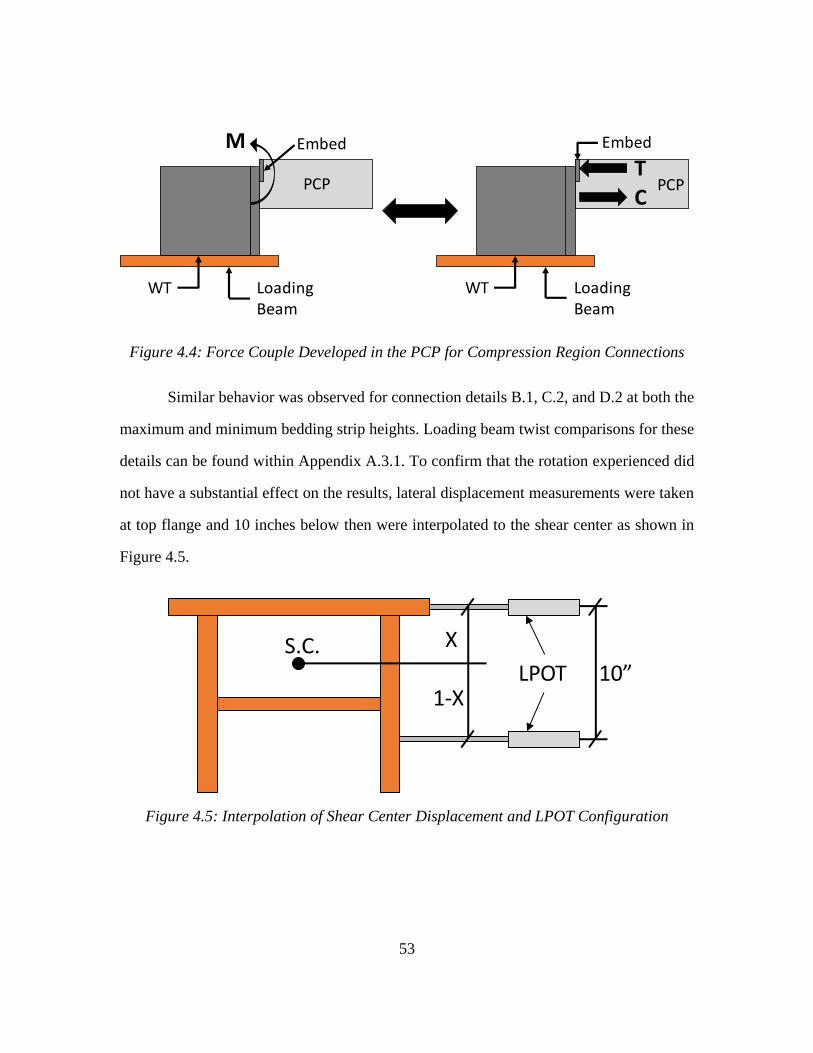
53
Figure 4.4: Force Couple Developed in the PCP for Compression Region Connections
Similar behavior was observed for connection details B.1, C.2, and D.2 at both the
maximum and minimum bedding strip heights. Loading beam twist comparisons for these
details can be found within Appendix A.3.1. To confirm that the rotation experienced did
not have a substantial effect on the results, lateral displacement measurements were taken
at top flange and 10 inches below then were interpolated to the shear center as shown in
Figure 4.5.
Figure 4.5: Interpolation of Shear Center Displacement and LPOT Configuration
M
Loading Beam
WT
T
CPCP
Embed
Loading Beam
WT
Embed
PCP
LPOT 10”S.C. X
1-X
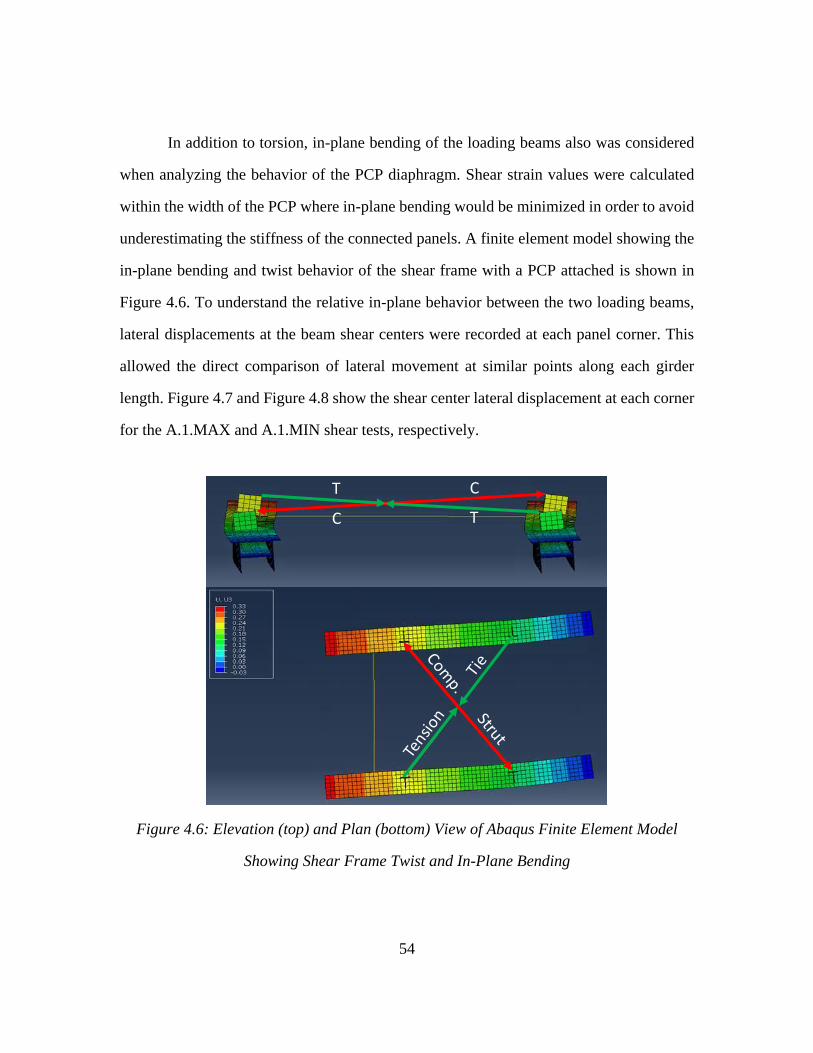
54
In addition to torsion, in-plane bending of the loading beams also was considered
when analyzing the behavior of the PCP diaphragm. Shear strain values were calculated
within the width of the PCP where in-plane bending would be minimized in order to avoid
underestimating the stiffness of the connected panels. A finite element model showing the
in-plane bending and twist behavior of the shear frame with a PCP attached is shown in
Figure 4.6. To understand the relative in-plane behavior between the two loading beams,
lateral displacements at the beam shear centers were recorded at each panel corner. This
allowed the direct comparison of lateral movement at similar points along each girder
length. Figure 4.7 and Figure 4.8 show the shear center lateral displacement at each corner
for the A.1.MAX and A.1.MIN shear tests, respectively.
Figure 4.6: Elevation (top) and Plan (bottom) View of Abaqus Finite Element Model
Showing Shear Frame Twist and In-Plane Bending
T
TC
C
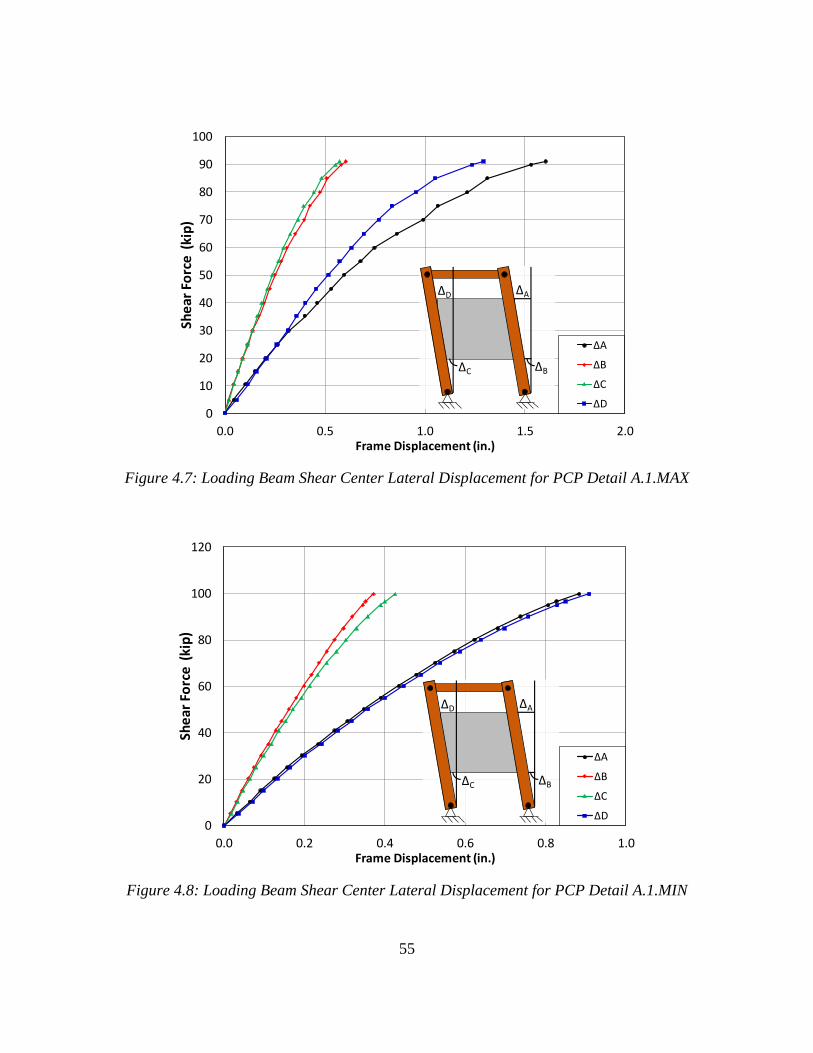
55
Figure 4.7: Loading Beam Shear Center Lateral Displacement for PCP Detail A.1.MAX
Figure 4.8: Loading Beam Shear Center Lateral Displacement for PCP Detail A.1.MIN
0
10
20
30
40
50
60
70
80
90
100
0.0 0.5 1.0 1.5 2.0
She
ar F
orc
e (
kip
)
Frame Displacement (in.)
ΔA
ΔB
ΔC
ΔD
ΔB
ΔA
ΔC
ΔD
0
20
40
60
80
100
120
0.0 0.2 0.4 0.6 0.8 1.0
She
ar F
orc
e (
kip
)
Frame Displacement (in.)
ΔA
ΔB
ΔC
ΔD
ΔB
ΔA
ΔC
ΔD
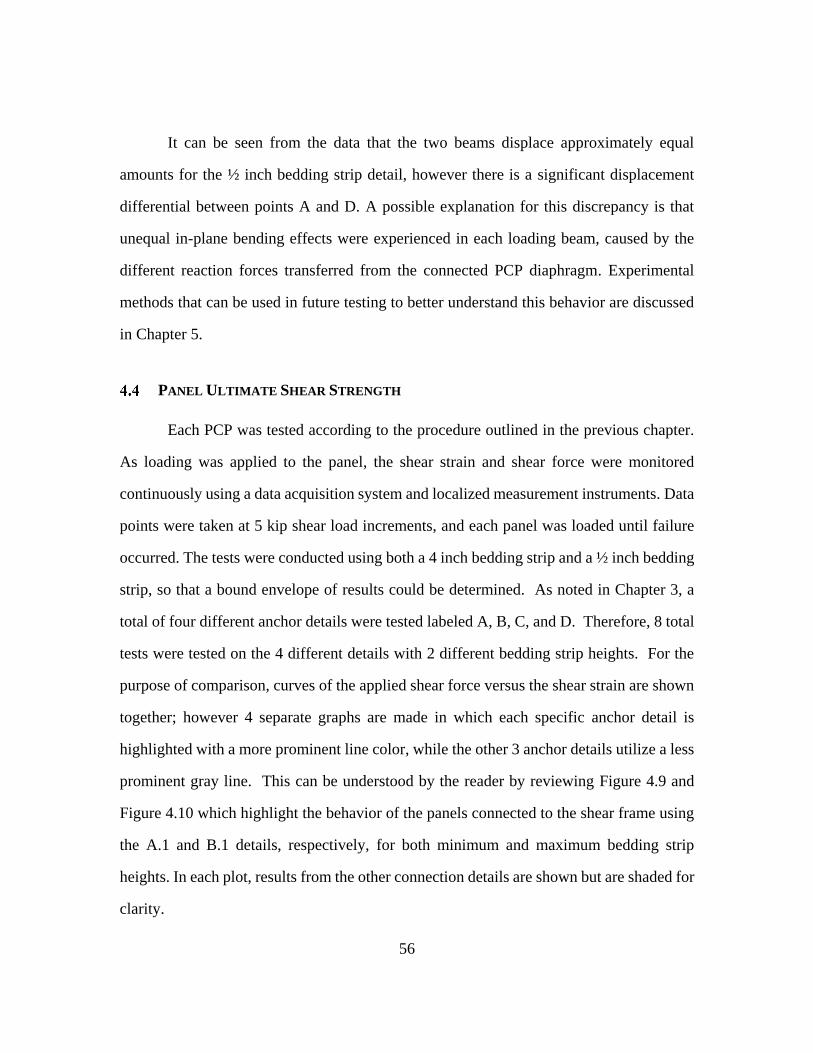
56
It can be seen from the data that the two beams displace approximately equal
amounts for the ½ inch bedding strip detail, however there is a significant displacement
differential between points A and D. A possible explanation for this discrepancy is that
unequal in-plane bending effects were experienced in each loading beam, caused by the
different reaction forces transferred from the connected PCP diaphragm. Experimental
methods that can be used in future testing to better understand this behavior are discussed
in Chapter 5.
PANEL ULTIMATE SHEAR STRENGTH
Each PCP was tested according to the procedure outlined in the previous chapter.
As loading was applied to the panel, the shear strain and shear force were monitored
continuously using a data acquisition system and localized measurement instruments. Data
points were taken at 5 kip shear load increments, and each panel was loaded until failure
occurred. The tests were conducted using both a 4 inch bedding strip and a ½ inch bedding
strip, so that a bound envelope of results could be determined. As noted in Chapter 3, a
total of four different anchor details were tested labeled A, B, C, and D. Therefore, 8 total
tests were tested on the 4 different details with 2 different bedding strip heights. For the
purpose of comparison, curves of the applied shear force versus the shear strain are shown
together; however 4 separate graphs are made in which each specific anchor detail is
highlighted with a more prominent line color, while the other 3 anchor details utilize a less
prominent gray line. This can be understood by the reader by reviewing Figure 4.9 and
Figure 4.10 which highlight the behavior of the panels connected to the shear frame using
the A.1 and B.1 details, respectively, for both minimum and maximum bedding strip
heights. In each plot, results from the other connection details are shown but are shaded for
clarity.
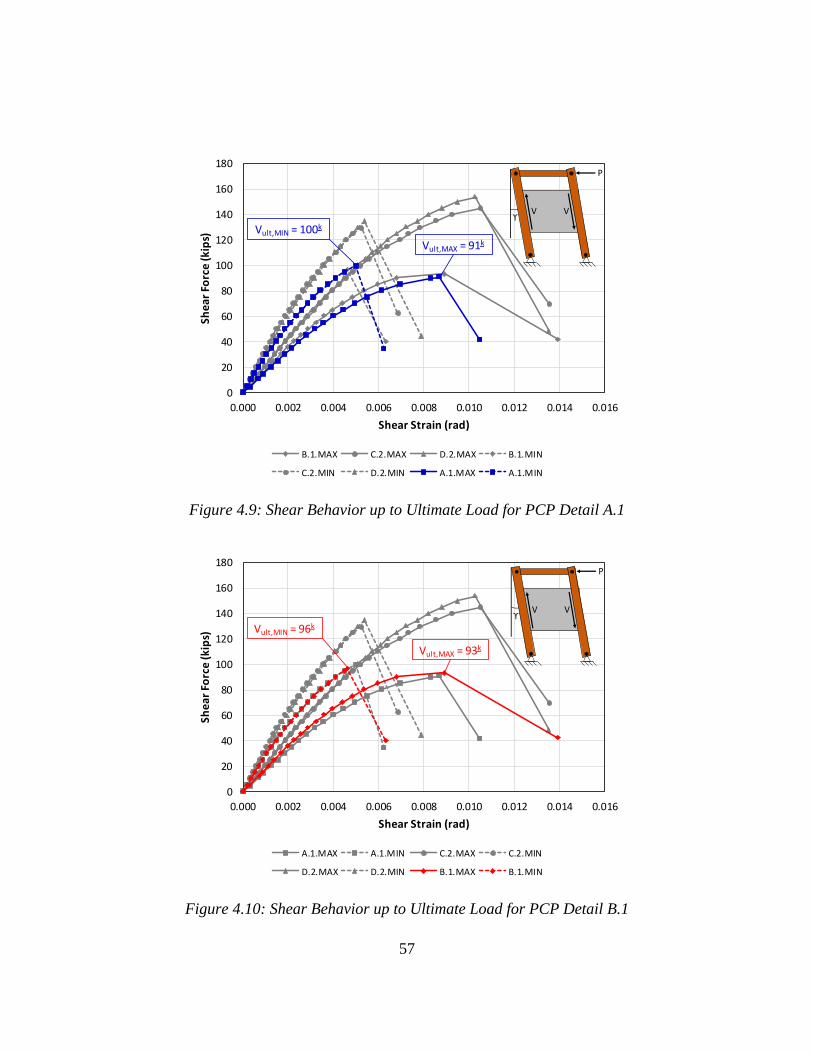
57
Figure 4.9: Shear Behavior up to Ultimate Load for PCP Detail A.1
Figure 4.10: Shear Behavior up to Ultimate Load for PCP Detail B.1
0
20
40
60
80
100
120
140
160
180
0.000 0.002 0.004 0.006 0.008 0.010 0.012 0.014 0.016
Shea
r Fo
rce
(kip
s)
Shear Strain (rad)
B.1.MAX C.2.MAX D.2.MAX B.1.MIN
C.2.MIN D.2.MIN A.1.MAX A.1.MIN
Vult,MIN = 100k
Vult,MAX = 91k
ϒV V
P
0
20
40
60
80
100
120
140
160
180
0.000 0.002 0.004 0.006 0.008 0.010 0.012 0.014 0.016
Sh
ear
Fo
rce
(k
ips)
Shear Strain (rad)
A.1.MAX A.1.MIN C.2.MAX C.2.MIN
D.2.MAX D.2.MIN B.1.MAX B.1.MIN
Vult,MAX = 93k
Vult,MIN = 96kϒ
V V
P
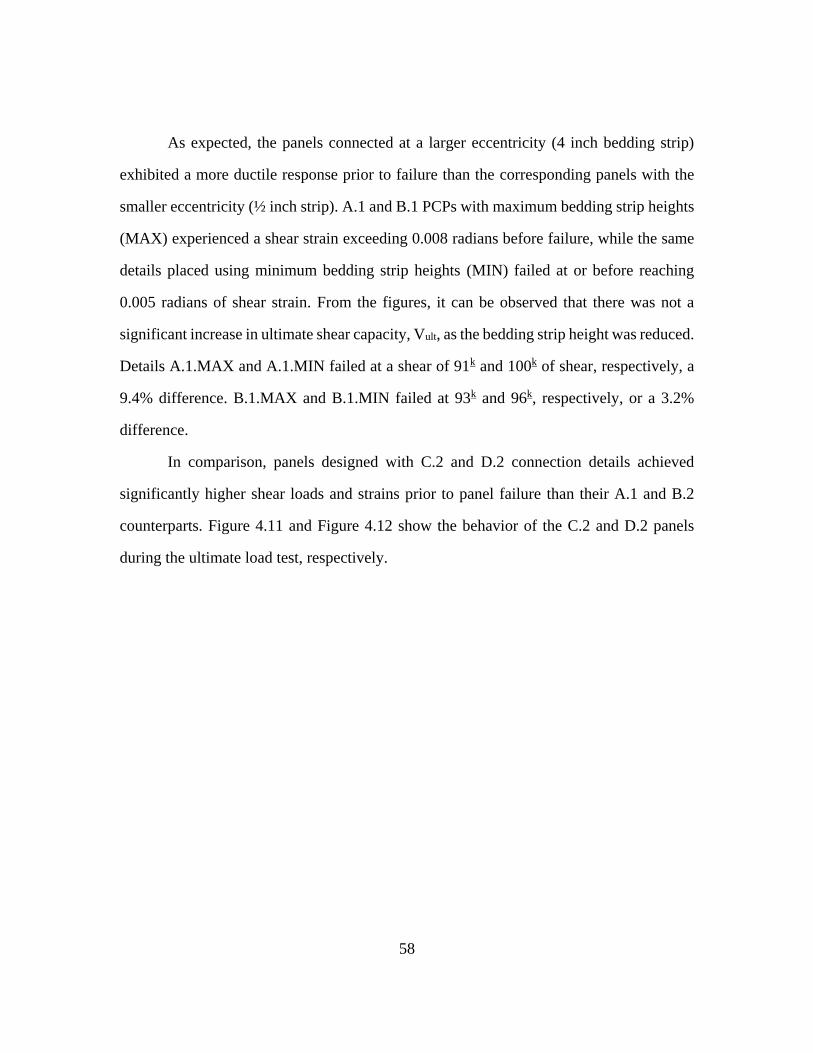
58
As expected, the panels connected at a larger eccentricity (4 inch bedding strip)
exhibited a more ductile response prior to failure than the corresponding panels with the
smaller eccentricity (½ inch strip). A.1 and B.1 PCPs with maximum bedding strip heights
(MAX) experienced a shear strain exceeding 0.008 radians before failure, while the same
details placed using minimum bedding strip heights (MIN) failed at or before reaching
0.005 radians of shear strain. From the figures, it can be observed that there was not a
significant increase in ultimate shear capacity, Vult, as the bedding strip height was reduced.
Details A.1.MAX and A.1.MIN failed at a shear of 91k and 100k of shear, respectively, a
9.4% difference. B.1.MAX and B.1.MIN failed at 93k and 96k, respectively, or a 3.2%
difference.
In comparison, panels designed with C.2 and D.2 connection details achieved
significantly higher shear loads and strains prior to panel failure than their A.1 and B.2
counterparts. Figure 4.11 and Figure 4.12 show the behavior of the C.2 and D.2 panels
during the ultimate load test, respectively.

59
Figure 4.11: Shear Behavior up to Ultimate Load for PCP Detail C.2
Figure 4.12: Shear Behavior up to Ultimate Load for PCP Detail D.2
0
20
40
60
80
100
120
140
160
180
0.000 0.002 0.004 0.006 0.008 0.010 0.012 0.014 0.016
Sh
ear
Fo
rce
(k
ips)
Shear Strain (rad)
A.1.MAX A.1.MIN B.1.MAX B.1.MIN
D.2.MAX D.2.MIN C.2.MAX C.2.MIN
Vult,MIN = 129k
Vult,MAX = 145k
ϒV V
P
0
20
40
60
80
100
120
140
160
180
0.000 0.002 0.004 0.006 0.008 0.010 0.012 0.014 0.016
Sh
ear
Fo
rce
(kip
s)
Shear Strain (rad)
A.1.MAX B.1.MAX C.2.MAX A.1.MIN
B.1.MIN C.2.MIN D.2.MAX D.2.MIN
Vult,MAX = 154k
Vult,MIN = 135k
ϒV V
P
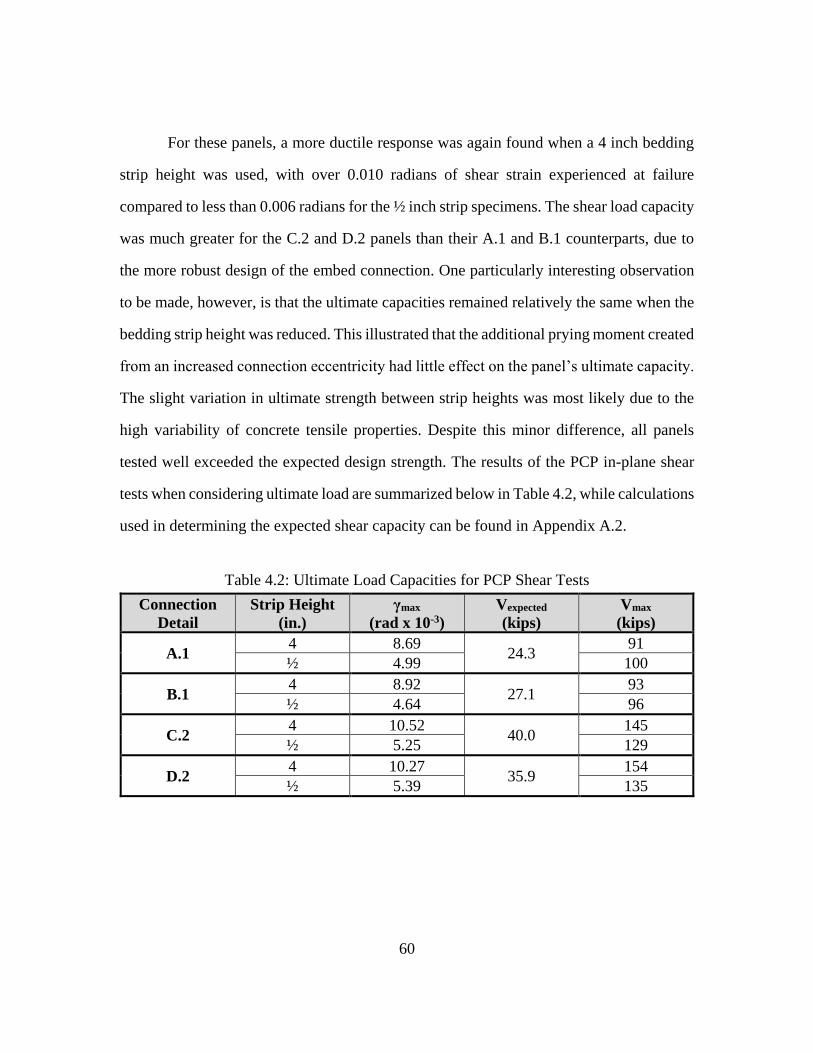
60
For these panels, a more ductile response was again found when a 4 inch bedding
strip height was used, with over 0.010 radians of shear strain experienced at failure
compared to less than 0.006 radians for the ½ inch strip specimens. The shear load capacity
was much greater for the C.2 and D.2 panels than their A.1 and B.1 counterparts, due to
the more robust design of the embed connection. One particularly interesting observation
to be made, however, is that the ultimate capacities remained relatively the same when the
bedding strip height was reduced. This illustrated that the additional prying moment created
from an increased connection eccentricity had little effect on the panel’s ultimate capacity.
The slight variation in ultimate strength between strip heights was most likely due to the
high variability of concrete tensile properties. Despite this minor difference, all panels
tested well exceeded the expected design strength. The results of the PCP in-plane shear
tests when considering ultimate load are summarized below in Table 4.2, while calculations
used in determining the expected shear capacity can be found in Appendix A.2.
Table 4.2: Ultimate Load Capacities for PCP Shear Tests
Connection
Detail
Strip Height
(in.)
γmax
(rad x 10-3)
Vexpected
(kips)
Vmax
(kips)
A.1 4 8.69
24.3 91
½ 4.99 100
B.1 4 8.92
27.1 93
½ 4.64 96
C.2 4 10.52
40.0 145
½ 5.25 129
D.2 4 10.27
35.9 154
½ 5.39 135
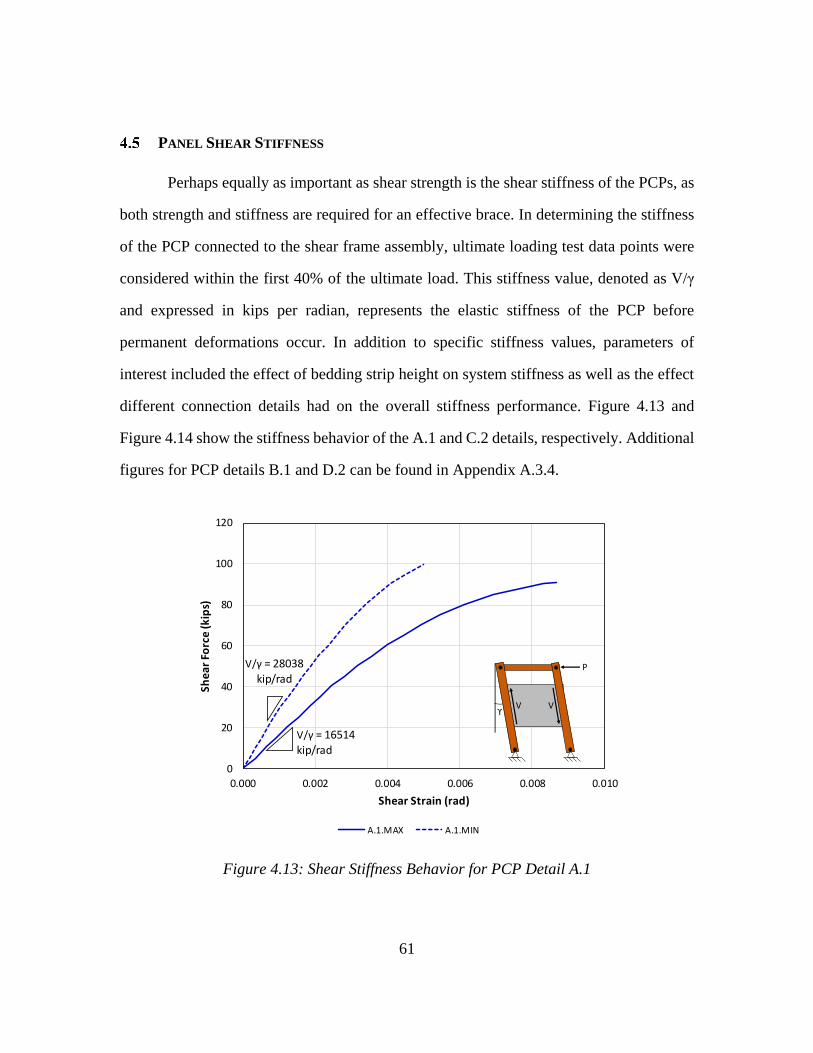
61
PANEL SHEAR STIFFNESS
Perhaps equally as important as shear strength is the shear stiffness of the PCPs, as
both strength and stiffness are required for an effective brace. In determining the stiffness
of the PCP connected to the shear frame assembly, ultimate loading test data points were
considered within the first 40% of the ultimate load. This stiffness value, denoted as V/γ
and expressed in kips per radian, represents the elastic stiffness of the PCP before
permanent deformations occur. In addition to specific stiffness values, parameters of
interest included the effect of bedding strip height on system stiffness as well as the effect
different connection details had on the overall stiffness performance. Figure 4.13 and
Figure 4.14 show the stiffness behavior of the A.1 and C.2 details, respectively. Additional
figures for PCP details B.1 and D.2 can be found in Appendix A.3.4.
Figure 4.13: Shear Stiffness Behavior for PCP Detail A.1
0
20
40
60
80
100
120
0.000 0.002 0.004 0.006 0.008 0.010
Sh
ear
Fo
rce
(kip
s)
Shear Strain (rad)
A.1.MAX A.1.MIN
V/γ = 28038 kip/rad
V/γ = 16514 kip/rad
ϒV V
P
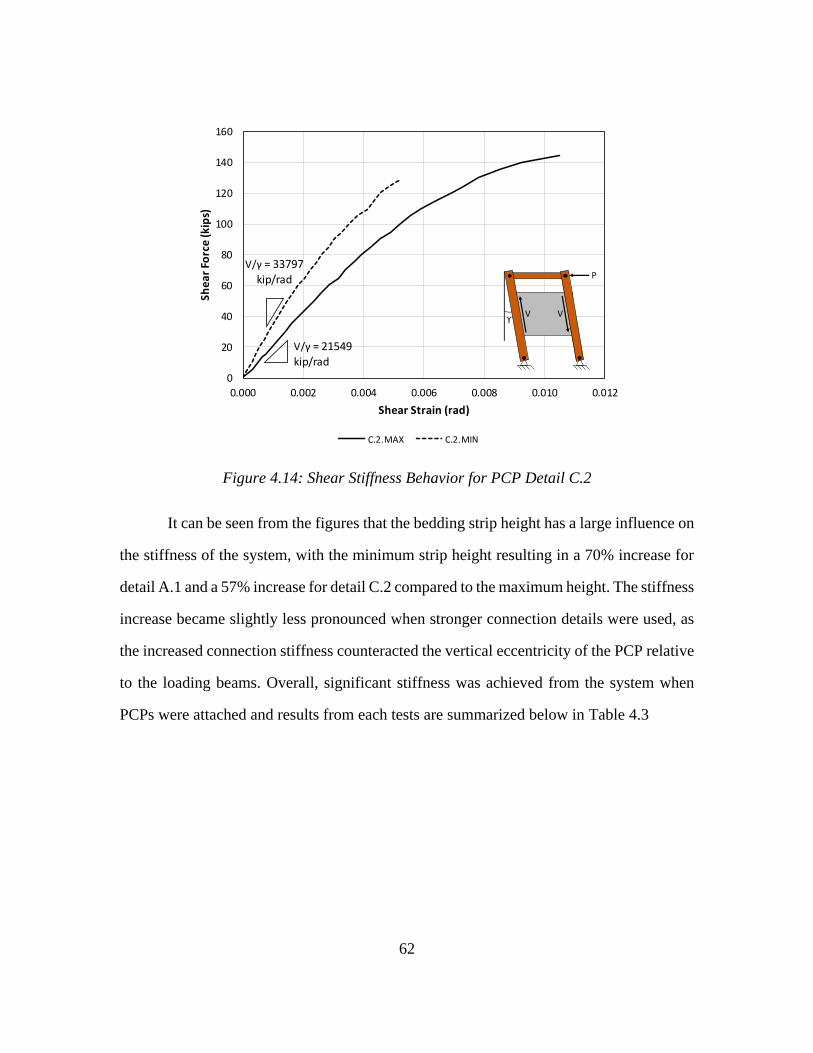
62
Figure 4.14: Shear Stiffness Behavior for PCP Detail C.2
It can be seen from the figures that the bedding strip height has a large influence on
the stiffness of the system, with the minimum strip height resulting in a 70% increase for
detail A.1 and a 57% increase for detail C.2 compared to the maximum height. The stiffness
increase became slightly less pronounced when stronger connection details were used, as
the increased connection stiffness counteracted the vertical eccentricity of the PCP relative
to the loading beams. Overall, significant stiffness was achieved from the system when
PCPs were attached and results from each tests are summarized below in Table 4.3
0
20
40
60
80
100
120
140
160
0.000 0.002 0.004 0.006 0.008 0.010 0.012
Sh
ear
Fo
rce
(kip
s)
Shear Strain (rad)
C.2.MAX C.2.MIN
V/γ = 33797
kip/rad
V/γ = 21549 kip/rad
ϒV V
P
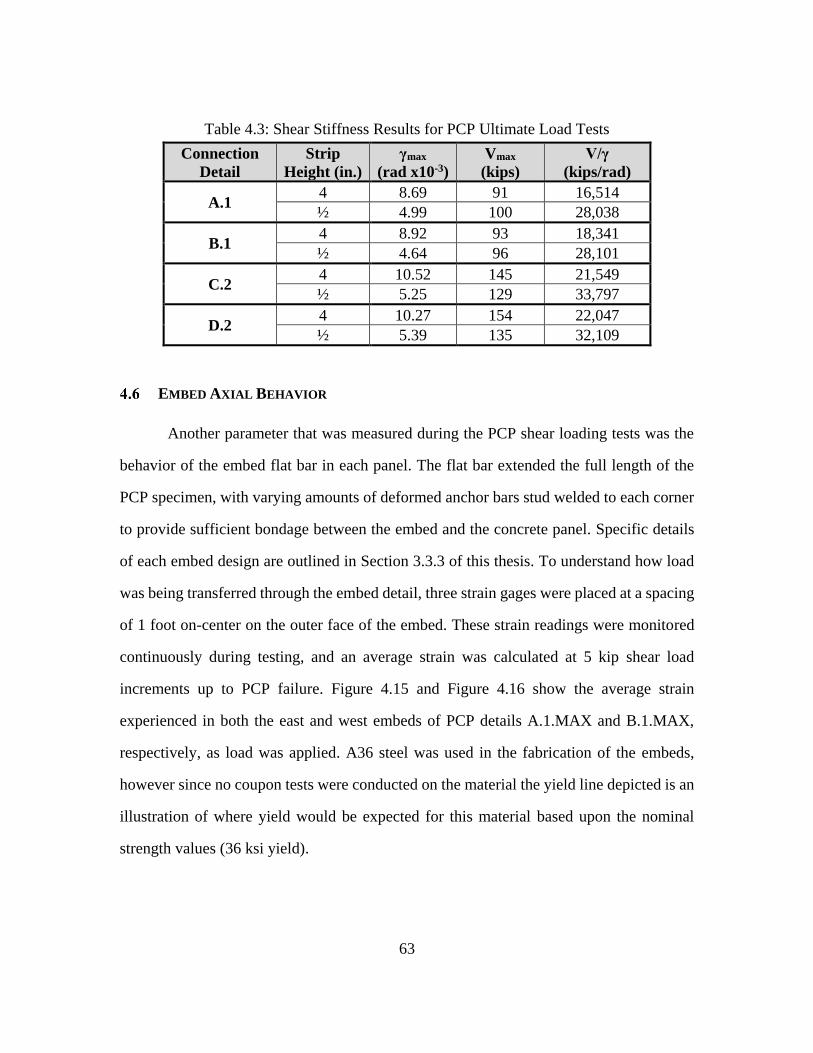
63
Table 4.3: Shear Stiffness Results for PCP Ultimate Load Tests
Connection
Detail
Strip
Height (in.)
γmax
(rad x10-3)
Vmax
(kips)
V/γ
(kips/rad)
A.1 4 8.69 91 16,514
½ 4.99 100 28,038
B.1 4 8.92 93 18,341
½ 4.64 96 28,101
C.2 4 10.52 145 21,549
½ 5.25 129 33,797
D.2 4 10.27 154 22,047
½ 5.39 135 32,109
EMBED AXIAL BEHAVIOR
Another parameter that was measured during the PCP shear loading tests was the
behavior of the embed flat bar in each panel. The flat bar extended the full length of the
PCP specimen, with varying amounts of deformed anchor bars stud welded to each corner
to provide sufficient bondage between the embed and the concrete panel. Specific details
of each embed design are outlined in Section 3.3.3 of this thesis. To understand how load
was being transferred through the embed detail, three strain gages were placed at a spacing
of 1 foot on-center on the outer face of the embed. These strain readings were monitored
continuously during testing, and an average strain was calculated at 5 kip shear load
increments up to PCP failure. Figure 4.15 and Figure 4.16 show the average strain
experienced in both the east and west embeds of PCP details A.1.MAX and B.1.MAX,
respectively, as load was applied. A36 steel was used in the fabrication of the embeds,
however since no coupon tests were conducted on the material the yield line depicted is an
illustration of where yield would be expected for this material based upon the nominal
strength values (36 ksi yield).
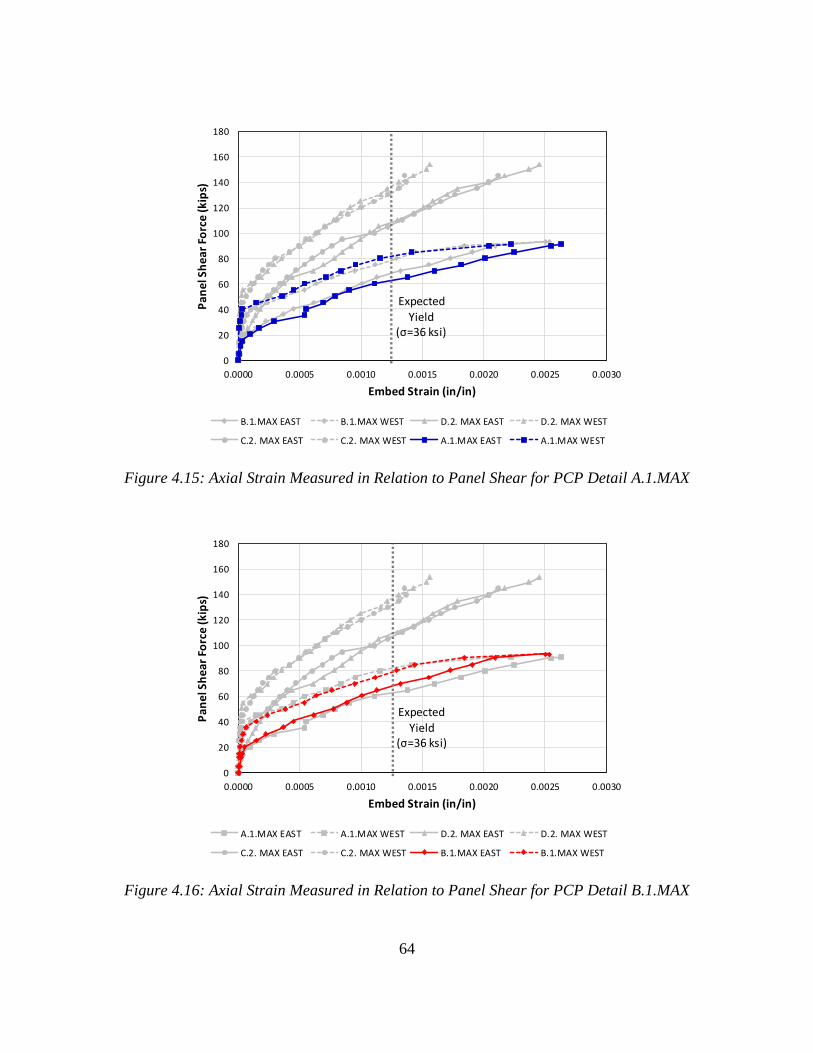
64
Figure 4.15: Axial Strain Measured in Relation to Panel Shear for PCP Detail A.1.MAX
Figure 4.16: Axial Strain Measured in Relation to Panel Shear for PCP Detail B.1.MAX
0
20
40
60
80
100
120
140
160
180
0.0000 0.0005 0.0010 0.0015 0.0020 0.0025 0.0030
Pa
ne
l Sh
ea
r Fo
rce
(kip
s)
Embed Strain (in/in)
B.1.MAX EAST B.1.MAX WEST D.2. MAX EAST D.2. MAX WEST
C.2. MAX EAST C.2. MAX WEST A.1.MAX EAST A.1.MAX WEST
Expected Yield
(σ=36 ksi)
0
20
40
60
80
100
120
140
160
180
0.0000 0.0005 0.0010 0.0015 0.0020 0.0025 0.0030
Pa
ne
l Sh
ea
r Fo
rce
(kip
s)
Embed Strain (in/in)
A.1.MAX EAST A.1.MAX WEST D.2. MAX EAST D.2. MAX WEST
C.2. MAX EAST C.2. MAX WEST B.1.MAX EAST B.1.MAX WEST
Expected Yield
(σ=36 ksi)

65
It can be seen from the figures above that embed details A.1.MAX and B.1.MAX
exhibit similar strain behavior as the load was increased in the PCP. Given that the flat bar
thickness for detail B.1.MAX is ⅝ inch compared to ½ inch for detail A.1.MAX, the similar
strain behavior shows that B.1.MAX attracts more load through the embed flat bar. Both
details revealed a very ductile behavior prior to panel failure, achieving strains exceeding
0.0025 in/in. Detail A.1.MAX reached nominal yield strains at 62.5k and 82k of panel shear
for the east and west embeds, respectively. For detail B.1.MAX, the nominal yield strains
were reached at panel shears of 68k and 78.5k for the east and west embeds, respectively.
As was the case with comparing the A.1.MAX and B.1.MAX details, embed details
C.2.MAX and D.2.MAX followed similar strain behavior as load was applied on the shear
frame. Thus higher load was induced in the D.2.MAX embed, due to the increased ¾ inch
thickness as opposed to the ⅝ inch C.2.MAX flat bar thickness. C.2.MAX and D.2.MAX
experienced much higher panel shear loads prior to nominal yield strain than the A.1.MAX
and B.1.MAX details previously discussed. Panel shear loads for C.2.MAX at the nominal
yield strains of the east and west embeds were 106k and 131k, respectively, while D.2.MAX
loads were measured as 108.5k and 136.5k for the east and west embeds. Decreased strain
values seen in the figures at the maximum loads are due to these points being considered
immediately prior to panel failure, where element failure may have caused load
redistribution in the embed. Figure 4.17 and Figure 4.18 show the average strain in both
embeds for PCP details C.2.MAX and D.2.MAX, respectively.
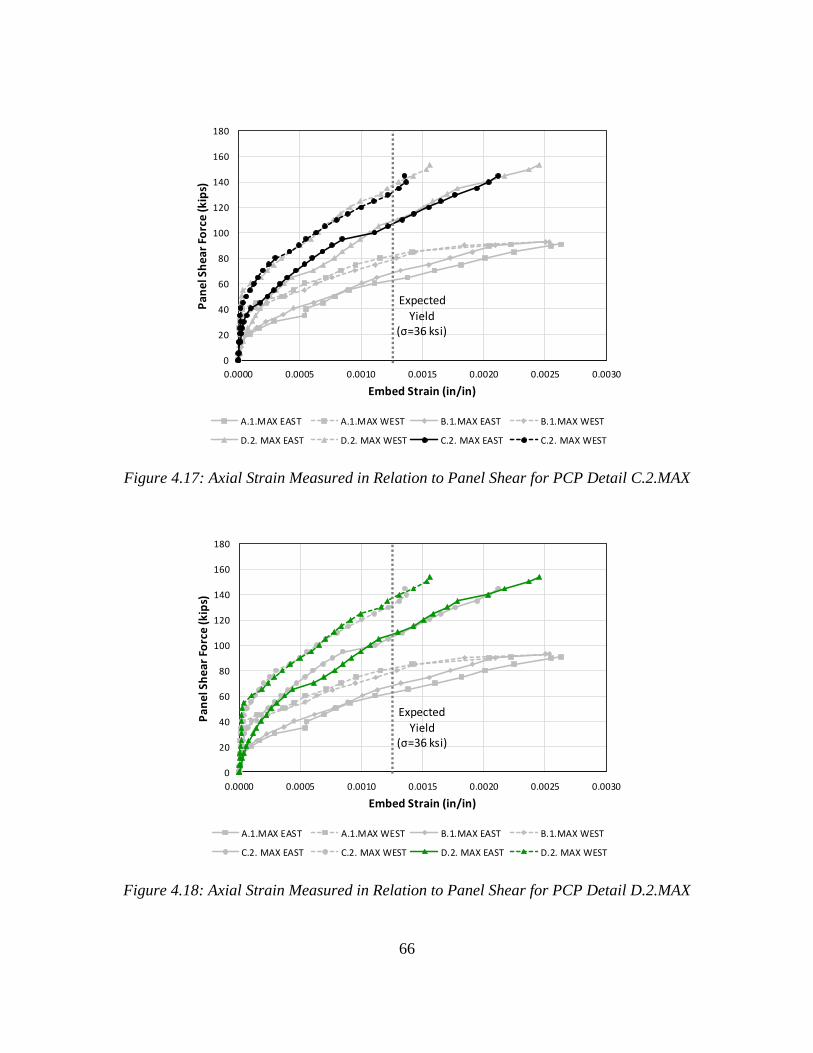
66
Figure 4.17: Axial Strain Measured in Relation to Panel Shear for PCP Detail C.2.MAX
Figure 4.18: Axial Strain Measured in Relation to Panel Shear for PCP Detail D.2.MAX
0
20
40
60
80
100
120
140
160
180
0.0000 0.0005 0.0010 0.0015 0.0020 0.0025 0.0030
Pa
ne
l Sh
ea
r Fo
rce
(kip
s)
Embed Strain (in/in)
A.1.MAX EAST A.1.MAX WEST B.1.MAX EAST B.1.MAX WEST
D.2. MAX EAST D.2. MAX WEST C.2. MAX EAST C.2. MAX WEST
Expected
Yield(σ=36 ksi)
0
20
40
60
80
100
120
140
160
180
0.0000 0.0005 0.0010 0.0015 0.0020 0.0025 0.0030
Pa
ne
l Sh
ea
r Fo
rce
(kip
s)
Embed Strain (in/in)
A.1.MAX EAST A.1.MAX WEST B.1.MAX EAST B.1.MAX WEST
C.2. MAX EAST C.2. MAX WEST D.2. MAX EAST D.2. MAX WEST
Expected
Yield(σ=36 ksi)
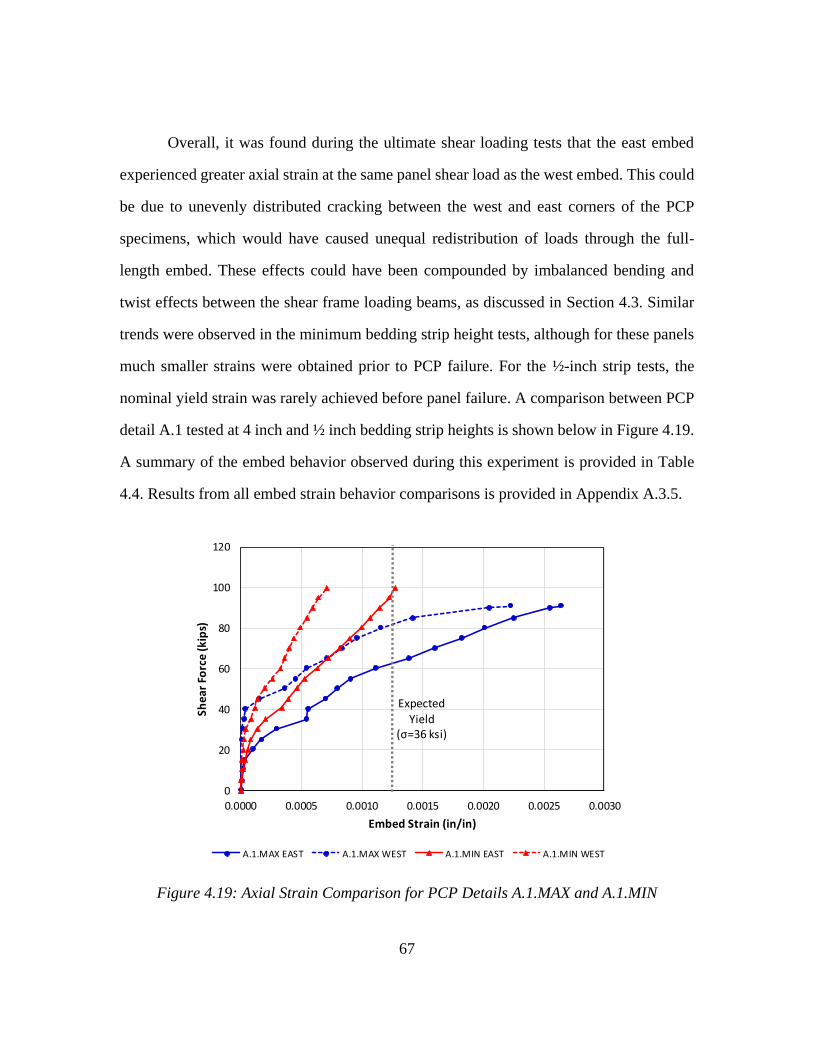
67
Overall, it was found during the ultimate shear loading tests that the east embed
experienced greater axial strain at the same panel shear load as the west embed. This could
be due to unevenly distributed cracking between the west and east corners of the PCP
specimens, which would have caused unequal redistribution of loads through the full-
length embed. These effects could have been compounded by imbalanced bending and
twist effects between the shear frame loading beams, as discussed in Section 4.3. Similar
trends were observed in the minimum bedding strip height tests, although for these panels
much smaller strains were obtained prior to PCP failure. For the ½-inch strip tests, the
nominal yield strain was rarely achieved before panel failure. A comparison between PCP
detail A.1 tested at 4 inch and ½ inch bedding strip heights is shown below in Figure 4.19.
A summary of the embed behavior observed during this experiment is provided in Table
4.4. Results from all embed strain behavior comparisons is provided in Appendix A.3.5.
Figure 4.19: Axial Strain Comparison for PCP Details A.1.MAX and A.1.MIN
0
20
40
60
80
100
120
0.0000 0.0005 0.0010 0.0015 0.0020 0.0025 0.0030
She
ar F
orc
e (
kip
s)
Embed Strain (in/in)
A.1.MAX EAST A.1.MAX WEST A.1.MIN EAST A.1.MIN WEST
Expected
Yield(σ=36 ksi)
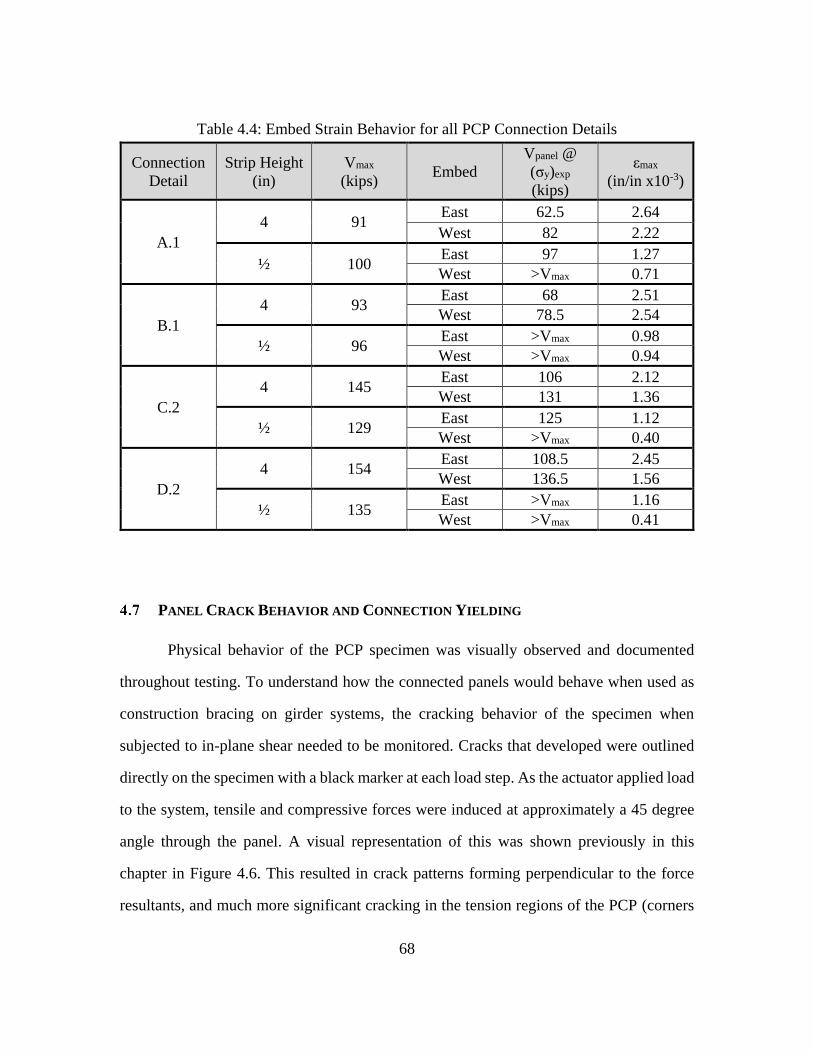
68
Table 4.4: Embed Strain Behavior for all PCP Connection Details
Connection
Detail
Strip Height
(in)
Vmax
(kips) Embed
Vpanel @
(σy)exp
(kips)
εmax
(in/in x10-3)
A.1
4 91 East 62.5 2.64
West 82 2.22
½ 100 East 97 1.27
West >Vmax 0.71
B.1
4 93 East 68 2.51
West 78.5 2.54
½ 96 East >Vmax 0.98
West >Vmax 0.94
C.2
4 145 East 106 2.12
West 131 1.36
½ 129 East 125 1.12
West >Vmax 0.40
D.2
4 154 East 108.5 2.45
West 136.5 1.56
½ 135 East >Vmax 1.16
West >Vmax 0.41
PANEL CRACK BEHAVIOR AND CONNECTION YIELDING
Physical behavior of the PCP specimen was visually observed and documented
throughout testing. To understand how the connected panels would behave when used as
construction bracing on girder systems, the cracking behavior of the specimen when
subjected to in-plane shear needed to be monitored. Cracks that developed were outlined
directly on the specimen with a black marker at each load step. As the actuator applied load
to the system, tensile and compressive forces were induced at approximately a 45 degree
angle through the panel. A visual representation of this was shown previously in this
chapter in Figure 4.6. This resulted in crack patterns forming perpendicular to the force
resultants, and much more significant cracking in the tension regions of the PCP (corners
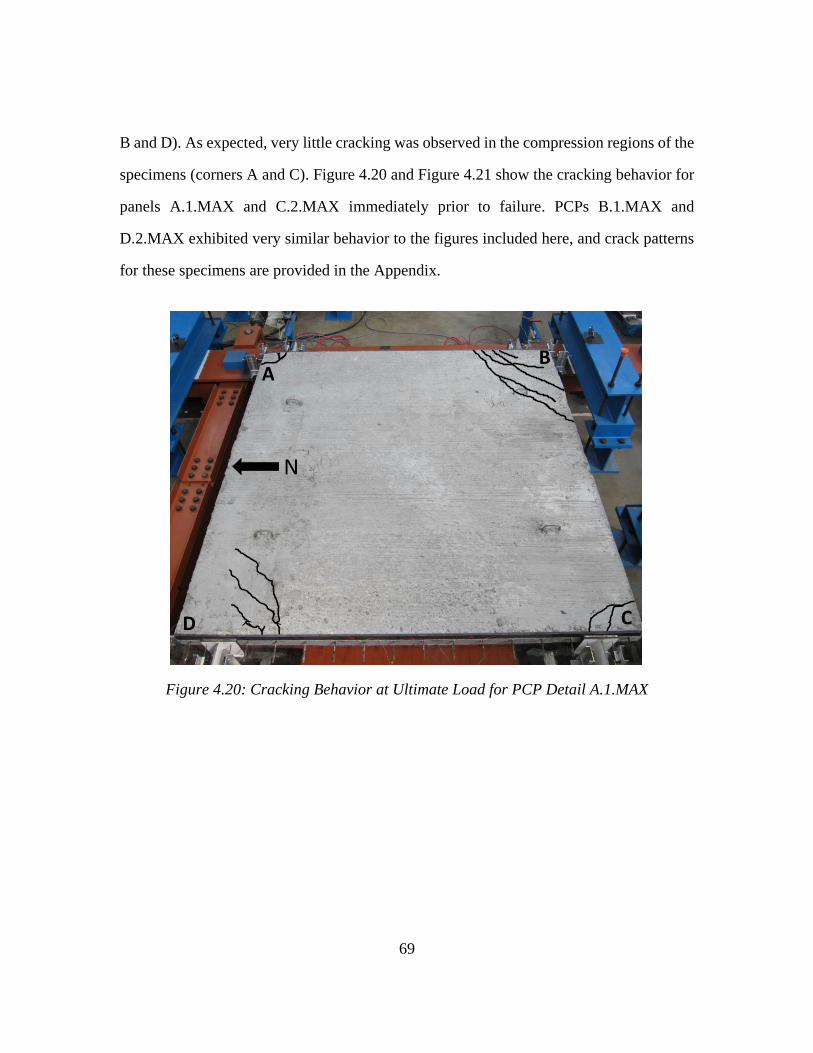
69
B and D). As expected, very little cracking was observed in the compression regions of the
specimens (corners A and C). Figure 4.20 and Figure 4.21 show the cracking behavior for
panels A.1.MAX and C.2.MAX immediately prior to failure. PCPs B.1.MAX and
D.2.MAX exhibited very similar behavior to the figures included here, and crack patterns
for these specimens are provided in the Appendix.
Figure 4.20: Cracking Behavior at Ultimate Load for PCP Detail A.1.MAX
AB
CD
N
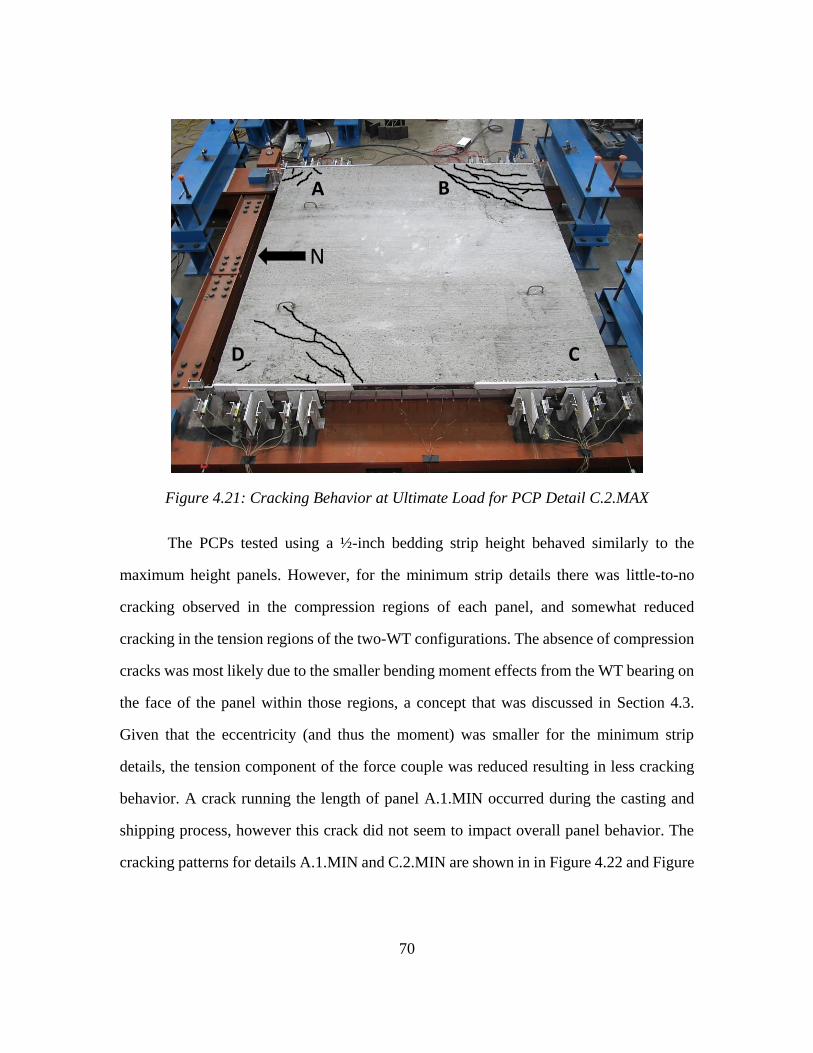
70
Figure 4.21: Cracking Behavior at Ultimate Load for PCP Detail C.2.MAX
The PCPs tested using a ½-inch bedding strip height behaved similarly to the
maximum height panels. However, for the minimum strip details there was little-to-no
cracking observed in the compression regions of each panel, and somewhat reduced
cracking in the tension regions of the two-WT configurations. The absence of compression
cracks was most likely due to the smaller bending moment effects from the WT bearing on
the face of the panel within those regions, a concept that was discussed in Section 4.3.
Given that the eccentricity (and thus the moment) was smaller for the minimum strip
details, the tension component of the force couple was reduced resulting in less cracking
behavior. A crack running the length of panel A.1.MIN occurred during the casting and
shipping process, however this crack did not seem to impact overall panel behavior. The
cracking patterns for details A.1.MIN and C.2.MIN are shown in in Figure 4.22 and Figure
N
A B
CD
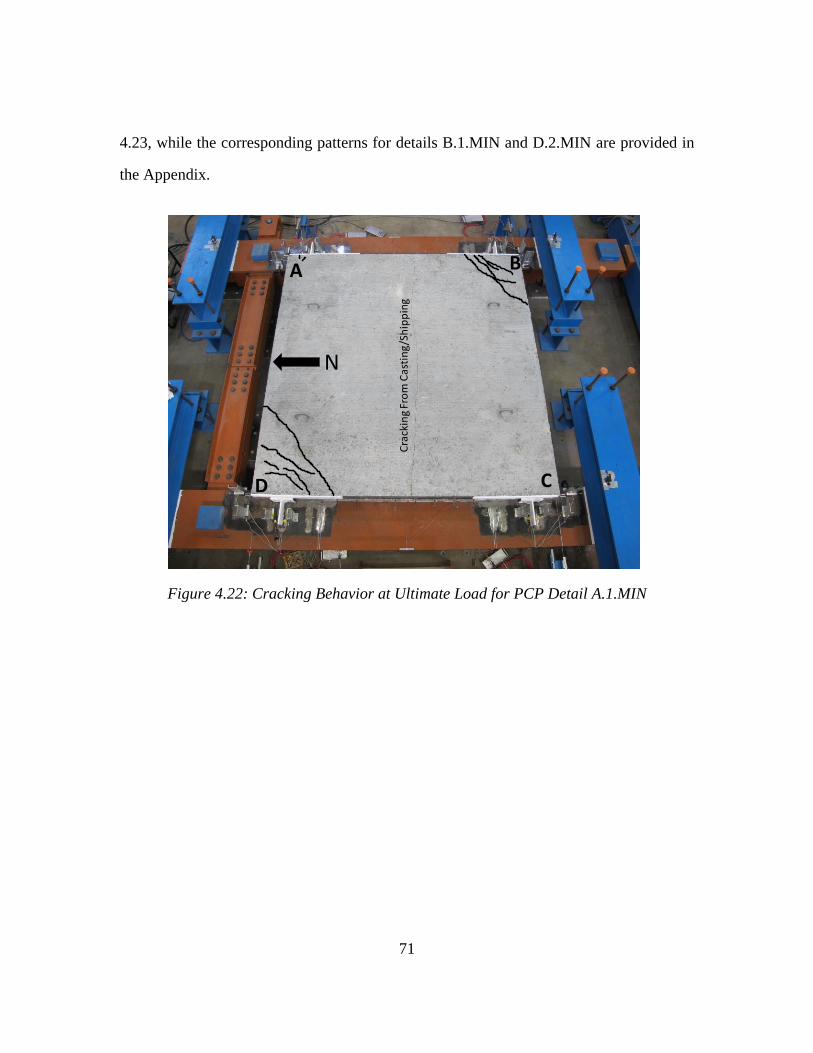
71
4.23, while the corresponding patterns for details B.1.MIN and D.2.MIN are provided in
the Appendix.
Figure 4.22: Cracking Behavior at Ultimate Load for PCP Detail A.1.MIN
Cra
ckin
g Fr
om
Ca
stin
g/S
hip
pin
g
N
A B
CD
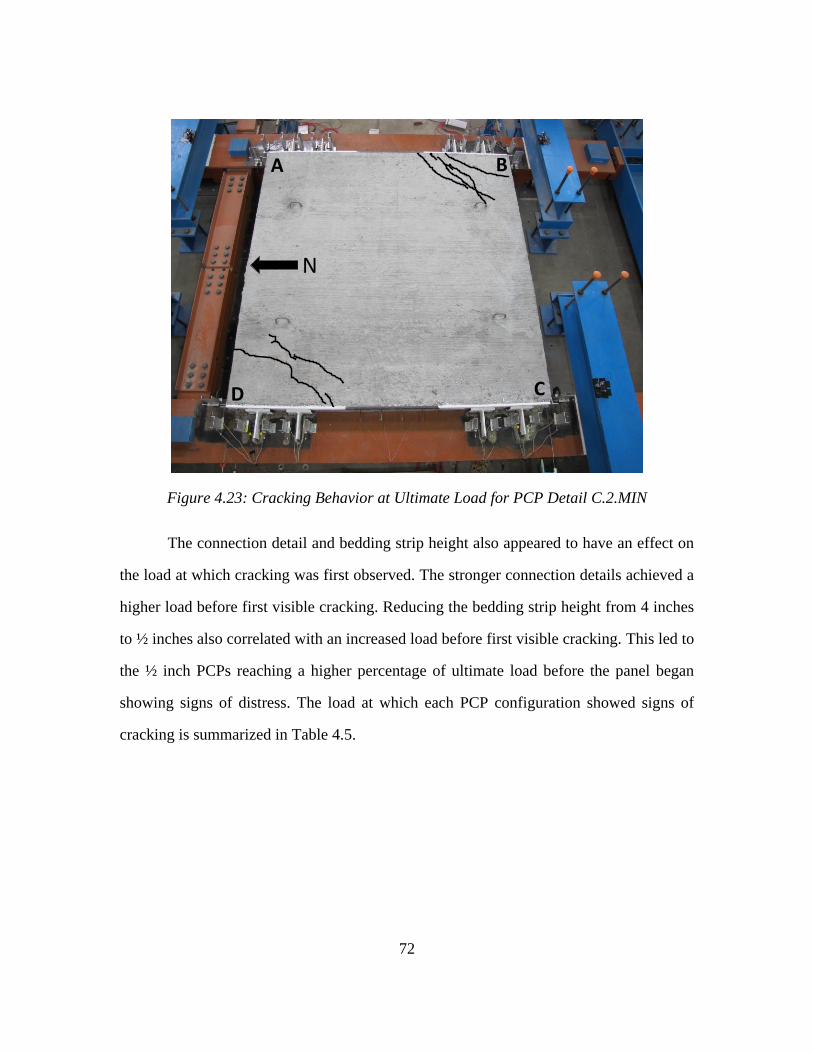
72
Figure 4.23: Cracking Behavior at Ultimate Load for PCP Detail C.2.MIN
The connection detail and bedding strip height also appeared to have an effect on
the load at which cracking was first observed. The stronger connection details achieved a
higher load before first visible cracking. Reducing the bedding strip height from 4 inches
to ½ inches also correlated with an increased load before first visible cracking. This led to
the ½ inch PCPs reaching a higher percentage of ultimate load before the panel began
showing signs of distress. The load at which each PCP configuration showed signs of
cracking is summarized in Table 4.5.
N
A B
CD
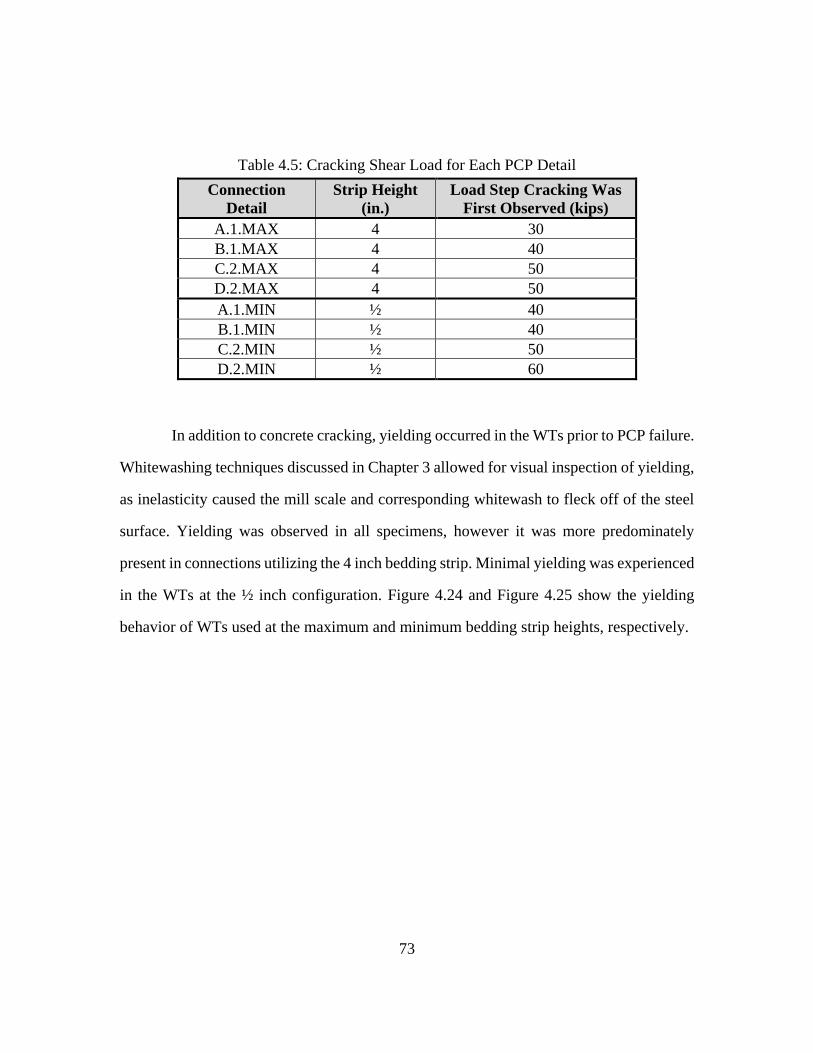
73
Table 4.5: Cracking Shear Load for Each PCP Detail
Connection
Detail
Strip Height
(in.)
Load Step Cracking Was
First Observed (kips)
A.1.MAX 4 30
B.1.MAX 4 40
C.2.MAX 4 50
D.2.MAX 4 50
A.1.MIN ½ 40
B.1.MIN ½ 40
C.2.MIN ½ 50
D.2.MIN ½ 60
In addition to concrete cracking, yielding occurred in the WTs prior to PCP failure.
Whitewashing techniques discussed in Chapter 3 allowed for visual inspection of yielding,
as inelasticity caused the mill scale and corresponding whitewash to fleck off of the steel
surface. Yielding was observed in all specimens, however it was more predominately
present in connections utilizing the 4 inch bedding strip. Minimal yielding was experienced
in the WTs at the ½ inch configuration. Figure 4.24 and Figure 4.25 show the yielding
behavior of WTs used at the maximum and minimum bedding strip heights, respectively.
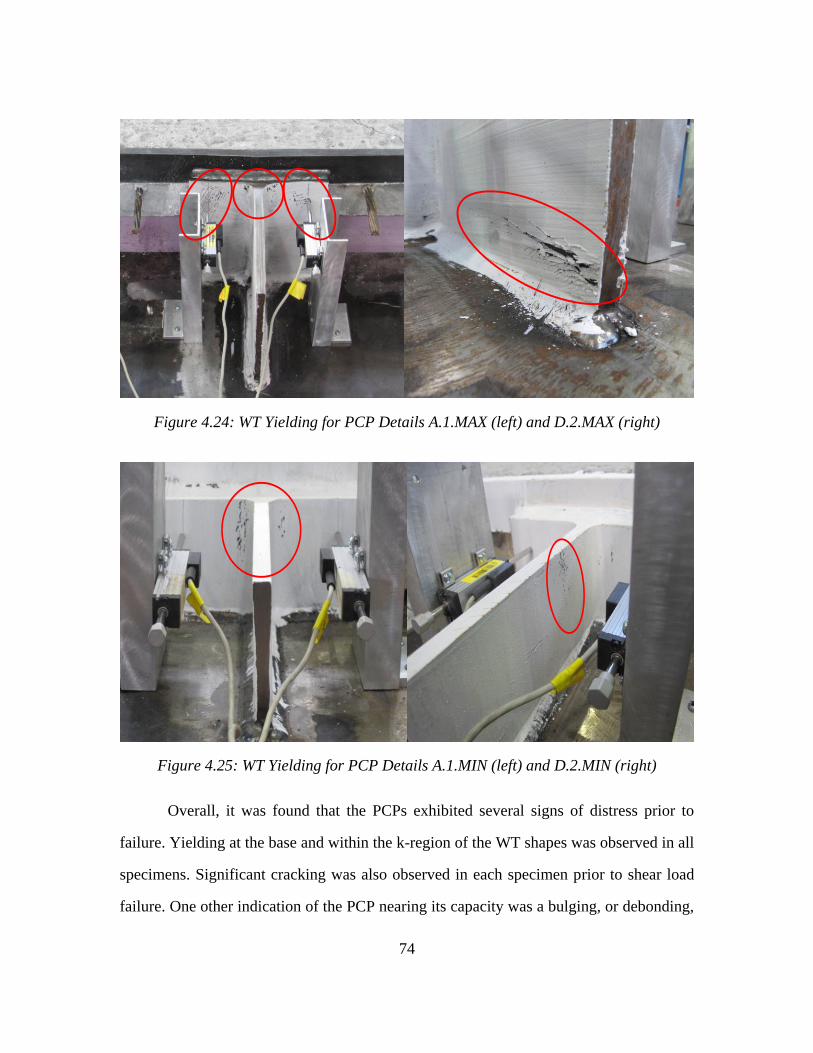
74
Figure 4.24: WT Yielding for PCP Details A.1.MAX (left) and D.2.MAX (right)
Figure 4.25: WT Yielding for PCP Details A.1.MIN (left) and D.2.MIN (right)
Overall, it was found that the PCPs exhibited several signs of distress prior to
failure. Yielding at the base and within the k-region of the WT shapes was observed in all
specimens. Significant cracking was also observed in each specimen prior to shear load
failure. One other indication of the PCP nearing its capacity was a bulging, or debonding,
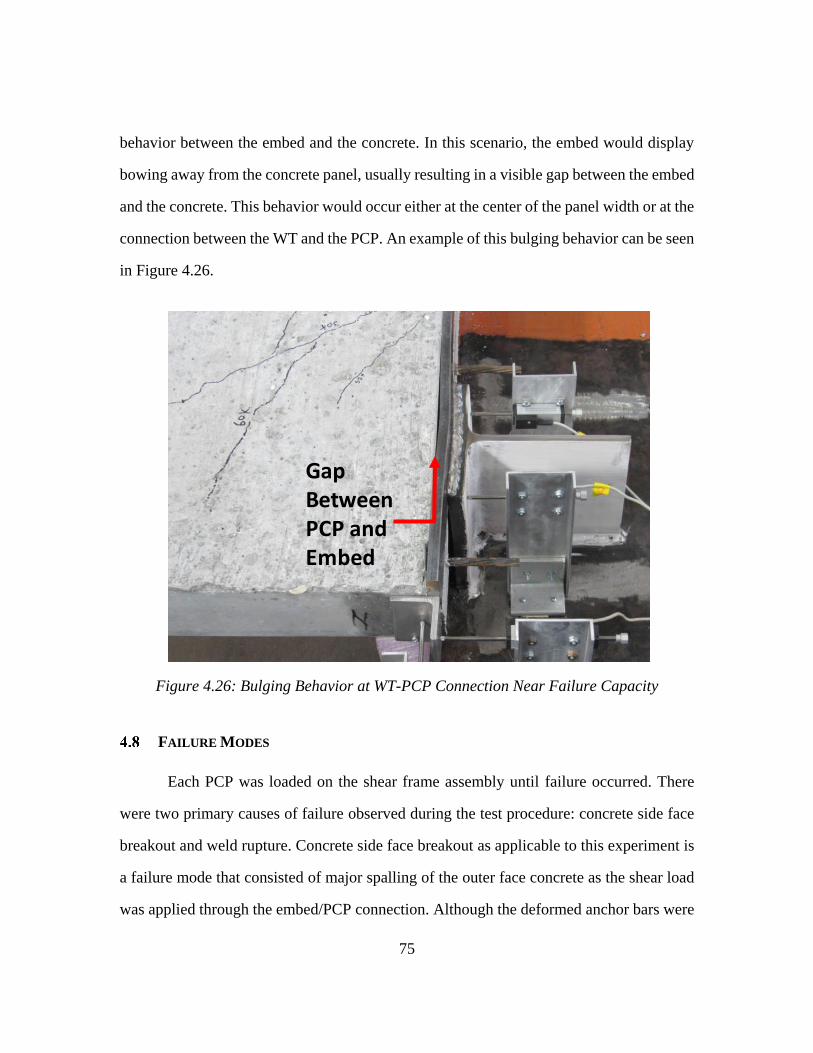
75
behavior between the embed and the concrete. In this scenario, the embed would display
bowing away from the concrete panel, usually resulting in a visible gap between the embed
and the concrete. This behavior would occur either at the center of the panel width or at the
connection between the WT and the PCP. An example of this bulging behavior can be seen
in Figure 4.26.
Figure 4.26: Bulging Behavior at WT-PCP Connection Near Failure Capacity
FAILURE MODES
Each PCP was loaded on the shear frame assembly until failure occurred. There
were two primary causes of failure observed during the test procedure: concrete side face
breakout and weld rupture. Concrete side face breakout as applicable to this experiment is
a failure mode that consisted of major spalling of the outer face concrete as the shear load
was applied through the embed/PCP connection. Although the deformed anchor bars were
Gap Between PCP and Embed
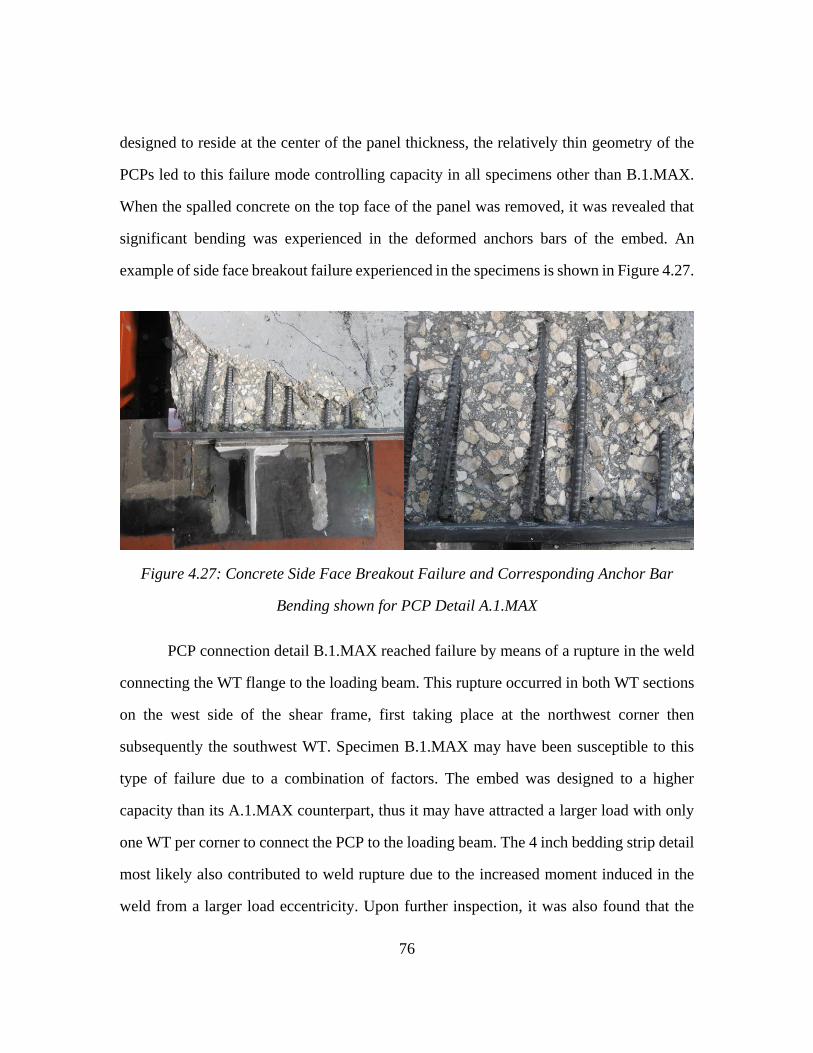
76
designed to reside at the center of the panel thickness, the relatively thin geometry of the
PCPs led to this failure mode controlling capacity in all specimens other than B.1.MAX.
When the spalled concrete on the top face of the panel was removed, it was revealed that
significant bending was experienced in the deformed anchors bars of the embed. An
example of side face breakout failure experienced in the specimens is shown in Figure 4.27.
Figure 4.27: Concrete Side Face Breakout Failure and Corresponding Anchor Bar
Bending shown for PCP Detail A.1.MAX
PCP connection detail B.1.MAX reached failure by means of a rupture in the weld
connecting the WT flange to the loading beam. This rupture occurred in both WT sections
on the west side of the shear frame, first taking place at the northwest corner then
subsequently the southwest WT. Specimen B.1.MAX may have been susceptible to this
type of failure due to a combination of factors. The embed was designed to a higher
capacity than its A.1.MAX counterpart, thus it may have attracted a larger load with only
one WT per corner to connect the PCP to the loading beam. The 4 inch bedding strip detail
most likely also contributed to weld rupture due to the increased moment induced in the
weld from a larger load eccentricity. Upon further inspection, it was also found that the
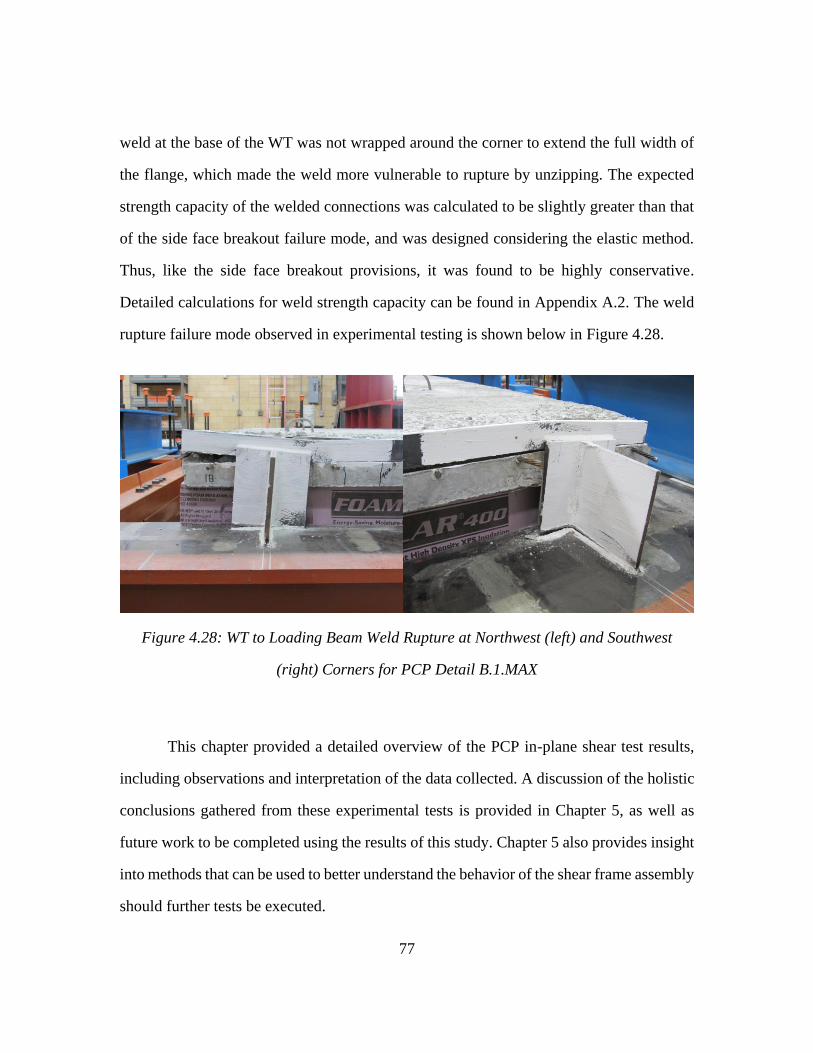
77
weld at the base of the WT was not wrapped around the corner to extend the full width of
the flange, which made the weld more vulnerable to rupture by unzipping. The expected
strength capacity of the welded connections was calculated to be slightly greater than that
of the side face breakout failure mode, and was designed considering the elastic method.
Thus, like the side face breakout provisions, it was found to be highly conservative.
Detailed calculations for weld strength capacity can be found in Appendix A.2. The weld
rupture failure mode observed in experimental testing is shown below in Figure 4.28.
Figure 4.28: WT to Loading Beam Weld Rupture at Northwest (left) and Southwest
(right) Corners for PCP Detail B.1.MAX
This chapter provided a detailed overview of the PCP in-plane shear test results,
including observations and interpretation of the data collected. A discussion of the holistic
conclusions gathered from these experimental tests is provided in Chapter 5, as well as
future work to be completed using the results of this study. Chapter 5 also provides insight
into methods that can be used to better understand the behavior of the shear frame assembly
should further tests be executed.
78
CHAPTER 5: CONCLUSIONS AND FUTURE RESEARCH
OVERVIEW
Horizontally curved bridge systems are often utilized to navigate restricted right-
of-way situations or for highway flyovers due to the tight radius of curvature that are
necessary. The large torsional demands on these systems can lead to significant bracing
requirements to increase the stiffness and control lateral torsional buckling. Typical cross
frame bracing can be expensive to fabricate and can result in fatigue concerns during the
life of the bridge. Partial depth precast concrete deck panels, or PCPS, are frequently used
on straight-girder systems but have not generally been used on horizontally curved girder
systems by the Texas Department of Transportation (TxDOT). If properly engaged, the
PCPs have the potential to provide significant bracing to the girders during construction.
The primary purpose of the research outlined in this thesis is to determine the
capabilities of PCPs as shear-diaphragm bracing on straight and horizontally curved girder
systems during the construction phase. Four different connection details for attaching the
PCP to the girders were introduced and tested within this study, with consideration given
to the effect of bedding strip height on PCP behavior.
SHEAR LOADING EXPERIMENTS
An investigation into the in-plane shear stiffness and strength of the connected
diaphragm was conducted by means of full-scale ultimate shear capacity tests. These tests
were carried out using a fabricated shear frame assembly, examining the behavior of each
of the different PCP details discussed within this thesis. Results were presented on the
79
stiffness and strength behaviors of each PCP. Individual elements of the PCP system were
also monitored throughout testing, such as panel cracking and embed behaviors.
5.2.1 Stiffness and Strength Behavior
All PCP connection details tested were found to provide substantial stiffness and
strength as a shear-diaphragm brace. It was also observed that, as the design strength of
individual connection elements was increased, the panels were able to achieve a higher
overall shear capacity and stiffness. The connection parameters modified throughout
testing were: the number of WT shapes per PCP corner, the embed flat bar thickness, and
the number and thickness of deformed anchor bars cast into the concrete at each corner.
Such design modifications could be incorporated as a method to accommodate systems
with more substantial brace loads. However, further study must be conducted before
recommendations can be made for bracing design. Additionally, it should be noted that
bedding strip height had a significant impact on the PCP system stiffness, with a ½ inch
PCP bedding strip providing at least a 46 percent increase in stiffness compared to when a
4 inch bedding strip was used.
5.2.2 Connection Detail Considerations
The design of the PCP connection detail had a direct impact on the behavior of the
embed during shear loading. Connection details designed to withstand higher capacity
experienced less axial strain in the embed prior to panel failure, indicating a less ductile
overall response. Higher capacity connections also, as expected, reached higher shear loads
before the nominal yielding stresses of A36 steel were exceeded. The bedding strip height
also affected the strain in the embed. Panels connected at a 4 inch strip height all exceeded
the nominal yield strain of the embed, while panels connected using the ½ inch strip height
often did not reach nominal yield strain before panel failure.
80
Failure in all but one specimen was governed by shear anchor breakout from the
side of the concrete, where shear parallel to the failure surface caused major spalling (in
this case at the top face of the panel). Although it was the controlling failure mode, ultimate
shear capacities calculated in the laboratory experiments were greater than 3 times the
predicted capacity calculated using ACI 318. Thus, it was determined that the code is quite
conservative in predicting this failure mode, which relies on the tensile properties of the
concrete. One approach that could be utilized to increase the side-face breakout capacity
of the PCP is to extend the deformed anchor bars across the entire panel width rather than
simply in the corners. This would increase the concrete breakout area, thus increasing
required shear for side face breakout.
The PCP specimen that did not succumb to concrete side face breakout failed by
weld rupture at the base of the WTs on the west side of the panel. Further inspection of the
failed connection revealed that the weld was only placed on the stem-side face of the WT
for this test, thus leaving it vulnerable to rupture by unzipping. To inhibit this failure mode,
it is important that the weld connecting the WT to the loading beam be wrapped around the
corners at the outer faces of the WT flanges.
5.2.3 Additional Considerations
It should be noted that the experimental tests discussed within this thesis focus on
the use of PCPs as a stability brace during the construction phase. Consideration was not
given to the composite deck behavior in the completed bridge, although this could be the
subject of future study. Specific cases with exceptionally high deck demands, such as
instances where the demands require depths exceeding normal provisions, may also
warrant additional consideration in future study.
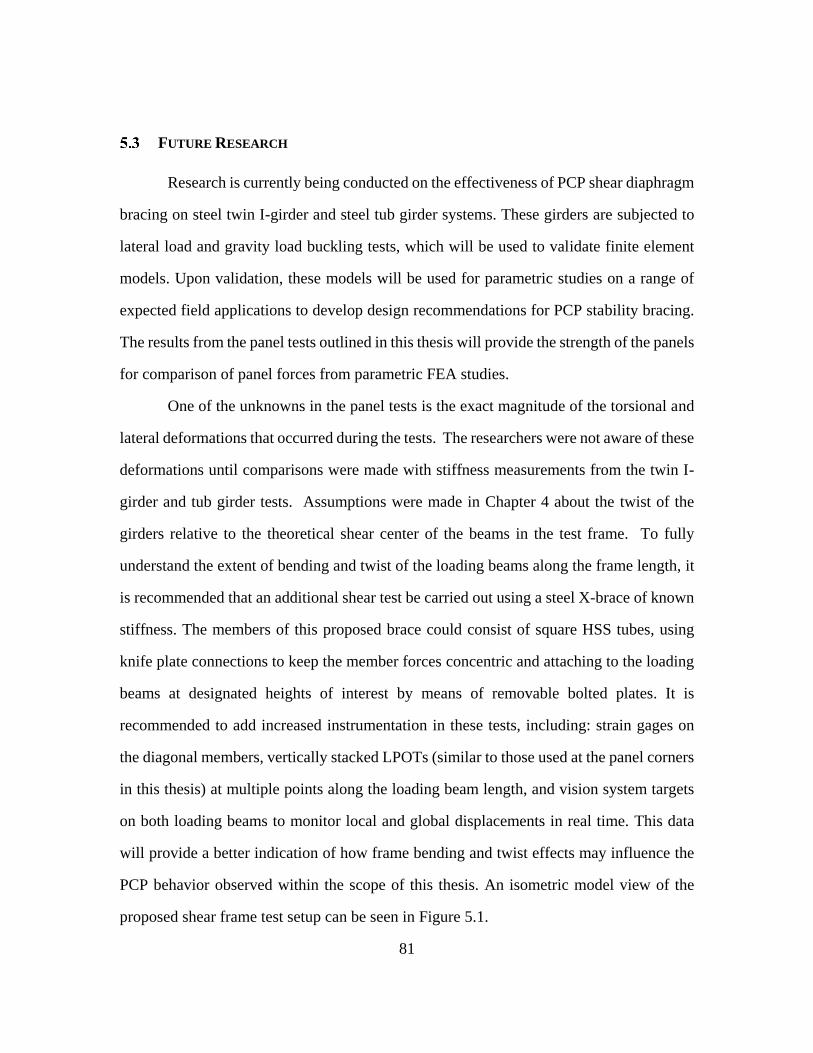
81
FUTURE RESEARCH
Research is currently being conducted on the effectiveness of PCP shear diaphragm
bracing on steel twin I-girder and steel tub girder systems. These girders are subjected to
lateral load and gravity load buckling tests, which will be used to validate finite element
models. Upon validation, these models will be used for parametric studies on a range of
expected field applications to develop design recommendations for PCP stability bracing.
The results from the panel tests outlined in this thesis will provide the strength of the panels
for comparison of panel forces from parametric FEA studies.
One of the unknowns in the panel tests is the exact magnitude of the torsional and
lateral deformations that occurred during the tests. The researchers were not aware of these
deformations until comparisons were made with stiffness measurements from the twin I-
girder and tub girder tests. Assumptions were made in Chapter 4 about the twist of the
girders relative to the theoretical shear center of the beams in the test frame. To fully
understand the extent of bending and twist of the loading beams along the frame length, it
is recommended that an additional shear test be carried out using a steel X-brace of known
stiffness. The members of this proposed brace could consist of square HSS tubes, using
knife plate connections to keep the member forces concentric and attaching to the loading
beams at designated heights of interest by means of removable bolted plates. It is
recommended to add increased instrumentation in these tests, including: strain gages on
the diagonal members, vertically stacked LPOTs (similar to those used at the panel corners
in this thesis) at multiple points along the loading beam length, and vision system targets
on both loading beams to monitor local and global displacements in real time. This data
will provide a better indication of how frame bending and twist effects may influence the
PCP behavior observed within the scope of this thesis. An isometric model view of the
proposed shear frame test setup can be seen in Figure 5.1.
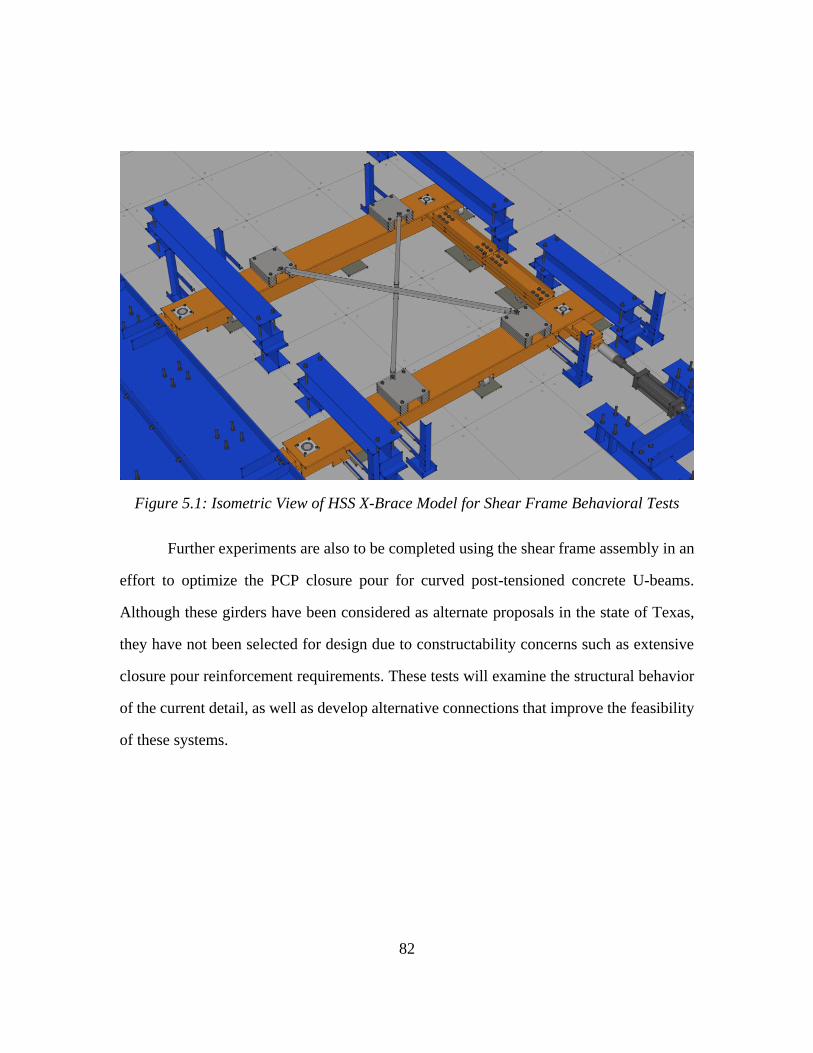
82
Figure 5.1: Isometric View of HSS X-Brace Model for Shear Frame Behavioral Tests
Further experiments are also to be completed using the shear frame assembly in an
effort to optimize the PCP closure pour for curved post-tensioned concrete U-beams.
Although these girders have been considered as alternate proposals in the state of Texas,
they have not been selected for design due to constructability concerns such as extensive
closure pour reinforcement requirements. These tests will examine the structural behavior
of the current detail, as well as develop alternative connections that improve the feasibility
of these systems.
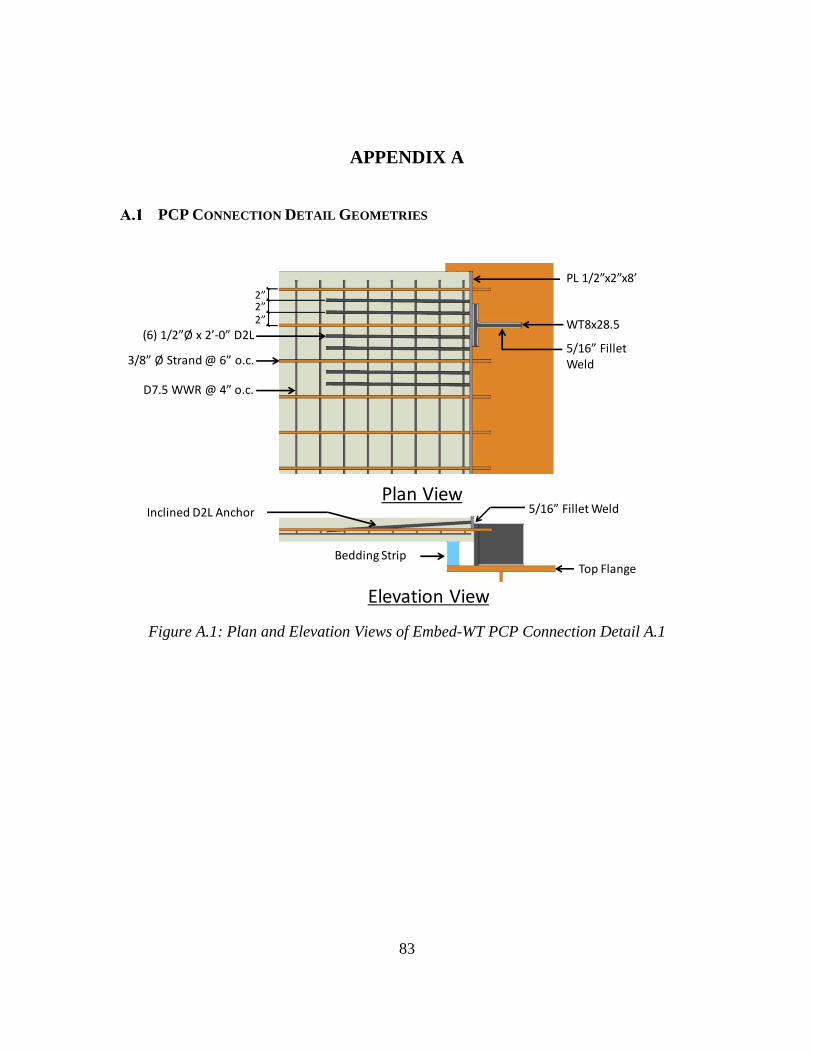
83
APPENDIX A
PCP CONNECTION DETAIL GEOMETRIES
Figure A.1: Plan and Elevation Views of Embed-WT PCP Connection Detail A.1
Plan View
Elevation View
(6) 1/2”Ø x 2’-0” D2L
D7.5 WWR @ 4” o.c.
3/8” Ø Strand @ 6” o.c.
WT8x28.5
PL 1/2”x2”x8’
Bedding Strip
Inclined D2L Anchor
5/16” Fillet Weld
Top Flange
5/16” Fillet Weld
2”2”2”
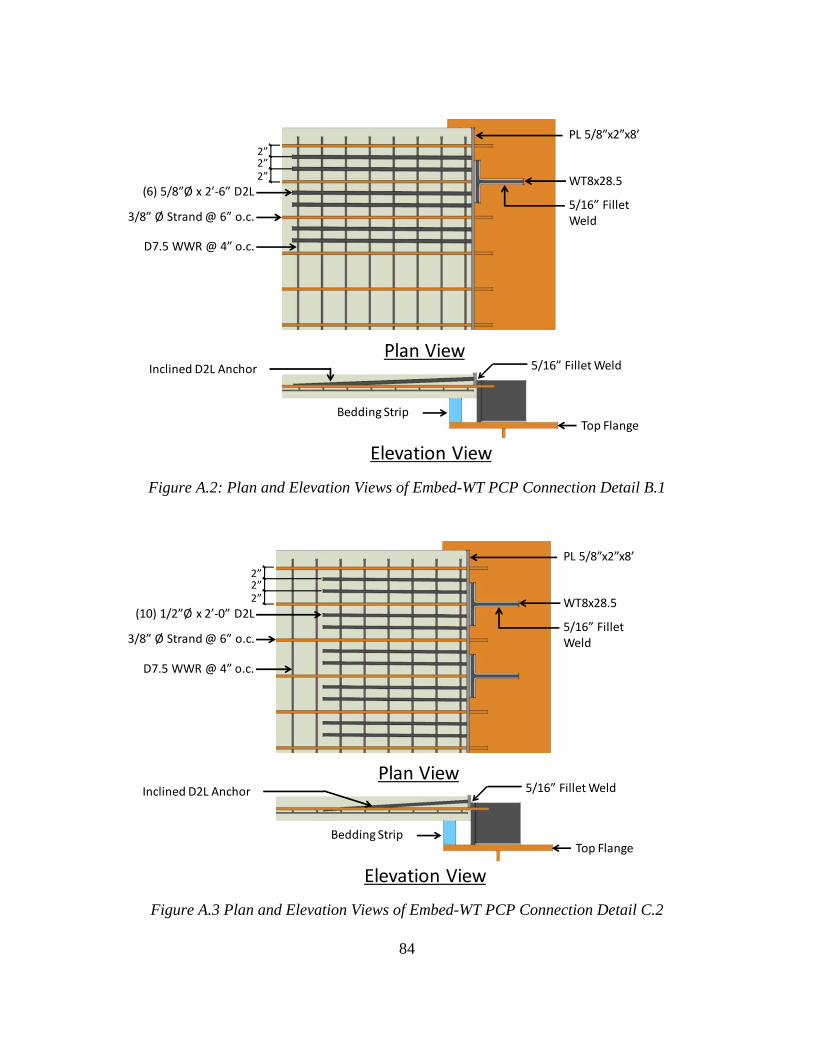
84
Figure A.2: Plan and Elevation Views of Embed-WT PCP Connection Detail B.1
Figure A.3 Plan and Elevation Views of Embed-WT PCP Connection Detail C.2
Plan View
Elevation View
(6) 5/8”Ø x 2’-6” D2L
D7.5 WWR @ 4” o.c.
3/8” Ø Strand @ 6” o.c.
WT8x28.5
PL 5/8”x2”x8’
Bedding Strip
Inclined D2L Anchor
5/16” Fillet Weld
Top Flange
5/16” Fillet Weld
2”2”2”
Plan View
Elevation View
(10) 1/2”Ø x 2’-0” D2L
D7.5 WWR @ 4” o.c.
3/8” Ø Strand @ 6” o.c.
WT8x28.5
PL 5/8”x2”x8’
Bedding Strip
Inclined D2L Anchor
5/16” Fillet Weld
Top Flange
5/16” Fillet Weld
2”2”2”
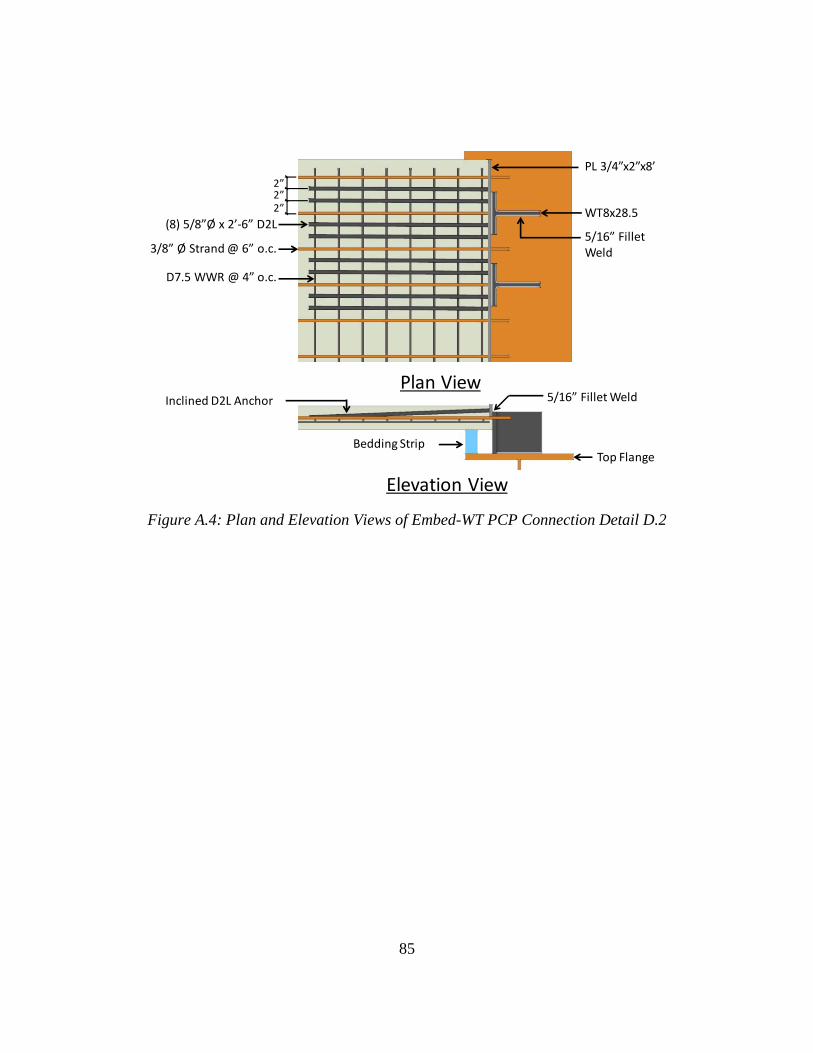
85
Figure A.4: Plan and Elevation Views of Embed-WT PCP Connection Detail D.2
Plan View
Elevation View
(8) 5/8”Ø x 2’-6” D2L
D7.5 WWR @ 4” o.c.
3/8” Ø Strand @ 6” o.c.
WT8x28.5
PL 3/4”x2”x8’
Bedding Strip
Inclined D2L Anchor
5/16” Fillet Weld
Top Flange
5/16” Fillet Weld
2”2”2”
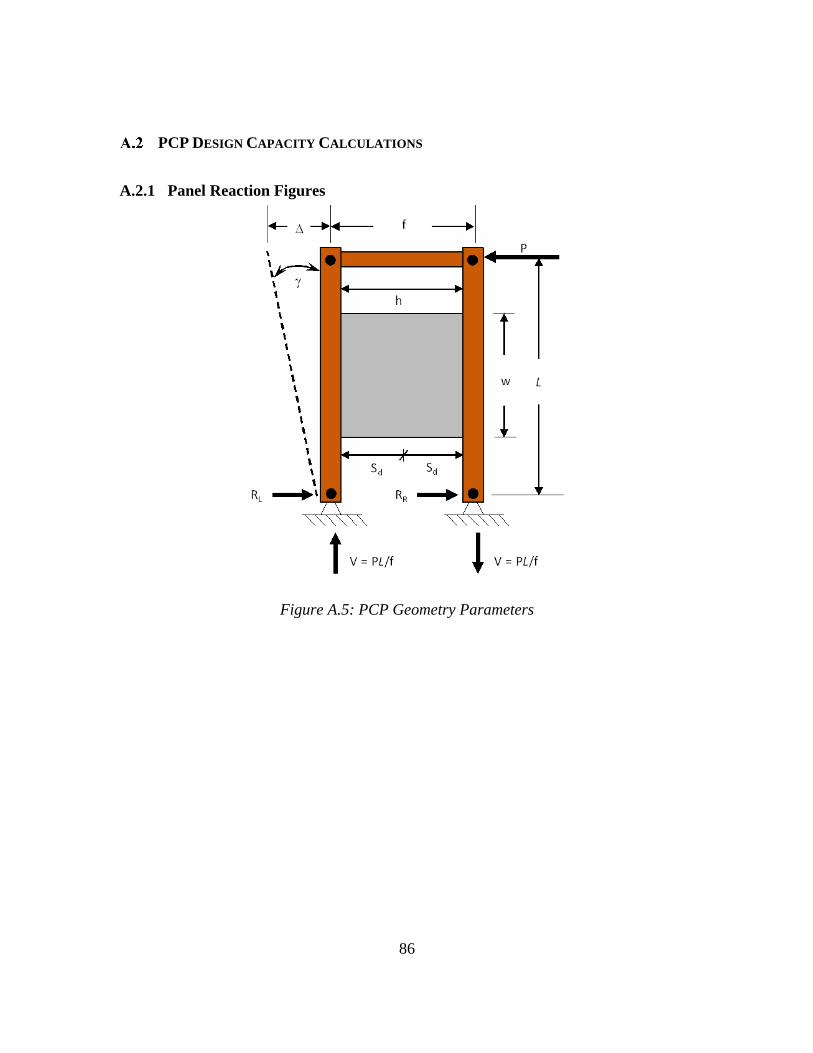
86
PCP DESIGN CAPACITY CALCULATIONS
A.2.1 Panel Reaction Figures
Figure A.5: PCP Geometry Parameters
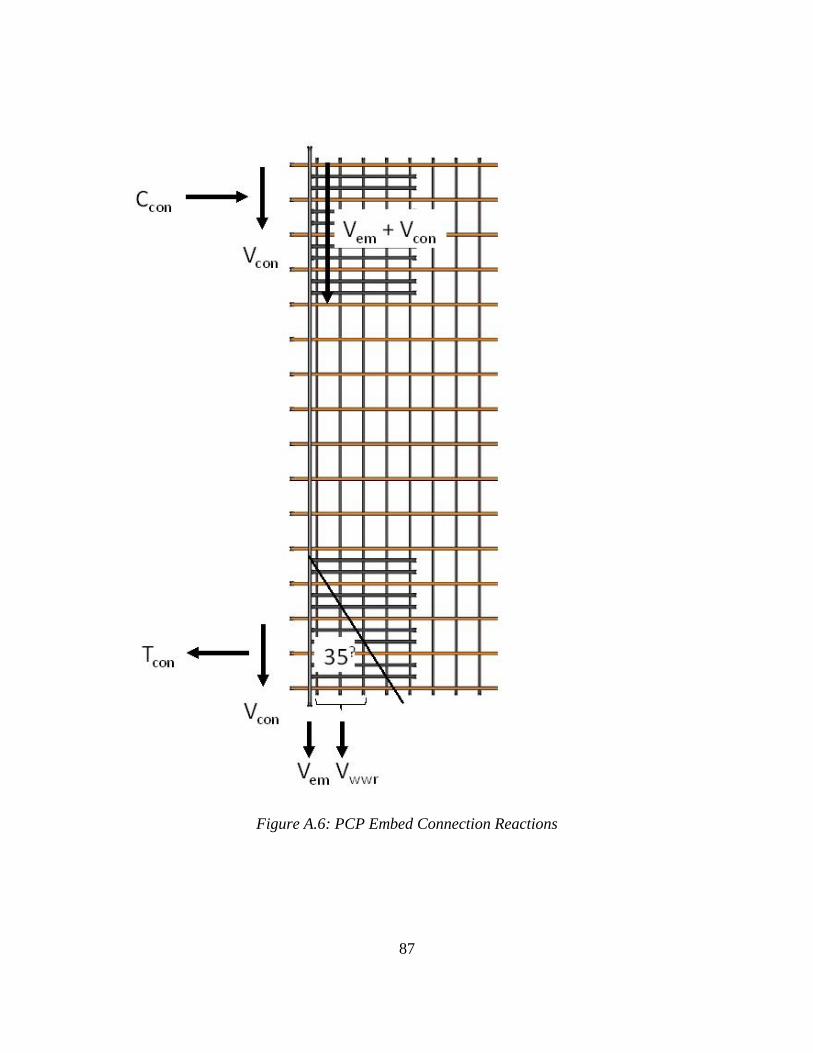
87
Figure A.6: PCP Embed Connection Reactions

88
A.2.2 PCP Detail A.1 Capacity Calculations
A.2.2.1 Detail A.1 Panel Capacity
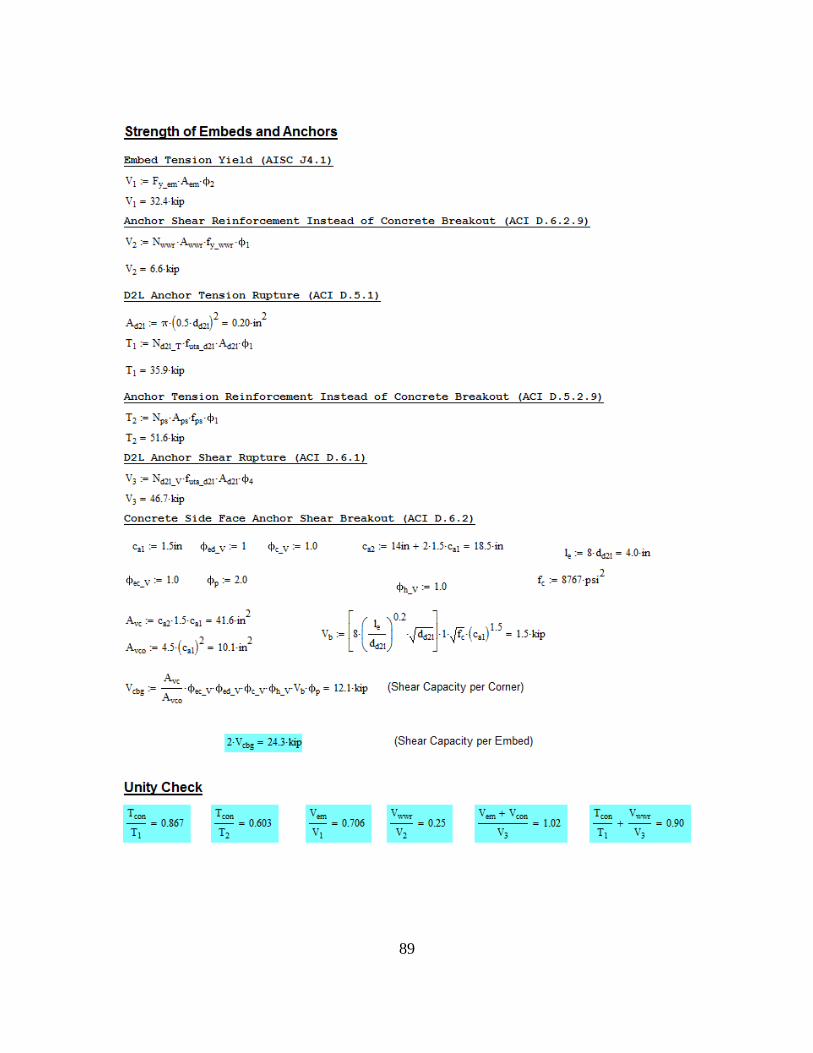
89

90
A.2.2.2 Detail A.1 Weld Capacity

91
A.2.3 PCP Detail B.1 Capacity Calculations
A.2.3.1 Detail B.1 Panel Capacity

92
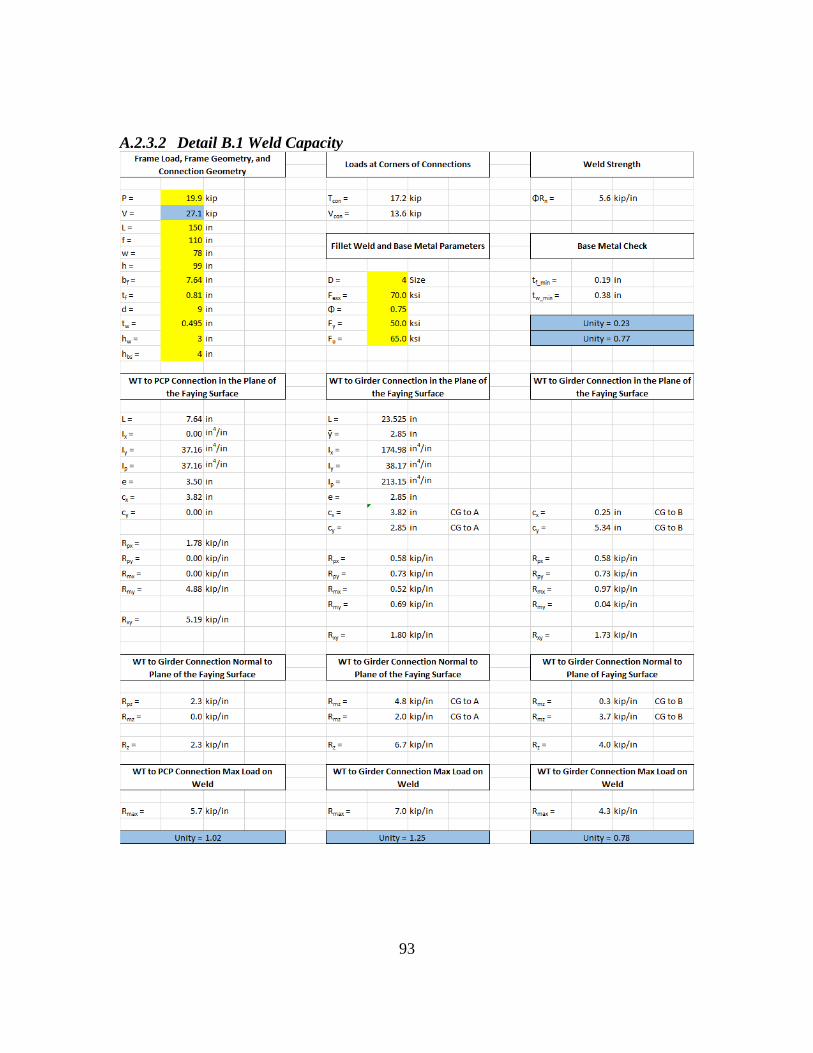
93
A.2.3.2 Detail B.1 Weld Capacity

94
A.2.4 PCP Detail C.2 Capacity Calculations
A.2.4.1 Detail C.2 Panel Capacity

95
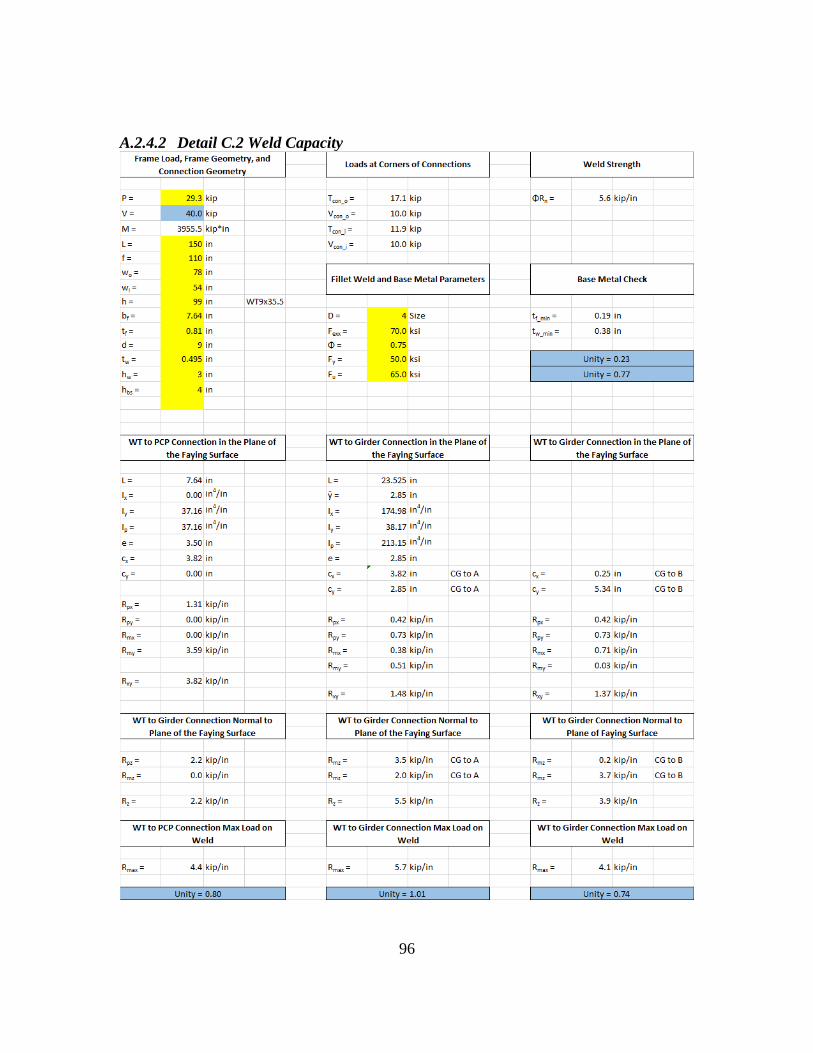
96
A.2.4.2 Detail C.2 Weld Capacity
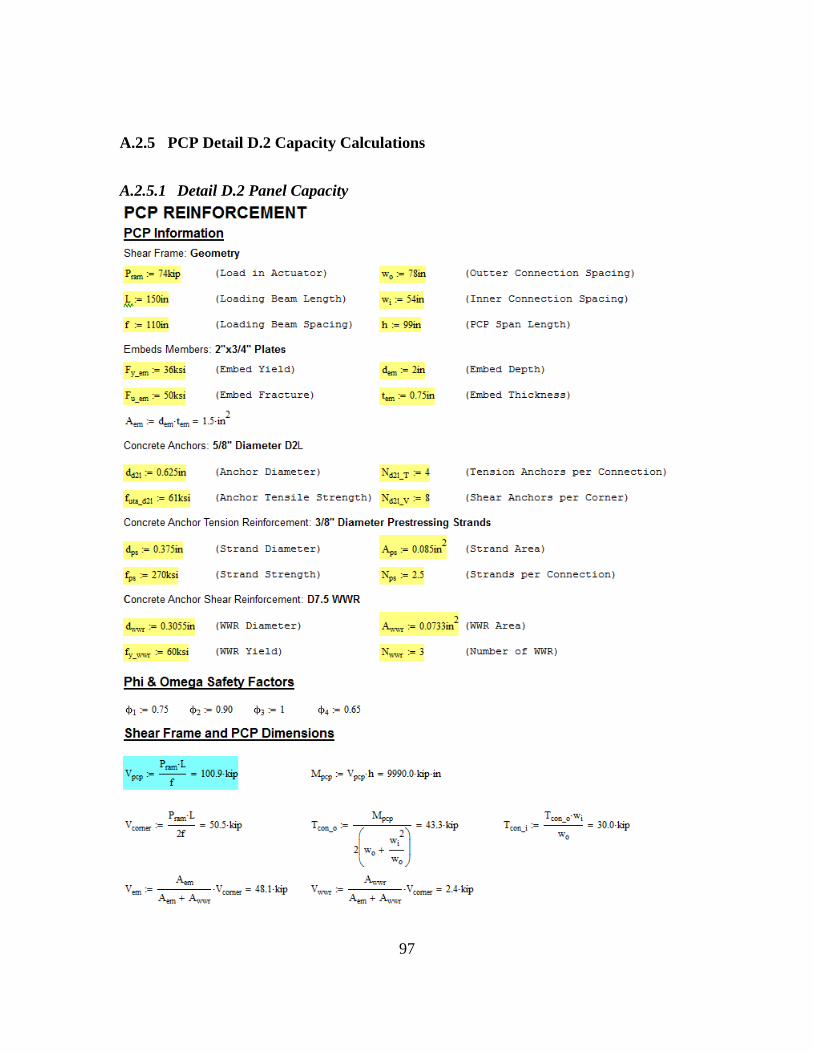
97
A.2.5 PCP Detail D.2 Capacity Calculations
A.2.5.1 Detail D.2 Panel Capacity
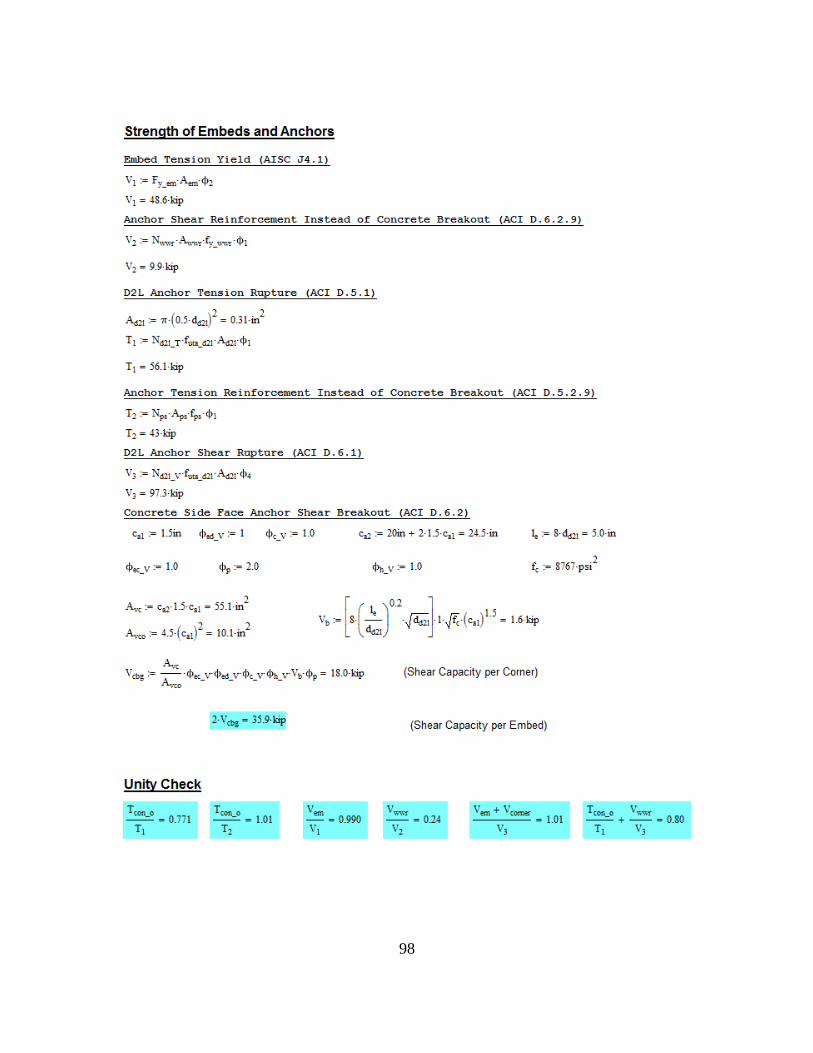
98
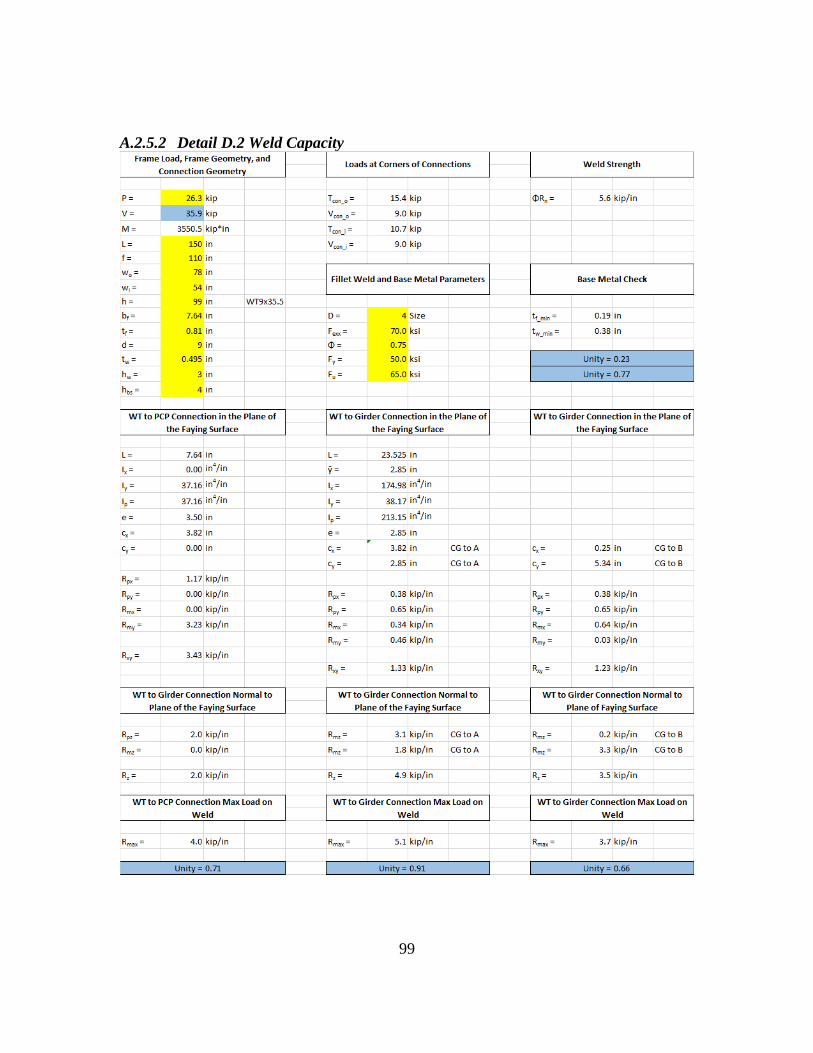
99
A.2.5.2 Detail D.2 Weld Capacity
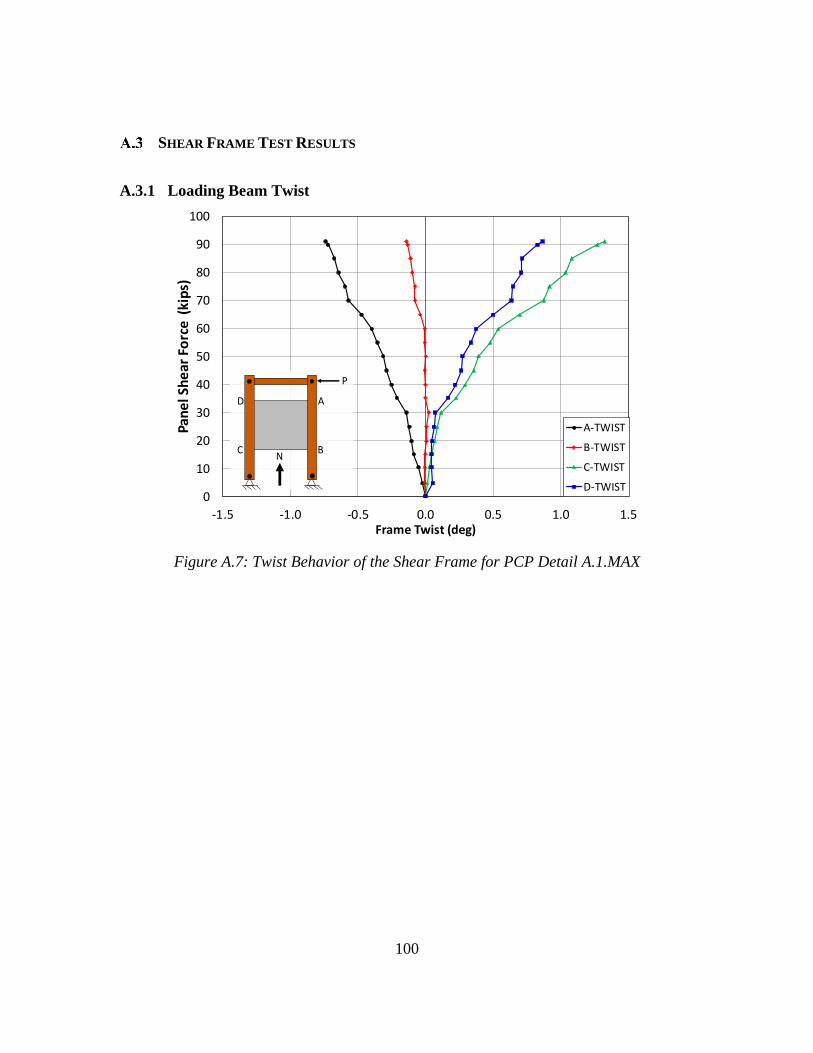
100
SHEAR FRAME TEST RESULTS
A.3.1 Loading Beam Twist
Figure A.7: Twist Behavior of the Shear Frame for PCP Detail A.1.MAX
0
10
20
30
40
50
60
70
80
90
100
-1.5 -1.0 -0.5 0.0 0.5 1.0 1.5
Pan
el S
he
ar F
orc
e (
kip
s)
Frame Twist (deg)
A-TWIST
B-TWIST
C-TWIST
D-TWIST
P
A
B
D
CN
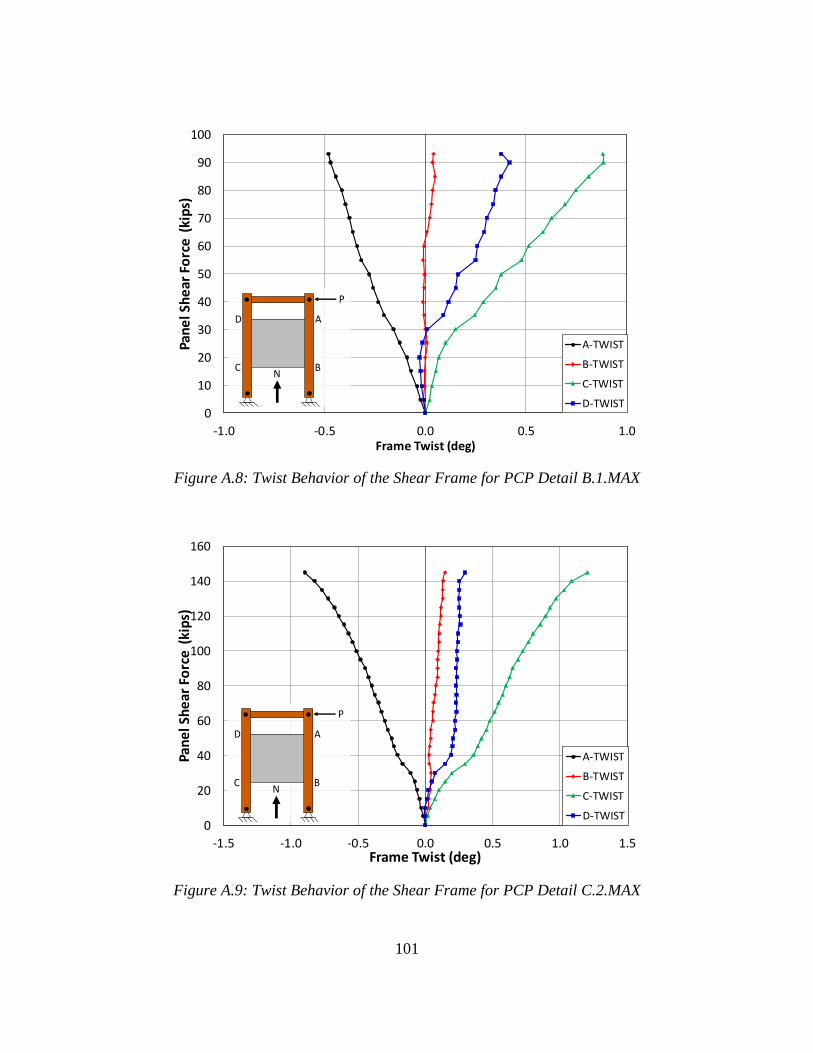
101
Figure A.8: Twist Behavior of the Shear Frame for PCP Detail B.1.MAX
Figure A.9: Twist Behavior of the Shear Frame for PCP Detail C.2.MAX
0
10
20
30
40
50
60
70
80
90
100
-1.0 -0.5 0.0 0.5 1.0
Pan
el S
he
ar F
orc
e (
kip
s)
Frame Twist (deg)
A-TWIST
B-TWIST
C-TWIST
D-TWIST
P
A
B
D
CN
0
20
40
60
80
100
120
140
160
-1.5 -1.0 -0.5 0.0 0.5 1.0 1.5
Pan
el S
he
ar F
orc
e (
kip
s)
Frame Twist (deg)
A-TWIST
B-TWIST
C-TWIST
D-TWIST
P
A
B
D
CN
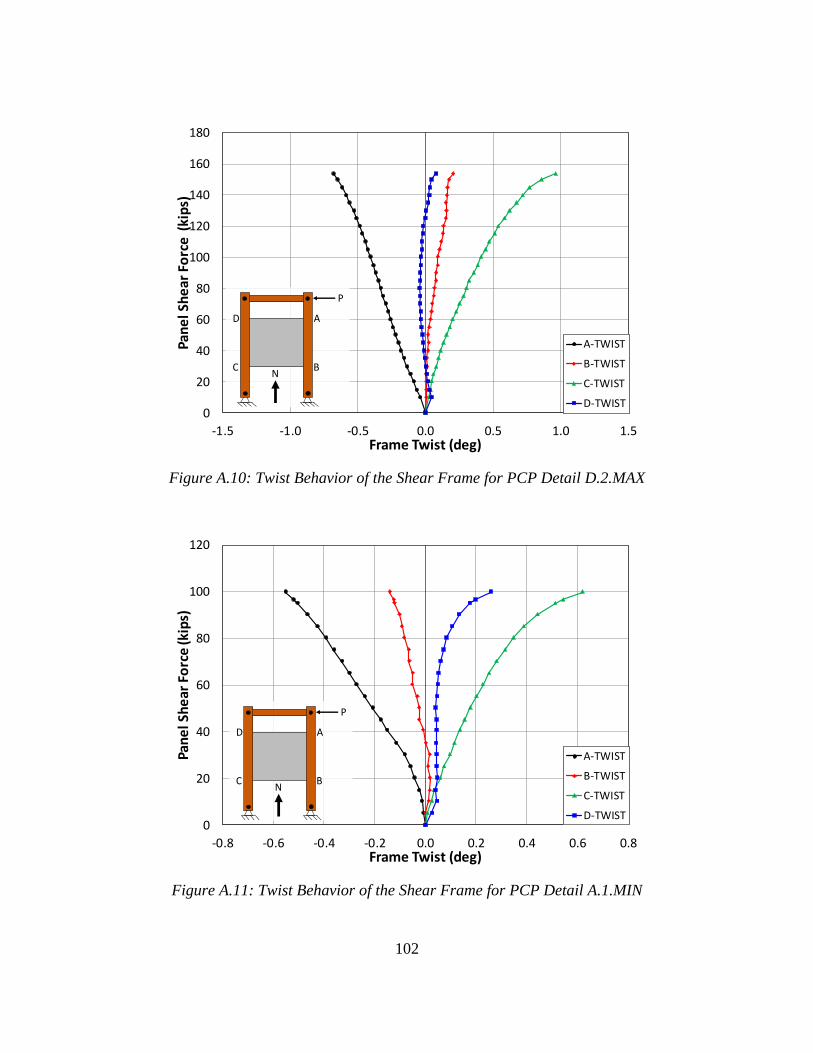
102
Figure A.10: Twist Behavior of the Shear Frame for PCP Detail D.2.MAX
Figure A.11: Twist Behavior of the Shear Frame for PCP Detail A.1.MIN
0
20
40
60
80
100
120
140
160
180
-1.5 -1.0 -0.5 0.0 0.5 1.0 1.5
Pan
el S
he
ar F
orc
e (
kip
s)
Frame Twist (deg)
A-TWIST
B-TWIST
C-TWIST
D-TWIST
P
A
B
D
CN
0
20
40
60
80
100
120
-0.8 -0.6 -0.4 -0.2 0.0 0.2 0.4 0.6 0.8
Pan
el S
he
ar F
orc
e (k
ips)
Frame Twist (deg)
A-TWIST
B-TWIST
C-TWIST
D-TWIST
P
A
B
D
CN
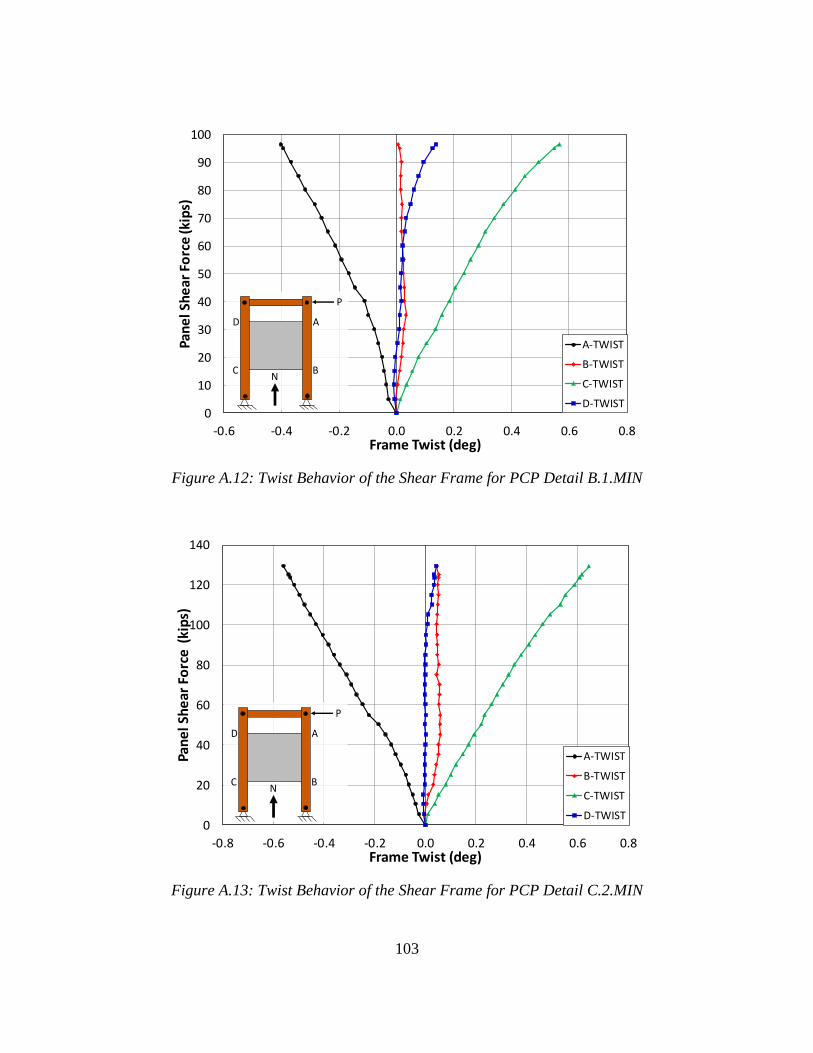
103
Figure A.12: Twist Behavior of the Shear Frame for PCP Detail B.1.MIN
Figure A.13: Twist Behavior of the Shear Frame for PCP Detail C.2.MIN
0
10
20
30
40
50
60
70
80
90
100
-0.6 -0.4 -0.2 0.0 0.2 0.4 0.6 0.8
Pan
el S
he
ar F
orc
e (k
ips)
Frame Twist (deg)
B.1.MIN - FRAME TWIST
A-TWIST
B-TWIST
C-TWIST
D-TWIST
P
A
B
D
CN
0
20
40
60
80
100
120
140
-0.8 -0.6 -0.4 -0.2 0.0 0.2 0.4 0.6 0.8
Pan
el S
he
ar F
orc
e (
kip
s)
Frame Twist (deg)
A-TWIST
B-TWIST
C-TWIST
D-TWIST
P
A
B
D
CN
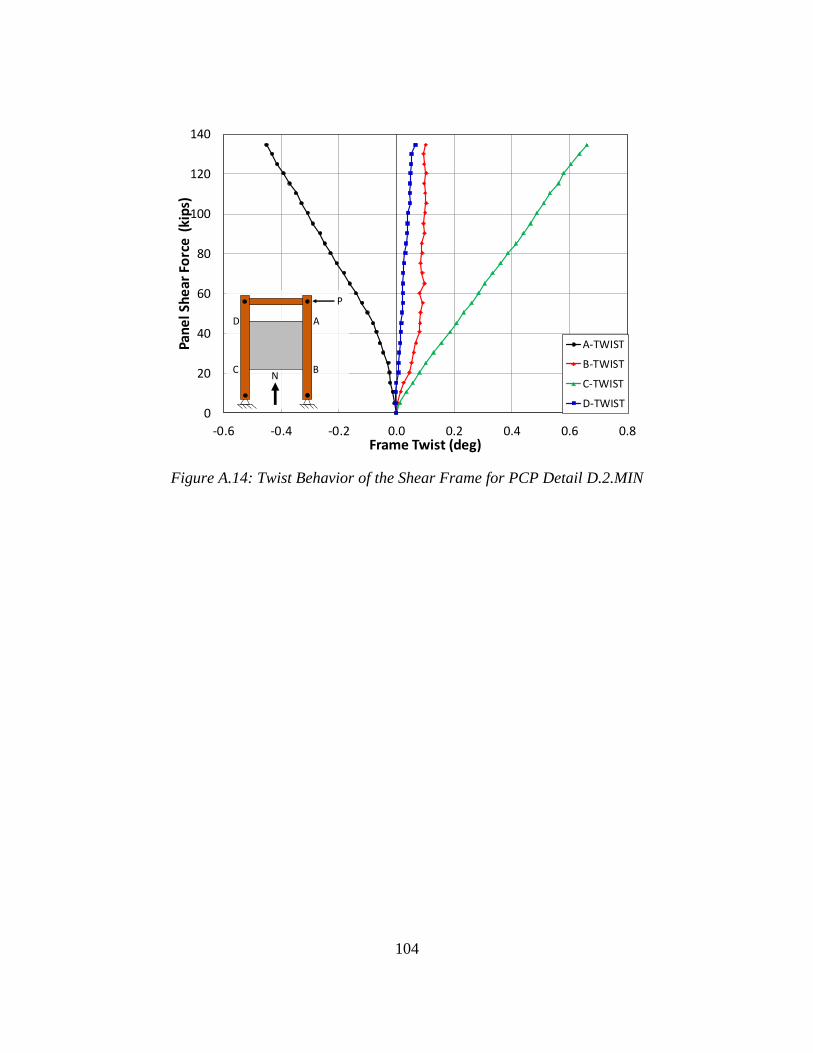
104
Figure A.14: Twist Behavior of the Shear Frame for PCP Detail D.2.MIN
0
20
40
60
80
100
120
140
-0.6 -0.4 -0.2 0.0 0.2 0.4 0.6 0.8
Pan
el S
he
ar F
orc
e (
kip
s)
Frame Twist (deg)
A-TWIST
B-TWIST
C-TWIST
D-TWIST
P
A
B
D
CN
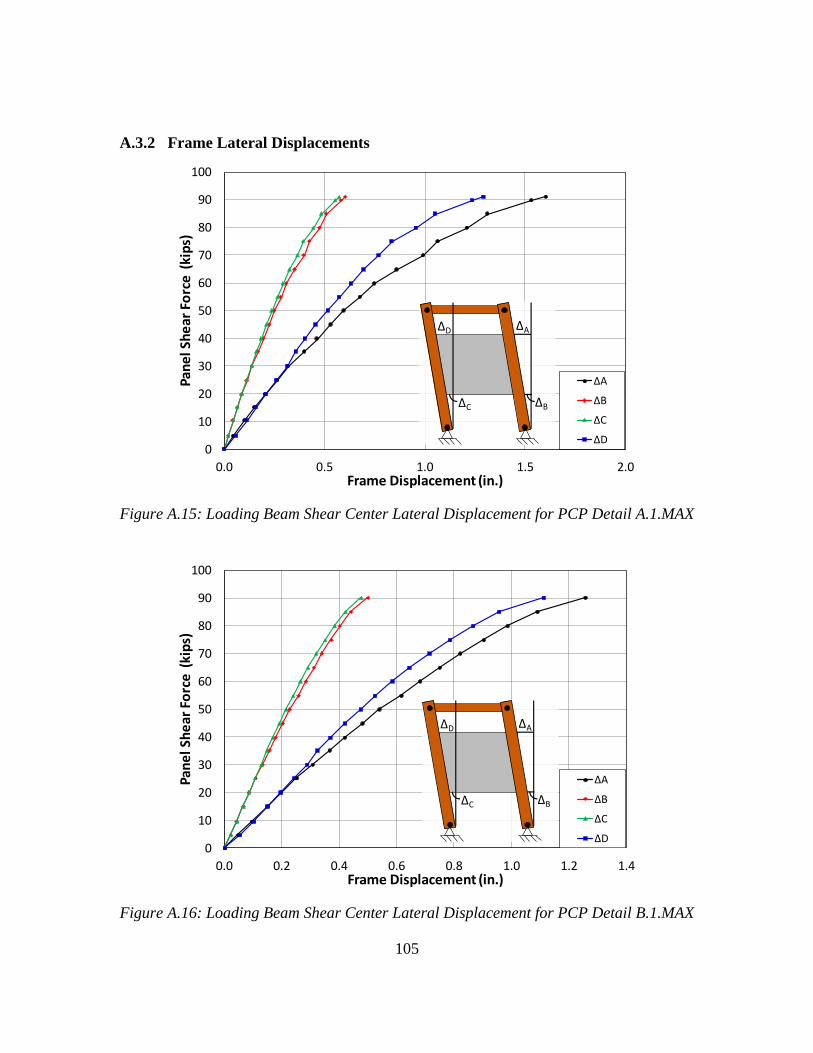
105
A.3.2 Frame Lateral Displacements
Figure A.15: Loading Beam Shear Center Lateral Displacement for PCP Detail A.1.MAX
Figure A.16: Loading Beam Shear Center Lateral Displacement for PCP Detail B.1.MAX
0
10
20
30
40
50
60
70
80
90
100
0.0 0.5 1.0 1.5 2.0
Pan
el S
he
ar F
orc
e (
kip
s)
Frame Displacement (in.)
ΔA
ΔB
ΔC
ΔD
ΔB
ΔA
ΔC
ΔD
0
10
20
30
40
50
60
70
80
90
100
0.0 0.2 0.4 0.6 0.8 1.0 1.2 1.4
Pan
el S
he
ar F
orc
e (
kip
s)
Frame Displacement (in.)
ΔA
ΔB
ΔC
ΔD
ΔB
ΔA
ΔC
ΔD
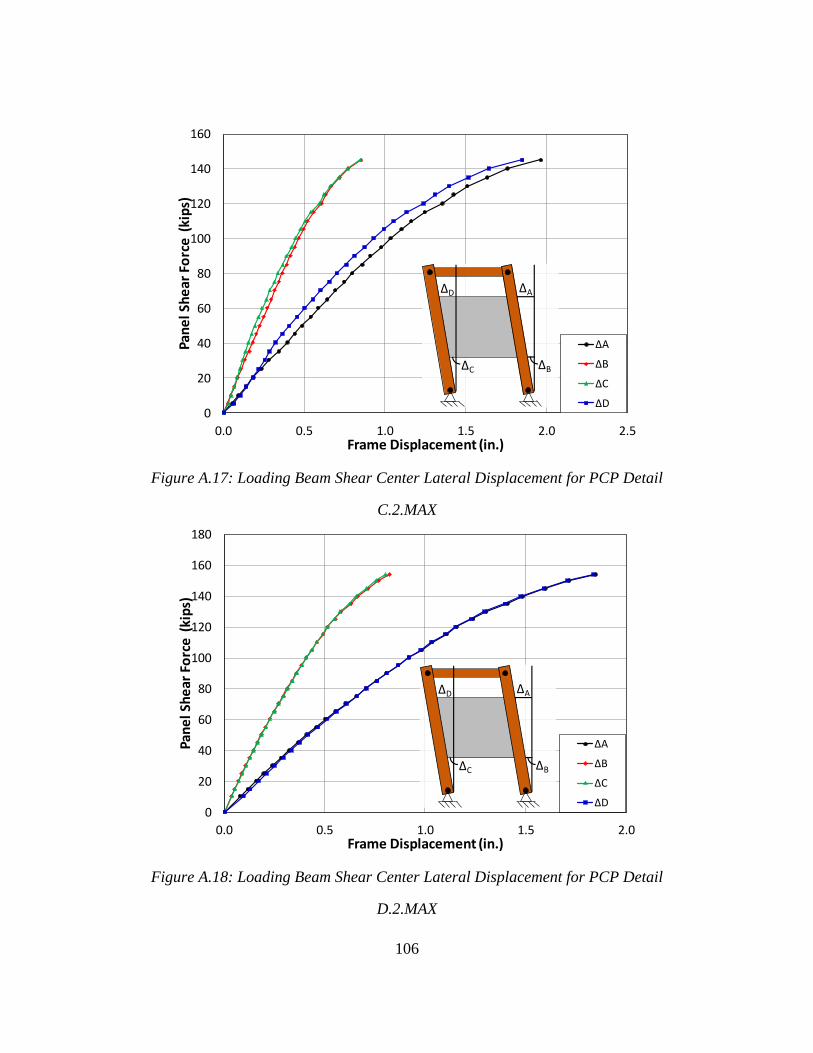
106
Figure A.17: Loading Beam Shear Center Lateral Displacement for PCP Detail
C.2.MAX
Figure A.18: Loading Beam Shear Center Lateral Displacement for PCP Detail
D.2.MAX
0
20
40
60
80
100
120
140
160
0.0 0.5 1.0 1.5 2.0 2.5
Pan
el S
he
ar F
orc
e (
kip
s)
Frame Displacement (in.)
ΔA
ΔB
ΔC
ΔD
ΔB
ΔA
ΔC
ΔD
0
20
40
60
80
100
120
140
160
180
0.0 0.5 1.0 1.5 2.0
Pan
el S
he
ar F
orc
e (
kip
s)
Frame Displacement (in.)
ΔA
ΔB
ΔC
ΔD
ΔB
ΔA
ΔC
ΔD
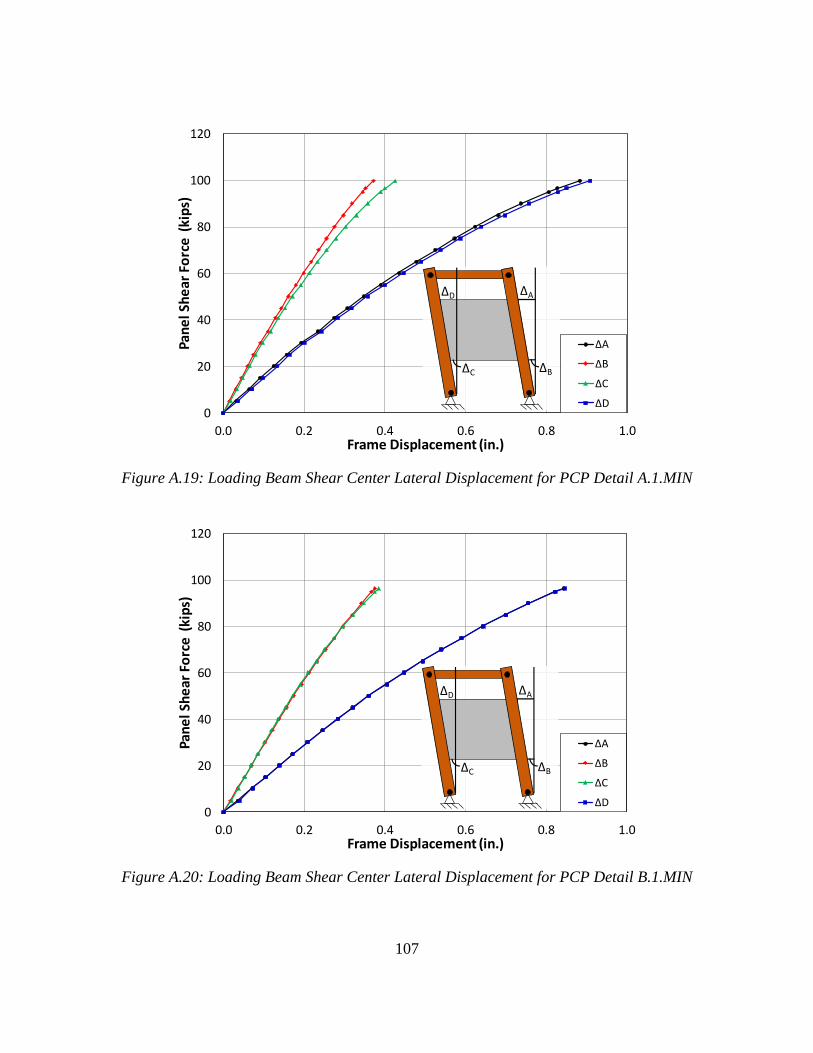
107
Figure A.19: Loading Beam Shear Center Lateral Displacement for PCP Detail A.1.MIN
Figure A.20: Loading Beam Shear Center Lateral Displacement for PCP Detail B.1.MIN
0
20
40
60
80
100
120
0.0 0.2 0.4 0.6 0.8 1.0
Pan
el S
he
ar F
orc
e (
kip
s)
Frame Displacement (in.)
ΔA
ΔB
ΔC
ΔD
ΔB
ΔA
ΔC
ΔD
0
20
40
60
80
100
120
0.0 0.2 0.4 0.6 0.8 1.0
Pan
el S
he
ar F
orc
e (
kip
s)
Frame Displacement (in.)
ΔA
ΔB
ΔC
ΔD
ΔB
ΔA
ΔC
ΔD
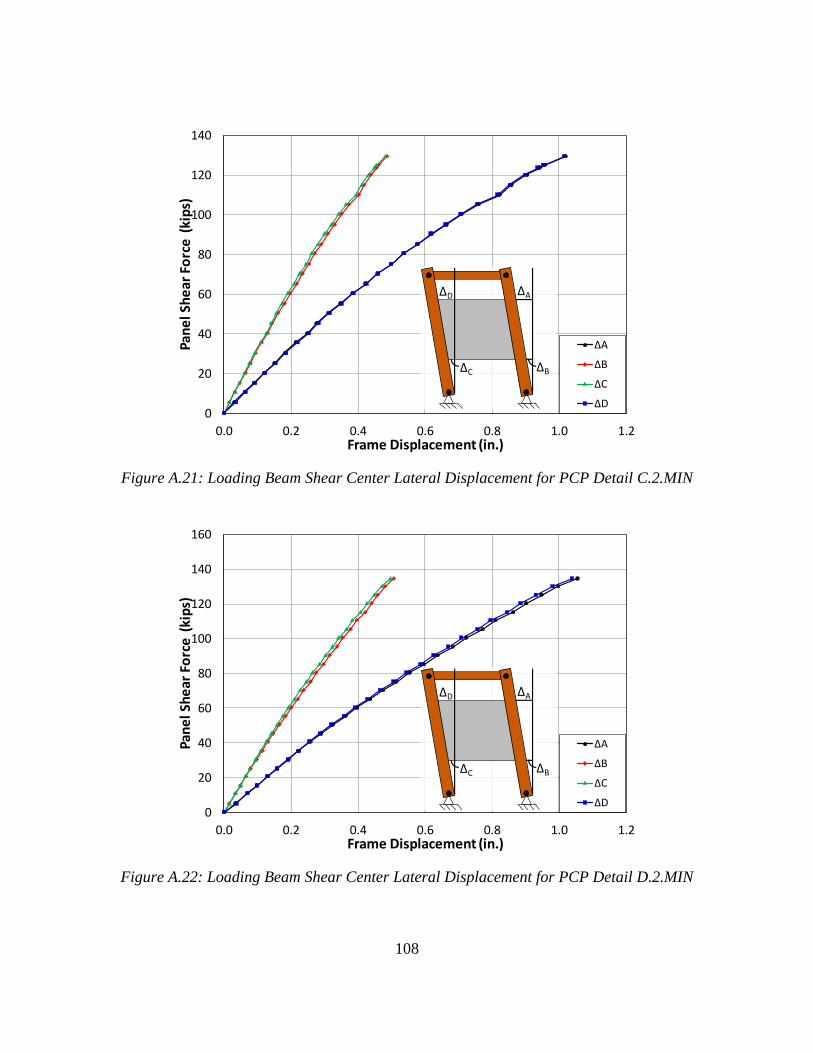
108
Figure A.21: Loading Beam Shear Center Lateral Displacement for PCP Detail C.2.MIN
Figure A.22: Loading Beam Shear Center Lateral Displacement for PCP Detail D.2.MIN
0
20
40
60
80
100
120
140
0.0 0.2 0.4 0.6 0.8 1.0 1.2
Pan
el S
he
ar F
orc
e (
kip
s)
Frame Displacement (in.)
ΔA
ΔB
ΔC
ΔD
ΔB
ΔA
ΔC
ΔD
0
20
40
60
80
100
120
140
160
0.0 0.2 0.4 0.6 0.8 1.0 1.2
Pan
el S
he
ar F
orc
e (
kip
s)
Frame Displacement (in.)
ΔA
ΔB
ΔC
ΔD
ΔB
ΔA
ΔC
ΔD
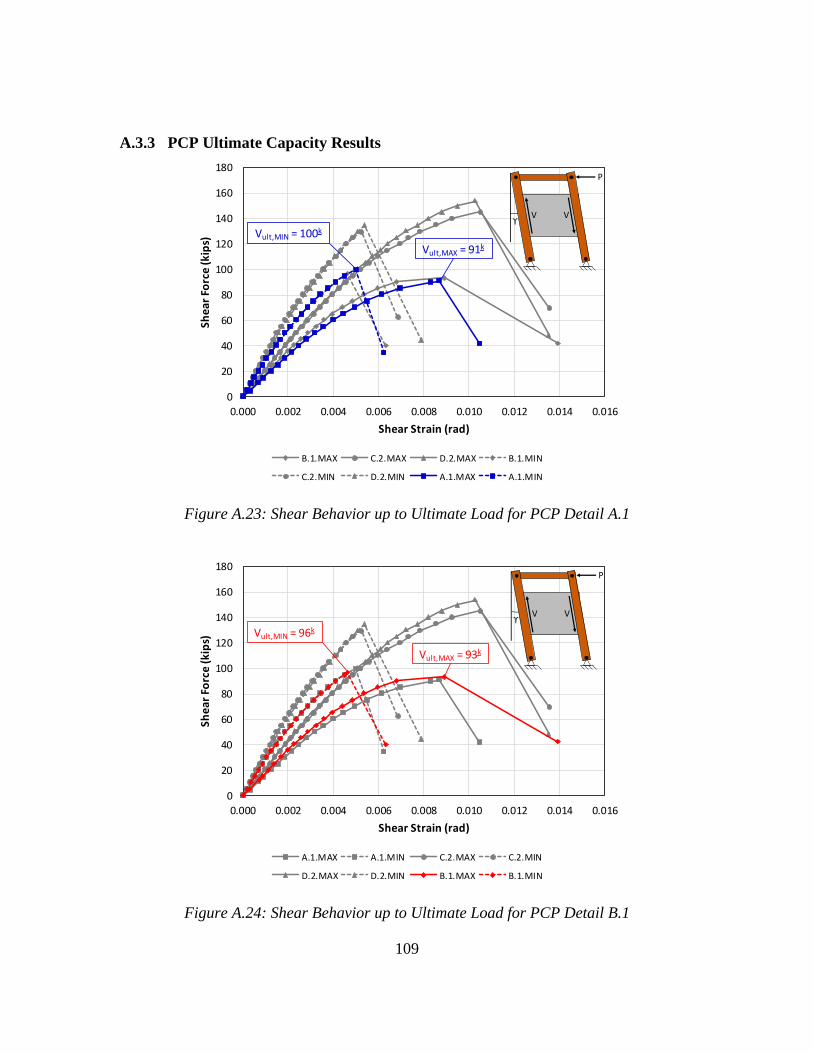
109
A.3.3 PCP Ultimate Capacity Results
Figure A.23: Shear Behavior up to Ultimate Load for PCP Detail A.1
Figure A.24: Shear Behavior up to Ultimate Load for PCP Detail B.1
0
20
40
60
80
100
120
140
160
180
0.000 0.002 0.004 0.006 0.008 0.010 0.012 0.014 0.016
Shea
r Fo
rce
(kip
s)
Shear Strain (rad)
B.1.MAX C.2.MAX D.2.MAX B.1.MIN
C.2.MIN D.2.MIN A.1.MAX A.1.MIN
Vult,MIN = 100k
Vult,MAX = 91k
ϒV V
P
0
20
40
60
80
100
120
140
160
180
0.000 0.002 0.004 0.006 0.008 0.010 0.012 0.014 0.016
Sh
ear
Fo
rce
(k
ips)
Shear Strain (rad)
A.1.MAX A.1.MIN C.2.MAX C.2.MIN
D.2.MAX D.2.MIN B.1.MAX B.1.MIN
Vult,MAX = 93k
Vult,MIN = 96kϒ
V V
P
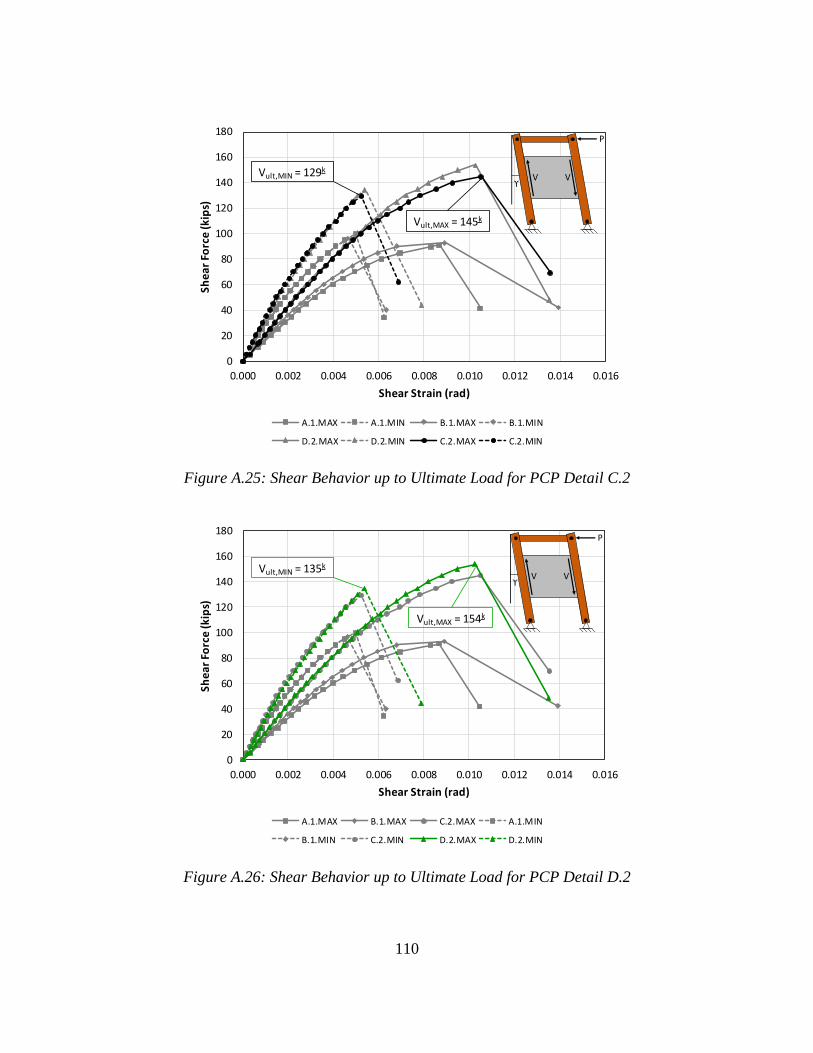
110
Figure A.25: Shear Behavior up to Ultimate Load for PCP Detail C.2
Figure A.26: Shear Behavior up to Ultimate Load for PCP Detail D.2
0
20
40
60
80
100
120
140
160
180
0.000 0.002 0.004 0.006 0.008 0.010 0.012 0.014 0.016
Sh
ear
Fo
rce
(k
ips)
Shear Strain (rad)
A.1.MAX A.1.MIN B.1.MAX B.1.MIN
D.2.MAX D.2.MIN C.2.MAX C.2.MIN
Vult,MIN = 129k
Vult,MAX = 145k
ϒV V
P
0
20
40
60
80
100
120
140
160
180
0.000 0.002 0.004 0.006 0.008 0.010 0.012 0.014 0.016
Sh
ear
Fo
rce
(kip
s)
Shear Strain (rad)
A.1.MAX B.1.MAX C.2.MAX A.1.MIN
B.1.MIN C.2.MIN D.2.MAX D.2.MIN
Vult,MAX = 154k
Vult,MIN = 135k
ϒV V
P
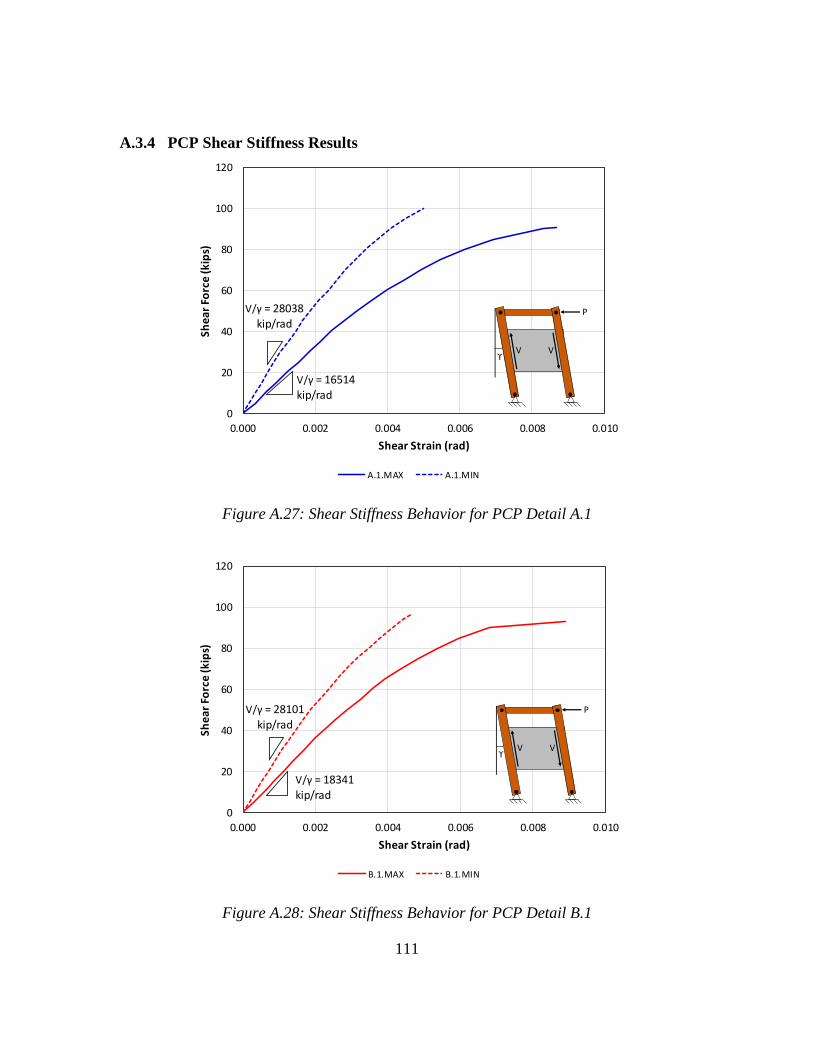
111
A.3.4 PCP Shear Stiffness Results
Figure A.27: Shear Stiffness Behavior for PCP Detail A.1
Figure A.28: Shear Stiffness Behavior for PCP Detail B.1
0
20
40
60
80
100
120
0.000 0.002 0.004 0.006 0.008 0.010
Sh
ear
Fo
rce
(kip
s)
Shear Strain (rad)
A.1.MAX A.1.MIN
V/γ = 28038 kip/rad
V/γ = 16514 kip/rad
ϒV V
P
0
20
40
60
80
100
120
0.000 0.002 0.004 0.006 0.008 0.010
Sh
ear
Fo
rce
(kip
s)
Shear Strain (rad)
B.1.MAX B.1.MIN
V/γ = 28101
kip/rad
V/γ = 18341
kip/rad
ϒV V
P
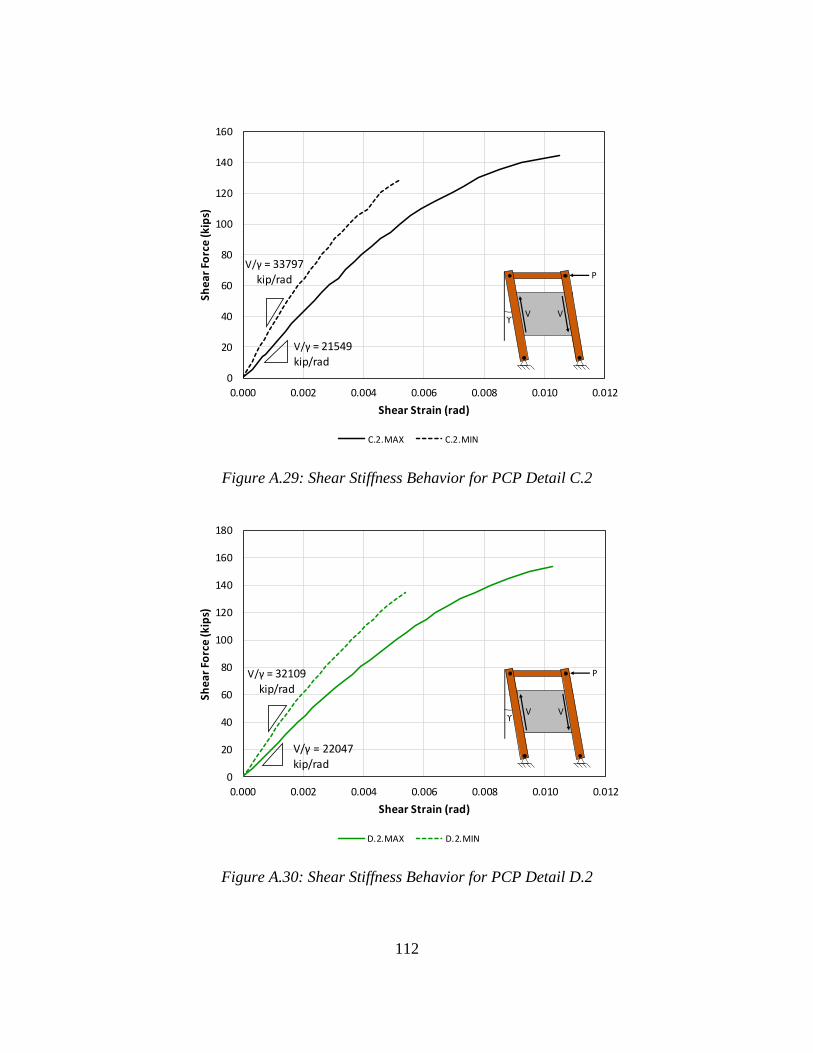
112
Figure A.29: Shear Stiffness Behavior for PCP Detail C.2
Figure A.30: Shear Stiffness Behavior for PCP Detail D.2
0
20
40
60
80
100
120
140
160
0.000 0.002 0.004 0.006 0.008 0.010 0.012
Sh
ear
Fo
rce
(kip
s)
Shear Strain (rad)
C.2.MAX C.2.MIN
V/γ = 33797
kip/rad
V/γ = 21549 kip/rad
ϒV V
P
0
20
40
60
80
100
120
140
160
180
0.000 0.002 0.004 0.006 0.008 0.010 0.012
Sh
ear
Fo
rce
(kip
s)
Shear Strain (rad)
D.2.MAX D.2.MIN
V/γ = 32109 kip/rad
V/γ = 22047
kip/rad
ϒV V
P
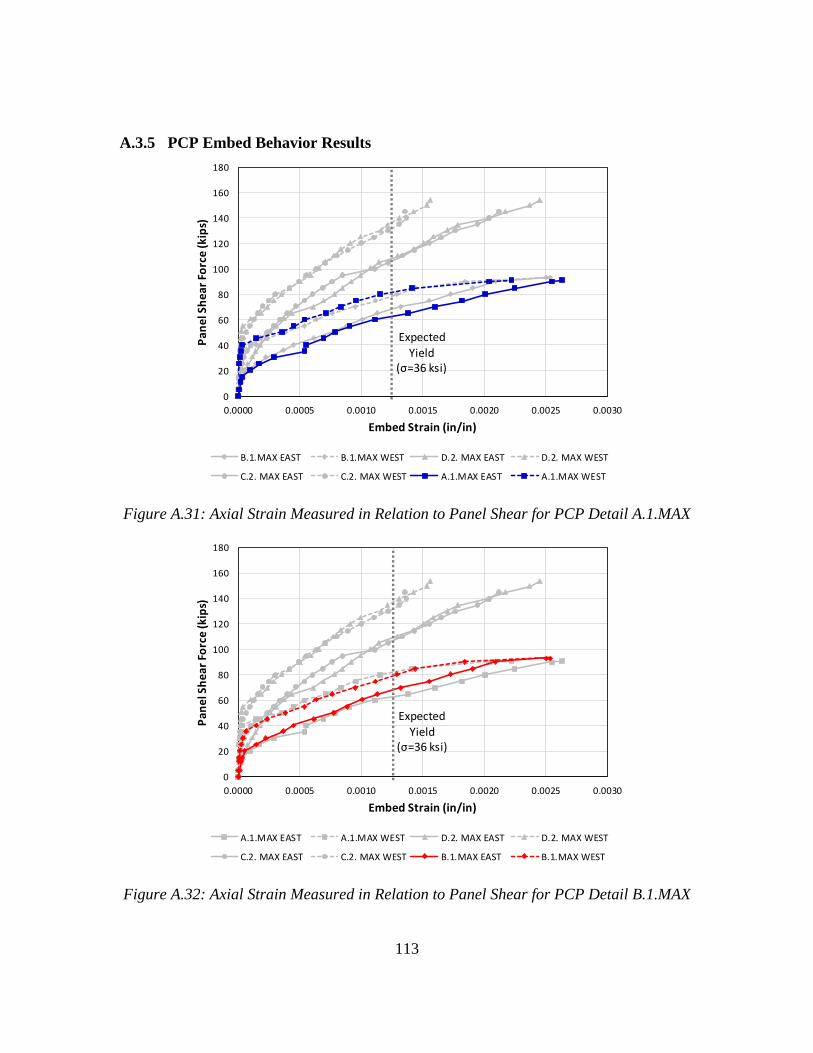
113
A.3.5 PCP Embed Behavior Results
Figure A.31: Axial Strain Measured in Relation to Panel Shear for PCP Detail A.1.MAX
Figure A.32: Axial Strain Measured in Relation to Panel Shear for PCP Detail B.1.MAX
0
20
40
60
80
100
120
140
160
180
0.0000 0.0005 0.0010 0.0015 0.0020 0.0025 0.0030
Pa
ne
l Sh
ear
Fo
rce
(kip
s)
Embed Strain (in/in)
B.1.MAX EAST B.1.MAX WEST D.2. MAX EAST D.2. MAX WEST
C.2. MAX EAST C.2. MAX WEST A.1.MAX EAST A.1.MAX WEST
Expected Yield
(σ=36 ksi)
0
20
40
60
80
100
120
140
160
180
0.0000 0.0005 0.0010 0.0015 0.0020 0.0025 0.0030
Pa
ne
l Sh
ear
Fo
rce
(kip
s)
Embed Strain (in/in)
A.1.MAX EAST A.1.MAX WEST D.2. MAX EAST D.2. MAX WEST
C.2. MAX EAST C.2. MAX WEST B.1.MAX EAST B.1.MAX WEST
Expected Yield
(σ=36 ksi)
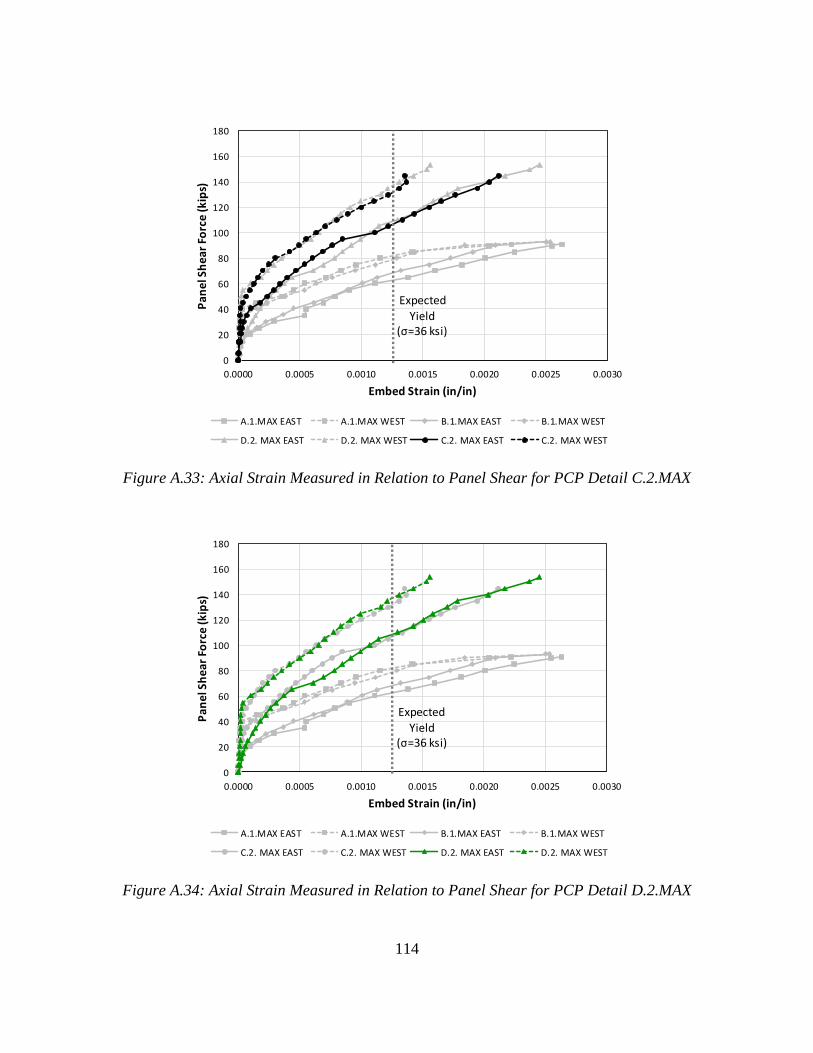
114
Figure A.33: Axial Strain Measured in Relation to Panel Shear for PCP Detail C.2.MAX
Figure A.34: Axial Strain Measured in Relation to Panel Shear for PCP Detail D.2.MAX
0
20
40
60
80
100
120
140
160
180
0.0000 0.0005 0.0010 0.0015 0.0020 0.0025 0.0030
Pa
ne
l Sh
ear
Fo
rce
(kip
s)
Embed Strain (in/in)
A.1.MAX EAST A.1.MAX WEST B.1.MAX EAST B.1.MAX WEST
D.2. MAX EAST D.2. MAX WEST C.2. MAX EAST C.2. MAX WEST
Expected
Yield(σ=36 ksi)
0
20
40
60
80
100
120
140
160
180
0.0000 0.0005 0.0010 0.0015 0.0020 0.0025 0.0030
Pa
ne
l Sh
ear
Fo
rce
(kip
s)
Embed Strain (in/in)
A.1.MAX EAST A.1.MAX WEST B.1.MAX EAST B.1.MAX WEST
C.2. MAX EAST C.2. MAX WEST D.2. MAX EAST D.2. MAX WEST
Expected
Yield(σ=36 ksi)
115
Figure A.35: Axial Strain Measured in Relation to Panel Shear for PCP Detail A.1.MIN
Figure A.36: Axial Strain Measured in Relation to Panel Shear for PCP Detail B.1.MIN
0
20
40
60
80
100
120
140
160
-0.0002 0.0000 0.0002 0.0004 0.0006 0.0008 0.0010 0.0012 0.0014
Pa
ne
l Sh
ear
Fo
rce
(k
ips)
Embed Strain (in/in)
B.1. MIN EAST B.1. MIN WEST C.2. MIN EAST C.2. MIN WEST
D.2. MIN EAST D.2. MIN WEST A.1.MIN EAST A.1.MIN WEST
Expected Yield
(σ=36 ksi)
0
20
40
60
80
100
120
140
160
-0.0002 0.0000 0.0002 0.0004 0.0006 0.0008 0.0010 0.0012 0.0014
Pa
ne
l Sh
ear
Fo
rce
(k
ips)
Embed Strain (in/in)
A.1.MIN EAST A.1.MIN WEST C.2. MIN EAST C.2. MIN WEST
D.2. MIN EAST D.2. MIN WEST B.1. MIN EAST B.1. MIN WEST
Expected Yield
(σ=36 ksi)
116
Figure A.37: Axial Strain Measured in Relation to Panel Shear for PCP Detail C.2.MIN
Figure A.38: Axial Strain Measured in Relation to Panel Shear for PCP Detail D.2.MIN
0
20
40
60
80
100
120
140
160
-0.0002 0.0000 0.0002 0.0004 0.0006 0.0008 0.0010 0.0012 0.0014
Pan
el S
hea
r Fo
rce
(kip
s)
Embed Strain (in/in)
A.1.MIN EAST A.1.MIN WEST B.1. MIN EAST B.1. MIN WEST
D.2. MIN EAST D.2. MIN WEST C.2. MIN EAST C.2. MIN WEST
Expected
Yield(σ=36 ksi)
0
20
40
60
80
100
120
140
160
-0.0002 0.0000 0.0002 0.0004 0.0006 0.0008 0.0010 0.0012 0.0014
Pan
el S
hea
r Fo
rce
(kip
s)
Embed Strain (in/in)
A.1.MIN EAST A.1.MIN WEST B.1. MIN EAST B.1. MIN WEST
C.2. MIN EAST C.2. MIN WEST D.2. MIN EAST D.2. MIN WEST
Expected Yield
(σ=36 ksi)
117
Figure A.39: Axial Strain Comparison for PCP Details A.1.MAX and A.1.MIN
Figure A.40: Axial Strain Comparison for PCP Details B.1.MAX and B.1.MIN
0
20
40
60
80
100
120
0.0000 0.0005 0.0010 0.0015 0.0020 0.0025 0.0030
Shea
r Fo
rce
(kip
s)
Embed Strain (in/in)
A.1.MAX EAST A.1.MAX WEST A.1.MIN EAST A.1.MIN WEST
Expected
Yield(σ=36 ksi)
0
20
40
60
80
100
120
0.0000 0.0005 0.0010 0.0015 0.0020 0.0025 0.0030
Sh
ear
Fo
rce
(kip
s)
Embed Strain (in/in)
B.1.MAX EAST B.1.MAX WEST B.1. MIN EAST B.1. MIN WEST
Expected Yield
(σ=36 ksi)
118
Figure A.41: Axial Strain Comparison for PCP Details C.2.MAX and C.2.MIN
Figure A.42: Axial Strain Comparison for PCP Details D.2.MAX and D.2.MIN
0
20
40
60
80
100
120
140
160
0.0000 0.0005 0.0010 0.0015 0.0020 0.0025
Sh
ear
Fo
rce
(kip
s)
Embed Strain (in/in)
C.2. MAX EAST C.2. MAX WEST C.2. MIN EAST C.2. MIN WEST
Expected
Yield(σ=36 ksi)
0
20
40
60
80
100
120
140
160
180
0.0000 0.0005 0.0010 0.0015 0.0020 0.0025 0.0030
Sh
ear
Fo
rce
(kip
s)
Embed Strain (in/in)
D.2. MAX EAST D.2. MAX WEST D.2. MIN EAST D.2. MIN WEST
Expected Yield
(σ=36 ksi)
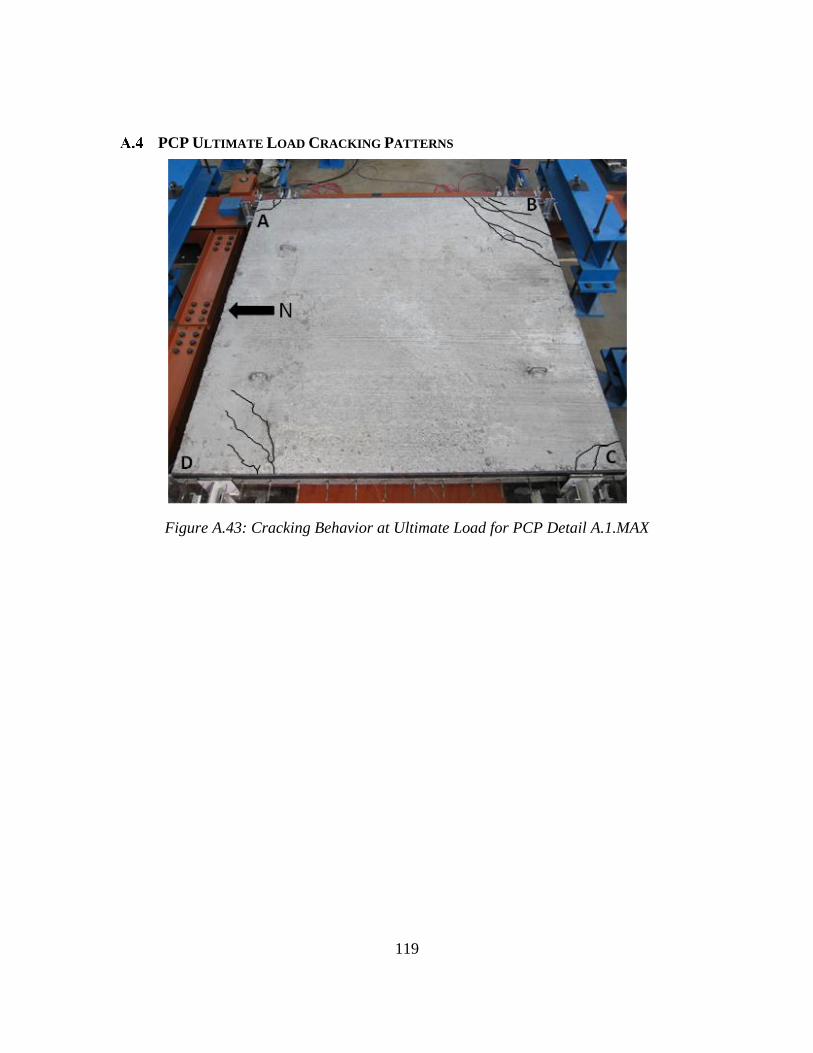
119
PCP ULTIMATE LOAD CRACKING PATTERNS
Figure A.43: Cracking Behavior at Ultimate Load for PCP Detail A.1.MAX
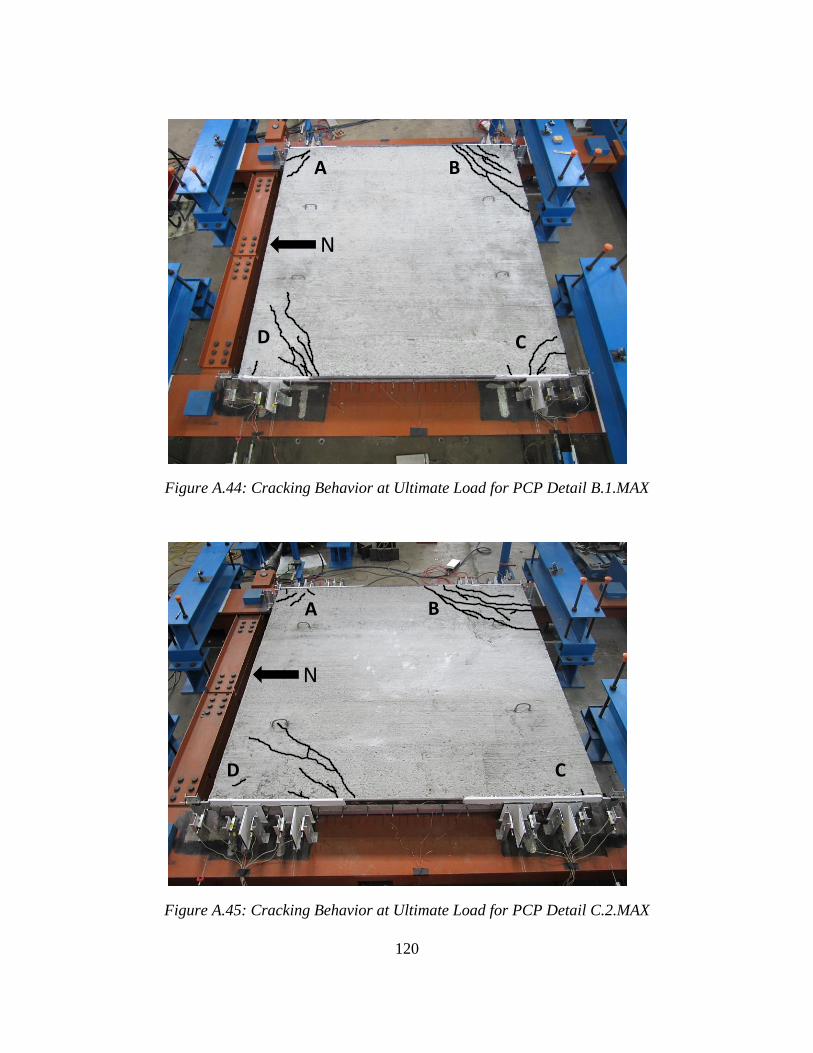
120
Figure A.44: Cracking Behavior at Ultimate Load for PCP Detail B.1.MAX
Figure A.45: Cracking Behavior at Ultimate Load for PCP Detail C.2.MAX
N
A B
CD
N
A B
CD
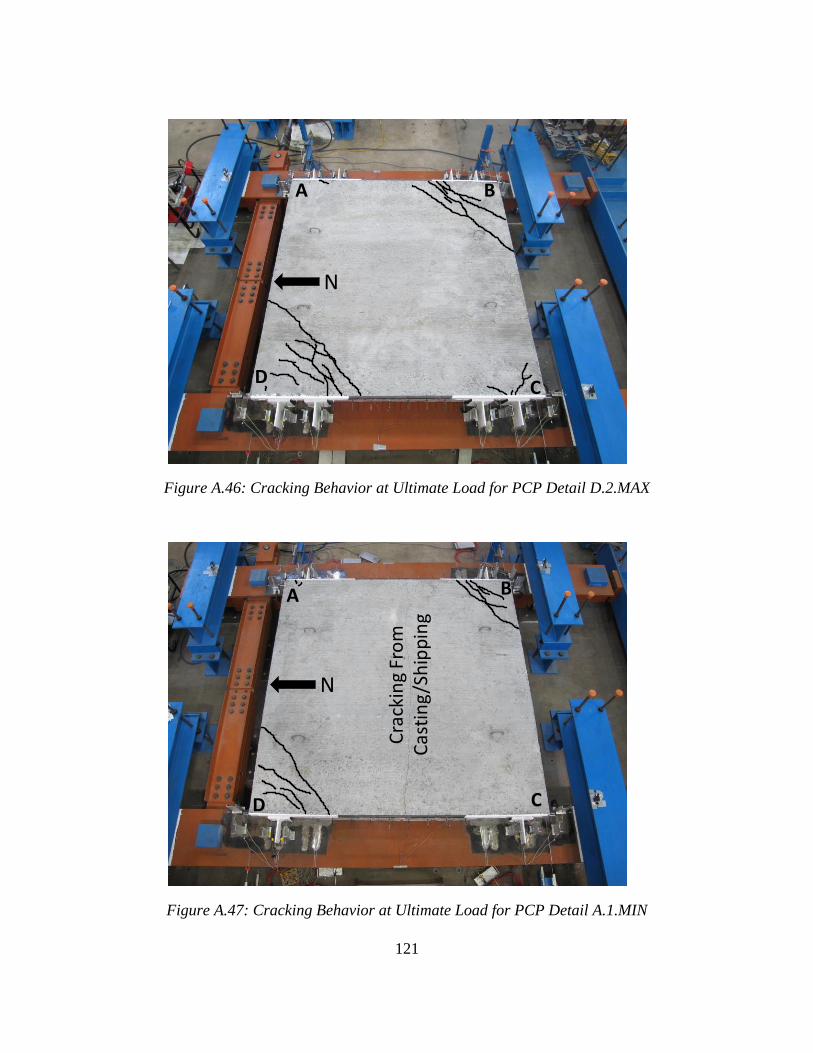
121
Figure A.46: Cracking Behavior at Ultimate Load for PCP Detail D.2.MAX
Figure A.47: Cracking Behavior at Ultimate Load for PCP Detail A.1.MIN
N
A B
CD
Cra
ckin
g Fr
om
C
asti
ng
/Sh
ipp
ing
N
A B
CD
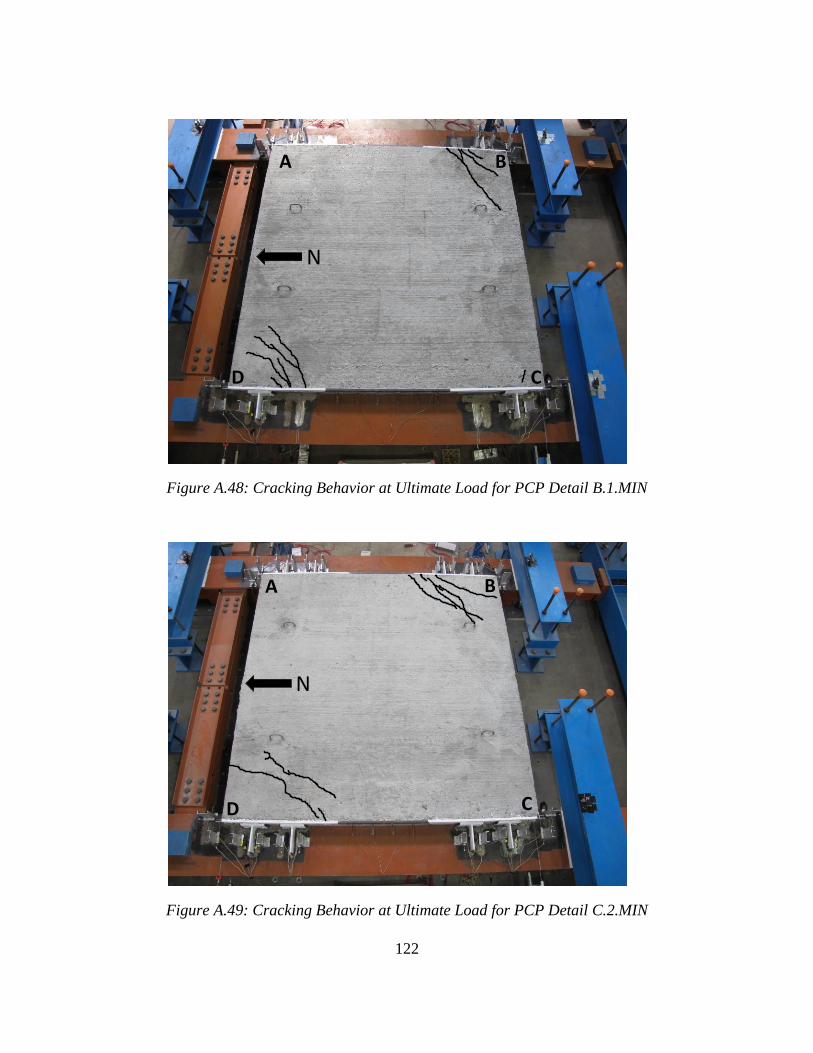
122
Figure A.48: Cracking Behavior at Ultimate Load for PCP Detail B.1.MIN
Figure A.49: Cracking Behavior at Ultimate Load for PCP Detail C.2.MIN
N
A B
CD
N
A B
CD
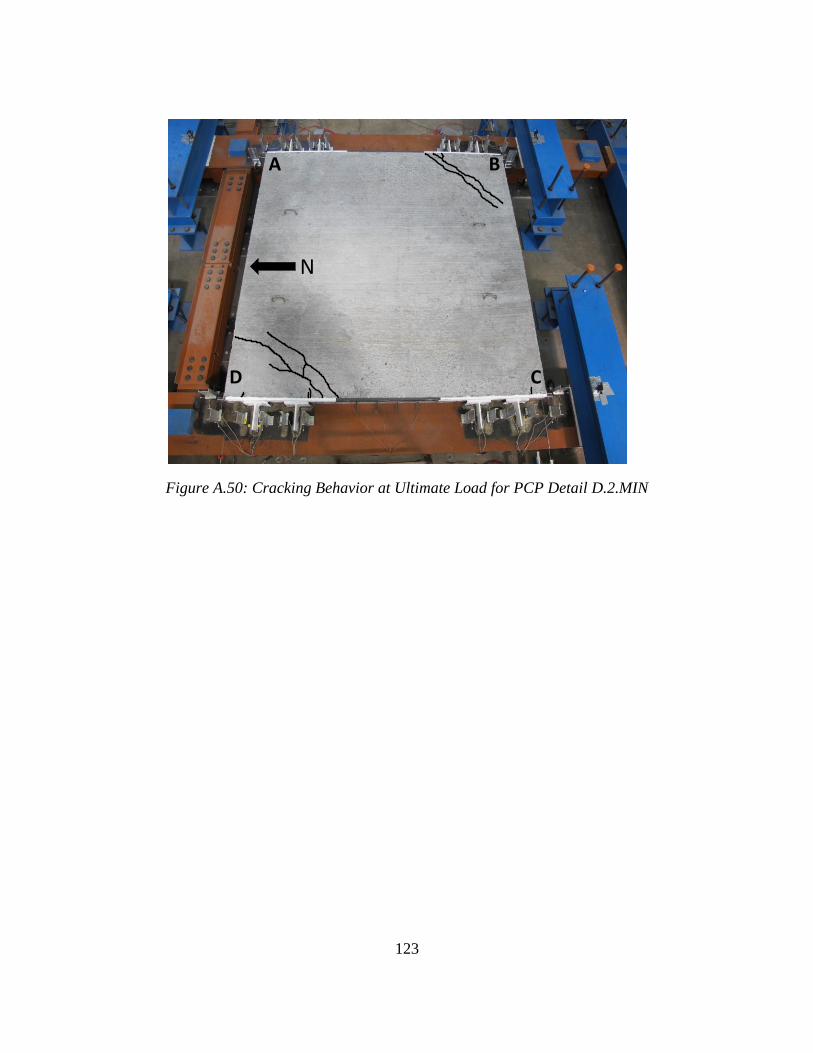
123
Figure A.50: Cracking Behavior at Ultimate Load for PCP Detail D.2.MIN
N
A B
CD
124
References
AASHTO, A. A. (2014). Load and Resistance Factor Design (LRFD) Bridge Design
Specifications, Seventh Edition. Washington, D.C.
AISC. (2011). Steel Construction Manual, 14th Edition.
Currah, R. M. (1993, August). Shear Strength and Shear Stiffness of Permanent Steel
Bridge Deck Forms. M.S. Thesis. The University of Texas at Austin.
Egilmez, O. O. (2005). Lateral Bracing of Steel Bridge Girders by Permanent Metal Deck
Forms. Ph.D. Dissertation. The University of Houston.
Errera, S., & Apparao, T. (1976). Design of I-shaped beams with diaphragm bracing. J.
Struct. Div., 102(4), 769-781.
Galambos, T. V. (1998). Guide to stability design criteria for metal structures. New
York: Wiley.
Haskins, M. (2015, January). What Is a Girder Bridge? Retrieved from Civil
Engineering: https://erkrishneelram.wordpress.com/tag/girder-bridges/
Helwig, T. A. (1994). Lateral bracing of Bridge Girders by Metal Deck Forms. Ph.D.
Dissertation. The University of Texas at Austin.
Helwig, T. A., & Frank, K. H. (1999). Stiffness Requirements for diaphragm bracing of
beams. J. of Struct. Engr., ASCE, Vol. 125, No. 11, 1249-1256.
Helwig, T. A., & Yura, J. A. (1995). Bracing for Stability.
Helwig, T. A., & Yura, J. A. (2008a). Shear Diaphragm Bracing of Beams I: Stiffness
and Strength. Journal of Structural Engineering, 134(3), 348-356.
Helwig, T. A., & Yura, J. A. (2008b). Shear diaphragm bracing of beams. II: Design
Requirements. Journal of Structural Engineering, 134(3), 357-363.
Helwig, T. A., Frank, K. H., & Yura, J. A. (1997). Lateral-Torsional Buckling of Singly-
Symmetric I-Beams. ASCE Journal of Structural Engineering, Vol. 123, No. 9,
pp. 1172-1179.
Jetann, C. A. (2003). Stiffness and Strength of Metal Bridge Deck Forms with Stiffened
Connection Details. M.S. Thesis. University of Houston.
Lawson, R., & Nethercot, P. (1985). Lateral Stability of I-beams Restrained by Profiled
Sheeting. The Struct. Engr., London, 63B(1), 3-13.
McCammon, V. E. (2015, December). In-Plane Shear Strength and Stiffness of Precast
Concrete Panels. M.S. Thesis. The University of Texas at Austin.
125
Nethercot, D., & Trahair, N. (1975). Design of diaphragm-braced I-beams. J. Struct. Div.,
101(10), 2045-2061.
Roskos et al. (2017). Partial Depth Precast Concrete Deck Panels on Curved Bridges.
Proceedings of the Annual Stability Conference. San Antonio: Structural Stability
Research Council.
Timoshenko, S. P., & Gere, J. M. (1961). Theory of Elastic Stability, Second Edition.
New York: McGraw-Hill Book Company, Inc.
TxDOT. (2006). Prestressed Concrete Panel Deck Details. Retrieved from Bridge
Division Standard: http://austinprestress.com/pdf/pcpstde2.pdf
TxDOT. (2010). Prestressed Concrete Panel Fabrication Details. Retrieved from Bridge
Division Standard: http://austinprestress.com/pdf/pcpstde1.pdf
Winter, G. (1960). Lateral Bracing of Columns and Beams. ASCE Transactions, Vol.
125, 809-825.
Yura, J. A. (2001). Fundamentals of Beam Bracing. Engineering Journal, AISC, 1st
Quarter, 11-26.
Yura, J. A., & Helwig, T. A. (2014). Stability Bracing of Columns and Frames. North
American Steel Construction Conference. Toronto: Structural Stability Research
Council.
126
Vita
John Kintz was born in Geneva, Illinois and raised in Sugar Grove, Illinois. He
attended the University of Iowa for his undergraduate education, receiving his Bachelor of
Science in Engineering degree in civil engineering in May of 2015. During his time as an
undergraduate, John worked as a teaching assistant and was heavily involved in Iowa’s
ASCE student chapter, particularly as a two-time captain of the steel bridge team. These
experiences, in addition to several civil engineering internships, cultivated his interest for
further education in structural engineering. In August 2015, he enrolled in the graduate
school at The University of Texas at Austin Cockrell School of Engineering to pursue a
master’s degree.
Permanent email: [email protected]
This thesis was typed by the author.