Embed Size (px)
Citation preview

Copyright
by
Leqian Liu
2014
The Dissertation Committee for Leqian Liu Certifies that this is the
approved version of the following dissertation:
Engineering Yarrowia lipolytica for High Lipid Production
Committee:
__________________________________
Hal S. Alper, Supervisor
__________________________________
Dean Appling
__________________________________
Lydia Contreras
__________________________________
Vishwanath Iyer
__________________________________
Marvin Whiteley
Engineering Yarrowia lipolytica for High Lipid Production
by
Leqian Liu, B.S.;B.S.
Dissertation
Presented to the Faculty of the Graduate School of
The University of Texas at Austin
in Partial Fulfillment
of the Requirements
for the Degree of
Doctor of Philosophy
The University of Texas at Austin
December 2014

Dedication
To Wenzong Li
You are always there.

v
Acknowledgement
I would like to first thank my advisor, Dr. Hal Alper. His support, guidance and
advice are the major reasons of the accomplishments and successes of the studies
described herein. His tolerance over my ignorance and his passion over my very limited
progresses kept me going forward with my research. His insights and suggestions guided
the projects towards the unexpected but fruitful directions. He also put his trust in me to
explore new research fields. I can’t thank him enough for all his helps and advices
through these five years.
I would also want to thank the members of my committee, who have all given
thoughtful advices and suggestions. The suggestions from Dr. Whiteley opened the
possibility of my omics based study in this work. The lessons from Dr. Iyer in human
genetics gave me a clear overview of the methods for genotyping and their applications.
The discussions with Dr. Contreras and Dr. Appling helped to guide my research
directions. Their availability for my committee meetings and discussions made my life
much easier.
Many other people I worked with while studying my PhD helped me on this
project with their expertise and efforts. I could not accomplish all these without their help.
I would like to first thank the people I worked with in Alper group: Dr. John Blazeck for
his guidance, training and collaboration on engineering Yarrowia lipolytica, we struggled
but we made it; Andrew Hill for his collaboration on lipid accumulation work and lots of
interesting conversations; Dr. Eric Young for all the late night talks, discussions and fun

vi
facts; Dr. Amanda Lanza for her helpful discussion for the promoter work; Dr. Nathan
Crook for discussing all the new techniques and scientific ideas with me; Dr. Kate Curran
for her gift of keeping all the equipment in the lab running for me; Dr. Sunmi Lee for her
discussion over xylose consumption; Joseph Cheng for his efforts of keeping refilling of
lab supplies; Dr. Jie Sun for her work as a lab manager to keep the lab running smoothly;
Kelly Markham and Rebecca Knight for their help with fatty acids analysis; Dacia Leon
for her help with RNA-seq experiments, John Leavitt, Heidi Redden, Joe Abatemarco,
Nick Morse and Haibo Li for all the fun conversions over scientific and nonscientific
topics. I also would like to specially thank Dhivya Arasappan for her patience to answer
all my questions about next generation sequencing analysis. I have also had the pleasure
of mentoring and instructing several undergraduate assistants. I want to deeply thank
Peter Otoupal, Annie Pan, Caitlin Spofford and Nijia Zhou for their hard work and
dedication towards completing many difficult experiments. I also want thank the faculty
members in biochemistry program, especially Dr. David Hoffman, for their help.
I have been fortunate to develop close friendships while doing my graduate study
in Austin, and I want to thank Brent Sherman, Man Liang, Matthew Hausknecht, Piyush
Khandelwal, Sirirat Kasemset, Zach Frye, Wupeng Yan, Rui Zhang, Qingxiang Fang,
Yubing Wang, Ying Lai, Yi Kou, Yuxuan Chen, Ning Jia for all of the good times we’ve
had. I also want to thank all the members of my incoming Ph.D. class: it is a pleasure to
study with your all.
Most importantly, I want to thank my family for their love and support. I want to
thank my parents, Hong Liu and Lin Wang for their patience and sacrifice to let me grow

vii
up and enjoy my life every day as well as for their cares and worries about my future: I
am so lucky to have you two and I can’t ask for better. I want to thank my daughter,
Savannah: you are a gift from heaven and your smiles just melt my heart, thank you for
choosing me. Finally, I want to thank my wife, Wenzong Li, I would not be able to
accomplish all these without you. It is your passion over scientific research inspired me
to pursue this degree. The most enjoyable part of my life is discussing science with you. I
love you.
viii
Engineering Yarrowia lipolytica for High Lipid Production
by
Leqian Liu, Ph.D.
The University of Texas at Austin, 2014
SUPERVISOR: Hal S. Alper
Among potential value-added fuels and chemicals, fatty acid-based chemicals are
important due to their wide use in industrial processes and in daily life. Fatty acids
produced from microbial systems could provide a sustainable supply to replace the
current costly and unsustainable process using plant oil or animal fat. The oleaginous
yeast Yarrowia lipolytica naturally possesses moderate lipid production capacity and
grows on different kinds of biomass and organic waste. However, fatty acid production
from native, un-engineered strains is not economically viable. Therefore, this work
develops strategies inspired from synthetic biology and metabolic engineering to expand
the engineering potential of Y. lipolytica — helping to establish this organism as a
premier platform for industrial-level, high lipid production as well as providing a
platform for uncovering novel understanding of lipogenesis.

ix
To do so, first, novel synthetic promoters and high expression plasmid were
necessary to achieve the ability to tune gene expression levels inside the cell. We
developed a hybrid promoter engineering strategy to create a promoter library exhibiting
a range of more than 400-fold in terms of mRNA levels as well as engineered plasmids
with regulated centromeric function to achieve a 2.7 fold expression range. Next, a
rational and evolutionary metabolic engineering approach was coupled with genomic and
transcriptomic studies to both engineer and understand underlying lipogenesis in this
organism. Through the engineering efforts, we successfully increased the lipid production
titer to over 40 g/L in bioreactor as well as identified novel lipogenic enhancers and
mechanisms. In addition, we identified and characterized a mutant mga2 protein with
superior lipogenesis enhancing capacity, which can regulate fatty acid desaturation and
carbon flux inside the cells. Collectively, these studies have facilitated the utilization of Y.
lipolytica as an industrially relevant microbial lipid production platform and supplied
novel understanding of its lipogenesis process. The methods and concepts developed here
can also be adapted to other oleaginous microbes and serve as a template for enabling
value-added chemical production in other nonconventional organism.
x
Table of Contents
List of Tables .................................................................................................................. xiv
List of Figures ...................................................................................................................xv
Chapter 1: Introduction and Background .......................................................................1
1.1 Value-add chemical production in yeast .....................................................................1
1.2 Metabolic engineering for microbial production ........................................................3
1.2.1 Promoter and plasmid for manipulating gene expression ...................................3
1.2.2 Rational and evolutionary metabolic engineering ...............................................5
1.2.3 Next generation sequencing analysis in metabolic engineering .........................7
1.3 Yarrowia lipolytica as microbial production host for lipid production ......................9
1.3.1 Lipid biosynthesis in Y. lipolytica .....................................................................10
1.3.2 Current challenges for high lipid production in Y. lipolytica ............................11
Chapter 2: Hybrid promoter engineering in Yarrowia lipolytica.................................13
2.1 Chapter summary ......................................................................................................13
2.2 Introduction...............................................................................................................14
2.3 Results .....................................................................................................................16
2.3.1 Characterization of endogenous promoters at the single-cell level ...................16
2.3.2 Creating and characterizing a hybrid promoter series using the UAS1B element
and minimal leucine core promoter ............................................................................21
2.3.3 Transcriptional analysis of the UAS1B-leum hybrid promoter series ..............23
2.3.4 Utility and stability of the UAS1B-leum hybrid promoter series......................23
2.3.5 Generalizing the hybrid promoter approach by switching the core promoter
region ..........................................................................................................................29
2.4 Discussion and conclusion ........................................................................................33
Chapter 3: Increasing expression level and copy number of a Yarrowia lipolytica
plasmid through regulated centromere function ..........................................................37
3.1 Chapter summary ......................................................................................................37
3.2 Introduction ...............................................................................................................38
3.3 Results ......................................................................................................................38
3.4 Discussion and conclusion ........................................................................................45
xi
Chapter 4: Rational metabolic engineering Yarrowia lipolytica for high lipid
production .........................................................................................................................47
4.1 Chapter summary ......................................................................................................47
4.2 Introduction ...............................................................................................................48
4.3 Results .....................................................................................................................50
4.3.1 Combinatorial genomic rewiring for improved lipogenesis .............................50
4.3.2 Lipogenic induction through nutrient level optimization ..................................59
4.3.3 Controlled fermentation enables superior lipogenesis ......................................63
4.3.4 High lipogenesis with alternative carbon sources .............................................69
4.3.5 Lipid analysis and conversion into soybean-like biodiesel ...............................69
4.5.6 Probing the link between leucine and lipogenesis .............................................73
4.4 Discussion and conclusion ........................................................................................78
Chapter 5: Evolutionary metabolic engineering for high lipid production in
Yarrowia lipolytica ............................................................................................................80
5.1 Chapter summary ......................................................................................................80
5.2 Introduction...............................................................................................................81
5.3 Results .....................................................................................................................82
5.3.1 High-lipid content cells can be identified via floating cells ..............................82
5.3.2 Random mutagenesis linked with floating cell transfer can identify improved
lipogenesis traits .........................................................................................................84
5.3.3 High lipid production through bioreactor fermentation with E26 .....................87
5.3.4 Assemble and analysis of draft genome of PO1f .............................................92
5.3.5 Whole genome sequencing revealed enhanced lipogenesis genotype .............94
5.3.6 uga2 pro209ser may play a critical role for improving lipid production ..........96
5.3.7 Iterative evolutionary engineering to further improve lipogenesis rates .........101
5.3.8 RNA-Seq analysis revealed the importance of glutamate degradation and
DHAP biosynthesis ................................................................................................105
5.4 Discussion and conclusion ......................................................................................106
Chapter 6: A mutant mga2 protein confers enhanced lipogenesis in Yarrowia
lipolytica .........................................................................................................................110
6.1 Chapter summary ....................................................................................................110
6.2 Introduction.............................................................................................................111
xii
6.3 Results ...................................................................................................................112
6.3.1 Isolation and whole genome sequencing of L36 revealed a mutant mga2 ......112
6.3.2 MGA2 (g1927a) leads to superior lipogenesis and is better than an MGA2
deletion .....................................................................................................................114
6.3.3 Metabolic engineering with L36 for improving lipogenesis and high lipid
production in bioreactor ..........................................................................................118
6.3.4 Rag- phenotype and elevated unsaturated fatty acid level associated with mga2
..................................................................................................................................120
6.3.5 Link mga2G643R with phenotype using RNA-Seq ........................................123
6.4 Discussion and conclusion ......................................................................................132
Chapter 7: Major findings and proposal for future work .........................................138
7.1 Major findings .........................................................................................................138
7.2 Proposal for future work ........................................................................................141
Chapter 8: Materials and methods ...............................................................................145
8.1 Common materials and methods .............................................................................145
8.1.1 Strains and media ............................................................................................145
8.1.2 Cloning procedures .........................................................................................145
8.1.3 Fatty acid characterization by Nile Red staining .............................................146
8.1.4 Bioreactor fermentation ...................................................................................147
8.1.5 Lipid, biomass and glucose quantification from samples ...............................148
8.2 Materials and methods for Chapter 2......................................................................148
8.2.1 Calculation of codon adaptation index ...........................................................148
8.2.2 Plasmid construction ......................................................................................148
8.2.3 Promoter characterization with flow cytometry .............................................150
8.2.4 Promoter characterization through β–galactosidase assay .............................150
8.2.5 Promoter characterization through qRT-PCR ................................................151
8.2.6 Plasmid stability test ......................................................................................151
8.3 Materials and methods for Chapter 3......................................................................154
8.3.1 Plasmid construction .......................................................................................154
8.3.2 Plasmid characterization with flow cytometry ...............................................154
8.3.3 Plasmid characterization through β–galactosidase assay ................................155
8.3.4 Plasmid copy number characterization through qRT-PCR .............................155
xiii
8.4 Materials and methods for Chapter 4......................................................................158
8.4.1 Base strains and media ....................................................................................158
8.4.2 Cloning and transformation procedures ..........................................................163
8.4.3 Plasmid construction .......................................................................................164
8.4.4 Construction of episomal expression cassettes ...............................................167
8.4.5 Construction of integrative expression cassettes .............................................167
8.4.6 Strain construction ...........................................................................................168
8.4.7 Lipid quantification and fatty acid profile analysis .........................................168
8.4.8 Citric acid quantification .................................................................................170
8.4.9 Ammonium quantification...............................................................................170
8.4.10 Bioreactor fermentations ...............................................................................170
8.4.11 Transesterification .........................................................................................171
8.4.12 Protein extraction...........................................................................................172
8.5 Materials and methods for Chapter 5......................................................................172
8.5.1 Culture media ..................................................................................................172
8.5.2 Transformation procedures ..............................................................................172
8.5.3 Plasmid construction .......................................................................................173
8.5.4 EMS mutagenesis and high lipid population enrichment ................................173
8.5.5 Whole genome sequencing and small nucleotide variation analysis ...............174
8.5.6 RNA preparation, sequencing and analysis .....................................................175
8.6 Materials and methods for Chapter 6......................................................................176
8.6.1 Culture media ..................................................................................................176
8.6.2 Plasmid construction .......................................................................................177
8.6.3 Whole genome sequencing and small nucleotide variation analysis ...............178
8.6.4 RNA-Seq and gene differential expression analysis .......................................178
References ........................................................................................................................181
xiv
List of Tables
Table 2.1: Promoter elements used in hybrid promoter engineering .................................21
Table 4.1: List of genes and enzymes for rational metabolic engineering for high lipid
production ..........................................................................................................................58
Table 5.1: Bioreactor metrics of E26 strain and E26E1 strain ..........................................92
Table 5.2: Authentic SNP shared in coding region in genome of E13 and E26 with their
annotation ...........................................................................................................................96
Table 6.1: Gene set enrichment analysis with significant differential expressed genes
from RNA-Seq experiments ............................................................................................128
Table 8.1: Primers used for Chapter 2 .............................................................................152
Table 8.2: Primers used for Chapter 3 .............................................................................157
Table 8.3: Strain information for Chapter 4.....................................................................159
Table 8.4: Primers used for Chapter 4 .............................................................................166
Table 8.5: Primers used for Chapter 5 .............................................................................173
Table 8.6: Primers used for Chapter 6 .............................................................................178
xv
List of Figures
Figure 1.1: Metabolic map for value-added chemical production in yeast..........................2
Figure 1.2: Simplified scheme of lipid metabolism in Yarrowia lipolytica ......................11
Figure 2.1: Fluorescence based assay for endogenous promoter characterization ............19
Figure 2.2: Developing and characterizing a UAS1B-Leum hybrid promoter set ............25
Figure 2.3: Expanding the hybrid promoter approach by altering the core promoter
element ...............................................................................................................................31
Figure 3.1: Improving expression level and copy number of plasmid in Yarrowia
lipolytica with regulated centromere function ..................................................................41
Figure 4.1: Combinatorial strain engineering for high lipid production in Yarrowia
lipolytica ...........................................................................................................................53
Figure 4.2: Genotypic dependency towards lipid induction phenotype with selected
strains .................................................................................................................................61
Figure 4.3: Fermentation profiles of pex10 mfe1 leucine+ uracil+ DGA1 and POlf
leucine+ uracil
+ ...................................................................................................................65
Figure 4.4: Lipid accumulation on alternative carbon sources ..........................................69
Figure 4.5: Fatty acid profile characterization and biodiesel conversion ..........................70
Figure 4.6: Leucine supplementation recovers leucine+ phenotype .................................74
Figure 5.1: High-lipid content cells can be identified via floating cells ...........................84
Figure 5.2: Overall schematic for the iterative, evolutionary metabolic engineering
approach used to enhance lipogenesis in Yarrowia lipolytica ..........................................87
Figure 5.3: Random mutagenesis linked with floating cell transfer can identify improved
lipogenesis strains ..............................................................................................................89
Figure 5.4: Functional and structural analysis of uga2 as an elicitor of lipogenesis .........98
Figure 5.5: Iterative evolutionary engineering can further improve lipogenesis rates ...102
Figure 6.1: MGA2 (g1927a) leads to superior lipogenesis and is better than an MGA2
deletion .............................................................................................................................115
xvi
Figure 6.2: Metabolic engineering lipid production in strain L36 ...................................119
Figure 6.3: Mga2 is related to Rag- phenotype and unsaturated fatty acid level ............122
Figure 6.4: Differential expression level of genes related to central carbon flux for lipid
biosynthesis ......................................................................................................................127
Figure 6.5: Illustration of mga2 protein with IPT and ANK domains and sequence
alignment over mga2 and its homologues ......................................................................137
1
Chapter 1: Introduction and Background
1.1 Value-added chemical production in yeast
Fungal systems possess an extensive track record in biotechnological applications
such as ethanol fermentation and enzyme production (1-2). Although metabolic
engineering endeavors over the past 20 years have focused primarily on diverse chemical
production in Escherichia coli (3-6), this organism is not always an ideal fermentation
host since it demonstrates relatively low stress tolerance (7), limited post-translational
modifications, difficulty in expressing complex enzymes such as P450s (2), and a lack of
subcellular compartments. In contrast, yeasts often lack these inherent flaws and possess
favorable attributes such as larger cell sizes (thus simplifying separation), lower growth
temperatures, higher pH and by-product tolerances (8), and immunity to phage
contamination. Collectively, these advantageous traits encourage the use of yeasts for
industrial-scale chemical and fuel production.
Contemporary metabolic engineering relies on bypassing native feedback
inhibition, constructing heterologous pathways and general optimization and rewiring of
metabolic flux. This approach has developed fungal platforms for the production of new
chemicals such as alcohols, sugar derivatives, organic acid, fats, terpenes, aromatics and
polyketides (9). This dissertation demonstrates a reproducible methodology used to
develop a nonconventional yeast, Yarrowia lipolytica, into a premier value-added
chemical (lipid) production platform. In particular, this feat is accomplished through
expanding the control over gene expression (Chapters 2 and 3), rational and evolutionary
2
metabolic engineering (Chapters 4 and 5) as well as probing novel regulators of
metabolism (Chapter 6). Chapter 7 provides a brief review of major findings and future
study recommendations and Chapter 8 contains comprehensive description of materials
and methods.
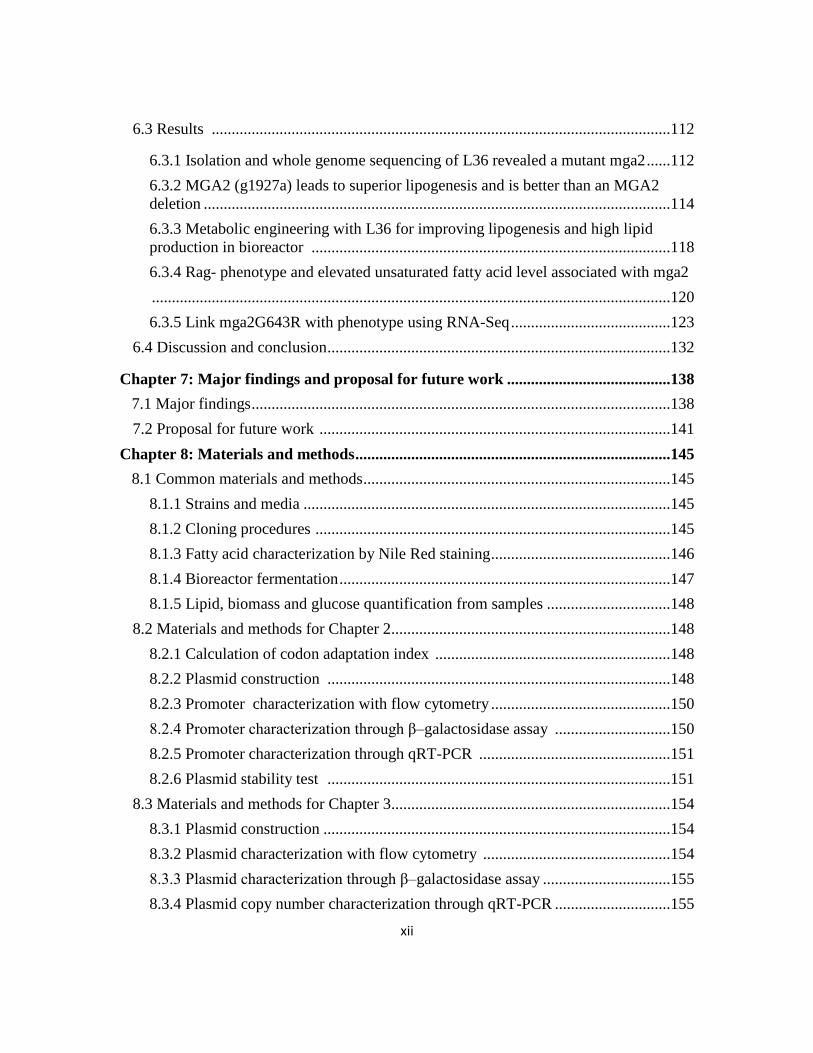
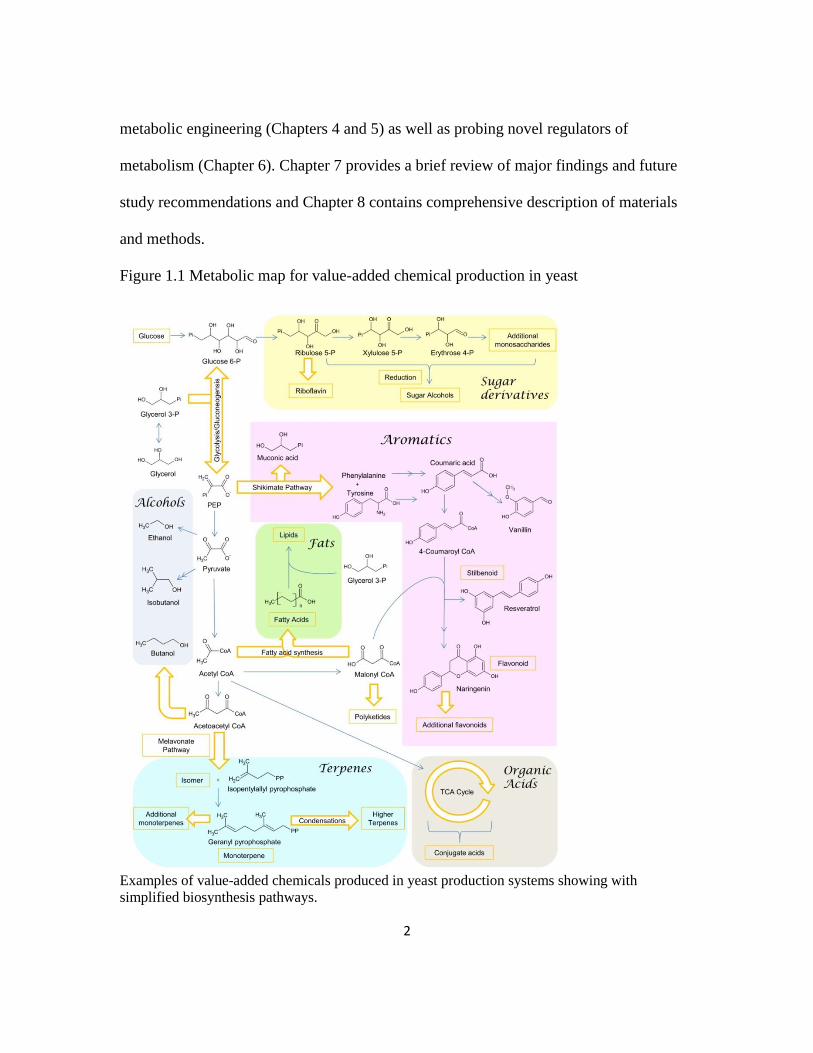
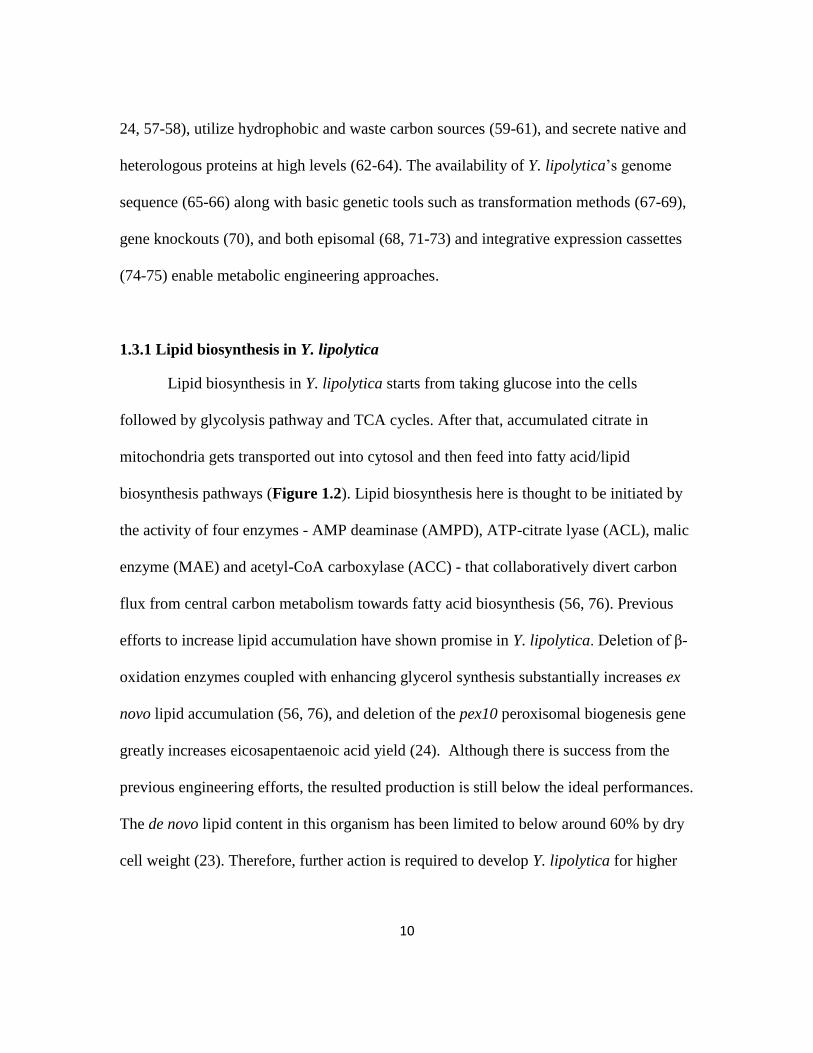
Figure 1.1 Metabolic map for value-added chemical production in yeast
Examples of value-added chemicals produced in yeast production systems showing with
simplified biosynthesis pathways.
3
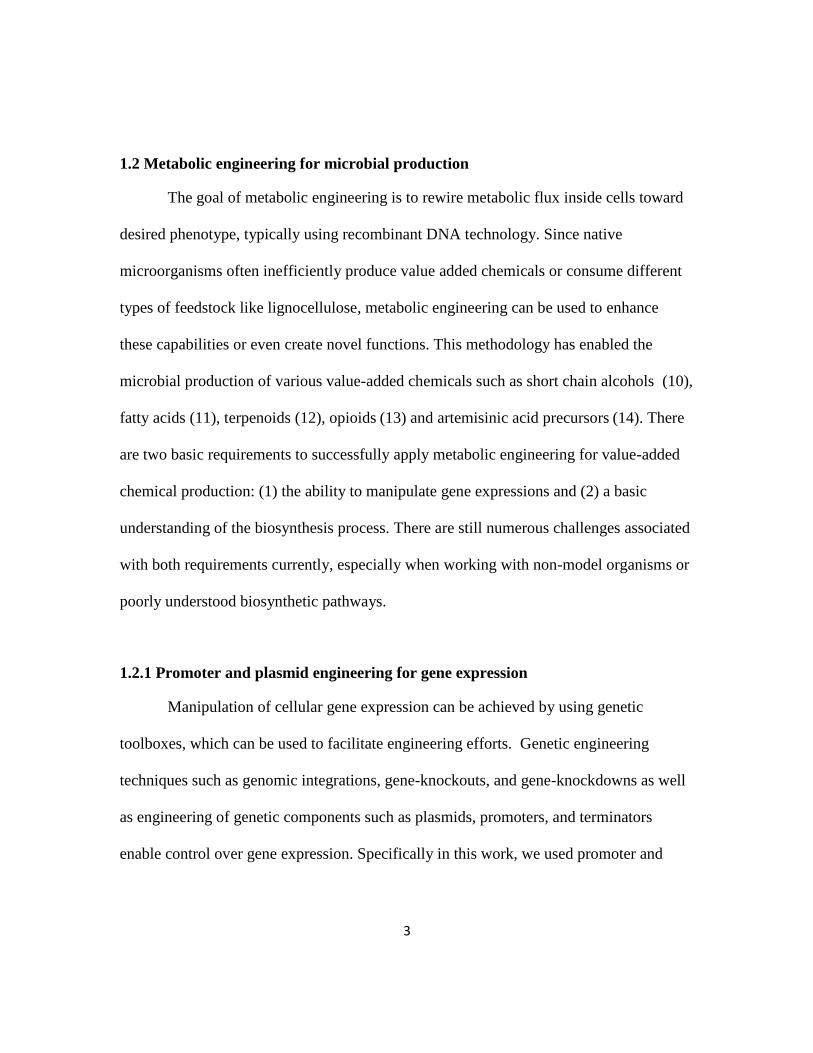
1.2 Metabolic engineering for microbial production
The goal of metabolic engineering is to rewire metabolic flux inside cells toward
desired phenotype, typically using recombinant DNA technology. Since native
microorganisms often inefficiently produce value added chemicals or consume different
types of feedstock like lignocellulose, metabolic engineering can be used to enhance
these capabilities or even create novel functions. This methodology has enabled the
microbial production of various value-added chemicals such as short chain alcohols (10),
fatty acids (11), terpenoids (12), opioids (13) and artemisinic acid precursors (14). There
are two basic requirements to successfully apply metabolic engineering for value-added
chemical production: (1) the ability to manipulate gene expressions and (2) a basic
understanding of the biosynthesis process. There are still numerous challenges associated
with both requirements currently, especially when working with non-model organisms or
poorly understood biosynthetic pathways.
1.2.1 Promoter and plasmid engineering for gene expression
Manipulation of cellular gene expression can be achieved by using genetic
toolboxes, which can be used to facilitate engineering efforts. Genetic engineering
techniques such as genomic integrations, gene-knockouts, and gene-knockdowns as well
as engineering of genetic components such as plasmids, promoters, and terminators
enable control over gene expression. Specifically in this work, we used promoter and
4
plasmid engineering to develop effective means for manipulating gene expression in Y.
lipolytica.
Promoter engineering is an efficient means to tune gene expression since
endogenous promoters do not fully sample the complete continuum of transcriptional
control (15). Synthetic control of gene expression is critical for metabolic engineering
efforts since precise control of key pathway enzymes (heterologous or native) can help
maximize product formation. To this end, several studies have developed techniques for
engineering promoters for desired expression characteristics. For instance, mutagenesis-
based promoter engineering has been used to create a library of mutants that could be
screened for those with desirable expression levels (16). Recently, a hybrid-promoter
engineering strategy was developed which paired multiple UAS sequences from one
native promoter with a different core promoter (17). Moreover, novel design of synthetic
yeast promoters has also been accomplished by tuning promoter sequences to alter
nucleosome architecture (18). These methods enabled the creation of different promoters
with a wide range of strength and properties. However, most of these promoters were
developed for model organisms such as S. cerevisiae. In order to unleash the microbial
production potential of non-conventional yeasts like Y. lipolytica, such tools need to be
developed for use in those organisms. In the work presented in Chapter 2, a hybrid
promoter engineering strategy was developed and implemented in Y. lipolytica to greatly
expand the ability for tuning gene expression in this yeast.
In addition to engineering of promoters, altering plasmid design can function as a
convenient means for tuning expression. In S. cerevisiae, plasmid-based control of gene
5
expression is achieved by using varieties of plasmids such as centromeric (CEN)
plasmids (low copy), 2-micron plasmids (high copy), and autonomously replicating
sequence (ARS) plasmids (high copy) (19-21) that possess different properties. However,
in Y. lipolytica, there is only CEN plasmid available. In the work presented in Chapter 3,
an alternative route to enable plasmid level gene expression control in Y. lipolytica was
enabled through developing a high expressing plasmid by repressing centromeric
function. This tuning ability on plasmid added another level of control over gene
expression in this yeast.
1.2.2 Rational and evolutionary metabolic engineering
Rational metabolic engineering refers to such engineering efforts which select
enzymes, transporters, or regulatory proteins as targets for genetic manipulation based on
available information regarding the pathways, enzymes, and regulation associated with
generating the product of interest. Rational metabolic engineering has been fairly
successful in various applications including the production of antimalarial drug precursor
artemisinic acid (14), the industrially versatile commodity chemical phenol (22), and
medically essential opioids (13). Common strategies used in rational metabolic
engineering include by-product elimination, precursor enrichment, rerouting metabolic
pathways and cofactor optimization (5). These approaches have been very efficient when
utilized to enable the production of various chemicals in different microbial hosts (23-26).
By engineering the precursor biosynthesis pathways, riboflavin production was
significantly improved in Ashbya gossypii (27). In addition, optimization of co-factor
6
supply and precursor production enabled α-santalene overproduction in S. cerevisiae (28).
Furthermore, inhibition of hydrocarbon accumulation in cyanobacteria has led to
improved production of fatty alcohols in these organisms (29). Chapter 4 describes our
efforts to utilize rational metabolic engineering techniques to systematically engineer Y.
lipolytica for high lipid production, which achieved a genetic background capable of at a
titer of over 25 g/L.
Although rational metabolic engineering has demonstrated successful in
numerous applications, manipulating only rational targets can be less successful than
predicted or even demonstrate detrimental effects. This arises due to an incomplete
understanding of the complex global metabolic network, which prevents the anticipation
of every consequence of a genetic modification. Evolutionary metabolic engineering,
often associated with multiple cycles of random genetic perturbation and selection, can
be very effective in overcoming this challenge by identifying phenotypically
advantageous variants (30-32). This approach has been successfully implemented to
rapidly provide strains with complex desired phenotypes such as improved galactose and
xylose catabolism in S. cerevisiae (30, 33), increased isobutanol, succinate, and L-
tyrosine production in E. coli (31, 34-35), as well as riboflavin production in Candida
famata (36). If a working selection method accompanied with techniques for screening
and/or enrichment has been developed, evolutionary engineering can provide a powerful
complimentary method to rational metabolic engineering. In the work presented in
Chapter 5, an evolutionary metabolic engineering strategy was developed and successful
implemented which further increased lipid production in Y. lipolytica. This provided a

7
strain able to achieve a lipid titer of over 40 g/L, which represents a 60% improvement
over the strain generated using rational metabolic engineering alone, without sacrificing
productivity or yield. Moreover, implementing inverse metabolic engineering with strains
developed using evolutionary metabolic engineering to identify the genetic basis for the
differing phenotypes provided novel understandings as well as additional engineering
targets. This can be achieved by using next generation sequencing to resolve strain
differences that arise from evolutionary engineering.
1.2.3 Next generation sequencing analysis in metabolic engineering
Analysis of evolutionary engineering efforts through next generation sequencing
(NGS) can reveal the detailed genomic and transcriptomic information within these
strains. This can then be utilized to identify beneficial mutations and identify novel
underlying cellular mechanisms. The rapid advances in next generation sequencing
technology has greatly enhanced genomic approaches, providing new potential for
evolutionary engineering and inverse metabolic engineering successes (37). NGS usually
refers to non-Sanger-based high-throughput DNA sequencing technologies including
Illumina sequencing, Roche 454 sequencing, SOLiD sequencing, etc. Millions or billions
of DNA strands can be sequenced in parallel, substantially improving sequencing
throughput and minimizing the need for fragment-cloning methods that are often
necessary for sequencing genomes using Sanger sequencing (38). Illumina sequencing is
the most popular sequencing technique used for omic studies such as whole genome
sequencing (WGS) and RNA-Seq. Utilization of both of these techniques can be very
8
informative in the application of metabolic engineering for microbial production of
value-added chemicals.
WGS provides access to the information coded in the genome of a
microorganism, which enhances our understanding of the organism, enabling metabolic
engineering endeavors. This information is commonly used for genome mining to
identify novel enzymes and pathways. Additionally, this can probe genotype-phenotype
linkage to identify changes at the genome level present in strains demonstrating a
superior phenotype, which can be used for identifying targets for inverse metabolic
engineering. A recent WGS study revealed the enriched difference in cAMP pathway
genes by comparing a model stain for modern industrial biotechnology, S. cerevisiae
CEN.PK113-7D, with another strain S288C. Moreover, beneficial mutations have been
identified through WGS approaches with improved galactose utilization as well as
improving heat tolerance in S. cerevisiae (39-40). The work presented in Chapters 5 and
6 describes the implementation of WGS analysis to identify beneficial mutations, which
arose from evolutionary engineering and random mutation, to enhancing understanding
of lipogenesis in Y. lipolytica.
Although WGS reveals detailed genomic information, RNA-Seq experiments can
analyze the cellular transcriptome which provides substantial information regarding to the
cellular metabolic state. RNA-Seq is especially useful when working with non-
conventional microorganisms since standard microarrays are not available for many of
these organisms. More importantly, RNA-Seq supplies more information compared to

9
traditional methods such as alternative splicing (41), differential isoform expression (42),
and promoter usage (43). It can also enable a more precise comparison of the expression
level of different genes within samples in addition to the differential gene expression
resulting from different samples/conditions. A recent study using RNA-Seq analysis to
investigate host-strain dependency for xylose utilization in recombinant S. cerevisiae
strains identified important transcription factors (44). Another study of Hansenula
polymorpha transcriptome identified abundant and highly upregulated expression of 40%
of the genome in methanol grown cells, and revealed alternative splicing events (45).
Chapters 5 and 6 describe transcriptomic analysis employed to unveil relevant
mechanisms present in high lipogenic strains.
1.3 Yarrowia lipolytica as a microbial production host for lipid production
Recently, there has been a surge in the types of microbially-derived oleochemicals
produced (46-48), including alkanes (46), alkenes (49-50), fatty alcohols (51), and fatty
esters (25, 51) as well as polyunsaturated fatty acids (52). However, most of these efforts
still suffer from low titers largely in part from the choice of the cellular host, typically E.
coli. Alternatively, oleaginous organisms, such as the fungus Y. lipolytica, could serve as
a more ideal host due to higher innate lipogenesis potential. Y. lipolytica is increasingly
being recognized as promising hosts for the production of valuable compounds (53). It is
a unique host for biochemical production and heterologous protein excretion on account
of its abilities to accumulate high levels of lipids (54-56), overproduce organic acids (23-
10
24, 57-58), utilize hydrophobic and waste carbon sources (59-61), and secrete native and
heterologous proteins at high levels (62-64). The availability of Y. lipolytica’s genome
sequence (65-66) along with basic genetic tools such as transformation methods (67-69),
gene knockouts (70), and both episomal (68, 71-73) and integrative expression cassettes
(74-75) enable metabolic engineering approaches.
1.3.1 Lipid biosynthesis in Y. lipolytica
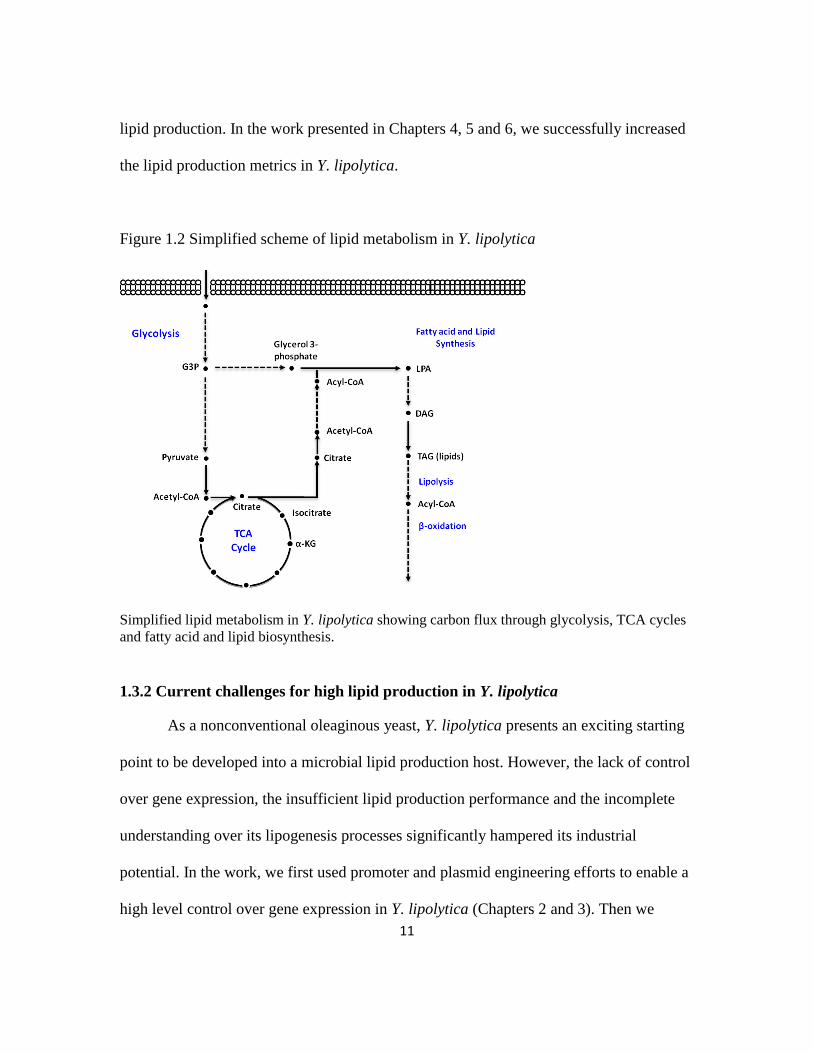
Lipid biosynthesis in Y. lipolytica starts from taking glucose into the cells
followed by glycolysis pathway and TCA cycles. After that, accumulated citrate in
mitochondria gets transported out into cytosol and then feed into fatty acid/lipid
biosynthesis pathways (Figure 1.2). Lipid biosynthesis here is thought to be initiated by
the activity of four enzymes - AMP deaminase (AMPD), ATP-citrate lyase (ACL), malic
enzyme (MAE) and acetyl-CoA carboxylase (ACC) - that collaboratively divert carbon
flux from central carbon metabolism towards fatty acid biosynthesis (56, 76). Previous
efforts to increase lipid accumulation have shown promise in Y. lipolytica. Deletion of β-
oxidation enzymes coupled with enhancing glycerol synthesis substantially increases ex
novo lipid accumulation (56, 76), and deletion of the pex10 peroxisomal biogenesis gene
greatly increases eicosapentaenoic acid yield (24). Although there is success from the
previous engineering efforts, the resulted production is still below the ideal performances.
The de novo lipid content in this organism has been limited to below around 60% by dry
cell weight (23). Therefore, further action is required to develop Y. lipolytica for higher
11
lipid production. In the work presented in Chapters 4, 5 and 6, we successfully increased
the lipid production metrics in Y. lipolytica.
Figure 1.2 Simplified scheme of lipid metabolism in Y. lipolytica
Simplified lipid metabolism in Y. lipolytica showing carbon flux through glycolysis, TCA cycles
and fatty acid and lipid biosynthesis.
1.3.2 Current challenges for high lipid production in Y. lipolytica
As a nonconventional oleaginous yeast, Y. lipolytica presents an exciting starting
point to be developed into a microbial lipid production host. However, the lack of control
over gene expression, the insufficient lipid production performance and the incomplete
understanding over its lipogenesis processes significantly hampered its industrial
potential. In the work, we first used promoter and plasmid engineering efforts to enable a
high level control over gene expression in Y. lipolytica (Chapters 2 and 3). Then we
12
employed rational and evolutionary metabolic engineering to develop Y. lipolytica into a
high lipid production host and in the same time, we supplied novel understanding over
lipogenesis process (Chapters 4 and 5). Lastly, we identified and analyzed a novel
lipogenesis regulator, a mutant mga2 protein, which expand the limited knowledge of
complex regulation of lipid production (Chapter 6).
13
Chapter 2: Hybrid promoter engineering in Yarrowia lipolytica1
2.1 Chapter summary
The development of strong and tunable promoter elements is necessary to enable
metabolic and pathway engineering applications for any host organism. In this chapter,
we have expanded and generalized a hybrid promoter approach to produce libraries of
high-expressing, tunable promoters in the nonconventional yeast, Yarrowia lipolytica to
enable the gene expression manipulation in this yeast. These synthetic promoters are
comprised of two modular components—the enhancer element and the core promoter
element. By exploiting this basic promoter architecture, we have overcome native
expression limitations and provided a strategy for both increasing native promoter
capacity and producing libraries for tunable gene expression in a cellular system with ill-
defined genetic tools. In doing so, the work presented in this chapter has created the
strongest promoters ever reported in Y. lipolytica. Furthermore, we have characterized
these promoters at the single-cell level through the use of a developed fluorescence based
assay as well as at the transcriptional and whole-cell level. The resulting promoter
libraries exhibited a range of more than 400 fold in terms of mRNA levels, and the
strongest promoters in this set had eight-fold higher fluorescence levels compared with
typically used endogenous promoters. These results suggest that promoters in Y.
lipolytica are enhancer limited and this limitation can be partially or fully alleviated
1 Portion of this chapter has been published previously in AEM, 77(22), 7905-7914 with JB, LL, HR, HA designed and carried the
experiments.

14
through the addition of tandem copies of upstream activation sequences (UAS). Finally,
the results from this chapter illustrates that tandem copies of UAS regions can serve as
synthetic transcriptional amplifiers that may be generically used to increase the
expression level of promoters.
2.2 Introduction
Developing and establishing a comprehensive suite of promoter elements in
organisms with poorly defined genetic tools is essential for enabling metabolic and
pathway engineering applications. To this end, the oleaginous yeast Yarrowia lipolytica
has received attention as a potential biofuels producing host, yet lacks genetic tools for
tunable and high level gene expression. In other organisms, prior attempts of promoter
engineering relied on modifying the expression range of endogenous promoters through
point mutations. As an example, error-prone PCR of the native Saccharomyces
cerevisiae TEF promoter yielded a library of mutant promoters with a nearly seventeen-
fold range in relative expression strength (77). A similar approach in E. coli led to a
nearly eighteen-fold range in relative expression strength based on the heterologous Pl-
lambda promoter (16). An alternative strategy aimed at tuning intergenic regions in
heterologous Escherichia coli operons enabled a seven-fold improvement in pathway
throughput and was used to prevent the accumulation of a toxic intermediate (78). While
successful, these methods and applications are quite limited by: (1) their reliance on a
strong, well-defined starting core promoter and (2) the tendency of alterations to result in
15
expression levels lower than these baselines. These limitations present a challenge for
creating a dynamic range of promoters with similar regulation in a novel organism
without highly characterized strong promoter elements.
Beyond point mutations, the generation of hybrid promoters has been previously
successful in significantly augmenting promoter architecture and function (79-81). Most
of these approaches attempt to create synthetic hybrid promoters by fusing an upstream
activating sequence (UAS) to a separate (often minimal) core promoter region. The
result is a functional UAS-core promoter chimera. In this construct, the UAS regulatory
site enhances gene expression by localizing trans-acting regulatory elements
(transcription factors). As a result, this approach raises the possibility to uniquely
engineer promoters as two independent, synthetic parts—activating regions and core
regions. In this chapter, we present a generalizable approach of hybrid promoter
engineering for the construction of both very high-strength promoters and tunable
promoter libraries in the non-conventional, oleaginous yeast host Y. lipolytica.
Although Y. lipolytica is a promising production host, many of the methods in
this organism rely on ill-defined genetic elements (60) especially in the area of promoters.
One of the strongest promoters in Y. lipolytica, the XPR2 promoter (pXPR2) has complex
requirements for induction that hinders its industrial applications (82). Nevertheless, this
promoter has been functionally analyzed to reveal a 105 base pair distal UAS fragment
named UAS1B (83-84). Previously, between one to four tandem UAS1B copies were
fused to a core minimal LEU2 promoter to create four increasingly strong hybrid chimera
promoters, named hp1d through hp4d (82). As a result, the hp4d promoter has become a
16
commonly used tool for heterologous protein expression in Y. lipolytica. A further re-
analysis of these four promoters revealed a linear increase of promoter strength as a
function of number of tandem UAS1B elements which raises the possibility of further
improvements.
Specifically, in this chapter, we describe the development of a generic, hybrid
promoter approach for creating synthetic, tunable promoters. Furthermore, these results
demonstrate that the activating regions and core regions can act as independent synthetic
parts to create a hybrid promoter. In particular, we construct and characterize two
libraries of synthetic hybrid promoters: a UAS1B-leum library in which between one and
thirty two UAS1B elements are fused to the minimal LEU2 promoter region and an
UAS1B8/16-TEF library in which eight or sixteen tandem UAS1B elements are fused to
varying sized TEF promoter regions. In doing so, this work creates the strongest
characterized promoters in Y. lipolytica and the first ever reported capacity for tunable
gene expression in this system. Moreover, this work establishes synthetic hybrid
promoter construction as a generic approach for promoter engineering to expand and
enhance the strength of engineered promoters in a manner not accessible through
traditional promoter engineering applications.
2.3 Results
2.3.1 Characterization of endogenous promoters at the single-cell level
Prior studies of promoter strength in Y. lipolytica have relied on assaying whole
cultures for protein expression level (using reporters such as β-galactosidase) (62, 82). It
17
is commonly known that these methods can mask potential bimodal “on/off” distributions
within the population. Thus, to avoid this complication, we sought to utilize a
fluorescence-based assay using the Y. lipolytica plasmid pSl16-Cen1-1(227) (85). All
results generated in this chapter, except where indicated, employed derivatives of this
replicative, ARS-CEN based plasmid. Since codon biases are known to limit translation
in Y. lipolytica (86) and no fluorescent reporter protein has been previously used in Y.
lipolytica to gauge promoter strength, we initially evaluated several available fluorescent
reporter proteins. The TEF promoter was coupled to four different fluorescence genes
including yECitrine, EGFP, hrGFP and mStrawberry and flow cytometry was performed
to determine reporter functionality. Of these variants, only hrGFP imparted detectable
fluorescence (Figure 2.1a). This gene, optimized for expression in mammalian cells, has
the highest Codon Adaptation Index for Y. lipolytica of the four fluorescence genes (87),
indicating the closest compatibility with codon usage frequencies for this organism.
As a result, the hrGFP reporter gene was used to evaluate the promoter strength of
seven previously identified endogenous Y. lipolytica promoters—TEF, EXP, FBA, GPAT,
GPD, YAT, and XPR2 (Table 2.1, Figure 2.1b) (62, 88-89). Based on this analysis, the
relative ordering of promoters strengths is EXP > TEF > GPD > GPAT > YAT > XPR2 >
FBA. The low mean fluorescence values of even the strongest of these native promoters,
EXP and TEF, highlight that even strong endogenous promoters in Y. lipolytica may be
too low for metabolic engineering purposes. When each of these promoters was used in a
plasmid-based construct, a bimodal fluorescence distribution was seen. Based on prior
reports to further improve the expression strength, a consensus four nucleotide “caca”
18
sequence 5’ of the +1 ATG codon was included (86, 90-92); however, this inclusion was
found to be detrimental to expression levels in most cases (data not shown). The
differential regulation patterns and small dynamic range of these endogenous promoters
require a novel approach to enable metabolic engineering applications in this organism.

19
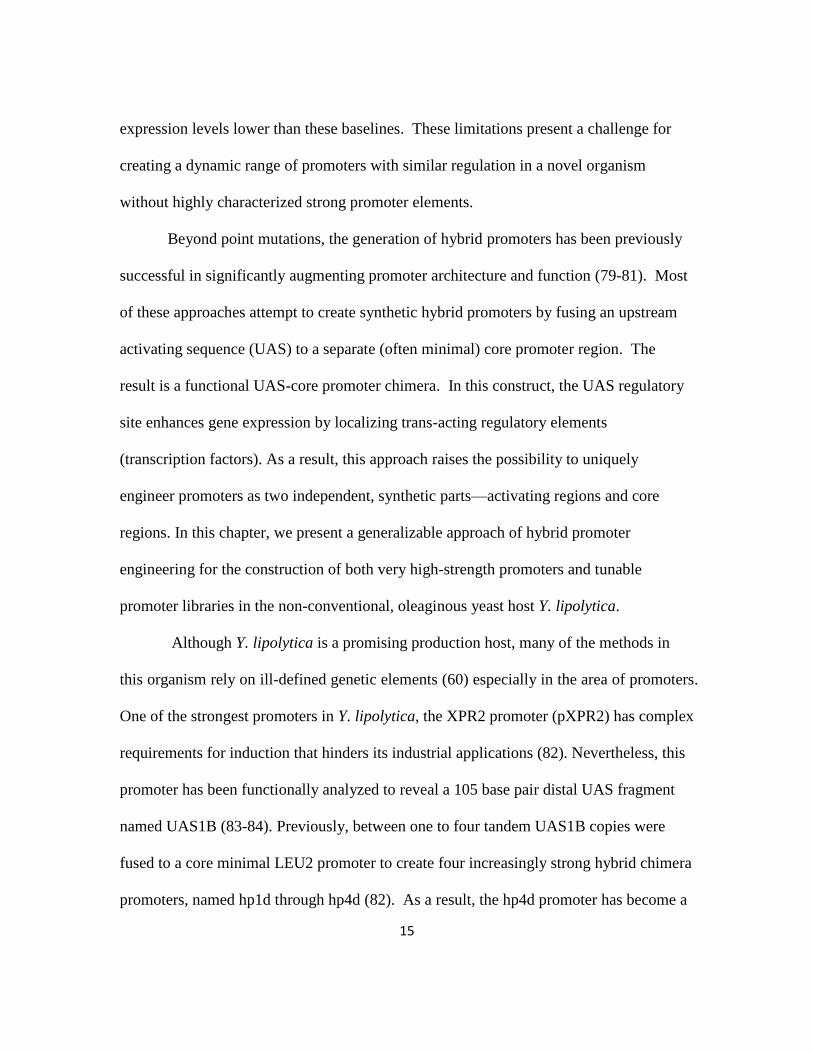
Figure 2.1 Fluorescence based assay for endogenous promoter characterization
Figure 2.1a
Figure 2.1b
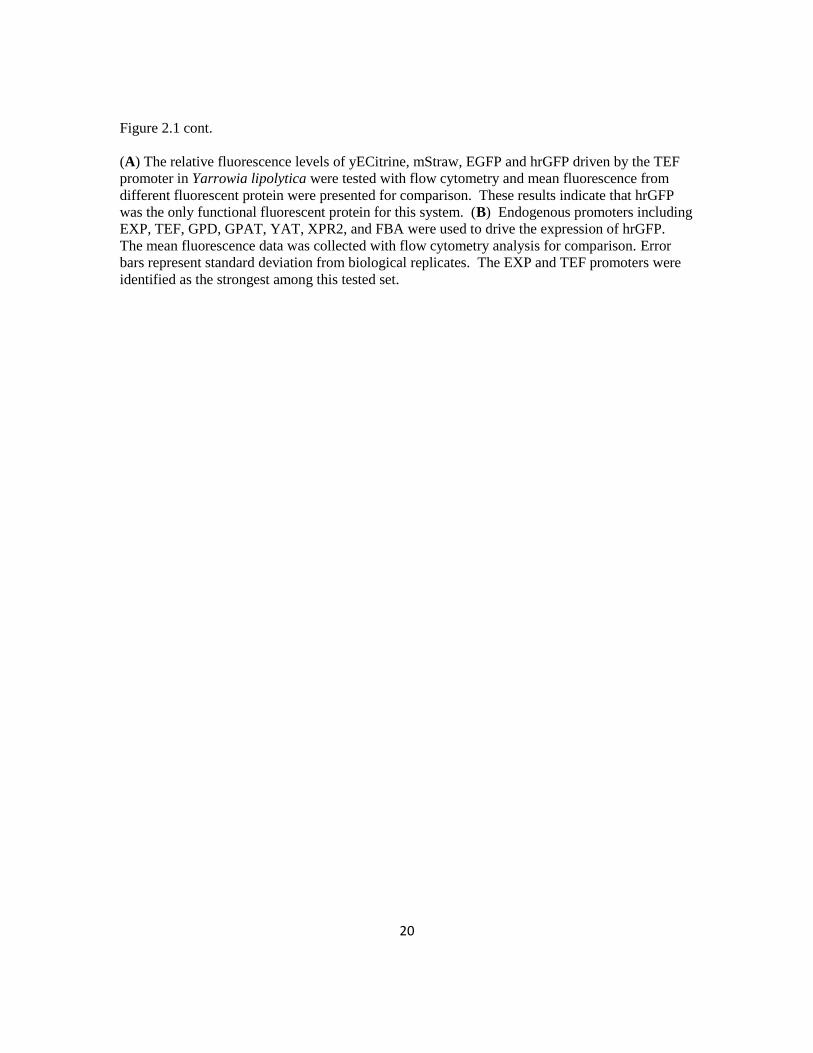
20
Figure 2.1 cont.
(A) The relative fluorescence levels of yECitrine, mStraw, EGFP and hrGFP driven by the TEF
promoter in Yarrowia lipolytica were tested with flow cytometry and mean fluorescence from
different fluorescent protein were presented for comparison. These results indicate that hrGFP
was the only functional fluorescent protein for this system. (B) Endogenous promoters including
EXP, TEF, GPD, GPAT, YAT, XPR2, and FBA were used to drive the expression of hrGFP.
The mean fluorescence data was collected with flow cytometry analysis for comparison. Error
bars represent standard deviation from biological replicates. The EXP and TEF promoters were
identified as the strongest among this tested set.
21
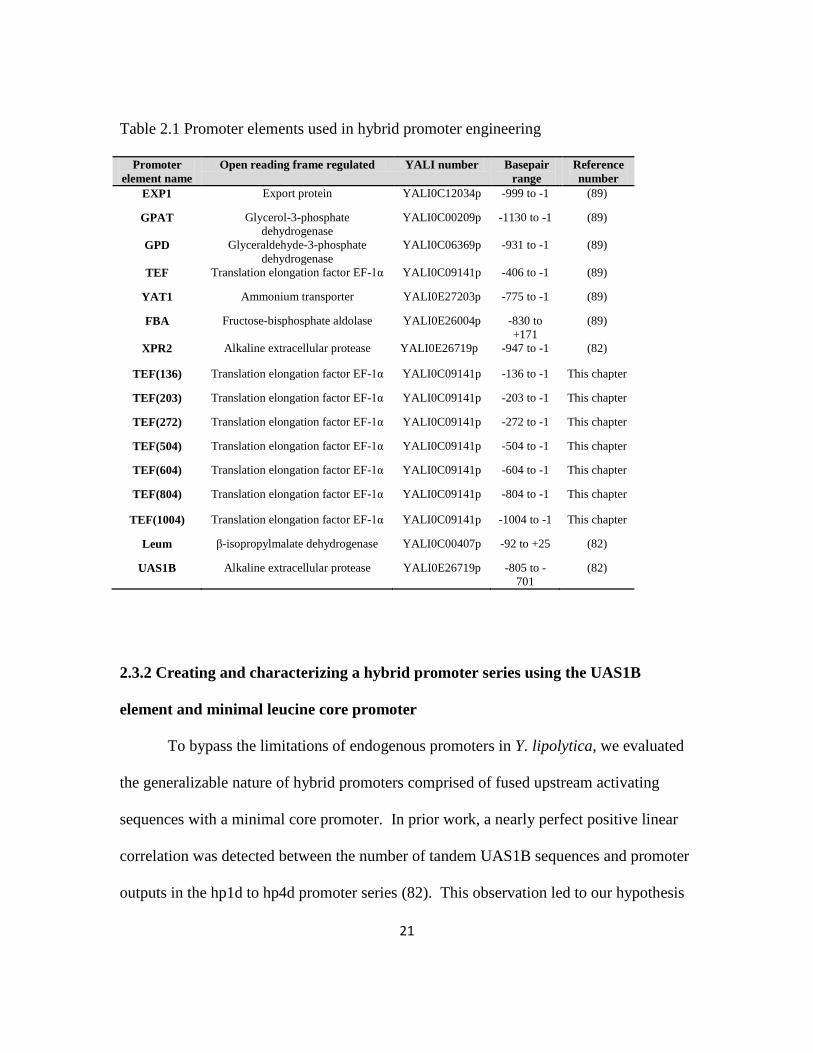
Table 2.1 Promoter elements used in hybrid promoter engineering
Promoter
element name
Open reading frame regulated YALI number Basepair
range
Reference
number
EXP1 Export protein YALI0C12034p -999 to -1 (89)
GPAT Glycerol-3-phosphate
dehydrogenase
YALI0C00209p -1130 to -1 (89)
GPD Glyceraldehyde-3-phosphate
dehydrogenase
YALI0C06369p -931 to -1 (89)
TEF Translation elongation factor EF-1α YALI0C09141p -406 to -1 (89)
YAT1 Ammonium transporter YALI0E27203p -775 to -1 (89)
FBA Fructose-bisphosphate aldolase YALI0E26004p -830 to
+171
(89)
XPR2 Alkaline extracellular protease YALI0E26719p -947 to -1 (82)
TEF(136) Translation elongation factor EF-1α YALI0C09141p -136 to -1 This chapter
TEF(203) Translation elongation factor EF-1α YALI0C09141p -203 to -1 This chapter
TEF(272) Translation elongation factor EF-1α YALI0C09141p -272 to -1 This chapter
TEF(504) Translation elongation factor EF-1α YALI0C09141p -504 to -1 This chapter
TEF(604) Translation elongation factor EF-1α YALI0C09141p -604 to -1 This chapter
TEF(804) Translation elongation factor EF-1α YALI0C09141p -804 to -1 This chapter
TEF(1004) Translation elongation factor EF-1α YALI0C09141p -1004 to -1 This chapter
Leum β-isopropylmalate dehydrogenase YALI0C00407p -92 to +25 (82)
UAS1B Alkaline extracellular protease YALI0E26719p -805 to -
701
(82)
2.3.2 Creating and characterizing a hybrid promoter series using the UAS1B
element and minimal leucine core promoter
To bypass the limitations of endogenous promoters in Y. lipolytica, we evaluated
the generalizable nature of hybrid promoters comprised of fused upstream activating
sequences with a minimal core promoter. In prior work, a nearly perfect positive linear
correlation was detected between the number of tandem UAS1B sequences and promoter
outputs in the hp1d to hp4d promoter series (82). This observation led to our hypothesis
22
that these minimal core promoters and potentially other Y. lipolytica full-length, native
promoters are enhancer limited. To address this limitation, we created an expanded
series of hybrid promoters by fusing between one and thirty two tandem UAS1B
enhancer sequences to the leucine minimal promoter (Leum) to form promoters UAS1B1-
Leum through UAS1B32-Leum (Figure 2.2a). The newly constructed UAS1B-Leum
promoter series was tested with hrGFP based flow cytometry analysis. The fluorescence
data displayed several domains for correlation between output fluorescence and the
number of upstream UAS elements. Initially, an exponential increase in fluorescence
was seen as UAS1B sequence count increased from one to eight. This trend became
linear through nineteen tandem repeats (a total of 1995 bp of upstream activating
sequences upstream of the core promoter). Finally, the output fluorescence seemed to be
saturated through 32 tandem UAS1B repeats (Figure 2.2b). This data strongly
conformed to a Hill Cooperative Binding model (correlation coefficient of 0.95) and
exhibited a high Hill Constant (3.889) which indicates a strong amount of binding
cooperativity of the enhancer elements (Figure 2.2b). Specifically, this data was fit to
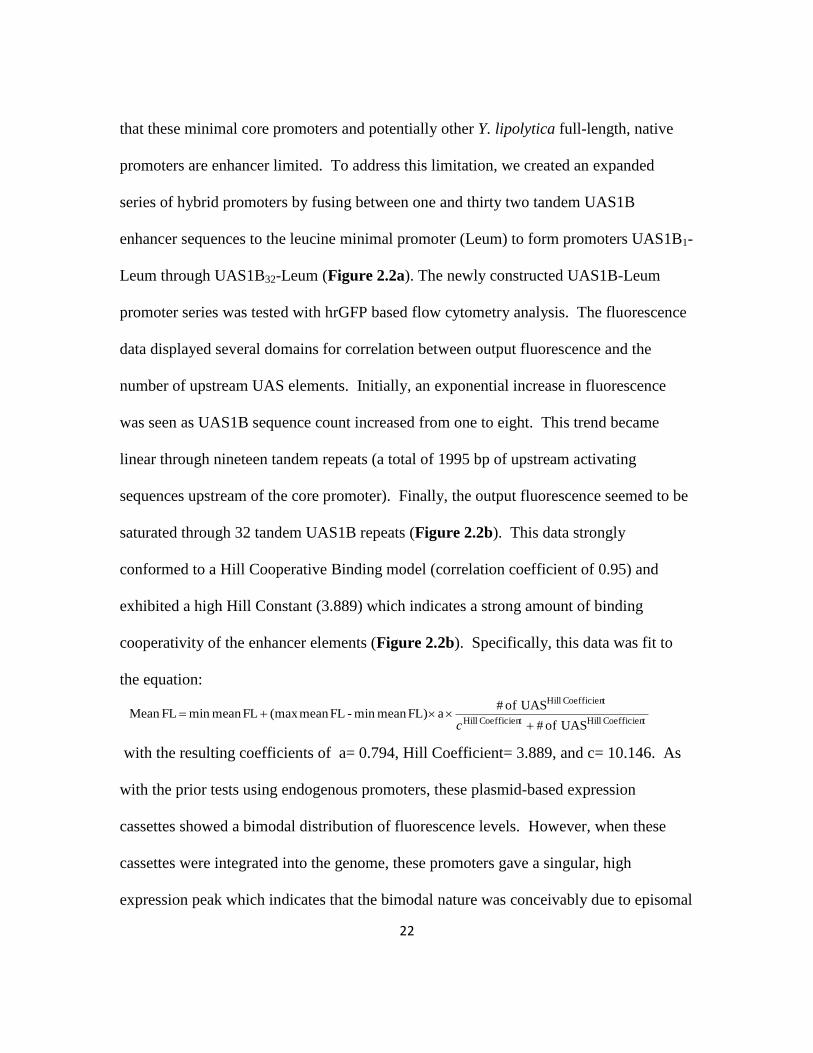
the equation:
with the resulting coefficients of a= 0.794, Hill Coefficient= 3.889, and c= 10.146. As
with the prior tests using endogenous promoters, these plasmid-based expression
cassettes showed a bimodal distribution of fluorescence levels. However, when these
cassettes were integrated into the genome, these promoters gave a singular, high
expression peak which indicates that the bimodal nature was conceivably due to episomal
tCoefficien HilltCoefficien Hill
tCoefficien Hill
UASof #
UASof # a FL)mean min - FLmean (max FLmean min FLMean
c
23
expression issue related to this organism. These integrative expression cassettes
generated roughly two-fold higher fluorescence values than their corresponding
replicative-based cassettes (data not shown).
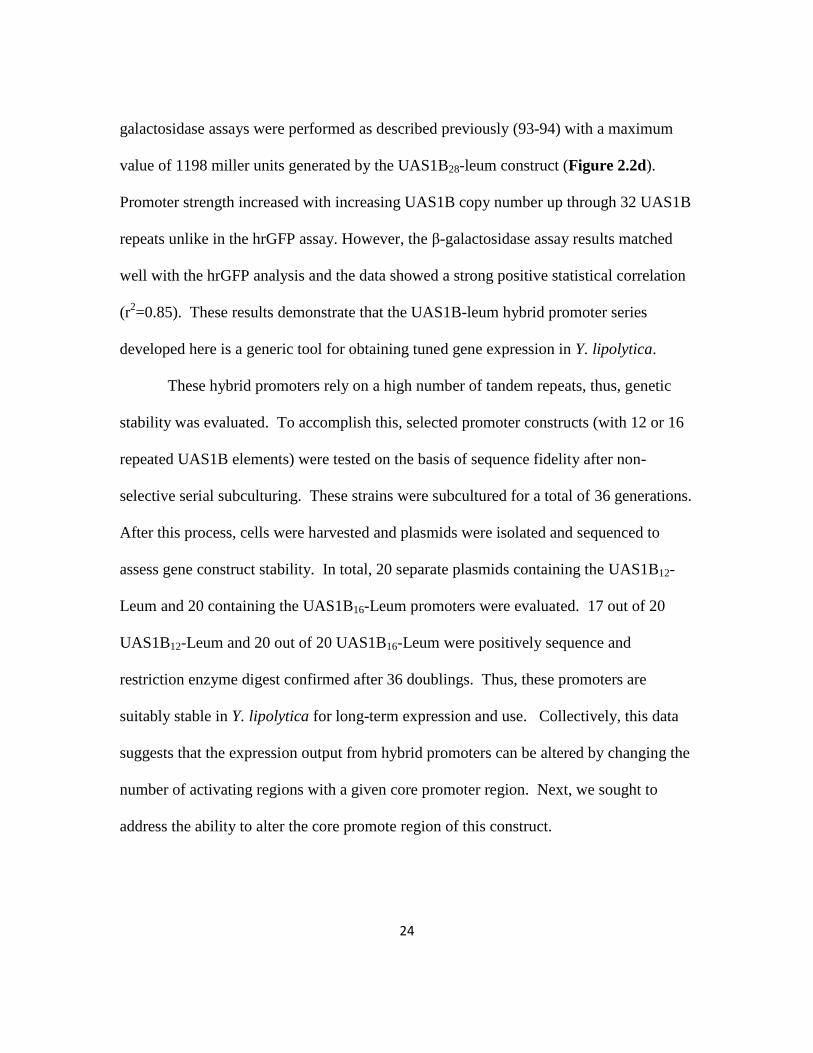
2.3.3 Transcriptional analysis of the UAS1B-leum hybrid promoter series
A transcriptional analysis was performed to confirm that the observed effect in
fluorescence was indeed manifested at the transcriptional level. To do so, qRT-PCR
analysis was employed using the hrGFP mRNA of select promoter constructs (Leum,
UAS1B4-Leum, UAS1B8-Leum, UAS1B16-Leum, UAS1B24-Leum, and UAS1B32-Leum)
(Figure 2.2c). Expression values were normalized to the mRNA level seen with only the
minimal leucine promoter used to drive hrGFP. Indeed, the increase in mean
fluorescence levels was strongly correlated with the increase in relative mRNA levels.
The relative mRNA levels increased and likewise plateaued for constructs with a high
number of UAS1B repeats. Moreover, these results demonstrate an extraordinary range
of promoter strength in this series with more than a 400 fold dynamic range of transcript
level between the minimal promoter and strongest promoters in this set.
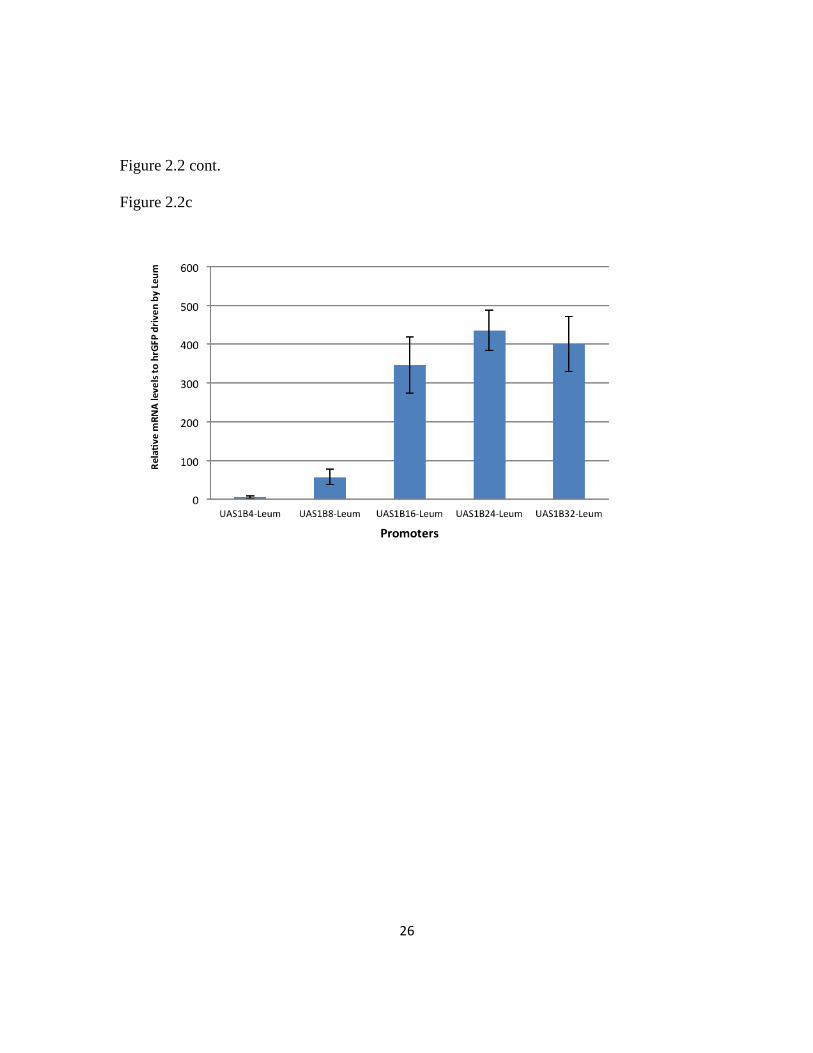
2.3.4 Utility and stability of the UAS1B-leum hybrid promoter series
To ensure that the observed effect was independent of reporter gene, we sought to
provide a further characterization of the UAS1B-Leum promoter series with a separate
reporter gene, the β-galactosidase gene encoded by E. coli lacZ. Select promoter
constructs (including the endogenous TEF, EXP, and XPR2 promoters as well as hybrid
UAS1B-leum constructs containing 1, 2, 3, 4, 6, 8, 12, 16, 20, 24, 28, and 32 UAS1B
copies) were used to construct expression cassettes with lacZ in place of hrGFP. β-
24
galactosidase assays were performed as described previously (93-94) with a maximum
value of 1198 miller units generated by the UAS1B28-leum construct (Figure 2.2d).
Promoter strength increased with increasing UAS1B copy number up through 32 UAS1B
repeats unlike in the hrGFP assay. However, the β-galactosidase assay results matched
well with the hrGFP analysis and the data showed a strong positive statistical correlation
(r2=0.85). These results demonstrate that the UAS1B-leum hybrid promoter series
developed here is a generic tool for obtaining tuned gene expression in Y. lipolytica.
These hybrid promoters rely on a high number of tandem repeats, thus, genetic
stability was evaluated. To accomplish this, selected promoter constructs (with 12 or 16
repeated UAS1B elements) were tested on the basis of sequence fidelity after non-
selective serial subculturing. These strains were subcultured for a total of 36 generations.
After this process, cells were harvested and plasmids were isolated and sequenced to
assess gene construct stability. In total, 20 separate plasmids containing the UAS1B12-
Leum and 20 containing the UAS1B16-Leum promoters were evaluated. 17 out of 20
UAS1B12-Leum and 20 out of 20 UAS1B16-Leum were positively sequence and
restriction enzyme digest confirmed after 36 doublings. Thus, these promoters are
suitably stable in Y. lipolytica for long-term expression and use. Collectively, this data
suggests that the expression output from hybrid promoters can be altered by changing the
number of activating regions with a given core promoter region. Next, we sought to
address the ability to alter the core promote region of this construct.

25
Figure 2.2 Developing and characterizing a UAS1B-Leum hybrid promoter set
Figure 2.2a
Figure 2.2b
26
Figure 2.2 cont.
Figure 2.2c
27
Figure 2.2 cont.
Figure 2.2d

28
Figure 2.2 cont.
(A) A schematic diagram for UAS-enabled hybrid promoter engineering illustrates that these
promoters were created from two distinct parts—the core promoter and upstream activation
sequence (UAS) elements. By inserting tandem copies of UAS upstream to the core promoter,
fine-tuned promoter sets with the strongest expression levels seen in Y. lipolytica were created.
(B) The tandem insertion of 1 to 32 copies of UAS1B sequences upstream of a minimal LEU
promoter enabled construction of the UAS1B1-Leum to UAS1B32-Leum promoters. Error bars
represent standard deviation from biological triplicates. The relative promoter strengths of
UAS1B-Leum promoters were fit to the Hill equation:
resulting in a= 0.794, Hill Coefficient= 3.889, c= 10.146 and r2= 0.9495 using Polymath Software
(Willimantic, CT). (C) Transcriptional profiling of select promoter constructs was used to
calculate mRNA levels relative to the minimal Leum promoter. Expression profiles matched
fluorescence data. Error bars represent standard deviation from biological triplicates. (D)
Endogenous and hybrid promoters were tested with a β-galactosidase reporter gene, yielding
similar results to the hrGFP assay. Error bars represent standard deviation from biological
triplicates.
tCoefficien HilltCoefficien Hill
tCoefficien Hill
UASof #
UASof # a FL)mean min - FLmean (max FLmean min FLMean
c

29
2.3.5 Generalizing the hybrid promoter approach by switching the core promoter
region
As discussed above, a hybrid promoter has two potential independent elements—
activating regions and core promoter region. The data above suggests that tandem UAS
elements may serve as movable, synthetic expression amplifiers for a given promoter.
Next, we sought to test the hypothesis that even native promoters in Y. lipolytica are
enhancer limited and can be strengthened by adding additional UAS elements. To do so,
we constructed new hybrid promoters containing either eight tandem UAS1B sequences
(UAS1B8) or sixteen tandem UAS1B sequences (UAS1B16) inserted 5’ upstream of a
series of different TEF-based core promoters. Specifically, we amplified eight different
regions of the TEF promoter spanning 136 bp and 1004 bp upstream of the ATG starting
site from PO1f (82) genomic DNA (Table 2.1). Included in this set is the consensus 404
bp TEF promoter for Y. lipolytica as well as lengthened and truncated versions of this
promoter. These eight core TEF promoters and their corresponding UAS1B8 and
UAS1B16 hybrid promoters were tested and compared with the Leum, UAS1B8-Leum
and UAS1B16-Leum constructs.
This new series of hybrid promoters was assayed via hrGFP fluorescence by flow
cytometry. In the absence of UAS elements, it can be seen that the fluorescence value
decreases for truncated promoters below the consensus TEF size as expected. Moreover,
the full length (and larger) TEF promoters have more strength than the minimal leucine
promoter (Figure 2.3a). The UAS1B8 and UAS1B16 enhancer fragments in isolation do
not confer any promoter activity (data not shown). When these enhancer fragments were
30
fused with the TEF promoter elements, a substantial increase in the net promoter strength
was seen regardless of the TEF variant utilized. The enhancement provided by UAS1B8
was roughly half the value obtained by using UAS1B16. Moreover, these enhancements
were seen for both more minimal and full length TEF promoter elements, even with the
existence of naturally occurring UAS elements in the consensus and longer TEF
promoters. Thus, this data suggests that even strong endogenous promoters like TEF are
enhancer limited in Y. lipolytica and their expression capacity can be increased through
additional UAS elements.
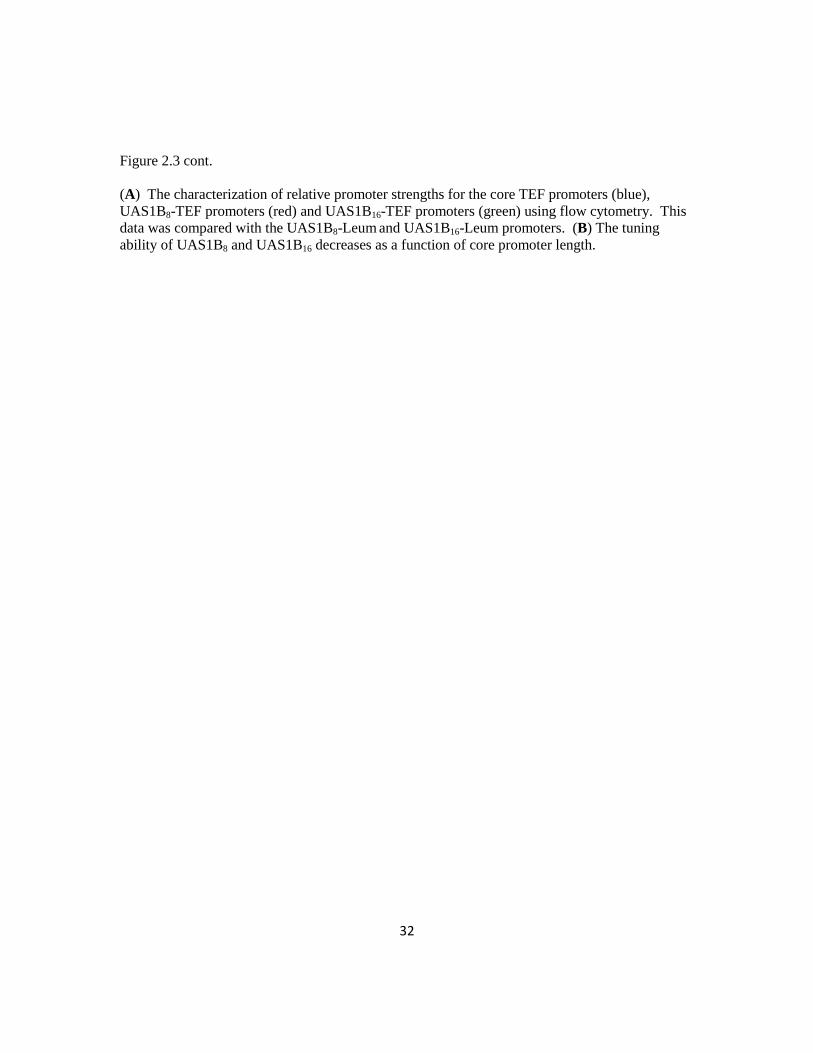
The amplification of expression imparted by the UAS1B8 and UAS1B16 enhancer
elements was not even for all promoters. The fold increase of the constructs relative to
the UAS-free TEF core promoters is plotted in (Figure 2.3b). In general, the largest
improvement is obtained when the UAS elements are placed most closely 5’ of a core
promoter region. This fold improvement trend is rationalized in terms of a mechanism of
proximity and localization of enhancer elements. However, it is interesting to note that
the total promoter size (with 16 activating sequences and a core region) totals upwards of
3 kbp for many of these promoters—a region that is quite large for typical yeast
constructs. In addition, many of these larger constructs were the best performing
promoters. Specifically, nearly all of these promoters proved to be stronger than the
corresponding UAS1B8-Leum and UAS1B16-Leum promoters, demonstrating the fitness
of the TEF-based core promoter regions for strong hybrid promoter engineering. In this
regard, this work demonstrates that tandem UAS elements serve to synthetically amplify
the expression level imparted by the core promoter element chosen.
31
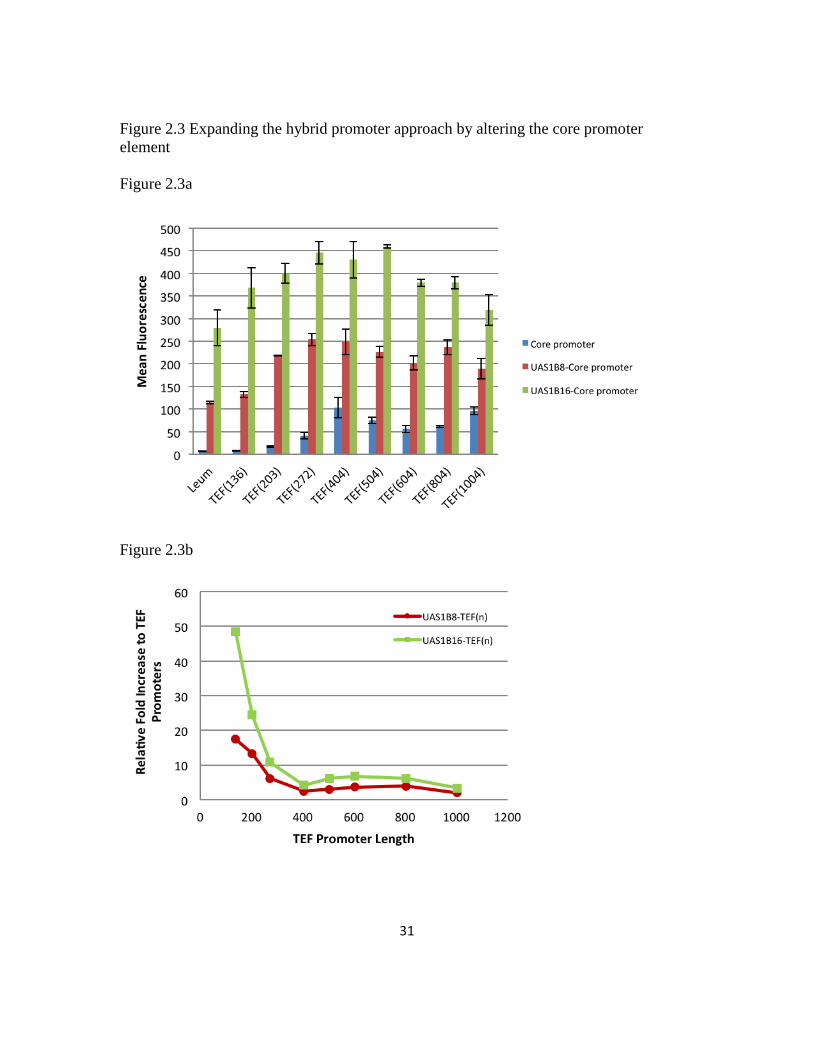
Figure 2.3 Expanding the hybrid promoter approach by altering the core promoter
element
Figure 2.3a
Figure 2.3b
32
Figure 2.3 cont.
(A) The characterization of relative promoter strengths for the core TEF promoters (blue),
UAS1B8-TEF promoters (red) and UAS1B16-TEF promoters (green) using flow cytometry. This
data was compared with the UAS1B8-Leum and UAS1B16-Leum promoters. (B) The tuning
ability of UAS1B8 and UAS1B16 decreases as a function of core promoter length.
33
2.4 Discussion and conclusion
The work presented in this chapter establishes a synthetic approach for tuning
gene expression using a hybrid promoter approach. Moreover, this approach is unique in
its capacity to up-regulate the expression of the baseline starting promoter unlike most
traditional approaches that typically generate promoters of decreased expression. In
doing so, this work created the strongest known promoters in the oleaginous yeast
Yarrowia lipolytica and allows for fine-tuned gene expression in this organism. The
general strategy developed in this chapter employing tandem UAS repeat elements could
potentially be applied to other organisms and further generalized by using other UAS
regions. Finally, these results have the biological implication that the expression capacity
for promoters (at least in Y. lipolytica) is enhancer limited. In this regard, this approach
expands the quantity and quality of parts available for systems biology research (95-96).
Using the hrGFP-enabled single-cell analysis, this work observed bimodal
fluorescence distributions for all the data collected using plasmid based expression.
These results strongly suggest an “on/off” switch mechanism resulting from the low copy
CEN-based plasmid used in the study. It is interesting to note that this bimodal
distribution was absent when using integrated expression cassette instead. As a result,
this work highlights an important consideration for using plasmids in a Y. lipolytica
system. Nevertheless, the hrGFP analysis allowed for a characterization of endogenous Y.
lipolytica promoters and identified EXP and TEF as strong promoters among the set
tested. Furthermore, this analysis led to the creation of several series of promoter
elements capable of high-level expression.
34
The magnitude of these hybrid promoters can be seen by the relative mRNA
range of more than 400 fold between the core promoter (Leum) and the maximum of
UAS1B24-Leum. The strongest UAS1B-Leum hybrid promoter exhibited a more than
eight fold increase in promoter strength in terms of Miller units compared to the strong
endogenous promoters tested in this chapter. It should be noted that the expression of the
UAS1B4-Leum reported here were substantially lower than previously reported. These
comparisons are difficult due to the slight differences in restriction sites used to create
these hybrid promoters, the use of rich media in prior reports, and the use of replicative
plasmids here compared with integrated plasmids in other studies. Even with these
difference and discrepancies, this work still presents up to a fourfold increase in
performance compared with the best reported endogenous promoters or previously
constructed hybrid promoters (82, 97). This illustrates that multiple tandem repeats of
the UAS1B enhancer element activate transcription to levels far stronger than those
previously described and that this enhancer activation can occur at regions more than
2000 nucleotides upstream of the start codon (for UAS1B16-32-Leum).
The UAS1B8 and UAS1B16 elements were shown to behave as synthetic
amplifiers when tested with various TEF-based promoters. In this regard, we
demonstrated that the ability of a UAS1B element to amplify expression is independent
of the core promoter element. However, the magnitude of this amplification was
dependent on the core promoter used. Thus, both the choice of tandem enhancer element
and core promoter element contribute to the collective strength of hybrid promoters. This
observation raises the possibility of rationally designing hybrid promoters with specified

35
expression strength. The drastic increase in expression levels by both of the UAS1B8 and
UAS1B16 elements across this series demonstrates that these genetic elements are
portable, modular components that can generically alleviate native enhancer-limitation
without disrupting endogenous regulation. The modularity of the UAS1B insert and the
strength of the UAS1B-Leum and UAS1B-TEF series advocate the use of hybrid
promoter engineering as generic approach towards building stronger, fine-tuned promoter
libraries with interchangeable, modular components.
Collectively, these results give credence to the theory that Y. lipolytica promoters
are enhancer-limited, and we have shown that this limitation can be effectively overcome
through hybrid promoter engineering. Tandem UAS elements help bypass the enhancer
limited nature of promoters by serving as transcriptional amplifiers. Cells containing the
strong hybrid promoters developed in this chapter did not exhibit any growth defects.
Therefore, transcription factor availability does not seem to be limiting for these cells as
these promoters did not seem to deplete or starve cells of transcription factors. In this
regard, transcription factor binding is posited to serve as a major rate limiting step for
transcription at promoter sites with addition of upstream activating sites alleviating this
limitation. Thus, it is possible for us to control transcriptional activity by indirectly
modulating transcription factor localization or affinity through the choice of enhancer and
core elements in a hybrid promoter.
The generic approach of hybrid promoter engineering described in this chapter is
an important, generic synthetic biology tool enabling the construction of high-level and
fine-tuned promoters with interchangeable promoter parts. This approach is one of the
36
first to rationally amplify the expression output of a given promoter element. By utilizing
this approach, we have expanded the metabolic engineering toolbox in Y. lipolytica and
developed several novel promoter series - UAS1B1-32-Leum, UAS1B8-TEF, and
UAS1B16-TEF. Heterologous protein expression requires strong promoters to obtain
high protein expression level, while metabolic pathway engineering necessitates strictly
controlled, fine-tuned promoters set to optimize pathways. The generic hybrid promoter
approach described here accomplished both of these tasks. Moreover, these results
demonstrate that the expression from Y. lipolytica native promoters is enhancer limited,
which may be a generic phenomenon across other yeast organisms. Finally, given the
results in this chapter, it is possible to conceive of novel combinations of upstream
activation sequences with various promoter elements to achieve both fine-tuned
expression and controlled regulation.
37
Chapter 3: Increasing expression level and copy number of a Yarrowia
lipolytica plasmid through regulated centromere function2
3.1 Chapter summary
Beyond the promoter engineering strategies described in Chapter 2, manipulating
gene expression using different types of plasmids (centromeric, 2-micron, and
autonomously replicating sequence) can expand expression levels and enables a quick
characterization of combinations, both of which are highly desired for metabolic
engineering applications. However, for the powerful potential industrial workhorse
Yarrowia lipolytica, only a low-copy CEN plasmid is available. As presented in this
chapter, we engineered the CEN plasmid from Y. lipolytica by fusing different promoters
upstream of the centromeric region to regulate its function and expand its range. By
doing this, we successfully improved the copy number and gene expression at plasmid
level by 80% and enabled a dynamic range of nearly 2.7 fold. This improvement was
seen to be independent from both the promoter and gene used in the expression cassette.
These results present a better starting point for more potent plasmids in Y. lipolytica.
2 Portion of this chapter has been published previously in FEMS Yeast Research 14(7), 1124-1127 with LL, PO, AP, HA designed
and carried the experiments

38
3.2 Introduction
The ability to tune gene expression is essential for the success of metabolic
engineering efforts. To this end, previous work including endogenous promoter
characterization (98), hybrid promoter engineering as described in Chapter 2, and multi-
copy integration (99) have increased the capacity to engineer Yarrowia lipolytica.
However, this tuning capacity has not been matched at the plasmid level, a convenience
that would enable quick characterization of genetic constructs through a simple
transformation and also a tool that can enable fundamental studies of replication and
segregation (100).
In the widely used baker’s yeast Saccharomyces cerevisiae, plasmid-based gene
expression control is enabled by several varieties of plasmids including centromeric
(CEN) plasmids (low copy), 2-micron plasmids (high copy), and autonomously
replicating sequence (ARS) plasmids (high copy) (19-21). However, for the case of Y.
lipolytica, a suitable 2-micron has not been identified and the CEN and ARS elements
cannot be separated (68, 72, 85) leaving only low copy CEN-based plasmids. In S.
cerevisiae, it has been reported that a CEN plasmid can be converted into an ARS-like
plasmid by fusing a promoter upstream of the centromeric region leading to increase in
copy number and gene expression (101). In the work presented in this chapter, we sought
to invoke a similar strategy for a Y. lipolytica CEN plasmid to both increase copy number
and expression level (Figure 3.1a).
3.3 Results
39
To accomplish this task, we first selected various endogenous promoters and
synthetic variants (P-GPD, P-EXP, P-POT1, P-MET2, P-TEF and truncated P-TEF: P-
TEF(272) and P-TEF(136) with 272 bp and 136 bp upstream of the ATG starting site (98,
102-103) as well as two cell-cycle dependent promoters (P-CDC2 and P-YOX1) to
regulate the centromere function in Y. lipolytica (all promoters were amplified with 50bp
from the coding region). Previous studies in S. cerevisiae suggested CDC2 and YOX1
exhibit cell-cycle dependent expression patterns and express in G1-phase and mid G1 to
early S phase respectively (104-106). Whereas the promoter fused to the CEN region was
altered in each plasmid, each construct contained a strong hybrid promoter (P-UAS1B16-
Leum) upstream of hrGFP, a green fluorescence protein. Through the use of flow
cytometry, we found that altering the promoter upstream of the centromere region in Y.
lipolytica leads to similar phenotype found in S. cerevisiae. As a result, it was possible to
alter the expression level via regulated centromere function (Figure 3.1b). For the case of
P-TEF(272), P-CDC2, P-POT1 and P-EXP based engineered plasmid, fluorescence was
increased by at least 50% compared to the control plasmid construct and up to 80% for
the case of P-TEF(272). Interestingly, the P-MET2 promoter upstream of the CEN region
resulted in a decreased expression by 30%. Collectively, a nearly 2.7 fold dynamic range
was achievable through this strategy.
Next, we replaced the hrGFP gene with a β-galactosidase reporter gene for two of
the plasmids (containing the promoters P-POT1 and P-CDC2 upstream of CEN) to test
the generalizability of this approach. Both plasmids showed a similar improvement of
40
roughly 50% in the β-galactosidase activity as seen with the hrGFP (Figure 3.1c). In
addition, the increase in expression is preserved when a lower strength native promoter
(P-EXP) is used to drive the expression of β-galactosidase, thus indicating that the
approach is independent of reporter protein and promoter driving the expression cassette
(Figure 3.1d).
To confirm that the increased protein expression level was the result of increases
in plasmid copy number, we employed a relative copy number assay based on RT-PCR
using a total genomic DNA extract (19, 107). The copy number in the augmented
plasmids was found to be increased by roughly 80% compared to the initial plasmid
construct (Figure 3.1c). Thus, these engineering efforts successfully increased the copy
number as well as the expression level from Y. lipolytica plasmids.
One commonly observed feature of these Y. lipolytica plasmids is a bimodal
distribution of fluorescence signal as mentioned in Chapter 2 (103). The improvement in
expression seen in this chapter was the cumulative result of both an increase in the signal
as well as a mild increase of the size of the positive subpopulation (Figure 3.1e). In an
effort to further understand this bimodal phenotype, we separated the positive and
negative subpopulations through cell sorting and cultivated the sorted populations.
Whereas the positive population reverted back to the bimodal distribution, the negative
population was unable to be grown in selective growth conditions. This data suggests a
biased plasmid segregation occurs in Y. lipolytica CEN-based plasmids which can be
attributed to the nature of the plasmid as well as the size (about 9.5kb).
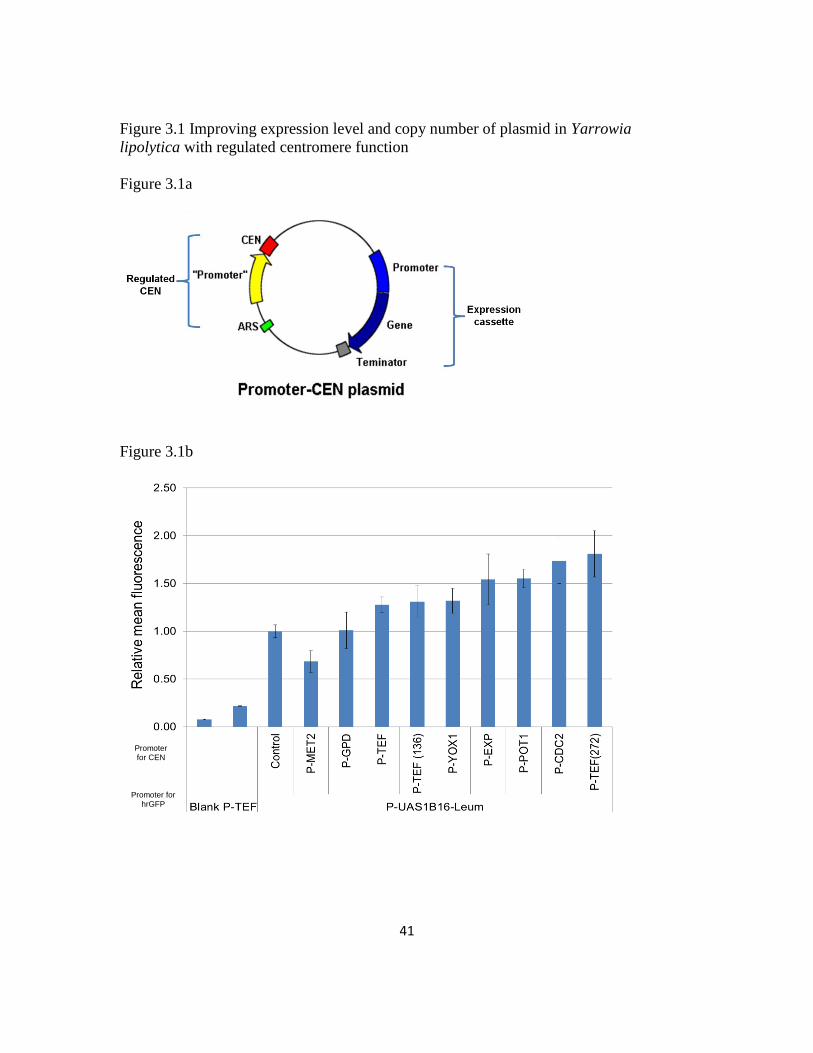
41
Figure 3.1 Improving expression level and copy number of plasmid in Yarrowia
lipolytica with regulated centromere function
Figure 3.1a
Figure 3.1b
Promoter for CEN
Promoter for hrGFP
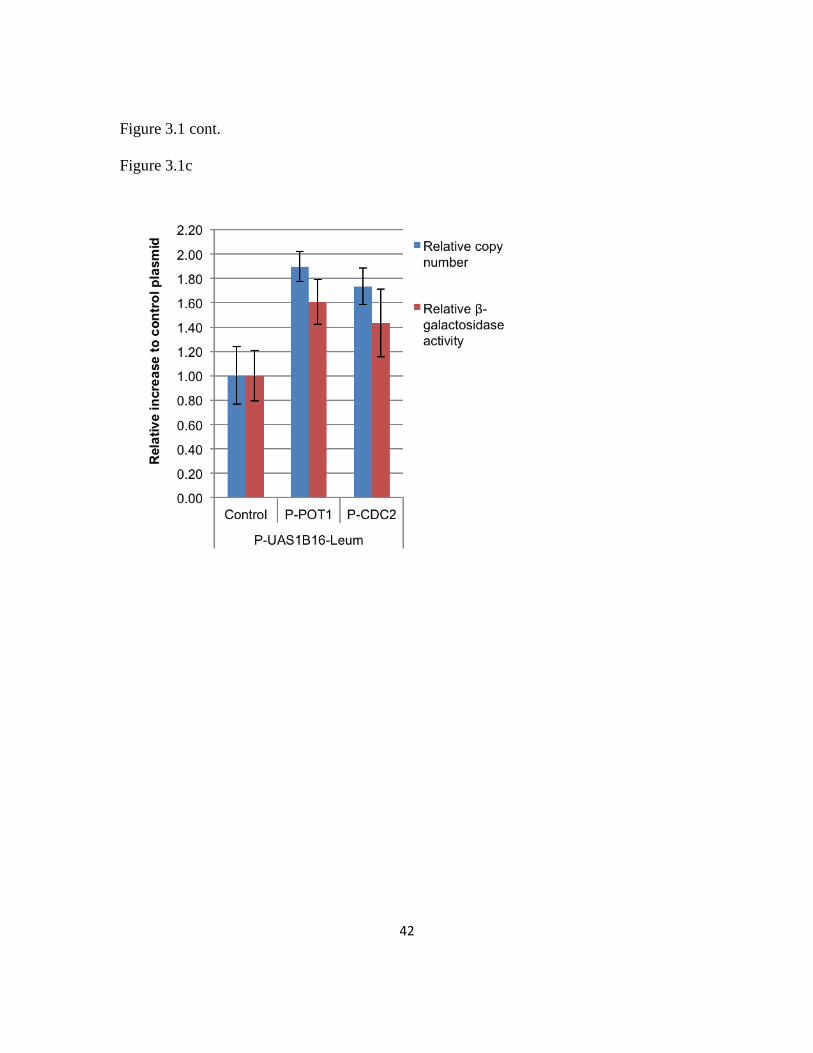
42
Figure 3.1 cont.
Figure 3.1c
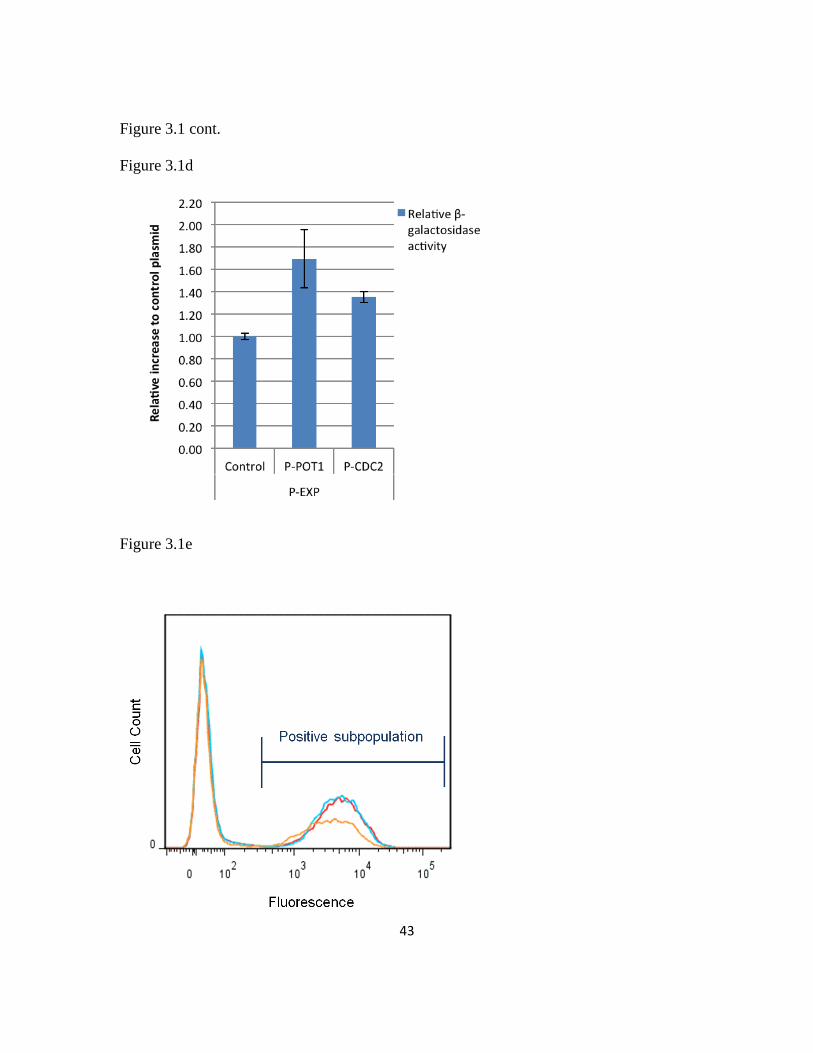
43
Figure 3.1 cont.
Figure 3.1d
Figure 3.1e

44
Figure 3.1 cont.
(A) A schematic of the engineered plasmids with regulated centromere function. (B) Promoters,
including P-MET2, P-GPD, P-TEF, P-TEF(136), P-YOX1, P-EXP, P-POT1, P-CDC2, P-
TEF(272), were used to regulate centromere function. Mean fluorescence data collected by flow
cytometry analysis was used to compare expression at a time point of 48 h in minimal medium.
(C) Relative plasmid copy number and β-galactosidase activity with P-POT1 and P-CDC2 based
engineered plasmid and control plasmid with P-UAS1B16-Leum driving expression of β-
galactosidase. The data was collected by RT-PCR and Gal-Screen™ β-Galactosidase Reporter
Gene Assay System for Yeast or Mammalian Cells (life technologies) at a time point of 48 h in
minimal medium. (D) Relative β-galactosidase activity with P-POT1 and P-CDC2 based
engineered plasmids and control plasmid with promoter P-EXP driving expression of β-
galactosidase. The data was collected by Gal-Screen™ β-Galactosidase Reporter Gene Assay
System for Yeast or Mammalian Cells (life technologies) at a time point of 48 h in minimal
medium. (E) Histogram of fluorescence signal showing the bimodal distribution with P-POT1
(blue), P-EXP (red) based engineered plasmids with the control plasmid (yellow). The data was
collected by flow cytometry analysis to compare P-POT1, P-EXP based engineered plasmids with
the control plasmid at a time point of 48h in minimal medium: P-POT1 based plasmid contains
46.1%, P-EXP based plasmid contains 46.2% and the control plasmid contains 36.6% positive
subpopulations. The graph was made using FlowJo software (Tree Star Inc., Ashland, OR). In all
graphs, error bars represent standard deviations from biological replicates.

45
3.4 Discussion and conclusion
From the data presented in this chapter, the improvements in expression and copy
number at the plasmid level are highly dependent on the characteristics of the promoters
repressing centromere function. Both of the strength and the expression pattern of the
promoters affect the turning ability with the engineered plasmids. For instance, the
decreased signal with promoter MET2 based plasmid could be resulted from the
expression pattern of MET2 is not in favor of plasmid stability. The different expression
levels exhibited with plasmids of constitutive promoter EXP, GPD and TEF series could
be due to different strengths possessed by different promoters. Moreover, the increase of
both positive population and mean fluorescence suggested a more stable plasmid
behavior in the engineered plasmids. This stability could be a result of increased copy
number inside the cells. The tuning ability achieved through this plasmid engineering
strategy can largely facilitate the metabolic engineering and microbiological studies in Y.
lipolyitica, since it supplies an opportunity to alter the gene expression level without
changing genetic components such as promoter and terminator, thus, enables the
preservation of native regulation pattern. In this chapter, we reported the improvement in
expression level and copy number at the plasmid level in Y. lipolytica through altering its
centromere function. These efforts resulted in over 80% improvement of plasmid copy
number and expression and also enabled a dynamic range of nearly 2.7 fold. This
improvement was seen to be independent of both the promoter and gene in the expression
cassette. Although the improvement is significantly less comparing with other expression
tuning strategies such as hybrid promoter engineering in this yeast (Chapter 2), the
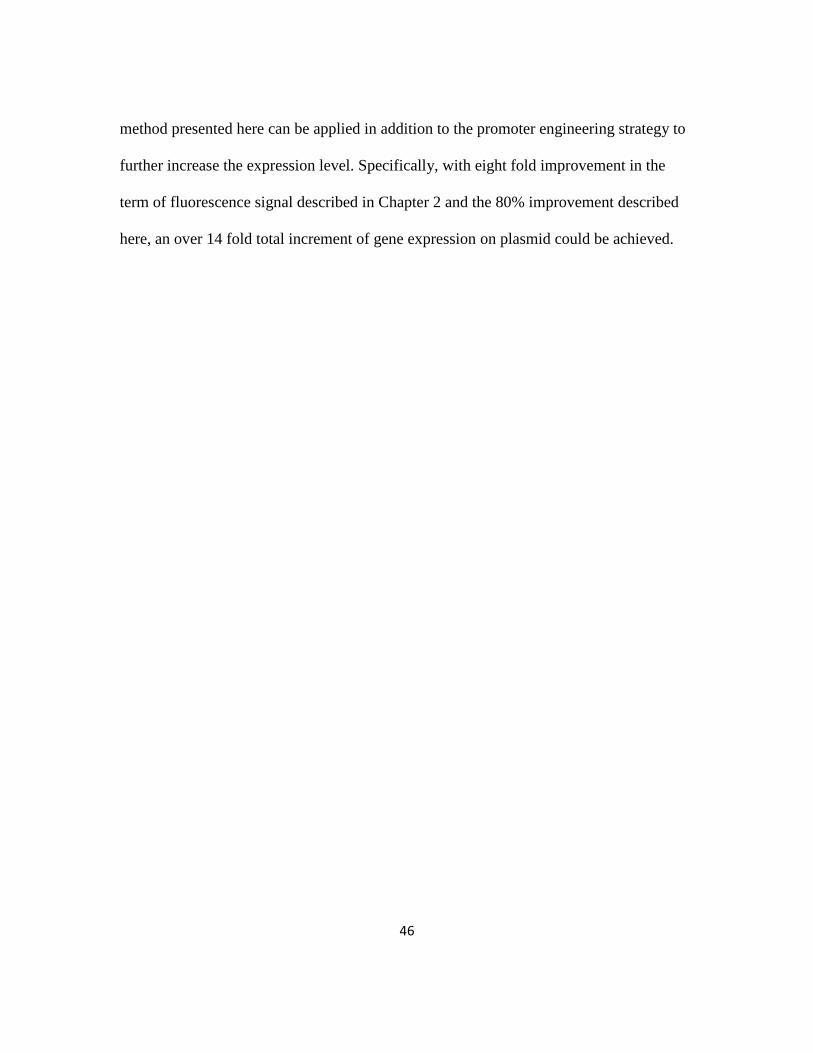
46
method presented here can be applied in addition to the promoter engineering strategy to
further increase the expression level. Specifically, with eight fold improvement in the
term of fluorescence signal described in Chapter 2 and the 80% improvement described
here, an over 14 fold total increment of gene expression on plasmid could be achieved.
47
Chapter 4: Rational metabolic engineering Yarrowia lipolytica for high
lipid production3
4.1 Chapter summary
Economic feasibility of biosynthetic fuel and chemical production hinges upon
harnessing metabolism to achieve high titer and yield. Once we gained the ability of
manipulating gene expression in Yarrowia lipolytica as described in Chapters 2 and 3.
We performed a thorough genotypic and phenotypic optimization of an oleaginous
organism to create a strain with significant lipogenesis capability based on rational
combinatorial metabolic engineering strategies described in this chapter. Specifically, we
rewire Y. lipolytica’s native metabolism for superior de novo lipogenesis by coupling
combinatorial multiplexing of lipogenesis targets with phenotypic induction. We further
complete direct conversion of lipid content into biodiesel. Tri-level metabolic control
results in saturated cells containing upwards of 90% lipid content and titers exceeding 25
g/L lipids, a 60-fold improvement over parental strain and conditions. Through this
rewiring effort, we advance fundamental understanding of lipogenesis, demonstrate
noncanonical environmental and intracellular stimuli, and uncouple lipogenesis from
nitrogen starvation. The high titers and carbon-source independent nature of this
lipogenesis in Y. lipolytica in this chapter highlight the potential of this organism as a
platform for efficient oleochemical production.
3 Portion of this chapter has been published previously in Nature Comm 5:3131 with JB, LL, HA designed the experiments, JB, AH,
LL, RK, JM, AP, PO carried the experiments and JB, HA wrote the manuscript.
48
4.2 Introduction
Microbial biosynthesis of fuels (such as ethanol and biodiesel) and industrial
chemical precursors provides a renewable means to reduce dependence on petroleum
feedstock (3, 5, 108-110). In particular, bio-based production of oils and lipids provides
a unique platform for the sustainable production of biodiesel and other important
oleochemicals (46, 110). Most efforts for developing such a platform involve either
rewiring E. coli or cultivating cyanobacteria. These attempts suffer from low titers (less
than 7 g/L) and variable lipid content (ranging between 10 and 87%), with the highest of
these levels typically occurring in non-tractable, slow growing hosts cultivated in oil
containing media (i.e., ex novo lipid incorporation instead of de novo lipogenesis) (51,
108, 110-114).
As an alternative, several groups have explored oleaginous organisms such as the
fungus Yarrowia lipolytica, but total oil content and titers are still limited (23, 55, 57, 76,
115-116). Yet, the genetic tractability of Y. lipolytica (9, 65, 68, 70, 74, 102-103)
coupled with its modest, innate de novo lipogenesis (~10-15% lipid content in wildtype
(23, 55-56, 117-118)) make it a potential candidate as a platform organism for superior
lipid production.
Lipid biosynthesis is primarily initiated by the activity of four enzymes - AMP
Deaminase (AMPD), ATP-Citrate Lyase (ACL), Malic Enzyme (MAE) and Acetyl-CoA
Carboxylase (ACC) - that cooperatively divert carbon flux from central carbon
metabolism towards fatty acid precursors (56, 76). AMPD inhibits citric acid cycle flux
to promote the accumulation of citrate, which is then cleaved into acetyl-CoA by ACL.

49
Fatty acid synthesis is further encouraged by carboxylation of acetyl-CoA to malonyl-
CoA fatty acid building blocks by ACC and by an increased NADPH supply generated
by MAE or the pentose phosphate pathway (56, 76, 119) (Figure 4.1a). Leucine
biosynthetic capacity has also been implicated as an effector of lipogenic ability in
oleaginous organisms (117, 120), and a putative acetyl-CoA generating leucine
degradation pathway was recently identified through a comparative genomics analysis of
non-oleaginous and oleaginous yeast strains (121). In this regard, Y. lipolytica also
possesses homologs for every enzyme and enzymatic subunit necessary for acetyl-CoA
generation through isoleucine degradation (>45% similarity to Homo sapiens enzymes)
(66, 122). Previous efforts to increase lipid accumulation have shown promise in Y.
lipolytica. In particular, deletion of β-oxidation enzymes coupled with enhancing
glycerol synthesis substantially increased ex novo lipid accumulation (56, 76), and
deletion of the pex10 peroxisomal biogenesis gene greatly increased eicosapentaenoic
acid yields (24). However, these studies have been limited by their breadth of metabolic
control and their comprehensiveness of genotypic and phenotypic sampling towards
complete redirection of metabolic flux towards lipid accumulation (23, 55, 76, 117).
Moreover, de novo lipid content in this organism has been limited to below around 60%
by dry cell weight (23).
In the work presented here, we undertake a large scale engineering effort -
multiplexing genomic engineering of lipogenesis targets with phenotypic induction - and
create a Y. lipolytica strain with significantly improved lipogenesis capability.
Simultaneous perturbation of five lipogenic targets (affecting three disparate metabolic
50
pathways) results in lipid-saturated cells, culminating in the highest reported lipid content
(~90%) and lipid titer (25.3 g/L). The latter milestone represents a more than 60-fold
improvement over parental strain and conditions. Through this rewiring effort, we
describe several non-canonical facets of lipogenesis, including that lipogenesis is
dependent on absolute environmental carbon content, that rare odd-chain fatty acids
pathways are naturally activated by high lipogenesis, that lipid accumulation phenotypes
are dependent on leucine-mediated signaling, and that high lipogenesis can be un-coupled
from nitrogen starvation and entails a reduction in citric acid cycling. We further
demonstrate that these lipids can be easily converted into FAMEs (fatty acid methyl
esters) suitable for biodiesel. This work demonstrates, and capitalizes upon, the lipogenic
potential of Y. lipolytica, utilizing its amenable metabolism to realize high titers and
carbon-source independent lipid accumulation.
4.3 Results
4.3.1 Combinatorial genomic rewiring for improved lipogenesis
In this work, we investigate a combinatorial, multiplexing of targets spanning
fatty acid, lipid, and central metabolism through the overexpression of five lipogenesis
enzymes in four genomic backgrounds marked by differential fatty acid catabolic
capacity (Table 4.1, Figure 4.1a). Specifically, AMPDp, ACLp, and MAEp
overexpression were investigated for their potential to increase acetyl-CoA and NADPH
supply (ACCp overexpression has not been reported to significantly improve lipogenesis
and was excluded (23)) and DGA1 and DGA2p (acyl-CoA:diacylglycerol
51
acyltransferases isozymes I and II) were included for their potential in catalyzing the
ultimate step in triglyceride synthesis (123). These overexpression targets were
multiplexed with deletions that served to reduce fatty acid catabolism by reducing one or
both of β–oxidation (via mfe1 deletion) (55, 76) and peroxisome biogenesis (via pex10
deletion) (117, 124) (Table 4.1). We have previously demonstrated that restoration of a
complete leucine biosynthetic pathway increased lipid accumulation more than
alleviation of uracil auxotrophy in a PO1f base strain (117). Thus, we included the
complementing of leucine and uracil biosynthetic capacity both singly and in tandem as
targets for this multiplexing. Integrated expression cassettes were driven by our high
strength synthetic UAS1B16-TEF constitutive hybrid promoter developed in Chapter 2.
Collectively, the combinatorial multiplexing of enzyme overexpressions, fatty-acid
inhibition knockouts, and other biosynthetic pathways resulted in 57 distinct genotypes
that were analyzed for lipogenesis capacity compared to the wild-type strain (Figure
4.1b). Initially, a Nile Red based fluorescence assay coupled with flow cytometry (125)
was used to efficiently determine relative lipid content and assess critical genotype
synergies. Across the resulting lipogenesis metabolic landscape, we observed a
significant range in lipid accumulation that spanned a 74-fold improvement in
fluorescence over unmodified Y. lipolytica PO1f (Figure 4.1b). Using fluorescence
microscopy, it is evident that cells become larger and visibly more saturated with lipid
content across the resulting lipogenic continuum in this landscape (Figure 4.1c).
Three dominant genetic targets exhibited cooperativity towards enhancing
lipogenesis—pex10 deletion, DGA1 or DGA2 overexpression, and restoration of a
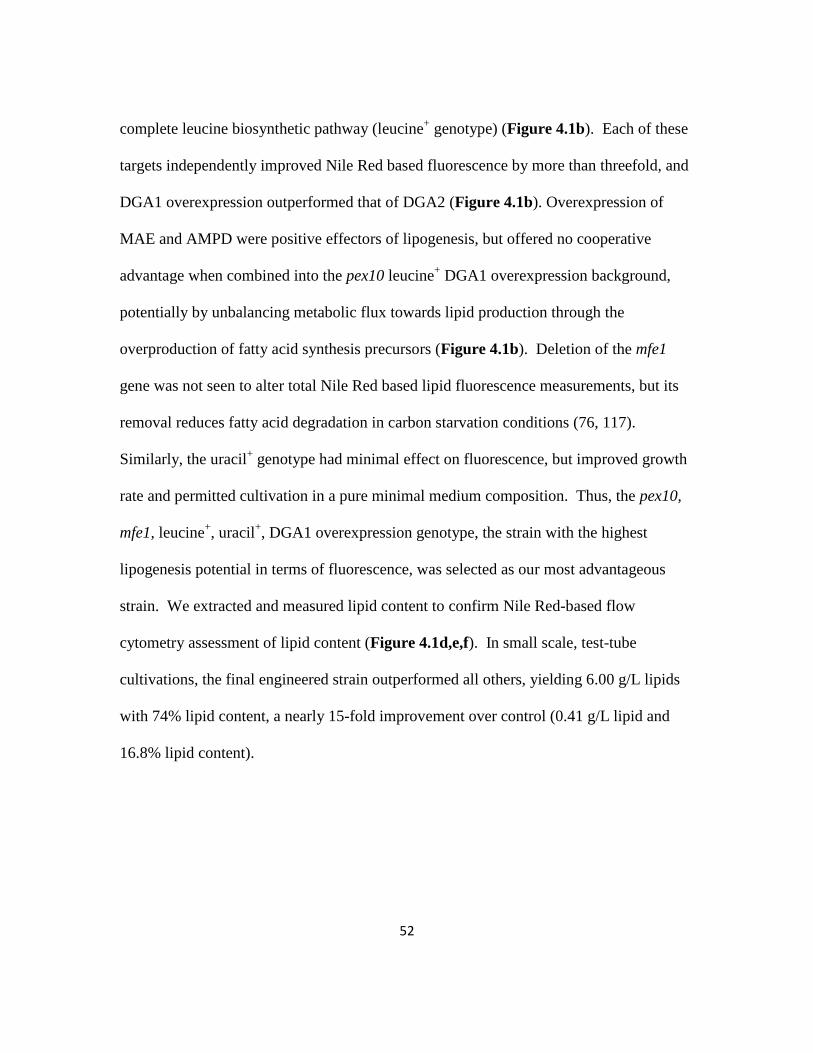
52
complete leucine biosynthetic pathway (leucine+ genotype) (Figure 4.1b). Each of these
targets independently improved Nile Red based fluorescence by more than threefold, and
DGA1 overexpression outperformed that of DGA2 (Figure 4.1b). Overexpression of
MAE and AMPD were positive effectors of lipogenesis, but offered no cooperative
advantage when combined into the pex10 leucine+ DGA1 overexpression background,
potentially by unbalancing metabolic flux towards lipid production through the
overproduction of fatty acid synthesis precursors (Figure 4.1b). Deletion of the mfe1
gene was not seen to alter total Nile Red based lipid fluorescence measurements, but its
removal reduces fatty acid degradation in carbon starvation conditions (76, 117).
Similarly, the uracil+ genotype had minimal effect on fluorescence, but improved growth
rate and permitted cultivation in a pure minimal medium composition. Thus, the pex10,
mfe1, leucine+, uracil
+, DGA1 overexpression genotype, the strain with the highest
lipogenesis potential in terms of fluorescence, was selected as our most advantageous
strain. We extracted and measured lipid content to confirm Nile Red-based flow
cytometry assessment of lipid content (Figure 4.1d,e,f). In small scale, test-tube
cultivations, the final engineered strain outperformed all others, yielding 6.00 g/L lipids
with 74% lipid content, a nearly 15-fold improvement over control (0.41 g/L lipid and
16.8% lipid content).
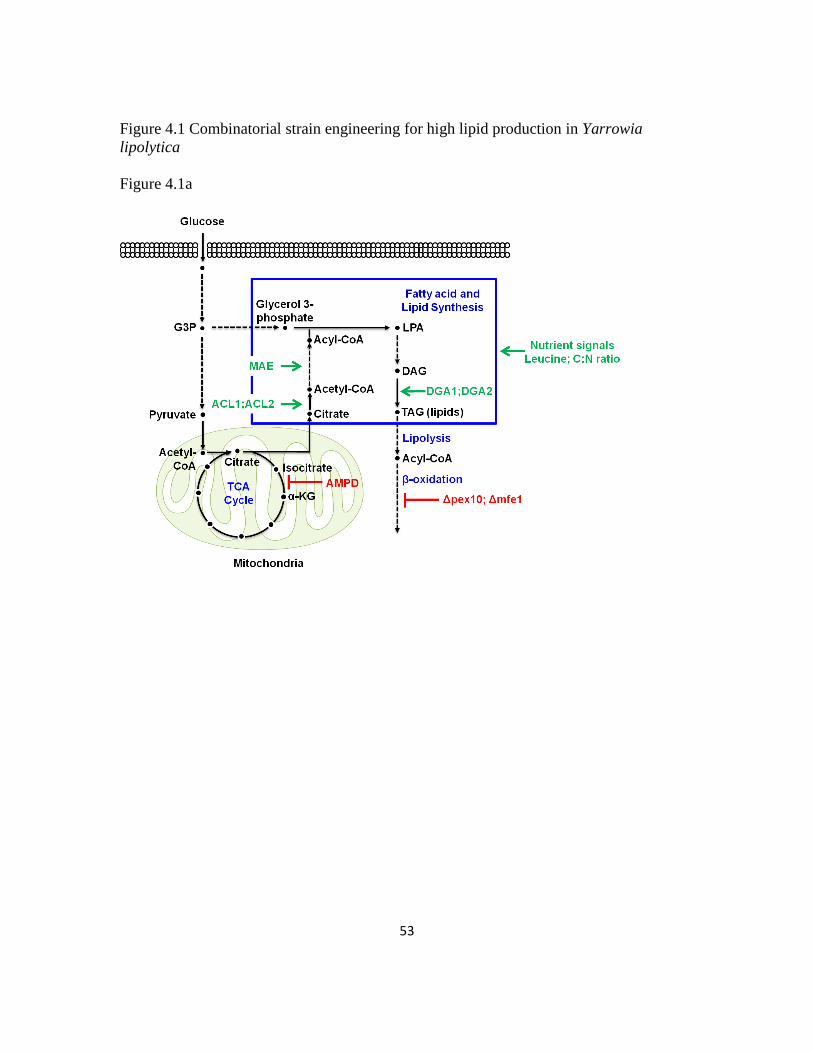
53
Figure 4.1 Combinatorial strain engineering for high lipid production in Yarrowia
lipolytica
Figure 4.1a
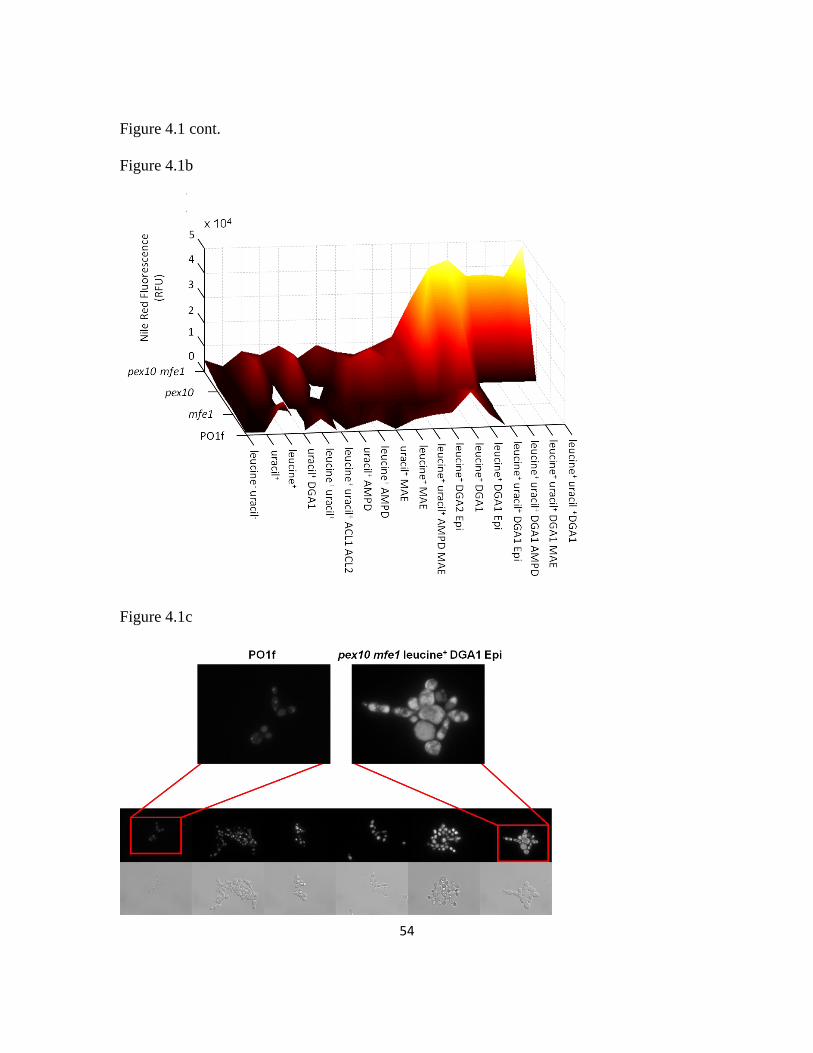
54
Figure 4.1 cont.
Figure 4.1b
Figure 4.1c
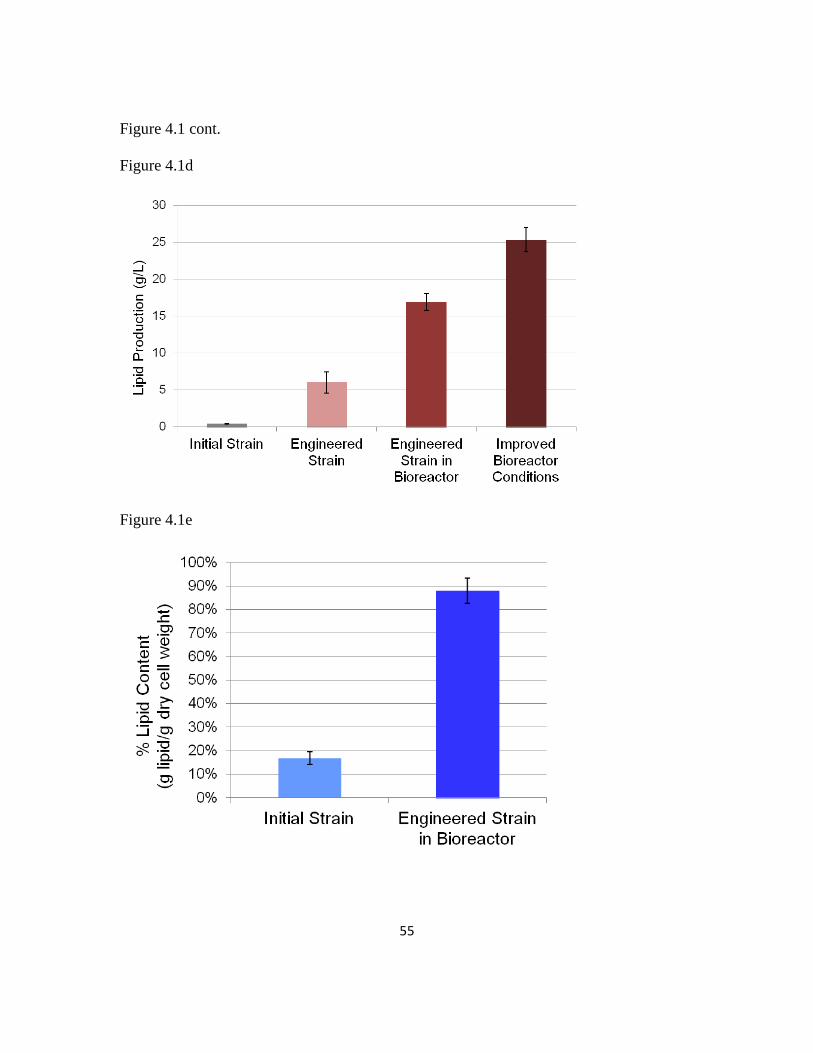
55
Figure 4.1 cont.
Figure 4.1d
Figure 4.1e
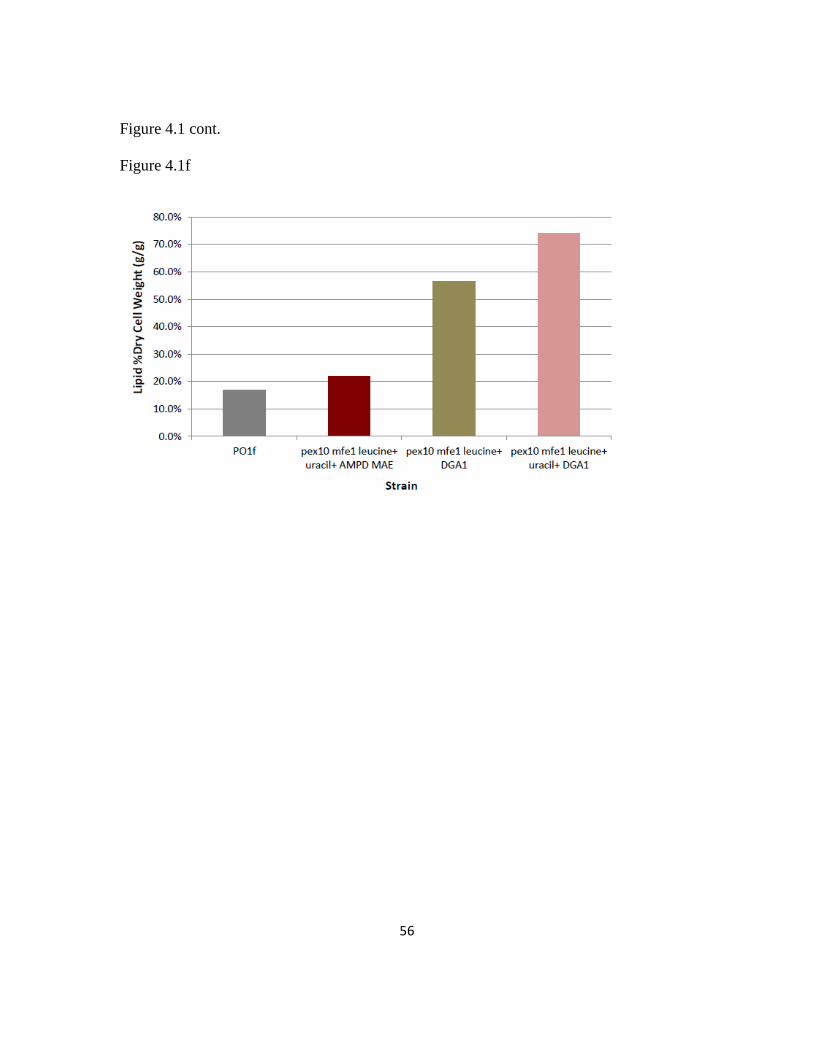
56
Figure 4.1 cont.
Figure 4.1f
57
Figure 4.1 cont.
(A) A schematic illustrating the pathways rewired in Y. lipolytica’s metabolism to drastically
increase lipogenesis capacity. (B) Nile Red fluorescence analysis of the strains constructed in
this chapter. Strain names include strain background (POlf, pex10, mfe1, pex10 mfe1),
auxotrophies relieved (leucine+ or uracil
+), and enzymes overexpressed. “Epi” denotes episomal
overexpressions. Lipogenesis is induced as pex10 deletion is coupled with leucine biosynthetic
capacity and DGA1 overexpression – generally from front left to back right of the 3D contour
heat map representation. Error bars represent the standard deviation of technical triplicates.(C)
Fluorescence light microscopy images of six strains increasing in lipid content (white) from left
(unmodified POlf) to right (pex10 mfe1 leucine+ DGA1). (D, E) Increases in lipid titer and lipid
content realized by engineering POlf to create the pex10 mfe1 leucine+ uracil
+ DGA1 strain and
then optimizing fermentation conditions in a bioreactor. Error bars represent standard deviations
of technical triplicates. (F) Four strains were analyzed for percent lipid content (g lipids/g dry
cell weight) after cultivation in 80 g/L glucose, 6.7 g/L Yeast Nitrogen Base w/o amino acids
(1.365 g/L ammonium), and 0.79 g/L CSM supplement – POlf, pex10 mfe1 leucine+ uracil
+
AMPD MAE, pex10 mfe1 leucine+ DGA1, and pex10 mfe1 leucine
+ uracil
+ DGA1. The pex10
mfe1 leucine+ uracil
+ DGA1 strain yielded the highest percentage lipid content (74%), a more
than 4-fold improvement over PO1f control (16.8% lipid content).
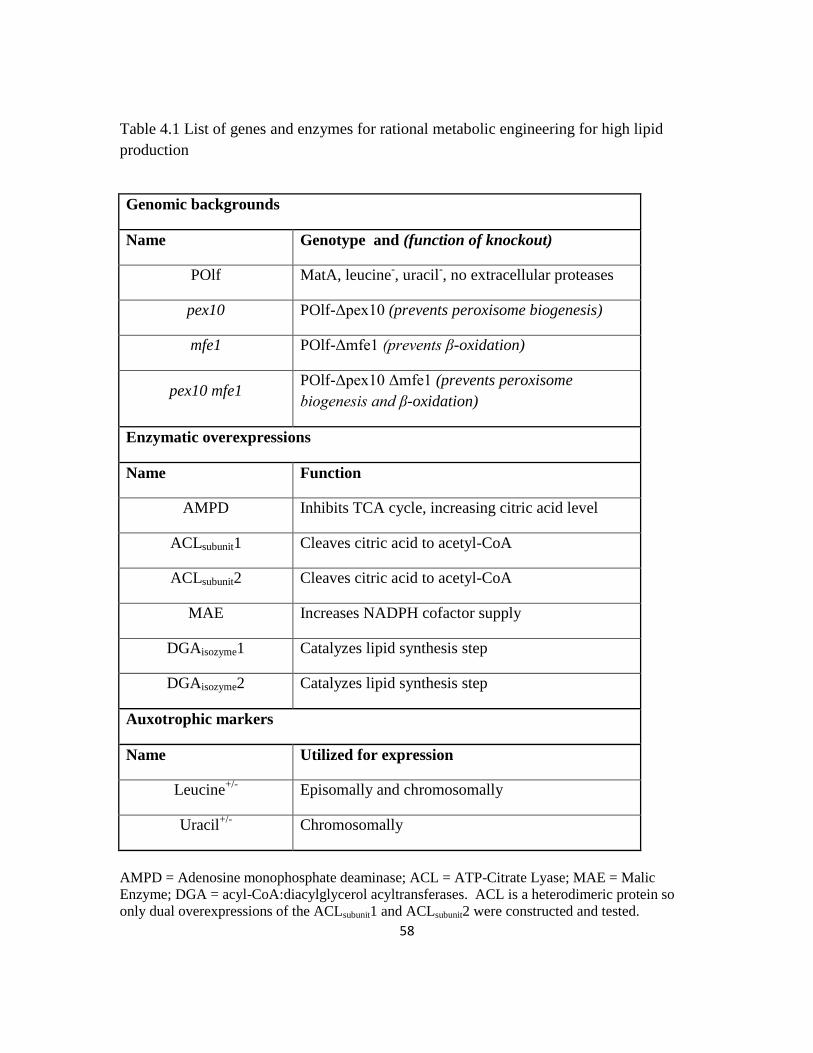
58
Table 4.1 List of genes and enzymes for rational metabolic engineering for high lipid
production
Genomic backgrounds
Name Genotype and (function of knockout)
POlf MatA, leucine-, uracil
-, no extracellular proteases
pex10 POlf-Δpex10 (prevents peroxisome biogenesis)
mfe1 POlf-Δmfe1 (prevents β-oxidation)
pex10 mfe1 POlf-Δpex10 Δmfe1 (prevents peroxisome
biogenesis and β-oxidation)
Enzymatic overexpressions
Name Function
AMPD Inhibits TCA cycle, increasing citric acid level
ACLsubunit1 Cleaves citric acid to acetyl-CoA
ACLsubunit2 Cleaves citric acid to acetyl-CoA
MAE Increases NADPH cofactor supply
DGAisozyme1 Catalyzes lipid synthesis step
DGAisozyme2 Catalyzes lipid synthesis step
Auxotrophic markers
Name Utilized for expression
Leucine+/-
Episomally and chromosomally
Uracil+/-
Chromosomally
AMPD = Adenosine monophosphate deaminase; ACL = ATP-Citrate Lyase; MAE = Malic
Enzyme; DGA = acyl-CoA:diacylglycerol acyltransferases. ACL is a heterodimeric protein so
only dual overexpressions of the ACLsubunit1 and ACLsubunit2 were constructed and tested.
59
4.3.2 Lipogenic induction through nutrient level optimization
We next sought to understand the complex relationship between de novo lipid
accumulation and nutrient levels. Previous studies generally accepted that lipogenesis
capacity is highly dependent on the ratio of available carbon and nitrogen (C:N ratio) and
that lipogenesis induction requires a nitrogen starvation mechanism (118, 126).
However, no definitive, quantitative relationship between genotype and lipogenesis
induction has been determined. Thus, we analyzed the effect of nitrogen starvation and
carbon availability on lipogenesis for unmodified Y. lipolytica PO1f and eleven
engineered strains spanning the lipogenesis landscape. Cultivation of these twelve strains
in thirteen media formulations containing between 10 g/L and 160 g/L glucose and 0.055
g/L and 1.365 g/L ammonium revealed that absolute glucose level, rather than generally
accepted C:N ratio, is crucial towards inducing lipid synthesis, and high lipid producers
realized optimal accumulation in higher glucose media (Figure 4.2). In particular,
unmodified Y. lipolytica PO1f and other low performing strains were most strongly
induced by a lower carbon level (20 g/L glucose and 0.273 g/L ammonium), but
responded poorly at similar C:N ratios with higher glucose and ammonium
concentrations (Figure 4.2a). Moderate lipid accumulators were highly induced at
intermediate glucose levels but again responded poorly at similar C:N ratios (Figure
4.2b). The highest accumulators, including the pex10 mfe1 leucine+ DGA1
overexpression genotype, were induced most intensely by higher levels of carbon and
nitrogen (80 g/L glucose and 1.365 g/L ammonium) (Figure 4.2c). Thus, the current
paradigm asserting the necessity of nitrogen starvation and that similar C:N ratios beget
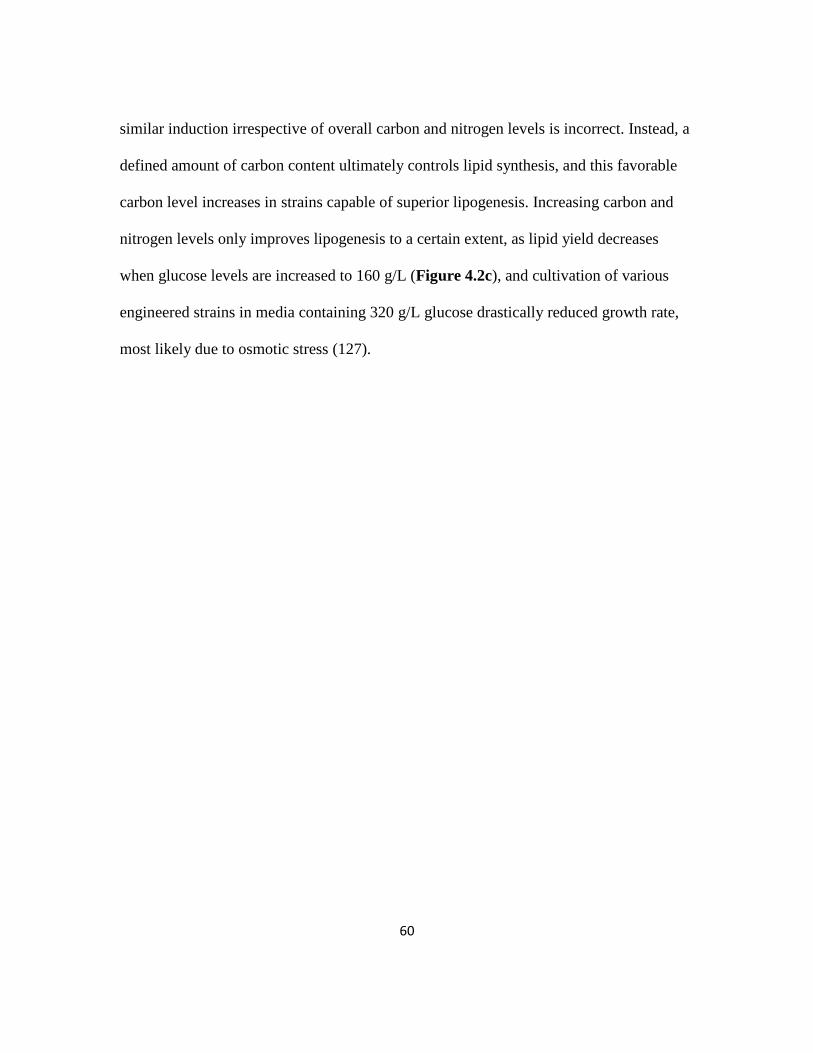
60
similar induction irrespective of overall carbon and nitrogen levels is incorrect. Instead, a
defined amount of carbon content ultimately controls lipid synthesis, and this favorable
carbon level increases in strains capable of superior lipogenesis. Increasing carbon and
nitrogen levels only improves lipogenesis to a certain extent, as lipid yield decreases
when glucose levels are increased to 160 g/L (Figure 4.2c), and cultivation of various
engineered strains in media containing 320 g/L glucose drastically reduced growth rate,
most likely due to osmotic stress (127).
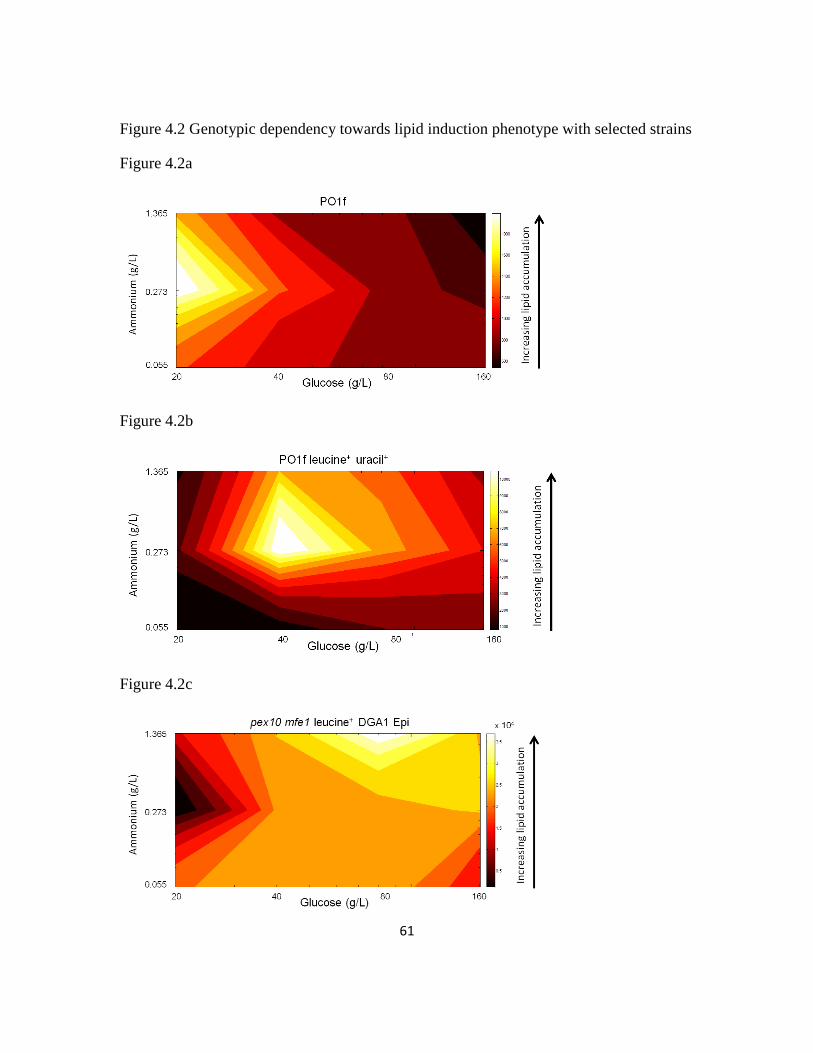
61
Figure 4.2 Genotypic dependency towards lipid induction phenotype with selected strains
Figure 4.2a
Figure 4.2b
Figure 4.2c

62
Figure 4.2 cont.
Heat maps of Nile Red stained lipid fluorescence for the (A) POlf low lipid accumulating strain,
(B) POlf leucine+ uracil
+ moderate lipid accumulating strain, and (C) pex10 mfe1 leucine
+ DGA1
high lipid accumulating strain demonstrate a decoupling of lipogenesis and nitrogen starvation as
well as the implication of absolute carbon content as a lipogenesis effector. Fluorescence data is
shown for each strain after cultivation and staining in twelve media formulations containing
between 20 g/L and 160 g/L glucose and 0.055 g/L and 1.365 g/L ammonium. Lipogenesis is
dependent on absolute environmental carbon content, and low lipid accumulators (A) require less
carbon for optimal lipogenic induction than moderate (B) or high (C) lipid accumulating strains.
In highly lipogenic strains (C), high lipogenesis is un-coupled from nitrogen starvation. These
studies were conducted with technical duplicates.
63
4.3.3 Controlled fermentation enables superior lipogenesis
Taken together, these dominant lipogenesis targets and nutrient levels
(specifically, 80 g/L glucose and 1.365 g/L ammonium) enabled an optimization of
fermentation conditions for the pex10 mfe1 leucine+ uracil
+ DGA1 overexpression strain
to maximize lipid accumulation in a bioreactor setting. We cultivated this fully
prototrophic strain in an inexpensive minimal media formulation consisting of only
glucose, ammonium sulfate, and yeast nitrogen base. By additionally controlling pH,
temperature, and dissolved oxygen levels, we observed significantly improved lipid titer
to 16.1 g/L with cells containing up to 88% lipid cellular content (Figure 4.3a). This
represents a 5.4 fold increase over a POlf leucine+ uracil
+ control and 63% of the
theoretical stoichiometric yield with a specific productivity approaching 0.2 g/L hr-1
(Figure 4.3). Lipogenesis continues in the engineered strain throughout the six day
fermentation despite complete depletion of glucose and cessation of biomass production
within three days (Figure 4.3a). Moreover, this engineered strain exhibits reduced citric
acid and biomass production to enable heightened flux towards lipid synthesis (Figure
4.3a,c). In contrast, excess carbon flux in the control strain accumulates as citric acid
(dispersed throughout the supernatant) before reabsorption and incorporation into
biomass (Figure 4.3c). Thus, the engineered strain’s metabolic processes are in stark
contrast to a central tenet of lipid accumulation in oleaginous organisms – that lipid
accumulation requires prior production of citric acid (128-130). We hypothesize that our
64
re-engineered metabolism enables temporary carbon storage in secondary metabolites
more amenable to direct incorporation into elongating fatty acids.
Doubling nutrient availability to 160 g/L glucose and 2.73 g/L ammonium further
increased lipid titer to 25.3 g/L, the highest reported titer to date (Figure 4.1d). This
represents an increase in specific productivity to 0.21 g/L/h, but a decrease in cellular
lipid content to 71% and a decrease to 44% of theoretical stoichiometric yield. This
further demonstrates the need to fully optimize carbon and nitrogen content to maximize
lipogenic efficiency. These extremely high lipogenesis levels correlated with a metabolic
shift to maintain homeostatic, steady state ammonium levels not seen in the low lipid
accumulation background (Figure 4.3b,d). Specifically, after an initial drop, engineered
cells re-buffered the nitrogen level within the media, thus illustrating a newfound,
decoupled relationship between lipogenesis and nitrogen starvation. The control and
engineered strain both exhibit similar intracellular protein degradation during the final
four days of fermentation (Figure 4.3e). However, the control strain produces 4.9 g/L
biomass containing ~11% nitrogen content (thus utilizing 0.54 g/L nitrogen) (131), while
the engineered strain re-buffers supernatant nitrogen levels to ~0.5 g/L. A simple mass
balance indicates that the nitrogen replenishment afforded by engineered cells is
originating from protein degradation. Interestingly, the purely lipogenic phase (after
biomass accumulation) in the engineered cells corresponds to a reduction in oxygen
utilization, evidenced by a large, prolonged spike in dissolved oxygen content in
bioreactor run, suggesting that both nitrogen and oxygen utilization are down regulated to
reduce metabolite utilization for cell growth to enable enhanced lipogenesis.
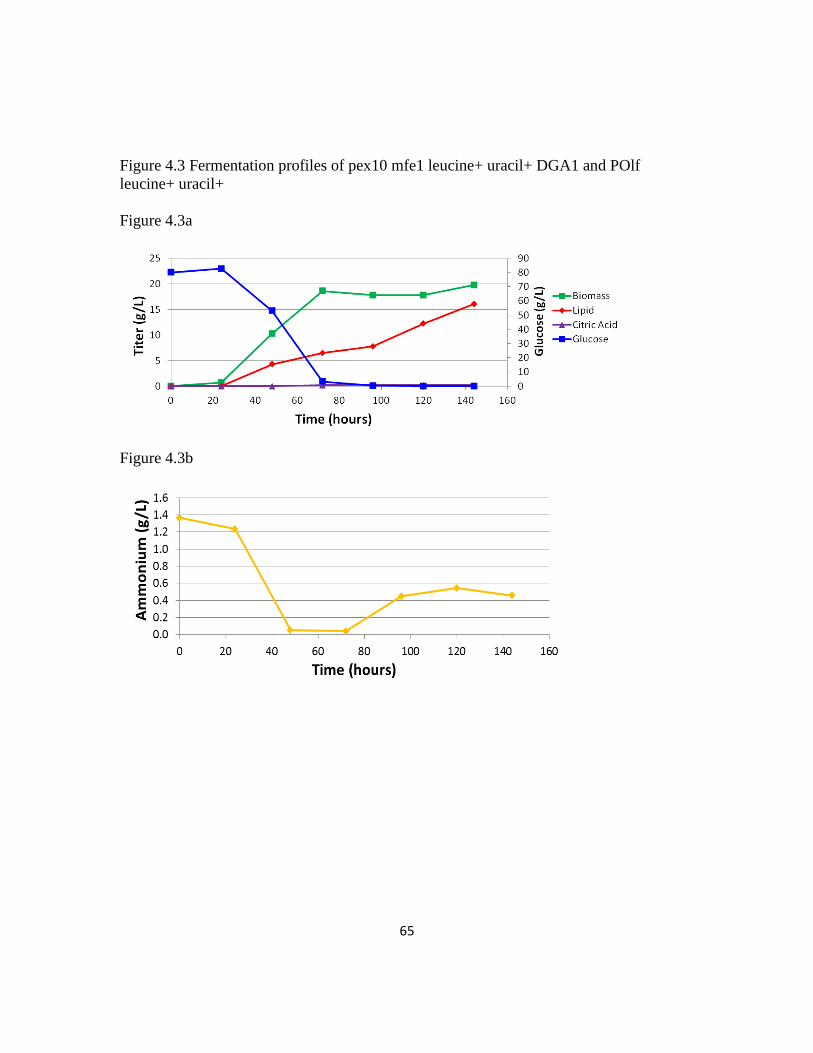
65
Figure 4.3 Fermentation profiles of pex10 mfe1 leucine+ uracil+ DGA1 and POlf
leucine+ uracil+
Figure 4.3a
Figure 4.3b
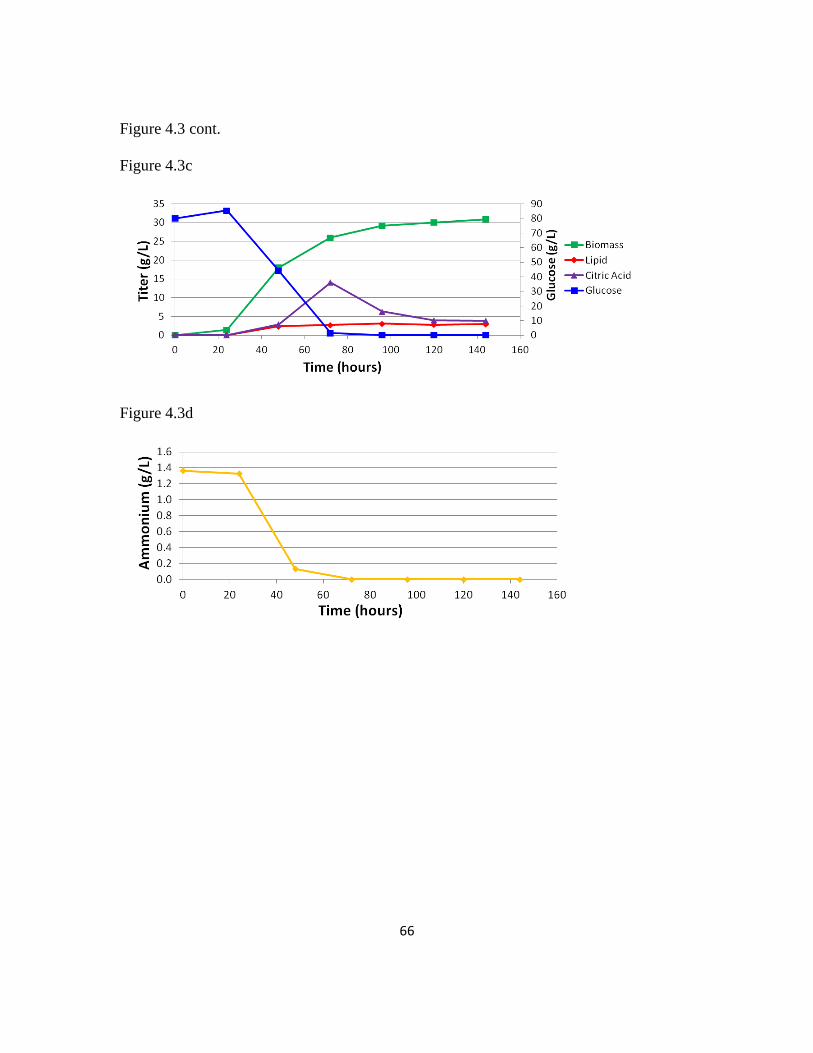
66
Figure 4.3 cont.
Figure 4.3c
Figure 4.3d

67
Figure 4.3 cont.
Figure 4.3e
68
Figure 4.3 cont.
Time courses of the 1.5L scale batch fermentation of the pex10 mfe1 leucine+ uracil
+ DGA1 (A,B)
and POlf leucine+ uracil
+(C,D) strains in 80 g/L glucose, 6.7 g/L YNB (no amino acids, 1.365 g/L
ammonium) are shown, including production of biomass, lipids, and citric acid (left axis a,c),
consumption of glucose (right axis a,c), and ammonium level (B,D). (A) During the pex10 mfe1
leucine+ uracil
+ DGA1 fermentation, negligible citric acid was produced, and lipid product
accumulated during and after biomass production phases. This fermentation was run three times
in identical conditions, reaching final yields of 15.25 g/L lipids and 20.3 g/L biomass (75% lipid
content), 14.96 g/L lipids and 20.6 g/L biomass (73% lipid content), and 16.9 g/L lipids and
19.21 g/L biomass (88% lipid content). Most time points show average values from the former
Figure 4.3 cont.
two fermentations (75% and 73% final lipid content), while endpoints represent averages from all
three final values. Error bars represent standard deviations of these technical replicates. Glucose
and ammonium substrate were fully consumed after 72 hours, but surprisingly, (B) ammonium
level was replenished to a steady state level of ~0.5 g/L, almost 40% of the original starting level.
(C) During the POlf leucine+ uracil
+ fermentation, citric acid accumulated to more than 14 g/L
after 72 hours before quickly reducing to 4 g/L. Lipid production did not trend with biomass
production, reaching a final yield of only 3 g/L lipids, compared to 30 g/L biomass, and glucose
was again consumed within 72 hours. (D) Ammonium was fully consumed after 72 hours with
no replenishment as observed in the mutant strain. (E) Ammonium is fully utilized by both the
pex10 mfe1 leucine+ uracil
+ DGA1 and POlf leucine
+ uracil
+ strains after 72 hours of bioreactor
batch fermentation. However, during pex10 mfe1 leucine+ uracil
+ DGA1 fermentation,
ammonium levels are replenished. We tested if this could be a result of intracellular protein
degradation, by analyzing protein content before, during, and after this dip in ammonium
concentration. However, protein concentration decreases in both pex10 mfe1 leucine+ uracil
+
DGA1 cells and in POlf leucine+ uracil
+ cells. Thus, the metabolic shift to sustain steady state
nitrogen levels observed in pex10 mfe1 leucine+ uracil
+ DGA1 fermentation is not solely the
result of protein degradation. This experiment was conducted with individual samples.
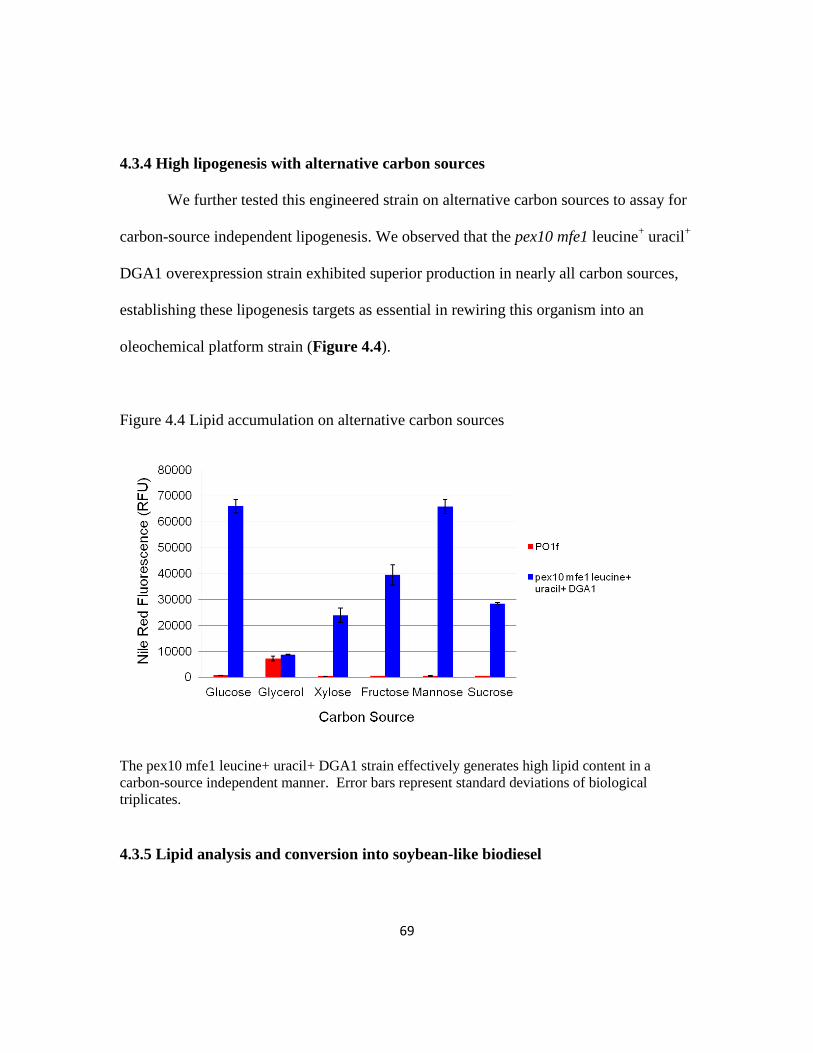
69
4.3.4 High lipogenesis with alternative carbon sources
We further tested this engineered strain on alternative carbon sources to assay for
carbon-source independent lipogenesis. We observed that the pex10 mfe1 leucine+ uracil
+
DGA1 overexpression strain exhibited superior production in nearly all carbon sources,
establishing these lipogenesis targets as essential in rewiring this organism into an
oleochemical platform strain (Figure 4.4).
Figure 4.4 Lipid accumulation on alternative carbon sources
The pex10 mfe1 leucine+ uracil+ DGA1 strain effectively generates high lipid content in a
carbon-source independent manner. Error bars represent standard deviations of biological
triplicates.
4.3.5 Lipid analysis and conversion into soybean-like biodiesel
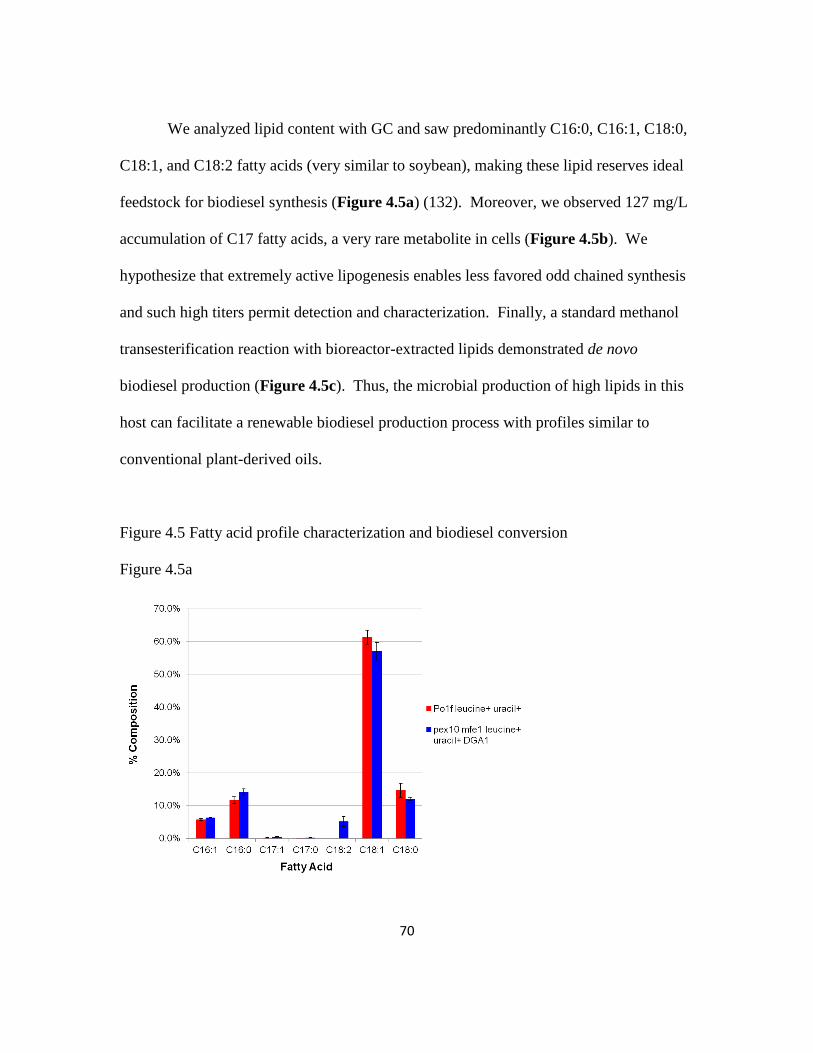
70
We analyzed lipid content with GC and saw predominantly C16:0, C16:1, C18:0,
C18:1, and C18:2 fatty acids (very similar to soybean), making these lipid reserves ideal
feedstock for biodiesel synthesis (Figure 4.5a) (132). Moreover, we observed 127 mg/L
accumulation of C17 fatty acids, a very rare metabolite in cells (Figure 4.5b). We
hypothesize that extremely active lipogenesis enables less favored odd chained synthesis
and such high titers permit detection and characterization. Finally, a standard methanol
transesterification reaction with bioreactor-extracted lipids demonstrated de novo
biodiesel production (Figure 4.5c). Thus, the microbial production of high lipids in this
host can facilitate a renewable biodiesel production process with profiles similar to
conventional plant-derived oils.
Figure 4.5 Fatty acid profile characterization and biodiesel conversion
Figure 4.5a
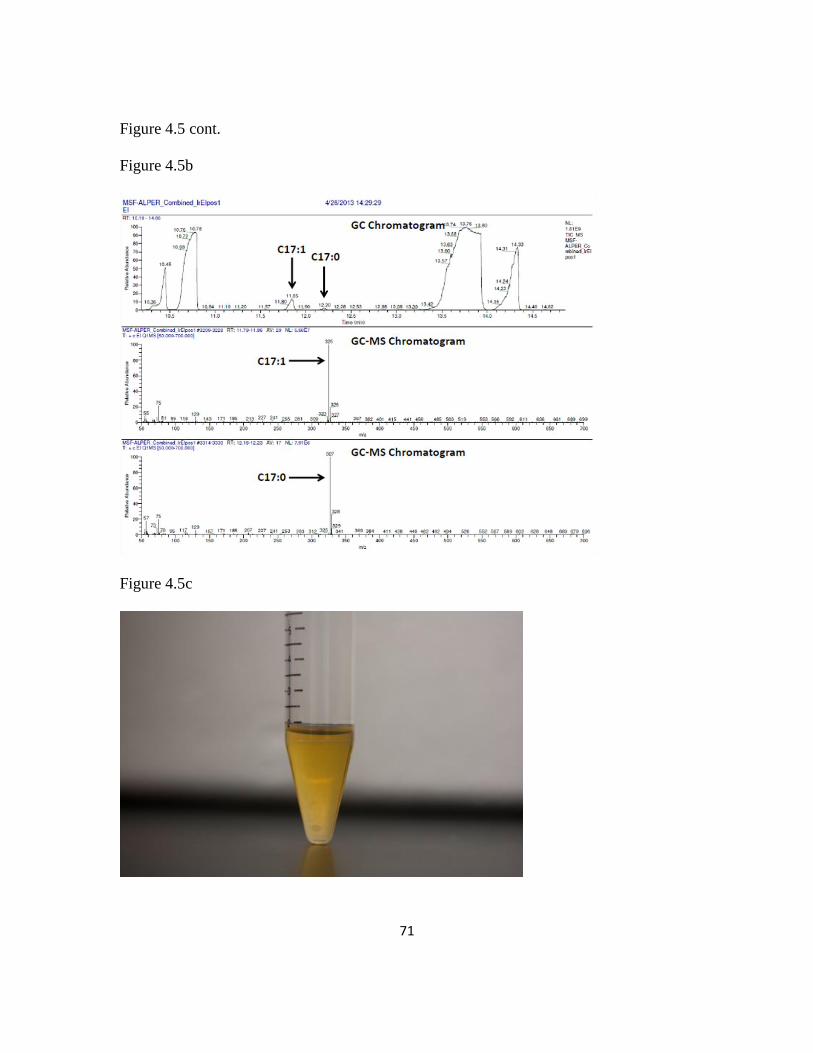
71
Figure 4.5 cont.
Figure 4.5b
Figure 4.5c
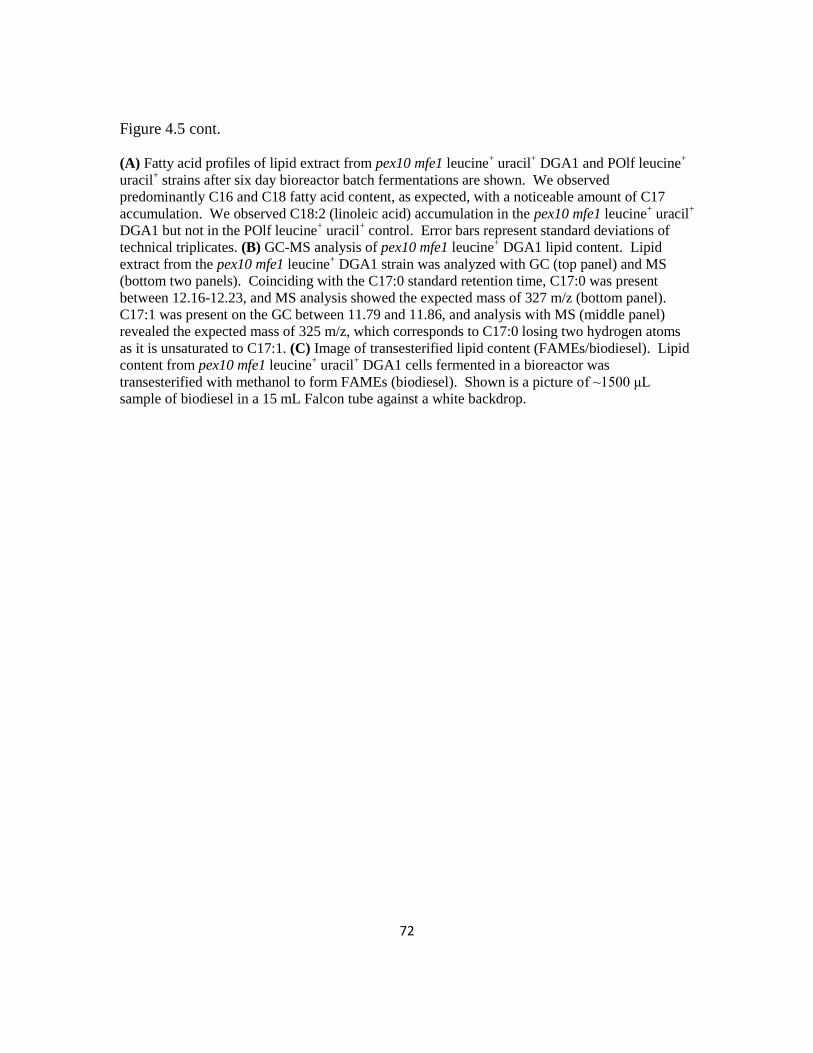
72
Figure 4.5 cont.
(A) Fatty acid profiles of lipid extract from pex10 mfe1 leucine+ uracil
+ DGA1 and POlf leucine
+
uracil+ strains after six day bioreactor batch fermentations are shown. We observed
predominantly C16 and C18 fatty acid content, as expected, with a noticeable amount of C17
accumulation. We observed C18:2 (linoleic acid) accumulation in the pex10 mfe1 leucine+ uracil
+
DGA1 but not in the POlf leucine+ uracil
+ control. Error bars represent standard deviations of
technical triplicates. (B) GC-MS analysis of pex10 mfe1 leucine+ DGA1 lipid content. Lipid
extract from the pex10 mfe1 leucine+ DGA1 strain was analyzed with GC (top panel) and MS
(bottom two panels). Coinciding with the C17:0 standard retention time, C17:0 was present
between 12.16-12.23, and MS analysis showed the expected mass of 327 m/z (bottom panel).
C17:1 was present on the GC between 11.79 and 11.86, and analysis with MS (middle panel)
revealed the expected mass of 325 m/z, which corresponds to C17:0 losing two hydrogen atoms
as it is unsaturated to C17:1. (C) Image of transesterified lipid content (FAMEs/biodiesel). Lipid
content from pex10 mfe1 leucine+ uracil
+ DGA1 cells fermented in a bioreactor was
transesterified with methanol to form FAMEs (biodiesel). Shown is a picture of ~1500 μL
sample of biodiesel in a 15 mL Falcon tube against a white backdrop.

73
4.5.6 Probing the link between leucine and lipogenesis
Finally, we sought to explain the lipogenic benefit bestowed by leucine
biosynthetic capacity by comparing leucine supplementation to genetic complementation.
Leucine supplementation mimicked genotypic complementation in leucine- strains but
did not affect leucine+ backgrounds (Figure 4.6a,b). Isoleucine supplementation had no
effect, insuring that this leucine-mediated response was not a result of amino acid
catabolism (Figure 4.6a,b). Leucine supplementation or genetic complementation
enabled a pronounced alteration in steady state nitrogen concentration that correlated
with lipogenesis in small scale cultivations (Figure 4.6c,d). These results implicated
leucine as an intracellular trigger to stimulate lipogenesis while regulating nitrogen
availability. In this regard, the yeast and mammalian TOR complexes (TORC1) promote
cell anabolic processes, such as growth, proliferation, and protein synthesis, in response
to amino acid availability and growth factor stimuli (133-134). The leucyl-tRNA
synthetase has recently been implicated as an intracellular sensor of amino acid
availability for the TORC1, providing a potential link between leucine stimulation and
lipogenesis (135-136). To probe this interaction further, we inhibited Y. lipolytica TOR
kinase activity with rapamycin, revealing a complex TOR-regulated lipogenic phenotype,
in which leucine stimulation and TOR inhibition coupled to facilitate lipogenesis in low
lipid production backgrounds but reduced lipogenesis in high production strains (Figure
4.6e). Thus, we demonstrated here that leucine-mediated lipogenic induction is affected
by TOR regulation.
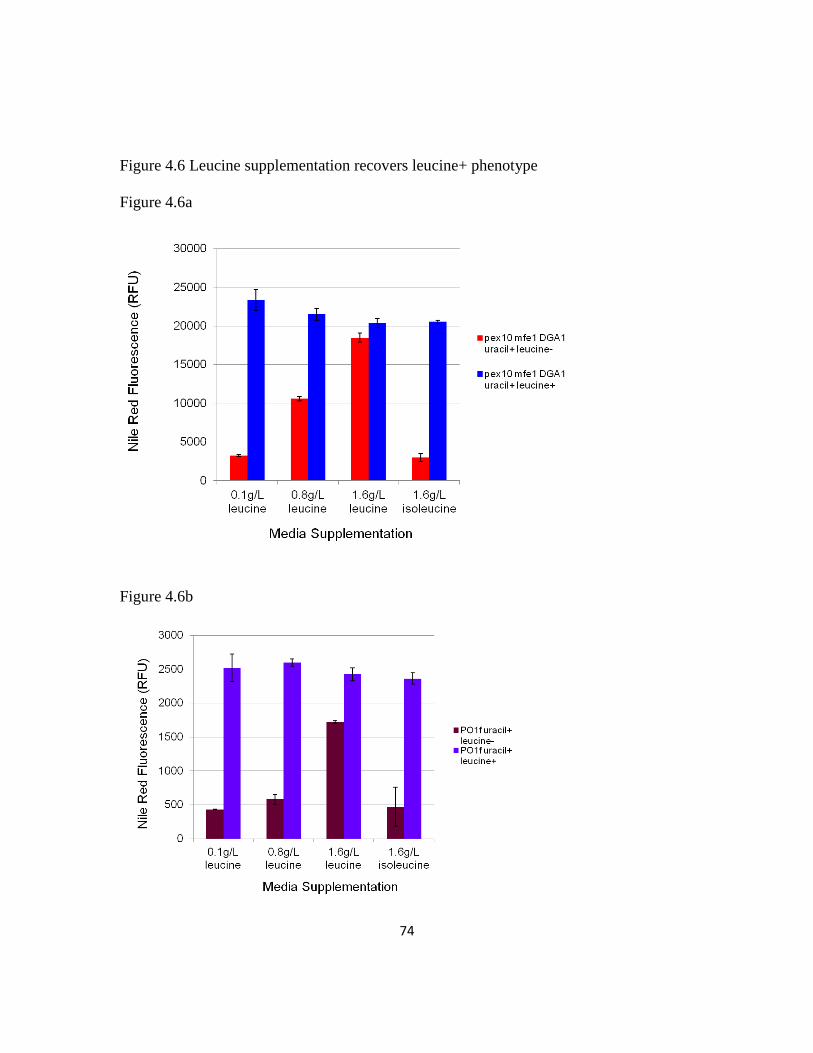
74
Figure 4.6 Leucine supplementation recovers leucine+ phenotype
Figure 4.6a
Figure 4.6b
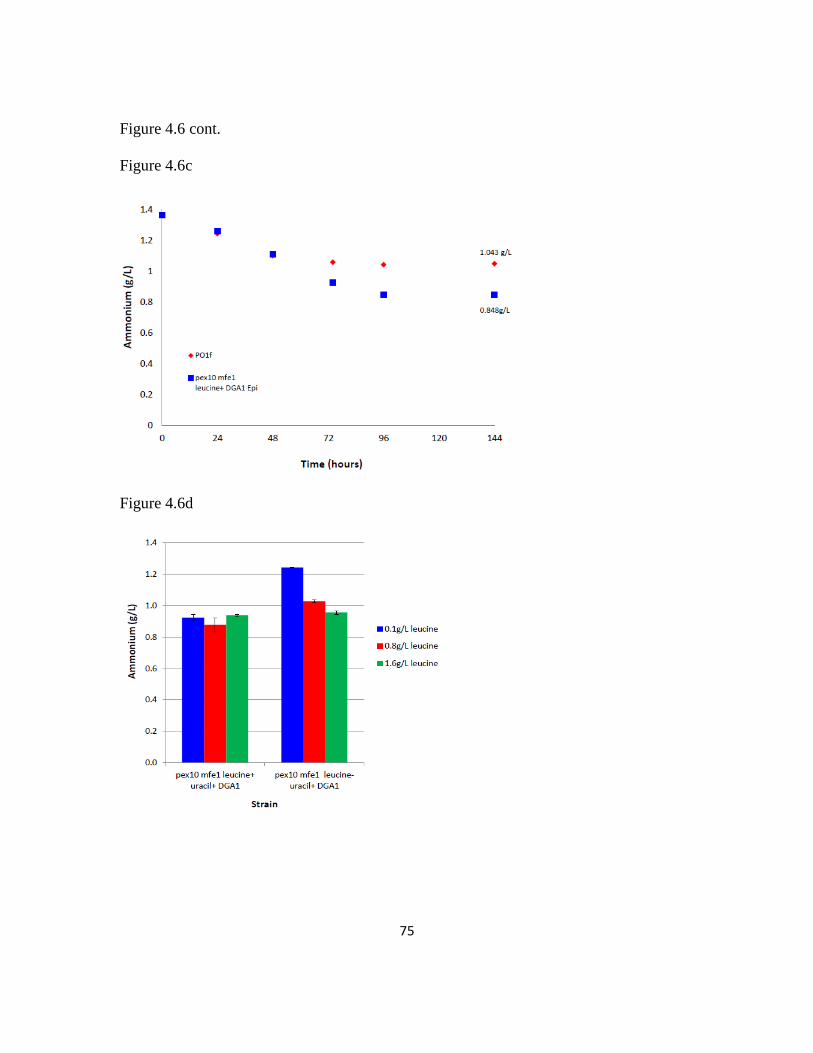
75
Figure 4.6 cont.
Figure 4.6c
Figure 4.6d
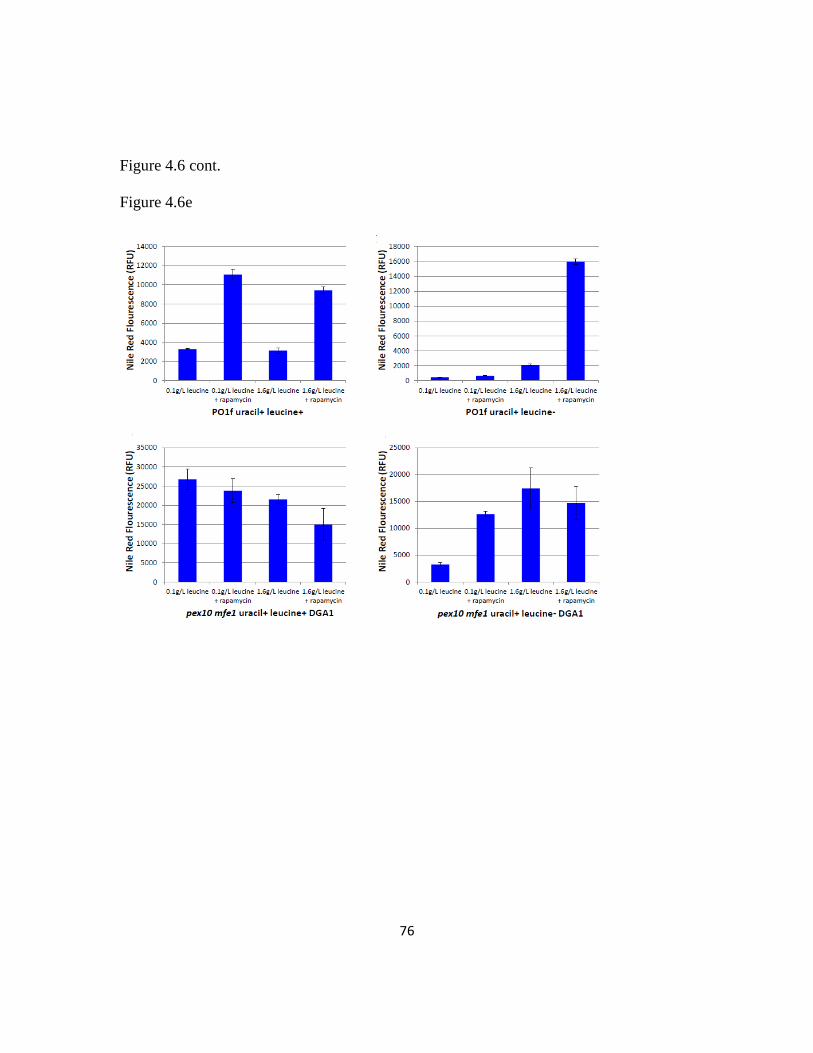
76
Figure 4.6 cont.
Figure 4.6e
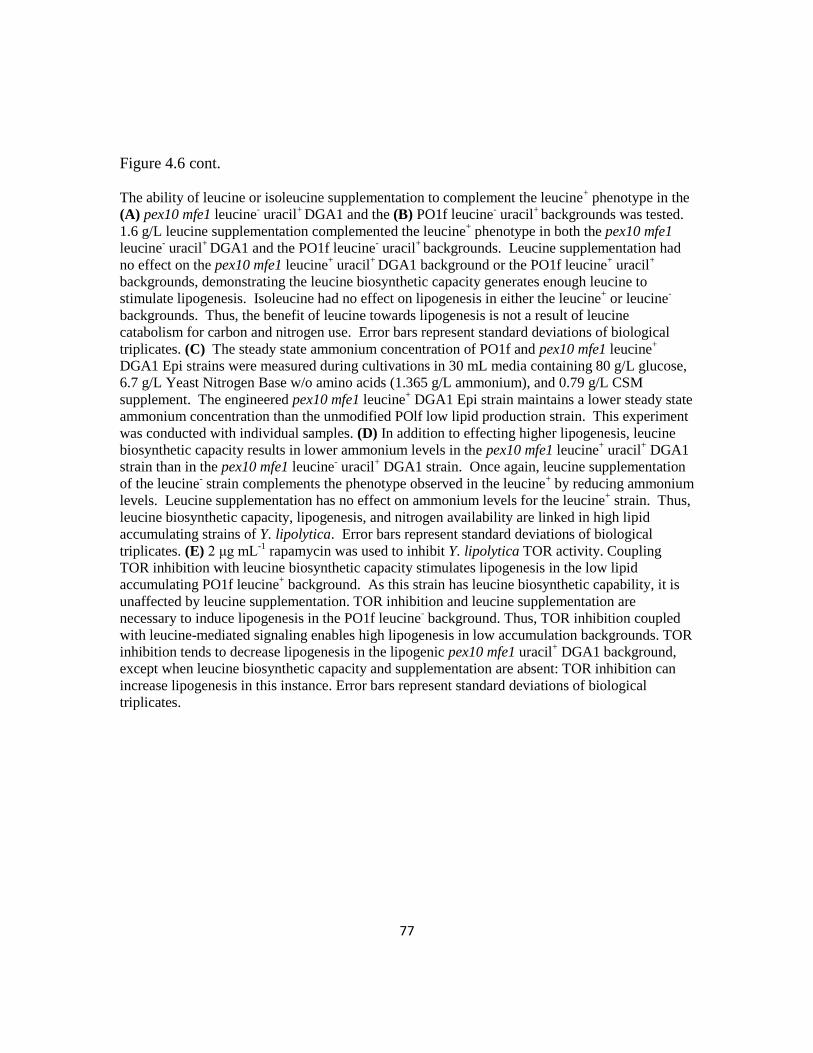
77
Figure 4.6 cont.
The ability of leucine or isoleucine supplementation to complement the leucine+ phenotype in the
(A) pex10 mfe1 leucine- uracil
+ DGA1 and the (B) PO1f leucine
- uracil
+ backgrounds was tested.
1.6 g/L leucine supplementation complemented the leucine+ phenotype in both the pex10 mfe1
leucine- uracil
+ DGA1 and the PO1f leucine
- uracil
+ backgrounds. Leucine supplementation had
no effect on the pex10 mfe1 leucine+ uracil
+ DGA1 background or the PO1f leucine
+ uracil
+
backgrounds, demonstrating the leucine biosynthetic capacity generates enough leucine to
stimulate lipogenesis. Isoleucine had no effect on lipogenesis in either the leucine+ or leucine
-
backgrounds. Thus, the benefit of leucine towards lipogenesis is not a result of leucine
catabolism for carbon and nitrogen use. Error bars represent standard deviations of biological
triplicates. (C) The steady state ammonium concentration of PO1f and pex10 mfe1 leucine+
DGA1 Epi strains were measured during cultivations in 30 mL media containing 80 g/L glucose,
6.7 g/L Yeast Nitrogen Base w/o amino acids (1.365 g/L ammonium), and 0.79 g/L CSM
supplement. The engineered pex10 mfe1 leucine+ DGA1 Epi strain maintains a lower steady state
ammonium concentration than the unmodified POlf low lipid production strain. This experiment
was conducted with individual samples. (D) In addition to effecting higher lipogenesis, leucine
biosynthetic capacity results in lower ammonium levels in the pex10 mfe1 leucine+ uracil
+ DGA1
strain than in the pex10 mfe1 leucine- uracil
+ DGA1 strain. Once again, leucine supplementation
of the leucine- strain complements the phenotype observed in the leucine
+ by reducing ammonium
levels. Leucine supplementation has no effect on ammonium levels for the leucine+ strain. Thus,
leucine biosynthetic capacity, lipogenesis, and nitrogen availability are linked in high lipid
accumulating strains of Y. lipolytica. Error bars represent standard deviations of biological
triplicates. (E) 2 μg mL-1
rapamycin was used to inhibit Y. lipolytica TOR activity. Coupling
TOR inhibition with leucine biosynthetic capacity stimulates lipogenesis in the low lipid
accumulating PO1f leucine+ background. As this strain has leucine biosynthetic capability, it is
unaffected by leucine supplementation. TOR inhibition and leucine supplementation are
necessary to induce lipogenesis in the PO1f leucine- background. Thus, TOR inhibition coupled
with leucine-mediated signaling enables high lipogenesis in low accumulation backgrounds. TOR
inhibition tends to decrease lipogenesis in the lipogenic pex10 mfe1 uracil+ DGA1 background,
except when leucine biosynthetic capacity and supplementation are absent: TOR inhibition can
increase lipogenesis in this instance. Error bars represent standard deviations of biological
triplicates.

78
4.4 Discussion and conclusion
Lipogenic organisms offer ideal platforms for biodiesel and oleo-chemical
synthesis. To this effect, we rewired Y. lipolytica’s native metabolism via a
combinatorial multiplexing to effect superior de novo lipid accumulation. Our analyses
revealed that high lipogenesis can be un-coupled from nitrogen starvation, is dependent
on leucine-mediated signaling and absolute environmental carbon content, and is
adversely affected by citric acid and nitrogen cycling. For the majority of our moderate
or highly lipogenic strains, optimal lipid accumulation was enabled in nitrogen-
permissive, high carbon conditions. In contrast, low performing strains were optimally
induced by low carbon levels, indicating central carbon metabolisms ill-equipped to
utilize energy-dense media formulations. Thus, genomic rewiring quickly eliminates the
requirement of induction through nitrogen starvation and necessitates a re-optimization of
environmental stimulus after each metabolic perturbation. During bioreactor
fermentation, a lowly lipogenic strain diverted excess carbon to production of
extracellular citric acid before assimilation into biomass (simultaneously utilizing
nitrogen derived from protein degradation). In contrast, a highly lipogenic strain avoided
citric acid accumulation and prevented incorporation of nitrogen into biomass. In this
manner, our final engineered strain mentioned in this chapter maintained nitrogen levels
optimal for high lipogenesis and prevented extracellular carbon flux, promoting easier
lipid accumulation.
79
The work from this chapter reports the novel link between leucine signaling and
lipogenesis in Y. lipolytica. Specifically, we contrasted the effects of leucine and
isoleucine supplementation on lipogenesis and demonstrated that only leucine acts to
promote lipogenesis. As Y. lipolytica possesses degradation pathways for both leucine
and isoleucine to acetyl-CoA fatty acid precursors (66, 121-122), leucine must act as an
intracellular signal to permit lipid production, rather than as a carbon source. This is
further established by the leucine-dependent TOR-inhibition phenotype of the PO1f
leucine- uracil
+ and PO1f leucine
+ uracil
+ strains. Thus, a complex signaling scheme is
implicated for high lipid titers in this organism.
In summary, we conducted the largest rewiring of an oleaginous organism, and
successfully engineered and enhanced de novo lipid accumulation in Y. lipolytica by
more than 60 fold comparing to the starting strain. In doing so, we identified several
unique features of lipogenesis, demonstrated that lipid accumulation approaching 90% of
cell mass is possible, determined dominant genotype- phenotype dependencies,
decoupled lipogenesis and nitrogen starvation, illustrated carbon-source independence,
and demonstrated the feasible conversion of these lipids into FAMEs. We further
presented evidence that two central tenets of lipogenesis, the necessity for nitrogen
starvation and citric acid cycling, are not universal. The work presented in this chapter
reports a high lipid titers to date at 25 g/L and it can be used as starting point for further
evolutionary metabolic engineering as described in the next chapter (Chapter 5).
80
Chapter 5: Evolutionary metabolic engineering for high lipid
production in Yarrowia lipolytica
5.1 Chapter summary
Through rational metabolic engineering efforts described in Chapter 4,
lipogenesis titers in Yarrowia lipolytica were significantly enhanced. However, the
improvement still suffered from decreased biomass generation rates. Here, we attempted
to employ a rapid evolutionary metabolic engineering approach linked with a floating cell
enrichment process to improve lipogenesis rates, titers, and yields. Through this iterative
process, we were able to ultimately improve yields from our prior strain by over 60% to
achieve production titers of 40.5 g/L with upwards of 79% of the theoretical maximum
yield of conversation. Isolated cells were saturated with up to 89% lipid content. An
average specific productivity of 0.55 g/L/h was achieved with a maximum instantaneous
specific productivity of 0.86 g/L/h during the fermentation. Genomic sequencing of the
evolved strains revealed a link between a decrease/loss of function mutation of succinate
semialdehyde dehydrogenase, uga2, suggesting the importance of gamma-aminobutyric
acid assimilation in lipogenesis. This linkage was validated through gene deletion
experiments. This chapter presents an improved host strain that can serve as a platform
for efficient oleochemical production.
81
5.2 Introduction
Metabolic engineering of a highly oleaginous strain of Y. lipolytica capable of
producing titers exceeding 25 g/L in bioreactors has been achieved as described in
Chapter 4. Nevertheless, even in this organism, improvements in all metrics
(productivities, titers, and yields) are essential to make microbial production of chemicals,
and especially commodity chemicals and biofuels, economically viable. Thus, here, we
take an evolutionary approach to further improve lipogenesis rates.
One particular challenge of rational metabolic engineering is the competition
between product titers and yields (137). To this end, improved lipid production is usually
accompanied by a decrease in cell growth (138). Specific for engineering lipogenesis in Y.
lipolytica, rational approaches have mainly produced strains with increased lipid
production at the cost of decreased biomass production (23, 139) . Thus, a more balanced
evolutionary approach may access a middle ground for these two competing factors.
Evolutionary metabolic engineering of bio-based production of oils and lipids is
challenging due to the lack of developed enrichment and selection schemes. Prior work
has coupled random mutagenesis with anti-metabolites such as cerulenin screening to
evolve oleaginous yeast Lipomyces starkeyi (140). However, the improvement was rather
limited probably due to the lack of full enrichment and the high specificity of cerulenin
screening. An alternative strategy based on physiology has been employed in the case of
identifying high lipid containing mutants from a transposon library of S. cerevisiae
whereby a gradient centrifugation selection step was used (141). However, these
82
approaches can be quite sensitive to conditions of the selection, yet demonstrate the
potential for an evolutionary approach.
Here, we designed and performed a simple, evolutionary metabolic engineering
approach for improving lipogenesis in a pre-engineered starting strain using random
mutagenesis and an observed buoyancy property of lipid-filled cells. Specifically, by
repeating the process of error generation and floating-based selection, we were able to
ultimately improve yields from our prior strain by over 60% to achieve production titers
of 40.5 g/L with upwards of 79% of the theoretical maximum yield of conversation and
average specific productivities reaching 0.55 g/L/h with a maximum instantaneous
productivity of 0.86 g/L/h. More importantly, these improvements simultaneously
increase both biomass and titer. Whole genome sequencing reveals a novel lipid
production enhancer (uga2) and provides important insight into the relationship between
glutamate degradation and lipogenesis. Thus, this chapter presents a metabolically
evolved, novel platform with substantial lipogenesis potential.
5.3 Results
5.3.1 High-lipid content cells can be identified via floating cells
By coupling combinatorial multiplexing of lipogenesis targets with phenotypic
induction, we successfully rewired Y. lipolytica’s native metabolism for high de novo
lipogenesis through the identification of three dominant genetic targets – pex10 deletion,
DGA1 overexpression and restoration of a complete leucine biosynthetic pathway
83
(leucine+ phenotype) and created an engineered strain PO1f pex10 mfe1 leucine
+ uracil
+
DGA1 with production titer exceeding 25 g/L in bioreactor (139). During these
engineering efforts, we successfully identified a subpopulation of cells with extremely
high buoyancy property: these cells can float on top of the medium once the culture
settled while normal cells would settle down to the bottom of the tube (Figure 5.1). At
times, this “floating” subpopulation can even survive conditions of mild centrifugation
(e.g. 100 x g). We then examined the lipid bodies inside both cell populations using
fluorescence microscopy with Nile Red staining (a dye straining lipid bodies showing
yellow-green fluorescence when excited with blue light (125)) and observed that the
floating cells were full of lipids whereas cells that settled were not (Figure 5.1, this strain
is further characterized in Chapter 6). Thus, we concluded that higher lipid containing
cells would possess a higher buoyancy property and can be separated based on this
“floating” phenotype. Here, we sought to utilize this observation as a method to isolate
cells with high lipid content cells by coupling this floating selection with random
mutagenesis and evolutionary engineering.

84
Figure 5.1 High-lipid content cells can be identified via floating cells
A non-floating strain (left) and culture with a floating subpopulation strain (right) was cultured in
high glucose media and then allowed to settled for 4 hours in room temperature in culture tubes to
demonstrate the observed floating cell phenotype. Representative fluorescence microscopic
pictures show lower lipids content inside the cells staining with Nile Red from the non-floating
population (left bottom) than from the floating subpopulation (right top).
5.3.2 Random mutagenesis linked with floating cell transfer can identify improved
lipogenesis traits
Based on the observations described above, we opted to invoke an iterative,
evolutionary metabolic engineering approach using our prior engineered strain of Y.
lipolytica PO1f pex10 mfe1 leucine+ uracil
+ DGA1 (Chapter 4) as a starting point.
Overall, this process consists of generating a random mutagenesis library using Ethyl
methanesulfonate (EMS), enriching for mutants with higher lipid content by sequentially
transferring the floating cells, screening individual colonies on Nile Red plates, and
finally testing for lipid content and cell growth (Figure 5.2). The best lipid producer was
tested in a bioreactor to evaluate the overall lipid production performance and was
Floating cells
Non-floating cells
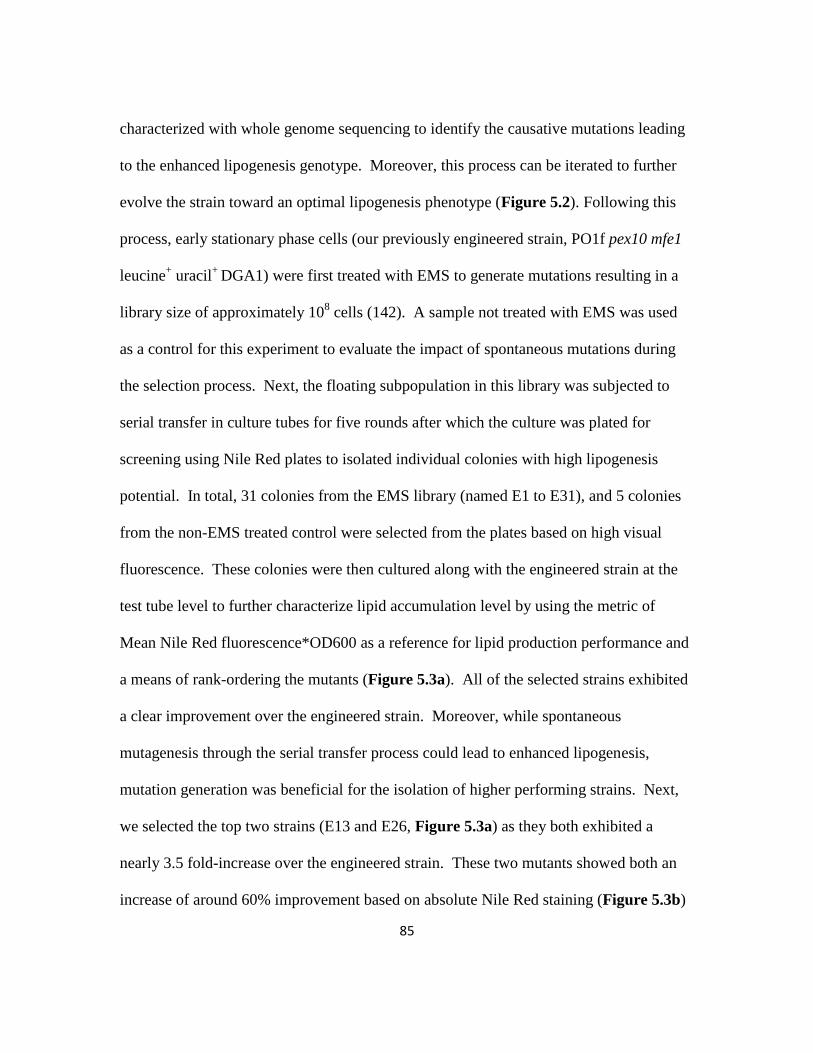
85
characterized with whole genome sequencing to identify the causative mutations leading
to the enhanced lipogenesis genotype. Moreover, this process can be iterated to further
evolve the strain toward an optimal lipogenesis phenotype (Figure 5.2). Following this
process, early stationary phase cells (our previously engineered strain, PO1f pex10 mfe1
leucine+ uracil
+ DGA1) were first treated with EMS to generate mutations resulting in a
library size of approximately 108 cells (142). A sample not treated with EMS was used
as a control for this experiment to evaluate the impact of spontaneous mutations during
the selection process. Next, the floating subpopulation in this library was subjected to
serial transfer in culture tubes for five rounds after which the culture was plated for
screening using Nile Red plates to isolated individual colonies with high lipogenesis
potential. In total, 31 colonies from the EMS library (named E1 to E31), and 5 colonies
from the non-EMS treated control were selected from the plates based on high visual
fluorescence. These colonies were then cultured along with the engineered strain at the
test tube level to further characterize lipid accumulation level by using the metric of
Mean Nile Red fluorescence*OD600 as a reference for lipid production performance and
a means of rank-ordering the mutants (Figure 5.3a). All of the selected strains exhibited
a clear improvement over the engineered strain. Moreover, while spontaneous
mutagenesis through the serial transfer process could lead to enhanced lipogenesis,
mutation generation was beneficial for the isolation of higher performing strains. Next,
we selected the top two strains (E13 and E26, Figure 5.3a) as they both exhibited a
nearly 3.5 fold-increase over the engineered strain. These two mutants showed both an
increase of around 60% improvement based on absolute Nile Red staining (Figure 5.3b)
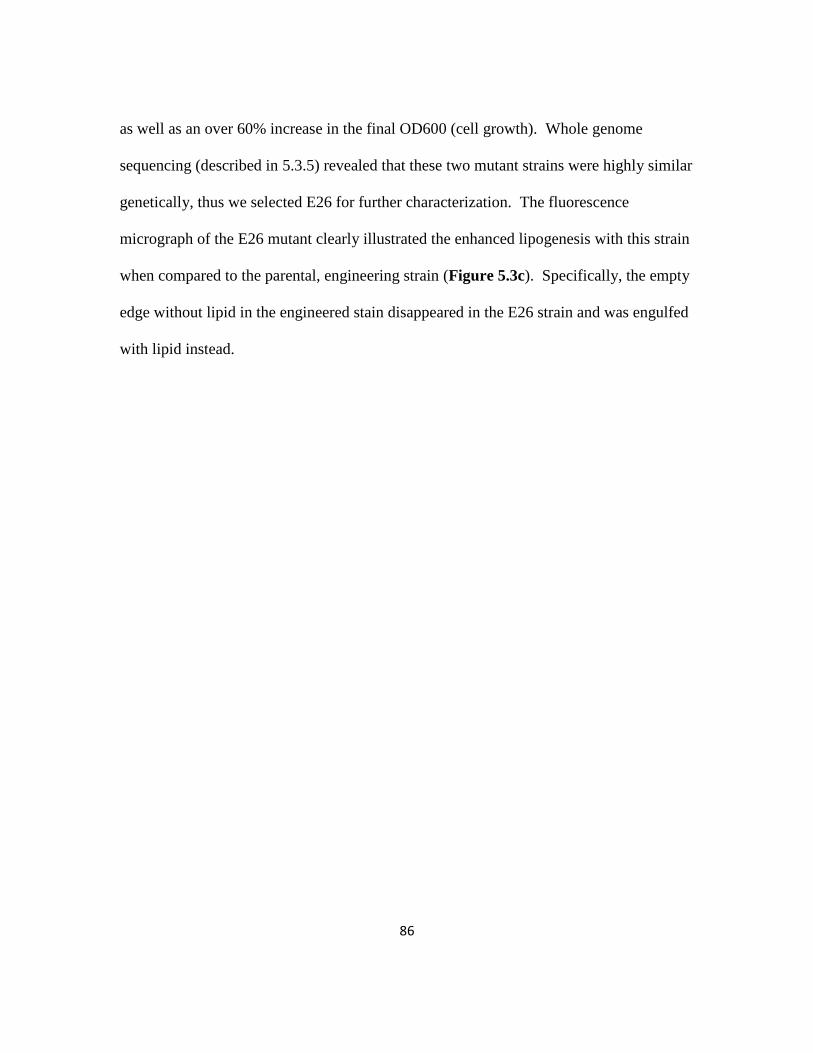
86
as well as an over 60% increase in the final OD600 (cell growth). Whole genome
sequencing (described in 5.3.5) revealed that these two mutant strains were highly similar
genetically, thus we selected E26 for further characterization. The fluorescence
micrograph of the E26 mutant clearly illustrated the enhanced lipogenesis with this strain
when compared to the parental, engineering strain (Figure 5.3c). Specifically, the empty
edge without lipid in the engineered stain disappeared in the E26 strain and was engulfed
with lipid instead.

87
Figure 5.2 Overall schematic for the iterative, evolutionary metabolic engineering
approach used to enhance lipogenesis in Yarrowia lipolytica
High lipid producing strains were created through first inducing random mutations by EMS, using
serial transfer of floating cells, screening colonies on Nile Red plates, and characterizing resulting
mutants through both whole genome sequencing and bioreactor production.
5.3.3 High lipid production through bioreactor fermentation with E26
To more accurately quantify the improvement achieved through this evolutionary
metabolic engineering approach, we cultivated the E26 strain in an inexpensive minimal
88
media formulation consisting of only glucose (160 g/L), ammonium sulphate (10 g/L)
and yeast nitrogen base while controlling pH, temperature and dissolved oxygen levels at
set points we previously found optimal (Figure 5.3d). In our previous efforts described
in Chapter 4, the engineered strain produced 25.2 g/L lipid with an average productivity
of 0.21g/L/h under these condition. After the evolutionary engineering, the E26 strain
derived from this engineered host exhibited a significantly improved lipid titer reaching
40.5 g/L with cells containing 89% lipid cellular content (Table 5.1). This value
represents the highest reported titer of lipid to the date. Moreover, this represents a 61%
increase in titer over the engineered strain. This strain achieved 79% of the theoretical
stoichiometric yield and had an average specific productivity approaching 0.51 g/L/h (a
2.5-fold increase over the engineered strain). The increased lipid titer was the combined
effect of both increase cellular lipid content as well as a higher overall biomass. For the
parental, engineered strain, the main period of lipogenesis occurred in the later parts of
fermentation (through 144 hours) after glucose depletion and biomass formation (139).
In contrast, for the evolved E26 strain, lipogenesis occurred during the biomass
accumulation stage and was completed within 96 hours. Thus, the evolved strain’s
metabolic processes are in clear contrast to the parental, engineered strain and presented
improvements in rate, titer, and yield.
89
Figure 5.3 Random mutagenesis linked with floating cell transfer can identify improved
lipogenesis strains.
Figure 5.3a
Figure 5.3b
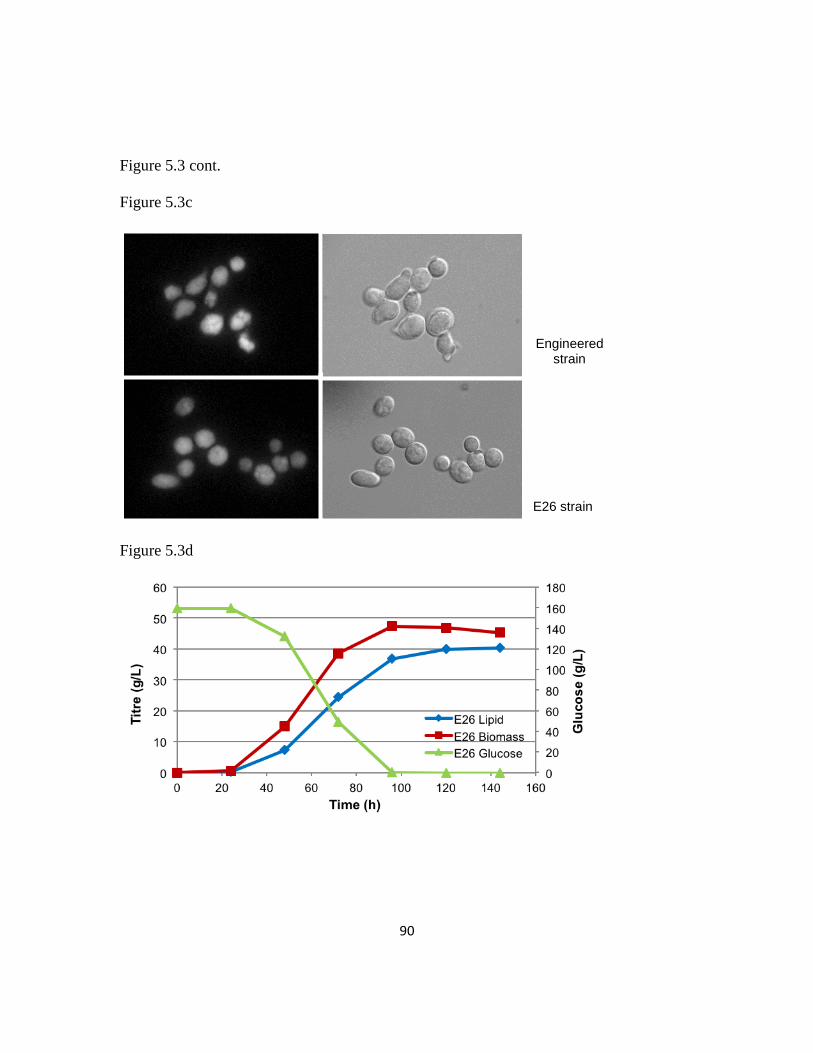
90
Figure 5.3 cont.
Figure 5.3c
Figure 5.3d
Engineered strain
E26 strain

91
Figre 5.3 cont.
(A) Comparison of lipid production using engineered strain (green), non-EMS evolved strain
(light blue), and EMS evolved strain (dark blue) using Mean Nile Red fluorescence*OD600 as
ranking metric. Selected strains E13 and E26 are highlighted by a red circle. (B) Enhanced
lipogenesis among the isolated evolved strains E13 and E26 were characterized using flow
cytometry and compared with the parental, engineered strain. (C) Comparison of lipids stained
with Nile Red between the engineered strain and evolved E26 strain using fluorescence
microscopy. (D) Batch bioreactor fermentation profile of the E26 strain for lipid production.
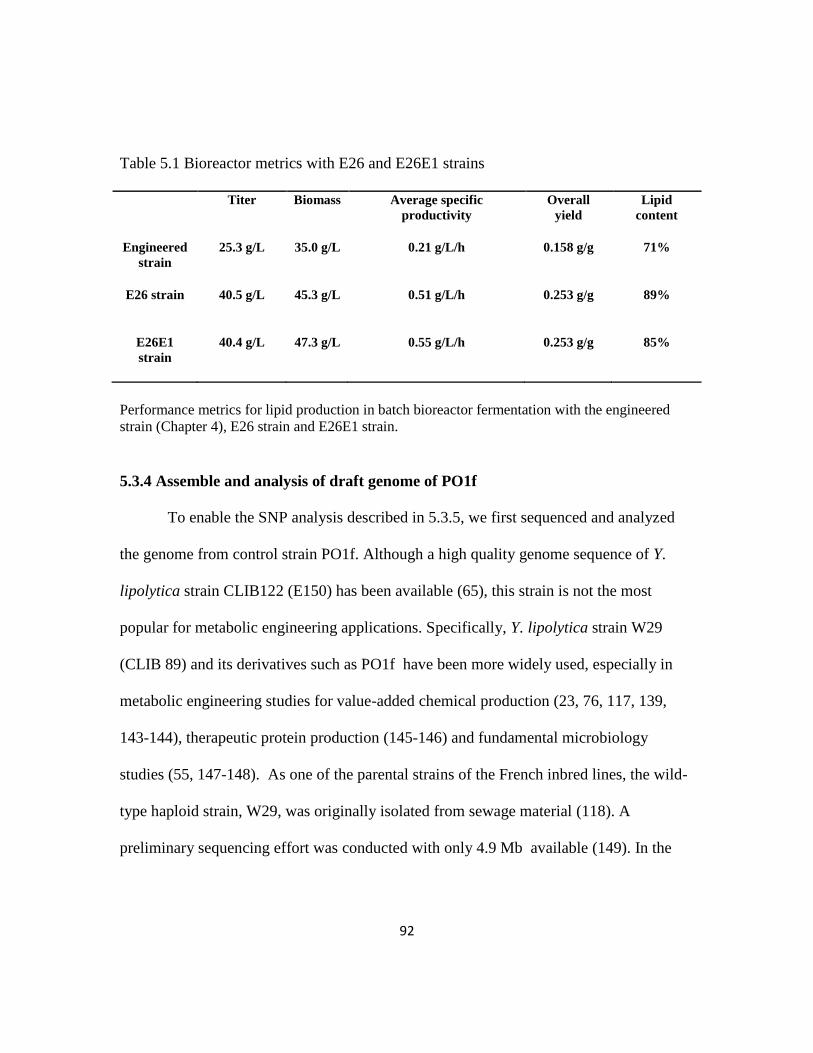
92
Table 5.1 Bioreactor metrics with E26 and E26E1 strains
Titer Biomass Average specific
productivity
Overall
yield
Lipid
content
Engineered
strain
25.3 g/L 35.0 g/L 0.21 g/L/h 0.158 g/g 71%
E26 strain 40.5 g/L 45.3 g/L 0.51 g/L/h 0.253 g/g 89%
E26E1
strain
40.4 g/L 47.3 g/L 0.55 g/L/h 0.253 g/g 85%
Performance metrics for lipid production in batch bioreactor fermentation with the engineered
strain (Chapter 4), E26 strain and E26E1 strain.
5.3.4 Assemble and analysis of draft genome of PO1f
To enable the SNP analysis described in 5.3.5, we first sequenced and analyzed
the genome from control strain PO1f. Although a high quality genome sequence of Y.
lipolytica strain CLIB122 (E150) has been available (65), this strain is not the most
popular for metabolic engineering applications. Specifically, Y. lipolytica strain W29
(CLIB 89) and its derivatives such as PO1f have been more widely used, especially in
metabolic engineering studies for value-added chemical production (23, 76, 117, 139,
143-144), therapeutic protein production (145-146) and fundamental microbiology
studies (55, 147-148). As one of the parental strains of the French inbred lines, the wild-
type haploid strain, W29, was originally isolated from sewage material (118). A
preliminary sequencing effort was conducted with only 4.9 Mb available (149). In the
93
work here, we assembled a draft genome of PO1f and analyzed the SNPs through its
genome using CLIB122 genome as reference.
The genome of Y. lipolytica PO1f was sequenced using the illumina HiSeq DNA
sequencing platform (PE2X100). The raw sequence data comprises a total of 8,740,022
reads that together provide very high sampling coverage of the genome (43.7-fold
coverage). The reads were assembled using Velvet with k-mer size of 55 (150). This led
to a genome assembly containing 669 contigs (each at length >= 500 bp). The total length
of the genome assembly is 20,282,994 bp with N50 equals 58kbp. The reads were also
assembled using A5 pipeline (151) and closed gaps with IMAGE (152) to 348 contigs
(each at length >=500 bp) and further scaffolded based on genome sequence of strain
CLIB122 using ABACAS (153). Total 19,922,824 bp were placed to the final 6 scaffolds.
The final de novo assembled genome was analyzed to assign open reading frames (ORF)
with Augustus (154) trained with Y. lipolytica CLIB122 data. A total of 6,420 putative
ORFs were identified and 4,096 were annotated with Blast2Go (155). The genome
sequences of PO1f and strain CLIB122 are very similar in nature. By mapping the
Illumina reads to the CLIB122 genome using BWA (156) and analyzing using Samtools
(156) and BEDTools (157), a total of 24,675 single nucleotide variations were called in
PO1f genome sequences (QUAL>=30; DP>=10). Moreover, LTR-retrotransposon
elements are confirmed being absent in stain PO1f, matching prior information about this
strain (149). There is one large deletion in chromosome A with four ORF missing. Two
of them are weakly similar to the SMC5/6 complex (YALI0A01562p and
YALI0A01602p), which are related to double strand break repairing and homologous
94
recombination (158). These absences may give rise to differences in homologous
recombination efficiencies in this strain.
5.3.5 Whole genome sequencing revealed enhanced lipogenesis genotype
To establish a genotype-phenotype linkage in our evolved strains, we performed
whole genome sequencing for isolated strains E13 and E26 using an Illumina platform.
An average of 65X coverage over the genome was obtained and a single nucleotide
polymorphism (SNP) analysis was performed by mapping the sequences to the CLIB122
genome (65) and comparing with SNPs identified from our recent draft genome sequence
of the PO1f strain described in 5.3.4. The SNPs identified in both E13 and E26 are
highly similar suggesting both successful enrichment of the enhanced lipogenesis
subpopulation as well as a co-occurrence of common mutations within this population.
After filtering the sequences (QUAL>30), a total of 182 SNPs were identified in E13 and
179 SNPs in E26 with 93 of them in common between the two strains. Using the IGV
genome browser (159), a total of 16 SNPs in E13 and 19 SNPs in E26 were determined to
be in coding regions. Further analysis taking into account read quality revealed that E13
and E26 shared 9 authentic coding region mutations (Table 5.2). Out of these 9 coding
regions, three of these ORFs had linkages with lipogenesis, namely YALI0A02354g
(YOX1), YALI0E20449g (OSH6) and YALI0F26191g (UGA2). YOX1 encodes for a
homeobox transcriptional repressor and has been suggested to bind with leucine tRNA
genes in Y. lipolytica, which could affect the leucine synthesis regulation (141). OSH6, a
member of the oxysterol-binding protein family, is associated with the activity of the
TOR (target of rapamycin) complex 1 (160). Both leucine and TOR were demonstrated to
95
be linked with lipogenesis in our prior engineering efforts (139). Finally, UGA2 encodes
for succinate semialdehyde dehydrogenase (SSADH) and participates in the GABA
(gamma-aminobutyric acid) assimilation pathway, converting succinate semialdehyde to
succinate following 4-aminobutyrate aminotransferase (161). Further analysis and
investigation into the non-coding mutations may also be necessary to fully investigate the
genotype-phenotype linkage.
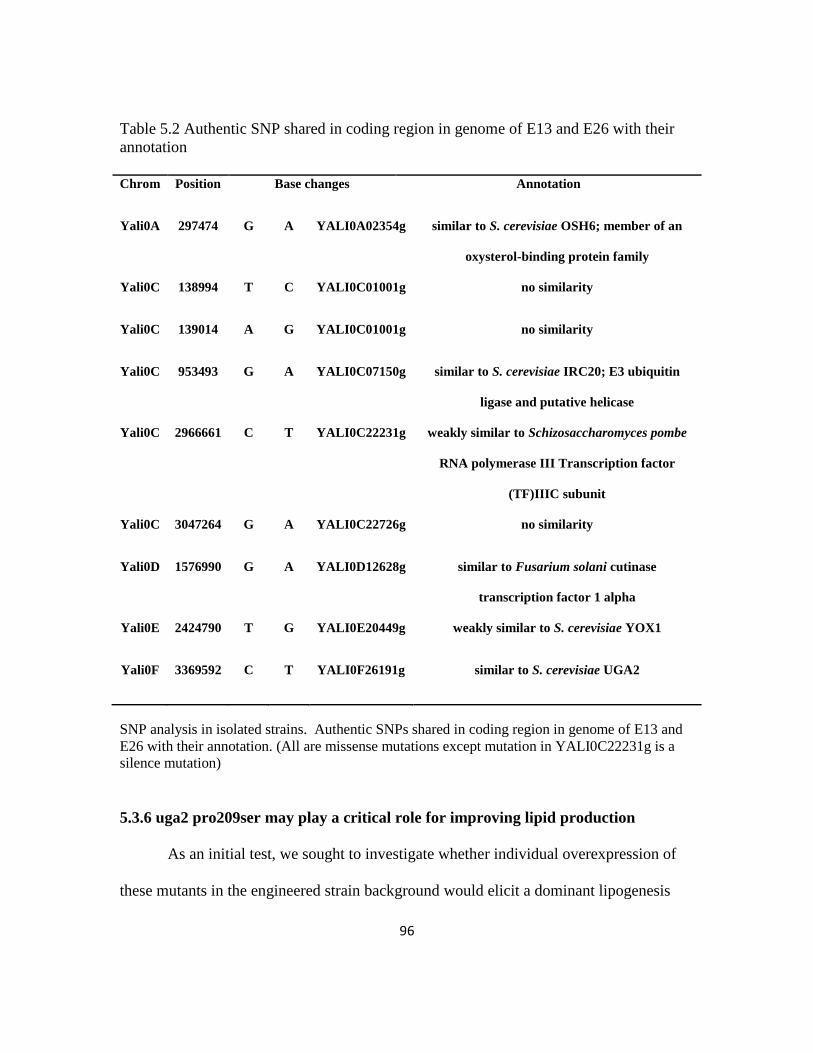
96
Table 5.2 Authentic SNP shared in coding region in genome of E13 and E26 with their
annotation
Chrom Position Base changes Annotation
Yali0A 297474 G A YALI0A02354g similar to S. cerevisiae OSH6; member of an
oxysterol-binding protein family
Yali0C 138994 T C YALI0C01001g no similarity
Yali0C 139014 A G YALI0C01001g no similarity
Yali0C 953493 G A YALI0C07150g similar to S. cerevisiae IRC20; E3 ubiquitin
ligase and putative helicase
Yali0C 2966661 C T YALI0C22231g weakly similar to Schizosaccharomyces pombe
RNA polymerase III Transcription factor
(TF)IIIC subunit
Yali0C 3047264 G A YALI0C22726g no similarity
Yali0D 1576990 G A YALI0D12628g similar to Fusarium solani cutinase
transcription factor 1 alpha
Yali0E 2424790 T G YALI0E20449g weakly similar to S. cerevisiae YOX1
Yali0F 3369592 C T YALI0F26191g similar to S. cerevisiae UGA2
SNP analysis in isolated strains. Authentic SNPs shared in coding region in genome of E13 and
E26 with their annotation. (All are missense mutations except mutation in YALI0C22231g is a
silence mutation)
5.3.6 uga2 pro209ser may play a critical role for improving lipid production
As an initial test, we sought to investigate whether individual overexpression of
these mutants in the engineered strain background would elicit a dominant lipogenesis
97
phenotype. To this end, no significant improvements were achieved through these efforts.
We were particularly intrigued by the uga2 mutant as it was functionally related to
nitrogen metabolism and relatively well studied (161-162). The identified mutation site in
uga2, Proline 209 is a highly conserved residue based on sequence alignment using
Geneious software (Figure 5.4a). Through the use of the i-tasser protein structure
prediction server (163) and structural analysis to a homologue (Synechococcus sp.
succinic semialdehyde dehydrogenase, PDB 3VZ3), Pro209 sits at a starting point of a
helix and is in close proximity to a hydrogen bond forming serine that provides critical
binding to the cofactor NADP+ (164) (Figure 5.4b). Thus, we hypothesized that the
mutation from proline to serine could distort the helix, decrease enzyme function, and
thus alter the GABA assimilation pathways. To test whether the uga2 P209S was a
reduced function allele, we cultivated the E26 strain and the engineered strain with either
GABA or NH4+ as the sole nitrogen source and tested the ratio of cell densities as a
measurement of the GABA assimilation function. E26 showed reduced growth and thus
a significant decrease in GABA assimilation (Figure 5.4c). To further link uga2
mutations to increased lipogenesis, we knocked out the UGA2 gene from the engineered
strain. This modification improved lipogenesis as measured by an over 30% increase in a
Nile Red staining assay (Figure 5.4d). Collectively, this data suggests the uga2 mutation
identified from genome sequencing is indeed a beneficial mutation for enhanced
lipogenesis.
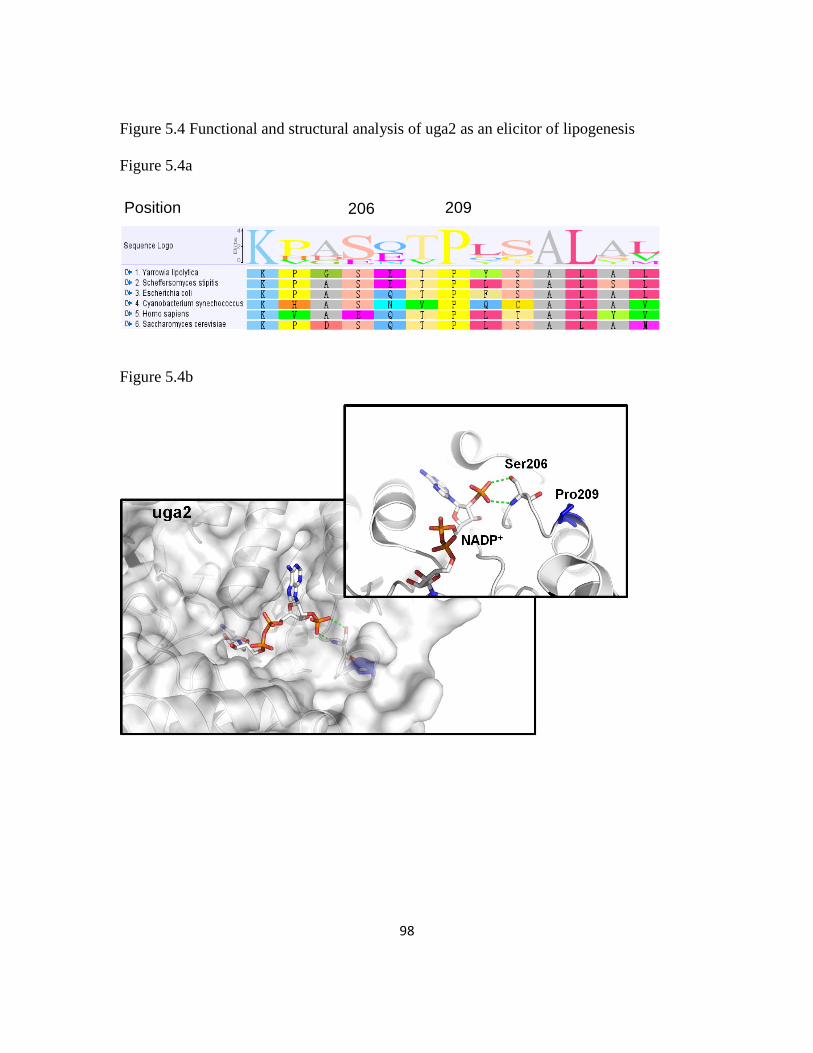
98
Figure 5.4 Functional and structural analysis of uga2 as an elicitor of lipogenesis
Figure 5.4a
Figure 5.4b
209 206 Position
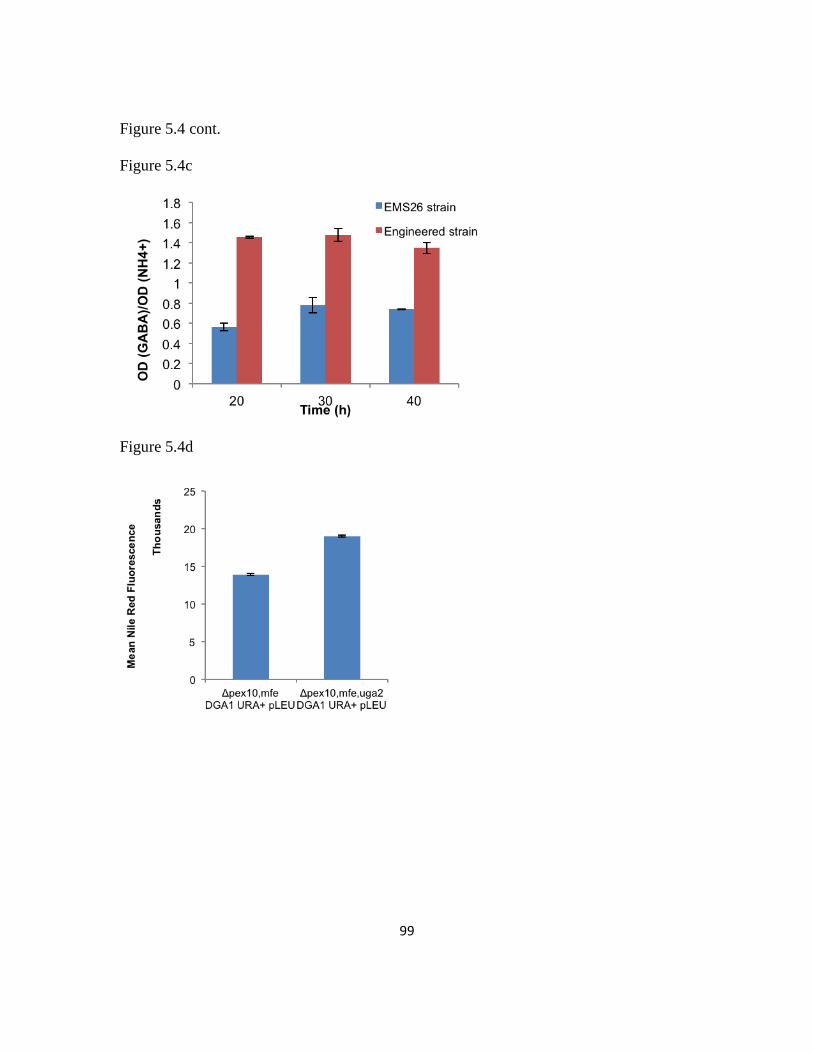
99
Figure 5.4 cont.
Figure 5.4c
Figure 5.4d
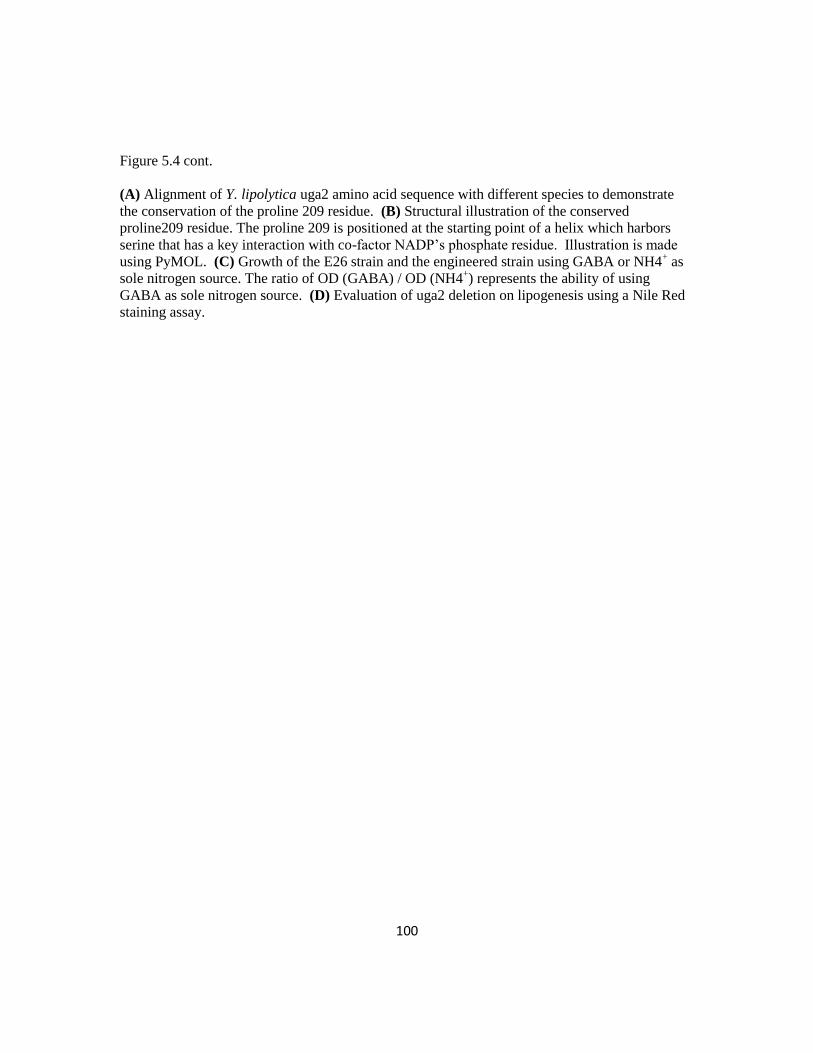
100
Figure 5.4 cont.
(A) Alignment of Y. lipolytica uga2 amino acid sequence with different species to demonstrate
the conservation of the proline 209 residue. (B) Structural illustration of the conserved
proline209 residue. The proline 209 is positioned at the starting point of a helix which harbors
serine that has a key interaction with co-factor NADP’s phosphate residue. Illustration is made
using PyMOL. (C) Growth of the E26 strain and the engineered strain using GABA or NH4+ as
sole nitrogen source. The ratio of OD (GABA) / OD (NH4+) represents the ability of using
GABA as sole nitrogen source. (D) Evaluation of uga2 deletion on lipogenesis using a Nile Red
staining assay.
101
5.3.7 Iterative evolutionary engineering to further improve lipogenesis rates
The first round of evolutionary metabolic engineering produced strains such as
E26 that exhibited improved rates, titers, and yields of lipids. Thus, we sought to iterate
this process using E26 as the parental strain to further enhance lipogenesis rates. In this
round, we opted to carry out the floating selection using flasks instead of culture tubes in
hopes of obtaining strains that were better suited for bioreactor conditions. After five
rounds of enrichment, screening and selection, we first characterized 34 isolated mutants
from this round and chose the top candidate, E26E1, for further testing (Figure 5.5a).
E26E1 had a 31% increase of our lipid ranking metric (OD600*Nile Red mean
fluorescence) compared to the E26 strain and a 97% increase compared to the engineered
strain. Visualization of the E26E1 strain using fluorescence microscopy showed fully
saturated cells (Figure 5.5b). To further evaluate the lipid production performance of
E26E1, we cultivated this strain in a bioreactor with the same conditions as for E26 and
the engineered strain (Figure 5.5c). Overall, E26E1 showed an improved lipogenesis
capacity with a titer of 40.4 g/L and an average specific productivity of 0.55 g/L/h (a
slight increase over E26). The final lipid content reached 85% with a yield of 0.253 g/g
glucose (Table 5.1). More interestingly, between 48 and 72 hours of fermentation, the
instantaneous specific productivity reached 0.86 g/L/h, a 20% increase over the E26
strain. Thus, this further evolved strain could benefit from fed-batch fermentation
operation.
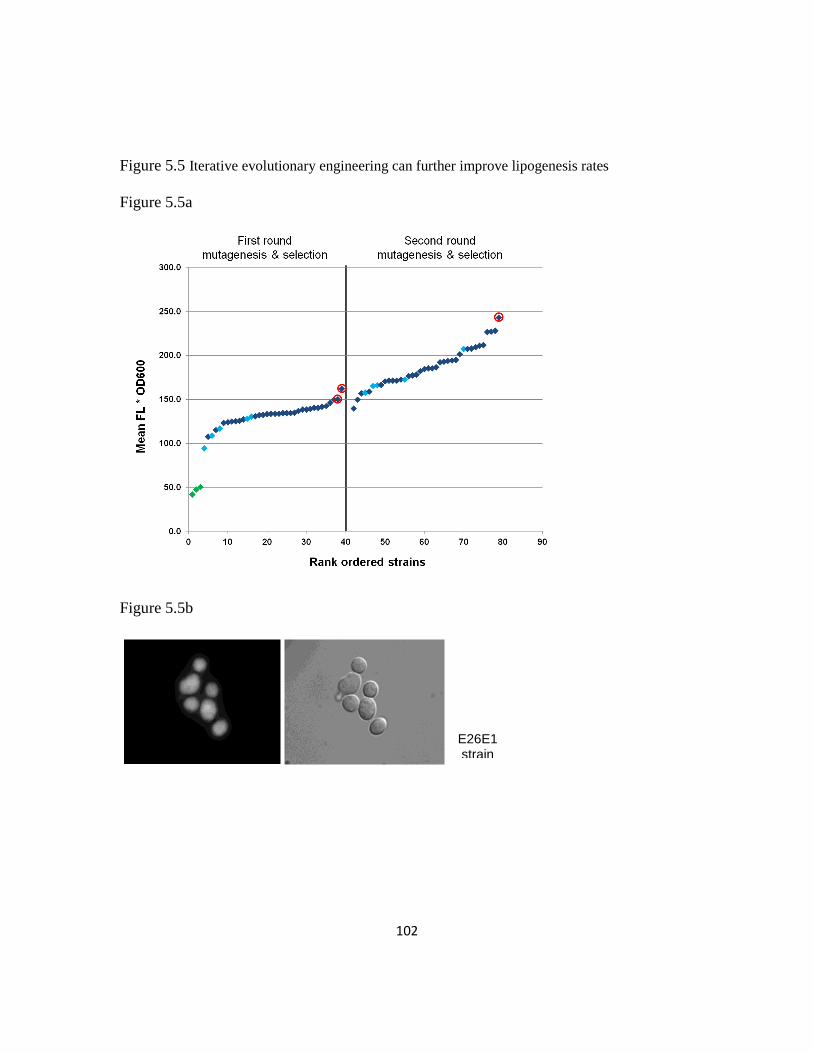
102
Figure 5.5 Iterative evolutionary engineering can further improve lipogenesis rates
Figure 5.5a
Figure 5.5b
E26E1 strain
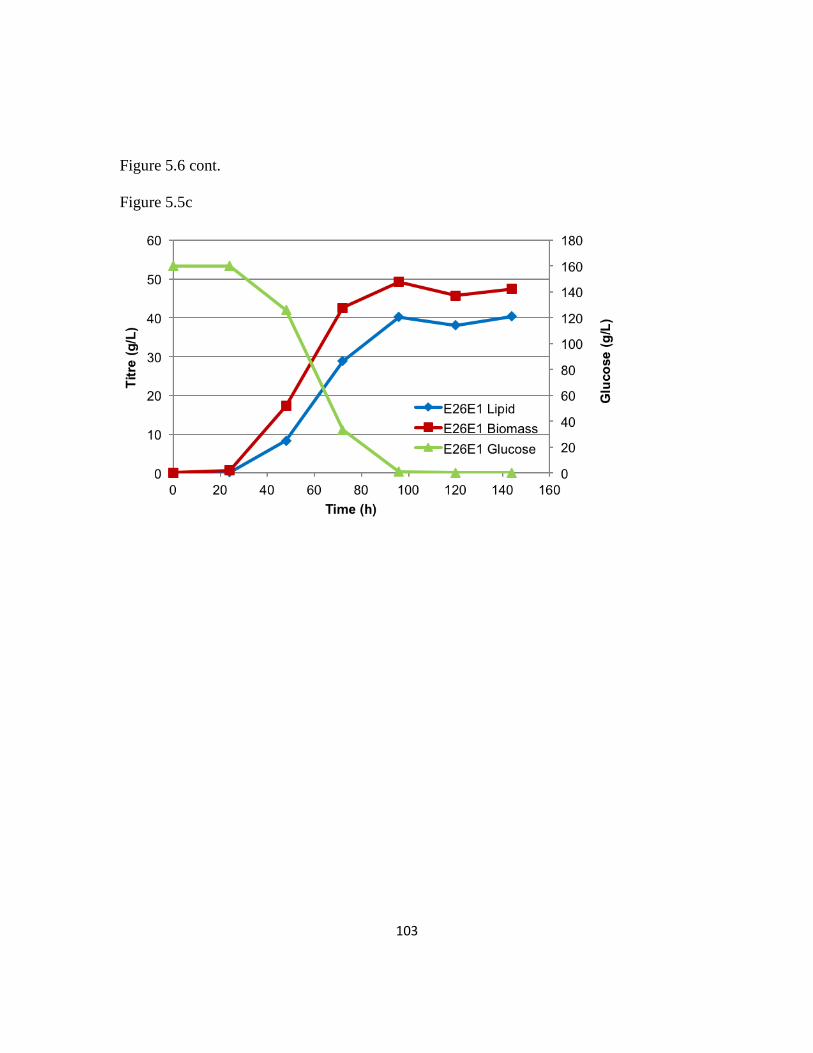
103
Figure 5.6 cont.
Figure 5.5c
104
Figure 5.6 cont.
(A) Overall performance of iterative evolutionary metabolic engineering using Mean Nile Red
fluorescence * OD 600 as metric to rank the strains. Green: the engineering strain; light blue: non
EMS mutagenized control strains; dark blue: isolated EMS mutants. The selected mutant, E26E1
is circled in red. (B) Fluorescence microscopy pictures of the E26E1 strain stained with Nile Red
to visualize lipids. (C) Batch bioreactor fermentation profile of the E26E1 strain for lipid
production.

105
5.3.8 RNA-Seq analysis revealed the importance of glutamate degradation and
DHAP biosynthesis
To further exam the transcriptome level changes in the high lipogenesis strain, we
performed RNA-Seq analysis with E26 stain and the control strain (PO1f leu+ ura
+). Due
to the identified beneficial mutation in uga2 from E26 and E13, we first took a look into
the glutamate degradation pathway genes and compared their expression (based on log2
fold change) to their expression in PO1f leu+ ura+. There are two metabolic pathways for
glutamate degradation in Y. lipolytica. The first pathway (along with expression fold
changes) uses glutamate decarboxylase (GAD1, YALI0F08415g, -0.82 and
YALI0F16753g, -0.37), GABA transaminase (UGA1, YALI0F18238g, no significant
change) and succinate semialdehyde dehydrogenase (UGA2, YALI0F26191g, -0.27).
The second pathway (along with expression fold changes) uses glutamate dehydrogenase
(GDH2, YALI0F17820g, +0.20). These transcriptional changes suggest a downregulated
glutamate decarboxylase pathway and a slightly upregulated glutamate dehydrogenase
pathway. In the glutamate decarboxylase pathway, degradation costs one 2-oxoglutarate
and generates one succinate, however, the glutamate dehydrogenase pathway generates
one 2-oxoglutarate. From this analysis, it is again possible that the glutamate
dehydrogenase pathway can lead to an unbalanced TCA cycle and subsequently lead to
increased citrate secretion from mitochondria. Interestingly, glutamate dehydrogenase
also releases one ammonia molecule during the reaction and we indeed found
106
accumulation of ammonia in the medium as characterized in the high lipid production
strain described in Chapter 4.
To gain a more holistic, global view of gene expression changes in the evolved
strain, we also sought to examine the top overexpressing genes in the E26 strain. Several
of the most highly expressed genes are related to important aspects of lipogenesis such
YCF1 (YALI0E08969g) for antioxidation, SPS19 (YALI0F01650g) for denoyl-CoA
reductase, ACP1 (YALI0D24629g) for acyl-carrier protein. Interestingly,
dihydroxyacetone kinase (YALI0E20691g) was also upregulated. This enzyme generates
dihydroxyacetone phosphate (DHAP), a backbone precursor for triacylglycerol synthesis,
which could be a very important molecule in lipogenesis. Interestingly, further analysis of
DHAP biosynthesis related gene expression demonstrates that both transketolase and
transaldolase were downregulated in E26 (-0.77 and -0.38). This data suggested a
reduced exchange between PPP and glycolysis, which could lead to an accumulation of
glyceraldehyde 3-phosphate (G3P) that can then be converted to DHAP or continue
through glycolysis. The reversible reaction between DHAP and G3P could be an
important regulatory node for lipogenesis, since the carbon flux can go to DHAP (for
lipid biosynthesis), PPP (for generating NADPH and pentose) or continue into glycolysis
to TCA cycle (for most biosynthetic pathway including fatty acid biosynthesis).
5.4 Discussion and conclusion
107
Evolutionary metabolic engineering strategies have been successfully applied to
improve production of molecules such as lactic acid, L-ornithine and isobutanol (31, 165-
166). Here we developed a floating based selection scheme that was able to significantly
increase: (1) lipid titers from 25 g/L to over 40 g/L, (2) average specific productivity
from 0.21 g/L/h to 0.55 g/L/h and (3) overall yield from 0.158 g/g to 0.253 g/g.
Moreover, we were able to achieve maximum instantaneous productivities of 0.86 g/L/h
during the fermentation. Previous rational engineering efforts resulted in unbalanced
strains with increased lipid production at the cost of decreased biomass production and
fitness. In contrast, the floating cell enrichment scheme used here resulted in concurrent
enhanced lipogenesis and biomass formation. Thus, we have efficiently resolved the
competition between product titers and yields by evolutionary engineering following our
rational engineering approach.
The balance of lipogenesis and biomass generation developed here could serve as
a key for industrialized and economically viable production of oleochemcials using Y.
lipolytica. The titer of over 40 g/L is the highest titer reported to the date for this
organism. Furthermore, this evolved strain exhibits lipid accumulation during the cell
growth phase without the need for extensive nitrogen starvation. The result is
improvements in all three metrics for a process: rate, titer, and yield.
In addition to the improvements in lipid production, whole genome sequencing of
the evolved strain produced critical information about the underlying metabolism.
Among the many SNPs identified in this analysis, a major contributing factor to the
observed phenotype was a reduced/loss of function mutation in the uga2 allele. Uga2p

108
functions in the GABA assimilation pathway, which serves as one of two pathways for
glutamate degradation and thus related to nitrogen assimilation, a key factor for
triggering lipogenesis in Y. lipolytica (56). Moreover, previous studies suggest that
nitrogen sources, especially glutamate, can be a critical factor for lipid accumulation
inside the cells (167). In Saccharomyces cerevisiae, uga2 null mutants result in an
accumulation of α-ketoglutarate (168) as well as a decrease in succinic acid (more than 5
fold decrease) (169). Moreover, reductive glutamine metabolism has been suggested as
a function of the α-ketoglutarate to citrate ratio in cells (170). Collectively, this
information suggests the decrease of GABA assimilation could lead to large changes in
carbon flux and result in an imbalance of TCA cycle intermediates which then stalls the
TCA cycle allowing for more flux through to fatty acid biosynthesis. In this regard, this
rewiring may be similar to the function of AMP deaminase as proposed before (56). It is
also likely that decreased GABA assimilation can alter the nitrogen metabolic flux during
the protein degradation stage and also lead to increased lipogenesis. Beyond both carbon
and nitrogen flux, it is known that the glutamate metabolic node is critical in many
processes and can act to buffer redox changes in the cell (171). Furthermore, the relation
between GABA metabolism and the TOR pathway, an important signaling pathway for
lipid accumulation (139), has been suggested (172-173). Thus, it is likely that the overall
rewiring achieved through this evolutionary approach is quite complex. Beyond the
GABA target, two additional notable mutations, YOX1 and OSH6, were also closely
related to known lipogenesis elicitors (i.e. leucine biosynthesis, TOR pathway) (139).
While the overexpression of these mutant alleles did not immediately improve phenotype,

109
they merit further investigation and can likely be novel engineering targets in the future.
Further analysis of the evolved strain E26 with RNA-Seq supported the beneficial effect
of uga2 mutation and revealed the potential importance of DHAP in high lipogenesis.
Overall, as described in this chapter, we developed an evolutionary metabolic
engineering approach that successfully enhanced lipogenesis of a previously engineered Y.
lipolytica strain to achieve lipid titers of 40.5 g/L with an average specific productivity
reaching 0.55 g/L/h, both representing the highest to the date in this organism. Moreover,
cells were saturated with upwards of 89% lipid content in bioreactors. Through whole
genome sequencing and RNA-Seq, we were able to provide a link between GABA
assimilation and lipogenesis. This evolutionary metabolic engineering approach linked
with a simple floating enrichment to enrich high lipogenesis potential presents a platform
for engineering a number of other oleaginous systems including potentially microalgae to
increase lipid production without compromising cell growth. The resulting strains
developed in this chapter should serve as a stepping stone towards creating a robust,
efficient engineering platform for converting carbon sources into value-added
oelochemical and biofuels.
110
Chapter 6: A mutant mga2 protein confers improved lipogenesis in
Yarrowia lipolytica
6.1 Chapter summary
Lipogenic organisms represent great starting points for engineering high lipid
production. While previous engineering efforts were able to significantly improve
lipogenesis in Yarrowia lipolytica (Chapters 4 and 5), understanding of its lipogenesis
process was rather limited. In this chapter, we started from a superior lipid accumulation
strain, L36, and employed whole genome sequencing and inverse metabolic engineering
to identify a mutant mga2 protein conferring improved lipogenesis. Phenotypic
characterization revealed this mutant’s newly-acquired role in regulating the profile of
unsaturated fatty acids. Furthermore, transcriptomic analysis suggested that this mutant
enhancer operates by redirecting the net carbon flux difference from an upregulated
glycolysis pathway and a downregulated TCA cycle into an upregulated fatty acid
synthesis pathway.
111
6.2 Introduction
In Chapters 4 and 5, we described our efforts of exploring the metabolic
landscape of lipogenesis through rational and evolutionary engineering, thus driving
production to titers exceeding 40 g/L in bioreactors. This exploration can also be done in
other ways, such as combining systems and combinatorial engineering of metabolic
enzymes (174), engineering the sensor-regulator system (175) or metabolic switches (11)
as well as engineering global transcriptional regulators (176-177). The landscape scanned
by these approaches contains overlapping phenotypes despite the fact that these
engineering efforts targeted different enzymes and pathways, illustrating the complex
regulation and crosstalk inherent to this system.
Lipogenesis is regulated in a complex manner (178). This complexity can lead to
a disconnection between the expected and actual results of rational engineering.
Regulators play a key role in the lipogenesis regulatory network. Thus, identification and
engineering of global regulators related to lipogenesis could potentially de-bottleneck
lipid production, enriching our understanding over the process and enhancing our
engineering ability. A recent study of SNF1 (179), a regulator for lipid accumulation,
showed that deletion of SNF1 conferred a 2.6 fold improvement to lipid production .
Moreover, results from studies of UBX2 (180) and MIG1 (181) also indicated important
function as regulators of lipogenesis.
112
In this chapter, we report the identification and characterization of a mutant mga2
protein functioning as a lipogenesis enhancer from the L36 mutant strain. In doing so, we
further engineered the strain into a high lipid producer and explored the altered
transcriptomic landscape caused by the mutation. Specifically, we identified a mutant
mga2 exhibiting a similar regulatory effect on unsaturated fatty acid biosynthesis as the
mga2 knockout but which is better able to enhance lipogenesis in Y. lipolytica.
Transcriptomic analysis suggested that a carbon flux imbalance was created by the
upregulation of glycolysis and the downregulation of TCA cycle, leading to upregulated
biosynthesis of acetyl-CoA/acyl-CoA from pyruvate and hence fatty acid production.
6.3 Results
6.3.1 Isolation and whole-genome sequencing of a high lipid producer revealed a
mutant mga2
During the course of metabolic engineering approach to improve lipid production
through construction genomic library (overexpression library on plasmid) and following
screening, we isolated mutant strain (L36) exhibiting a dark purple color when grown on
solid media containing Nile Red, indicative of high lipid content. Strikingly, during
growth in liquid media, this strain settled at the liquid surface while cells from the parent
strain remained at the bottom, indicating a reduced mass density in the mutant, consistent
with increased lipid production. Indeed, Nile Red staining of the mutant strain followed
by fluorescence microscopy indicated almost nothing but lipid inside the cells (Figure
113
5.1, Chapter 5). Furthermore, TLC plate analysis of cell extracts indicated that the
majority of accumulated lipids were in the form of triacylglycerol (Figure 6.1a).
However, this significant improvement is not due to the plasmid the strain contained due
to no beneficial effect was detected when the plasmid was transformed into a control
strain.
In order to identify the mechanism underlying this superior lipid accumulation
phenotype, we isolated genomic DNA and performed whole-genome sequencing with
strain L36 using the Illumina HiSeq platform yielding 2x100bp reads. A 47x coverage
was obtained and single nucleotide polymorphism (SNP) analysis was performed by
mapping the sequences to the CLIB122 genome (65) and comparing these to the SNPs
identified from the draft genome sequence of the PO1f strain (Chapter 5). After filtering
the sequences (Q>30), a total of 259 SNPs were identified in L36. Manual curation using
the IGV genome browser (159) revealed that there is only one coding region mutation in
L36: YALI0B12342g (g1927a), corresponding to MGA2 (g1927a). Mga2 has been well-
studied as regulator for multiple cellular processes. It is known to be proteolytically
processed on the ER membrane before translocation into the nucleus to function as a
transcriptional regulator for delta-9 desaturase gene expression with its homolog spt23
(182-185). Overexpression of mga2 can also influence the chromatin accessibility (186).
Mga2 has also been associated with hypoxia as well as with glucose sensing (187-188).
Its linkage with lipogenesis has also been studied in S. cerevisiae, showing that
overexpression of mga2 was accompanied by the appearance of large lipid particles due
114
to accumulation of unsaturated triacylglycerol (189). To understand the potential impact
of the isolated mutation on mga2 function, we first analyzed the mga2 protein sequence
from Y. lipolytica using the Simple Modular Analysis Research Tool (SMART) (190).
This analysis revealed the presence of putative functional domains which were identical
and arranged similarly to other mga2 proteins: an IPT domain (DNA-binding domain), an
ankyrin-like domain (protein binding domain) and a transmembrane (TM) domain. The
isolated mutation occurs in the middle of the DNA-binding domain and the protein
binding domain at position amino acid 643, changing a glycine into arginine
(mga2G643R).
6.3.2 MGA2 (g1927a) leads to superior lipogenesis compared with MGA2 deletion
We sought to test the importance of the mga2G643R mutation using inverse
metabolic engineering. We first knocked out the mutant mga2 gene from L36. The lipid
accumulation from the resulting strain L36 Δmga2(g1927a) leu+ was dramatically
decreased compared with L36 leu+, confirming the importance of this SNP to the superior
lipogenesis phenotype in L36 (Figure 6.1b). Subsequently, we deleted wild-type mga2
from the parent strain PO1f (PO1fΔmga2 leu+) and then integrated the mutant mga2
(including 1000bp upstream of the start codon to preserve native expression/regulation)
to test whether this SNP is the dominant mutation causing a superior lipogenesis
phenotype. The resulting strain PO1fΔmga2 MGA2(g1927a) leu+ exhibits an almost, if
not all, restored phenotype compared to L36 leu+ (Figure 6.1b,c). In particular, knockout
115
of mga2 from PO1f resulted in an over 2 fold increase in Nile Red signal, and
introduction of mutant mga2 restored the superior lipogenesis phenotype as characterized
by Nile Red straining (Figure 6.1b) as well as the floating phenotype (Figure 6.1c).
Hence, mga2 is an important lipogenesis regulator in Y. lipolytica. While knockout can
improve lipogenesis, the mutant mga2 identified here functions as a superior lipogenesis
enhancer. Collectively, these results suggest that this mutant mga2 protein results in a
gain-of-function in the context of lipogenesis.
Figure 6.1 MGA2 (g1927a) leads to superior lipogenesis and is better than an MGA2
deletion
Figure 6.1a

116
Figure 6.1 cont.
Figure 6.1b
Figure 6.1c
117
Figure 6.1 cont.
(A) TLC plate analysis showing that majority of lipid accumulated in L36 is in the form of
triacylglycerol. (B) Nile Red staining characterized with flow cytometry for strains through
inverse metabolic engineering process. (C) Floating phenotype exhibited with L36 leu+ and
PO1fΔmga2 MGA2(g1927a) leu+ after cultivation.
118
6.3.3 Metabolic engineering of strain L36 for high lipid production
While L36 showed promising lipid accumulation traits, its lipid production
potentials were not yet fully explored. To further enhance its lipid production capacity,
we sought to introduce two previously identified lipogenesis enhancers: PEX10
(pexisome biogenesis factor 10) knockout and DGA1(diacylglycerol acyltransferase 1)
overexpression, as identified in Chapter 4. We first integrated DGA1 into L36 with
leucine and uracil biosynthesis capacity, improving Nile Red fluorescence by 13%
(Figure 6.2a). Intriguingly, knockout PEX10 significantly decreased lipid accumulation
inside the cells (Figure 6.2a). To further examine the lipid production performance of the
engineered mutant strain, cultivation in a bioreactor was undertaken (Figure 6.2b). The
lipid titer reached 25 g/L with a specific productivity of 0.142 g/L/h, suggesting its
potential for use as an industrial production host. Both measures are comparable to those
from the rational metabolic engineering efforts described in Chapter 4.

119
Figure 6.2 Metabolic engineering lipid production in strain L36
Figure 6.2a
Figure 6.2b
(A) Lipogenesis among control strain, L36 leu+ ura
+, engineered strains L36 DGA1 leu
+ ura
+ and
L36 Δpex10 leu+ ura
+ were characterized using flow cytometry with Nile Red strained cells. (B)
Fed batch bioreactor fermentation profile of the L36 DGA1 leu+ ura
+ strain for lipid production.
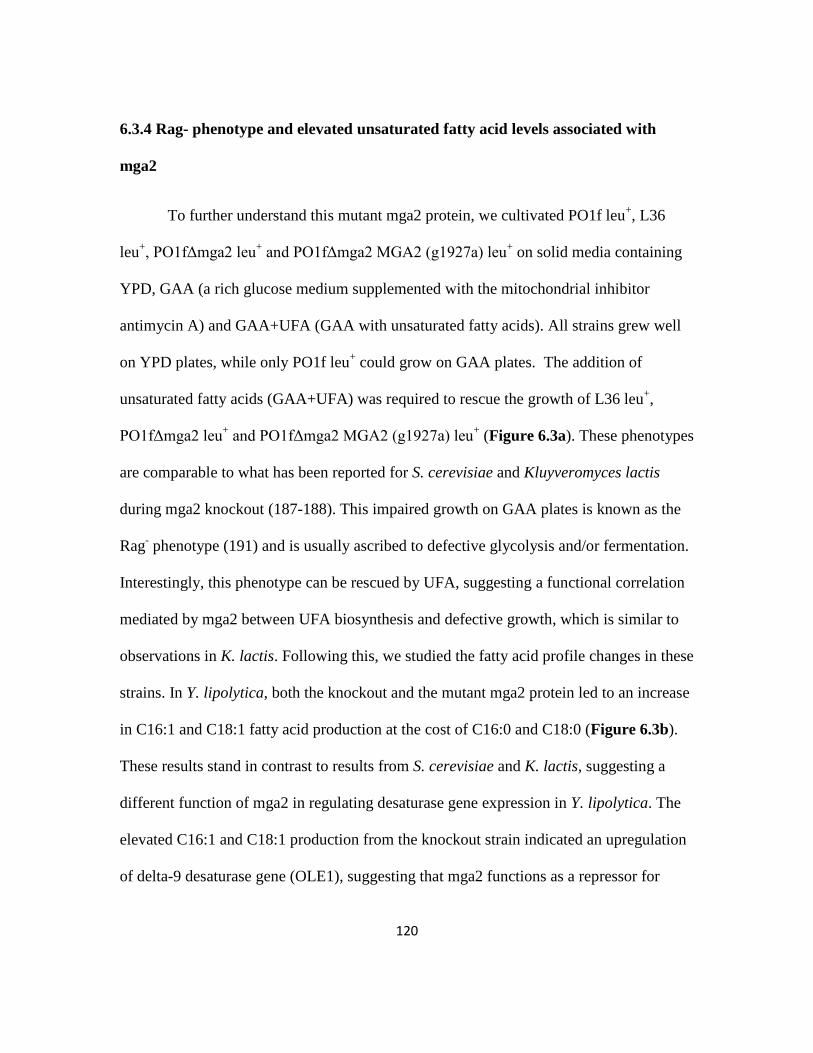
120
6.3.4 Rag- phenotype and elevated unsaturated fatty acid levels associated with
mga2
To further understand this mutant mga2 protein, we cultivated PO1f leu+, L36
leu+, PO1fΔmga2 leu
+ and PO1fΔmga2 MGA2 (g1927a) leu
+ on solid media containing
YPD, GAA (a rich glucose medium supplemented with the mitochondrial inhibitor
antimycin A) and GAA+UFA (GAA with unsaturated fatty acids). All strains grew well
on YPD plates, while only PO1f leu+ could grow on GAA plates. The addition of
unsaturated fatty acids (GAA+UFA) was required to rescue the growth of L36 leu+,
PO1fΔmga2 leu+ and PO1fΔmga2 MGA2 (g1927a) leu
+ (Figure 6.3a). These phenotypes
are comparable to what has been reported for S. cerevisiae and Kluyveromyces lactis
during mga2 knockout (187-188). This impaired growth on GAA plates is known as the
Rag- phenotype (191) and is usually ascribed to defective glycolysis and/or fermentation.
Interestingly, this phenotype can be rescued by UFA, suggesting a functional correlation
mediated by mga2 between UFA biosynthesis and defective growth, which is similar to
observations in K. lactis. Following this, we studied the fatty acid profile changes in these
strains. In Y. lipolytica, both the knockout and the mutant mga2 protein led to an increase
in C16:1 and C18:1 fatty acid production at the cost of C16:0 and C18:0 (Figure 6.3b).
These results stand in contrast to results from S. cerevisiae and K. lactis, suggesting a
different function of mga2 in regulating desaturase gene expression in Y. lipolytica. The
elevated C16:1 and C18:1 production from the knockout strain indicated an upregulation
of delta-9 desaturase gene (OLE1), suggesting that mga2 functions as a repressor for
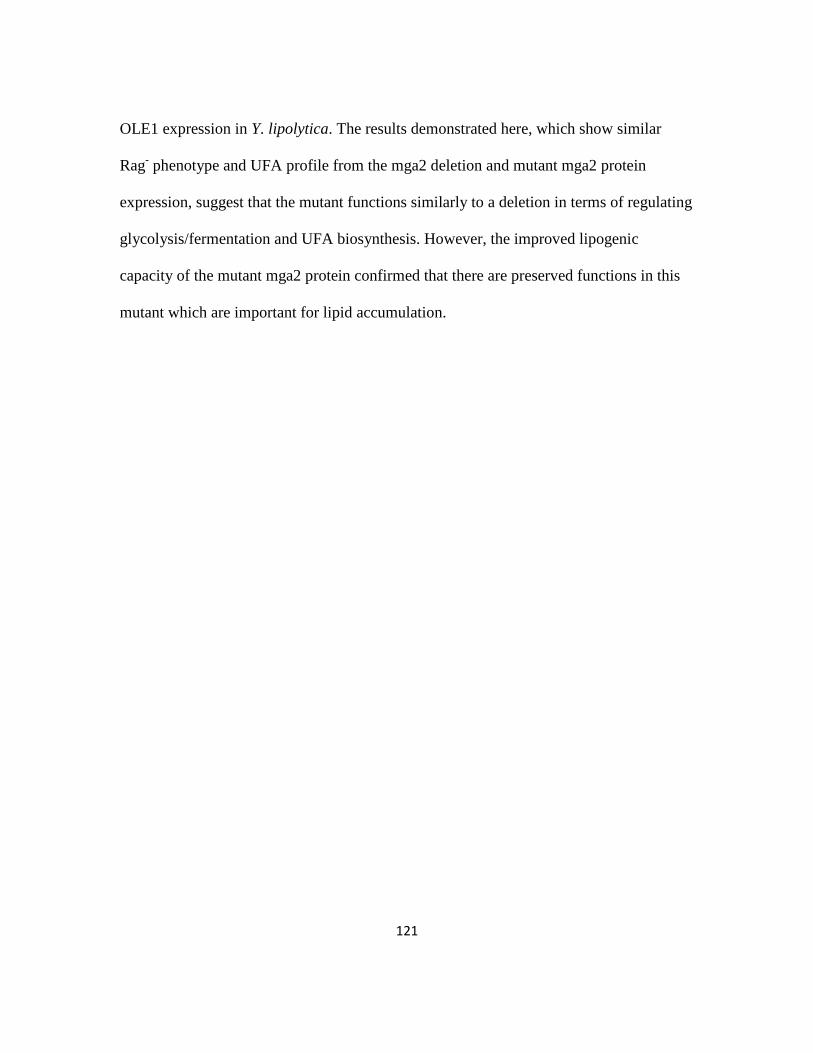
121
OLE1 expression in Y. lipolytica. The results demonstrated here, which show similar
Rag- phenotype and UFA profile from the mga2 deletion and mutant mga2 protein
expression, suggest that the mutant functions similarly to a deletion in terms of regulating
glycolysis/fermentation and UFA biosynthesis. However, the improved lipogenic
capacity of the mutant mga2 protein confirmed that there are preserved functions in this
mutant which are important for lipid accumulation.
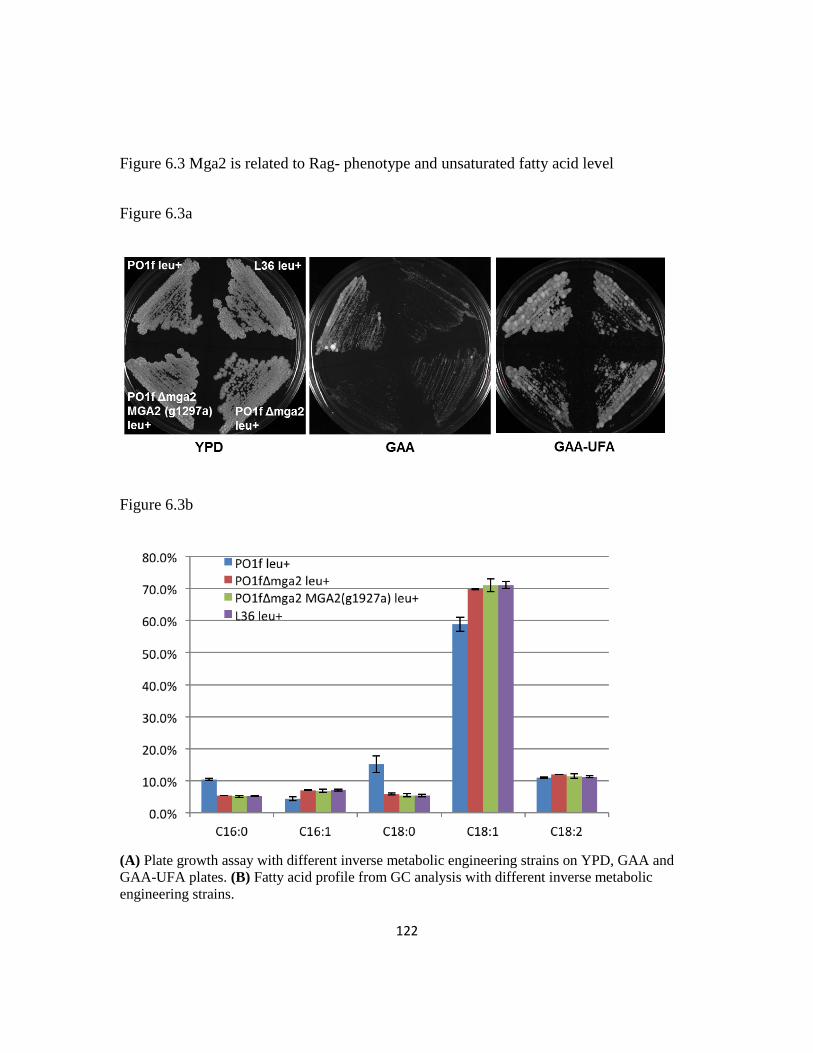
122
Figure 6.3 Mga2 is related to Rag- phenotype and unsaturated fatty acid level
Figure 6.3a
Figure 6.3b
(A) Plate growth assay with different inverse metabolic engineering strains on YPD, GAA and
GAA-UFA plates. (B) Fatty acid profile from GC analysis with different inverse metabolic
engineering strains.
123
6.3.5 Link the mga2G643R with phenotype using RNA-Seq
To further probe the mechanisms underlying the phenotypic changes resulting
from mga2G643R, we performed RNA-Seq analysis with PO1f leu+ and PO1fΔmga2
MGA2 (g1927a) leu+. Overall, we identified 429 upregulated and 467 downregulated
genes (> 1-fold change) with edgeR (192). Due to changes in the fatty acid profile, we
first examined the expression of desaturase genes. Indeed, the expression of delta-9
desaturase (YALI0C05951g) and delta-12 desaturase (YALI0B10153g) were upregulated
in the inverse engineered strain, explaining the increased level of C16:1/C18:1 and C18:2
fatty acids.
Due to the importance of acetyl-CoA/malonyl-CoA and glycerol-3-phosphate
(G3P) in lipid biosynthesis, we also examined the expression of genes related to their
biosynthesis (Figure 4). We found that while most of the genes involved in glycolysis
were significantly upregulated in the mutant strain, genes related to TCA cycles were not,
especially the genes close to citrate biosynthesis. This observation raises the possibility
that the improved lipogenesis in the inverse engineered strain results from the generation
of extra carbon flux due to an imbalance between increased glycolysis and reduced TCA
cycle. This net carbon flux could then be funneled into acetyl-CoA biosynthesis through
the upregulated pyruvate dehydrogenase and citrate synthase. However, it is also
interesting to note that pyruvate decarboxylase, another possible route to generate acetyl-
CoA from pyruvate, is downregulated. While pyruvate dehydrogenase yields one NADH
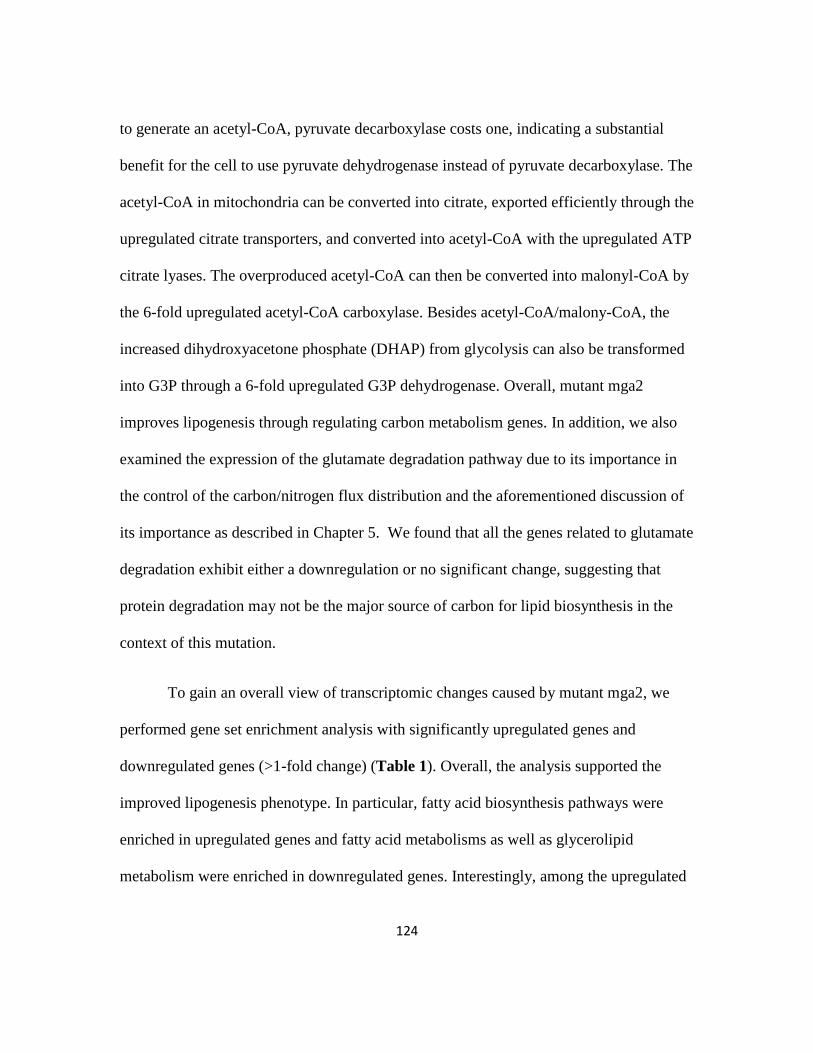
124
to generate an acetyl-CoA, pyruvate decarboxylase costs one, indicating a substantial
benefit for the cell to use pyruvate dehydrogenase instead of pyruvate decarboxylase. The
acetyl-CoA in mitochondria can be converted into citrate, exported efficiently through the
upregulated citrate transporters, and converted into acetyl-CoA with the upregulated ATP
citrate lyases. The overproduced acetyl-CoA can then be converted into malonyl-CoA by
the 6-fold upregulated acetyl-CoA carboxylase. Besides acetyl-CoA/malony-CoA, the
increased dihydroxyacetone phosphate (DHAP) from glycolysis can also be transformed
into G3P through a 6-fold upregulated G3P dehydrogenase. Overall, mutant mga2
improves lipogenesis through regulating carbon metabolism genes. In addition, we also
examined the expression of the glutamate degradation pathway due to its importance in
the control of the carbon/nitrogen flux distribution and the aforementioned discussion of
its importance as described in Chapter 5. We found that all the genes related to glutamate
degradation exhibit either a downregulation or no significant change, suggesting that
protein degradation may not be the major source of carbon for lipid biosynthesis in the
context of this mutation.
To gain an overall view of transcriptomic changes caused by mutant mga2, we
performed gene set enrichment analysis with significantly upregulated genes and
downregulated genes (>1-fold change) (Table 1). Overall, the analysis supported the
improved lipogenesis phenotype. In particular, fatty acid biosynthesis pathways were
enriched in upregulated genes and fatty acid metabolisms as well as glycerolipid
metabolism were enriched in downregulated genes. Interestingly, among the upregulated
125
genes, analysis with INTROPRO suggested the enrichment of mitochondrial substrate
carrier genes. Among these, citrate and oxoglutarate carrier protein (YALI0B10736g)
exhibited a 6.2-fold overexpression, which could be very important as this protein
functions to export citrate from mitochondria and import oxoglutarate, with a net export
of NADPH (193). As a consequence, this gene could supply citrate for acetyl-CoA
biosynthesis as well as NADPH as cofactor for fatty acid biosynthesis. Oxaloacetate
carrier (OAC1, YALI0E04048g) also represents an important link to citrate export: it
takes in oxaloacetate, which is produced by ATP citrate lyases when converting citrate to
acetyl-CoA, thus recycling carbon back to the TCA cycle. Furthermore, one ATP–ADP
translocase protein (AAC, YALI0A10659g), which is responsible for importing ADP into
and exporting ATP out of the mitochondria, is also overexpressed. This protein could
supply ATP to the ATP citrate lyases for production of acetyl-CoA, as well as supply
energy to other cellular processes. Among the significantly downregulated genes, we
found that the fatty acid metabolism pathway (KEGG) was enriched in significantly
downregulated genes, including POX2 (YALI0F10857g), POX3 (YALI0D24750g),
POX5 (YALI0C23895g), enoyl-CoA dehydrase (YALI0B10406g) confirming a decrease
in fatty acid degradation. We also found that glycerolipid metabolism was enriched, in
particular DGA1 (YALI0D07986g), a very important lipogenesis enhancer as identified
in Chapter 4, suggesting that the improvement to lipid accumulation is mainly due to
initial carbon flux rewiring, further verifying the previous beneficial results obtained
from the metabolic engineering of L36.
126
As a transcriptional regulator, this mutant mga2 protein could also regulate the
expression of other regulators to achieve this complex rewiring of cellular metabolism.
To understand this process a more deeply, we analyzed the upregulated and
downregulated genes separately using SCOPE to investigate the enrichment of motifs in
the promoter region (-800). When comparing the top 10 candidates from both sets to the
known transcription factor binding sites in S. cerevisiae (194), we found that enriched
motifs showed similarity to the binding sites of mig1,2,3 proteins (aytttcwgt and thttatta)
and sko1 protein (tacgtab) in the promoters of upregulated genes, and leu3 protein
(gttaacd) and azf1 protein (aaaga) in the downregulated genes. These transcription factors
are closely linked with cellular metabolism, in particular the regulation of carbon and
nitrogen uptake. Collectively, mutant mga2 improved lipogenesis by rewiring cellular
metabolism related to carbon flux, fatty acid related biosynthesis and degradation as well
as other cellular metabolic regulators.
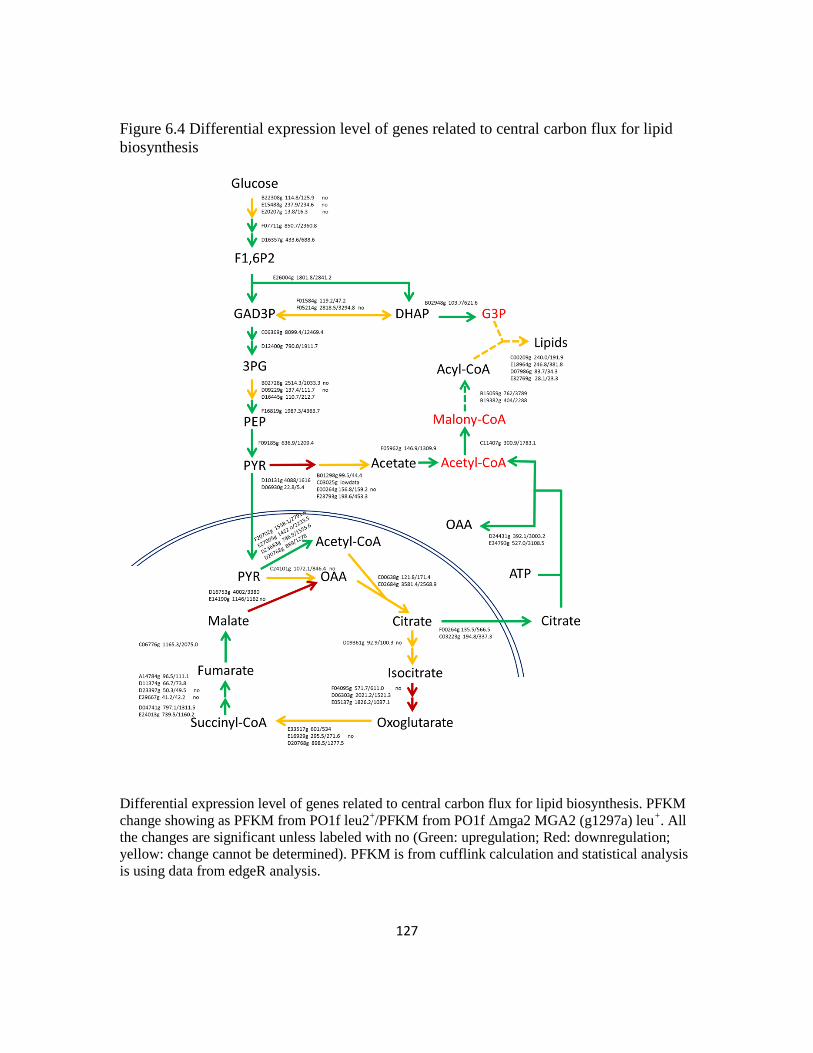
127
Figure 6.4 Differential expression level of genes related to central carbon flux for lipid
biosynthesis
Differential expression level of genes related to central carbon flux for lipid biosynthesis. PFKM
change showing as PFKM from PO1f leu2+/PFKM from PO1f Δmga2 MGA2 (g1297a) leu
+. All
the changes are significant unless labeled with no (Green: upregulation; Red: downregulation;
yellow: change cannot be determined). PFKM is from cufflink calculation and statistical analysis
is using data from edgeR analysis.

128
Table 6.1 Gene set enrichment analysis with significant differential expressed genes from
RNA-Seq experiments
Upregulated genes Downregulated genes
GOTERM
GO:0018130~heterocyclebiosyntheticprocess
GO:0030001~metaliontransport
GO:0016053~organicacidbiosyntheticprocess
GO:0046942~carboxylicacidtransport
GO:0046394~carboxylicacidbiosyntheticprocess
GO:0015837~aminetransport
GO:0008610~lipidbiosyntheticprocess GO:0015849~organicacidtransport
GO:0044271~nitrogencompoundbiosyntheticprocess
GO:0006865~aminoacidtransport
GO:0055114~oxidationreduction GO:0055114~oxidationreduction
GO:0042278~purinenucleosidemetabolicprocess
GO:0006812~cationtransport
GO:0046128~purineribonucleosidemetabolicprocess
GO:0006811~iontransport
GO:0051188~cofactorbiosyntheticprocess
GO:0000041~transitionmetaliontransport
GO:0016021~integraltomembrane GO:0006825~copperiontransport
GO:0031224~intrinsictomembrane GO:0006071~glycerolmetabolicprocess
GO:0033293~monocarboxylicacidbinding
GO:0019400~alditolmetabolicprocess
GO:0004806~triacylglycerollipaseactivity
GO:0019751~polyolmetabolicprocess
GO:0016836~hydro-lyaseactivity GO:0051252~regulationofRNAmetabolicprocess
GO:0009374~biotinbinding GO:0006355~regulationoftranscription,DNA-dependent
GO:0045449~regulationoftranscription
GO:0016021~integraltomembrane
GO:0031224~intrinsictomembrane
GO:0005576~extracellularregion
GO:0046873~metaliontransmembranetransporteractivity
GO:0046915~transitionmetaliontransmembranetransporteractivity
GO:0015171~aminoacidtransmembranetransporteractivity
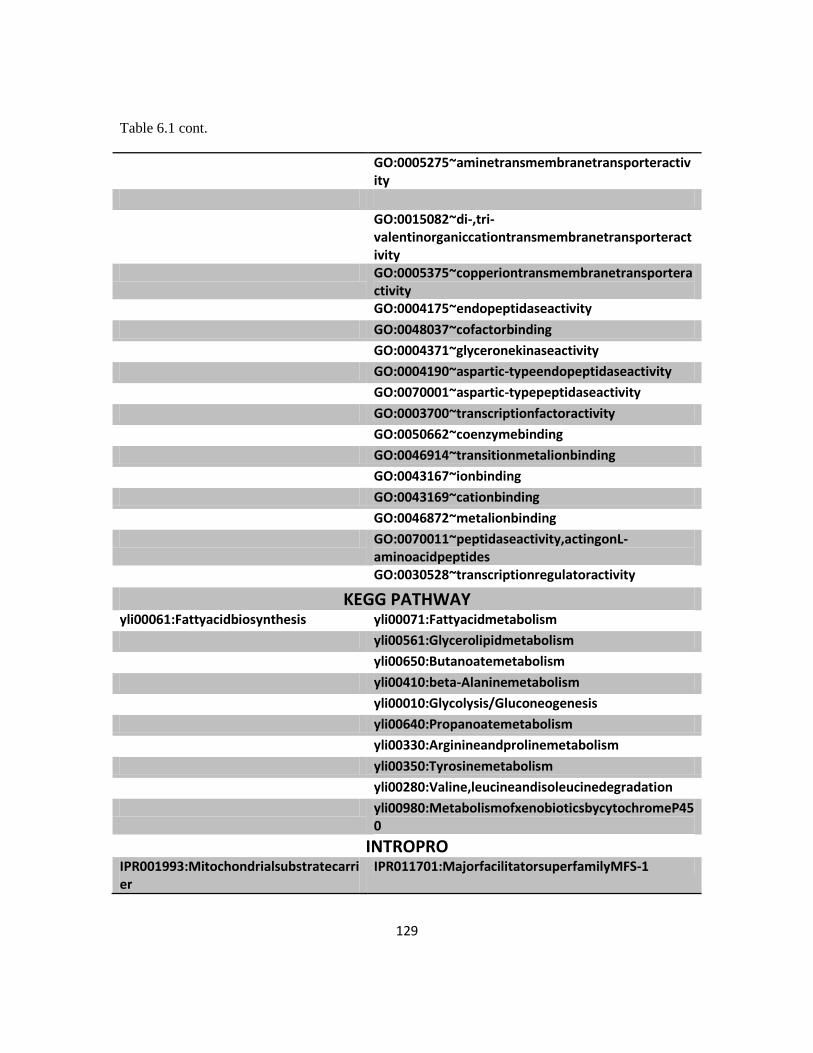
129
Table 6.1 cont.
GO:0005275~aminetransmembranetransporteractivity
GO:0015082~di-,tri-valentinorganiccationtransmembranetransporteractivity
GO:0005375~copperiontransmembranetransporteractivity
GO:0004175~endopeptidaseactivity
GO:0048037~cofactorbinding
GO:0004371~glyceronekinaseactivity
GO:0004190~aspartic-typeendopeptidaseactivity
GO:0070001~aspartic-typepeptidaseactivity
GO:0003700~transcriptionfactoractivity
GO:0050662~coenzymebinding
GO:0046914~transitionmetalionbinding
GO:0043167~ionbinding
GO:0043169~cationbinding
GO:0046872~metalionbinding
GO:0070011~peptidaseactivity,actingonL-aminoacidpeptides
GO:0030528~transcriptionregulatoractivity
KEGG PATHWAY
yli00061:Fattyacidbiosynthesis yli00071:Fattyacidmetabolism
yli00561:Glycerolipidmetabolism
yli00650:Butanoatemetabolism
yli00410:beta-Alaninemetabolism
yli00010:Glycolysis/Gluconeogenesis
yli00640:Propanoatemetabolism
yli00330:Arginineandprolinemetabolism
yli00350:Tyrosinemetabolism
yli00280:Valine,leucineandisoleucinedegradation
yli00980:MetabolismofxenobioticsbycytochromeP450
INTROPRO
IPR001993:Mitochondrialsubstratecarrier
IPR011701:MajorfacilitatorsuperfamilyMFS-1
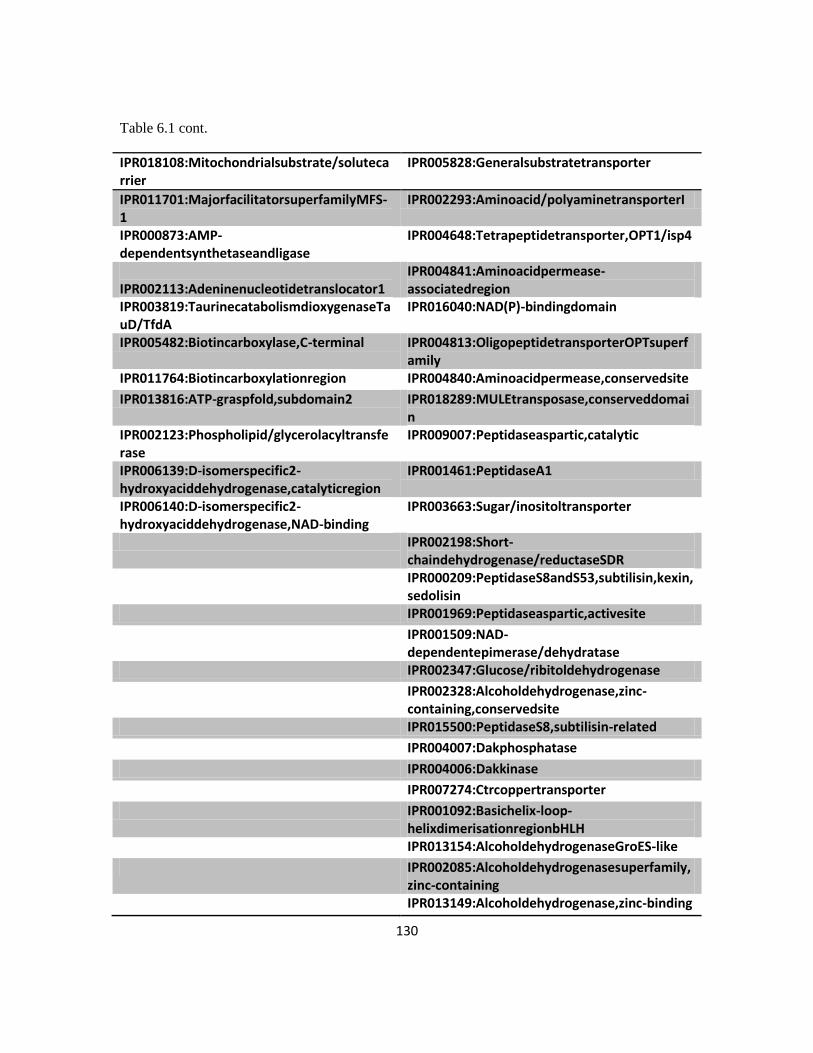
130
Table 6.1 cont.
IPR018108:Mitochondrialsubstrate/solutecarrier
IPR005828:Generalsubstratetransporter
IPR011701:MajorfacilitatorsuperfamilyMFS-1
IPR002293:Aminoacid/polyaminetransporterI
IPR000873:AMP-dependentsynthetaseandligase
IPR004648:Tetrapeptidetransporter,OPT1/isp4
IPR002113:Adeninenucleotidetranslocator1
IPR004841:Aminoacidpermease-associatedregion
IPR003819:TaurinecatabolismdioxygenaseTauD/TfdA
IPR016040:NAD(P)-bindingdomain
IPR005482:Biotincarboxylase,C-terminal IPR004813:OligopeptidetransporterOPTsuperfamily
IPR011764:Biotincarboxylationregion IPR004840:Aminoacidpermease,conservedsite
IPR013816:ATP-graspfold,subdomain2 IPR018289:MULEtransposase,conserveddomain
IPR002123:Phospholipid/glycerolacyltransferase
IPR009007:Peptidaseaspartic,catalytic
IPR006139:D-isomerspecific2-hydroxyaciddehydrogenase,catalyticregion
IPR001461:PeptidaseA1
IPR006140:D-isomerspecific2-hydroxyaciddehydrogenase,NAD-binding
IPR003663:Sugar/inositoltransporter
IPR002198:Short-chaindehydrogenase/reductaseSDR
IPR000209:PeptidaseS8andS53,subtilisin,kexin,sedolisin
IPR001969:Peptidaseaspartic,activesite
IPR001509:NAD-dependentepimerase/dehydratase
IPR002347:Glucose/ribitoldehydrogenase
IPR002328:Alcoholdehydrogenase,zinc-containing,conservedsite
IPR015500:PeptidaseS8,subtilisin-related
IPR004007:Dakphosphatase
IPR004006:Dakkinase
IPR007274:Ctrcoppertransporter
IPR001092:Basichelix-loop-helixdimerisationregionbHLH
IPR013154:AlcoholdehydrogenaseGroES-like
IPR002085:Alcoholdehydrogenasesuperfamily,zinc-containing
IPR013149:Alcoholdehydrogenase,zinc-binding
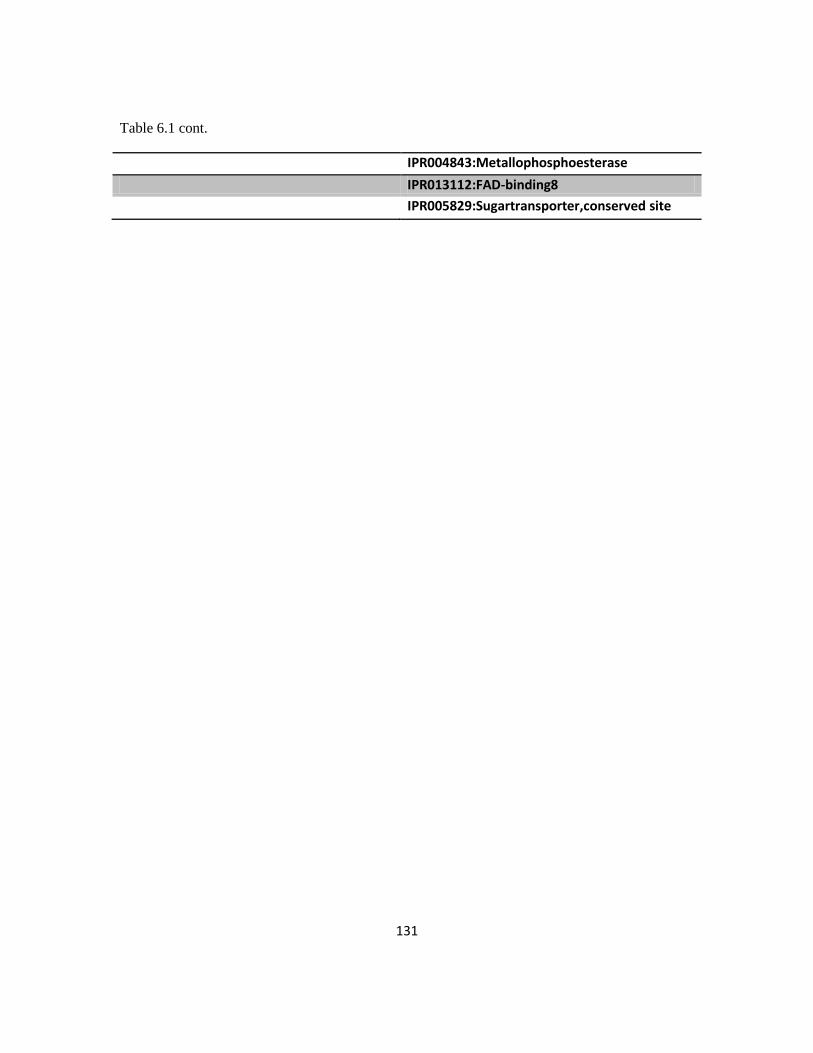
131
Table 6.1 cont.
IPR004843:Metallophosphoesterase
IPR013112:FAD-binding8
IPR005829:Sugartransporter,conserved site
132
6.4 Discussion and conclusion
Lipogenesis is a complex and energy-consuming process. Rewiring this process
usually requires complex cellular metabolic engineering, which is time and labor
intensive. The mutant mga2 protein conferring improved lipogenesis identified here
strongly validated the power of transcriptional regulators in altering a complex cellular
phenotype. Strikingly, when compared to the rational metabolic engineering for high
lipogenesis in this yeast as presented in Chapter 4, which required a large scale
exploration of lipogenesis-related targets, this single SNP in the genome placed its de
novo lipid accumulation on par with the engineered strain (139). The nature of this result
is characteristic of the gTME (global transcriptional machinery engineering) approach
(177); single mutations in enzymatic proteins are usually not enough to dramatically
improve complex cellular phenotypes and sequential beneficial mutations are hard to
achieve without strong selection pressure. However, simple mutations to global
transcriptional regulators can alter the metabolism of the whole cell to a very large extent,
thus efficiently improving a complex phenotype.
Although the results of plate assays for the Rag- phenotype resembled those from
K. lactis and S. cerevisiae, the alterations to the fatty acids profile was different. In K.
lacis, there is an increase of C18:1 at the cost of C18:2 and C18:3 (188) while in S.
cerevisiae, there is reduction of C16:1 and an increase in C18:1 (195). This data suggests
a difference in mga2’s function in Y. lipolytica. In addition, the changes in UFA with
mutant mga2 could also explain the detrimental effect of the PEX10 knockout in L36.
133
Moreover, the mga2 knockout strain contained a similar fatty acid profile to the strain
with mutant mga2, indicating a similar loss of function over the control of OLE1 from
this mutation. However, the clearly improved lipogenesis as illustrated by the floating
phenotype and Nile Red staining suggests that the mutant protein functions differently
than the knockout. Indeed, previous studies also suggested that mga2 could regulate the
stability of OLE1 mRNA through exosome-mediated mechanisms (182) as well as
influencing chromatin accessibility (186), presenting the possibility of an incomplete
loss of function from the mutation.
Despite the lack of a conversed domain predicted to contain the mutation,
alignment of mga2 sequences from different species showed that the mutant position and
adjacent sequences are actually highly conserved with other yeast species such as S.
cerevisiae and Scheffersomyces stipitis (196) (Figure 6.5). Interestingly, this conserved
region in S. cerevisiae (VGLKMNGKLEDAR) has been predicted to be subject to
ubiquitination on the second lysine (197). A recent study also suggested that the region
between the IPT domain and the ANK domain are putative sites of initial degradation
and processing of mga2 in S. cerevisiae (198). This process is similar to its human
homolog NFκB (199). However, in Y. lipolytica mga2 as well as in the homologous
sequences from two other oleaginous yeast sequences Rhodosporidium toruloides (200)
and Rhodotorula glutinis (201), there is an arginine in the position of lysine, which is
likely to stop ubiquitination and the resulting degradation. Moreover, in sequence of the
homologous regulator spt23, there remains a lysine at this position (Figure 6.5). In
134
addition, two lysine residues within membrane-anchored mga2 have also been studied as
targets of Rsp5p ubiquitination for cleavage (202). These results suggest the possibility of
multi-step processing of mga2, and hence a complex underlying regulation mechanism. A
previous study with its human relative, NFκB, indicated the possibility of non-
ubiqutination dependent processing in the conserved region aforementioned (203), raising
the possibility that due to the level of sequence conservation, processing can occur with
native mga2 in Y. lipolytica but not the mutant one. As a consequence, mga2G643R does
not get activated to carry out its full function as a transcriptional factor yet still functions
in other ways such as improving RNA stability, which could explain both the similarities
and differences between mga2G643R and mga2 deletion.
When comparing the differential gene expression data obtained here with that
obtained from another regulator (SNF1 knockout) for lipogenesis in Y. lipolytica (179),
out of 49 targets identified for SNF 1 knockout, 32 of these showed differential
expression in mutant mga2 strain, with 3 out of 8 downregulated genes and 24 out of 41
upregulated genes overlapping. This suggests there are similar underlying lipogenesis
rewiring mechanisms shared between the two modifications. However, the large number
of targets identified through this study may indicate a more complex and complete
rewiring over cellular metabolism using the mutant mga2 protein, which also led to a
better lipogenesis phenotype comparing to the SNF1 knockout. Indeed, through the
promoter motif enrichment analysis, the potential of involvement of several
transcriptional factors was revealed. Mig1,2,3 proteins have been studied for their role in
135
mediating glucose repression and sko1 protein has been shown to interact with mig
proteins as well as to regulate cellular metabolism under oxidative stress (204-205). Leu3
is a key transcriptional regulator for branched-chain amino acid metabolism in S.
cerevisiae (206) and azf1 (207) has also been linked with nitrogen assimilation. This
information indicates a global regulatory change resulting from the mutant mga2 to
rewire whole cellular metabolism through the glucose repression and nitrogen
assimilation.
There is an increased level of unsaturated fatty acids in the mutant strain and the
mga2 deletion strain. This increment should result from upregulated desaturase gene
expression. Desaturases such as OLE1 in yeast and the mammal homolog Stearoyl-CoA
desaturase-1 (SCD1) have been shown to be functionally important to fatty acid
biosynthesis. Deletion of OLE1 (ole1Δ/Δ) in Candida parapsilosis severely impaired
lipid droplet formation inside the cells (208). Furthermore, increases to SCD1 activity in
CHO cells is sufficient to increase triglyceride accumulation when supplemented with
exogenous palmitic acid, and this increased triglyceride synthesis associated with SCD1
overexpression can also protect against lipoapoptosis (209). In addition, SCD in C.
elegans also showed an ability to regulate fatty acid biosynthesis (184). Unsaturated fatty
acid biosynthesis is usually tightly regulated due to its importance to membrane fluidity.
This elevated unsaturated fatty acids level along with improved lipogenesis indicates that
regulation over UFA biosynthesis could be one of the bottlenecks for improving
lipogenesis.
136
Lipogenic organisms provide an ideal platform for biodiesel and oleochemical
production. However, to fully develop a platform for industrial level production,
understanding the regulatory aspects of lipogenesis can be very beneficial. In this chapter,
we successfully identified and confirmed a mutant mga2 protein as a novel lipogenesis
regulator through whole genome sequencing. This mutant mga2 protein leads to a
superior lipid accumulation phenotype and an elevated unsaturated fatty acids level.
Through probing the transcriptomic changes associated with the mutant mga2, we were
able to show that mutant mga2 acts to funnel carbon flux to fatty acid biosynthesis.
Further metabolic engineering of this mutant strain led to a high lipid producer with a
titer of 25 g/L. The altered fatty acid profile of this strain makes it a unique starting point
for downstream engineering for tailored oleochemical production. Collectively, the
information supplied in this chapter along with the identified mutations and the strains
could accelerate understanding of the complex regulation of lipogenesis as well as the
creation of a robust, efficient engineering platform for converting carbon sources into
value-added oleochemicals and biofuels.

137
Figure 6.5 Illustration of mga2 protein with IPT and ANK domains and sequence
alignment over mga2 and its homologues
Blue indicates transmembrane domain, purple indicates low complexity and grey indicates
unknown region (illustration made by SMART). Sequence alignment is performed using
clustralW.
138
Chapter 7: Major findings and proposal for future work
7.1 Major findings
The experiments described herein had three major goals. The first goal was to
develop tools for controlling gene expression in Yarrowia lipolytica. We first performed
hybrid promoter engineering by creating a library of promoters with a 400-fold dynamic
range based on mRNA expression levels. We then created a set of plasmids with a
dynamic range of 2.7-fold using different promoters upstream of the centromeric region.
The results presented in Chapters 2 demonstrated that the hybrid promoter approach is an
efficient strategy for promoter engineering by fusing a core promoter region with
upstream activation sequences, and the results presented in Chapter 3 illustrated that
using a promoter repressed centromere could alter the plasmid copy number and
expression level to enable an additional layer for controlling gene expression. Both
methods developed here are based on fundamental molecular biology principles, thus,
could be easily adapted into other organisms with an ill-defined gene expression toolbox.
Furthermore, the combination of these two methods would further expand the range of
expression level.
The second goal was to metabolically engineer Y. lipolytica for high lipid
production. In order to achieve this goal, we employed rational and evolutionary
metabolic engineering strategies. Rational metabolic engineering efforts included
combinatorially engineering several targets related to lipogenesis, which successfully
improved the lipid production in this yeast. The lipid content reached upwards of 90% in
the engineered strain while the initial strain only amassed up to 10% under the same
139
condition. The engineered strain was able to produce over 25 g/L lipid in a bioreactor
without requiring nitrogen starvation. By further employing a self-developed
evolutionary engineering method, the lipid production titer exceeded 40 g/L with both
increased yield and productivity at the same time. Moreover, unlike other rational
metabolic engineering cases, this improved lipid production was not accompanied by
decreased biomass. The results here clearly showed a significant improvement over lipid
production performance in Y. lipolytica through a combination of rational and
evolutionary metabolic engineering. The evolutionary metabolic engineering method for
improving lipid production could be easily applied to other microorganisms to enhance
lipid production.
The third goal was to gain novel understanding over the lipogenesis process in Y.
lipolytica. Through the engineering experiments and whole genome sequencing efforts,
we successfully identified several lipogenesis enhancers such as DGA1 overexpression,
PEX10 knockout, UGA2 mutation/knockout. Leucine biosynthetic capacity was also
identified as essential for high lipogenesis. These findings supplied clues to the basic
mechanism of lipid accumulation in this yeast; more specifically, they revealed the
limiting rate of triacylglycerol biosynthesis, the importance of glutamate degradation, and
the essence of target of rapamycin pathway (TOR) in lipogenesis process. Transcriptomic
analysis with the evolved strain confirmed the importance of glutamate degradation and
further illustrated the potential of DHAP serving as a key molecule to high lipogenesis. In
addition to the knowledge gained from the strain engineering process, we also identified a

140
mutant mga2 protein functioning as a novel lipid enhancer. Further characterization of
mga2 protein uncovered its function for regulating unsaturated fatty acid biosynthesis in
Y. lipolytica. Ultimately, this mutant mga2 protein redirected carbon flux towards fatty
acid biosynthesis using pyruvate as a key intermediate.
Overall, through the experiments described in this work, we employed synthetic
biology concepts rooted in fundamental molecular biology to gain control over gene
expression and utilized rational metabolic engineering in combination with evolutionary
engineering to improve lipid production in Y. lipolytica. In addition, we successfully
identified and characterized a novel lipogenesis enhancer, a mutant mga2 protein.
Moreover, we performed genomic and transcriptomic analyses to further explore the
underlying mechanism that contributed to improved lipogenesis. The resulting strains and
information would serve as stepping stones for industrial development and production
studies. A recent study of the oleaginous yeast Lipomyces starkeyi fed with soluble starch
proposed a biodiesel factory gate price of $2.30 per gallon, which is economically viable
(210). This study suggests that the Y. lipolytica strain with high lipid production titer,
yield, and productivity developed in this work could serve as an industrial production
platform. Since the cost of lipid production was strongly influenced by the cost of
medium nutrients required for cultivation of cells (50%) and the cost of solvent required
to extract lipids from biomass (25%), decreases in raw materials cost and engineering
fatty acid secretion in this organism could improve economic viability (210). Furthermore,
the methodologies, tools, and information gained in this work could be transferred into
141
other microorganisms in order to engineer them for producing a variety of value-added
chemicals.
7.2 Proposal for future work
The research described here represents a metabolic engineering flow for
engineering high lipid production in a microorganism. Since most of the methods and
targets used here are based on general biological mechanisms and concepts, it would be
interesting to apply these similar strategies in order to engineer other organisms for high
lipid production. Although Y. lipolytica is a very attractive host, there are other natural
hosts that are amenable to industrial-scale processes and have better alternative carbon
source utilization (more importantly, different types of biomass), such as other
oleaginous yeasts like L. starkeyi and Rhodosporidium toruloides (211) as well as non-
oleaginous yeast such as Ustilago maydis (212). Specifically, the evolutionary
engineering scheme developed in this work could be very effective when applied to other
organisms.
The information gained from rational metabolic engineering, especially the
importance of leucine biosynthetic capacity to high lipogenesis is very interesting.
Although the studies showed here suggest relation to the TOR pathway, detailed study
could further reveal its function in lipogenesis. Since rapamycin addition actually
improved lipogenesis as described in Chapter 4, further engineering of the FK506-
binding protein of 12 kDa (FKBP) that binds rapamycin should impact lipogenesis inside
the cells (213). In addition, RNA-Seq experiments would be especially helpful to
142
illustrate the changes in lipid accumulation with or without the leucine biosynthesis
capacity. Furthermore, additional analysis of the RNA-Seq results from the evolved strain
E26 as well as mutant strain L36 could further supply novel understanding over the
lipogenesis mechanism in this yeast. The importance of DHAP and glutamate
degradation pathway can be further studied with metabolic engineering strategies such as
feeding DHAP and overexpression of the GDH2 (glutamate dehydrogenase 2) to examine
the lipogenesis changes. Nitrogen starvation is also a very key component for lipogenesis.
While the studies described here test the effect of nitrogen starvation through optimizing
the carbon/nitrogen ratio in the medium, more detailed genetic modifications could
supply better understanding underlying this requirement, such as identifying the resulting
signaling pathway regulation caused by nitrogen starvation through engineering one of
the key regulatory knot, the URE2/GLN3 transcriptional regulator pairs (214-215).
Although we studied and characterized the mutant mga2’s function over lipogenesis, the
results from sequence alignments and previous studies suggested a complex regulation
and important function over the identified conserved region. Follow-up studies mixed
with biochemical characterization to identify different processing events and resulting
phenotype changes could further explain the function of this regulator. More importantly,
this study could lead to identification of one of the key factors in creating oleaginous
yeast.
While high lipid production has been engineered in Y. lipolytica, their actual use
for industrial scale production would depend on other factors such as its ability to utilize
alternative carbon sources (xylose, arabinose, cellulose etc.) in addition to the optimal
143
production medium. Thus, engineering Y. lipolytica for xylose consumption is another
important task. This can be tackled with overexpressing native genes predicted to code
for xylose metabolic enzymes and complementing with heterologous genes from other
xylose metabolizing microorganisms such as Scheffersomyces stipitis (216) and
Piromyces sp. (217). Furthermore, micronutrients such as minerals and small molecules
have been studied as beneficial factors to improve growth and hydrocarbon or lipid
production in algae (218-219). Similar work has been done with oleaginous yeast such as
Lipomyces starkeyi to improve lipid production (220). For Y. lipolytica, a medium
optimization study was performed to improve its heterologous protein production and
lipase production (146, 221). Mineral supplementation was also studied in order to
increase erythritol biosynthesis from glycerol in Y. lipolytica (222). However, the effect
of micronutrients on lipid accumulation has not been studied in detail. More importantly,
not only the available study is rather limited but also almost all of those have been carried
with the wild type strain rather than a metabolic engineered strain for increased lipid
production. The responses to micronutrients from the genetic engineered strains need to
be addressed in comparison with the wild type strain in order to fully understand their
impact on lipogenesis in these strains and to enable their complete and optimal utilization
during lipid production.
Collectively, my research led to successfully improving lipid production in Y.
lipolytica. In doing so, we developed novel promoter engineering and plasmid
engineering strategies, and an efficient evolutionary engineering method for increasing
lipid production. Concurrently, we revealed sufficient knowledge over the lipogenic

144
pathway in this yeast, such as the importance of leucine biosynthetic capacity and the
novel functions of a mutant mga2 in lipogenesis.
145
Chapter 8: Materials and methods
8.1 Common materials and methods
8.1.1 Strains and media
E. coli strain DH10β was used for all cloning and plasmid propagation. DH10β
was grown at 37oC with constant shaking in Luria-Bertani (LB) Broth (Teknova)
supplemented with 50μg/ml ampicillin for plasmid propagation. Yarrowia lipolytica
strain PO1f (ATCC # MYA-2613), a leucine and uracil auxotroph devoid of any secreted
proteasic activity (82) was used for all studies. Y. lipolytica PO1f containing plasmid was
routinely cultivated at 30oC with constant agitation in YSC-LEU media consisting of
20g/L glucose purchased from Fisher Scientific, 0.69g/L CSM-Leucine supplement
purchased from MP Biomedicals, and 0.67g/L Yeast Nitrogen Base purchased from
Becton, Dickinson, and Company. Solid media for E.coli and Yarrowia lipolytica was
prepared by adding 15g/L agar (Teknova) to liquid media.
8.1.2 Cloning procedures
All restriction enzymes were purchased from New England Biolabs and all
digestions were performed according to standard protocols. PCR reactions were set up
with recommended conditions using Phusion high fidelity DNA polymerase (Finnzymes).
Ligation reactions were performed overnight at 16oC using T4 DNA Ligase (Fermentas).
Gel extractions were performed using the GeneClean gel extraction kit purchased from
MP Biomedicals. Purification of small DNA fragments (<200 bp) generated during
plasmid construction were performed using the MERmaid Spin Kit (Qbiogene). E. coli
146
minipreps were performed using the Zyppy Plasmid Miniprep Kit (Zymo Research
Corporation). Y. lipolytica minipreps were performed using Zymoprep Yeast Plasmid
Miniprep II kit (Zymo Research Corporation). Transformation of E. coli strains was
performed using the standard electroporator protocols (223). Transformation of Y.
lipolytica was performed using the Zymogen Frozen EZ Yeast Transformation Kit II
(Zymo Research Corporation). Genomic DNA was extracted from Y. lipolytica using the
Wizard Genomic DNA Purification kit (Promega).
8.1.3 Fatty acid characterization by Nile Red staining
Nile Red (MP Biomedicals) is commonly utilized to stain oleaginous cellular
material and can be coupled with fluorescence flow cytometry to gauge relative lipid
content (125). Y. lipolytica strains were routinely inoculated from glycerol stock in
biological triplicate in appropriate media for 72 hours at 30 oC with shaking. Cell
concentrations were normalized to a specific OD600 for reinoculation in fresh media and
further incubation. For assays in which the effect of media formulation was not being
investigated, this media contained 0.79 g/L CSM (or 0.69 g/L CSM-Leucine if necessary),
1.7 g/L Yeast Nitrogen Base w/o amino acid and w/o (NH4)2SO4, 80 g/L carbon source,
and 5 g/L ammonium sulfate, as this formulation was shown to strongly induce lipid
accumulation in the highest lipid producing strains . For large experiments, 2 mL
cultures were utilized to test large number of cultures and were inoculated to an OD600
=2.5, and larger volume cultures were inoculated to an OD600 = 0.1. Cultures were
incubated for two to eight days at 30 oC with constant agitation. 2 mL cultures were
incubated in a rotary drum (CT-7, New Brunswick Scientific) at speed seven. Flasks

147
were shaken at 225 rpm in a standing incubator, and bioreactors were agitated by rotor at
no less than 250 rpm and no more than 800 rpm. To harvest, one OD600 unit of culture
was spun down at 1000 x g for three minutes and resuspended in 500 μL Phosphate
Buffered Saline solution (PBS) (Sigma Aldrich). 6 μL of 1 mM Nile Red (dissolved in
DMSO) was added, and then cells were incubated in the dark at room temperature for 15
minutes. Cells were spun down at 1000 x g for three minutes, resuspended in 800 μL ice
cold water, spun down again, and resuspended again in 800 μL ice cold water. 300 μL of
stained cells was added to 1ml ice cold water and tested with a FACS Fortessa (BD
Biosciences), a voltage of 350, a 10,000 cell count, a forward scatter of 125, a side scatter
of 125, and the 535LP and 585/42BP filters for fluorescence detection using the GFP
fluorochrome. Samples were kept on ice and in the dark during the test and fluorescence
data was analyzed using FlowJo software (Tree Star Inc., Ashland, OR) to compute mean
fluorescence values. Day-to-day variability was mitigated by analyzing all comparable
strains on the same day. An average fluorescence and standard deviation were calculated
from the mean values of biological replicates. Stained cells were routinely examined
with fluorescence microscopy under a 100X oil immersion objective using the FITC
channel on an Axiovert 200M microscope (Zeiss).
8.1.5 Bioreactor fermentations
Bioreactor fermentations were run in minimal media (described above) as batch
processes. All fermentations were inoculated to an initial OD600 = 0.1 in 1.5L of media.
Dissolved oxygen was maintained at 50% of maximum by varying rotor speed between
250 rpm and 800 rpm with a constant air input flow rate of 2.5 v/v/m. PH was maintained

148
at 3.5 or above with 2.5M NaOH, and temperature was maintained at 28 oC. 10-15 mL
samples were taken every twenty-four hours.
8.1.4 Lipid, biomass and glucose quantification from samples
Lipids from approximate 2mg dry weight culture were extracted following the
procedure described by Folch et al. (224) and modified for yeast (225). Lipid weights
were determined through gravity method. For biomass, 500ul culture were washed and
dried overnight in 65 oC until the weight become constant. Glucose concentrations were
measured with supernant from bioreactor samples using Glucose (HK) Assay Kit (Sigma
GAHK) following the manufacturer instruction.
8.2 Materials and methods for Chapter 2
8.2.1 Calculation of codon adaptation index
Codon Adaption Indices were calculated for the hrGFP, mStrawberry, EGFP, and
yECitrine genes using the CAIcal server (226) and the codon usage table for Y. lipolytica
available on the Codon Usage Database(227).
8.2.2 Plasmid construction
Detailed information for primers can be found in Table 8.1.
Construction of endogenous promoter fluorescence cassettes : All plasmids
employed for gene expression in Y. lipolytica were centromeric, replicative vectors based
off plasmid pSl16-Cen1-1(227), which was initially modified to include a new
multicloning site and redubbed pMCSCen1 (85). The cyc1 terminator (cyc1t) was
amplified from p416-TEF-yECitrine (16, 228) and inserted into pMCSCen1 with an
149
EcoNI/BlpI digestion to form pMCScyc1t. Endogenous promoters EXP1, GPAT, GPD,
TEF, YAT1, FBA and XPR2 were amplified from Yarrowia lipolytica PO1f genomic
DNA and ligated into pMCScyc1t using XmaI/AscI for FBA and BstBI/AscI for the rest
to form pMCS-Promoter serial constructs. Reporter genes including yECitine (16),
mStrawberry (pmstrawberry, Clonetech), EGFP (229), hrGFP (pIRES-hrGFP, Agilent)
and lacZ (230) were amplified and inserted into appropriate pMCS-Promoter constructs
to form different pMCS-Promoter-Reporter constructs.
Constructions of UAS1B1-Leum through UAS1B32-Leum expression cassettes:
Leum (minimal leucine promoter) was amplified from Y. lipolytica genomic DNA and
ligated into pUC19 plasmid using SphI/HindIII. Following that, serial and reciprocal
insertions of UAS1B (upstream activating sequence 1B) elements were performed with
different restriction sites to form pUC-UAS1Bn-Leum plasmids. UAS1Bn-Leum
promoter elements were cut out using BstBI/AscI and inserted upstream of hrGFP and
lacZ reporter genes in pMCS-Promoter-Reporter constructs (pMCS-hrGFP and pMCS-
lacZ).
Construction of TEF-based promoters and expression cassettes: TEF serial
truncation promoters, including TEF(1004), TEF(804), TEF(604), TEF(504), TEF,
TEF(203), TEF(136), were amplified from Yarrowia lipolytica PO1f genomic DNA and
inserted in the pUC19 vector (pUC-TEF(n)) and further digested with BstBI/AscI and
ligated into pMCS-hrGFP to form pTEF(n)-hrGFP. UAS1B8 and UAS1B16 fragments
were cut out from the appropriate vectors and ligated into pUC19 vectors to form pUC-
UAS1B8/16. TEF truncation promoters were amplified and inserted into these vectors
150
using HindIII/AscI resulting in pUC-UAS1B8/16-TEF(n) vectors. UAS1B8/16-TEF(n)
promoters were cut out and ligated into the pMCS-hrGFP vector to form pUAS1B8/16-
TEF(n)-hrGFP.
8.2.3 Promoter characterization with flow cytometry
Y. lipolytica PO1f strains, transformed with different plasmids, were inoculated
directly from glycerol stock (in biological duplicate or triplicate) in YSC-LEU media for
48 hours at 30oC with shaking, and then normalized to an OD600 of 0.03 in 2ml fresh
YSC-LEU and incubated for another 48 hours at 30oC in a rotary drum (CT-7, New
Brunswick Scientific) at speed seven. To harvest, the cultures were spun down at 500g
for five minutes, washed in cold water, and resuspended in 5ml ice cold water before
testing with a FACSCalibur (BD Biosciences) using 488nm excitation; FL1 detector; and
10,000 cell count for hrGFP detection. Standard, optimized protocols were used for other
reporter proteins tested in this chapter. The samples were kept on ice during the test and
the data was analyzed using FlowJo software (Tree Star Inc., Ashland, OR) to compute
mean fluorescence values.
8.2.4 Promoter characterization through β–galactosidase assay
Y. lipolytica PO1f strains, transformed with different plasmids, were inoculated
directly from glycerol stock (in biological triplicate) in YSC-LEU media for 48 hours at
30oC in a rotary drum (CT-7, New Brunswick Scientific) at speed seven, and then
normalized to an OD600 of 0.03 in 2ml fresh YSC-LEU and incubated for another 48
hours in the same conditions. The cultures were washed twice in 1ml Z buffer ,
resuspended in 1 ml of Z buffer, and their OD600 readings were recorded (93-94). β-
151
galactosidase assays were performed as described by Miller (93) using 10μl of
chloroform-permeabilized cells, with a reaction length of 17 minutes.
8.2.5 Promoter characterization through qRT-PCR
Y. lipolytica PO1f strains, transformed with different plasmids, were inoculated
directly from glycerol stock (in biological triplicate) in YSC-LEU media for 48 hours at
30oC with shaking, and normalized to an OD600 = 0.03 in 2ml fresh YSC-LEU media and
incubated for another 48 hours at 30oC in a rotary drum (CT-7, New Brunswick Scientific)
at speed seven. The cells were pelleted and total RNA was extracted using the
RiboPureTM-Yeast Kit (Ambion). 1000ng of RNA from each sample was used for a
reverse transcription reaction with the High-Capacity cDNA Reverse Transcription Kit
(Applied Biosystems). A 1.2μl sample from each reaction was used to set up a qPCR
reaction (in triplicate) with FastStart SYBR Green Master (Roche) using primers 5’-
TCAGCGACTTCTTCATCCAGAGCTTC-3’ and 5’-
ACACGAACATCTCCTCGATCAGGTTG-3’ as described in the manual with a non-
template control. The reactions were run with Applied Biosystems 7900HT Fast Real-
Time PCR System (Applied Biosystems) using fast 96 well plates (Applied Biosystems).
The data was analyzed with ABI 7900HTsequence detection systems (version 2.4;
Applied Biosystems).
8.2.6 Plasmid stability test
Y. lipolytica PO1f strains containing plasmids pUAS1B12-Leum-hrGFP or
pUAS1B16-Leum-hrGFP were grown for 48 hours from glycerol stock and thereafter
subcultured in fresh YSC-LEU media at an OD600=0.01 every 48 hours. After a total

152
continuous culture time of 192 hours, corresponding to 36 cell doublings, yeast cells were
miniprepped to extract the plasmid. Individual plasmids were isolated by transformation
into E. coli, and sequencing and restriction enzymes digests of isolated plasmids were
used to confirm the stability of the UAS1B12-Leum and UAS1B16-Leum promoters over
this timeframe.
Table 8.1 Primers used for Chapter 2
Primer Sequence (5’-3’)
JB085 CGGGATCCCCCCCGGGAATTCGAATTGGCGCGCCCCTTAATT
AAGGCACGTGCCTAAAAAAGGCGGACCGGGCTTAGCTTGTTT
AAACAACTGCAGTTTT
JB088 GGTTCGAAGACGCAGTAGGATGTCCTGCA
JB089 TTGGCGCGCCGTTGATGTGTGTTTAATTCAAGAATGA
JB090 GG TTCGAAATAAGTTTGCAAAAAGATCGTATTATAGT
JB091 TTGGCGCGCCTTGTGAATTAGGGTGGTGAGA
JB092 TCCCCCCGGGTAAACAGTGTACGCAGTACTATAGA
JB093 TTGGCGCGCCGGAGAGCTGGGTTAGTTTGT
JB094 GG TTCGAACAACTTTTCTTGTCGACCTGAGAT
JB095 TTGGCGCGCCTTAGCGTGTCGTGTTTTTGTTGT
JB096 GGTTCGAAGGAGTTTGGCGCCCGTTTTT
JB097 TTGGCGCGCCTGCTGTAGATATGTCTTGTGTGTAAGGG
JB099 AAAACTGCAGTTGTTTAAACAAGCTAAGCCCGGTCCGCCTT
TTTTAGGCACGTGCCTTAATTAAGGGGCGCGCCAATTCGAA
TTCCCGGGCCGGATCCCG
JB102 GGCCTAAAAAAGGATCGATACCGTCGACCTCGAG
JB103 GGGCTTAGCCGAGCGTCCCAAAACCTTCTC
JB153 TTGGCGCGCCATGGTGAGCAAGGGCGAGGA
JB155 CCTTAATTAACTACTTGTACAGCTCGTCCATGCC
JB156 TTGGCGCGCCATGTCTAAAGGTGAAGAATTATTCA
JB158 CCTTAATTAATTATTTGTACAATTCATCCATACCA
JB160 TTGGCGCGCCATGGTGAGCAAGCAGATCCTGAAG
JB161 CCTTAATTAATTACACCCACTCGTGCAGGC
JB162 ACATGTGCATGCACTGATCACGGGCAAAAGTGCGTATATAT
JB163 CAACCCAAGCTTTTAGTTTCGGGTTCCATTGTGG
153
Table 8.1 cont.
JB164 GACACGCGTCGACCTGAGGTGTCTCACAAGTGC
JB165 GACACATGCATGCCCGGATCGAGGTGGGCGGG
JB166 GACACATGCATGCGAGCTCCCGGATCGAGGTGGGCGGG
JB167 CGCGGATCCCTGAGGTGTCTCACAAGTGCC
JB168 GACACGCGTCGACCCGGATCGAGGTGGGCGGG
JB169 CACACACGAGCTCCTAGTCTAGACTGAGGTGTCTCACAAGTGCC
JB170 CGCGGATCCCCGGATCGAGGTGGGCGGG
JB171 CACACACGAGCTCCTGAGGTGTCTCACAAGTGCC
JB172 CTAGTCTAGACCGGATCGAGGTGGGCGGG
JB173 CCGGAATTCCTGAGGTGTCTCACAAGTGCC
JB174 CACACACGAGCTCCTGAGGTGTCTCACAAGTGC
JB177 CTGAGGTGTCTCACAAGTGCCGTGCAGTCCCGCCCCCACTT
GCTTCTCTTTGTGTGTAGTGTACGTACATTATCGAGA
CCGTTGTTCCCGCCCACCTCGATCCGG
JB178 CCGGATCGAGGTGGGCGGGAACAACGGTCTCGATAA
TGTACGTACACTACACACAAAGAGAAGCAAGTGGGG
GCGGGACTGCACGGCACTTGTGAGACACCTCAG
JB249 CATATGCGGTGTGAAATACCGC
JB250 GGAATTCGGGTACCAACTGCAGTTCGAAACTGGCCGTCGTT
TTACAAC
JB251 AAGCTTCAGGCGCGCCATCATGGTCATAGCTGTTTCCTG
JB252 CCCACATGTTCTTTCCTGCGTTATCC
JB253 GGAATTCAACTGCAGACTGGCCGTCGTTTTACAAC
JB254 ACATACATGCATGCGGTACCCGGGCAAAAGTGCGTATAT
ATACAA
JB289 GGAATTCCATATGTGTAAAACGACGGCCAGTTTCGAAGGT
ACCAAGGAAGCATGCCTGCAGAAGCTTGGGAAGA
JB290 TCTTCCCAAGCTTCTGCAGGCATGCTTCCTTGGTACCT
TCGAAACTGGCCGTCGTTTTACACATATGGAATTCC
JB311 TTGGCGCGCCATGACCATGATTACGGATTCACTG
JB312 ACTGTTGGCGCGCCACCATGATTACGGATTCACTGGC
JB313 CCTTAATTAATTATTTTTGACACCAGACCAACTGG
LQ9 CCAATTGGTTCGAAATGTCCCAACTTGCCAAATT
LQ10 CCAATTGGTTCGAAATTGCACCCCAGCCAGACCG
LQ12 CCAATTGGTTCGAATTGCGTTTCGCTCCCACAC
LQ13 CCAATTGGTTCGAATCTGTAAAAAGTCTCTACAAG
LQ14 CCAATTGGTTCGAATTGTGGTTGGGACTTTAG
LQ15 CCAATTGGTTCGAATTTCTTTGTCTGGCCATC
LQ16 CCAATTGGTTCGAACCCACACTTGCCGTTAAG
LQ17 TTAAAGCTTAGAGACCGGGTTGGCG
LQ18 TATAAGCTTGGCGCGCCTCATTTTGAATGATTCTTATAC
154
Table 8.1 cont.
LQ19 CCAATTGGTTCGAACGGGCAAAAGTGCGTAT
LQ20 TTGGCGCGCCTGAAGCTTTTAGTTTCG
LQ25 CCAATTGGAAGCTTATGTCCCAACTTGCCAAATT
LQ26 CCAATTGGAAGCTTATTGCACCCCAGCCAGACCG
LQ28 CCAATTGGAAGCTTTTGCGTTTCGCTCCCACAC
LQ29 CCAATTGGAAGCTTTCTGTAAAAAGTCTCTACAAG
LQ30 CCAATTGGAAGCTTTTGTGGTTGGGACTTTAG
LQ31 CCAATTGGAAGCTTTTTCTTTGTCTGGCCATC
LQ32 CCAATTGGAAGCTTCCCACACTTGCCGTTAAG
8.3 Materials and methods for Chapter 3
8.3.1 Plasmid construction
Primer sequences can be found in the primer list in Table 8.2. All plasmids
employed for gene expression in Y. lipolytica were centromeric, replicative vectors based
on plasmid pSl16-Cen1-1(227) (85), which was initially modified to pMCSCEN1 (103).
Promoters with partial open reading frame TEF(404), TEF(272), TEF(136) (primer pair
LQ105/LQ110, LQ106/LQ110, LQ107/LQ110), GPD (LQ125/LQ126), EXP
(LQ127/LQ128), POT1 (LQ123/LQ124), CDC2 (LQ172/LQ173), MET2
(LQ170/LQ171), YOX1 (LQ178/LQ179) were amplified from Y. lipolytica PO1f
genomic DNA and ligated into pMCSCEN1 by using KpnI/NdeI and then digested out
Promoter-CEN region with NdeI/BstBI and ligated into pMCSUAS1B16-LeumhrGFP
(103). CDC2 and POT1-CEN regions were digested out with BglII/XmaI and ligated into
pMCSUAS1B16-LeumlacZ and pMCSEXPlacZ (103).
8.3.2 Plasmid characterization with flow cytometry
Y. lipolytica PO1f strains, transformed with different plasmids, were inoculated
directly from glycerol stock (in biological triplicate) in YSC-LEU media for 48 hours at
30oC with shaking, and then normalized to an OD600 of 0.03 in 2ml fresh YSC-LEU and
155
incubated for another 48 hours at 30oC in a rotary drum (CT-7, New Brunswick Scientific)
at speed seven. To harvest, the cultures were spun down at 500g for five minutes, washed
in cold water, and resuspended in 5ml ice cold water before testing with a FACS
LSRFortessa (BD Biosciences) using 488nm excitation; FL1 detector; and 10,000 cell
count for hrGFP detection. The samples were kept on ice during the test and the data was
analyzed using FlowJo software (Tree Star Inc., Ashland, OR) to compute mean
fluorescence values. The sorting was performed with FACSAria Cell Sorter (BD
Biosciences) using the same setting to collect 10^6 cells from two subpopulation.
8.3.3 Plasmid characterization through β–galactosidase assay
Y. lipolytica PO1f strains, transformed with different plasmids, were inoculated
directly from glycerol stock (in biological triplicate) in YSC-LEU media for 48 hours at
30oC in a rotary drum (CT-7, New Brunswick Scientific) at speed seven, and then
normalized to an OD600 of 0.03 in 2ml fresh YSC-LEU and incubated for another 48
hours in the same conditions. The cells were characterized using Gal-Screen™ β-
Galactosidase Reporter Gene Assay System for Yeast or Mammalian Cells (life
technologies) following manufacturer’s manual.
8.3.4 Plasmid copy number characterization through qRT-PCR
Y. lipolytica PO1f strains, transformed with different plasmids, were inoculated
directly from glycerol stock (in biological triplicate) in YSC-LEU media for 48 hours at
30oC with shaking, and normalized to an OD600 = 0.03 in 2ml fresh YSC-LEU media and
incubated for another 48 hours at 30oC in a rotary drum (CT-7, New Brunswick Scientific)
at speed seven. Plasmid copy numbers were quantified using quantitative PCR (qPCR)
from the total DNA extracts. Total DNA extraction was performed as described
previously (107). Lyticase from Arthrobacter luteus was purchased from Sigma Aldrich
(St. Louis, MO). Quantitative PCR was performed on a ViiA7 qPCR system (Life
Technologies, Carlsbad, CA) using SYBR Green Master Mix from Roche (Penzberg,
Germany) with primer set 5’-TCAGCGACTTCTTCATCCAGAGCTTC-3’ and 5’-

156
ACACGAACATCTCCTCGATCAGGTTG-3’, following the manufacturer's instructions
with an annealing temperature of 58 °C and 1 μL of total DNA extract per 20-μL reaction
volume.
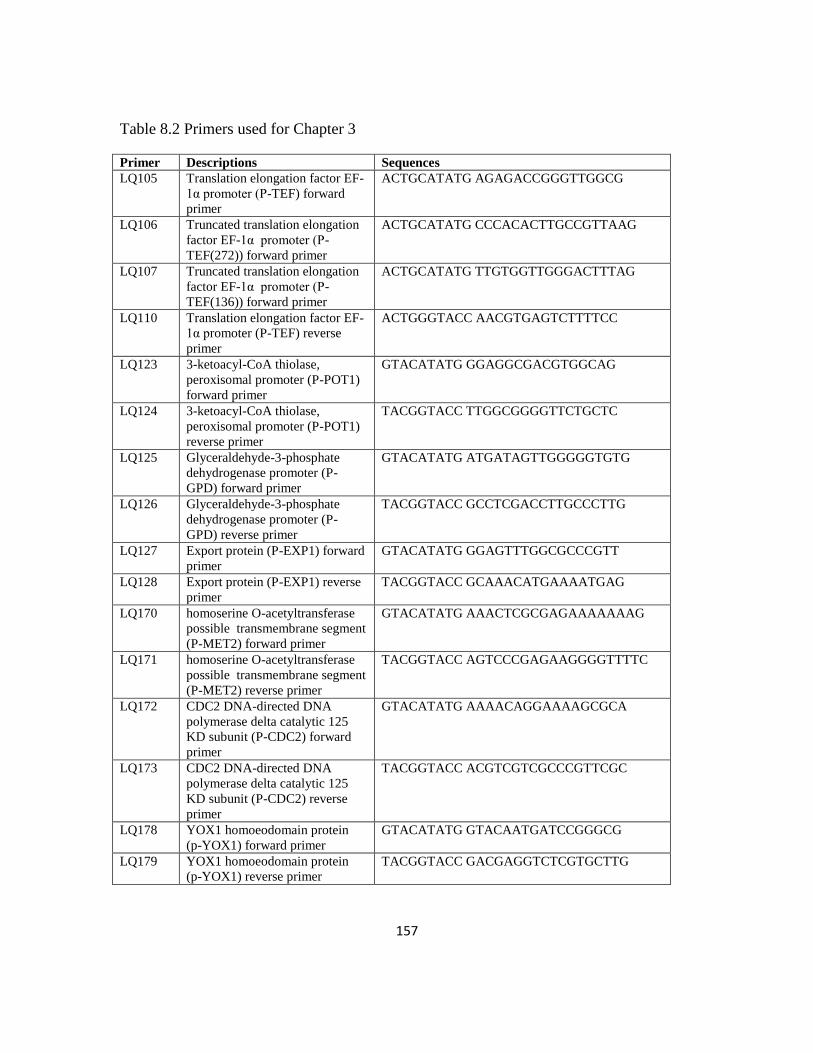
157
Table 8.2 Primers used for Chapter 3
Primer Descriptions Sequences
LQ105 Translation elongation factor EF-
1α promoter (P-TEF) forward
primer
ACTGCATATG AGAGACCGGGTTGGCG
LQ106 Truncated translation elongation
factor EF-1α promoter (P-
TEF(272)) forward primer
ACTGCATATG CCCACACTTGCCGTTAAG
LQ107 Truncated translation elongation
factor EF-1α promoter (P-
TEF(136)) forward primer
ACTGCATATG TTGTGGTTGGGACTTTAG
LQ110 Translation elongation factor EF-
1α promoter (P-TEF) reverse
primer
ACTGGGTACC AACGTGAGTCTTTTCC
LQ123 3-ketoacyl-CoA thiolase,
peroxisomal promoter (P-POT1)
forward primer
GTACATATG GGAGGCGACGTGGCAG
LQ124 3-ketoacyl-CoA thiolase,
peroxisomal promoter (P-POT1)
reverse primer
TACGGTACC TTGGCGGGGTTCTGCTC
LQ125 Glyceraldehyde-3-phosphate
dehydrogenase promoter (P-
GPD) forward primer
GTACATATG ATGATAGTTGGGGGTGTG
LQ126 Glyceraldehyde-3-phosphate
dehydrogenase promoter (P-
GPD) reverse primer
TACGGTACC GCCTCGACCTTGCCCTTG
LQ127 Export protein (P-EXP1) forward
primer
GTACATATG GGAGTTTGGCGCCCGTT
LQ128 Export protein (P-EXP1) reverse
primer
TACGGTACC GCAAACATGAAAATGAG
LQ170 homoserine O-acetyltransferase
possible transmembrane segment
(P-MET2) forward primer
GTACATATG AAACTCGCGAGAAAAAAAG
LQ171 homoserine O-acetyltransferase
possible transmembrane segment
(P-MET2) reverse primer
TACGGTACC AGTCCCGAGAAGGGGTTTTC
LQ172 CDC2 DNA-directed DNA
polymerase delta catalytic 125
KD subunit (P-CDC2) forward
primer
GTACATATG AAAACAGGAAAAGCGCA
LQ173 CDC2 DNA-directed DNA
polymerase delta catalytic 125
KD subunit (P-CDC2) reverse
primer
TACGGTACC ACGTCGTCGCCCGTTCGC
LQ178 YOX1 homoeodomain protein
(p-YOX1) forward primer
GTACATATG GTACAATGATCCGGGCG
LQ179 YOX1 homoeodomain protein
(p-YOX1) reverse primer
TACGGTACC GACGAGGTCTCGTGCTTG
158
8.4 Materials and methods for Chapter 4
8.4.1 Base strains and media
Table 8.3 contains a complete list of PO1f derivatives produced in this chapter. Y.
lipolytica was cultivated at 30 oC unless otherwise stated with constant agitation. 2 mL
cultures of Y. lipolytica used in large-scale screens were grown in a rotary drum (CT-7,
New Brunswick Scientific) at speed seven, and larger culture volumes were shaken in
flasks at 225 rpm or fermented in a bioreactor.
YSC media consisted of 20 g/L glucose (Fisher Scientific), 0.79 g/L CSM
supplement (MP Biomedicals), and 6.7 g/L Yeast Nitrogen Base w/o amino acids
(Becton, Dickinson, and Company). YSC-URA, YSC-LEU, and YSC-LEU-URA media
contained 0.77 g/L CSM-Uracil, 0.69 g/L CSM-Leucine, or 0.67 g/L CSM-Leucine-
Uracil in place of CSM, respectively. YPD media contained 10 g/L yeast extract (Fisher
Scientific), 20 g/L peptone (Fisher Scientific) and 20 g/L glucose, and was often
supplemented with 300 μg mL-1
Hygromycin B (Invitrogen) for knockout selection.
Lipid accumulation response towards media formulation was investigated by cultivation
in varying concentrations of glucose and nitrogen. These media formulations contained
0.79 g/L CSM, 1.7 g/L Yeast Nitrogen Base w/o amino acid and w/o (NH4)2SO4 (Becton,
Dickinson, and Company), between 20 g/L and 160 g/L glucose, and between 0.2 g/L and
5 g/L ammonium sulfate - (NH4)2SO4 (Fisher Scientific) – which corresponds to between
0.055 g/L and 1.365 g/L ammonium. Minimal media formulations utilized for bioreactor
fermentations typically contained 80 g/L glucose and 6.7 g/L Yeast Nitrogen Base w/o
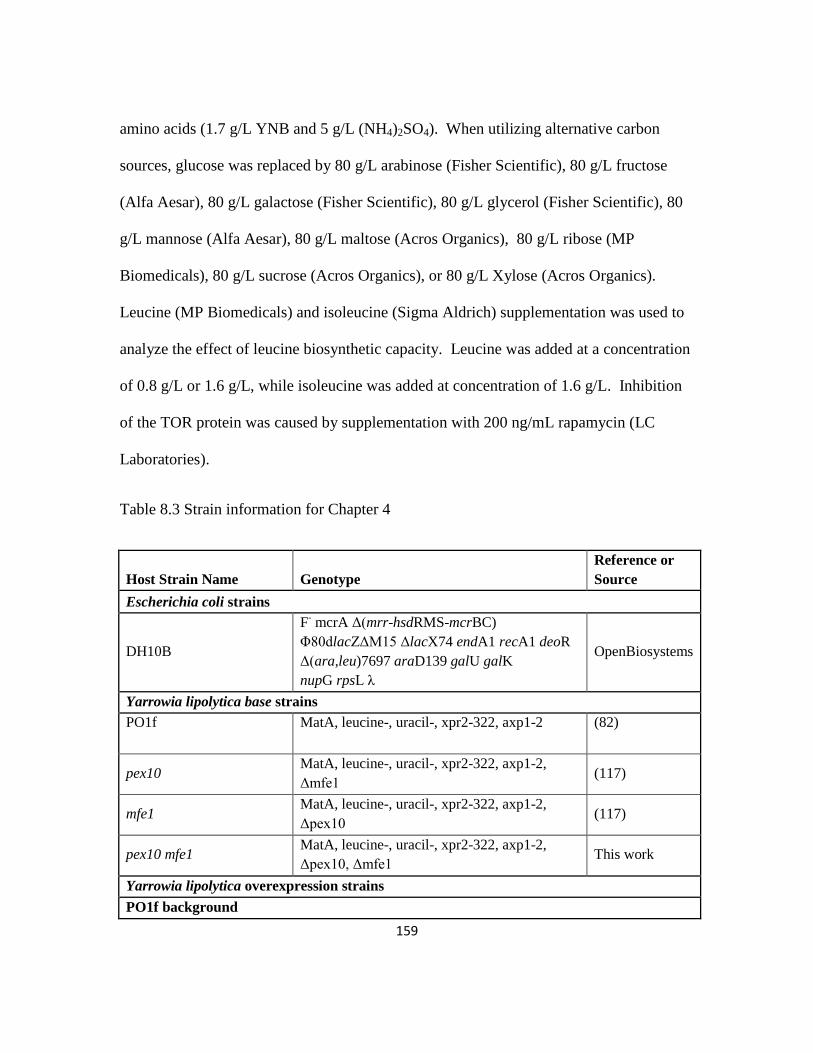
159
amino acids (1.7 g/L YNB and 5 g/L (NH4)2SO4). When utilizing alternative carbon
sources, glucose was replaced by 80 g/L arabinose (Fisher Scientific), 80 g/L fructose
(Alfa Aesar), 80 g/L galactose (Fisher Scientific), 80 g/L glycerol (Fisher Scientific), 80
g/L mannose (Alfa Aesar), 80 g/L maltose (Acros Organics), 80 g/L ribose (MP
Biomedicals), 80 g/L sucrose (Acros Organics), or 80 g/L Xylose (Acros Organics).
Leucine (MP Biomedicals) and isoleucine (Sigma Aldrich) supplementation was used to
analyze the effect of leucine biosynthetic capacity. Leucine was added at a concentration
of 0.8 g/L or 1.6 g/L, while isoleucine was added at concentration of 1.6 g/L. Inhibition
of the TOR protein was caused by supplementation with 200 ng/mL rapamycin (LC
Laboratories).
Table 8.3 Strain information for Chapter 4
Host Strain Name Genotype
Reference or
Source
Escherichia coli strains
DH10B
F- mcrA Δ(mrr-hsdRMS-mcrBC)
Φ80dlacZΔM15 ΔlacX74 endA1 recA1 deoR
Δ(ara,leu)7697 araD139 galU galK
nupG rpsL λ
OpenBiosystems
Yarrowia lipolytica base strains
PO1f MatA, leucine-, uracil-, xpr2-322, axp1-2 (82)
pex10 MatA, leucine-, uracil-, xpr2-322, axp1-2,
Δmfe1 (117)
mfe1 MatA, leucine-, uracil-, xpr2-322, axp1-2,
Δpex10 (117)
pex10 mfe1 MatA, leucine-, uracil-, xpr2-322, axp1-2,
Δpex10, Δmfe1 This work
Yarrowia lipolytica overexpression strains
PO1f background
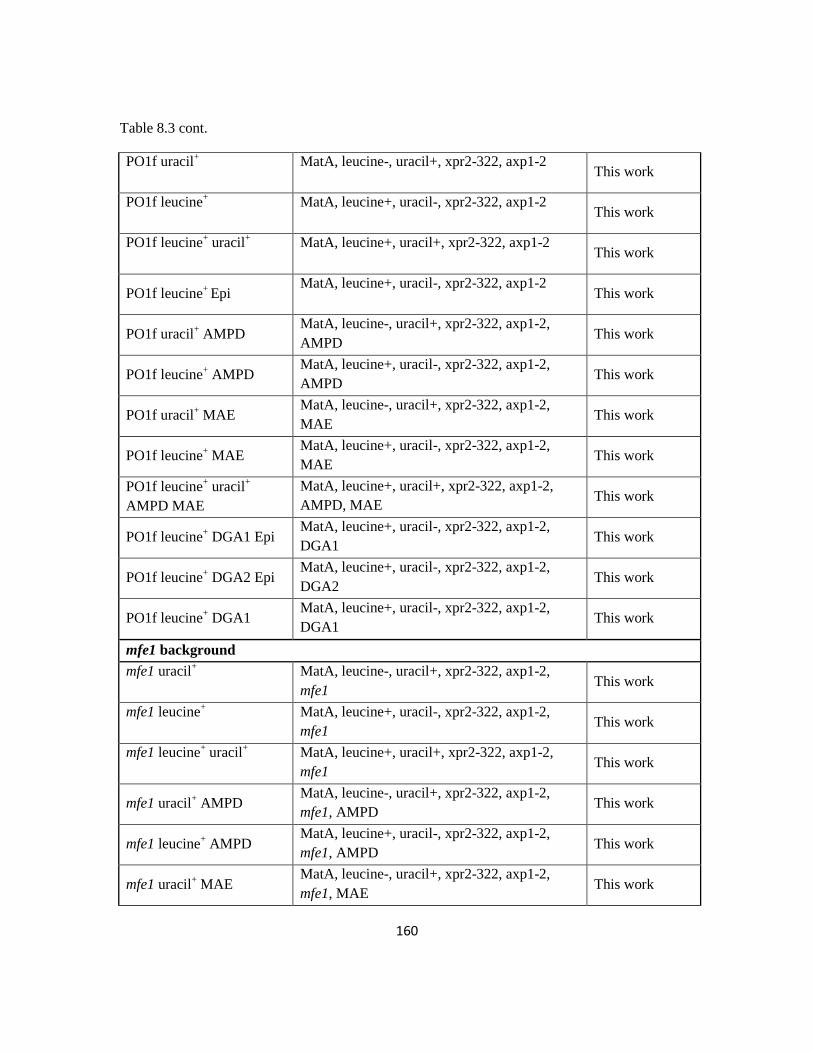
160
Table 8.3 cont.
PO1f uracil+ MatA, leucine-, uracil+, xpr2-322, axp1-2
This work
PO1f leucine+ MatA, leucine+, uracil-, xpr2-322, axp1-2
This work
PO1f leucine+ uracil
+ MatA, leucine+, uracil+, xpr2-322, axp1-2
This work
PO1f leucine+
Epi MatA, leucine+, uracil-, xpr2-322, axp1-2
This work
PO1f uracil+ AMPD
MatA, leucine-, uracil+, xpr2-322, axp1-2,
AMPD This work
PO1f leucine+ AMPD
MatA, leucine+, uracil-, xpr2-322, axp1-2,
AMPD This work
PO1f uracil+ MAE
MatA, leucine-, uracil+, xpr2-322, axp1-2,
MAE This work
PO1f leucine+ MAE
MatA, leucine+, uracil-, xpr2-322, axp1-2,
MAE This work
PO1f leucine+ uracil
+
AMPD MAE
MatA, leucine+, uracil+, xpr2-322, axp1-2,
AMPD, MAE This work
PO1f leucine+ DGA1 Epi
MatA, leucine+, uracil-, xpr2-322, axp1-2,
DGA1 This work
PO1f leucine+ DGA2 Epi
MatA, leucine+, uracil-, xpr2-322, axp1-2,
DGA2 This work
PO1f leucine+ DGA1
MatA, leucine+, uracil-, xpr2-322, axp1-2,
DGA1 This work
mfe1 background
mfe1 uracil+ MatA, leucine-, uracil+, xpr2-322, axp1-2,
mfe1 This work
mfe1 leucine+ MatA, leucine+, uracil-, xpr2-322, axp1-2,
mfe1 This work
mfe1 leucine+ uracil
+ MatA, leucine+, uracil+, xpr2-322, axp1-2,
mfe1 This work
mfe1 uracil+ AMPD
MatA, leucine-, uracil+, xpr2-322, axp1-2,
mfe1, AMPD This work
mfe1 leucine+ AMPD
MatA, leucine+, uracil-, xpr2-322, axp1-2,
mfe1, AMPD This work
mfe1 uracil+ MAE
MatA, leucine-, uracil+, xpr2-322, axp1-2,
mfe1, MAE This work
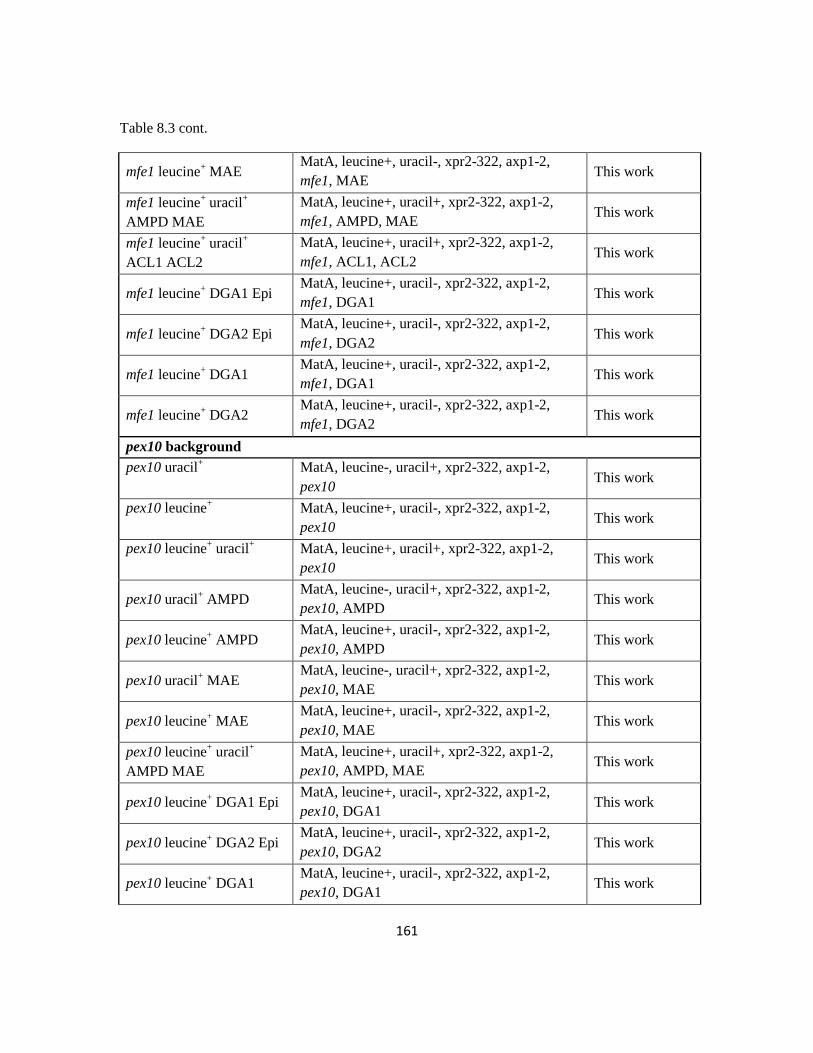
161
Table 8.3 cont.
mfe1 leucine+ MAE
MatA, leucine+, uracil-, xpr2-322, axp1-2,
mfe1, MAE This work
mfe1 leucine+ uracil
+
AMPD MAE
MatA, leucine+, uracil+, xpr2-322, axp1-2,
mfe1, AMPD, MAE This work
mfe1 leucine+ uracil
+
ACL1 ACL2
MatA, leucine+, uracil+, xpr2-322, axp1-2,
mfe1, ACL1, ACL2 This work
mfe1 leucine+ DGA1 Epi
MatA, leucine+, uracil-, xpr2-322, axp1-2,
mfe1, DGA1 This work
mfe1 leucine+ DGA2 Epi
MatA, leucine+, uracil-, xpr2-322, axp1-2,
mfe1, DGA2 This work
mfe1 leucine+ DGA1
MatA, leucine+, uracil-, xpr2-322, axp1-2,
mfe1, DGA1 This work
mfe1 leucine+ DGA2
MatA, leucine+, uracil-, xpr2-322, axp1-2,
mfe1, DGA2 This work
pex10 background
pex10 uracil+ MatA, leucine-, uracil+, xpr2-322, axp1-2,
pex10 This work
pex10 leucine+ MatA, leucine+, uracil-, xpr2-322, axp1-2,
pex10 This work
pex10 leucine+ uracil
+ MatA, leucine+, uracil+, xpr2-322, axp1-2,
pex10 This work
pex10 uracil+ AMPD
MatA, leucine-, uracil+, xpr2-322, axp1-2,
pex10, AMPD This work
pex10 leucine+ AMPD
MatA, leucine+, uracil-, xpr2-322, axp1-2,
pex10, AMPD This work
pex10 uracil+ MAE
MatA, leucine-, uracil+, xpr2-322, axp1-2,
pex10, MAE This work
pex10 leucine+ MAE
MatA, leucine+, uracil-, xpr2-322, axp1-2,
pex10, MAE This work
pex10 leucine+ uracil
+
AMPD MAE
MatA, leucine+, uracil+, xpr2-322, axp1-2,
pex10, AMPD, MAE This work
pex10 leucine+ DGA1 Epi
MatA, leucine+, uracil-, xpr2-322, axp1-2,
pex10, DGA1 This work
pex10 leucine+ DGA2 Epi
MatA, leucine+, uracil-, xpr2-322, axp1-2,
pex10, DGA2 This work
pex10 leucine+ DGA1
MatA, leucine+, uracil-, xpr2-322, axp1-2,
pex10, DGA1 This work
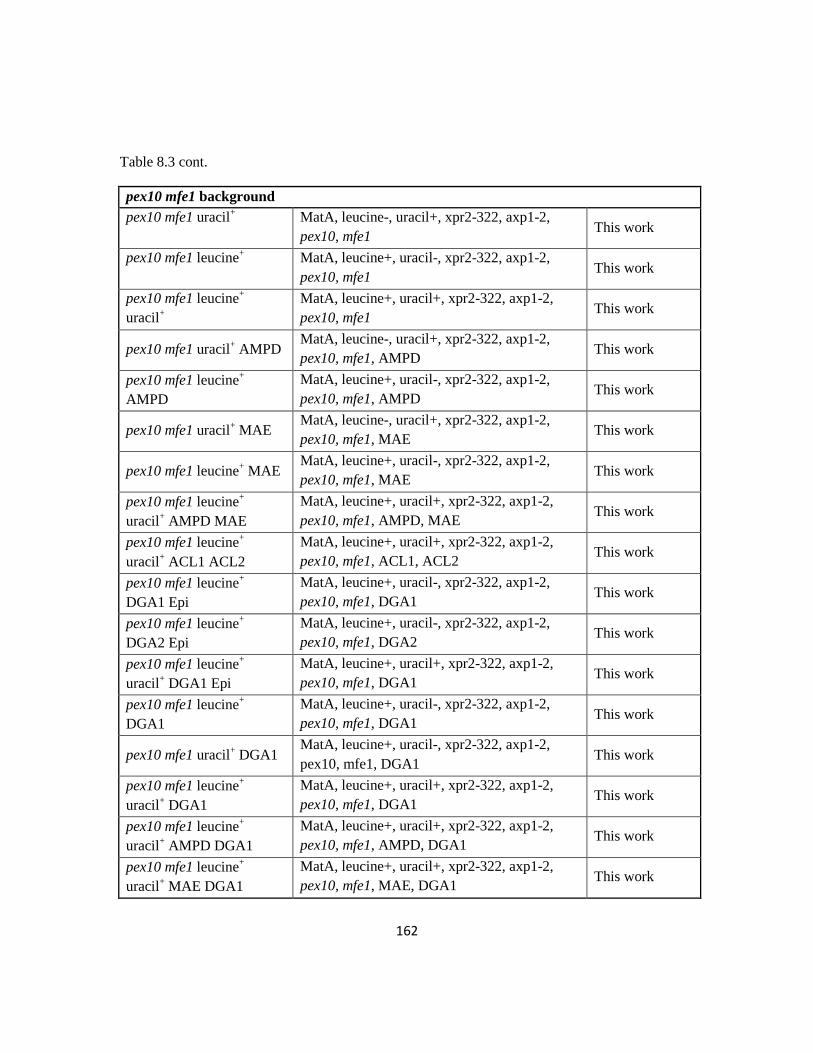
162
Table 8.3 cont.
pex10 mfe1 background
pex10 mfe1 uracil+ MatA, leucine-, uracil+, xpr2-322, axp1-2,
pex10, mfe1 This work
pex10 mfe1 leucine+ MatA, leucine+, uracil-, xpr2-322, axp1-2,
pex10, mfe1 This work
pex10 mfe1 leucine+
uracil+
MatA, leucine+, uracil+, xpr2-322, axp1-2,
pex10, mfe1 This work
pex10 mfe1 uracil+ AMPD
MatA, leucine-, uracil+, xpr2-322, axp1-2,
pex10, mfe1, AMPD This work
pex10 mfe1 leucine+
AMPD
MatA, leucine+, uracil-, xpr2-322, axp1-2,
pex10, mfe1, AMPD This work
pex10 mfe1 uracil+ MAE
MatA, leucine-, uracil+, xpr2-322, axp1-2,
pex10, mfe1, MAE This work
pex10 mfe1 leucine+ MAE
MatA, leucine+, uracil-, xpr2-322, axp1-2,
pex10, mfe1, MAE This work
pex10 mfe1 leucine+
uracil+ AMPD MAE
MatA, leucine+, uracil+, xpr2-322, axp1-2,
pex10, mfe1, AMPD, MAE This work
pex10 mfe1 leucine+
uracil+ ACL1 ACL2
MatA, leucine+, uracil+, xpr2-322, axp1-2,
pex10, mfe1, ACL1, ACL2 This work
pex10 mfe1 leucine+
DGA1 Epi
MatA, leucine+, uracil-, xpr2-322, axp1-2,
pex10, mfe1, DGA1 This work
pex10 mfe1 leucine+
DGA2 Epi
MatA, leucine+, uracil-, xpr2-322, axp1-2,
pex10, mfe1, DGA2 This work
pex10 mfe1 leucine+
uracil+ DGA1 Epi
MatA, leucine+, uracil+, xpr2-322, axp1-2,
pex10, mfe1, DGA1 This work
pex10 mfe1 leucine+
DGA1
MatA, leucine+, uracil-, xpr2-322, axp1-2,
pex10, mfe1, DGA1 This work
pex10 mfe1 uracil+ DGA1
MatA, leucine+, uracil-, xpr2-322, axp1-2,
pex10, mfe1, DGA1 This work
pex10 mfe1 leucine+
uracil+ DGA1
MatA, leucine+, uracil+, xpr2-322, axp1-2,
pex10, mfe1, DGA1 This work
pex10 mfe1 leucine+
uracil+ AMPD DGA1
MatA, leucine+, uracil+, xpr2-322, axp1-2,
pex10, mfe1, AMPD, DGA1 This work
pex10 mfe1 leucine+
uracil+ MAE DGA1
MatA, leucine+, uracil+, xpr2-322, axp1-2,
pex10, mfe1, MAE, DGA1 This work
163
8.4.2 Cloning and transformation procedures
All restriction enzymes were purchased from New England Biolabs and all
digestions were performed according to standard protocols. PCR reactions were set up
with recommended conditions using Phusion high fidelity DNA polymerase (Finnzymes),
or LongAmp Taq DNA polymerase (New England Biolabs). Ligation reactions were
performed overnight at room temperature using T4 DNA Ligase (Fermentas). Gel
extractions were performed using the Fermentas GeneJET extraction kit purchased from
Fisher ThermoScientific. E. coli minipreps were performed using the Zyppy Plasmid
Miniprep Kit (Zymo Research Corporation). E. coli maxipreps were performed using the
Qiagen HiSpeed Plasmid Maxi Kit. Transformation of E. coli strains was performed
using standard electroporator protocols (223). Large amounts of linearized DNA (>20 μg),
necessary for Y. lipolytica PO1f transformation were cleaned and precipitated using a
standard phenol:chloroform extraction followed by an ethanol precipitation.
Transformation of Y. lipolytica with episomal expression plasmids was performed
using the Zymogen Frozen EZ Yeast Transformation Kit II (Zymo Research Corporation),
with plating on YSC-LEU plates. Transformation of Y. lipolytica PO1f with linearized
cassettes was performed as described previously (117), with selection on appropriate
plates. Briefly, Y. lipolytica strains were inoculated from glycerol stock directly into 10
mL YPD media, grown overnight, and harvested at an OD600 between 9 and 15 by
centrifugation at 1000 x g for 3 minutes. Cells were washed twice in sterile water. 108
cells were dispensed into separate microcentrifuge tubes for each transformation, spun
164
down, and resuspended in 1.0 mL 100 mM LiOAc. Cells were incubated with shaking at
30 oC for 60 minutes, spun down, resuspended in 90 μL 100 mM LiOAc, and placed on
ice. 1-5 μg of linearized DNA was added to each transformation mixture in a total
volume of 10 μL, followed by 25 μL of 50 mg mL-1
boiled salmon sperm DNA (Sigma-
Aldrich). Cells were incubated at 30 oC for 15 minutes with shaking, before adding 720
μL PEG buffer (50% PEG8000, 100 mM LiOAc, pH = 6.0) and 45 μL 2M Dithiothreitol.
Cells were incubated at 30 oC with shaking for 60 minutes, heat shocked for 10 minutes
in a 39 oC water bath, spun down and resuspended in 1 mL sterile water. 200 μL of cells
were plated on appropriate selection plates. All auxotrophic or antibiotic selection
markers were flanked with LoxP sites to allow for retrieval of integrated markers with the
pMCS-UAS1B16-TEF-Cre replicative vector (117).
8.4.3 Plasmid construction
Primer sequences can be found in the Table 8. 4. All Y. lipolytica episomal
plasmids were centromeric, replicative vectors derived from plasmid pSl16-Cen1-1(227)
(85) after it had been modified to include a multi-cloning site, a hrGFP green fluorescent
reporter gene (pIRES-hrGFP, Agilent) driven by the strong UAS1B16-TEF promoter
(103), and a cyc1 terminator (228) to create plasmid pMCS-UAS1B16-TEF-hrGFP.
Integrative plasmids were derived from plasmids pUC-S1-UAS1B16-Leum or pUC-S1-
UAS1B16-TEF (117) that contained 5’ and 3’ rDNA integrative sequences surrounding
the following elements - (from 5’ to 3’) a uracil section marker surrounded by LoxP sites
for marker retrieval, the strong UAS1B16-Leum or UAS1B16-TEF promoter, AscI and
165
PacI restriction enzyme sites for gene insertion, and a XPR2 minimal terminator. These
integrative plasmids were also designed to contain two identical NotI restriction enzyme
sites directly outside of the rDNA regions so that plasmid linearization would
simultaneously remove E. coli pUC19-based DNA. All plasmids containing expression
cassettes were sequenced confirmed before transformation into Y. lipolytica.
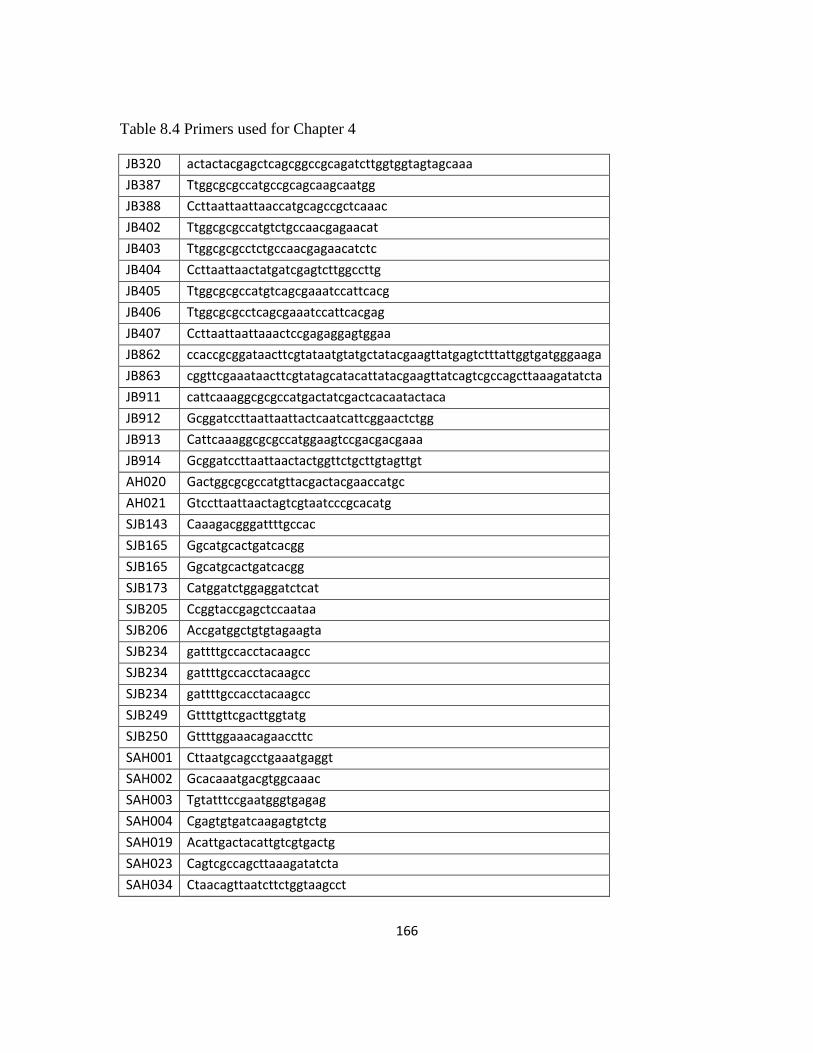
166
Table 8.4 Primers used for Chapter 4
JB320 actactacgagctcagcggccgcagatcttggtggtagtagcaaa
JB387 Ttggcgcgccatgccgcagcaagcaatgg
JB388 Ccttaattaattaaccatgcagccgctcaaac
JB402 Ttggcgcgccatgtctgccaacgagaacat
JB403 Ttggcgcgcctctgccaacgagaacatctc
JB404 Ccttaattaactatgatcgagtcttggccttg
JB405 Ttggcgcgccatgtcagcgaaatccattcacg
JB406 Ttggcgcgcctcagcgaaatccattcacgag
JB407 Ccttaattaattaaactccgagaggagtggaa
JB862 ccaccgcggataacttcgtataatgtatgctatacgaagttatgagtctttattggtgatgggaaga
JB863 cggttcgaaataacttcgtatagcatacattatacgaagttatcagtcgccagcttaaagatatcta
JB911 cattcaaaggcgcgccatgactatcgactcacaatactaca
JB912 Gcggatccttaattaattactcaatcattcggaactctgg
JB913 Cattcaaaggcgcgccatggaagtccgacgacgaaa
JB914 Gcggatccttaattaactactggttctgcttgtagttgt
AH020 Gactggcgcgccatgttacgactacgaaccatgc
AH021 Gtccttaattaactagtcgtaatcccgcacatg
SJB143 Caaagacgggattttgccac
SJB165 Ggcatgcactgatcacgg
SJB165 Ggcatgcactgatcacgg
SJB173 Catggatctggaggatctcat
SJB205 Ccggtaccgagctccaataa
SJB206 Accgatggctgtgtagaagta
SJB234 gattttgccacctacaagcc
SJB234 gattttgccacctacaagcc
SJB234 gattttgccacctacaagcc
SJB249 Gttttgttcgacttggtatg
SJB250 Gttttggaaacagaaccttc
SAH001 Cttaatgcagcctgaaatgaggt
SAH002 Gcacaaatgacgtggcaaac
SAH003 Tgtatttccgaatgggtgagag
SAH004 Cgagtgtgatcaagagtgtctg
SAH019 Acattgactacattgtcgtgactg
SAH023 Cagtcgccagcttaaagatatcta
SAH034 Ctaacagttaatcttctggtaagcct
167
8.4.4 Construction of episomal expression cassettes
The following genes were PCR amplified from Y. lipolytica PO1f gDNA and
inserted into vector pMCS-UAS1B16-TEF-hrGFP in place of hrGFP with an AscI/PacI
digest: AMPD, ACL subunit 1 (ACL1), ACL subunit 2 (ACL2), MAE1, DGA1, and
DGA2 with primers JB387/388, JB402/404, JB405/407, AH020/021, JB911/912, and
JB913/914, respectively. This formed plasmids pMCS-UAS1B16-TEF-AMPD, pMCS-
UAS1B16-TEF-ACL1, pMCS-UAS1B16-TEF-ACL2, pMCS-UAS1B16-TEF-MAE1,
pMCS-UAS1B16-TEF-DGA1, and pMCS-UAS1B16-TEF-DGA2.
A leucine marker containing plasmid containing the Cre-Recombinase gene,
pMCS-UAS1B16-TEF-Cre enables constitutive, high-level Cre expression(117).
8.4.5 Construction of integrative expression cassettes
The following genes were gel extracted from the previously constructed episomal
expression vectors and inserted into vector pUC-S1-UAS1B16-TEF with an AscI/PacI
digest: AMPD, ACL subunit 1 (ACL1), ACL subunit 2 (ACL2), MAE1, DGA1, and
DGA2. This formed plasmids pUC-S1-UAS1B16-TEF-AMPD, pUC-S1-UAS1B16-TEF-
ACL1, pUC-S1-UAS1B16-TEF-ACL2, pUC-S1-UAS1B16-TEF-MAE1, and pUC-S1-
UAS1B16-TEF-DGA1, and pUC-S1-UAS1B16-TEF-DGA2. The loxP-surrounded uracil
marker of these integrative plasmids was replaced with a loxP-surrounded leucine marker
created by amplification of pMCSCen1 template with primers JB862/863 followed by
insertion using a BstBI/SacII digest. These plasmids enabled integrative selection with
leucine auxotrophy and co-expression of two enzymes without marker retrieval. These
leucine marker integrative plasmids were dubbed plasmids pUC-S2-UAS1B16-TEF-
168
AMPD, pUC-S2-UAS1B16-TEF-ACL1, pUC-S2-UAS1B16-TEF-ACL2, pUC-S2-
UAS1B16-TEF-MAE1, and pUC-S2-UAS1B16-TEF-DGA1, and pUC-S2-UAS1B16-TEF-
DGA2. ACL1 and ACL2 were similarly inserted into pUC-S1-UAS1B16-Leum with
primers JB403/404 and JB406/407, respectively, to form plasmids pUC-S1-UAS1B16-
Leum-ACL1 and pUC-S1-UAS1B16-Leum-ACL2.
8.4.6 Strain construction
All strains were confirmed through gDNA extraction and PCR. We previously
constructed two markerless single-gene deletion strains in the Y. lipolytica PO1f
background, PO1f-Δmfe1 and PO1f-Δpex10, deficient in their β-oxidation and
peroxisomal biogenesis capacity, respectively (117). Following our previous protocol,
the PEX10 gene was deleted from strain PO1f-Δmfe1 to form the markerless double
mutant PO1f-Δmfe1-Δpex10. These four strains, referred to as PO1f, pex10, mfe1, and
pex10 mfe1 were utilized as backgrounds for single and double overexpression of the
AMPD, ACL1, ACL2, MAE1, DGA1, and DGA2 proteins, including variation in
selective marker utilized, i.e., leucine (chromosomal or episomal expression cassette) vs.
uracil (chromosomal expression cassette). Integrative cassettes were linearized,
transformed into the four background strains, and selected for on appropriate dropout
plates. Integrative vectors without open reading frames to express, pUC-S1-UAS1B16-
TEF and pUC-S2-UAS1B16-TEF, were utilized to create strains with leucine, uracil, or
both leucine and uracil prototrophies, but without enzyme overexpression.
8.4.7 Lipid quantification and fatty acid profile analysis

169
Lipids from a 500 μL volume of culture, or approximately 1.0 mg dry cell weight,
were extracted following the procedure described by Folch et al. (224) and modified for
yeast (231). Briefly, Y. lipolytica cells were spun down and washed with water twice,
and then resuspended in a chloroform/methanol solution (2:1) and vortexed on high with
glass beads for 20 minutes. The organic solution was extracted and washed with 0.2
volumes of 0.3% NaCl solution before being dried at 60 oC overnight and weighed to
quantify lipid production. Lipids in the culture medium were tested for, but no
extracellular lipids were detected. Dry cell weight was determined after washing cells
twice with H2O and drying overnight at 60 oC. The dried lipids were transesterified with
N-tert-Butyldimethylsilyl-N-methyltrifluoroacetamide (Sigma-Aldrich) following the
procedure of (Paik et al., 2009), and 2 μL samples were injected into a GC-FID (Agilent
Technologies 6890 Network GC System) equipped with an Agilent HP-5 column (5%
phenyl-95% methylsiloxane - product number 19091J-413) to analyze fatty acid fractions.
Briefly, the following settings were used: Detector Temp = 300 oC, He Flow = 1.0 mL
min-1
, Oven Temp = 80 °C for 2 min, increased at 30 °C min-1
to 200 °C, increased at
2 °C min-1
to 229 °C, increased at 1 °C min-1
to 232 °C, increased at 50 °C min-1
to
325 °C. Fatty acid standards for C16:0 palmitic acid, C16:1(n-7) palmitoleic acid, C17:0
heptadecanoic acid, C18:0 stearic acid, C18:1(n-9) oleic acid, and C18:2(n-6) linoleic
acid were purchased from Sigma-Aldrich, transesterified, and analyzed by GC to identify
fatty acid peaks. Similarly, C16:1(n-9) palmitoleic acid was purchased from Cayman
Chemical and used a standard. GC-MS confirmation of fatty acid type was performed
with a Thermo Scientific TSQ Quantum Triple Quad using chemical ionization and a 1.5
170
mL min-1
flow rate. Lipid quantification obtained using both methods converge within an
error of less than 20%; thus, we determine both methods are suitable for quantifying lipid
levels in the cells.
8.4.8 Citric acid quantification
A 2 mL culture sample was pelleted down for 5 minutes at 3000 x g, and the
supernatant was filtered using a 0.2 mm syringe filter (Corning Incorporated). Filtered
supernatant was analyzed with a HPLC Ultimate 3000 (Dionex) and a Zorbax SB-Aq
column (Agilent Technologies). A 2.0 μL injection volume was used in a mobile phase
composed of a 99.5:0.5 ratio of 25 mM potassium phosphate buffer (pH=2.0) to
acetonitrile with a flow rate of 1.25 mL min-1
. The column temperature was maintained
at 30 oC and UV–Vis absorption was measured at 210 nm. A citric acid standard (Sigma-
Aldrich) was used to detect and quantify citric acid production.
8.4.9 Ammonium quantification
1 mL of culture was heated to 80 oC for 15 minutes, and then centrifuged at
17,900 x g for 3 minutes. Supernatant was stored at 4 oC for less than 1 week, and
ammonium concentration was determined using the R-Biopharm Ammonium Assay kit
following the manufacturer’s instructions. Ammonium Assay kit accuracy was assessed
by measuring ammonium concentration in solutions with varying concentrations of Yeast
Nitrogen Base w/o amino acids. Minor necessary adjustments were made using the
resulting standard curve.
8.4.10 Bioreactor fermentations
171
Typically, bioreactor fermentations were run in minimal media (described above)
as batch processes. However, one fermentation included a spike of an additional 80 g/L
glucose at the 72 hour timepoint, and another had a doubled media formulation that
contained 160 g/L glucose and 13.4 g/L YNB w/o amino acids. All fermentations were
inoculated to an initial OD600 = 0.1 in 1.5 L of media. Dissolved oxygen was maintained
at 50% of maximum by varying rotor speed between 250 rpm and 800 rpm with a
constant air input flow rate of 2.5 v v-1
min-1
(3.75 L min-1
). PH was maintained at 3.5 or
above with 2.5 M NaOH, and temperature was maintained at 28 oC. 10-15 mL samples
were taken every twelve hours, and fermentations lasted 6-7 days. We ran several
fermentations with suboptimal conditions before settling on the above parameters.
Supernatant was diluted 1:10 and glucose concentration was quantified using a YSI Life
Sciences Bioanalyzer 7100MBS.
8.4.11 Transesterification
Y. lipolytica lipid reserves were transesterified using acid-promoted direct
methanolysis of cellular biomass (232). 1L of pex10 mfe1 leucine+ uracil
+ DGA1
fermented in a bioreactor for seven days as described above was washed twice in 400 mL
water. Cells were dried on a hotplate at 140 oC for 3 hours. The dried cell mass was
transesterified with 2% w v-1
H2SO4 in 200 mL methanol at a fast boil with reflux and
constant agitation for 72 hours. The reaction mixture was centrifuged to remove cellular
debris. FAMEs were extracted from the supernatant by adding 0.2 volumes water,
mixing, centrifuging, and removing the polar phase. Additional FAMEs were extracted
172
in the polar phase with a second extraction using 0.4 volume of water. FAMEs were
washed in 1 volume of water and analyzed with TLC and GC.
8.4.12 Protein extraction
Protein content from 0.5 to 1.0 mL of culture was extracted using the Pierce BCA
Protein Assay Kit following the manufacturer’s instructions. Protein concentration (mg
mL-1
) was normalized per mL of culture and per culture OD600 to normalize to the
individual cellular level. PO1f leucine+ uracil
+ and pex10 mfe1 leucine
+ uracil
+ DGA1
strains were analyzed in this manner after fermentation in a bioreactor.
8.5 Material and Method for Chapter 5
8.5.1 Culture media
For testing growth with GABA as a nitrogen source, 1 g/L GABA were added in
place of ammonia sulfate. Lipid accumulation was promoted by cultivation in media with
high glucose, containing 80 g/L glucose, 0.79 g/L CSM supplement, 6.7 g/L Yeast
Nitrogen Base w/ ammonia sulfate w/o amino acid. Minimal media formulations utilized
for bioreactor fermentations contained 160 g/L glucose and 13.4 g/L Yeast Nitrogen Base
w/ ammonia sulfate w/o amino acids (3.4 g/L YNB and 10 g/L (NH4)2SO4). Solid media
for E. coli and Y. lipolytica were prepared by adding 15 g/L agar (Teknova) to liquid
media formulations. Nile Red plates were made by adding 1mM Nile Red (MP
biomedicals) stock solution dissolved in DMSO (Fisher Scientific) to a final
concentration of 1µM.
8.5.2 Transformation procedures
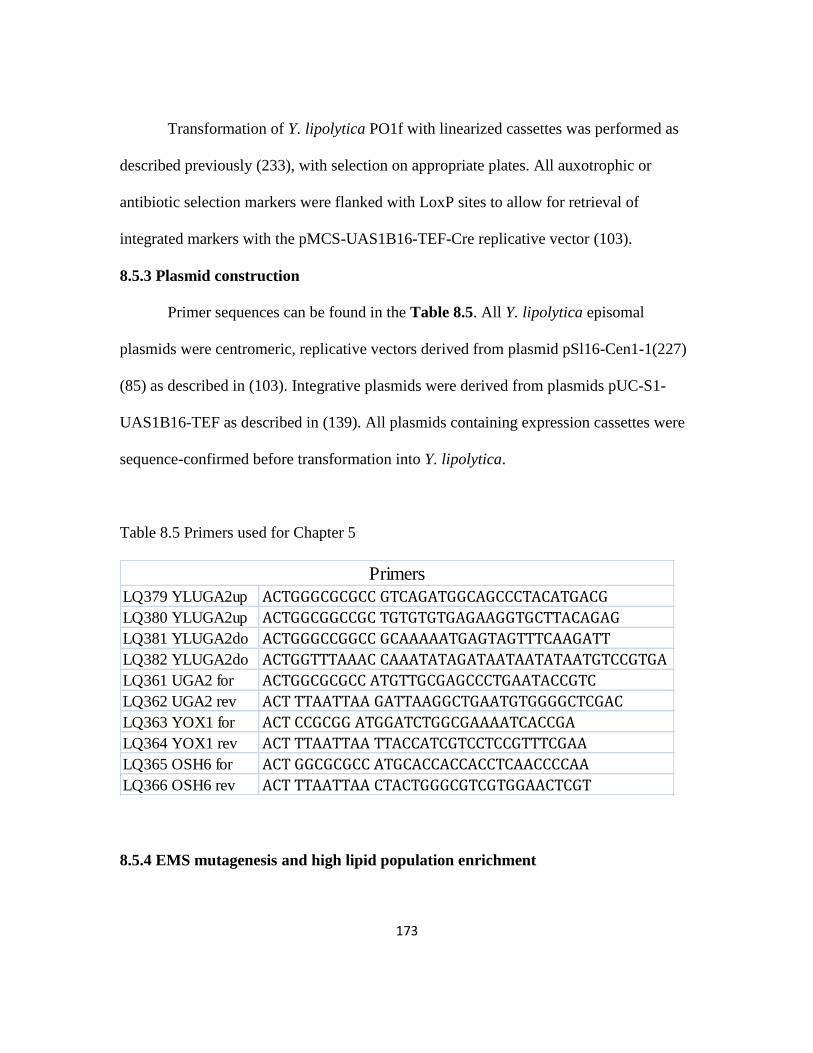
173
Transformation of Y. lipolytica PO1f with linearized cassettes was performed as
described previously (233), with selection on appropriate plates. All auxotrophic or
antibiotic selection markers were flanked with LoxP sites to allow for retrieval of
integrated markers with the pMCS-UAS1B16-TEF-Cre replicative vector (103).
8.5.3 Plasmid construction
Primer sequences can be found in the Table 8.5. All Y. lipolytica episomal
plasmids were centromeric, replicative vectors derived from plasmid pSl16-Cen1-1(227)
(85) as described in (103). Integrative plasmids were derived from plasmids pUC-S1-
UAS1B16-TEF as described in (139). All plasmids containing expression cassettes were
sequence-confirmed before transformation into Y. lipolytica.
Table 8.5 Primers used for Chapter 5
LQ379 YLUGA2up ACTGGGCGCGCC GTCAGATGGCAGCCCTACATGACG
LQ380 YLUGA2up ACTGGCGGCCGC TGTGTGTGAGAAGGTGCTTACAGAG
LQ381 YLUGA2do ACTGGGCCGGCC GCAAAAATGAGTAGTTTCAAGATT
LQ382 YLUGA2do ACTGGTTTAAAC CAAATATAGATAATAATATAATGTCCGTGA
LQ361 UGA2 for ACTGGCGCGCC ATGTTGCGAGCCCTGAATACCGTC
LQ362 UGA2 rev ACT TTAATTAA GATTAAGGCTGAATGTGGGGCTCGAC
LQ363 YOX1 for ACT CCGCGG ATGGATCTGGCGAAAATCACCGA
LQ364 YOX1 rev ACT TTAATTAA TTACCATCGTCCTCCGTTTCGAA
LQ365 OSH6 for ACT GGCGCGCC ATGCACCACCACCTCAACCCCAA
LQ366 OSH6 rev ACT TTAATTAA CTACTGGGCGTCGTGGAACTCGT
Primers
8.5.4 EMS mutagenesis and high lipid population enrichment
174
The EMS mutagenesis procedures were performed following the protocol
described by Winston (234). Briefly, an overnight culture was cultivated to OD around
10. Cells were then harvested, washed and suspended with 0.1M sodium phosphate
buffer (pH=7). 30µl of EMS was added and incubated along with an unmutagenized
control for 1 hour at 30°C, with agitation. The cells were then washed with 5% sodium
thiosulfate and prepared for serial transfer experiments to enrich the high lipid population.
The EMS treated cells and unmutagenized cells starting OD approximately equals
5 were first cultured YSC media for 72 hours and then cultured in high glucose media
(containing 80 g/L glucose, 0.79 g/L CSM supplement, 6.7 g/L Yeast Nitrogen Base w/
ammonia sulfate w/o amino acid) for 144 hours. High glucose media has been used here
to induce lipid accumulation in Y. lipolytica (235). The cells were centrifuged down with
100 x g for 2 minutes, the unclear supernatant, which contains enhanced lipogenesis
strains, was used as seed for another round of cultivation after pellet down with starting
OD approximately equals 0.1. After five rounds of transfer, the cells were plated on Nile
Red YSC plate to isolate of high lipid production strains. Individual colonies were picked
from the EMS treated cells as well as the unmutagenized but serial transferred cells
(spontaneous mutagenesis) for characterization. First round of evolution was performed
in 15ml culture tubes with 2ml media with starting OD equals 2.5 and the second round
was done in 500ml flask with 100ml media with starting OD equals 0.1.
8.5.5 Whole genome sequencing and small nucleotide variation analysis
Next generation sequencing platform Illumina paired ended sequencing PE
2X100 were performed with genomic DNA extracted from strain E26 and E13 by
175
Genomic Sequencing and Analysis Facility in The University of Texas at Austin.
6,424,381 reads for strain E26 and 6,565,093 reads for strain E13 were collected from
Illumina HiSeq, which lead to a coverage approximately 65X. The illumina reads were
mapped to the CLIB122 genome using BWA (236) and analyzed with Samtools (156)
and BEDTools (157). The SNPs identified were then filtered with SnpSift with
QUAL >= 30 (237). The SNPs identified from PO1f , EMS26 and EMS13 were
compared to extract the authentic SNPs in EMS26 and EMS13. The identified SNPs were
then visualized in the IGV genome visualization software to validate as well as study the
location of the SNPs in the genome due to the high false error rate in SNP calling process
(238).
8.5.6 RNA preparation, sequencing and analysis
Samples were taken at the early stationary phase of strain PO1f ura+ leu+ and
E26 (evolved from strain Δpex10, mfe DGA1 ura+ leu+) when growing in with 100ml in
500ml flask (~48 h). Total RNA was extracted by ™ RNA Purification Kit, yeast (Life
technologies) according to the manufacturer’s instructions. The RNA quality and quantity
were determined using Agilent 2100 Bioanalyzer (Agilent Technologies, Santa Clara, CA,
USA). The RNA integrity number (RIN) of all RNA samples used for sequencing was
more than 7.0. The RNA samples were then sent to Genomic Sequencing and Analysis
Facility at The University of Texas at Austin for library preparation and sequencing. The
sequencing experiments were performed with using illumina Hiseq single end 100bp
(1X100) platform.
176
The sequence files in FASTQ format were first groomed with FastQC (239). The
RNA-seq single-end reads were analyzed with TopHat and Cufflinks (240). The reads
were mapped into transcripts using TopHat by setting the reference genome as Y.
lipolytica (CLIB122) (65). 18,948,539/19,943,689/18,170,124 reads from triplicates of
strain E26 and 18,322,608/20,708,616/18,393,515 reads from triplicates of strain PO1f
ura+ leu
+ were successfully mapped to the reference sequences. The mapped reads were
then analyzed by bedtools (157) and edgeR (192) to identify differentially expressed
genes. The differentially expression were further filtered with log2 > 1 (overexpression)
or log2 < -1 (downregulation). The gene ontology analysis was performed using DAVID
(241) with background setting as Y. lipolytica.
8.6 Material and Method for Chapter 6
8.6.1 Culture media
YSC media was used for starting cultures, consisted of 20 g/L glucose (Fisher
Scientific), 0.79 g/L CSM supplement (MP Biomedicals), and 6.7 g/L Yeast Nitrogen
Base w/ ammonia sulfate w/o amino acids (Becton, Dickinson, and Company). YSC-
LEU media contained 0.69 g/L CSM-Leucine in place of CSM, respectively. Lipid
accumulation was promoted by cultivation in media with high glucose, containing 80 g/L
glucose, 0.79 g/L CSM supplement, 2 g/L ammonia sulfate and 1.7 g/L Yeast Nitrogen
Base w/o ammonia sulfate w/o amino acid for strains with leu+
and ura+ and 160 g/L
glucose, 0.79 g/L CSM supplement, 0.2 g/L ammonia sulfate and 1.7 g/L Yeast Nitrogen
Base w/o ammonia sulfate w/o amino acid for strains with leu+. YPD media contained 10
177
g/L yeast extract (Fisher Scientific), 20 g/L peptone (Fisher Scientific) and 20 g/L
glucose, and was often supplemented with 300 μg/ml Hygromycin B (Invitrogen) for
knockout selection. GAA media is the same to YPD media except 50g/L glucose with
5µM antimycin A (Sigma-Aldrich). The unsaturated fatty acids (UFAs) – oleic (Fisher
Scientific) and palmitoleic acids (Sigma-Aldrich) – were used at a final concentration of
0.5mM each. Minimal media formulations utilized for bioreactor fermentations contained
80 g/L glucose and 3.4 g/L Yeast Nitrogen Base w/o ammonia sulfate w/o amino acids
and 4 g/L (NH4)2SO4 with another 80g glucose fed at day 3 time point. Solid media for E.
coli and Y. lipolytica were prepared by adding 15 g/L agar (Teknova) to liquid media
formulations. Nile Red plates were made by adding 1mM Nile Red (MP biomedicals)
stock solution dissolved in DMSO (Fisher Scientific) to a final concentration of 1µM.
8.6.2 Plasmid construction
Primer sequences can be found in the Table 8.6. Y.lipolytica integrative/knockout
related plasmids for DGA1 overexpression and PEX10 knockout were described in (117).
The knockout plasmid for MGA2 was constructed with as described in (117).
Mga2G643R were cloned with primer pair which including 1500 bps upstream to the
start codon to keep its native regulation in plasmids pMCSUAS1B16-TEF as described in
(103) and digested with NdeI/ BamHI to linearized the plasmid for integration. All
plasmids containing expression cassettes were sequence-confirmed before transformation
into Y. lipolytica.
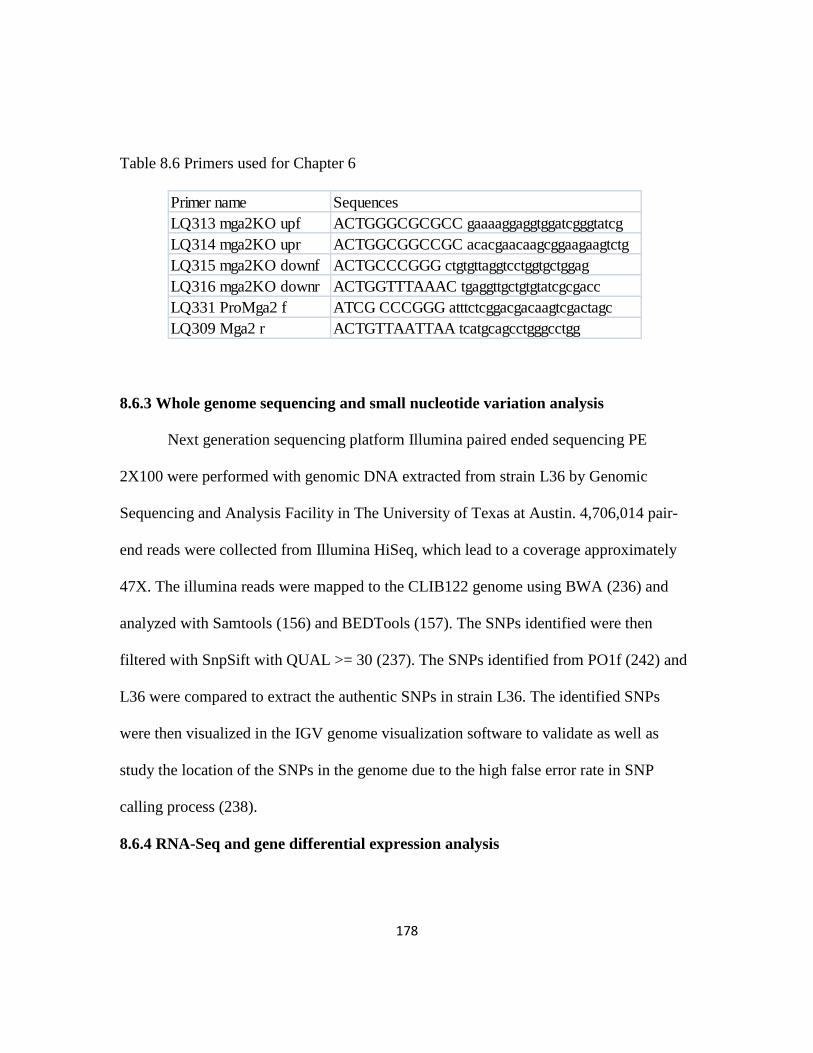
178
Table 8.6 Primers used for Chapter 6
Primer name Sequences
LQ313 mga2KO upf ACTGGGCGCGCC gaaaaggaggtggatcgggtatcg
LQ314 mga2KO upr ACTGGCGGCCGC acacgaacaagcggaagaagtctg
LQ315 mga2KO downf ACTGCCCGGG ctgtgttaggtcctggtgctggag
LQ316 mga2KO downr ACTGGTTTAAAC tgaggttgctgtgtatcgcgacc
LQ331 ProMga2 f ATCG CCCGGG atttctcggacgacaagtcgactagc
LQ309 Mga2 r ACTGTTAATTAA tcatgcagcctgggcctgg
8.6.3 Whole genome sequencing and small nucleotide variation analysis
Next generation sequencing platform Illumina paired ended sequencing PE
2X100 were performed with genomic DNA extracted from strain L36 by Genomic
Sequencing and Analysis Facility in The University of Texas at Austin. 4,706,014 pair-
end reads were collected from Illumina HiSeq, which lead to a coverage approximately
47X. The illumina reads were mapped to the CLIB122 genome using BWA (236) and
analyzed with Samtools (156) and BEDTools (157). The SNPs identified were then
filtered with SnpSift with QUAL >= 30 (237). The SNPs identified from PO1f (242) and
L36 were compared to extract the authentic SNPs in strain L36. The identified SNPs
were then visualized in the IGV genome visualization software to validate as well as
study the location of the SNPs in the genome due to the high false error rate in SNP
calling process (238).
8.6.4 RNA-Seq and gene differential expression analysis
179
Total RNA was extracted from triplicates from strains PO1f leu+ and PO1f Δmga2
MGA2g1927a leu+ using RiboPure™ RNA Purification Kit for yeast (life technologies)
at 36 hour time point with starting OD equals 0.1 in media with 160 g/L glucose, 0.79 g/L
CSM-LEU supplement and 6.7 g/L Yeast Nitrogen Base w/o amino acid. The polyA
mRNA capture and sequential RNA-Seq library construction and next generation
sequencing platform Illumina paired ended sequencing PE 2X100 were performed by
Genomic Sequencing and Analysis Facility in The University of Texas at Austin. The
sequence files in FASTQ format were first groomed with FastQC (239). The reads were
analyzed with TopHat and Cufflinks (240). 8,194,962/13,338,379/14,861,420 reads of the
triplicates from PO1f leu+ and 12,077,107/6,210,940/13,192,029 reads of the triplicates
from PO1fΔmga2 MGA2(g1927a) leu+ were mapped into transcripts using TopHat by
setting the reference genome as Y. lipolytica (CLIB122) (65). The transcripts were
assembled and the FPKM (fragments per kilobase of exon per million fragments mapped)
were estimated using Cufflinks with the default parameter settings, followed by
transcripts merge using Cuffmerge. The assembled transcripts between control group and
experimental group were compared using Cuffdiff. The differential gene expressions
were analyzed with bedtools (157) and edgeR (192) for significant expression with output
bam files from TopHat. The differentially expression were further filtered with log2 > 1
(overexpression) or log2 < -1 (downregulation) with p-value and FDR both < 0.05. The
promoter motifs were analysis with SCOPE (243) and the identified motifs were then
compared with transcriptional factor binding sites sequences in YEASTRACT database

180
(194). The reference sequences and annotation filed were downloaded from Ensembl
Genomes.
181
References
1. Krivoruchko A, Siewers V, Nielsen J. Opportunities for yeast metabolic
engineering: Lessons from synthetic biology. Biotechnology Journal. 2011;6(3):262-76.
2. Siddiqui MS, Thodey K, Trenchard I, Smolke CD. Advancing secondary
metabolite biosynthesis in yeast with synthetic biology tools. Fems Yeast Research.
2012;12(2):144-70.
3. Curran KA, Alper HS. Expanding the chemical palate of cells by combining
systems biology and metabolic engineering. Metab Eng. 2012;14(4):289-97.
4. Peralta-Yahya PP, Zhang F, del Cardayre SB, Keasling JD. Microbial engineering
for the production of advanced biofuels. Nature. 2012;488(7411):320-8.
5. Lee JW, Na D, Park JM, Lee J, Choi S, Lee SY. Systems metabolic engineering
of microorganisms for natural and non-natural chemicals. Nat Chem Biol. 2012;8(6):536-
46.
6. Pickens LB, Tang Y, Chooi YH. Metabolic engineering for the production of
natural products. Annu Rev Chem Biomol Eng. 2011;2:211-36.
7. Dunlop M. Engineering microbes for tolerance to next-generation biofuels.
Biotechnology for Biofuels. 2011;4(1):32.
8. Jeffries TW. Engineering yeasts for xylose metabolism. Curr Opin Biotechnol.
2006;17(3):320-6.
9. Liu L, Redden H, Alper HS. Frontiers of yeast metabolic engineering:
diversifying beyond ethanol and Saccharomyces. Current Opinion in Biotechnology.
2013;24(6):1023-30.
10. Hu B, Lidstrom M. Metabolic engineering of Methylobacterium extorquens AM1
for 1-butanol production. Biotechnology for Biofuels. 2014;7(1):156.
11. Xu P, Li L, Zhang F, Stephanopoulos G, Koffas M. Improving fatty acids
production by engineering dynamic pathway regulation and metabolic control.
Proceedings of the National Academy of Sciences. 2014;111(31):11299-304.
12. Leonard E, Ajikumar PK, Thayer K, Xiao W-H, Mo JD, Tidor B, et al.
Combining metabolic and protein engineering of a terpenoid biosynthetic pathway for
overproduction and selectivity control. Proceedings of the National Academy of Sciences.
2010;107(31):13654-9.
13. Thodey K, Galanie S, Smolke CD. A microbial biomanufacturing platform for
natural and semisynthetic opioids. Nat Chem Biol. 2014;10(10):837-44.
14. Ro D-K, Paradise EM, Ouellet M, Fisher KJ, Newman KL, Ndungu JM, et al.
Production of the antimalarial drug precursor artemisinic acid in engineered yeast. Nature.
2006;440(7086):940-3.
15. Blazeck J, Alper HS. Promoter engineering: Recent advances in controlling
transcription at the most fundamental level. Biotechnology Journal. 2013;8(1):46-58.
16. Alper H, Fischer C, Nevoigt E, Stephanopoulos G. Tuning genetic control
through promoter engineering. P Natl Acad Sci USA. 2005;102(36):12678-83.

182
17. Blazeck J, Garg R, Reed B, Alper HS. Controlling promoter strength and
regulation in Saccharomyces cerevisiae using synthetic hybrid promoters. Biotechnology
and Bioengineering. 2012;109(11):2884-95.
18. Curran KA, Crook NC, Karim AS, Gupta A, Wagman AM, Alper HS. Design of
synthetic yeast promoters via tuning of nucleosome architecture. Nat Commun. 2014;5.
19. Karim AS, Curran KA, Alper HS. Characterization of plasmid burden and copy
number in Saccharomyces cerevisiae for optimization of metabolic engineering
applications. Fems Yeast Research. 2013;13(1):107-16.
20. Romanos MA, Scorer CA, Clare JJ. Foreign gene expression in yeast: a review.
Yeast. 1992;8(6):423-88.
21. Chen Y, Partow S, Scalcinati G, Siewers V, Nielsen J. Enhancing the copy
number of episomal plasmids in Saccharomyces cerevisiae for improved protein
production. Fems Yeast Research. 2012;12(5):598-607.
22. Kim B, Park H, Na D, Lee SY. Metabolic engineering of Escherichia coli for the
production of phenol from glucose. Biotechnology Journal. 2014;9(5):621-9.
23. Tai M, Stephanopoulos G. Engineering the push and pull of lipid biosynthesis in
oleaginous yeast Yarrowia lipolytica for biofuel production. Metabolic Engineering.
2013;15(0):1-9.
24. Xue Z, Sharpe PL, Hong S-P, Yadav NS, Xie D, Short DR, et al. Production of
omega-3 eicosapentaenoic acid by metabolic engineering of Yarrowia lipolytica. Nat
Biotech. 2013;31(8):734-40.
25. Guo D, Zhu J, Deng Z, Liu T. Metabolic engineering of Escherichia coli for
production of fatty acid short-chain esters through combination of the fatty acid and 2-
keto acid pathways. Metabolic Engineering. 2014;22(0):69-75.
26. Börgel D, van den Berg M, Hüller T, Andrea H, Liebisch G, Boles E, et al.
Metabolic engineering of the non-conventional yeast Pichia ciferrii for production of rare
sphingoid bases. Metabolic Engineering. 2012;14(4):412-26.
27. Jiménez A, Santos MA, Pompejus M, Revuelta JL. Metabolic Engineering of the
Purine Pathway for Riboflavin Production in Ashbya gossypii. Applied and
Environmental Microbiology. 2005;71(10):5743-51.
28. Scalcinati G, Partow S, Siewers V, Schalk M, Daviet L, Nielsen J. Combined
metabolic engineering of precursor and co-factor supply to increase alpha-santalene
production by Saccharomyces cerevisiae. Microbial Cell Factories. 2012;11(1):117.
29. Yao L, Qi F, Tan X, Lu X. Improved production of fatty alcohols in cyanobacteria
by metabolic engineering. Biotechnology for Biofuels. 2014;7(1):94.
30. Scalcinati G, Otero JM, Van Vleet JRH, Jeffries TW, Olsson L, Nielsen J.
Evolutionary engineering of Saccharomyces cerevisiae for efficient aerobic xylose
consumption. Fems Yeast Research. 2012;12(5):582-97.
31. Smith KM, Liao JC. An evolutionary strategy for isobutanol production strain
development in Escherichia coli. Metabolic Engineering. 2011;13(6):674-81.
32. Nevoigt E. Progress in Metabolic Engineering of Saccharomyces cerevisiae.
Microbiology and Molecular Biology Reviews. 2008;72(3):379-412.
183
33. Hong K-K, Nielsen J. Recovery of Phenotypes Obtained by Adaptive Evolution
through Inverse Metabolic Engineering. Applied and Environmental Microbiology.
2012;78(21):7579-86.
34. Zhu X, Tan Z, Xu H, Chen J, Tang J, Zhang X. Metabolic evolution of two
reducing equivalent-conserving pathways for high-yield succinate production in
Escherichia coli. Metabolic Engineering. 2014;24(0):87-96.
35. Santos CNS, Xiao W, Stephanopoulos G. Rational, combinatorial, and genomic
approaches for engineering L-tyrosine production in Escherichia coli. Proceedings of the
National Academy of Sciences. 2012;109(34):13538-43.
36. Dmytruk KV, Yatsyshyn VY, Sybirna NO, Fedorovych DV, Sibirny AA.
Metabolic engineering and classic selection of the yeast Candida famata (Candida flareri)
for construction of strains with enhanced riboflavin production. Metabolic Engineering.
2011;13(1):82-8.
37. Graf A, Dragosits M, Gasser B, Mattanovich D. Yeast systems biotechnology for
the production of heterologous proteins. Fems Yeast Research. 2009;9(3):335-48.
38. Koboldt DC, Steinberg KM, Larson DE, Wilson RK, Mardis ER. The next-
generation sequencing revolution and its impact on genomics. Cell. 2013;155(1):27-38.
PMCID: 3969849.
39. Hong K-K, Vongsangnak W, Vemuri GN, Nielsen J. Unravelling evolutionary
strategies of yeast for improving galactose utilization through integrated systems level
analysis. Proceedings of the National Academy of Sciences. 2011;108(29):12179-84.
40. Caspeta L, Chen Y, Ghiaci P, Feizi A, Buskov S, Hallström BM, et al. Altered
sterol composition renders yeast thermotolerant. Science. 2014;346(6205):75-8.
41. Eswaran J, Horvath A, Godbole S, Reddy SD, Mudvari P, Ohshiro K, et al. RNA
sequencing of cancer reveals novel splicing alterations. Sci Rep. 2013;3.
42. Trapnell C, Williams BA, Pertea G, Mortazavi A, Kwan G, van Baren MJ, et al.
Transcript assembly and quantification by RNA-Seq reveals unannotated transcripts and
isoform switching during cell differentiation. Nat Biotech. 2010;28(5):511-5.
43. Wu JQ, Wang X, Beveridge NJ, Tooney PA, Scott RJ, Carr VJ, et al.
Transcriptome Sequencing Revealed Significant Alteration of Cortical Promoter Usage
and Splicing in Schizophrenia. PLoS ONE. 2012;7(4):e36351.
44. Feng X, Zhao H. Investigating host dependence of xylose utilization in
recombinant Saccharomyces cerevisiae strains using RNA-seq analysis. Biotechnology
for Biofuels. 2013;6(1):96.
45. Ravin N, Eldarov M, Kadnikov V, Beletsky A, Schneider J, Mardanova E, et al.
Genome sequence and analysis of methylotrophic yeast Hansenula polymorpha DL1.
BMC Genomics. 2013;14(1):837.
46. Schirmer A, Rude MA, Li X, Popova E, del Cardayre SB. Microbial Biosynthesis
of Alkanes. Science. 2010;329(5991):559-62.
47. Zhang F, Ouellet M, Batth TS, Adams PD, Petzold CJ, Mukhopadhyay A, et al.
Enhancing fatty acid production by the expression of the regulatory transcription factor
FadR. Metabolic Engineering. 2012;14(6):653-60.

184
48. Lennen RM, Pfleger BF. Microbial production of fatty acid-derived fuels and
chemicals. Current Opinion in Biotechnology. 2013;24(6):1044-53.
49. Beller HR, Goh E-B, Keasling JD. Genes Involved in Long-Chain Alkene
Biosynthesis in Micrococcus luteus. Applied and Environmental Microbiology.
2010;76(4):1212-23.
50. Liu Y, Wang C, Yan J, Zhang W, Guan W, Lu X, et al. Hydrogen peroxide-
independent production of alpha-alkenes by OleTJE P450 fatty acid decarboxylase.
Biotechnology for Biofuels. 2014;7(1):28.
51. Steen EJ, Kang Y, Bokinsky G, Hu Z, Schirmer A, McClure A, et al. Microbial
production of fatty-acid-derived fuels and chemicals from plant biomass. Nature.
2010;463(7280):559-62.
52. Hamilton ML, Haslam RP, Napier JA, Sayanova O. Metabolic engineering of
Phaeodactylum tricornutum for the enhanced accumulation of omega-3 long chain
polyunsaturated fatty acids. Metabolic Engineering. 2014;22(0):3-9.
53. Rywińska A, Rymowicz W. High-yield production of citric acid by Yarrowia
lipolytica on glycerol in repeated-batch bioreactors. Journal of Industrial Microbiology &
Biotechnology. 2010;37(5):431-5.
54. Beopoulos A, Chardot T, Nicaud JM. Yarrowia lipolytica: A model and a tool to
understand the mechanisms implicated in lipid accumulation. Biochimie. 2009;91(6):692-
6.
55. Beopoulos A, Mrozova Z, Thevenieau F, Le Dall MT, Hapala I, Papanikolaou S,
et al. Control of Lipid Accumulation in the Yeast Yarrowia lipolytica. Applied and
Environmental Microbiology. 2008;74(24):7779-89.
56. Beopoulos A, Cescut J, Haddouche R, Uribelarrea JL, Molina-Jouve C, Nicaud
JM. Yarrowia lipolytica as a model for bio-oil production. Progress in Lipid Research.
2009;48(6):375-87.
57. Papanikolaou S, Muniglia L, Chevalot I, Aggelis G, Marc I. Yarrowia lipolytica
as a potential producer of citric acid from raw glycerol. Journal of Applied Microbiology.
2002;92(4):737-44.
58. Yu Z, Du G, Zhou J, Chen J. Enhanced α-ketoglutaric acid production in
Yarrowia lipolytica WSH-Z06 by an improved integrated fed-batch strategy. Bioresource
Technology. 2012;114(0):597-602.
59. Andre A, Chatzifragkou A, Diamantopoulou P, Sarris D, Philippoussis A,
Galiotou-Panayotou M, et al. Biotechnological conversions of bio-diesel-derived crude
glycerol by Yarrowia lipolytica strains. Eng Life Sci. 2009;9(6):468-78.
60. Barth G, Gaillardin C. Physiology and genetics of the dimorphic fungus Yarrowia
lipolytica. Fems Microbiology Reviews. 1997;19(4):219-37.
61. Fickers P, Benetti PH, Wache Y, Marty A, Mauersberger S, Smit MS, et al.
Hydrophobic substrate utilisation by the yeast Yarrowia lipolytica, and its potential
applications. Fems Yeast Research. 2005;5(6-7):527-43.
62. Muller S, Sandal T, Kamp-Hansen P, Dalboge H. Comparison of expression
systems in the yeasts Saccharomyces cerevisiae, Hansenula polymorpha, Klyveromyces
185
lactis, Schizosaccharomyces pombe and Yarrowia lipolytica. Cloning of two novel
promoters from Yarrowia lipolytica. Yeast. 1998;14(14):1267-83.
63. Madzak C, Gaillardin C, Beckerich JM. Heterologous protein expression and
secretion in the non-conventional yeast Yarrowia lipolytica: a review. Journal of
Biotechnology. 2004;109(1-2):63-81.
64. Dominguez A, Ferminan E, Sanchez M, Gonzalez FJ, Perez-Campo FM, Garcia S,
et al. Non-conventional yeasts as hosts for heterologous protein production. Int Microbiol.
1998;1(2):131-42.
65. Dujon B, Sherman D, Fischer G, Durrens P, Casaregola S, Lafontaine I, et al.
Genome evolution in yeasts. Nature. 2004;430(6995):35-44.
66. Sherman D, Durrens P, Iragne F, Beyne E, Nikolski M, Souciet JL. Genolevures
complete genomes provide data and tools for comparative genomics of
hemiascomycetous yeasts. Nucleic Acids Research. 2006;34:D432-D5.
67. Davidow LS, Apostolakos D, Odonnell MM, Proctor AR, Ogrydziak DM, Wing
RA, et al. INTEGRATIVE TRANSFORMATION OF THE YEAST YARROWIA-
LIPOLYTICA. Current Genetics. 1985;10(1):39-48.
68. Fournier P, Abbas A, Chasles M, Kudla B, Ogrydziak DM, Yaver D, et al.
Colocalization of centromeric and replicative functions on autonomously replicating
sequences isolated from the yeast Yarrowia lipolytica. Proceedings of the National
Academy of Sciences. 1993;90(11):4912-6.
69. Chen DC, Yang BC, Kuo TT. ONE-STEP TRANSFORMATION OF YEAST IN
STATIONARY PHASE. Current Genetics. 1992;21(1):83-4.
70. Fickers P, Le Dall MT, Gaillardin C, Thonart P, Nicaud JM. New disruption
cassettes for rapid gene disruption and marker rescue in the yeast Yarrowia lipolytica. J
Microbiol Methods. 2003;55(3):727-37.
71. Vernis L, Abbas A, Chasles M, Gaillardin CM, Brun C, Huberman JA, et al. An
origin of replication and a centromere are both needed to establish a replicative plasmid
in the yeast Yarrowia lipolytica. Molecular and Cellular Biology. 1997;17(4):1995-2004.
72. Vernis L, Poljak L, Chasles M, Uchida K, Casarégola S, Käs E, et al. Only
Centromeres Can Supply the Partition System Required for ARS Function in the Yeast
Yarrowia lipolytica. J Mol Biol. 2001;305(2):203-17.
73. Matsuoka M, Matsubara M, Daidoh H, Imanaka T, Uchida K, Aiba S.
ANALYSIS OF REGIONS ESSENTIAL FOR THE FUNCTION OF
CHROMOSOMAL REPLICATOR SEQUENCES FROM YARROWIA-LIPOLYTICA.
Mol Gen Genet. 1993;237(3):327-33.
74. Juretzek T, Le Dall MT, Mauersberger S, Gaillardin C, Barth G, Nicaud JM.
Vectors for gene expression and amplification in the yeast Yarrowia lipolytica. Yeast.
2001;18(2):97-113.
75. Vanheerikhuizen H, Ykema A, Klootwijk J, Gaillardin C, Ballas C, Fournier P.
HETEROGENEITY IN THE RIBOSOMAL-RNA GENES OF THE YEAST
YARROWIA-LIPOLYTICA - CLONING AND ANALYSIS OF 2 SIZE CLASSES OF
REPEATS. Gene. 1985;39(2-3):213-22.
186
76. Dulermo T, Nicaud J-M. Involvement of the G3P shuttle and β-oxidation pathway
in the control of TAG synthesis and lipid accumulation in Yarrowia lipolytica. Metabolic
Engineering. 2011;13(5):482-91.
77. Nevoigt E, Kohnke J, Fischer CR, Alper H, Stahl U, Stephanopoulos G.
Engineering of promoter replacement cassettes for fine-tuning of gene expression in
Saccharomyces cerevisiae. Applied and Environmental Microbiology. 2006;72(8):5266-
73.
78. Pfleger BF, Pitera DJ, D Smolke C, Keasling JD. Combinatorial engineering of
intergenic regions in operons tunes expression of multiple genes. Nature Biotechnology.
2006;24(8):1027-32.
79. Deboer HA, Comstock LJ, Vasser M. The Tac Promoter - a Functional Hybrid
Derived from the Trp and Lac Promoters. P Natl Acad Sci-Biol. 1983;80(1):21-5.
80. Rosenberg S, Tekamp-olson P, inventors; Chiron Corporation (Emeryville, CA),
assignee. Enhanced yeast transcription employing hybrid GAPDH promoter region
constructs. United States. 1992.
81. Mukai H, Horii H, Tsujikawa M, Kawabe H, Arimura H, Suyama T, inventors;
GREEN CROSS CORPORATION (3-3, Imabashi 1-chome Chuo-ku, Osaka-shi, Osaka,
JP), assignee. Yeast promoter and process for preparing heterologous protein. Europe.
1992.
82. Madzak C, Treton B, Blanchin-Roland S. Strong hybrid promoters and integrative
expression/secretion vectors for quasi-constitutive expression of heterologous proteins in
the yeast Yarrowia lipolytica. J Mol Microb Biotech. 2000;2(2):207-16.
83. Madzak C, Blanchin-Roland S, Otero RRC, Gaillardin C. Functional analysis of
upstream regulating regions from the Yarrowia lipolytica XPR2 promoter. Microbiol-Uk.
1999;145:75-87.
84. Blanchinroland S, Otero RRC, Gaillardin C. 2 Upstream Activation Sequences
Control the Expression of the Xpr2 Gene in the Yeast Yarrowia-Lipolytica. Molecular
and Cellular Biology. 1994;14(1):327-38.
85. Yamane T, Sakai H, Nagahama K, Ogawa T, Matsuoka M. Dissection of
centromeric DNA from yeast Yarrowia lipolytica and identification of protein-binding
site required for plasmid transmission. J Biosci Bioeng. 2008;105(6):571-8.
86. Gasmi N, Fudalej F, Kallel H, Nicaud J-M. A molecular approach to optimize
hIFN α2b expression and secretion in Yarrowia lipolytica. Appl Microbiol Biotechnol.
2011;89(1):109-19.
87. Haas J, Park EC, Seed B. Codon usage limitation in the expression of HIV-1
envelope glycoprotein. Current Biology. 1996;6(3):315-24.
88. Nicaud JM, Fabre E, Becherich JM, Fournier P, Gaillardin C. Cloning,
sequencing and amplification of the alkaline extracellular protease (XPR2) gene of the
yeast Yarrowia lipolytica. Journal of Biotechnology. 1989;12(3-4):285-97.
89. Damude HGH, DE, US), Gillies, Peter John (Landenberg, PA, US), Macool,
Daniel Joseph (Philadelphia, PA, US), Picataggio, Stephen K. (Landenberg, PA, US),
Pollak, Dana Walters M. (Media, PA, US), Ragghianti, James John (Bear, DE, US), Xue,
Zhixiong (Chadds Ford, PA, US), Yadav, Narendra S. (Chadds Ford, PA, US), Zhang,
187
Hongxiang (Chadds Ford, PA, US), Zhu, Quinn Qun (West Chester, PA, US), inventor
High eicosapentaenoic acid producing strains of Yarrowia lipolytica. United States. 2006.
90. Sumita T, Iida T, Yamagami S, Horiuchi H, Takagi M, Ohta A. YlALK1
encoding the cytochrome P450ALK1 in Yarrowia lipolytica is transcriptionally induced
by n-alkane through two distinct cis-elements on its promoter. Biochem Biophys Res
Commun. 2002;294(5):1071-8.
91. Endoh-Yamagami S, Hirakawa K, Morioka D, Fukuda R, Ohta A. Basic helix-
loop-helix transcription factor heterocomplex of Yas1p and Yas2p regulates cytochrome
P450 expression in response to alkanes in the yeast Yarrowia lipolytica. Eukaryotic Cell.
2007;6(4):734-43.
92. Yamagami S, Morioka D, Fukuda R, Ohta A. A basic helix-loop-helix
transcription factor essential for cytochrome P450 induction in response to alkanes in
yeast Yarrowia lipolytica. Journal of Biological Chemistry. 2004;279(21):22183-9.
93. Miller JH. Experiments in molecular genetics. [Cold Spring Harbor, N.Y.]: Cold
Spring Harbor Laboratory; 1972.
94. Gaillardin C, Ribet AM. LEU2 directed expression of beta-galactosidase activity
and phleomycin resistance in Yarrowia lipolytica. Curr Genet. 1987;11(5):369-75.
95. Young E, Alper H. Synthetic biology: tools to design, build, and optimize cellular
processes. J Biomed Biotechnol. 2010;2010:130781. PMCID: 2817555.
96. Liu L, Reed B, Alper H. From Pathways to Genomes and Beyond: The Metabolic
Engineering Toolbox and Its Place in Biofuels Production. Green. 2011;1(1):81-95.
97. Juretzek T, Wang H, Nicaud JM, Mauersberger S, Barth G. Comparison of
Promoters Suitable for Regulated Overexpression of β-Galactosidase in the Alkane-
Utilizing Yeast Yarroiwa lipolytica. Biotechnol Bioprocess Eng. 2000;5:320-6.
98. Juretzek T, Wang H-J, Nicaud J-M, Mauersberger S, Barth G. Comparison of
promoters suitable for regulated overexpression of β-galactosidase in the alkane-utilizing
yeastYarrowia lipolytica. Biotechnology and Bioprocess Engineering. 2000;5(5):320-6.
99. Le Dall M-T, Nicaud J-M, Gaillardin C. Multiple-copy integration in the yeast
Yarrowia lipolytica. Current Genetics. 1994;26(1):38-44.
100. Ghosh SK, Hajra S, Paek A, Jayaram M. Mechanisms for Chromosome and
Plasmid Segregation. Annual Review of Biochemistry. 2006;75(1):211-41.
101. Chlebowicz-Śledziewska E, Śledziewski AZ. Construction of multicopy yeast
plasmids with regulated centromere function. Gene. 1985;39(1):25-31.
102. Blazeck J, Reed B, Garg R, Gerstner R, Pan A, Agarwala V, et al. Generalizing a
hybrid synthetic promoter approach in Yarrowia lipolytica. Appl Microbiol Biotechnol.
2013;97(7):3037-52.
103. Blazeck J, Liu L, Redden H, Alper H. Tuning Gene Expression in Yarrowia
lipolytica by a Hybrid Promoter Approach. Applied and Environmental Microbiology.
2011;77(22):7905-14.
104. Wittenberg C, Reed SI. Cell cycle-dependent transcription in yeast: promoters,
transcription factors, and transcriptomes. Oncogene. 2005;24(17):2746-55.
105. Spellman PT, Sherlock G, Zhang MQ, Iyer VR, Anders K, Eisen MB, et al.
Comprehensive Identification of Cell Cycle–regulated Genes of the Yeast

188
Saccharomyces cerevisiae by Microarray Hybridization. Molecular Biology of the Cell.
1998;9(12):3273-97.
106. Cho RJ, Campbell MJ, Winzeler EA, Steinmetz L, Conway A, Wodicka L, et al.
A Genome-Wide Transcriptional Analysis of the Mitotic Cell Cycle. Molecular Cell.
1998;2(1):65-73.
107. Moriya H, Shimizu-Yoshida Y, Kitano H. In Vivo Robustness Analysis of Cell
Division Cycle Genes in Saccharomyces cerevisiae. PLoS Genet. 2006;2(7):e111.
108. Zhang FZ, Carothers JM, Keasling JD. Design of a dynamic sensor-regulator
system for production of chemicals and fuels derived from fatty acids. Nature
Biotechnology. 2012;30(4):354-60.
109. Atsumi S, Hanai T, Liao JC. Non-fermentative pathways for synthesis of
branched-chain higher alcohols as biofuels. Nature. 2008;451(7174):86-9.
110. Li Q, Du W, Liu DH. Perspectives of microbial oils for biodiesel production.
Appl Microbiol Biotechnol. 2008;80(5):749-56.
111. Lu XF, Vora H, Khosla C. Overproduction of free fatty acids in E. coli:
Implications for biodiesel production. Metabolic Engineering. 2008;10(6):333-9.
112. Rodolfi L, Zittelli GC, Bassi N, Padovani G, Biondi N, Bonini G, et al.
Microalgae for Oil: Strain Selection, Induction of Lipid Synthesis and Outdoor Mass
Cultivation in a Low-Cost Photobioreactor. Biotechnology and Bioengineering.
2009;102(1):100-12.
113. Alvarez HM, Mayer F, Fabritius D, Steinbuchel A. Formation of intracytoplasmic
lipid inclusions by Rhodococcus opacus strain PD630. Archives of Microbiology.
1996;165(6):377-86.
114. Dellomonaco C, Clomburg JM, Miller EN, Gonzalez R. Engineered reversal of
the beta-oxidation cycle for the synthesis of fuels and chemicals. Nature.
2011;476(7360):355-U131.
115. Makri A, Fakas S, Aggelis G. Metabolic activities of biotechnological interest in
Yarrowia lipolytica grown on glycerol in repeated batch cultures. Bioresource
Technology. 2010;101(7):2351-8.
116. Fontanille P, Kumar V, Christophe G, Nouaille R, Larroche C. Bioconversion of
volatile fatty acids into lipids by the oleaginous yeast Yarrowia lipolytica. Bioresource
Technology. 2012;114:443-9.
117. Blazeck J, Liu L, Knight R, Alper HS. Heterologous production of pentane in the
oleaginous yeast Yarrowia lipolytica. Journal of Biotechnology. 2013;165(3–4):184-94.
118. Barth G, Gaillardin C. Yarrowia lipolytica. In: Wolf K, editor. Nonconventional
Yeasts in Biotechnology: A Handbook: Springer; 1996. p. 313-88.
119. Zhang H, Zhang L, Chen H, Chen Y, Ratledge C, Song Y, et al. Regulatory
properties of malic enzyme in the oleaginous yeast, Yarrowia lipolytica, and its non-
involvement in lipid accumulation. Biotechnology Letters. 2013;35(12):2091-8.
120. Rodríguez-Frómeta RA, Gutiérrez A, Torres-Martínez S, Garre V. Malic enzyme
activity is not the only bottleneck for lipid accumulation in the oleaginous fungus Mucor
circinelloides. Appl Microbiol Biotechnol. 2013;97(7):3063-72.

189
121. Vorapreeda T, Thammarongtham C, Cheevadhanarak S, Laoteng K. Alternative
routes of acetyl-CoA synthesis identified by comparative genomic analysis: involvement
in the lipid production of oleaginous yeast and fungi. Microbiology. 2012;158:217-28.
122. Caspi R, Altman T, Dreher K, Fulcher CA, Subhraveti P, Keseler IM, et al. The
MetaCyc database of metabolic pathways and enzymes and the BioCyc collection of
pathway/genome databases. Nucleic Acids Research. 2012;40(D1):D742-D53.
123. Beopoulos A, Haddouche R, Kabran P, Dulermo T, Chardot T, Nicaud JM.
Identification and characterization of DGA2, an acyltransferase of the DGAT1 acyl-
CoA:diacylglycerol acyltransferase family in the oleaginous yeast Yarrowia lipolytica.
New insights into the storage lipid metabolism of oleaginous yeasts. Appl Microbiol
Biotechnol. 2012;93(4):1523-37.
124. Hong S, Sharpe P, Xue Z, Yadav N, Zhu Q, inventors; E. I. du Pont de Nemours
and Company (Wilmington, DE), assignee. Peroxisome biogenesis factor protein (pex)
disruptions for altering the content of polyunsaturated fatty acids and the total lipid
content in oleaginous eukaryotic organisms. 12/244,950 USA. 2008.
125. Greenspan P, Mayer EP, Fowler SD. Nile red: a selective fluroscent stain for
intracelluluar lipid droplets. Journal of Cell Biology. 1985;100(3):965-73.
126. Ratledge C. Regulation of lipid accumulation in oleaginous micro-organisms.
Biochem Soc Trans. 2002;30:1047-50.
127. Jimenez-Marti E, Zuzuarregui A, Gomar-Alba M, Gutierrez D, Gil C, del Olmo
M. Molecular response of Saccharomyces cerevisiae wine and laboratory strains to high
sugar stress conditions. International Journal of Food Microbiology. 2011;145(1):211-20.
128. Botham PA, Ratledge C. A biochemical explanation for lipid accumulation in
Candida 107 and other oleaginous micro-organisms. Journal of General Microbiology.
1979;114(OCT):361-75.
129. Evans CT, Ratledge C. Biochemical activities during lipid accumulation in
Candida curvata. Lipids. 1983;18(9):630-5.
130. Evans CT, Scragg AH, Ratledge C. A comparative study of citrate efflux from
mitochondria of oleaginous and non-oleaginous yeasts. Eur J Biochem. 1983;130(1):195-
204.
131. Atkinson BM, F.;. Biochemical Engineering and Biotechnology Handbook:
Palgrave Macmillan; 1983.
132. Hammond EG, Johnson LA, Su C, Wang T, White PJ. Soybean Oil. In: Shahidi F,
editor. Bailey’s Industrial Oil and Fat Products. 6 ed: John Wiley & Sons, Inc.; 2005. p.
577-653.
133. Laplante M, Sabatini DM. An Emerging Role of mTOR in Lipid Biosynthesis.
Current Biology. 2009;19(22):R1046-R52.
134. Sancak Y, Peterson TR, Shaul YD, Lindquist RA, Thoreen CC, Bar-Peled L, et al.
The Rag GTPases bind raptor and mediate amino acid signaling to mTORC1. Science.
2008;320(5882):1496-501.
135. Han JM, Jeong SJ, Park MC, Kim G, Kwon NH, Kim HK, et al. Leucyl-tRNA
synthetase is an intracellular leucine sensor for the mTORC1-signaling pathway. Cell.
2012;149(2):410-24.
190
136. Bonfils G, Jaquenoud M, Bontron S, Ostrowicz C, Ungermann C, De Virgilio C.
Leucyl-tRNA synthetase controls TORC1 via the EGO complex. Mol Cell.
2012;46(1):105-10.
137. Keasling JD. Manufacturing Molecules Through Metabolic Engineering. Science.
2010;330(6009):1355-8.
138. Trentacoste EM, Shrestha RP, Smith SR, Glé C, Hartmann AC, Hildebrand M, et
al. Metabolic engineering of lipid catabolism increases microalgal lipid accumulation
without compromising growth. Proceedings of the National Academy of Sciences. 2013.
139. Blazeck J, Hill A, Liu L, Knight R, Miller J, Pan A, et al. Harnessing Yarrowia
lipolytica lipogenesis to create a platform for lipid and biofuel production. Nat Commun.
2014;5.
140. Tapia V E, Anschau A, Coradini AL, T Franco T, Deckmann A. Optimization of
lipid production by the oleaginous yeast Lipomyces starkeyi by random mutagenesis
coupled to cerulenin screening. AMB Express. 2012;2(1):64.
141. Kamisaka Y, Noda N, Tomita N, Kimura K, Kodaki T, Hosaka K. Identification
of Genes Affecting Lipid Content Using Transposon Mutagenesis in Saccharomyces
cerevisiae. Bioscience, Biotechnology, and Biochemistry. 2006;70(3):646-53.
142. Shiwa Y, Fukushima-Tanaka S, Kasahara K, Horiuchi T, Yoshikawa H. Whole-
Genome Profiling of a Novel Mutagenesis Technique Using Proofreading-Deficient
DNA Polymerase delta. Int J Evol Biol. 2012;2012:860797. PMCID: 3364565.
143. Beopoulos A, Verbeke J, Bordes F, Guicherd M, Bressy M, Marty A, et al.
Metabolic engineering for ricinoleic acid production in the oleaginous yeast Yarrowia
lipolytica. Appl Microbiol Biotechnol. 2014;98(1):251-62.
144. Zhang B, Chen H, Li M, Gu Z, Song Y, Ratledge C, et al. Genetic engineering of
Yarrowia lipolytica for enhanced production of trans-10, cis-12 conjugated linoleic acid.
Microbial Cell Factories. 2013;12(1):70.
145. De Pourcq K, Vervecken W, Dewerte I, Valevska A, Van Hecke A, Callewaert N.
Engineering the yeast Yarrowia lipolytica for the production of therapeutic proteins
homogeneously glycosylated with Man8GlcNAc2 and Man5GlcNAc2. Microbial Cell
Factories. 2012;11(1):53.
146. Gasmi N, Ayed A, Nicaud J-M, Kallel H. Design of an efficient medium for
heterologous protein production in Yarrowia lipolytica: case of human interferon alpha
2b. Microbial Cell Factories. 2011;10(1):1-13.
147. Mlíčková K, Roux E, Athenstaedt K, d'Andrea S, Daum G, Chardot T, et al. Lipid
Accumulation, Lipid Body Formation, and Acyl Coenzyme A Oxidases of the Yeast
Yarrowia lipolytica. Applied and Environmental Microbiology. 2004;70(7):3918-24.
148. Ruiz-Herrera J, Sentandreu R. Different effectors of dimorphism in Yarrowia
lipolytica. Archives of Microbiology. 2002;178(6):477-83.
149. Casaregola S, Neuvéglise C, Lépingle A, Bon E, Feynerol C, Artiguenave F, et al.
Genomic Exploration of the Hemiascomycetous Yeasts: 17. Yarrowia lipolytica. FEBS
Letters. 2000;487(1):95-100.
150. Zerbino DR, Birney E. Velvet: Algorithms for de novo short read assembly using
de Bruijn graphs. Genome Research. 2008;18(5):821-9.
191
151. Tritt A, Eisen JA, Facciotti MT, Darling AE. An Integrated Pipeline for de Novo
Assembly of Microbial Genomes. PLoS ONE. 2012;7(9):e42304.
152. Tsai I, Otto T, Berriman M. Improving draft assemblies by iterative mapping and
assembly of short reads to eliminate gaps. Genome Biology. 2010;11(4):R41.
153. Assefa S, Keane TM, Otto TD, Newbold C, Berriman M. ABACAS: algorithm-
based automatic contiguation of assembled sequences. Bioinformatics.
2009;25(15):1968-9.
154. Stanke M, Waack S. Gene prediction with a hidden Markov model and a new
intron submodel. Bioinformatics. 2003;19(suppl 2):ii215-ii25.
155. Conesa A, Götz S, García-Gómez JM, Terol J, Talón M, Robles M. Blast2GO: a
universal tool for annotation, visualization and analysis in functional genomics research.
Bioinformatics. 2005;21(18):3674-6.
156. Li H, Handsaker B, Wysoker A, Fennell T, Ruan J, Homer N, et al. The Sequence
Alignment/Map format and SAMtools. Bioinformatics. 2009;25(16):2078-9.
157. Quinlan AR, Hall IM. BEDTools: a flexible suite of utilities for comparing
genomic features. Bioinformatics. 2010;26(6):841-2.
158. Potts PR. The Yin and Yang of the MMS21–SMC5/6 SUMO ligase complex in
homologous recombination. DNA Repair. 2009;8(4):499-506.
159. Robinson JT, Thorvaldsdottir H, Winckler W, Guttman M, Lander ES, Getz G, et
al. Integrative genomics viewer. Nat Biotech. 2011;29(1):24-6.
160. Gebre S, Connor R, Xia Y, Jawed S, Bush JM, Bard M, et al. Osh6
overexpression extends the lifespan of yeast by increasing vacuole fusion. Cell Cycle.
2012;11(11):2176-88.
161. Ramos F, El Guezzar M, Grenson M, Wiame J-M. Mutations affecting the
enzymes involved in the utilization of 4-aminobutyric acid as nitrogen source by the
yeast Saccharomyces cerevisiae. Eur J Biochem. 1985;149(2):401-4.
162. Bach B, Meudec E, Lepoutre J-P, Rossignol T, Blondin B, Dequin S, et al. New
Insights into γ-Aminobutyric Acid Catabolism: Evidence for γ-Hydroxybutyric Acid and
Polyhydroxybutyrate Synthesis in Saccharomyces cerevisiae. Applied and Environmental
Microbiology. 2009;75(13):4231-9.
163. Roy A, Kucukural A, Zhang Y. I-TASSER: a unified platform for automated
protein structure and function prediction. Nat Protocols. 2010;5(4):725-38.
164. Yuan Z, Yin B, Wei D, Yuan YA. Structural basis for cofactor and substrate
selection by cyanobacterium succinic semialdehyde dehydrogenase. Journal of Structural
Biology. 2013;182(2):125-35.
165. Fong SS, Burgard AP, Herring CD, Knight EM, Blattner FR, Maranas CD, et al.
In silico design and adaptive evolution of Escherichia coli for production of lactic acid.
Biotechnology and Bioengineering. 2005;91(5):643-8.
166. Jiang L-Y, Chen S-G, Zhang Y-Y, Liu J-Z. Metabolic evolution of
Corynebacterium glutamicum for increased production of L-ornithine. BMC
Biotechnology. 2013;13(1):47.
167. Evans CT, Ratledge C. Effect of Nitrogen Source on Lipid Accumulation in
Oleaginous Yeasts. Journal of General Microbiology. 1984;130(7):1693-704.
192
168. Cao J, Barbosa JM, Singh NK, Locy RD. GABA shunt mediates thermotolerance
in Saccharomyces cerevisiae by reducing reactive oxygen production. Yeast.
2013;30(4):129-44.
169. Kamei Y, Tamura T, Yoshida R, Ohta S, Fukusaki E, Mukai Y. GABA
metabolism pathway genes, UGA1 and GAD1, regulate replicative lifespan in
Saccharomyces cerevisiae. Biochemical and Biophysical Research Communications.
2011;407(1):185-90.
170. Fendt S-M, Bell EL, Keibler MA, Olenchock BA, Mayers JR, Wasylenko TM, et
al. Reductive glutamine metabolism is a function of the α-ketoglutarate to citrate ratio in
cells. Nat Commun. 2013;4.
171. Coleman ST, Fang TK, Rovinsky SA, Turano FJ, Moye-Rowley WS. Expression
of a Glutamate Decarboxylase Homologue Is Required for Normal Oxidative Stress
Tolerance in Saccharomyces cerevisiae. Journal of Biological Chemistry.
2001;276(1):244-50.
172. Cardenas ME, Cutler NS, Lorenz MC, Di Como CJ, Heitman J. The TOR
signaling cascade regulates gene expression in response to nutrients. Gene Dev.
1999;13(24):3271-9.
173. Staschke KA, Dey S, Zaborske JM, Palam LR, McClintick JN, Pan T, et al.
Integration of General Amino Acid Control and Target of Rapamycin (TOR) Regulatory
Pathways in Nitrogen Assimilation in Yeast. Journal of Biological Chemistry.
2010;285(22):16893-911.
174. Alper H, Miyaoku K, Stephanopoulos G. Construction of lycopene-overproducing
E. coli strains by combining systematic and combinatorial gene knockout targets. Nat
Biotech. 2005;23(5):612-6.
175. Zhang F, Carothers JM, Keasling JD. Design of a dynamic sensor-regulator
system for production of chemicals and fuels derived from fatty acids. Nat Biotech.
2012;30(4):354-9.
176. Alper H, Stephanopoulos G. Global transcription machinery engineering: a new
approach for improving cellular phenotype. Metab Eng. 2007;9(3):258-67.
177. Alper H, Moxley J, Nevoigt E, Fink GR, Stephanopoulos G. Engineering yeast
transcription machinery for improved ethanol tolerance and production. Science.
2006;314(5805):1565-8.
178. Henry SA, Kohlwein SD, Carman GM. Metabolism and Regulation of
Glycerolipids in the Yeast Saccharomyces cerevisiae. Genetics. 2012;190(2):317-49.
179. Seip J, Jackson R, He H, Zhu Q, Hong S-P. Snf1 Is a Regulator of Lipid
Accumulation in Yarrowia lipolytica. Applied and Environmental Microbiology.
2013;79(23):7360-70.
180. Wang C-W, Lee S-C. The ubiquitin-like (UBX)-domain-containing protein
Ubx2/Ubxd8 regulates lipid droplet homeostasis. Journal of Cell Science.
2012;125(12):2930-9.
181. Wang Z-P, Xu H-M, Wang G-Y, Chi Z, Chi Z-M. Disruption of the MIG1 gene
enhances lipid biosynthesis in the oleaginous yeast Yarrowia lipolytica ACA-DC 50109.
193
Biochimica et Biophysica Acta (BBA) - Molecular and Cell Biology of Lipids.
2013;1831(4):675-82.
182. Kandasamy P, Vemula M, Oh C-S, Chellappa R, Martin CE. Regulation of
Unsaturated Fatty Acid Biosynthesis in Saccharomyces: THE ENDOPLASMIC
RETICULUM MEMBRANE PROTEIN, Mga2p, A TRANSCRIPTION ACTIVATOR
OF THE OLE1 GENE, REGULATES THE STABILITY OF THE OLE1 mRNA
THROUGH EXOSOME-MEDIATED MECHANISMS. Journal of Biological Chemistry.
2004;279(35):36586-92.
183. Hoppe T, Matuschewski K, Rape M, Schlenker S, Ulrich HD, Jentsch S.
Activation of a Membrane-Bound Transcription Factor by Regulated
Ubiquitin/Proteasome-Dependent Processing. Cell. 2000;102(5):577-86.
184. Shi X, Li J, Zou X, Greggain J, Rødkær SV, Færgeman NJ, et al. Regulation of
lipid droplet size and phospholipid composition by stearoyl-CoA desaturase. Journal of
Lipid Research. 2013;54(9):2504-14.
185. Zhang S, Skalsky Y, Garfinkel DJ. MGA2 or SPT23 Is Required for
Transcription of the Δ9 Fatty Acid Desaturase Gene, OLE1, and Nuclear Membrane
Integrity in Saccharomyces cerevisiae. Genetics. 1999;151(2):473-83.
186. Zhang S, Burkett TJ, Yamashita I, Garfinkel DJ. Genetic redundancy between
SPT23 and MGA2: regulators of Ty-induced mutations and Ty1 transcription in
Saccharomyces cerevisiae. Molecular and Cellular Biology. 1997;17(8):4718-29.
187. Jiang Y, Vasconcelles MJ, Wretzel S, Light A, Martin CE, Goldberg MA. MGA2
Is Involved in the Low-Oxygen Response Element-Dependent Hypoxic Induction of
Genes inSaccharomyces cerevisiae. Molecular and Cellular Biology. 2001;21(18):6161-9.
188. Micolonghi C, Ottaviano D, Di Silvio E, Damato G, Heipieper HJ, Bianchi MM.
A dual signalling pathway for the hypoxic expression of lipid genes, dependent on the
glucose sensor Rag4, is revealed by the analysis of the KlMGA2 gene in Kluyveromyces
lactis. Microbiology. 2012;158(Pt 7):1734-44.
189. Kaliszewski P, Szkopińska A, Ferreira T, Świezewska E, Berges T, Zołądek T.
Rsp5p ubiquitin ligase and the transcriptional activators Spt23p and Mga2p are involved
in co-regulation of biosynthesis of end products of the mevalonate pathway and
triacylglycerol in yeast Saccharomyces cerevisiae. Biochimica et Biophysica Acta (BBA)
- Molecular and Cell Biology of Lipids. 2008;1781(10):627-34.
190. Letunic I, Doerks T, Bork P. SMART 7: recent updates to the protein domain
annotation resource. Nucleic Acids Research. 2012;40(D1):D302-D5.
191. Wesolowski-Louvel M, Goffrini P, Ferrero I, Fukuhara H. Glucose transport in
the yeast Kluyveromyces lactis. I. Properties of an inducible low-affinity glucose
transporter gene. Mol Gen Genet. 1992;233(1-2):89-96.
192. Robinson MD, McCarthy DJ, Smyth GK. edgeR: a Bioconductor package for
differential expression analysis of digital gene expression data. Bioinformatics.
2010;26(1):139-40.
193. Castegna A, Scarcia P, Agrimi G, Palmieri L, Rottensteiner H, Spera I, et al.
Identification and Functional Characterization of a Novel Mitochondrial Carrier for
194
Citrate and Oxoglutarate in Saccharomyces cerevisiae. Journal of Biological Chemistry.
2010;285(23):17359-70.
194. Teixeira MC, Monteiro PT, Guerreiro JF, Gonçalves JP, Mira NP, dos Santos SC,
et al. The YEASTRACT database: an upgraded information system for the analysis of
gene and genomic transcription regulation in Saccharomyces cerevisiae. Nucleic Acids
Research. 2014;42(D1):D161-D6.
195. Chellappa R, Kandasamy P, Oh C-S, Jiang Y, Vemula M, Martin CE. The
Membrane Proteins, Spt23p and Mga2p, Play Distinct Roles in the Activation of
Saccharomyces cerevisiae OLE1 Gene Expression: FATTY ACID-MEDIATED
REGULATION OF Mga2p ACTIVITY IS INDEPENDENT OF ITS PROTEOLYTIC
PROCESSING INTO A SOLUBLE TRANSCRIPTION ACTIVATOR. Journal of
Biological Chemistry. 2001;276(47):43548-56.
196. Jeffries TW, Grigoriev IV, Grimwood J, Laplaza JM, Aerts A, Salamov A, et al.
Genome sequence of the lignocellulose-bioconverting and xylose-fermenting yeast Pichia
stipitis. Nat Biotech. 2007;25(3):319-26.
197. Swaney DL, Beltrao P, Starita L, Guo A, Rush J, Fields S, et al. Global analysis
of phosphorylation and ubiquitylation cross-talk in protein degradation. Nat Meth.
2013;10(7):676-82.
198. Piwko W, Jentsch S. Proteasome-mediated protein processing by bidirectional
degradation initiated from an internal site. Nat Struct Mol Biol. 2006;13(8):691-7.
199. Xiao G, Harhaj EW, Sun S-C. NF-κB-Inducing Kinase Regulates the Processing
of NF-κB2 p100. Molecular Cell.7(2):401-9.
200. Zhu Z, Zhang S, Liu H, Shen H, Lin X, Yang F, et al. A multi-omic map of the
lipid-producing yeast Rhodosporidium toruloides. Nat Commun. 2012;3:1112.
201. Paul D, Magbanua Z, Arick M, French T, Bridges SM, Burgess SC, et al. Genome
Sequence of the Oleaginous Yeast Rhodotorula glutinis ATCC 204091. Genome
Announcements. 2014;2(1).
202. Bhattacharya S, Shcherbik N, Vasilescu J, Smith JC, Figeys D, Haines DS.
Identification of Lysines within Membrane-Anchored Mga2p120 that Are Targets of
Rsp5p Ubiquitination and Mediate Mobilization of Tethered Mga2p90. J Mol Biol.
2009;385(3):718-25.
203. Lin L, DeMartino GN, Greene WC. Cotranslational dimerization of the Rel
homology domain of NF‐κB1 generates p50–p105 heterodimers and is required for
effective p50 production2000.
204. Nehlin JO, Carlberg M, Ronne H. Yeast SKO1 gene encodes a bZIP protein that
binds to the CRE motif and acts as a repressor of transcription. Nucleic Acids Research.
1992;20(20):5271-8.
205. Alonso-Monge R, Román E, Arana DM, Prieto D, Urrialde V, Nombela C, et al.
The Sko1 protein represses the yeast-to-hypha transition and regulates the oxidative
stress response in Candida albicans. Fungal Genetics and Biology. 2010;47(7):587-601.
206. Boer VM, Daran J-M, Almering MJH, de Winde JH, Pronk JT. Contribution of
the Saccharomyces cerevisiae transcriptional regulator Leu3p to physiology and gene
195
expression in nitrogen- and carbon-limited chemostat cultures. FEMS Yeast Research.
2005;5(10):885-97.
207. Slattery MG, Liko D, Heideman W. The Function and Properties of the Azf1
Transcriptional Regulator Change with Growth Conditions in Saccharomyces cerevisiae.
Eukaryotic Cell. 2006;5(2):313-20.
208. Nguyen LN, Nosanchuk JD. Lipid droplet formation protects against
gluco/lipotoxicity in Candida parapsilosis: An essential role of fatty acid desaturase Ole1.
Cell Cycle. 2011;10(18):3159-67.
209. Listenberger LL, Han X, Lewis SE, Cases S, Farese RV, Ory DS, et al.
Triglyceride accumulation protects against fatty acid-induced lipotoxicity. Proceedings of
the National Academy of Sciences. 2003;100(6):3077-82.
210. Subramaniam R, Dufreche S, Zappi M, Bajpai R. Microbial lipids from renewable
resources: production and characterization. Journal of Industrial Microbiology &
Biotechnology. 2010;37(12):1271-87.
211. Lin J, Li S, Sun M, Zhang C, Yang W, Zhang Z, et al. Microbial lipid production
by oleaginous yeast in d-xylose solution using a two-stage culture mode. RSC Advances.
2014;4(66):34944-9.
212. Klose J, Kronstad JW. The Multifunctional β-Oxidation Enzyme Is Required for
Full Symptom Development by the Biotrophic Maize Pathogen Ustilago maydis.
Eukaryotic Cell. 2006;5(12):2047-61.
213. Crespo JL, Hall MN. Elucidating TOR Signaling and Rapamycin Action: Lessons
from Saccharomyces cerevisiae. Microbiology and Molecular Biology Reviews.
2002;66(4):579-91.
214. Courchesne WE, Magasanik B. Regulation of nitrogen assimilation in
Saccharomyces cerevisiae: roles of the URE2 and GLN3 genes. Journal of Bacteriology.
1988;170(2):708-13.
215. Xu S, Falvey DA, Brandriss MC. Roles of URE2 and GLN3 in the proline
utilization pathway in Saccharomyces cerevisiae. Molecular and Cellular Biology.
1995;15(4):2321-30.
216. Papini M, Nookaew I, Uhlen M, Nielsen J. Scheffersomyces stipitis: a
comparative systems biology study with the Crabtree positive yeast Saccharomyces
cerevisiae. Microbial Cell Factories. 2012;11(1):136.
217. Lee S-M, Jellison T, Alper HS. Directed Evolution of Xylose Isomerase for
Improved Xylose Catabolism and Fermentation in the Yeast Saccharomyces cerevisiae.
Applied and Environmental Microbiology. 2012;78(16):5708-16.
218. Franz AK, Danielewicz MA, Wong DM, Anderson LA, Boothe JR. Phenotypic
Screening with Oleaginous Microalgae Reveals Modulators of Lipid Productivity. ACS
Chemical Biology. 2013;8(5):1053-62.
219. Song L, Qin JG, Su S, Xu J, Clarke S, Shan Y. Micronutrient Requirements for
Growth and Hydrocarbon Production in the Oil Producing Green Alga Botryococcus
braunii (Chlorophyta). PLoS ONE. 2012;7(7):e41459.
220. Zhao X, Kong X, Hua Y, Feng B, Zhao Z. Medium optimization for lipid
production through co-fermentation of glucose and xylose by the oleaginous yeast
196
Lipomyces starkeyi. European Journal of Lipid Science and Technology.
2008;110(5):405-12.
221. Galvagno MA, Iannone LJ, Bianchi J, Kronberg F, Rost E, Carstens MR, et al.
Optimization of biomass production of a mutant of Yarrowia lipolytica with an increased
lipase activity using raw glycerol. Revista argentina de microbiología. 2011;43:218-25.
222. Tomaszewska L, Rymowicz W, Rywińska A. Mineral Supplementation Increases
Erythrose Reductase Activity in Erythritol Biosynthesis from Glycerol by Yarrowia
lipolytica. Appl Biochem Biotechnol. 2014;172(6):3069-78.
223. Sambrook J, Russell DW. Molecular cloning : a laboratory manual. 3rd ed. Cold
Spring Harbor, N.Y.: Cold Spring Harbor Laboratory Press; 2001.
224. Folch J, Lees M, Stanley GHS. A simple method for the isolation and purification
of total lipids from animal tissues. Journal of Biological Chemistry. 1957;226(1):497-509.
225. Schneiter R, Daum G. Extraction of Yeast Lipids. In: Xiao W, editor. Yeast
Protocol: Humana Press; 2006. p. 41-5.
226. Puigbo P, Bravo IG, Garcia-Vallve S. CAIcal: A combined set of tools to assess
codon usage adaptation. Biology Direct. 2008;3.
227. Nakamura Y, Gojobori T, Ikemura T. Codon usage tabulated from international
DNA sequence databases: status for the year 2000. Nucleic Acids Research.
2000;28(1):292-.
228. Mumberg D, Muller R, Funk M. Yeast vectors for the controlled expression of
heterologous proteins in different genetic backgrounds. Gene. 1995;156(1):119-22.
229. Sheff MA, Thorn KS. Optimized cassettes for fluorescent protein tagging in
Saccharomyces cerevisiae. Yeast. 2004;21(8):661-70.
230. Kalnins A, Otto K, Ruther U, Muller-Hill B. Sequence of the lacZ gene of
Escherichia coli. EMBO J. 1983;2(4):593-7. PMCID: 555066.
231. Schneiter R, Daum G. Extraction of yeast lipids. Methods in Molecular Biology.
2006;313:41-5.
232. Liu B, Zhao Z. Biodiesel production by direct methanolysis of oleaginous
microbial biomass. Journal of Chemical Technology and Biotechnology. 2007;82(8):775-
80.
233. Gaillardin C, Ribet AM, Heslot H. Integrative transformation of the yeast
Yarrowia lipolytica. Current Genetics. 1985;10(1):49-58.
234. Winston F. EMS and UV Mutagenesis in Yeast. Current Protocols in Molecular
Biology: John Wiley & Sons, Inc.; 2001.
235. Papanikolaou S, Chatzifragkou A, Fakas S, Galiotou-Panayotou M, Komaitis M,
Nicaud J-M, et al. Biosynthesis of lipids and organic acids by Yarrowia lipolytica strains
cultivated on glucose. European Journal of Lipid Science and Technology.
2009;111(12):1221-32.
236. Li H, Durbin R. Fast and accurate short read alignment with Burrows–Wheeler
transform. Bioinformatics. 2009;25(14):1754-60.
237. Pablo C, Viral MP, Melissa C, Tung N, Susan JL, Douglas MR, et al. Using
Drosophila melanogaster as a Model for Genotoxic Chemical Mutational Studies with a
New Program, SnpSift. Frontiers in Genetics. 2012;3.
197
238. Liu Q, Guo Y, Li J, Long J, Zhang B, Shyr Y. Steps to ensure accuracy in
genotype and SNP calling from Illumina sequencing data. BMC Genomics.
2012;13(Suppl 8):S8.
239. Andrews S. FastQC a quality-control tool for high-throughput sequence data.
http://wwwbioinformaticsbabrahamacuk/projects/fastqc/.
240. Trapnell C, Roberts A, Goff L, Pertea G, Kim D, Kelley DR, et al. Differential
gene and transcript expression analysis of RNA-seq experiments with TopHat and
Cufflinks. Nat Protocols. 2012;7(3):562-78.
241. Huang DW, Sherman BT, Lempicki RA. Systematic and integrative analysis of
large gene lists using DAVID bioinformatics resources. Nat Protocols. 2008;4(1):44-57.
242. Liu L, Alper HS. Draft Genome Sequence of the Oleaginous Yeast Yarrowia
lipolytica PO1f, a Commonly Used Metabolic Engineering Host. Genome
Announcements. 2014;2(4).
243. Carlson JM, Chakravarty A, DeZiel CE, Gross RH. SCOPE: a web server for
practical de novo motif discovery. Nucleic Acids Research. 2007;35(suppl 2):W259-W64.