Embed Size (px)
Citation preview

Copyright
by
Mehnaaz Fatima Ali
2006

The Dissertation Committee for Mehnaaz Fatima Ali Certifies that this is the
approved version of the following dissertation:
The Development of a Microbead Array for the Detection and
Amplification of Nucleic Acids
Committee:
John T. McDevitt, Supervisor
Karen S. Browning
Jason B. Shear
Eric V. Anslyn
Shaochen Chen

The Development of a Microbead Array for the Detection and
Amplification of Nucleic Acids
by
Mehnaaz Fatima Ali, B.S.
Dissertation
Presented to the Faculty of the Graduate School of
The University of Texas at Austin
in Partial Fulfillment
of the Requirements
for the Degree of
Doctor of Philosophy
The University of Texas at Austin
December, 2006

Dedication
To Ama and Bawa for giving me wings.

v
Acknowledgements
This inimitable journey has only been possible due to the numerous
individuals who have either directly or indirectly bolstered and guided my every
step. First and foremost, I would like to extend my profound gratitude, admiration
and respect for my advisor, Professor John T. McDevitt. From the get go, John
has championed my every effort and has lent a steady reassurance to all of my
endeavors successful and not so successful alike. For this and for numerous life
lessons I am eternally indebted to him. In this vein, I would like to acknowledge
and extend my gratitude towards Professors Eric V. Anslyn, Jason B. Shear and
Dean P. Neikirk, the co-creators of the project that has extended into my
dissertation work. Furthermore, my sincere thanks are also extended to Dr. Gisela
Kramer and Professor Karen Browning for always being fantastically helpful and
insightful with all of my queries and endeavors. To Dr. Shifeng Li and David
Fozdar from the laboratories of Professor Shaochen Chen for collaborative efforts
resulting in the amplification experiments detailed in Chapter 5. Dr. Li and David,
were responsible for the fabrication and thermal and fluid flow modelling aspects
of the project. Dr. Romy Kirby from the laboratories of Professor Andrew
Ellington for collaborative efforts with initial discrimination studies leading upto

vi
specifics detailed in Chapter 2. Professor Jennifer S. Brodbelt, Penny Kile and
Kimberly Terry for all things official and giving graduate school a familial feel.
These years in graduate school have accelerated my growth not just as a
scientist, but also to the individual that I am today. For both of these intertwined
and sometimes parallel paths I have to thank a number of persons.
The individuals of the McDevitt lab of both afore and now that I have
crossed paths with . In particular, Drs. Adrian Goodey, Pierre Floriano and
Dwight Romanovicz, for uncountable and immeasurable acts of guidance and
friendship. Jorge Wong and Dr. Nic Christodoulides for numerous discussions
and for exemplar collaborative opportunities. Andrew S. Tsao for the flow cell
that kept on giving as well as my eternal gratitude for providing me a step-stool to
glimpse the world with. My fellow graduate students Shannon Weigum, Jesse
Jokerst, Alexis Lennart, Michael Griffin and Amanda Gerlach for helping to
create an environment made up of friends in addition to colleagues.
I would also like to thank a few key people who have helped retain my
sanity through these years as well as helped make graduate school a truly
memorable experience: Patricia Melfi, Drs. Mitra Mohanty, Ioana Pavel, Nicola
Edwards, David Sanchez and Sungwook Kim. As importantly Kathryn E. Boul
and Linh T. Tran who keep me real. This would not be a complete and honest list
without the mention of Janan Jayawickramarajah who knows me as I am and
more importantly likes me as I am.
Finally and most importantly I would like to thank my darling parents and
my baby brother Sarfaraz, without whom, all else would truly be meaningless.

vii
The Development of a Microbead Array for the Detection and
Amplification of Nucleic Acids
Publication No._____________
Mehnaaz Fatima Ali, Ph.D.
The University of Texas at Austin, 2006
Supervisor: John T. McDevitt
The focus of this doctoral thesis is on the development of a chip-based
sensor array, composed of individually addressable agarose micro-beads, that is
suitable for the real-time detection of DNA oligonucleotides. This research is
consistent with recent trends in disease diagnostics following the miniaturization
and integration of sample preparation and measurement steps towards portable
devices capable of point of care analysis. Thus, the power and utility of this
microbead array methodology for DNA detection is demonstrated here for the
analysis of fluids containing a variety of similar short oligonucleotides.
Hybridization times on the order of minutes with point mutation selectivity
factors greater than 10,000 and limit of detection values of ~10-13 M are obtained
readily with this microbead array system. These analytical characteristics, here

viii
exhibited are competitive with some of the best direct DNA detection
methodologies before reported.
As an extension of this work, an integrated self quenching based sensing
system within the bead format has shown clear efficacy for the detection of HIV
gag isolates and Bacillus anthracis (Sterne) purified strains and allows for the
rapid detection of 100bp sequences with sensitivities in the subnanomolar range.
Additionally, due to the tailored immobilization of specific sequences on each
sensor element, the multiplexed detection of various sequences utilizing diverse
strategies has been demonstrated. Use of the micro-bead array in tandem with
the hybridization capabilities of molecular beacons, constitutes a powerful tool
for the heterogeneous elucidation of specific sequences.
Concomitantly, successful collaboration with the Chen group on the
development of a miniaturized enzyme based nucleic acid amplification device
has been reported. Purified strains of Bacillus anthracis (Sterne) have been
successfully amplified by the miniaturized polymerase chain reaction (PCR) chip
as seen by gel electrophoresis. One of the long term aims of this general area of
research will be to couple the glass micro chip-based PCR amplification of
oligonucleotides with the real-time detection capabilities of a bead based array.
These efforts serve to establish some precedent for the bead-based microfluidics
approach to be implemented in the context of genomics testing for the next
generation of health care.

ix
Table of Contents
List of Tables........................................................................................................ xiv
List of Figures ....................................................................................................... xv
List of Figures ....................................................................................................... xv
Chapter 1: Approaches for the Detection of Nucleic Acids within Microarray Formats........................................................................................................... 1 1.1 Overview .................................................................................................. 1 1.2 Single Nucleotide Polymorphisms (SNPs) and Haplotype Blocks.......... 2 1.3 Traditional Methods ................................................................................. 3 1.4 Two-Dimensional Arrays......................................................................... 4
1.4.1 Microarrays .................................................................................. 5 1.5 Three-Dimensional Arrays....................................................................... 7
1.5.1 Polymer Bead Based Sensors ....................................................... 7 1.5.2 Gel Pads........................................................................................ 8
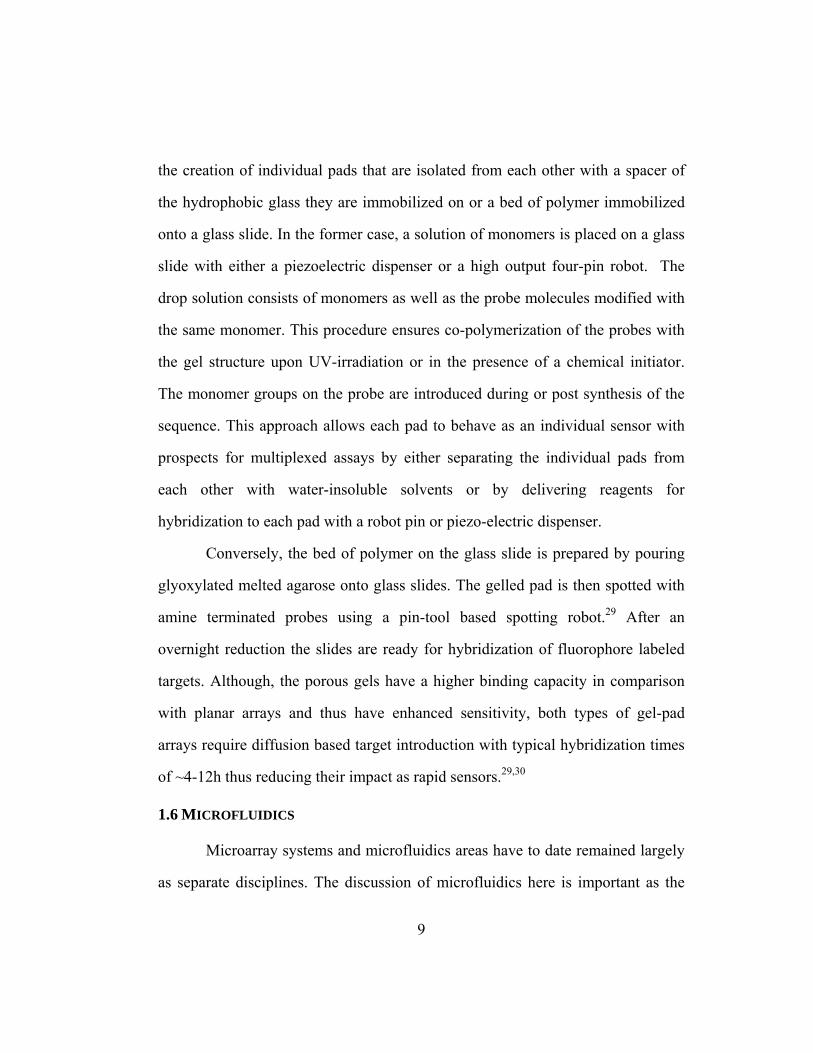
1.6 Microfluidics ............................................................................................ 9 1.7 Summary and Dissertation Overview .................................................... 11
Chapter 2: DNA Hybridization and Discrimination of Single- Nucleotide Mismatches Using Chip-Based Microbead Arrays...................................... 17 2.1 Introduction ............................................................................................ 17 2.2 Experimental Section ............................................................................. 21
2.2.1 Instrumentation and Analysis Protocols..................................... 21 2.2.2 Reagents ..................................................................................... 22 2.2.3 DNA Functionalization .............................................................. 23 2.2.4 Discrimination Studies ............................................................... 23 2.2.5 Reproducibility Studies .............................................................. 24 2.2.6 Microbead Array Sensitivity Studies ......................................... 25
2.3 Results and Discussion........................................................................... 25

x
2.3.1 Platform Description .................................................................. 25 2.3.2 Capture and Target Sequence Specifics ..................................... 28 2.3.3 Discrimination Analysis............................................................. 29 2.3.4 Regeneration and Recirculation Capabilities ............................. 36 2.3.5 Three Dimensionality of Bead Microreactors ............................ 39 2.3.6 Assay Sensitivity ........................................................................ 42 2.3.7 Variance Associated with the Discrimination Index.................. 44
2.4 Summary and Conclusions..................................................................... 46
Chapter 3: Elucidation of Molecular Interactions within the Microbead Matrix.. 48 3.1 Introduction ............................................................................................ 48 3.2 Experimental Section ............................................................................. 50
3.2.1 Reagents ..................................................................................... 50 3.2.2 DNA Functionalization .............................................................. 50 3.2.3 Instrumentation and Analysis Protocols..................................... 51 3.2.4 Effects of Si-Chip Coating on Linearity of Signal Acquisition . 52 3.2.5 Optimization of Avidin Immobilization Procedure ................... 52 3.2.6 Investigate Immobilization Conditions within Polymer
Microsphere................................................................................ 53 3.2.7 Patterns of Signal Acquisition.................................................... 53 3.2.8 Effects of Porosity on Radial Penetration .................................. 54
3.3 Results and Discussion........................................................................... 56 3.3.1 Effects of Si-Chip Coating on Linearity of Signal Acquisition . 59 3.3.2 Optimization of Avidin Immobilization Procedure ................... 62 3.3.3 Investigate Immobilization Conditions within Polymer
Microsphere................................................................................ 64 3.3.3.1 Internal Optical Inefficiencies within Polymer Bead..... 64 3.3.3.2Elucidating Ring Formation within Polymer
Microsphere....................................................................... 65 3.3.3.3 Probe Concentration Dependant Effects on Immobilization... 66 3.3.4 Patterns of Signal Acquisition.................................................... 68

xi
3.3.4.2 Depleting Conditions...................................................... 71 3.3.4.1 High Concentration ........................................................ 73
3.3.5 Effects of Length of Probe and Probe Density on Sequestration .............................................................................. 75 3.3.5.1 High Immobilized Probe Density................................... 77 3.3.5.2 Low Immobilized Probe Density ................................... 82
3.3.6 Effects of Porosity on Radial Penetration .................................. 85 3.3.6.1 Signal versus Time of Sequestration within Microporous
Particle........................................................................................ 86 3.3.6.2 Radial Sequestration for Multiple Polymer Densities.... 88 3.3.6.3 Rates of Diffusion in Heterogeneous Polymer
Matrices............................................................................. 89 3.4 Summary and Conclusions..................................................................... 91
Chapter 4: Molecular Beacon Encoded Beads in Tandem with an Integrated Fluidics System ............................................................................................ 92 4.1 Introduction ............................................................................................ 92 4.2 Experimental Section ............................................................................. 96
4.2.1 Reagents ..................................................................................... 96 4.2.2 DNA Functionalization .............................................................. 97 4.2.3 Instrumentation and Analysis Protocols..................................... 98 4.2.4 Signal to Background Studies .................................................... 99 4.2.5 Discrimination Studies ............................................................. 101 4.2.6 Regeneration............................................................................. 101 4.2.7 Bacillus anthracis Hairpin Loop .............................................. 101 4.2.8 Multiplexing ............................................................................. 102
4.3 Results and Discussion......................................................................... 103 4.3.1 Microbead Platform in Tandem with Molecular Beacons ....... 103 4.3.2 Optimization of Signal to Background..................................... 106
4.3.2.1 Signal to Background dependence on MgCl2 [M] ....... 106 4.3.2.2 Effects of Immobilized Hairpin Density on S/B .......... 108

xii
4.3.3 Various Immobilization Strategies........................................... 109 4.3.3.1 Stem versus Loop Immobilization ............................... 109 4.3.3.2 Target Length on Binding Profiles and S/B ................. 111 4.3.3.3 Immobilization Strategies ............................................ 115
4.3.4 Mismatch Discrimination......................................................... 118 4.3.5 Sensor Regeneration................................................................. 123 4.3.6 Design of Molecular Beacon.................................................... 124
4.3.6.1 Stem Binding Target for Bacillus anthracis ................. 126 4.3.6.2 LOD of 90bp 16S rRNA Bacillus anthracis Specific
Sequence.......................................................................... 129 4.3.9 Multiplexed Detection of Bacillus anthracis and HIV gag
isolates...................................................................................... 131 4.4 Summary and Conclusions................................................................... 133
Chapter 5: µ-Channel PCR Chip Based Amplification and Microbead Array Detection .................................................................................................... 135 5.1 Introduction .......................................................................................... 135 5.2 Experimental Details and Discussion.................................................. 138
5.2.1 Design Features/Fabrication of the Continuous-Flow PCR Microdevice.............................................................................. 138 5.2.1.1 Microchip Material Selection....................................... 139 5.2.1.2 Serpentine Microchannel Geometry and Heater
Assembly Spacings ......................................................... 139 5.2.1.3 Microchip / Heating Assembly Fabrication ................. 141
5.2.2 Thermal / Fluid Analysis of the PCR Microdevice.................. 144 5.2.2.1 Thermal Finite Element Analysis (FEA) ..................... 145 5.2.2.2 Infrared (IR) Surface Temperature Measurements ...... 148 5.2.2.3 Flow Simulation within the Serpentine Microchannel. 150
5.2.3 PCR Amplification Experiments.............................................. 153 5.2.4 Detection of Amplified Product ............................................... 155
5.2.4.1 Magnetic Separation of Amplified Sequence............... 157

xiii
5.3 Summary and Conclusions................................................................... 160
References ........................................................................................................... 162
Vita 176
xiv
List of Tables
Table 2.1: Data for plot of discrimination index as a function of time of buffer
rinse. ................................................................................................. 44
Table 3.1: Short sequences for length dependent studies (5’ 3’) ...................... 77
Table 3.2: Melting Temperature (°C) values for hybridized pairs of Probe
sequences (P 10, 20, 50) and Target sequences (T 10, 21, 50) ........ 79
Table 4.1: Stem-Loop structures and target sequences (5’ 3’) ......................... 97
Table 4.2: Mismatched sequences for discrimination studies (5’ 3’)............. 119
xv
List of Figures
Figure 1.1: Schematic for key qualities necessary to complete a successful
nucleic acid sensor. .......................................................................... 13
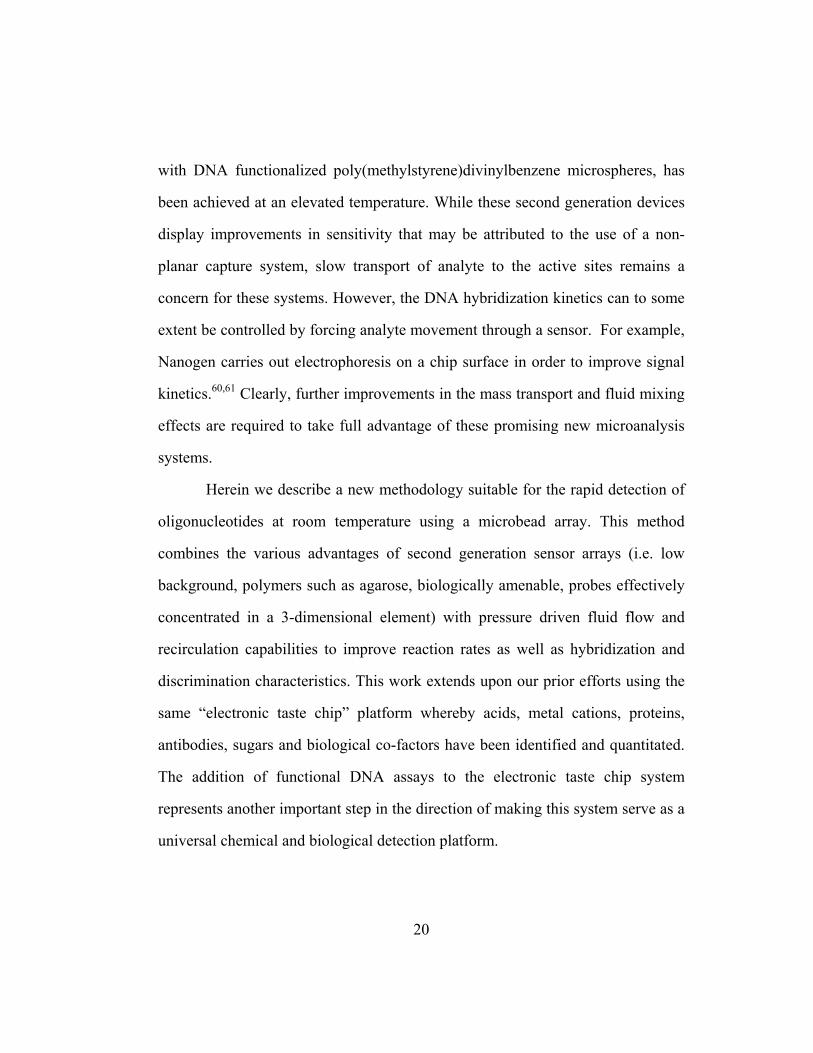
Figure 2.1: (A) A scanning electron micrograph shows multiple well pits
etched within a silicon wafer. These pyramidal wells, which
extend through the wafer, are used to confine the sensor beads in
a central position. (B) Schematic illustration showing an avidin
coated agarose bead bound to a biotinylated DNA capture strand;
the fluorophore conjugated DNA target is a complement to the
capture strand. (C) The sequences used in the array are arranged
in the 5’ – 3’ direction going from left to right. The DNA-capture
strands are modified with a 5’ biotin and the DNA-target strands
are modified with a 5’fluorophore as described in the text.............. 27

xvi
Figure 2.2: Fluorescence images of DNA-capture beads (R, B, G) (shown at
the bottom of each panel) incubated sequentially with Targets-
R’, G’ and B’ (shown at the top of the panels). The three
horizontal panels of images show identical arrays that have been
viewed with three different filter cubes specific to each
fluorophore conjugated target. An avidin coated bead (A) was
included in the array to serve as a negative control. The three
vertical panels show discrimination of one and two base pair
sequences along with demonstrating behavior for complement
hybridization with the three different fluorophore-conjugated
targets. Three different time periods recorded after sample
introduction during the wash sequence are provided: t(0), t(1)
and t(2). At t(0), the indicated target is incubating with the array
consisting of the four columns of microspheres. Progressive
rinsing shown at t(1) rapidly diminishes both the background
fluid contributions as well as the non-specific signals associated
with non-complementary interactions within the microspheres.
At the end of the rinse phase shown at t(2), only complements
remain hybridized at their respective DNA capture beads............... 31

xvii
Figure 2.3: (A) Fluorescence intensity curves recorded as a function of time
during buffer rinse for reaction of Target-G’ with all three DNA-
capture sequences: (i) hybridization to the complement DNA-
cap-G, (ii) discrimination from the C:C one base pair mismatch
sequence DNA-cap-B, and (iii) discrimination from the G:G and
C:C two base pair mismatch sequence DNA-cap-R. (B) Signal
intensity curves recorded as a function of time during buffer
rinse following the reaction of Target-B’ with all three DNA-
capture sequences: (i) hybridization to the complement DNA-
cap-B, (ii) discrimination from the highly stable G:G one base
pair mismatch sequence DNA-cap-G, (iii) discrimination from
the less stable G:G one base pair mismatch sequence DNA-cap-
R. The buffer rinses were carried out using a flow rate of 2.5
mL/min with the high stringency solution. ...................................... 35

xviii
Figure 2.4: (A) Real-time hybridization data recorded during the recirculation
of Target-G’ followed by the regeneration of the same microbead
array. Fluorescence images were taken every 5 s using a CCD
exposure time of 69.9 ms and gain 16. (B) Schematic for
recirculation fluidics and sample delivery system is provided.
Depending on the selection of valve settings (V) 1, 2 or 3, fluids
can be directed through the manifold (M) using the pump (P) and
onto inlet (I). When unidirectional flow is selected, the outgoing
fluid will travel via the T-connector (iii) and follow path O1 to
waste. However, if the system is selected for the recirculation
mode then outgoing fluid will follow path O2 depositing it back
into the initial sample container. Likewise, the fluid components
associated with O2 can be used to direct fluid flow to either
containers (i) or (ii), thus, enabling the recirculation of various
samples selectively. .......................................................................... 38
xix
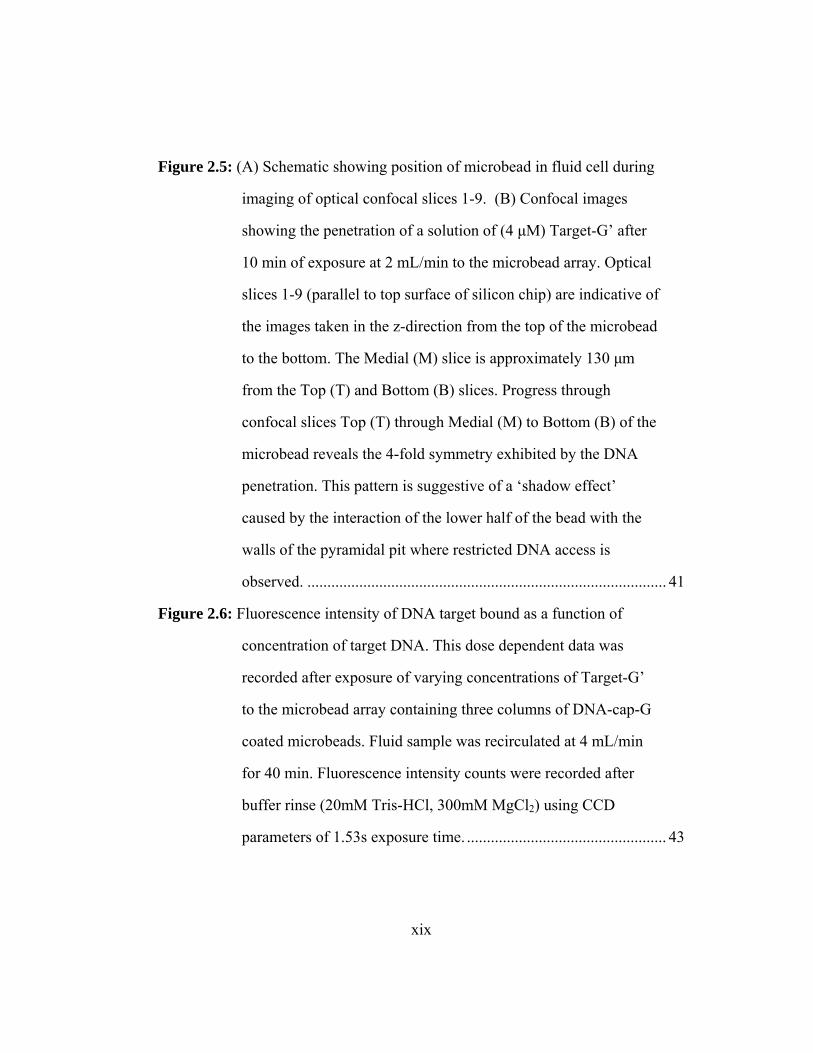
Figure 2.5: (A) Schematic showing position of microbead in fluid cell during
imaging of optical confocal slices 1-9. (B) Confocal images
showing the penetration of a solution of (4 µM) Target-G’ after
10 min of exposure at 2 mL/min to the microbead array. Optical
slices 1-9 (parallel to top surface of silicon chip) are indicative of
the images taken in the z-direction from the top of the microbead
to the bottom. The Medial (M) slice is approximately 130 µm
from the Top (T) and Bottom (B) slices. Progress through
confocal slices Top (T) through Medial (M) to Bottom (B) of the
microbead reveals the 4-fold symmetry exhibited by the DNA
penetration. This pattern is suggestive of a ‘shadow effect’
caused by the interaction of the lower half of the bead with the
walls of the pyramidal pit where restricted DNA access is
observed. .......................................................................................... 41
Figure 2.6: Fluorescence intensity of DNA target bound as a function of
concentration of target DNA. This dose dependent data was
recorded after exposure of varying concentrations of Target-G’
to the microbead array containing three columns of DNA-cap-G
coated microbeads. Fluid sample was recirculated at 4 mL/min
for 40 min. Fluorescence intensity counts were recorded after
buffer rinse (20mM Tris-HCl, 300mM MgCl2) using CCD
parameters of 1.53s exposure time. .................................................. 43

xx
Figure 2.7: The discrimination index is plotted as a function of time
following the start of the rinse phase. This discrimination index
is obtained using the raw fluorescence intensity values for the
specific signal associated with Target-G’and DNA-cap-G to the
non specific background signal associated between Target-G’
and DNA-cap-B. The discrimination index represents the ratio of
signal recorded for the specific signal versus the non-specific
signal. With the progression of the wash step the ratio of specific
signal to background and the associated variance increases
exponentially. ................................................................................... 45

xxi
Fgure 3.1: (A) A scanning electron microscope image of etched pyramidal
wells within the silicon chip. The well openings allow for the
localization of the micro-spherical sensor elements. (B) A
schematic depicting the components of the fluid delivery module.
The PMMA disks consist of chemically inert high pressure
tubing (PEEK) fitted within machined channels. The channels
extend through the depth of the disks to exit in the x-y plane of
the silicon wafer. Thus fluid is delivered via the PEEK tubing of
the top PMMA insert to the sensor array and concomitantly, the
fluid exits the sensor array through the tubing contained within
the bottom insert. The two PMMA disks are affixed with a layer
of polyvinyl tape which serve as gaskets and provide structural
support to the silicon wafer. The polyvinyl tapes contain
openings which frame the array, thus allowing for the
transmission of light. (C) Schematic of epi-fluorescent setup for
measurement of fluorescent signal from the microbead. (a)
Monochromatic light source hits the dichroic (b) which filters
light specifically to the excitation wavelength. The excitation
source is directed to the bead situated inside the (d) silicon well.
The emitted light from the bead is reflected back to the dichroic
where any stray light is filtered and the emission wavelength is
sent to the detector(c). The fluorescence from the microsphere is
reflected back from the wall of the silicon well (e) if the wafer is

xxii
not coated with a non-reflective layer of SiN3. (D) Schematic of
Top view of microbead (a) in the silicon well. The excitation and
emission reflections (b) off of the walls of the silicon amplify the
total signal contained within the microsphere.................................. 58
Figure 3.2: Reflectivity effects of Si-wafer on fluorescence signal acquired
with polymer bead. (A) Texas Red conjugated beads within a
reflective (top row of images) and non-reflective (bottom row of
images) chip. The three columns are representative of varied
camera exposure times. (B) Fam6 conjugated beads within a
reflective (top row of images) and non-reflective (bottom row of
images) chip. The three columns are representative of varied
camera exposure times. .................................................................... 61
Figure 3.3: Confocal images of the medial slice of agarose beads after
immobilization of molecular beacon conjugated to FAM-6 (A)
without the addition of Triton-x, (B) with 0.1% Triton-x (C) with
1% Triton-x. ..................................................................................... 63
xxiii
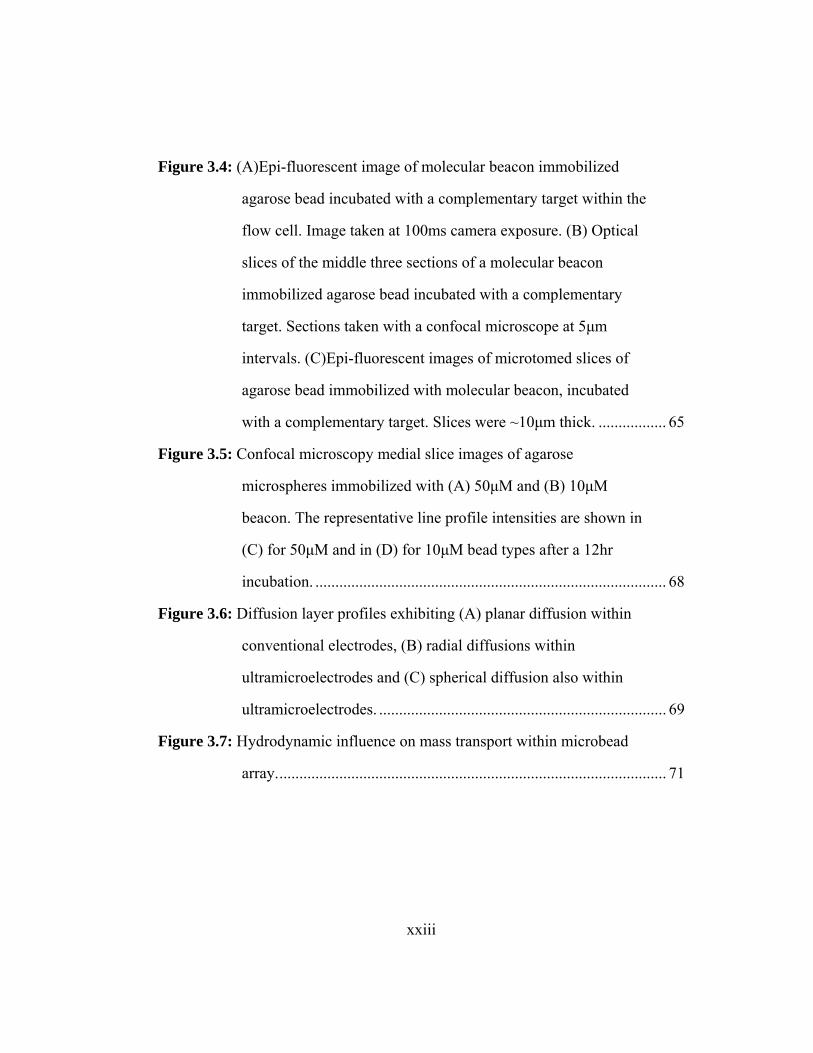
Figure 3.4: (A)Epi-fluorescent image of molecular beacon immobilized
agarose bead incubated with a complementary target within the
flow cell. Image taken at 100ms camera exposure. (B) Optical
slices of the middle three sections of a molecular beacon
immobilized agarose bead incubated with a complementary
target. Sections taken with a confocal microscope at 5µm
intervals. (C)Epi-fluorescent images of microtomed slices of
agarose bead immobilized with molecular beacon, incubated
with a complementary target. Slices were ~10µm thick. ................. 65
Figure 3.5: Confocal microscopy medial slice images of agarose
microspheres immobilized with (A) 50µM and (B) 10µM
beacon. The representative line profile intensities are shown in
(C) for 50µM and in (D) for 10µM bead types after a 12hr
incubation. ........................................................................................ 68
Figure 3.6: Diffusion layer profiles exhibiting (A) planar diffusion within
conventional electrodes, (B) radial diffusions within
ultramicroelectrodes and (C) spherical diffusion also within
ultramicroelectrodes. ........................................................................ 69
Figure 3.7: Hydrodynamic influence on mass transport within microbead
array.................................................................................................. 71

xxiv
Figure 3.8: Diffusion or depletion layers around microsphere for (A) low
analyte concentrations at slow flow rates, (B) low analyte
concentrations at higher flow rates and (C) low analyte
concentrations at fast flow rates as well as high analyte
concentrations................................................................................... 73
Figure 3.9: Diffusion driven mass transport at high analyte concentrations
within bead independent of flow rate. Insert shows extent of
hybridization reached by single flow through as opposed to
recirculation...................................................................................... 75
Figure 3.10: Hybridization profiles versus time for beads immobilized with
high density of probes lengths 10, 20 and 50 base sequences
hybridized with target (A) 10mer, (B) 20mer and (C) 50mer
sequences. The raw images were captured with camera exposure
times of 100ms and analyte delivery rate of 1.5mL/min.................. 81
Figure 3.11: Hybridization profiles versus time for beads immobilized with
low density of probe lengths 10, 20 and 50 base sequences
hybridized with target (A) 10mer, (B) 20mer and (C) 50mer
sequences.......................................................................................... 83
Figure 3.12: Schematic of microsphere immobilized with (A) high and (B)
low probe density. ............................................................................ 84
Figure 3.13: Scanning electron microscopy (SEM) images of (A)
homogeneous and (B) superporous microspheres respectively.
(Images provided by Jorge Wong) ................................................... 86

xxv
Figure 3.14: Kinetic profiles for the sequestration of a 21mer target by the
superporous (SA) and homogeneous (HA) bead type...................... 87
Figure 3.15: Radial sequestration of 21mer target within (A) homogeneous
agarose particle and (B) superporous agarose particle as acquired
by epi-fluorescent microscopy. These images were captured with
a CCD camera exposure time of 100 ms.......................................... 88
Figure 4.1: A schematic of the principle mechanism of molecular beacons.
Stem-stem hybridization ensures hairpin structure and thus self-
quenching of fluorophore. However, upon hybridization of target
to loop region, the beacon undergoes conformational shift that
compels the stem sequences apart and thus allows the emission
of fluorescence. ................................................................................ 93

xxvi
Figure 4.2: (A) A scanning electron microscope image of etched pyramidal
wells within the silicon chip. The well openings allow for the
localization of the micro-spherical sensor elements. (B) Cross-
sectional schematic of the micro-sphere localized within the
etched pyramidal well. The pyramidal cavity extends through the
entire thickness of the silicon wafer, thus facilitating the easy
flow of fluid away from the micro-sphere. Transmission of light
through the optically viable polymer is also available due to the
openings of the truncated pyramidal cavities. (C) A schematic
depicting the components of the fluid delivery module. The
PMMA disks consist of chemically inert high pressure tubing
(PEEK) fitted within machined channels. The channels extend
through the depth of the disks to exit in the x-y plane of the
silicon wafer. Thus fluid is delivered via the PEEK tubing of the
top PMMA insert to the sensor array and concomitantly, the fluid
exits the sensor array through the tubing contained within the
bottom insert. The two PMMA disks are affixed with a layer of
polyvinyl tape which serve as gaskets and provide structural
support to the silicon wafer. The polyvinyl tapes contain
openings which frame the array, thus allowing for the
transmission of light. (D) Diagonal view of a completed flow cell
module complete with inlet and outlet tubing. ............................... 105
xxvii
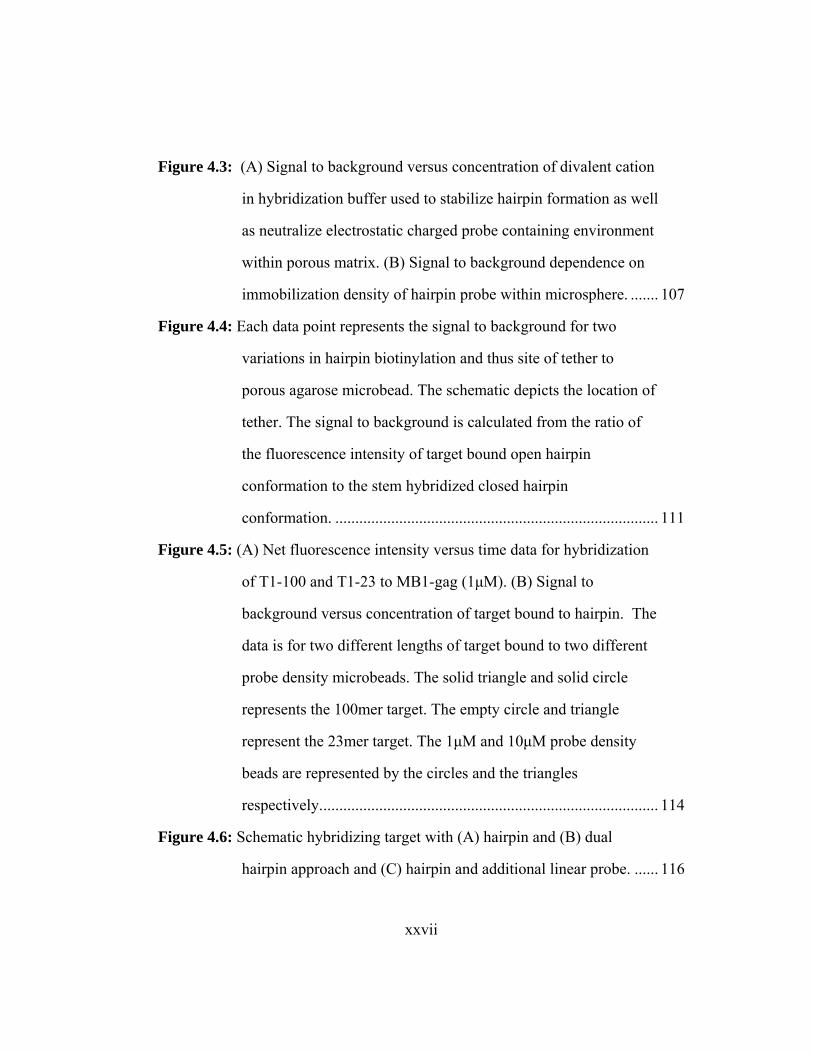
Figure 4.3: (A) Signal to background versus concentration of divalent cation
in hybridization buffer used to stabilize hairpin formation as well
as neutralize electrostatic charged probe containing environment
within porous matrix. (B) Signal to background dependence on
immobilization density of hairpin probe within microsphere. ....... 107
Figure 4.4: Each data point represents the signal to background for two
variations in hairpin biotinylation and thus site of tether to
porous agarose microbead. The schematic depicts the location of
tether. The signal to background is calculated from the ratio of
the fluorescence intensity of target bound open hairpin
conformation to the stem hybridized closed hairpin
conformation. ................................................................................. 111
Figure 4.5: (A) Net fluorescence intensity versus time data for hybridization
of T1-100 and T1-23 to MB1-gag (1µM). (B) Signal to
background versus concentration of target bound to hairpin. The
data is for two different lengths of target bound to two different
probe density microbeads. The solid triangle and solid circle
represents the 100mer target. The empty circle and triangle
represent the 23mer target. The 1µM and 10µM probe density
beads are represented by the circles and the triangles
respectively..................................................................................... 114
Figure 4.6: Schematic hybridizing target with (A) hairpin and (B) dual
hairpin approach and (C) hairpin and additional linear probe. ...... 116

xxviii
Figure 4.7: S/B for the hybridization of 100mer target with various
immobilization strategies within the bead matrix. ......................... 118
Figure 4.8: (A) Signal to background ratios for perfect match (T1-23), 2bp
A:A;A:G mismatches (T1-MM4), 2bp G:T;G:T mismatches (T1-
MM3), 1bp T:T mismatch (T1-MM2) and 1bp A:C mismatch
(T1-MM1) versus the change in respective melting temperature
compared to the perfect complement. (B) Discrimination index
for A:C mismatch yielded by the microbead array shown with
the black bar and by Frutos et al with the striped bar.117 (C)
Topographical maps of the raw fluorescence intensity increase
from the actual microbeads from the array. (D) Line intensity
profiles of beads before (red lines) and after (black lines)
hybridization of the specified sequences. The line intensity
panels follow the same sequence order as the labeled topographs. 122
Figure 4.9: Real-time hybridization data of the recirculation of T1-23 over an
array of MB1-gag beads where the same array was regenerated
over three trials. Fluorescence images were taken every 60s with
a CCD exposure time of 1s. ........................................................... 124
Figure 4.10: (A) Probe density optimization for hairpin MB3-anth conjugated
to Tx-Red. (B) Signal to background differences for identical
hairpin sequence (MB3-anth) conjugated to either FAM-6 or Tx-
Red. ................................................................................................ 127

xxix
Figure 4.11: Fluorescence photomicrographs and corresponding topomaps of
microspheres immobilized with beacon (A) MB1-gag conjugated
to Tx-Red, (B) MB3-anth conjugated to Tx-Red and (C) MB3-
anth conjugated to FAM-6. The left hand photomicrograph and
corresponding topo map within each panel (A,B and C) detail the
background signal of the beacon immobilized microsphere and
the right-hand photomicrograph and topomap within each panel
detail the signal after the hybridization of targets. The epi-
fluorescent images were taken at 1s camera exposure for all
panels. T1-100 was hybridized with A and T3-90 was hybridized
with B and C, all at concentrations of 0.4µM. ............................... 128
Figure 4.12: Detection of Bacillus anthracis 90bp target (T3-90) with MB3-
anth conjugated to FAM-6. Shown is the S/B versus
concentration titration curve. The dashed line represents the 3σ
above background level.................................................................. 131
xxx
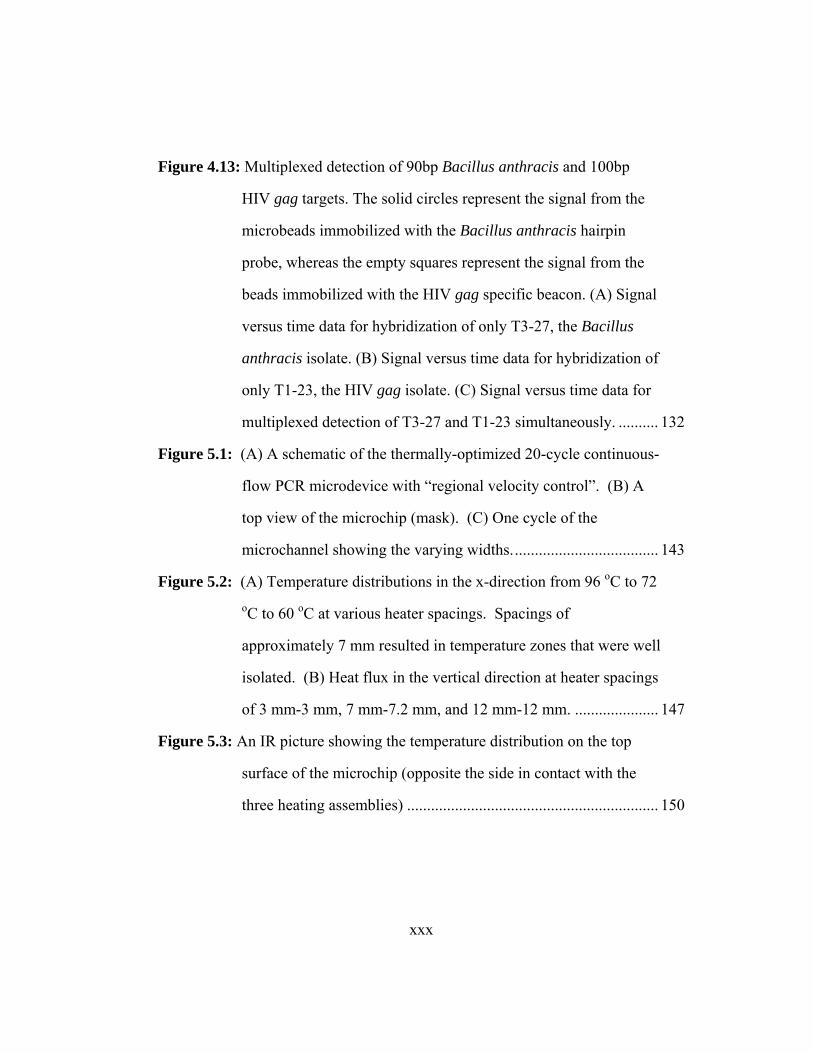
Figure 4.13: Multiplexed detection of 90bp Bacillus anthracis and 100bp
HIV gag targets. The solid circles represent the signal from the
microbeads immobilized with the Bacillus anthracis hairpin
probe, whereas the empty squares represent the signal from the
beads immobilized with the HIV gag specific beacon. (A) Signal
versus time data for hybridization of only T3-27, the Bacillus
anthracis isolate. (B) Signal versus time data for hybridization of
only T1-23, the HIV gag isolate. (C) Signal versus time data for
multiplexed detection of T3-27 and T1-23 simultaneously. .......... 132
Figure 5.1: (A) A schematic of the thermally-optimized 20-cycle continuous-
flow PCR microdevice with “regional velocity control”. (B) A
top view of the microchip (mask). (C) One cycle of the
microchannel showing the varying widths..................................... 143
Figure 5.2: (A) Temperature distributions in the x-direction from 96 oC to 72 oC to 60 oC at various heater spacings. Spacings of
approximately 7 mm resulted in temperature zones that were well
isolated. (B) Heat flux in the vertical direction at heater spacings
of 3 mm-3 mm, 7 mm-7.2 mm, and 12 mm-12 mm. ..................... 147
Figure 5.3: An IR picture showing the temperature distribution on the top
surface of the microchip (opposite the side in contact with the
three heating assemblies) ............................................................... 150
xxxi
Figure 5.4: Velocity field distributions of an (A) 7o diffuser (expansion) and
a (B) 7o nozzle (contraction) at the target flow rate of 1-5 µl/min.
The distributions were produced by ANSYS software. ................. 152
Figure 5.4: The experimental setup for running DNA amplification
experiments and the wiring diagram of the temperature control
system............................................................................................. 153
Figure 5.5. Gel electrophoresis results from a 20-cycle amplification reaction
at 1 µl/min. ..................................................................................... 155

xxxii
Figure 5.6: Schematic of the optimized steps for microbead based detection
of amplified sample. (A) Amplification of double stranded
template using PCR with 5’ primers biotinylated so that half of
amplified template is also biotinylated. (B) Addition of amplified
sequence consisting of one half biotinylated template to avidin
coated magnetic beads. Once the double stranded amplicons are
immobilized to the avidin coated magnetic beads, the aliquot is
heat denaturated to separate the double stranded template. (C) A
quick freeze separation step immediately after the denaturation
step ensures availability of separated double stranded template.
(D) Magnetic beads immobilized with biotinylated amplicons are
localized with a magnet and the supernatant consisting of free
half of amplified sequences necessary for end point detection are
retrieved. (E) The supernatant is diluted in hybridization buffer
and is recirculated over microbeads immobilized with molecular
beacons specific to amplified target sequence thus allowing for a
fluorescent mode of detection. ....................................................... 158

xxxiii
Figure 5.7: Photomicrographs and respective topographs for microbead array
(A) before and (B) after target hybridization. Two densities of
beads are shown where the rightmost column is immobilized
with 10µM of probe and the center and leftmost columns are
immobilized with 50µM of probe solutions. The sample was
incubated under recirculation for 2hr with the array of beads
immobilized with molecular beacon complementary to the target
sequence. ........................................................................................ 160

1
Chapter 1: Approaches for the Detection of Nucleic Acids within Microarray Formats
1.1 OVERVIEW
The following dissertation details the development of a nucleic acid
detection and amplification methodologies for the existing Electronic Taste Chip
(ETC) platform. This ETC approach has been developed over the past decade and
serves as a miniaturized platform that is suitable for the detection of a variety of
important classes of analytes including acids, bases, metal cations, antibody and
antigens. The taste chip platform is composed of individually addressable
polymer microspheres selectively arranged in etched cavities contained within
silicon wafers. Specifically, the ETC works by chemically derivitizing the
polymer micro-sphere to allow for the immobilization of specific receptors.
Additionally, the etched wells containing the microspheres are enclosed in
between an assembly of fluid delivery components which allow for both
encapsulation of the wafer and for the delivery of reagents to the sensor elements.
In addition, a short purview of a few seminal microarray based
approaches will be discussed to provide perspective on existing technologies as
well as establish requirements for a state-of-the-art miniaturized DNA sensor. The
final section to this introductory chapter provides an account of the advantages
and limitations for each of the discussed sensor types, thus highlighting the need
for the bead sensor platform that is the focus of this dissertation. Finally, a short
2
description of the content of the chapters to follow in this dissertation is outlined
at the close of this chapter.
1.2 SINGLE NUCLEOTIDE POLYMORPHISMS (SNPS) AND HAPLOTYPE BLOCKS
In order to truly appreciate the various approaches available to probe
single nucleotide polymorphisms with a miniaturized platform, it is necessary to
first establish the impetus for this focused research area that has changed the face
of functional genomics. Single nucleotide polymorphisms are by definition,
single-base DNA differences among individuals where the less common variant is
present at or above a frequency of 1% in the tested population.1,2 Establishing a
threshold frequency for the identity of SNPs is useful since very few of the rarer
variants not included within this frequency are important for genetic studies.
Although the Human Genome Project relays the image of there being a single
human genome, there is only 99.9% homology within the 3.2 billion base pairs
between any two genomes, still allowing for millions of differences encompassing
nucleotide diversity and resulting in the heritable differences between individuals
and their ensuing unique susceptibilities to diseases.2 It is estimated that two
genomes differ at a rate of 1 nucleotide per 1331 bp leading to roughly 11 million
sites in a single genome that vary in approximately 1% of the worlds population.2
Therefore, the influences of SNP maps to probe influence of genes on common
diseases such as cancer, heart disease, diabetes and stroke could have significant
impact for therapeutic interventions as well as for discoveries of cures. Although
nearly 10 million SNPs have been registered to date in public databases such as
The SNP Consortium (TSC) and the Human Genome Variation database (HGV

3
base), the technology and resources available to genotype hundreds of thousands
of SNPs in a genome for thousands of individuals is not practical.
Thus, in addition to large scale projects to map SNPs (The International
SNP map Working Group), haplotype mapping (HapMap) projects have also been
initiated. It is seen from efforts here that a majority of the genome is ordered into
segments of sequences called haplotypes that are inherited as discrete blocks with
minimal genetic shuffling through the generations.1,3,4 Although haplotype blocks
can contain large numbers of SNPs, they can be identified with only a few
number of SNPs, providing easier access to regions in the chromosome that are
linked to diseases. Additionally, the high number of SNPs already being
discovered could be used as markers for linkage studies and could help pattern
inheritance of a gene since DNA segments situated in close proximity to each
other typically get inherited together.1 The ultimate goal for research in this area
is to identify the structure of sequence variation throughout the genome thus
discerning the genetic contributions to diseases in individuals. It is necessary
therefore, to have available the technology and the resources to assist in
genotyping SNPs and for highlighting haplotypes in a large population of
individuals.
1.3 TRADITIONAL METHODS
Traditional genotyping techniques involve using the Sanger DNA
sequencing method, based on enzymatic chain termination by chemically altered
“dideoxy” bases generating a set of single-stranded DNA sequences that are size-
separated by gel electrophoresis.5 Although, the Sanger sequencing method was

4
the primary method for sequencing the Human Genome Project, as well as being
instrumental in initial SNP recognition, the low throughput and high cost per
sample have limited the utility of this approach. As such, alternative techniques
for SNP detection have paved their way through to the forefront with significant
efforts in the past decade. Most of the alternative methods rely on the ‘sequence-
specific’ or ‘sequence-nonspecific’ hybridization reactions.6 Most sequence-
nonspecific reactions depend on the subtly different conformations under
nondenaturing conditions attained by mismatched heteroduplexes between single
stranded sequences. These reactions are typically based on capture, cleavage or
mobility change during electrophoresis or liquid chromatography.7 However,
sequence specific reactions depend generally on allelic discrimination. These
mechanisms either include hybridization,8,9 nucleotide incorporation,10
oligonucleotide ligation11 or invasive cleavage with endonucleases12 of alleles.13
These methods typically require a PCR amplification step prior to or during
discrimination. Although these homogeneous assays are robust, they have limited
multiplexed abilities and thus have reduced throughput.
1.4 TWO-DIMENSIONAL ARRAYS
Ideally, a genotyping method should possess a few key qualities such as:
(a) ease of assay development, (b) cost of overall assay, (c) robust reactions
yielding reliable results, (d) ease of automation, (e) simple data analysis and (f)
flexible reaction format.6 To this end, several immobilized solid phase genotyping
supports have been developed using silicon chips, glass slides or polymer beads to
address some of the cost and high-throughput requirements as needed for an
5
optimal method to be practical. The following section highlights a few important
types of advanced microarray technologies that have been reported to date. These
new methods have helped shape the current state-of-the-art strategies for DNA
sensing and genotyping.
1.4.1 Microarrays
Basic microarray technology follows two general manufacturing
categories: synthesis and delivery.14 For the former, microarrays are prepared in a
systematic fashion, by in situ synthesis of nucleic acids from their respective
building blocks. A cycle of synthesis involves the addition of nucleotides to a
growing chain till the optimal length has been reached. The delivery category in
contrast involves the deposition of a prepared solution of necessary reagents for
chip fabrication.
High-density oligonucleotide microarrays or “GeneChips” are
manufactured by combining photolithography technology from the semiconductor
industry with DNA-synthetic chemistry.15 They are manufactured by a modified
version of conventional phosphoramidite chemistry with the use of a photolabile
protecting group on the terminal hydroxy group of a spacer linked to the surface
of the substrate. The intial step involves the removal of the protecting group to
generate a free hydroxyl group only at positions illuminated by UV light shining
through a photolithographic mask. The next step involves the addition of 5’-
protected phosphoramidite to the deprotected sites. The unreacted hydroxyls are
subsequently capped, followed by oxidation and washing and the use of a second
mask to synthesize the next nucleotide on the required probe site. This synthesis

6
process is repeated till the required oligonucleotide set is synthesized. With the
fabrication step complete the array is ready for hybridization where the targets to
be analyzed are labeled with a fluorescent dye. The labeled target is incubated
under planar diffusion conditions till the hybridization reaction is complete.
Developed by Fodor and colleagues, the GeneChip’s main advantage is its ability
to manufacture microarrays directly from sequence databases. However, a
disadvantage to this approach is that the use of photomasks is time-consuming to
design and build. The systems are also quite expensive.14,16 Consequently, a high
concentration of oligonucleotides are required due to difficulties in establishing
reliable SNP discrimination.17
Originally developed by Shalon and Brown, the mechanical microspotting
approach serves as a robust alternative to photolithography microarray
synthesis.18 Microspotting allows for automated microarray production with the
printing of small amounts of premixed biological reagents necessary for probe
fabrication onto a planar surface. The printing procedure is accomplished through
direct contact between the printing substrate and the surface. Although, some of
the advantages of this approach include low cost and versatility, the sample
preparation and storage steps reduce the automated impact of the platform. This
spotting procedure has also shown to be effective with the use of a piezo-based
inkjet dispenser, a non-contact method that is theoretically amenable to very high
throughput assays.19
From their inception, microarray technologies promised to provide
massive parallel genotyping capabilities with simple allele-specific hybridization

7
detection. Although, RNA expression analysis may have been aided greatly with
the advent of microarrays, the attributes for the SNP genotyping arena has been
less revolutionized. Difficulties associated with design of a high-density
oligonucleotide array resolved for the detection of single-base mismatches using
basic hybridization conditions has not been fruitful due to low sensitivities.
Additionally, long hybridization times for targets due to passive diffusion within
the planar surface have reduced the impact on prototyping rapid assays.20,21
1.5 THREE-DIMENSIONAL ARRAYS
In order to address the high binding capacity and limited transport
properties of planar chips, alternative solid-phase reaction surfaces have been
used. Polymer beads in the nano- to micrometer size range have shown great
flexibility towards being able to immobilize various molecules and thus address a
need for a multianalyte sensor for proteins,22 oligonucleotides,23 and other
biologically relevant molecules.24 The high surface to volume ratio allows for the
drastic reduction of reaction volumes and the porous nature of some of these
polymers affords high sensitivity for detection by virtue of a high capture density.
Polymer beads or pads have seen an increased prevalence in key genomic
approaches with promising results.
1.5.1 Polymer Bead Based Sensors
Fiber-optic bead based arrays from Walt and co workers serve as an
elegant alternative to planar microarrays.25 This approach utilizes a high density
of selectively etched optical fibers fused together. Each etched core at the ends of
the fiber bundle serves to contain a single polymer microsphere previously
8
modified with probes of interest. Specific oligonucleotide probes can be
immobilized respectively to a single bead, followed by a pooling method to form
a library of beads with different probes. This library aliquot is exposed to the
bundle of fibers where a single bead is captured into a single well. Thus, the probe
support phase of the bead array is completed and is ready for the hybridization of
targets. Although, the hybridization aspects are similar to the planar array
technology, the beads are located at random spots throughout the fiber-optic array
as opposed to containing a fixed position during fabrication. Thus, it is necessary
for each bead type to be identified through combinations of different dyes co-
localized within the bead core. Additionally, the fiber is used to detect the
fluorescence emission from the labeled targets sequences and can be regenerated
with the removal of beads. Multiplexed assays with high-throughput are also
possible with this highly miniaturized platform since beads can be produced in
enormous numbers with high reproducibility. Polymer beads have shown great
efficacies for DNA sensing with low sensitivities26 but a large number of beads
are required for quantitation to establish a reasonable signal to background
ratio.25Additionally this approach yields values of ~2 for discrimination of single
nucleotide mismatches.27 Further, the hybridization of targets is limited by a
diffusion based transport mechanism, leading to long incubation times.25
1.5.2 Gel Pads
The trend to use high binding capacity polymers has also been extended to
gel pad arrays, where polymer gels such as polyacrylamide or agarose are
immobilized onto a glass slide.28,29 Procedures for chip preparation either include
9
the creation of individual pads that are isolated from each other with a spacer of
the hydrophobic glass they are immobilized on or a bed of polymer immobilized
onto a glass slide. In the former case, a solution of monomers is placed on a glass
slide with either a piezoelectric dispenser or a high output four-pin robot. The
drop solution consists of monomers as well as the probe molecules modified with
the same monomer. This procedure ensures co-polymerization of the probes with
the gel structure upon UV-irradiation or in the presence of a chemical initiator.
The monomer groups on the probe are introduced during or post synthesis of the
sequence. This approach allows each pad to behave as an individual sensor with
prospects for multiplexed assays by either separating the individual pads from
each other with water-insoluble solvents or by delivering reagents for
hybridization to each pad with a robot pin or piezo-electric dispenser.
Conversely, the bed of polymer on the glass slide is prepared by pouring
glyoxylated melted agarose onto glass slides. The gelled pad is then spotted with
amine terminated probes using a pin-tool based spotting robot.29 After an
overnight reduction the slides are ready for hybridization of fluorophore labeled
targets. Although, the porous gels have a higher binding capacity in comparison
with planar arrays and thus have enhanced sensitivity, both types of gel-pad
arrays require diffusion based target introduction with typical hybridization times
of ~4-12h thus reducing their impact as rapid sensors.29,30
1.6 MICROFLUIDICS
Microarray systems and microfluidics areas have to date remained largely
as separate disciplines. The discussion of microfluidics here is important as the

10
area has the potential to provide active transport of reagents and analytes to
reactive capture sites as required increasing assay throughput. Microfluidic
devices typically consist of one or more channels with at least one dimension less
than 1mm. The advent of the fabrication processes used to manufacture
microfluidic devices has enabled numerous advantages towards reduction in
analyte volumes as well as in creating highly integrated devices with multiplexing
abilities in combination with the possibility of mass production. These advantages
have thus enabled the development of lab-on-a-chip (LOC) or micro-total analysis
systems (µTAS) focused for a myriad of specific areas such as point of care
testing,31 clinical and forensic analysis,32 molecular33 and medical34 diagnostics. A
few notable contributions to advance microfluidic devices are therefore discussed.
The last decade has seen a tremendous leap in the abilities of miniaturized
capillary electrophoresis (CE) devices. Electrophoresis, basically the technique
used to size-separate and analyze oligonucleotides is traditionally used in a slab-
gel format. However, the evolution of electrophoresis techniques has culminated
into highly developed microfabricated chip based CE devices. The term ‘µ-TAS’
coined by Manz and Widmer in 1990,35 mainly comprising of a combination of
separation and detection components has garnered tremendous interest in the
micro-analytical systems community. The majority of these achievements
acquired by µ-TAS systems have been due to the strides that CE devices have
made with respect to reducing reagent volumes, and increasing the speed of
separations. In comparison with traditional separation techniques such as
capillaries and slab-gel platforms, microchip based CE devices are faster on the

11
order of 10 to 100 fold, respectively.32 Some of these notable advances have been
directed by Mathies and coworkers with the pioneering of both capillary array
electrophoresis (CAE)36,37 as well as the miniaturized version (µCAE).38 Their
contributions have furthered the throughput of CE devices to even include a
radial format accommodating as many as 384 channels.39-41 Various
commercialization processes for microchip separation devices are underway, with
pneumatic and electrokinetic force fluid delivery and separation methods. These
recent developments of microfabricated channels could significantly reduce
reaction volume and thus reaction cost and increase throughput. However, for a
broader utility separation processes need to be in-tandem with purification and
amplification components to provide a total analysis system and aid overall
diagnostic applications.
1.7 SUMMARY AND DISSERTATION OVERVIEW
The preceding sections detail the impressive advances made by planar and
three-dimensional microarrays as well as microfluidic separation ensembles. Each
of these separate bodies of work has yielded tremendous advantages for furthering
DNA analysis devices. Planar arrays have been instrumental in providing a high-
throughput option for gene expression with enhanced unrivaled automation.
Meanwhile, polymer based sensors offer a higher binding capacity surface leading
to enhanced sensitivities where the fiberoptic based approach in particular has
shown tremendous multiplexing advantages. Microchannel fabrication and in
particular CE devices have paved the way for rapid oligonucleotide separations
and allowed for integration of various analysis components subsequently to reach

12
closer towards the goal of creating some of the components for a total analysis
system.
Although these mentioned approaches have made great strides in
furthering nucleic acid sensing, each of them also have shortcomings that reduce
their overall utility. Planar microarrays for example, have been notoriously
inadequate for SNP genotyping, a highly required attribute for a successful DNA
sensor. Decreased sensitivities and a complex assay design coupled with long
incubation times due to planar diffusion transport shortcomings have drastically
reduced the impact of microarrays. In contrast, polymer based arrays have been
very successful in sensitivities for detection but lack ease of analysis. Although,
radial diffusion transport is the lead mechanism involved in analyte hybridization,
the lack of a hydrodynamic reagent delivery component greatly elongates
incubation times for targets. Nevertheless, as aforementioned, µTAS devices have
demonstrated extreme prowess towards reduced reagent volumes and rapid
analyte separation, but at the present time are not adept at performing multiplexed
assays and at this time are not very amenable to existing SNP detection strategies.
Having provided this perspective, it is necessary to point out that each of
these different approaches has achieved very different goals where each
contribute a different piece to completing the puzzle. Figure 1.1 depicts the
necessary pieces necessary for a lab-on-a-chip system. These pieces have been
identified as necessary features for a successful step towards creating a
miniaturized nucleic acid sensor for a myriad of environments such as drug and
diagnostic therapeutics as well as for defense against biological agents.
13
Henceforth, the following dissertation details the development and validation of a
nucleic acid sensor capable of providing a more complete solution to the needs for
a DNA sensing device.
Figure 1.1: Schematic for key qualities necessary to complete a successful nucleic acid sensor.
This dissertation attempts to develop the science base that will enable the
development of miniaturized, integrated DNA detection systems. The work is
separated as described in the following sections. The second chapter of this
dissertation discusses the development of a microbead based sensor array tailored
for the detection of nucleic acids. More specifically, the focus is directed towards
14
demonstrating the efficacy of this bead array based sensor for the discrimination
of single nucleotide polymorphisms within short oligonucleotides. Additionally,
the work detailed within this chapter serves to institute the microbead array as a
reliable analytical tool for oligonucleotide detection with high sensitivities in
addition to enhanced rates of reaction and effective sensor regeneration for high-
throughput assays. Chapter 2 also sheds some preliminary insight into the analyte
sequestration features of the three-dimensional sensor element.
Having validated the microbead array for the detection of nucleic acids, by
performing gold standard assays for the detection of SNPs, it was necessary to
expand upon the analyte sequestration studies mentioned in the previous chapter.
Thus, Chapter 3 serves to probe further the molecular interactions occurring
within the bead polymer matrix with respect to the hybridization of nucleic acids.
The work mentioned herein details the external and internal factors affecting the
signal acquisition parameters such as molecule size dependent analyte permeation
within the bead and effects of varied density of immobilized probe on the rates of
hybridization. Additionally, the chapter also serves to delineate the patterns of the
mass transport mechanism occurring within the microbead array due to the porous
polymer integrated with a hydrodynamic analyte delivery system. This body of
work also details the evolution of the homogeneous bead to a superporous bead
polymer exhibiting enhanced mass transport properties leading to higher
‘effective’ diffusion coefficients.
The work detailed in Chapter 4 serves to extend the capabilities of the
microbead array towards quantitative real-time multiplexed detection of disease

15
gene isolates with the integration of molecular beacons within the bead platform.
The chapter represents a thorough study of the implementation of the internal
recognition modality of molecular beacons within the bead sensor and effects
thereof on signal to background. Various parameters were explored leading to
optimization of density of probe, sensitivity for 100bp targets and discrimination
for mismatched targets in addition to effective sensor regeneration. This work
encompasses the development of a competitive real-time sensor for the detection
of nucleic acids with the added attributes of the electronic taste chip.
Chapter 5, the last chapter of this dissertation discusses collaborative
efforts towards the successful development of a µ-channel glass polymerase chain
reaction (PCR) chip. The chapter summarizes the work involving the design and
modeling parameters optimized for the development of a µ-channel PCR chip
resulting in the successful amplification of 90base pair isolates from the 16S
rRNA region of Bacillus anthracis. Also discussed here are preliminary details
encompassing bridging the µ-channel amplification with the molecular beacon
based microbead detection for endpoint quantitation of the amplicons. This step
may lend itself to the eventual integration of the amplification and detection
parameters for nucleic acid sensing resulting in a high-throughput lab-on-a-chip
system.
Collectively, the body of work in this dissertation lends itself to addressing
the needs of the DNA sensing community in providing a more complete
realization towards a nucleic acid based lab-on-a-chip. As will be shown here, the
Taste Chip platform lends itself nicely to the sensitive and selective detection of

16
nucleic acids and has additionally addressed goals such as transport rates and
adaptability with amplification and microfluidic modules. This work in
conjunction with previous analyte detection for the microbead array lends
strongly towards a multiplexed detection strategy within a multianalyte effort.
Thus, this microbead array based nucleic acid sensor serves to provide a more
thorough solution to the puzzle.
17
Chapter 2: DNA Hybridization and Discrimination of Single- Nucleotide Mismatches Using Chip-Based Microbead Arrays
2.1 INTRODUCTION
The development of a chip-based sensor array composed of individually
addressable agarose microbeads has been demonstrated here for the rapid
detection of DNA oligonucleotides. Here, a “plug and play” approach allows for
the simple incorporation of various biotinylated DNA capture probes into the
bead-microreactors which are derivatized in each case with avidin docking sites.
The DNA-capture probe containing microbeads are selectively arranged in
micromachined cavities localized on silicon wafers. The micro-cavities possess
trans-wafer openings, which allow for both fluid flow through the
microreactors/analysis chambers as well as optical access to the chemically
sensitive microbeads. Collectively, these features allow for the identification and
quantitation of target DNA analytes to occur in near-real-time using fluorescence
changes that accompany the target sample. The unique 3-dimensional
microenvironment within the agarose bead as well as the microfluidics
capabilities of the chip structure afford a fully integrated package that fosters
rapid analyses of solutions containing complex mixtures of DNA oligomers.
These analyses can be completed at room temperature through the use of
appropriate hybridization buffers. For applications requiring analysis of ≤ 102
different DNA sequences, the hybridization times and point mutation selectivity
factors exhibited by this bead-array method exceed the operational characteristics
in many respects for the commonly utilized planar DNA chip technologies. The

18
power and utility of this DNA detection microbead array methodology is
demonstrated here for the analysis of fluids containing a variety of similar 18-base
oligonucleotides. Hybridization times on the order of minutes with point mutation
selectivity factors greater than 10,000 and limit of detection values of ~10-13 M
are obtained readily with this microbead array system. Recent trends in analytical
chemistry have shifted towards the creation of miniaturized total analysis systems
that integrate sample preparation and measurement steps into microfabricated
fluidic devices.42,43 The potential advantages of such lab-on-a-chip systems
relative to conventional macroscopic instrumentation include: (i) reduced sample
and reagent consumption, (ii) shorter analysis time, (iii) higher sensitivity, (iv)
portability and (v) disposability.44,45 These advantages have now been
documented46 for chip-based enzyme assays,24 immunoassays,22,47 and DNA
sequencing.48,49 Arguably, the most advanced and impressive demonstrations in
the lab-on-a-chip area have centered around miniaturized capillary electrophoresis
systems where multiplexed separation lanes have been fashioned and ultrafast and
orthogonal separations have been completed.50 Less attention has been paid to the
development of multiplexed detection schemes that maybe used in conjunction
with these lab-on-a-chip systems. Likewise, the creation of miniaturized chip-
based platforms that are suitable for the analysis of multiple analyte classes
remains an essential theme for future sensor research.
Over the last decade, research in the microfluidics area has catalyzed
important developments in the genomics field. The development of sequence
specific DNA detection methodologies has become increasingly important as the

19
scientific community strives to unravel the genetic underpinnings of various
diseases.51,52 While the majority of modern DNA detection methodologies rely at
some level on polymerase chain reaction (PCR), methods for the detection of
specific sequences in an array format are still under development.53-56 For
example, commercially available technologies include oligonucleotide arrays
from Affymetrix,15 and DNA arrays with electrochemical transduction from
Motorola.57,58 While these systems, have proved to be extremely successful for
advancing genomics research, slow hybridization times (typically > 1 hour) and
inefficiencies in lithographic processing have limited the utility of these
approaches for many other applications. In general, the use of planar DNA
microchip structures results in small effective signal-generating path-lengths that
necessitate either the use of high power light sources for chip readout or the use of
amplification methodologies which slow analysis times.
Clearly, the development of new high sensitivity and high selectivity
platforms suitable for rapid and direct (i.e., without amplification) detection of
oligonucleotides represents an important challenge for the scientific community.
Progress towards higher sensitivity arrays has been made with platforms which go
beyond planar DNA microchips and incorporate a 3-dimensional element into the
sensor. These second generation DNA chips provide a medium which allows for
the attachment of probes at a much higher density. Such platforms include
acrylamide and agarose gel pad arrays on glass substrates.29,59 Additionally, Walt
and co-workers have elegantly demonstrated the power of bead-based arrays
when coupled with optical fibers.27 Single base-pair mismatch discrimination,
20
with DNA functionalized poly(methylstyrene)divinylbenzene microspheres, has
been achieved at an elevated temperature. While these second generation devices
display improvements in sensitivity that may be attributed to the use of a non-
planar capture system, slow transport of analyte to the active sites remains a
concern for these systems. However, the DNA hybridization kinetics can to some
extent be controlled by forcing analyte movement through a sensor. For example,
Nanogen carries out electrophoresis on a chip surface in order to improve signal
kinetics.60,61 Clearly, further improvements in the mass transport and fluid mixing
effects are required to take full advantage of these promising new microanalysis
systems.
Herein we describe a new methodology suitable for the rapid detection of
oligonucleotides at room temperature using a microbead array. This method
combines the various advantages of second generation sensor arrays (i.e. low
background, polymers such as agarose, biologically amenable, probes effectively
concentrated in a 3-dimensional element) with pressure driven fluid flow and
recirculation capabilities to improve reaction rates as well as hybridization and
discrimination characteristics. This work extends upon our prior efforts using the
same “electronic taste chip” platform whereby acids, metal cations, proteins,
antibodies, sugars and biological co-factors have been identified and quantitated.
The addition of functional DNA assays to the electronic taste chip system
represents another important step in the direction of making this system serve as a
universal chemical and biological detection platform.

21
2.2 EXPERIMENTAL SECTION
2.2.1 Instrumentation and Analysis Protocols
The imaging and analysis systems for the microbead array have been
discussed previously.22 Fluid samples were introduced into the cell either with
miniaturized peristaltic pumps from Instech Laboratories Inc. (Plymouth Meeting,
PA) or with an Amersham Pharmacia Biotech ÄKTA high-pressure liquid
chromatograph, controlled by Unicorn 3.0 software (Amersham Pharmacia
Biotech). All fluid introduction steps were completed using computer controlled
macros. Typical flow rates for sample and buffer introduction ranged from 1 to 5
mL/min. An optical station was assembled with components provided by
Olympus (Melville, NY). The station was equipped for epifluorescent imaging of
the microbead array using a 200 W Hg/Xe light source. The custom-made system
also contained interchangeable objectives and removable filters to control the
excitation and emission wavelengths. For the purposes of DNA hybridization
detection, a 5x objective was utilized in conjunction with a set of three
interchangeable filters: FITC (λex = 480 nm, λem = 535 nm), Texas Red (λex = 560
nm, λem = 645 nm) and Pacific Blue (λex = 410 nm, λem = 470 nm) purchased from
Chroma Technology Corp. (Brattleboro, VT). Optical data were captured using a
DVC 1312C (Austin, TX) 12-bit charge-coupled device (CCD) camera and the
data was analyzed using Image Pro Plus 4.0 software from Media Cybernetics
(Carlsbad, CA). The CCD measurements were taken with exposure times ranging
from 69.9 ms to 2.36 s. To monitor the DNA hybridization progress, an area of

22
interest (AOI) for each of the beads was defined using the analysis software and
then the relevant red, green, blue average color intensity values as a function of
time were recorded by the CCD. The average pixel intensity versus time data for
each of the beads were exported to a spreadsheet. The data measurement and
quantitation steps were completed in an automated fashion using software macros
created for these specific purposes. Confocal studies were conducted with a Leica
TCS 4D (Bannockburn, IL) confocal microscope equipped with a Kr/Ar mixed
gas laser and DIC optics.
2.2.2 Reagents
The DNA 18-mer capture sequences (DNA-cap-sequences Figure 1C) and
their complements (Target-sequences Figure 1C) were purchased from Integrated
DNA Technologies, Inc (Coralville, IA). The lyophilized DNA samples were
reconstituted using TE buffer (10 mM Tris-HCl, pH 8.0, 1 mM EDTA).
Aldehyde-terminated agarose microbeads were purchased from XC Corporation
(Lowell, MA). Hybridization and high stringency washing buffers (1X) were
diluted from a concentrated stock solution of 5X (pH 7.8) containing 5 M NaCl
(J.T. Baker Inc), 1 M Tris buffer, pH 7.6 (Sigma Chemical Co.) and 0.5 M EDTA
pH 8.0 (Spectrum Chemical MFG. Corp.) Both buffers also contained 1 M Urea
(diluted from 4 M stock solution), (Mallinckrodt AR). In addition the high
stringency buffer contained 35% Formamide (diluted from 80% stock solution),
(Sigma Chemical Co.). Hybridization buffers were used for the target incubation
period of discrimination studies; high stringency buffers were used for the rinse
phase of the discrimination studies (vide infra).

23
2.2.3 DNA Functionalization
Avidin docking sites were coupled to the aldehyde-terminated agarose
microspheres via reductive amination.62 The method involves reacting the
aldehyde terminals of the microbeads (500 µL) with the protein avidin (300 µL)
(Pierce) in carbonate buffer, pH 9.6 (640 µL), to form initially reversible Schiff’s
base complexes. Subsequently, the complexes were selectively reduced and
stabilized so as to form covalent linkages using sodium cyanoborohydride (60
µL). A solution of 1% Triton-X (Sigma Chemical Co.) was also included in the
reaction volume. The biotinylated DNA-cap-sequences (50 µM) were reacted
over a period of 1-12 hrs with the avidin conjugated agarose beads (20 µL) in a
microcentrifuge tube on a shaker at room temperature. The oligonucleotide-
immobilized beads were rinsed 5 times with phosphate buffer (pH 8.0) and stored
in the refrigerator at 4 ºC.
2.2.4 Discrimination Studies
The microbead array used for discrimination experiments contained three
columns of microbeads previously immobilized to three different DNA capture
strands. A column of avidin coated microbeads was included here to serve as a
negative control. Samples volumes (550µL) containing DNA targets (3.2µM)
were incubated under flow conditions within the microbead array. The
hybridization phase was followed by a short rinse with a high stringency wash
buffer (see Reagents Section above). Data was obtained using specific color
selective filters (see Instrumentation and Analysis Protocols above) in conjunction

24
with CCD measurements recorded at an exposure setting of 69.9ms. The
discrimination index was obtained using the raw fluorescence intensity values for
the specific signal associated with Target-G’and DNA-cap-G to the non specific
background signal associated between Target-G’ and DNA-cap-B (see
Supplementary Materials). Target-G’contains a one base pair mismatch (C:C)
relative to DNA-cap-B. Specific and non-specific signals were monitored with
consistent areas of interest (AOI) on same bead of each type (DNA-cap-G and
DNA-cap-B) recorded as a function of time after the start of rinse phase.
2.2.5 Reproducibility Studies
The microbead array was exposed to 1.5 mL of target sample that was
contained within a circulation loop. At a flow rate of 4 mL/min, the DNA analyte
was circulated over the beads containing DNA-cap-G anchored therein for 5 min.
After discharging the sample fluid, the array was then rinsed with washing buffer
(20 mM Tris-HCl from Sigma Chemical Co. and 300 mM MgCl2 from
Mallinckrodt AR) for 30 s. These steps were followed by the introduction of 90%
formamide in TE buffer (10 mM Tris-HCl, pH 8.0, 1 mM EDTA) at room
temperature for 15 s. At this point, the fluid flow was stopped for 2 min and then
a rinse was initiated with washing buffer at 4 mL/min for 2 min. This final rinsing
procedure serves to remove all DNA analyte sample and effectively regenerate
the bead array. This procedure was repeated 4 times using the complementary
target (i.e. Target-G’) to the sequence on the microspheres (i.e. DNA-cap-G).

25
2.2.6 Microbead Array Sensitivity Studies
The array was exposed to 1.5 mL of a DNA target containing solution
(Target-G' in TE buffer) for 40 min at a flow rate of 4 mL/min. The fluid sample
was circulated over the beads in a continuous manner via a fluidics loop.
Fluorescence images were taken before sample introduction and after buffer rinse
(20 mM Tris-HCl, 300 mM MgCl2) using CCD parameters of 1.53 s exposure
time. The DNA detection threshold values for the microbead array were
determined following the analysis of dose-dependent data so as to define the
detected DNA concentrations that yield signal values greater than 3 standard
deviations above the background mean signal recorded for the same array without
target introduction.
2.3 RESULTS AND DISCUSSION
2.3.1 Platform Description
The new DNA adaptation of the electronic taste chip system exploits a
series of polymer microbeads that are placed into small voids fashioned within Si-
chips. The chips have been treated chemically so as to expose a series of
pyramidal pits whose sides are angled inward at 54.7 degrees relative to the
surface plane. Each well, by design, houses a single bead (Figure 2.1A) and
serves in conjunction with a transparent cover slip to immobilize the microsphere.
The packaged fluid cell allows for direct and efficient fluid flow (~20,000 bead
volumes delivered per minute) to occur into the bead chamber while at the same
time allowing for optical analyses at numerous similar sites simultaneously. For

26
the measurements described here, microbeads with diameters of 250-350 µm are
used with bead internal volumes in the range of 8-22 nL. The bead and cell
package combination readily accommodates flow rates up to 5 mL/min through
array sizes as small as 3 x 4 with higher flow rate values for larger arrays (i.e. 5 x
7, 10 x 10, etc.). The inclusion of drains at the bottom of the wells allows for
rapid delivery of reagents while at the same time providing flexibility for the
choice of sample size.
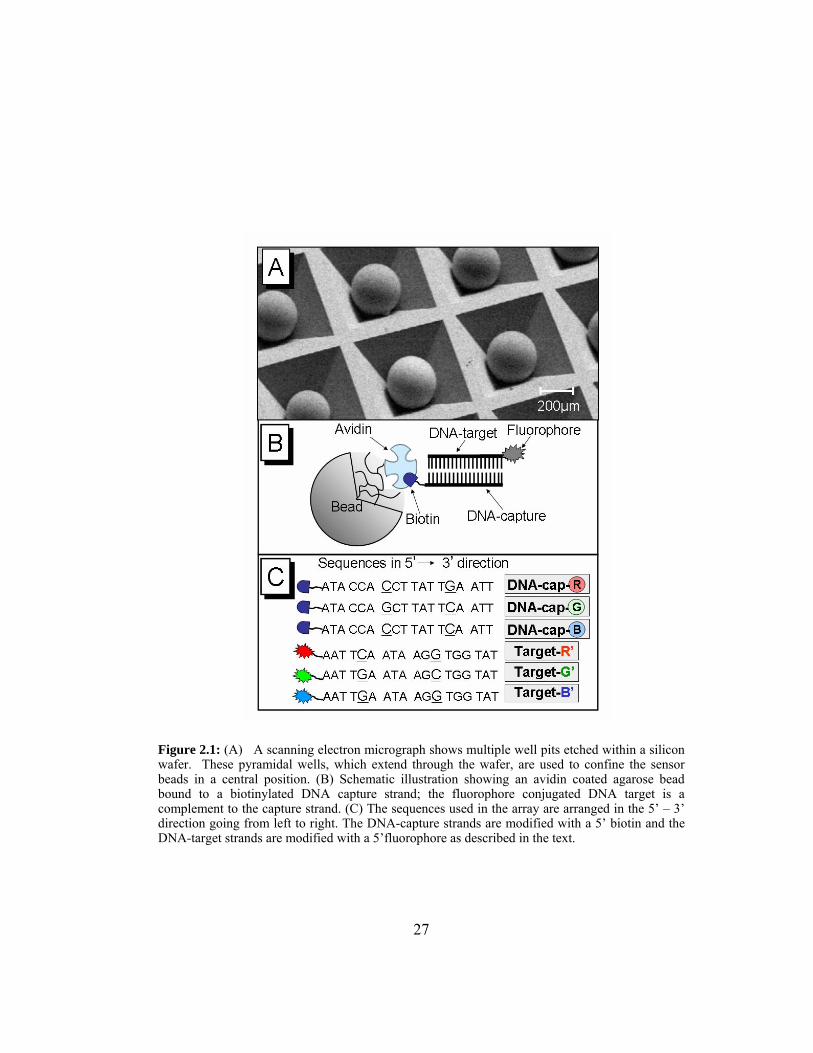
27
Figure 2.1: (A) A scanning electron micrograph shows multiple well pits etched within a silicon wafer. These pyramidal wells, which extend through the wafer, are used to confine the sensor beads in a central position. (B) Schematic illustration showing an avidin coated agarose bead bound to a biotinylated DNA capture strand; the fluorophore conjugated DNA target is a complement to the capture strand. (C) The sequences used in the array are arranged in the 5’ – 3’ direction going from left to right. The DNA-capture strands are modified with a 5’ biotin and the DNA-target strands are modified with a 5’fluorophore as described in the text.

28
The microbead array methodology provides a number of unique
characteristics relative to those exhibited by more commonly exploited planar
DNA array technologies. Beads present a much larger surface area for the display
of capture agents as compared to planar surfaces.63,64 A simple “plug and play”
approach allows for rapid incorporation of various biotinylated DNA capture
probes into bead-microreactors which have been previously derivatized with
avidin docking sites (Figure 2.1B). Conventional solid-state oligonucleotide
synthetic methods can be used to create bulk quantities of strategic capture
sequences as needed for the various applications. Consequently, 106 to 109 nearly
identical microbeads can be prepared rapidly using simple reaction vessels.
Moreover, when microspheres are prepared from a porous cross-linked agarose
matrix, an internal environment quite suitable for DNA hybridization is obtained.
At the same time, access is provided not only to the surface region of the porous
agarose bead, but also to the internal volume (vide infra).
2.3.2 Capture and Target Sequence Specifics
To demonstrate oligonucleotide discrimination capabilities of the
microbead array system, hybridization data were obtained for three very similar
DNA capture strands. Three specific capture strands were designed with their
complements attached to three different fluorophores. As shown in Figure 2.1C,
DNA-cap-R is the capture strand whose complement, Target-R’, is conjugated to
Texas Red. Similarly, Target-G’ and Target-B’ are conjugated to Oregon Green
488x and Pacific Blue, respectively. It is also important to note that DNA-cap-R
contains a two base-pair mismatch (G:G and C:C) relative to Target-G’ and a one

29
base-pair mismatch relative to Target-B’ (G:G). In the same manner, DNA-cap-G
contains a one base-pair mismatch relative to Target-B’ (G:G). Likewise, DNA-
cap-B contains one base-pair C:C mismatches relative to both Target-R’ and
Target-G’ (although at different locations). The use of labeled sample (target)
DNA allows for real-time monitoring of hybridization events. Thus, the
discrimination capacity of the new system can be quantitated, and optimal flow
and hybridization buffer conditions can be chosen in an efficient manner. Similar
conditions disclosed here can be used readily in future experiments to complete
sandwich DNA assays for the detection of unlabeled DNA samples.65,66
2.3.3 Discrimination Analysis
To demonstrate oligonucleotide hybridization and discrimination
capabilities, a 3 x 4 microbead array was assembled with three columns of
microbeads previously immobilized to three DNA capture strands (R, G, B.
Figure 2.2). A column of avidin-coated microbeads (A) is also included in the
array to serve as a negative control. Each DNA capture bead (R, G, B), as well as
the negative control bead (A), is included within the array in triplicate. In this
way, redundant data are obtained and the reliability of results is ascertained
efficiently. A sample volume of 550 µL of 3.2 µM of each DNA target (R’, G’,
B’) was incubated under flow conditions within the array containing the 4
columns of microbeads. Samples of each DNA target (R’, G’, B’) are introduced
at room temperature either individually or in mixtures (data not shown). This was
followed by a short rinse with a high stringency wash buffer.

30
The sample introduction, hybridization and rinse stages are depicted in
Figure 2.2 by three panels of photomicrographs representing Targets R’, G’ and
B’, respectively. At time (0), the unbound target molecules are contained in the
pyramidal wells surrounding the microbeads. Progressive rinsing shown in time
(1), rapidly diminishes both the background fluid signal contributions as well as
the non-specific signals associated with non-complementary interactions within
the bead microreactors.67 At the end of the rinse sequence shown at time (2), only
complements remain hybridized at their respective DNA capture beads. The
sample incubation, rinse, and measurement procedures are completed in 6 min or
less. Measurement of the ratio of binding of the complement to the single
nucleotide mismatch is achieved using color selective filters and fluorescence
measurements at different bead sites. A single nucleotide discrimination index in
the range of 10,000 to 50,000 (signal of complement hybridization vs. signal of
non-specific binding for mismatched sequence) is obtained after a 3.2-minute
rinse cycle for the 18-mer DNA oligomers [Figure 2.2 at the t(2) stage for Target

31
Figure 2.2: Fluorescence images of DNA-capture beads (R, B, G) (shown at the bottom of each panel) incubated sequentially with Targets-R’, G’ and B’ (shown at the top of the panels). The three horizontal panels of images show identical arrays that have been viewed with three different filter cubes specific to each fluorophore conjugated target. An avidin coated bead (A) was included in the array to serve as a negative control. The three vertical panels show discrimination of one and two base pair sequences along with demonstrating behavior for complement hybridization with the three different fluorophore-conjugated targets. Three different time periods recorded after sample introduction during the wash sequence are provided: t(0), t(1) and t(2). At t(0), the indicated target is incubating with the array consisting of the four columns of microspheres. Progressive rinsing shown at t(1) rapidly diminishes both the background fluid contributions as well as the non-specific signals associated with non-complementary interactions within the microspheres. At the end of the rinse phase shown at t(2), only complements remain hybridized at their respective DNA capture beads.

32
G’]. With progressive rinsing using a high stringency buffer, the ratio of specific
signal to non-specific signal continues to increase as does the variance of the
measured discrimination index (see section 2.3.7). The large variance in the
measured discrimination ratio here obtained is attributed mainly to the scatter in
the non-specific signals which approach closely to the background noise levels.
While Walt and co-workers previously achieved single mismatch discrimination
by altering the temperature of the hybridization reaction in a system without
integrated flow capabilities,27 the optimization of buffer composition and chip-
based approach shown here achieve similar results. In particular, as shown here
the simple addition of chaotropes such as urea and formamide during
hybridization reactions can be used to foster single mismatch discrimination.68,69
Moreover, the isothermal discrimination capacity obtained by optimizing the
buffer composition allows for elimination of time-consuming temperature
displacement steps. The selectivity characteristics described here for the
microbead array are competitive relative to recent reports for evolving DNA
detection methodologies.70
As emphasized above, the inclusion of integrated fluidics capabilities
alongside high selectivity bead microreactors affords interesting new
opportunities to explore in real-time the dynamics of DNA hybridization and
dehybridization. The effectiveness of the microbead array system towards
detecting the subtle melting temperature differences associated with different
nearest neighbors to a single mismatch is very high as seen in Figure 2.3. The
fluorescence intensity recorded for the exposure of Target-G’ to the 3 different

33
capture beads is shown in Figure 2.3A. Here the initial non-specific signal
accumulated within the bead and the adjacent well region is seen to wash away
rapidly with buffer flow yielding the above specified high signal ratio for the
complement to that of the single nucleotide mismatch at the 3.0-3.6 min time
interval. These observations are consistent with the fact that the calculated
melting temperature (Tm) for the hybridization of Target-G’ with its complement
(DNA-cap-G) is 69.5˚C whereas the same value for the two base pair (DNA-cap-
R) and one base pair (DNA-cap-B) mismatched sequences are found to be 48.1
and 57.3˚C, respectively.
The selectivity and temporal capabilities of the chip-based microbead
approach is further explored from an evaluation of the relative fluorescence
intensity versus time for the same bead-based capture sequences when exposed to
Target-B’ as shown in Figure 2.3B. In this particular case, the array consists of
bead sets with the complement alongside two different sets of single nucleotide
mismatches. Upon exposure to the Target-B’ labeled DNA sequence, the initial
intensity value recorded at time (0) for the complement (i) is found to be
substantially (≥ 25%) higher than either value for the two single mismatches (ii
and iii). Further, the rate at which the displacements occur is found again to be
dependent on the thermodynamic stability of the various hybridized structures.
For example, there are two different thermally stable G:G mismatches associated
with Target-B’ and the capture beads (DNA-cap-R and DNA-cap-G). Due to the
influence of nearest neighbor base pairs, the G:G mismatch associated between
Target-B’ and DNA-cap-G is more thermally stable (with a Tm value of 65.0˚ C)

34
than the G:G mismatch with Target-B’ relative to DNA-cap-R (which has a Tm
value of 63.1˚C).71 Further, a comparison of the two complement cases [shown in
Figure 2.3A case (i) with that of Figure 3B case (i)] reveals that the two 18-mer
DNA target complements are displaced at different rates. Again, the observed
dynamics for displacements are consistent with the calculated Tm values [Tm is
69.5˚C for Figure 2.3A (i) and 69.2˚C for Figure 2.3B (i)]. Collectively, these
results reveal an excellent agreement between the DNA displacement dynamics
and the analysis of the melting temperatures for the various hybrid complexes.72
This ability to explore in a rapid and efficient manner subtle differences in
displacement dynamics for closely related DNA hybridized sequences sets this
integrated chip-based approach apart from the majority of the prior DNA
detection methodologies.
35
Figure 2.3: (A) Fluorescence intensity curves recorded as a function of time during buffer rinse for reaction of Target-G’ with all three DNA-capture sequences: (i) hybridization to the complement DNA-cap-G, (ii) discrimination from the C:C one base pair mismatch sequence DNA-cap-B, and (iii) discrimination from the G:G and C:C two base pair mismatch sequence DNA-cap-R. (B) Signal intensity curves recorded as a function of time during buffer rinse following the reaction of Target-B’ with all three DNA-capture sequences: (i) hybridization to the complement DNA-cap-B, (ii) discrimination from the highly stable G:G one base pair mismatch sequence DNA-cap-G, (iii) discrimination from the less stable G:G one base pair mismatch sequence DNA-cap-R. The buffer rinses were carried out using a flow rate of 2.5 mL/min with the high stringency solution.

36
2.3.4 Regeneration and Recirculation Capabilities
An attractive feature of the microbead array system with the associated
fluidics systems is its capacity to allow for rapid and convenient bead
regeneration. Upon completion of the multiplexed DNA assays, the same array
can be regenerated with the introduction of a solution of 90% formamide in TE
buffer (Figure 2.4). Subsequently, the same array can then be reacted with a
recirculating solution of the DNA analyte to reinduce hybridization. As seen in
Figure 2.4A, the signal from the microspheres with each incubation and
regeneration cycle attained comparable results. Each hybridization and
dehybridization cycle is completed in <10min. Figure 2.4B is a schematic
showing the miniaturized peristaltic pump and circulation loop coupled to the
chip cartridge which serve to drive the analyte and reagents into the bead
microreactor regions. These fluidics features allow for multiple passes of the
reagents past the active capture microbeads. Using similar procedures, the same
array can be recycled and used for numerous assays without any apparent loss in
sensitivity or selectivity. Trial to trial reproducibility studies (n = 4) are
established using identical samples, which yield coefficient of variance (CV)
values of ~5% between assay signals. For these experiments, the time evolution of
signal development is found to be dependent strongly on the recirculation flow
rates over the range of 0.1 to 5 mL/min that have been explored here. A consistent
trend is observed whereby more rapid flow rates yield faster DNA hybridization.
Multiple flow cycles can be used to limit the sample size volume. Likewise, the
recirculation capability not only shortens hybridization times, by improving mass
37
transport aspects of sample delivery, but also leads to increased sensitivity of the
microbead array (vide infra). Importantly, many of the typical problems
associated with the inefficiencies of reagent mixing61,63,73,74 and analyte
sequestration in microfluidics systems (where mixing of solutes is generally
driven by diffusion alone) are overcome with the integrated fluidics elements and
circulation loops. The advantage of using beads to promote efficient mixing in
microfluidic systems has been noted also recently by Crooks and co workers,64
whereby such spheres have been shown to promote both laminar and turbulent
mixing in restricted micro-channel environments. In the future, analogous studies
will be performed to elucidate the mass transport and diffusional characteristics of
this new microbead array system.
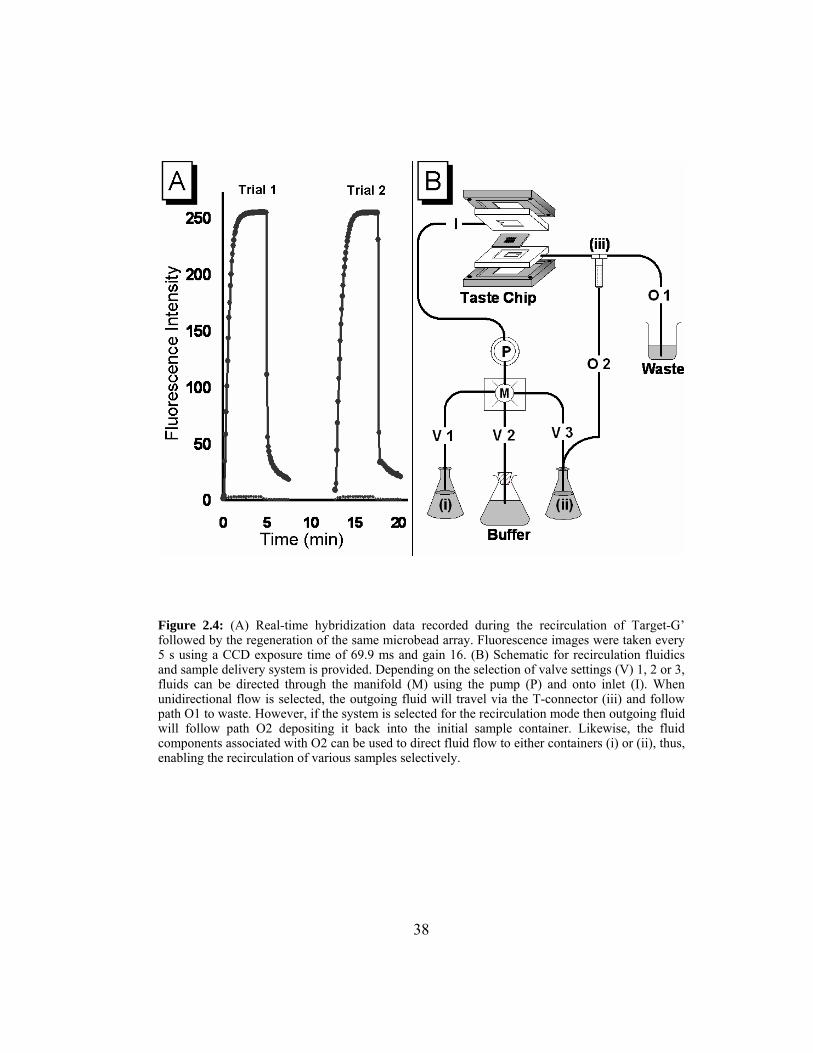
38
Figure 2.4: (A) Real-time hybridization data recorded during the recirculation of Target-G’ followed by the regeneration of the same microbead array. Fluorescence images were taken every 5 s using a CCD exposure time of 69.9 ms and gain 16. (B) Schematic for recirculation fluidics and sample delivery system is provided. Depending on the selection of valve settings (V) 1, 2 or 3, fluids can be directed through the manifold (M) using the pump (P) and onto inlet (I). When unidirectional flow is selected, the outgoing fluid will travel via the T-connector (iii) and follow path O1 to waste. However, if the system is selected for the recirculation mode then outgoing fluid will follow path O2 depositing it back into the initial sample container. Likewise, the fluid components associated with O2 can be used to direct fluid flow to either containers (i) or (ii), thus, enabling the recirculation of various samples selectively.
39
2.3.5 Three Dimensionality of Bead Microreactors
While Walt and co-workers have previously demonstrated impressive
bead-based DNA detection capabilities using fiber optic methods, prior work in
this area has been completed under conditions where signal generation is
localized at the surface of bead spheres.26,27,75,76 In addition to the rapid, high
fidelity DNA nucleotide discrimination afforded by the new chip-based bead
array here described, it is apparent that the porous nature of the microbead
provides added benefits in terms of the intrinsic sensitivity of the approach. For
example, upon introduction of the target analyte, measurable signals above
background are recorded almost immediately even with the use of conventional
illumination sources. The signal intensity continues to grow with time as more
DNA analyte becomes sequestered by the radial penetration within the bead
microreactor. Analysis of the DNA hybridization characteristics as explored by
confocal microscopy confirms the conjecture that analyte is capable of penetrating
deeply into the core region of the bead. Figure 2.5 shows a series of fluorescence
micrograph slices obtained from confocal analysis after a solution (4 µM) of
Target-G’ is introduced to the bead (DNA-cap-G) at 2 mL/min for 10 min. Even
at this early time period, the analyte has penetrated ~50 µm into the interior region
of the microsphere. These results clearly show that the bead-based system
provides much higher signaling capacity relative to planar approaches. Similar
advantages of 3-dimensional volume elements for agarose films and
polyacrylamide gel pads have been reported for glass substrate supported
systems.29,77 However, these prior 3-dimensional capture approaches lacked the

40
active integrated flow delivery and recirculation capabilities that are associated
with the electronic taste chip approach here described. Closer inspection of the
confocal image stack reveals a 4-fold symmetry observed for the DNA
penetration characteristics in Figure 2.5B, suggesting the bead remains spatially
and rotationally frozen in the etch pit for the entire duration of the sample
introduction phase. While only at the initial stages of development, these confocal
studies using labeled DNA targets reveal interesting information related to bead-
channel microfluidic transport phenomena as well as diffusional/mass transport
effects within porous bead matrices. Further, the radial dependence of DNA
capture (i.e. the penetration depth) from various fluids as well as the influence of
optical reflections from the etch pit structures will be used in the future as another
variable to extract additional sequence specific information. Fundamental and
practical applications exploiting these phenomena are now being investigated.

41
Figure 2.5: (A) Schematic showing position of microbead in fluid cell during imaging of optical confocal slices 1-9. (B) Confocal images showing the penetration of a solution of (4 µM) Target-G’ after 10 min of exposure at 2 mL/min to the microbead array. Optical slices 1-9 (parallel to top surface of silicon chip) are indicative of the images taken in the z-direction from the top of the microbead to the bottom. The Medial (M) slice is approximately 130 µm from the Top (T) and Bottom (B) slices. Progress through confocal slices Top (T) through Medial (M) to Bottom (B) of the microbead reveals the 4-fold symmetry exhibited by the DNA penetration. This pattern is suggestive of a ‘shadow effect’ caused by the interaction of the lower half of the bead with the walls of the pyramidal pit where restricted DNA access is observed.

42
2.3.6 Assay Sensitivity
Finally, measurement of the bead-based DNA assay sensitivity
characteristics remains an important issue for any viable new direct DNA
detection approach. Here the measured array-based sensitivity defines the
minimum amount of detectable DNA analyte that can be reproducibly detected by
the system. The sensitivity of the approach depends on the ratio of analyte signal
to that recorded for the background. To determine assay sensitivity factors, dose
dependent signals are recorded using the same array described above which is
exposed in this case for 40 min to 1.5 mL samples containing various
concentrations of Target-G’ over the range of 10-6 M to 10-13 M concentrations.
The limit of detection, defined as the minimum concentration which yields a
signal 3 standard deviations above the zero concentration blank, is found to be
~10-13 M (10-16 moles) as shown in Figure 2.6. This limit of detection value is
competitive with the best prior values reported previously as recorded for planar
DNA,15,78 gel pad,29,79 bead-fiber-optic26,27 and nanoparticle based
approaches.65,66,80 Further, a particularly attractive feature of the new microbead
array approach is the speed at which the assays are completed (5-40 min). Typical
hybridization times of 4-12h have been required for the alternative approaches to
reach low detection thresholds using synthetic short sequence oligomers.26,29,66
While longer DNA sequences are expected to be resolved over longer time scales
than here reported,81 the excellent discrimination capabilities and efficient
transport properties of the bead-array system bodes well for the future expansion

43
of this approach to more complex sample matrices, as well as longer
oligonucleotide sequences (studies of this type are now in progress).
Figure 2.6: Fluorescence intensity of DNA target bound as a function of concentration of target DNA. This dose dependent data was recorded after exposure of varying concentrations of Target-G’ to the microbead array containing three columns of DNA-cap-G coated microbeads. Fluid sample was recirculated at 4 mL/min for 40 min. Fluorescence intensity counts were recorded after buffer rinse (20mM Tris-HCl, 300mM MgCl2) using CCD parameters of 1.53s exposure time.
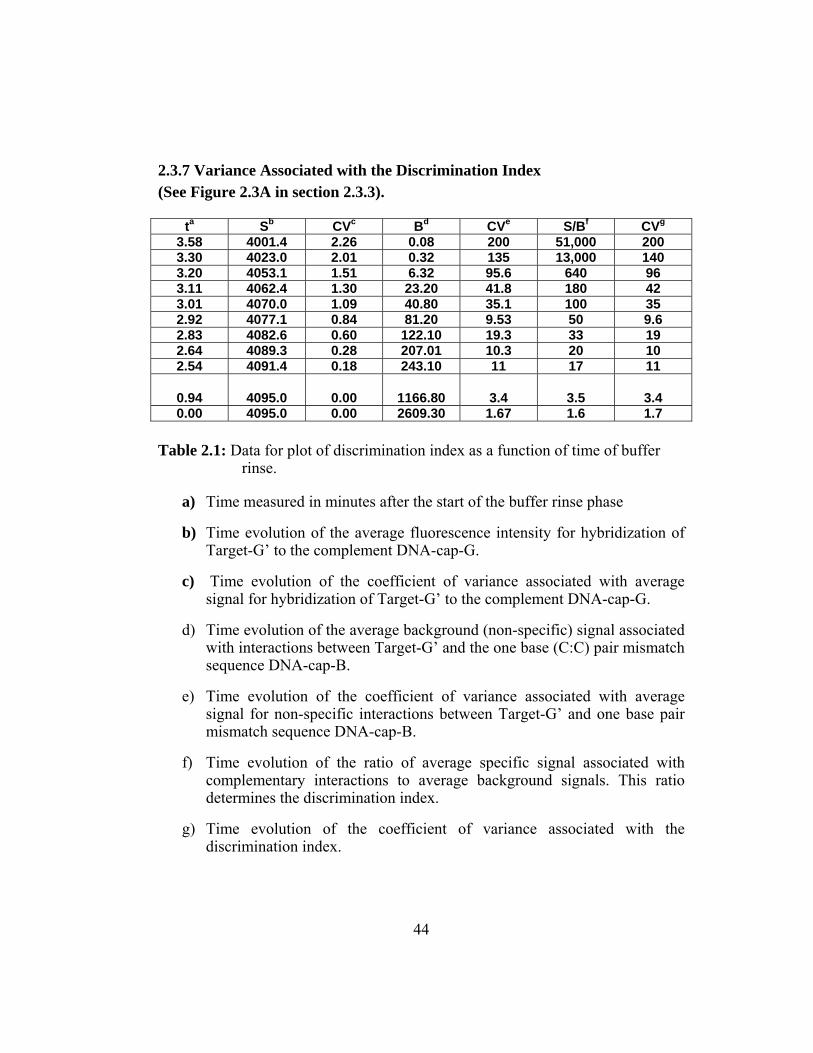
44
2.3.7 Variance Associated with the Discrimination Index (See Figure 2.3A in section 2.3.3).
ta Sb CVc Bd CVe S/Bf CVg 3.58 4001.4 2.26 0.08 200 51,000 200 3.30 4023.0 2.01 0.32 135 13,000 140 3.20 4053.1 1.51 6.32 95.6 640 96 3.11 4062.4 1.30 23.20 41.8 180 42 3.01 4070.0 1.09 40.80 35.1 100 35 2.92 4077.1 0.84 81.20 9.53 50 9.6 2.83 4082.6 0.60 122.10 19.3 33 19 2.64 4089.3 0.28 207.01 10.3 20 10 2.54 4091.4 0.18 243.10 11 17 11
0.94 4095.0 0.00 1166.80 3.4 3.5 3.4 0.00 4095.0 0.00 2609.30 1.67 1.6 1.7
Table 2.1: Data for plot of discrimination index as a function of time of buffer rinse.
a) Time measured in minutes after the start of the buffer rinse phase
b) Time evolution of the average fluorescence intensity for hybridization of Target-G’ to the complement DNA-cap-G.
c) Time evolution of the coefficient of variance associated with average signal for hybridization of Target-G’ to the complement DNA-cap-G.
d) Time evolution of the average background (non-specific) signal associated with interactions between Target-G’ and the one base (C:C) pair mismatch sequence DNA-cap-B.
e) Time evolution of the coefficient of variance associated with average signal for non-specific interactions between Target-G’ and one base pair mismatch sequence DNA-cap-B.
f) Time evolution of the ratio of average specific signal associated with complementary interactions to average background signals. This ratio determines the discrimination index.
g) Time evolution of the coefficient of variance associated with the discrimination index.

45
Figure 2.7: The discrimination index is plotted as a function of time following the start of the rinse phase. This discrimination index is obtained using the raw fluorescence intensity values for the specific signal associated with Target-G’and DNA-cap-G to the non specific background signal associated between Target-G’ and DNA-cap-B. The discrimination index represents the ratio of signal recorded for the specific signal versus the non-specific signal. With the progression of the wash step the ratio of specific signal to background and the associated variance increases exponentially.

46
2.4 SUMMARY AND CONCLUSIONS
In conclusion, this work serves to extend the analyte diversity of the
electronic taste chip approach while at the same time documenting a number of
advances for array-based DNA detection in the following areas: (1) A simple and
rapid approach has been described which affords the incorporation of DNA
capture probes into porous microbeads. (2) The porous beads micro-environment
allows for high sequence detection efficiency and extends in an important way the
capability of such systems relative to conventional planar DNA microchips. (3)
The microbead array offers the capability of multiplexed oligonucleotide assays,
since each microbead in an array can be sensitized so as to capture a specific
target sequence. This DNA multiplexing capacity extends the prior multiplexing
abilities of the same taste chip approach as demonstrated using acids, metal
cations, proteins and antibodies.22 (4) The inclusion of microfluidic channels and
micro-drains at the bottom of the wells that house the beads allows for the rapid
delivery of the DNA containing analytes. The integrated fluid transport and bead
microreactors foster the completion of rapid assays making the methodology
suitable for use in high throughput DNA detection applications requiring analysis
of ≤ 102 DNA sequences. (5) The ability to recycle the multiplexed arrays along
with an automated fluidics system allows for more rapid optimization of complex
DNA detection applications. (6) Hybridization times on the order of minutes with
point mutation selectivity factors greater than 10,000 and limit of detection values
of ~10-13 M are obtained readily with this microbead array system. (7) The 3-
dimensionality along with a chromatography-like sequestration features exhibited

47
by the capture beads affords both purification and long signal path length (>
50µm) generation capacities that are lacking with conventional current generation
planar chip approaches. (8) Features such as the short hybridization times, small
sample volumes, high sensitivity/selectivity assay characteristics and simple
optical readout strategies associated with the DNA microbead array systems here
described are suitable for use with simple hand-held reader units as may be
required for various important future DNA detection applications.53

48
Chapter 3: Elucidation of Molecular Interactions within the Microbead Matrix
3.1 INTRODUCTION
With the growth of immobilized biological sensors, geared towards the
recognition of proteins and nucleic acids, it becomes useful to define the complex
interactions occurring between the molecules and their tethered environment. The
salient progress of microarray based rapid lab-on-a-chip schemes has included
such areas as genomics screening leading to disease diagnosis, gene mapping,
nucleic acid sequencing82-85 as well as various antibody-based capture strategies
for the recognition of important biomarkers.86 Although, most efforts described
here have availed the attributes of a planar surface, the trend towards satisfying
the necessity for high binding capacity sensors has embraced the utility of porous
high surface area polymer ensembles.87-89 The capabilities of polymeric matrices
within the lab-on-a-chip format allows for a rapid upgrade to three-dimensional
structures within varied approaches such as microspheres, gel pads and agarose
films. These adaptations have allowed not only higher binding capacities, but
have also included contributions towards a more homogeneous environment for
the capture of bio-molecules. Some such approaches include gel pad arrays with
immobilized nucleic acid probe sequences and fluorescence based target detection
with hybridization response times of 4-12h and detection thresholds of ~10-10M,
49
30,86 as well as fiber-optic based bead approaches with multiplexed detection
capabilities and 12-17h hybridization times.26 Thus, the fidelity of the porous
polymeric structures for the detection of biological molecules such as nucleic
acids and proteins has been established.26,86,87,90However, few extensive
fundamental explorations within three-dimensional polymers have been
undertaken with regards to signal acquisition and analytical sensor development.
In order for the successful evolution of polymeric biosensors, it is necessary to
elucidate the fundamental interactions and transport mechanisms occurring within
these complex porous structures.
The ‘electronic taste chip’ utilizes a three-dimensional polymer matrix as
the core component of the sensing strategy. A facile, yet highly effective approach
to immobilize probe molecules of relevance to an array of high binding capacity
polymer microspheres, has resulted in the detection of various classes of analytes.
This microbead array has also shown remarkable sensitivity and specificity for the
recognition of short oligonucleotides as described in Chapter 2.23 The importance
of characterizations for immobilized surfaces has induced the focus to be directed
towards more basic explorations of the complex interactions within the bead
matrix. In addition to the polymer, the taste chip platform utilizes an integrated
pressure driven fluid delivery component that lends itself to active transport of
analytes within the bead sensor. Thus, the conjunction of the bead and fluid
delivery components lead to interesting transport properties within the taste chip
platform. As a result, the explorations mentioned herein will involve some
elucidations into the DNA based molecular interactions occurring within the

50
‘electronic taste chip’. These studies will strive to provide a detailed view into the
external and internal factors affecting nucleic acid hybridization and subsequent
signal acquisition within the bead matrix.
3.2 EXPERIMENTAL SECTION
3.2.1 Reagents
The oligonucleotide sequences and their complements were purchased
from Integrated DNA Technologies, Inc (Coralville, IA). The lyophilized DNA
samples were reconstituted with DI H2O. Aldehyde-terminated agarose
microbeads were purchased from XC Corporation (Lowell, MA). Hybridization
buffer contained 20mM Tris-HCl (Sigma Chemical Co.) and 300mM MgCl2
(Mallinckrodt AR) pH 7.8, unless otherwise mentioned.
3.2.2 DNA Functionalization
Avidin was coupled to the aldehyde-terminated agarose microspheres via
reductive amination. The method involves forming initially reversible Schiff’s
base complexes between the aldehyde functional groups found throughout the
microbeads (500 µL) and the amine residues of the glycoprotein avidin (300 µL)
(Pierce) in carbonate buffer, pH 9.6 (640 µL), to form initially reversible Schiff’s
base complexes. Subsequently, the Schiff’s complexes were selectively reduced
and stabilized so as to form covalent linkages using sodium cyanoborohydride (60
µL). A solution of 1% Triton-X (Sigma Chemical Co.) was also included in the
reaction volume. The biotinylated molecular beacon sequences (concentrations as
specified below) (20 µL) were reacted over a period of 12 hrs with the avidin
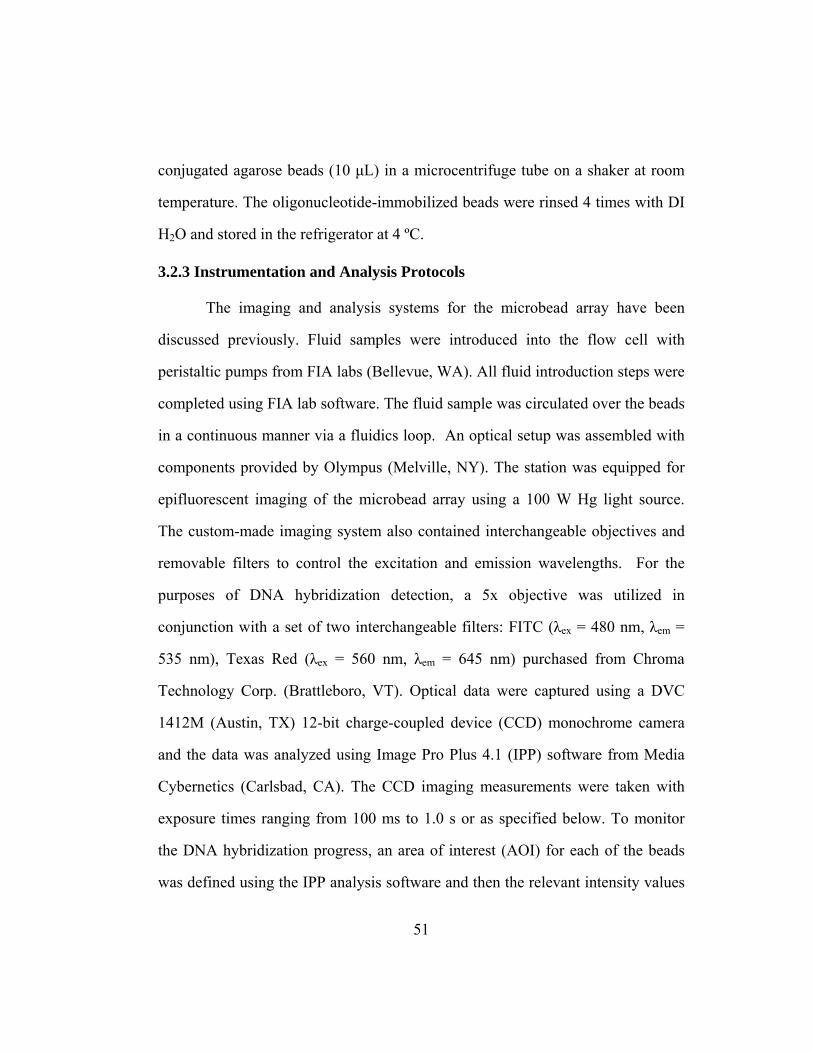
51
conjugated agarose beads (10 µL) in a microcentrifuge tube on a shaker at room
temperature. The oligonucleotide-immobilized beads were rinsed 4 times with DI
H2O and stored in the refrigerator at 4 ºC.
3.2.3 Instrumentation and Analysis Protocols
The imaging and analysis systems for the microbead array have been
discussed previously. Fluid samples were introduced into the flow cell with
peristaltic pumps from FIA labs (Bellevue, WA). All fluid introduction steps were
completed using FIA lab software. The fluid sample was circulated over the beads
in a continuous manner via a fluidics loop. An optical setup was assembled with
components provided by Olympus (Melville, NY). The station was equipped for
epifluorescent imaging of the microbead array using a 100 W Hg light source.
The custom-made imaging system also contained interchangeable objectives and
removable filters to control the excitation and emission wavelengths. For the
purposes of DNA hybridization detection, a 5x objective was utilized in
conjunction with a set of two interchangeable filters: FITC (λex = 480 nm, λem =
535 nm), Texas Red (λex = 560 nm, λem = 645 nm) purchased from Chroma
Technology Corp. (Brattleboro, VT). Optical data were captured using a DVC
1412M (Austin, TX) 12-bit charge-coupled device (CCD) monochrome camera
and the data was analyzed using Image Pro Plus 4.1 (IPP) software from Media
Cybernetics (Carlsbad, CA). The CCD imaging measurements were taken with
exposure times ranging from 100 ms to 1.0 s or as specified below. To monitor
the DNA hybridization progress, an area of interest (AOI) for each of the beads
was defined using the IPP analysis software and then the relevant intensity values
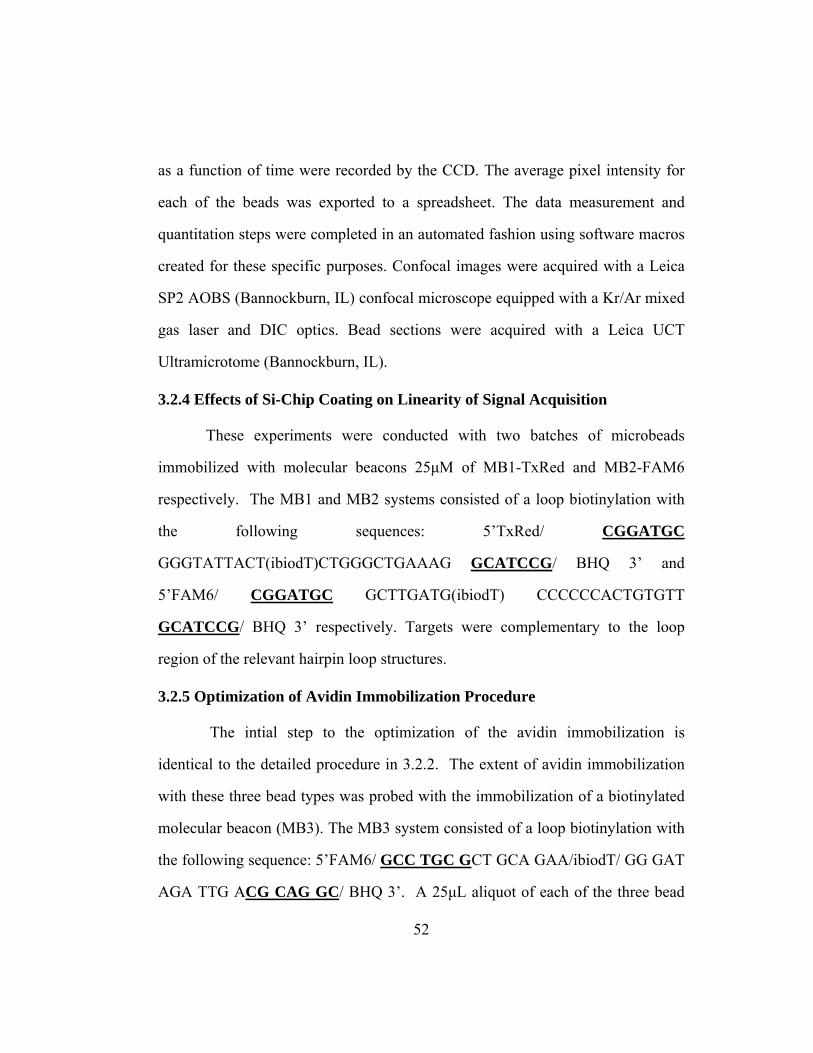
52
as a function of time were recorded by the CCD. The average pixel intensity for
each of the beads was exported to a spreadsheet. The data measurement and
quantitation steps were completed in an automated fashion using software macros
created for these specific purposes. Confocal images were acquired with a Leica
SP2 AOBS (Bannockburn, IL) confocal microscope equipped with a Kr/Ar mixed
gas laser and DIC optics. Bead sections were acquired with a Leica UCT
Ultramicrotome (Bannockburn, IL).
3.2.4 Effects of Si-Chip Coating on Linearity of Signal Acquisition
These experiments were conducted with two batches of microbeads
immobilized with molecular beacons 25µM of MB1-TxRed and MB2-FAM6
respectively. The MB1 and MB2 systems consisted of a loop biotinylation with
the following sequences: 5’TxRed/ CGGATGC
GGGTATTACT(ibiodT)CTGGGCTGAAAG GCATCCG/ BHQ 3’ and
5’FAM6/ CGGATGC GCTTGATG(ibiodT) CCCCCCACTGTGTT
GCATCCG/ BHQ 3’ respectively. Targets were complementary to the loop
region of the relevant hairpin loop structures.
3.2.5 Optimization of Avidin Immobilization Procedure
The intial step to the optimization of the avidin immobilization is
identical to the detailed procedure in 3.2.2. The extent of avidin immobilization
with these three bead types was probed with the immobilization of a biotinylated
molecular beacon (MB3). The MB3 system consisted of a loop biotinylation with
the following sequence: 5’FAM6/ GCC TGC GCT GCA GAA/ibiodT/ GG GAT
AGA TTG ACG CAG GC/ BHQ 3’. A 25µL aliquot of each of the three bead
53
types was immobilized with 50µL of a 100µM concentration of the beacon
overnight respectively. The beads were then rinsed in T.E. buffer 4 times and
stored in 4 °C.
3.2.6 Investigate Immobilization Conditions within Polymer Microsphere
The probe immobilization studies in Figure 3.4 were conducted with a
10µM probe density of MB1-TxRd (sequence in section 3.2.4) and a 0.1µM
(1350µL) 100bp target (T1-100) complementary to the loop region of the
molecular beacon. Figure 3.4A details the epi-fluorescent image captured at a
camera exposure of 100ms after the 1hr incubation under recirculation of target
T1-100 with an array of 10µM MB1-TxRd beads. Figure 3.4B, shows the medial
slice from confocal microscopy images taken of the beads reacted in (A). The
optical slices were acquired at 5µm slices. Figure 3.4C, details the epi-fluorescent
images (4s camera exposure) taken of 10µm microtomed slices of the beads from
(A). The beads were cryofrozen and microtomed into 10µm slices which were
transferred to a microscope slide and fixed with aquamount purchased from
Polysciences (Warrington, PA) to retain the fluorescent signal.
3.2.7 Patterns of Signal Acquisition
Sequestration studies in Figures 3.7 and 3.9 were conducted on
microspheres immobilized with 50µM P2-20 (Table 3.1) and complementary
target T2-21. Figure 3.7 details data from flow rates of 0.1, 5, 7 and 10mL/min all
with the recirculation of 0.01µM (500µL) solution of T2-21 through an array
consisting of 50µM P2-20 beads. These images were captured at a rate of one
frame per 300s with a camera exposure of 500ms. Figure 3.9 (insert) shows the

54
immobilization of 1µM (500µL) of T2-21 with an array of P2-20 beads under
recirculation and with a single flow through both at 0.1mL/min. Camera exposure
of 45ms were used to acquire these images at image capture rates of one frame
per 15s and one frame per 300s for single flow through and recirculation
conditions respectively. Figure 3.9 details data from flow rates of 0.1, 5 and
10mL/min all with the recirculation of a 1µM (500µL) solution of T2-21 through
an array consisting of 50µM P2-20 beads. These images were captured at a
camera exposure of 45ms at an image capture rate of one frame per 300s.
3.2.8 Effects of Porosity on Radial Penetration
The following 4% superporous and homogeneous beads were prepared by
Jorge Wong. Superporous agarose beads were prepared with a 4% agarose
solution by a ‘double emulsification’ procedure. An amount of 2g of agarose
powder (Sigma Chemical Co.) was dissolved in 50mL water by gently boiling the
mixture for a few minutes with occasional stirring. The agarose solution was
transferred to a 50 ºC bath and stirred at 1000 rpm. A mixture of 0.7 mL Tween
80 and 20 mL hexanes stabilized at 50 ºC was added to the agarose solution and
stirring proceeded for 2 min. A 50 ºC suspended solution was prepared by
dissolving 8.5mL Span 85 in hexanes to obtain a final volume of 150mL. The
suspended solution was added to the agarose suspension. Stirring continued for 1
min at 1000 rpm after which time the rate was readjusted to 600 rpm and the
mixture was removed from the 50 ºC bath. Stirring continued until the
temperature dropped to 25 ºC at which point water was added to the mixture and

55
stirring stopped. Beads were collected in metal screens and washed with water.
The bead size fraction 250-280µm was separated with metal screens and the beads
were washed with a 50/50 mixture of ethanol/water and finally with water. The
agarose beads were stored at 4 ºC.
Homogeneous agarose beads were prepared by emulsifying a 4% agarose
solution. An amount of 2 g of agarose was dissolved in 50 mL water by boiling
the mixture for a few minutes with occasional stirring. A suspending solution
made of 10 mL Span 85 diluted to 100 mL in hexanes was heated to 60 ºC and
stirred at 900 rpm. The polysaccharide solution was allowed to stabilize at 60 ºC
and then poured into the suspending solution. Stirring proceeded at 900 rpm at 59
ºC. After 1 min the stirring speed was adjusted to 600 rpm, heating stopped and
the agarose left to gel into small beads as the temperature dropped to 25 ºC. Beads
were collected on a sieve and washed with water. Sorted through metal screens
the 250-280 µm beads fraction was collected and washed with a mixture of 50/50
ethanol/water and finally with water. The beads were kept in water at 4°C.
The homogeneous and superporous beads from Figure 3.14 were
immobilized with 50µM of P2-20 (See Table 3.1). A 1µM (500µL) solution of
T2-21 was recirculated through the microbead array at 1.5mL/min. The intial
image capture rate was at one frame per 2s for a total of 60 frames followed by
one frame per 120s till the signal saturation.

56
3.3 RESULTS AND DISCUSSION
The efficacy of the microbead array for the sensitive and selective
detection of short nucleotides has been shown previously.23 These studies had
served to establish the fidelity of the taste chip platform as an effective nucleic
acid sensor. Thus, it becomes necessary to extend these studies and gain a
molecular level understanding into the heterogeneous phase reaction dynamics of
the electronic taste chip in order to aid the advancement of the platform. Several
parameters embodying the taste chip platform could lend themselves to affecting
signal acquisition. Although, the microbead array approach has been extensively
discussed,92 it is useful here to outline the basic components within the platform
in order to delineate the signal acquisition parameters. The core of the microbead
array is the polymer bead sensor element which serves as the location for probe
immobilization. Bulk MEMS micro-etched methods are used to expose the Si-
111 surface and create pyramidal pits of ~500 x 500 µm on top and ~120 x 120µm
on bottom. The top openings serve to allow for the placement of the sensor
element and the bottom openings serve as a drain for fluid delivery. A silicon
wafer consisting of chemically etched transwafer wells serves to contain the bead
sensors and thus comprises of the microbead array, Figure 3.1A. The wafer is
capable of accommodating array sizes of 3X4 upto 5X7 with simultaneous bead
sensor analyses. Since, the bead sensors can be tailored to be specific for a wide
range of molecules, the capability of isolating a single bead within a single well
allows for the multiplexed detection capability of varied classes of molecules
within an array. Furthermore, the etched silicon wafer, containing the

57
microspheres is enclosed in between an assembly of fluid delivery components
which allow for both the encapsulation of the silicon wafer and for the delivery of
reagents to the sensor elements, 3.1B. Additionally, the optical transparency of
the PMMA components in conjunction with the pyramidal well openings allows
for either the transmission of light through the polymer microspheres for
absorbance based quantitative measurements or rapid epi-fluorescence events to
be measured with the help of dichroic filters, 3.1C. These separate components
are encased within an aluminum structure to complete a flow cell, which serves to
maintain the integrity of the desired fluid path by allowing fluid delivery o the top
of the array through the sensor microspheres and out via the base to a
recirculation valve or to waste. The fluid delivery component serves to introduce
a hydrodynamic approach to the delivery of reagents to the sensor bead and thus
separate the microbead array from strategies relying solely on the diffusion of
reagents.

58
Fgure 3.1: (A) A scanning electron microscope image of etched pyramidal wells within the silicon chip. The well openings allow for the localization of the micro-spherical sensor elements. (B) A schematic depicting the components of the fluid delivery module. The PMMA disks consist of chemically inert high pressure tubing (PEEK) fitted within machined channels. The channels extend through the depth of the disks to exit in the x-y plane of the silicon wafer. Thus fluid is delivered via the PEEK tubing of the top PMMA insert to the sensor array and concomitantly, the fluid exits the sensor array through the tubing contained within the bottom insert. The two PMMA disks are affixed with a layer of polyvinyl tape which serve as gaskets and provide structural support to the silicon wafer. The polyvinyl tapes contain openings which frame the array, thus allowing for the transmission of light. (C) Schematic of epi-fluorescent setup for measurement of fluorescent signal from the microbead. (a) Monochromatic light source hits the dichroic (b) which filters light specifically to the excitation wavelength. The excitation source is directed to the bead situated inside the (d) silicon well. The emitted light from the bead is reflected back to the dichroic where any stray light is filtered and the emission wavelength is sent to the detector(c). The fluorescence from the microsphere is reflected back from the wall of the silicon well (e) if the wafer is not coated with a non-reflective layer of SiN3. (D) Schematic of Top view of microbead (a) in the silicon well. The excitation and emission reflections (b) off of the walls of the silicon amplify the total signal contained within the microsphere.
59
3.3.1 Effects of Si-Chip Coating on Linearity of Signal Acquisition
As mentioned above, the purpose of the etched silicon wafer is to aid in
the containment and isolation of a single microsphere within an etched well. The
well ensures the specificity of a single bead independent from the rest of the array
as well as aids in reducing sample volume by allowing for an effective drain for
excess analytes. The truncated pyramidal well, housing the microsphere allows
for the passage of either transmitted light through the bead or reflected
fluorescence from the microsphere to be quantitated. As seen in Figure 3.1C, the
schematic depicts how a specific fluorophore immobilized within the microsphere
is excited with the optimal wavelength of light from a mercury light source with
the use of selective excitation and dichroic filters. The dichroic is the key in also
allowing only the fluorescent reflected light emitted from the microsphere to be
specifically channeled to the detector. Although the purpose of the silicon wafer is
an integral component of the microbead array, it poses as an external factor
influencing the epi-signal transduced from the microspheres. The excitation light
and the fluorescent signal reflected from the microbead to the detector pathway
are also reflected off the ‘shiny’ walls of the silicon micro well, Figure 3.1D.
These surfaces are ultra-flat and created as a result of the anisotropic etch process
of the Si bulk machining that leads to the selective exposure of the Si-111 surface.
This mirrored reflection provides an effective signal amplification of the
fluorescence signal processed from the microbead. Although, a physical means to
amplify effective signal intensities is a possible attribute, the loss of distinct
permeation effects in addition to non-linear patterns of signal acquisition reduce

60
the fidelity of the amplified signal. A possible strategy to reduce the reflections is
to chemically coat the silicon wafer with a substrate that helps absorb the
reflected light. The suggested strategy was undertaken with a silicon nitride
coating of the wafer where varied coating thicknesses yielded various levels of
‘anti-reflectivity’. Figure 3.2, details the effects of the reflective and anti-
reflective wafer on the total signal emitted from a microbead for two
fluorophores. As seen in Figure 3.2, A and B, the top row of both panels detail the
effective signal acquisitions with a reflective (non-coated) wafer of two molecular
beacons immobilized to Texas Red and Fam6 respectively. Consecutively, the
bottom rows of both panels detail the fluorescent signal generated from the
microbeads placed in a non-reflective (coated) wafer. The images were acquired
after the hybridization of 1µM target specific to the immobilized molecular
beacons MB1 (Texas Red) and MB2 (Fam6) within panels A and B, respectively.
The columns within each panel require the use of different CCD camera exposure
times. As seen from the photomicrographs and their corresponding intensity
topomaps, the reflections from the silicon walls magnify the effective
fluorescence seen within each bead. The various problems associated with the
reflected wafers are identified with both fluorophore emissions. The continued
signal saturation viewed for MB1 (panel A, right most column) in direct contrast
to that of the non-reflective microspheres could lead to a reduced dynamic range
for a titration curve with the reflective wafers. Additionally, detailed permeation
effects of various sized targets within the bead would be lost with the amplified
signal resulting from the reflective chips. The Fam6 conjugated molecular
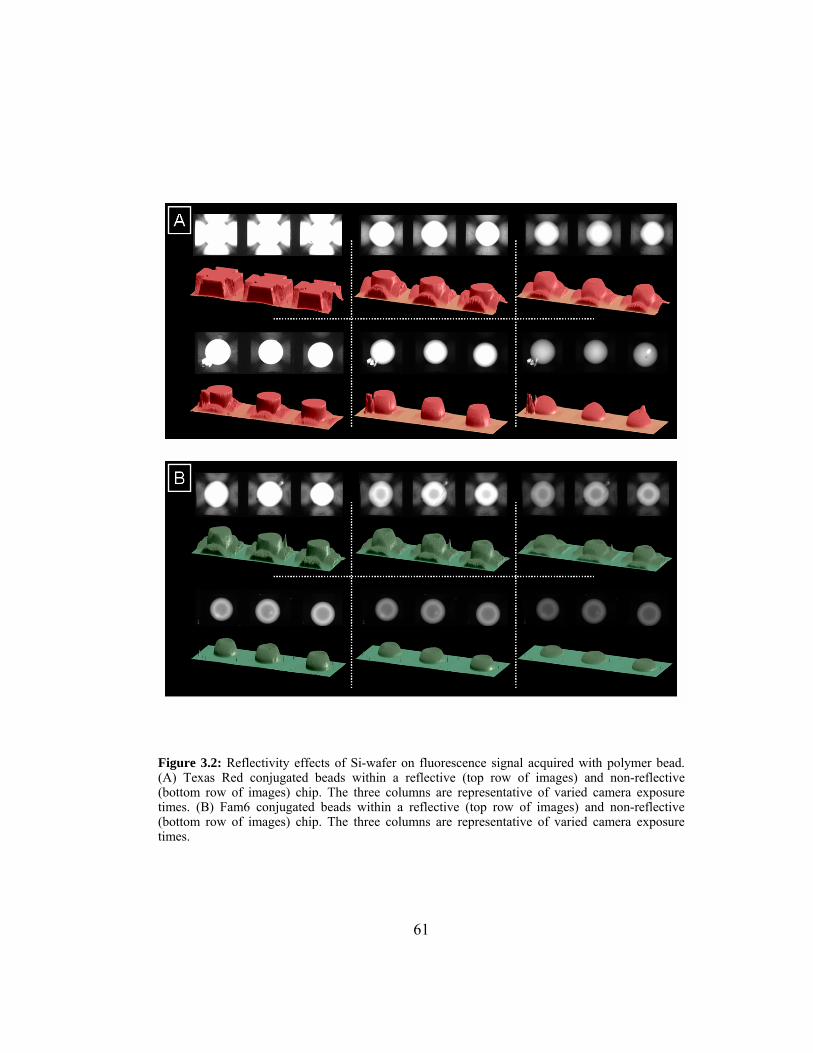
61
Figure 3.2: Reflectivity effects of Si-wafer on fluorescence signal acquired with polymer bead. (A) Texas Red conjugated beads within a reflective (top row of images) and non-reflective (bottom row of images) chip. The three columns are representative of varied camera exposure times. (B) Fam6 conjugated beads within a reflective (top row of images) and non-reflective (bottom row of images) chip. The three columns are representative of varied camera exposure times.

62
beacons immobilized on microspheres shown in Figure 3.2B, are indicative of the
effects on the bead penetration profiles. Not only is the dynamic range of the
assay narrowed, but any details into the permeation distance of the analyte to
isolate effective diffusion coefficients would be hindered with the reflective chips.
3.3.2 Optimization of Avidin Immobilization Procedure
The initial step to optimizing the microbead array towards nucleotide
hybridization was in confirming the efficiency of avidin biotin as a bridge for
probe immobilization to the bead. The importance of homogeneous
functionalization of avidin through the microsphere volume was realized and thus
explored. Figure 3.3 details the medial slices from a stack of confocal images
acquired after the immobilization of a biotinylated molecular beacon (MB3) to
avidin conjugated beads. The difference between these three images is the varied
avidin conjugation step of the procedure. The aldehyde functionalized beads
underwent direct protein conjugation and reduction of the resulting Schiff’s base.
However, the subsequent immobilization of the biotinylated molecular beacon
showed inefficient penetration within the bead matrix, 3.3A. The permeation
barrier could be attributed to either the inefficiency of penetration of the tagged
MB or the initial step of avidin conjugation to the bead matrix. Since the size of
the molecular beacon was ~12kDa with high immobilization concentrations, the
68kDa protein was hypothesized to be the rate limiting step in the immobilization
step. Immunohistochemistry in tissues and cells has precedence for the addition of
surfactants during the antibody labeling step for enhanced penetration through the
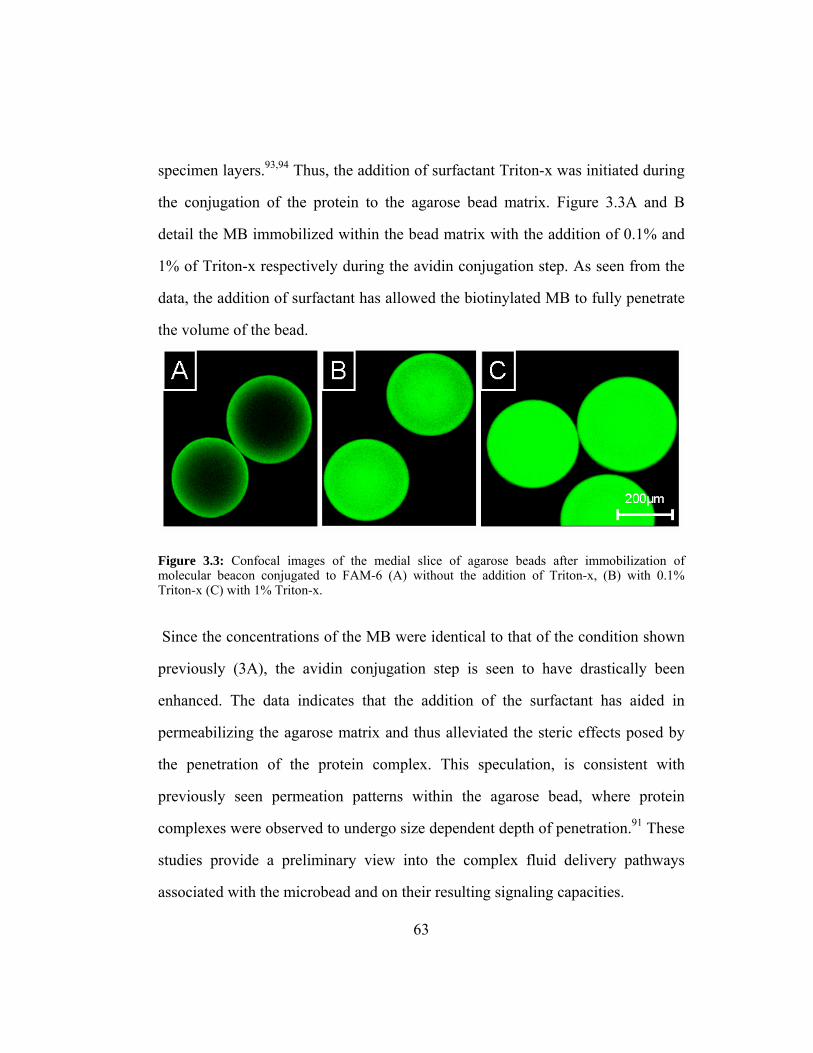
63
specimen layers.93,94 Thus, the addition of surfactant Triton-x was initiated during
the conjugation of the protein to the agarose bead matrix. Figure 3.3A and B
detail the MB immobilized within the bead matrix with the addition of 0.1% and
1% of Triton-x respectively during the avidin conjugation step. As seen from the
data, the addition of surfactant has allowed the biotinylated MB to fully penetrate
the volume of the bead.
Figure 3.3: Confocal images of the medial slice of agarose beads after immobilization of molecular beacon conjugated to FAM-6 (A) without the addition of Triton-x, (B) with 0.1% Triton-x (C) with 1% Triton-x.
Since the concentrations of the MB were identical to that of the condition shown
previously (3A), the avidin conjugation step is seen to have drastically been
enhanced. The data indicates that the addition of the surfactant has aided in
permeabilizing the agarose matrix and thus alleviated the steric effects posed by
the penetration of the protein complex. This speculation, is consistent with
previously seen permeation patterns within the agarose bead, where protein
complexes were observed to undergo size dependent depth of penetration.91 These
studies provide a preliminary view into the complex fluid delivery pathways
associated with the microbead and on their resulting signaling capacities.

64
3.3.3 Investigate Immobilization Conditions within Polymer Microsphere
3.3.3.1 Internal Optical Inefficiencies within Polymer Bead
In the evaluation of the permeation properties within the bead samples, it
is important to consider carefully past literature studies of the optical imaging
issues for such polymer microspheres. Investigations into the functionality
distribution within resin beads (PS, TentaGel, and controlled pore glass) shown
by Kress et al suggested that high bead loading conditions yield inefficient
fluorescence measurements.95 The work offered conclusions showing that at high
resin loading of a fluorophore, the fluorescence intensity profile of the bead
diameter appeared to contain a hollow in the core. Thus, fluorescence intensity
was emitted only from a certain thickness of the periphery of the bead forming a
‘doughnut’ shape image. The supporting explanation suggested that the dense
fluorescence signal from the periphery of the bead prevented the excitation light
from reaching the core and even if at the core, the subsequent emitted light would
undergo reabsorption due to a narrow Stokes shift. This cumulative phenomenon
would yield a bead image with a darker core suggesting incorrectly of inefficient
bead permeation of the fluorescent tag. These prior observations will be
considered in the context of more detailed studies of polymer microspheres which
serve as reactive particles and detection ensembles within the integrated fluidic
structures.

65
3.3.3.2Elucidating Ring Formation within Polymer Microsphere
Figure 3.4: (A)Epi-fluorescent image of molecular beacon immobilized agarose bead incubated with a complementary target within the flow cell. Image taken at 100ms camera exposure. (B) Optical slices of the middle three sections of a molecular beacon immobilized agarose bead incubated with a complementary target. Sections taken with a confocal microscope at 5µm intervals. (C)Epi-fluorescent images of microtomed slices of agarose bead immobilized with molecular beacon, incubated with a complementary target. Slices were ~10µm thick.
Figure 3.4 (A) shows a photomicrograph of beads immobilized with 10µM of
MB1 after having reacted with 0.1µM of a complementary target. Consistent with
the reabsorption explanation provided in the preceding section, the resulting
‘doughnut’ shaped fluorescent signal from 3.4A appears to have resulted in a
similar observation using the standard epi-imaging methodology. However, to
explore this issue more carefully, the beads from the hybridization experiment
were collected and analyzed with a confocal microscope, 3.4B. Although, the
radial images from the confocal replicated the periphery signal, the use of the
whole bead for the confocal measurements could allow for reabsorption artifacts
to appear. Thus, the beads were physically cut with a microtome into 10µm thick
slices and the slices were separately viewed with an epi-fluorescent microscope.
Figure 3.4C, details four slices from the microtomed bead samples. The consistent

66
presence of the ‘doughnut’ shape in the 10µm slices strongly suggest that the
periphery localized signal is more due to in complete probe or target permeation
and not due to fluorescence reabsorption artifacts, at least in this system. These
studies would seem to question the conclusions drawn from the prior studies.
More explorations are required to challenge the explanations of the prior studies
that were conducted with different conditions. However, the microtomed studies
here reported provide strong evidence for the restricted localization of reagents at
the bead exterior. These definitive measurements are key to obtaining a detailed
understanding of the reagent and analyte transport and capture processes within
the bead ensembles.
3.3.3.3 Probe Concentration Dependant Effects on Immobilization
Having established that the ‘doughnut’ formation was not due to internal
reflections, the natural progression was to elucidate the penetration depth of the
probe within the bead matrix. As aforementioned, the avidin immobilization
within the bead matrix was optimized with the addition of a surfactant to aid in
the permeation of the protein. Thus, a possible explanation for the
‘doughnut’effect within the microbead could also be attributed to inefficient
analyte permeation. Since the microbeads exhibiting the ‘doughnut’ formation
were immobilized with 10µM of MB1, a new batch of microspheres was
immobilized with 50µM of the same probe. Figure 3.5 shows the medial confocal
slices for the 50µM and 10µM probe immobilized beads. From an analysis of the
data, it is clear that there are striking differences between the two concentrations.
With the lower concentration, a doughnut structure is created suggesting

67
saturation of the exterior regions followed by a depletion of the probe. Once
localized, the molecular beacons remain fixed in their position of immobilization.
However, the conjugation step with the 50µM probe permeates the bead
efficiently in the 12 hours. It is interesting to notice that the permeation of
reagents into the bead matrix occurs in a systematic fashion with every outer ring
of peripheral binding sites being filled before the analyte moves through to the
core of the bead. This ‘moving boundary’ type of mass transport is especially
apparent since the fluorescence intensities measured by the line profile for the two
variations of beads are consistent with each other. Although, the probe has not
fully permeated the core of the 10µM bead type the peripheral signal is consistent
with the peripheral signal measured for 50µM probe immobilized bead. Moving
boundaries are typically associated with binding events exhibiting a high kinetic
rate constant which is expected from the biotinylated probe with the avidin coated
microsphere. These explorations into the permeation pattern within the bead help
further highlight the analyte binding events occurring within the microsphere.

68
Figure 3.5: Confocal microscopy medial slice images of agarose microspheres immobilized with (A) 50µM and (B) 10µM beacon. The representative line profile intensities are shown in (C) for 50µM and in (D) for 10µM bead types after a 12hr incubation.
3.3.4 Patterns of Signal Acquisition
An important parameter to explore and possibly elucidate within the signal
acquisition steps of the microbead array is the mass transport mechanism
occurring within the polymer bead. In traditional chromatography studies, the
transport of bio-molecules through the polymer matrix is predominantly
controlled by diffusion.96 Although the main component of the microbead array is
the polymer bead, the inclusion of a fluid delivery component introduces a
hydrodynamic feature to the transport dynamics. This feature widely separates
the transport properties of the microbead array from traditional diffusion limited
planar arrays 20,66 and other polymer based sensors.26,90 Since the diffusion
limited reaction times reduce the impact of elegant heterogeneous strategies for

69
nucleic acid hybridization, trends towards microfluidic alternatives with enhanced
reagent mixing and ‘forced’ analyte delivery have been furthered in efforts to
reduce the shortcomings of a non-convective transport system.64,97,98 However,
the microbead array is isolated in conjoining the immobilization of probes to a
high binding capacity spherical polymer with the pressure driven fluid flow
capability for analyte delivery. Consequently, the microbead array has previously
shown
Figure 3.6: Diffusion layer profiles exhibiting (A) planar diffusion within conventional electrodes, (B) radial diffusions within ultramicroelectrodes and (C) spherical diffusion also within ultramicroelectrodes.
hybridization times < 40min for the detection of short oligonucleotides with
sensitivities in the femtomoles.23 These times are in comparison with
hybridization times of 4-12h for arrays dependent solely on diffusional mass
transport.26,66,86 As a consequence the augmented reagent and analyte delivery
within the microbead array need to be further explored to delineate molecular
transport patterns within the sensor bead. Interestingly, it is seen that
microvoltammetric electrode systems provide analogous profiles to aid in the
comparison of forced fluid or diffusional mass transport between planar and
spherical surfaces. The development of ultramicroelectrodes was important to aid

70
in both the accessibility of measurement sites as well as to enhance the mass
transport to and from the electrode.99,100 Traditional electrodes which were larger
in size were seen to demonstrate mostly mass transport profiles perpendicular to
the surface resulting in planar diffusion, Figure 3.6 A. In contrast, disk or sphere
shaped ultramicroelectrodes exhibit radial (hemispherical) or spherical diffusion
profiles thus accelerating the response times between the species in solution and
the electrode surface by decreasing the effective diffusion radius of the depletion
layer, Figure 3.6 B and C. The hemispherical and spherical diffusion profiles are
able to continually regenerate the diffusion layer surrounding the electrode thus
reducing the influence of the concentration gradients on the surface of the
electrodes.101
Thus, these diffusion profiles could be extended to explain the planar array
based perpendicular diffusion limitations resulting in long hybridization times.
The microbead array mass transport patterns are more readily explained by a
spherical diffusion pattern improving transport by decreasing the effects of an
analyte concentration depletion layer. However, this initial explanation of planar
versus spherical diffusion profiles leading to mass transport disparities between
planar and bead based sensors is not sufficient to explain the effects of the forced
fluid delivery component within the microbead sensor. More analogous
conditions exist within systems with an added agitation or convective factor such
as rotating disk electrodes.101 These conditions serve to diminish the effects of the
depletion layer near the surface of the electrode and can be compared with higher
fidelity with the microbead array.

71
3.3.4.2 Depleting Conditions
Figure 3.7 details the hybridization profiles with four different flow rates
for the hybridization of 10nM of T2-21 with microbeads immobilized with 50µM
of P2-20. Under these target concentrations the trends observed clearly point
towards a combined convective and diffusion dependent flow. The hydrodynamic
dependence of the signal acquisition is highlighted by the flow rate dependent
Figure 3.7: Hydrodynamic influence on mass transport within microbead array.
profiles seen in Figure 3.7. The 0.1mL/min flow rate requires >300min to reach
95% saturation (see insert). This is in direct contrast with the 10mL/min flow rate
where the signal reaches 95% saturation at ~110min after recirculation of the
target solution. Additionally there exists a gradual trend for the four flow rates
72
probed, where both the initial rates of hybridization as well as the time taken for
signal saturation are affected by convective transport. The schematic in Figure
3.8 serves to establish a more detailed view of the transport mechanisms involved
with these varied flowrates. As aforementioned, the diffusion layer plays an
important role in the availability of reagents on the concentration gradient
occurring on the surface of the bead sensor. As seen in Figure 3.8A, at the slow
flow rates (A), the depletion layer is broader and thus reduces the availability of
reagents to the surface of the bead and thus affects the resulting concentration
gradients. However, at higher flow rates (B, and C) the utility of the integrated
fluidics system and resulting molecular flux is realized, in not only narrowing the
effective depletion distance but proportionally increasing the transport rate for
analyte delivery by allowing fresh reagents to be delivered to the surface of the
sensor. This trend is thus analogous to the convective mass transport
observations within electrochemical techniques for rotating disk electrodes where
rotation of the electrode causing

73
Figure 3.8: Diffusion or depletion layers around microsphere for (A) low analyte concentrations at slow flow rates, (B) low analyte concentrations at higher flow rates and (C) low analyte concentrations at fast flow rates as well as high analyte concentrations.
molecular flux ensures that the solution at the surface of the electrode is equal to
the bulk concentration thereby reducing the influence and size of the depletion
layer at the relevant interface.101 Similarly, within the microbead array, the
recirculated hydrodynamic flow allows rates for steady state to be enhanced with
increased flow rates.
3.3.4.1 High Concentration
At high analyte concentrations, the dependence on the hydrodynamic
component of the system is changed. Figure 3.9 details the hybridization profiles
with four varied flow rates for the hybridization of 1µM of T2-21 with
microbeads immobilized with 50µM of P2-20. Similar flow rates as the preceding
section were explored at these higher target concentrations. The consistent trends
for the varied flow rates are indicative of a diffusion driven mass transport
mechanism. The high concentration gradient is the primary driving force for the

74
reaction, with the convective fluid delivery having a secondary effect. The
diffusion layer around the microsphere is narrow and does not affect the
concentration gradient of the reaction with the probes on the bead. This is due to
primarily the high concentration of complementary analyte and secondly due to
the recirculating fluid delivery. Further studies were also undertaken to establish
the efficiency of a recirculation loop versus a single flow through solution of the
same volume. Microbeads immobilized with 50µM of 20mer probe P2-20 were
contained in the array and hybridized with the complementary target T2-21
conjugated to a fluorophore. Figure 3.9 insert details two data sets, signal
acquisition with either a single flow through at 0.1mL/min of a 1µM (500µL)
target solution or a recirculation of the 1µM (500µL) target solution also at
0.1mL/min till the signal reached steady state. As the data shows, the single flow
through hybridization reaches ~30% of the total signal reached at saturation by
the recirculated solution. However, as expected the pattern of signal acquisition
seems consistent with a slight increase in hybridization for the non-recirculated
condition. The recirculation loop thus helps minimize sample volume, a necessary
parameter for the advent of microarray based assay systems.

75
Figure 3.9: Diffusion driven mass transport at high analyte concentrations within bead independent of flow rate. Insert shows extent of hybridization reached by single flow through as opposed to recirculation.
3.3.5 Effects of Length of Probe and Probe Density on Sequestration
Another essential component to the ensuing discussion of factors affecting
the hybridization dynamics within the microspheres is the effect of sequence
length for both probe and targets. Highly descriptive studies exploring the effects
of planar array probe density on the hybridization kinetics of mismatched and
complementary targets have been shown by Peterson et al.102-104 It was seen that
at high probe densities there exists a kinetic difference for signal saturation for the
76
25mer PM and MM (1basepair MM, A:C; 2basepair MM, A:C and C:C)
sequences. Additionally, both types of sequences reach comparable hybridization
efficiencies at > 7hrs thus exhibiting limited selectivity. However, at lower probe
densities the rates of target capture are drastically increased with a subsequent
difference in hybridization efficiency between PM and MM sequences. Studies,
exploring the efficacy of the microbead array towards the detection of single
nucleotide mismatches within 18mer probes and targets has been shown
previously as described in Chapter 2.23 These explorations highlighted the
capability of the taste chip approach to effectively discriminate between two
different thermally stable G:G mutations at high probe densities. Additionally,
hybridization reactions were completed in < 40min for these 18mer target and
probe sequences. Although, high rates of reaction attributed to the integrated fluid
delivery component and the high selectivity of the microbead array have been
shown, studies shown by Levicky et al delineate differences between
immobilization of probes > 24bases. Thus to elucidate these length dependent
interactions within the microbead array, three different pairs of probe and target
sequences immobilized to biotin and a fluorophore respectively (Table 3.1) of
base lengths 10, 20 and 50 were utilized. These probe and target sequences are
designed so that the longer sequences are an extension of the shorter probe and
target pairs, thus allowing for all three hybrids to be complementary to each other.
Therefore, three batches of microbeads were immobilized with 50µM of the three
probe sequences (P1-10, P2-20 and P3-50).

77
Table 3.1: Short sequences for length dependent studies (5’ 3’)
3.3.5.1 High Immobilized Probe Density
Figure 3.10 shows the percentage of hybridization versus time for an array
consisting of four columns of beads immobilized with the 10mer (P1-10) (~8 x
107 copies/bead), the 20mer (P2-20) (~7 x 10⁷ copies/bead) and the 50mer (P3-
50) (~4 x 10⁷ copies/bead) probe sequences and avidin (negative control)
respectively with the hybridization of 1µM (500µL) of targets 10mer (T1-10) as
shown in 3A, 20mer (T2-20) in 3B and 50mer (T3-50) in 3C.
The decrease in probe immobilization for the 50 base sequence is
concurrent with data shown by Levicky et al demonstrating the increase in
polymeric behaviour for sequences longer than 24bases (studies conducted up to
48bases).105 For the prior mentioned planar studies, it was seen that the
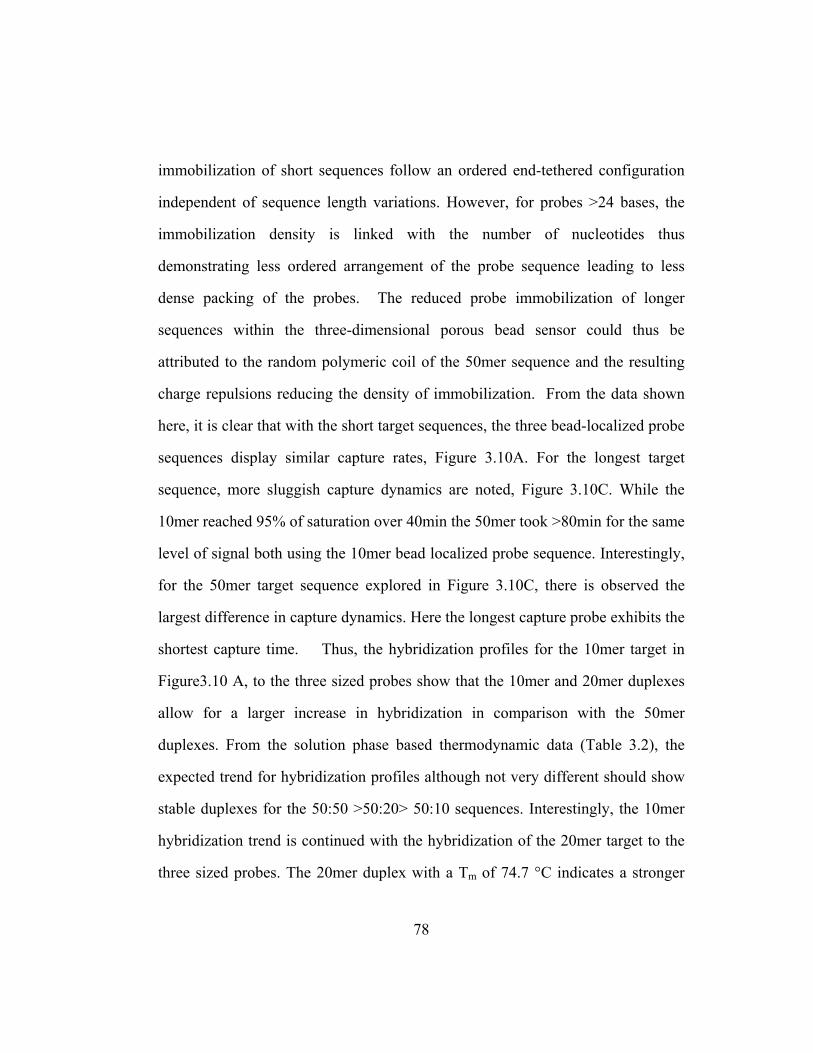
78
immobilization of short sequences follow an ordered end-tethered configuration
independent of sequence length variations. However, for probes >24 bases, the
immobilization density is linked with the number of nucleotides thus
demonstrating less ordered arrangement of the probe sequence leading to less
dense packing of the probes. The reduced probe immobilization of longer
sequences within the three-dimensional porous bead sensor could thus be
attributed to the random polymeric coil of the 50mer sequence and the resulting
charge repulsions reducing the density of immobilization. From the data shown
here, it is clear that with the short target sequences, the three bead-localized probe
sequences display similar capture rates, Figure 3.10A. For the longest target
sequence, more sluggish capture dynamics are noted, Figure 3.10C. While the
10mer reached 95% of saturation over 40min the 50mer took >80min for the same
level of signal both using the 10mer bead localized probe sequence. Interestingly,
for the 50mer target sequence explored in Figure 3.10C, there is observed the
largest difference in capture dynamics. Here the longest capture probe exhibits the
shortest capture time. Thus, the hybridization profiles for the 10mer target in
Figure3.10 A, to the three sized probes show that the 10mer and 20mer duplexes
allow for a larger increase in hybridization in comparison with the 50mer
duplexes. From the solution phase based thermodynamic data (Table 3.2), the
expected trend for hybridization profiles although not very different should show
stable duplexes for the 50:50 >50:20> 50:10 sequences. Interestingly, the 10mer
hybridization trend is continued with the hybridization of the 20mer target to the
three sized probes. The 20mer duplex with a Tm of 74.7 °C indicates a stronger

79
stability in comparison with the 20:10 duplex consisting of a Tm of 48.3 °C.
Although, this pattern is expected from the melting temperature values and
demonstrating thermodynamic fidelity of the microbead array, the duplex
formation with the 50mer probe shows a drastic decrease in stability.
Table 3.2: Melting Temperature (°C) values for hybridized pairs of Probe sequences (P 10, 20, 50) and Target sequences (T 10, 21, 50)
The solution phase Tm of 75 °C would have yielded expected hybridization
profiles comparable to the 20mer duplex. Although, the decreased probe density
for the 50base sequence could result in the reduced hybridization efficiencies of
the targets seen here, the trend is not consistent since there is ~50% decrease in
immobilization probe density for the 50base probe in comparison with the 10 and
20mer probes. If the hybridization efficiencies were solely dependent on the
density on the bead, the net hybridizations should effectively yield greater
differences between the three different probes. Thus it is observed, that the
hybridization profiles in Figure 3.10 A and B for the 50base probe is dependent
on factors additional to the melting temperature values and the probe density. The
longer 50mer probe seems to pose hybridization barriers in comparison with the
shorter probe sequences. It is important to mention that the shorter targets are

80
complementary to the immobilized end of the 50mer probe. Additionally, duplex
formation between short oligonucleotides has been seen to follow a nucleation
step followed by helix zipping.102 Elegant prior studies conducted by Peterson et
al, have shown that the immobilized probe format definitely reduces the
accessible pathways to nucleation and thus to duplex formation.102-104 Thus, the
longer 50mer probe is possibly decreasing the chances of hybridization of the
shorter 10 and 20 mer target sequences by creating both charge repulsion as well
as a steric barrier to the nucleation and duplex formation of the shorter sequences.
Subsequently, the hybridization of a longer 50mer target should mitigate the
initial nucleation barriers since the target is complementary to the entire 50mer
probe sequence. Figure 3.10C, details the hybridization of the 50mer target with
the three probes. Although, the initial rate of hybridization for the 50mer duplex is
faster than that of the 50:10 and 50:20 duplex formations which could indicate
easier initiation of nucleation, the percentage of hybridization for the 92.4 °C Tm
50mer duplex continues to be lower than expected. The, 50:10 duplex (Tm: 48.3
°C) after a slow initial rate of hybridization, reaches saturation above the two
other duplex formations. Therefore, in addition to the location of the nucleation
site, the hybridization events for the 50 base sequences maybe greatly
orchestrated by charge repulsions. Thus, from these data it is possible to envisage
that the probe density immobilized on the agarose matrix may not directly be
reducing the hybridization events by steric influences, but rather increasing the
charge repulsions leading to the deviations from the expected patterns of sequence
hybridization within the agarose matrix.

81
Figure 3.10: Hybridization profiles versus time for beads immobilized with high density of probes lengths 10, 20 and 50 base sequences hybridized with target (A) 10mer, (B) 20mer and (C) 50mer sequences. The raw images were captured with camera exposure times of 100ms and analyte delivery rate of 1.5mL/min.
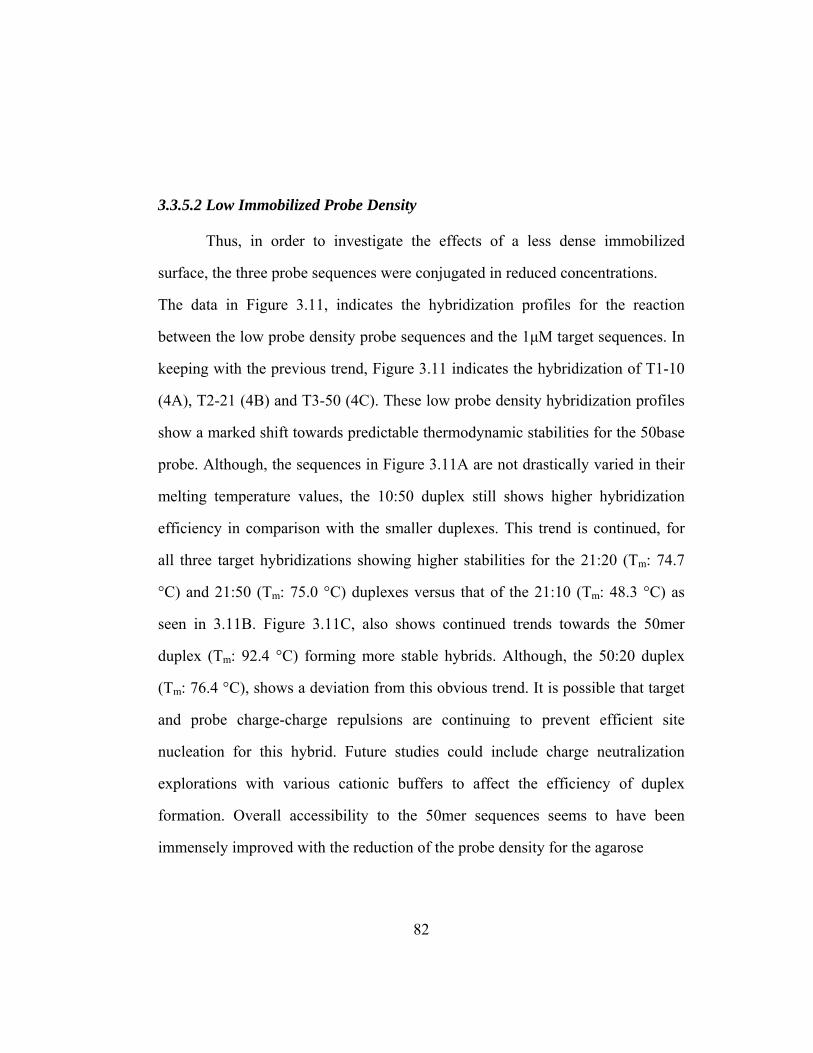
82
3.3.5.2 Low Immobilized Probe Density
Thus, in order to investigate the effects of a less dense immobilized
surface, the three probe sequences were conjugated in reduced concentrations.
The data in Figure 3.11, indicates the hybridization profiles for the reaction
between the low probe density probe sequences and the 1µM target sequences. In
keeping with the previous trend, Figure 3.11 indicates the hybridization of T1-10
(4A), T2-21 (4B) and T3-50 (4C). These low probe density hybridization profiles
show a marked shift towards predictable thermodynamic stabilities for the 50base
probe. Although, the sequences in Figure 3.11A are not drastically varied in their
melting temperature values, the 10:50 duplex still shows higher hybridization
efficiency in comparison with the smaller duplexes. This trend is continued, for
all three target hybridizations showing higher stabilities for the 21:20 (Tm: 74.7
°C) and 21:50 (Tm: 75.0 °C) duplexes versus that of the 21:10 (Tm: 48.3 °C) as
seen in 3.11B. Figure 3.11C, also shows continued trends towards the 50mer
duplex (Tm: 92.4 °C) forming more stable hybrids. Although, the 50:20 duplex
(Tm: 76.4 °C), shows a deviation from this obvious trend. It is possible that target
and probe charge-charge repulsions are continuing to prevent efficient site
nucleation for this hybrid. Future studies could include charge neutralization
explorations with various cationic buffers to affect the efficiency of duplex
formation. Overall accessibility to the 50mer sequences seems to have been
immensely improved with the reduction of the probe density for the agarose

83
Figure 3.11: Hybridization profiles versus time for beads immobilized with low density of probe lengths 10, 20 and 50 base sequences hybridized with target (A) 10mer, (B) 20mer and (C) 50mer sequences.

84
matrix. As seen in the schematic Figure 3.12A, the dense immobilization of
longer sequences could definitely hinder the stable formation of hybrids with
complementary targets. This effect can be magnified with shorter targets being
complementary to the lower part of the longer immobilized probe thus facing
obstructed sites of nucleation and enhanced charge-charge repulsion. The
aforementioned trends confirm these speculations specially seen with the decrease
in probe density that alleviates the steric and charge bulk and allows for the
Figure 3.12: Schematic of microsphere immobilized with (A) high and (B) low probe density.
thermodynamic stabilities to be restored. These studies have established the
efficacy of the microbead array to discriminate sequences thermodynamically
independent of probe density for short sequences with enhanced reaction kinetics
leading to signal saturation in less than 40min. This utility is extended to include
50mer sequences at lower probe densities with signal saturation times of less than
15min. Additionally, probe sequences in concentrations of 107 copies are

85
contained within a single 280µm diameter bead in contrast to 1012 copies
contained on a 1cm2 planar array.
3.3.6 Effects of Porosity on Radial Penetration
The effects of the porous polymer have been shown inter alia to be crucial for
optimal rates of mass transfer.96 Although, polymers consist of high binding
capacities leading to low sensitivities and surpass planar surfaces in
accommodating steric bulk, the mass transport properties of biological molecules
through the diffusive pores of the polymer could be further optimized. To bolster
the existing list of attributes for polymeric microspheres with larger ‘flow-
through’ pores would greatly mitigate the diffusion driven limitations within the
polymer. These larger pore sizes in addition to the convection driven fluid
delivery abilities of the microbead array would greatly enhance not only the
effective rates of mass transfer by both increasing pore size and decreasing back
pressure but proportionally increase the diffusion coefficients of macromolecules
within the polymer interface thus scaling towards solution phase reaction kinetics
within the immobilized format. The attributes of superporous microspheres have
been well established within the protein chromatography arena as a viable means
to acquire convective flow with low backpressures and an overall effective means
of protein transport.96

86
Figure 3.13: Scanning electron microscopy (SEM) images of (A) homogeneous and (B) superporous microspheres respectively. (Images provided by Jorge Wong)
The superporous beads have been previously prepared by a double emulsification
procedure as shown by Gustavsson et al.106 Figure 3.13 details SEM images of
homogeneous versus superporous microspheres that were prepared ‘in house’
with comparable densities of agarose by Jorge Wong in the McDevitt Lab.
Clearly evident from the images is the stark difference in the architecture of the
physical surface of the two types of polymeric beads. The superporous bead
consists of these macroporous channels throughout the volume of the sphere as
seen by both confocal and scanning electron microscopy (data not shown). The
pores form an inter-connecting network of fluid delivery channels without the loss
of the high binding capacities of the agarose polymer.
3.3.6.1 Signal versus Time of Sequestration within Microporous Particle
The ability of the superporous (SA) beads to support enhanced rates of
mass transfer in comparison with the homogenous (HA) beads is seen in Figure
3.14. The experiment was performed with an array of both types of microspheres
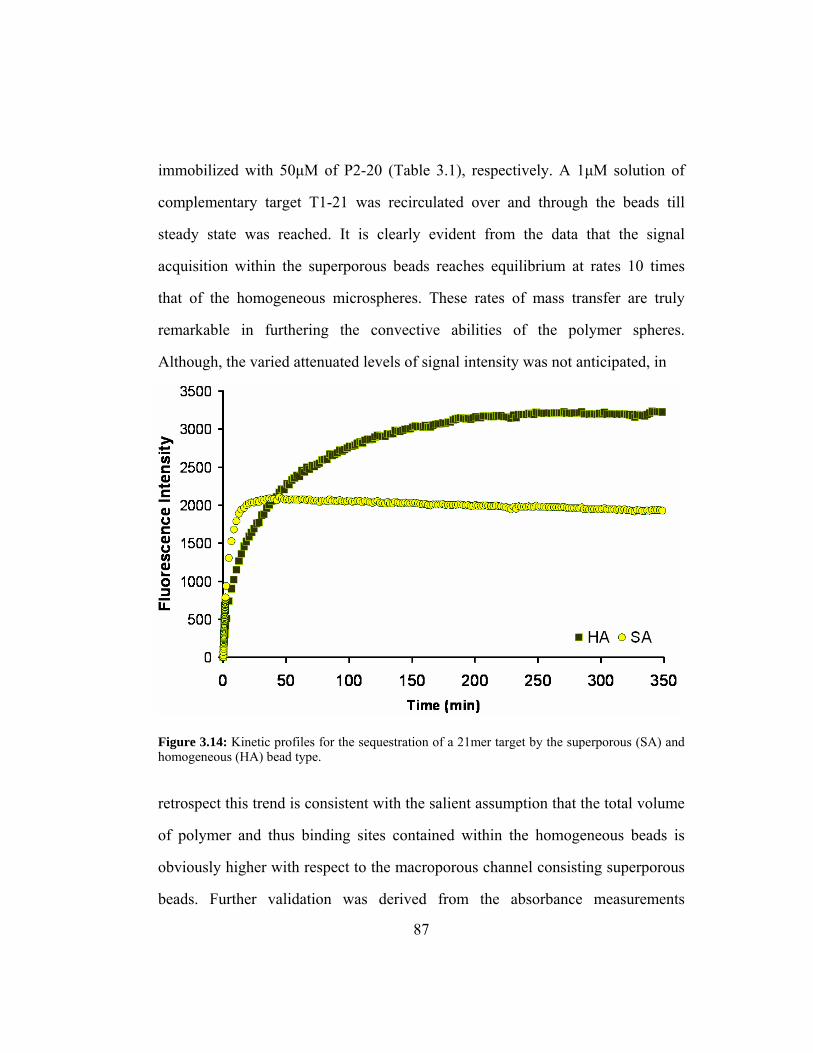
87
immobilized with 50µM of P2-20 (Table 3.1), respectively. A 1µM solution of
complementary target T1-21 was recirculated over and through the beads till
steady state was reached. It is clearly evident from the data that the signal
acquisition within the superporous beads reaches equilibrium at rates 10 times
that of the homogeneous microspheres. These rates of mass transfer are truly
remarkable in furthering the convective abilities of the polymer spheres.
Although, the varied attenuated levels of signal intensity was not anticipated, in
Figure 3.14: Kinetic profiles for the sequestration of a 21mer target by the superporous (SA) and homogeneous (HA) bead type.
retrospect this trend is consistent with the salient assumption that the total volume
of polymer and thus binding sites contained within the homogeneous beads is
obviously higher with respect to the macroporous channel consisting superporous
beads. Further validation was derived from the absorbance measurements
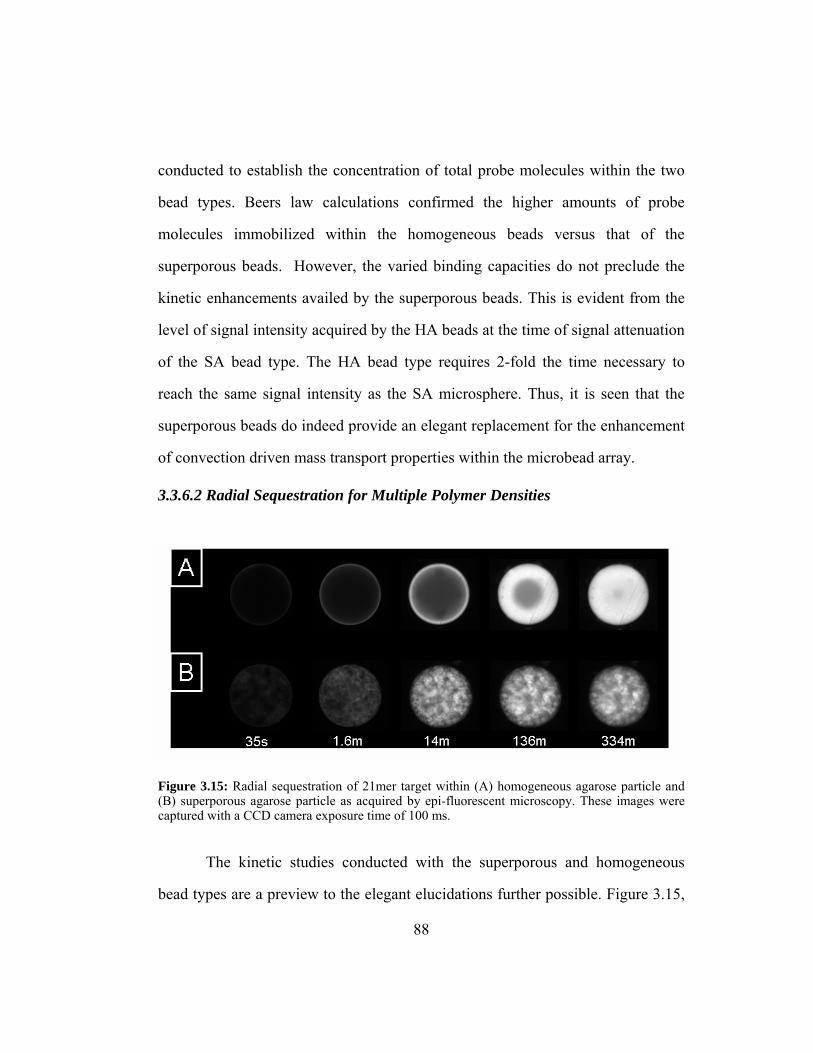
88
conducted to establish the concentration of total probe molecules within the two
bead types. Beers law calculations confirmed the higher amounts of probe
molecules immobilized within the homogeneous beads versus that of the
superporous beads. However, the varied binding capacities do not preclude the
kinetic enhancements availed by the superporous beads. This is evident from the
level of signal intensity acquired by the HA beads at the time of signal attenuation
of the SA bead type. The HA bead type requires 2-fold the time necessary to
reach the same signal intensity as the SA microsphere. Thus, it is seen that the
superporous beads do indeed provide an elegant replacement for the enhancement
of convection driven mass transport properties within the microbead array.
3.3.6.2 Radial Sequestration for Multiple Polymer Densities
Figure 3.15: Radial sequestration of 21mer target within (A) homogeneous agarose particle and (B) superporous agarose particle as acquired by epi-fluorescent microscopy. These images were captured with a CCD camera exposure time of 100 ms.
The kinetic studies conducted with the superporous and homogeneous
bead types are a preview to the elegant elucidations further possible. Figure 3.15,

89
details epiflourescent images of the sequestration of analyte within the two bead
samples at increasing time frames. The advantage of the spherical mass transport
mechanism, within the superporous bead is defiantly clear from these images.
Even at 14 min the fluorescently tagged target molecule is seen to have
completely traversed the volume of the superporous bead and reached equilibrium
conditions. At this same time frame, the target molecule is seen to have permeated
~ 10% into the diameter of the homogeneous microsphere. Further elucidations to
delineate the respective diffusion coefficients for the 21mer target molecule
within these two bead types were conducted.
3.3.6.3 Rates of Diffusion in Heterogeneous Polymer Matrices
Confocal microscopy provides the ideal tool to decipher the real-time
sequestration events occurring within the microspheres. With identical
experimental conditions as aforementioned, image acquisition was focused on the
medial section of the optical slices of the two bead types. Thus, real-time lengths
of permeation were recorded for the superporous and homogenous beads. This
raw data was translated into the ‘effective’ diffusion coefficient for the target
molecule within the two different polymer environments. It should be recognized
here that the creation of the pore network for the superporous beads affords
increased transport for analytes and reagents through the reduction of the polymer
path length. While the actual diffusion coefficient for species within the
homogeneous and superporous regions may be similar, the reduction in path
length for the porous beads is likely the dominant effect in increasing the rate of
transport. Thus, the term effective diffusion is used here to track the increased rate
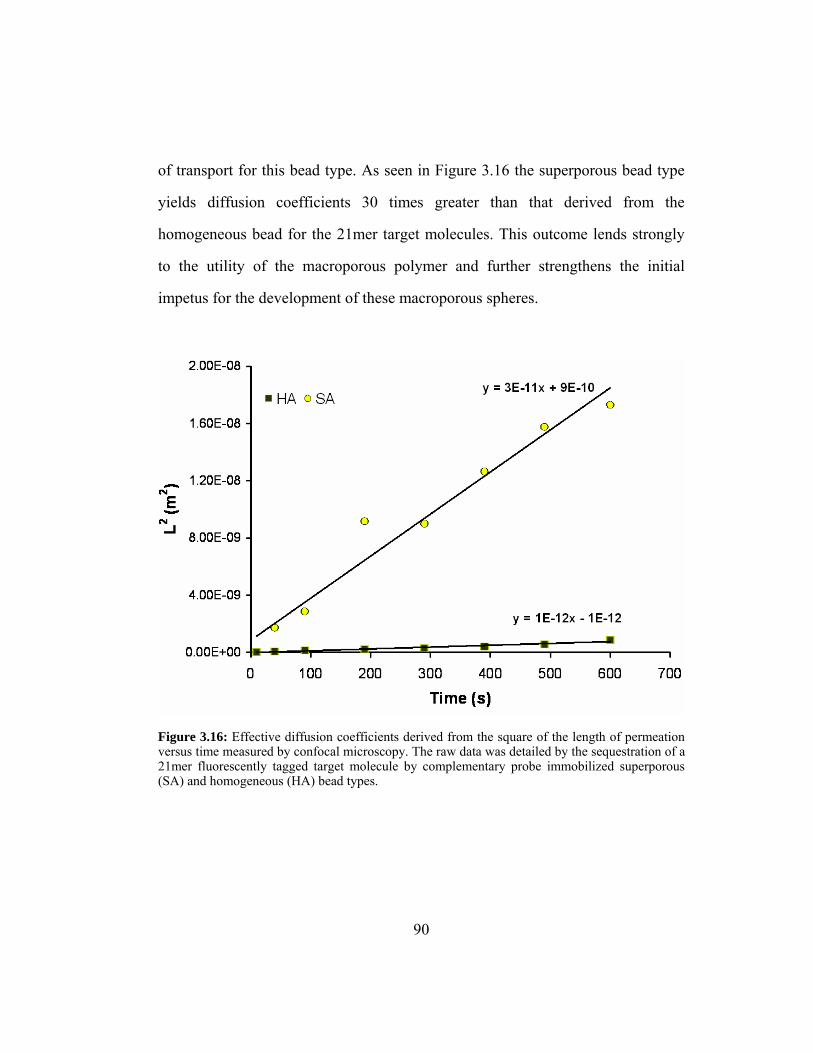
90
of transport for this bead type. As seen in Figure 3.16 the superporous bead type
yields diffusion coefficients 30 times greater than that derived from the
homogeneous bead for the 21mer target molecules. This outcome lends strongly
to the utility of the macroporous polymer and further strengthens the initial
impetus for the development of these macroporous spheres.
Figure 3.16: Effective diffusion coefficients derived from the square of the length of permeation versus time measured by confocal microscopy. The raw data was detailed by the sequestration of a 21mer fluorescently tagged target molecule by complementary probe immobilized superporous (SA) and homogeneous (HA) bead types.
91
3.4 SUMMARY AND CONCLUSIONS
In conclusion, the intial study of the external and internal parameters
affecting the signal acquisition within the microbead array has been undertaken.
The importance of exploring these conditions has lent itself to the elucidation of
various signal acquisition parameters within the polymer sensor matrix as a
whole. Various strategies for the probe immobilization along with optimizations
for molecule permeation within the bead matrix have also been explored. The
mass transport mechanisms were closely examined with evidence showing a
convective diffusion transport occurring within the microbead array. This data is
in contrast to the majority of planar arrays which rely mainly on diffusional mass
transport. Thus, the integrated fluidic delivery system, here described along with a
high binding capacity polymer and the use of a spherical particle within a
microfluidic chamber capable of pressure driven flow have allowed for the
detection of nucleic acids in < 40min with an inbuilt regeneration capability to
reduce sample sizes. Additionally, the porous bead matrix has shown great
fidelity for discriminating thermodynamic stabilities for short oligonucleotides.
Polymer evolutions have also led to the development of a superporous three-
dimensional bead structure which has increased diffusion coefficients by 30 times
with respective to homogeneous polymer beads for short oligonucleotides. These
elements of an integrated microfluidic system have yielded direct DNA capture
and detection capabilities that are competitive with prior approaches.
92
Chapter 4: Molecular Beacon Encoded Beads in Tandem with an Integrated Fluidics System
4.1 INTRODUCTION
Although microarray technology has revolutionized the face of
functional genomics, advantages for a broader population can only be achieved
via reduced reagent volumes and flexible sensor design and fabrication mitigating
end costs. Such alternative approaches would serve to elucidate previously
identified gene involvement in a wider spectrum of individuals. To this end, the
advent of heterogeneous bio-sensors for the detection of nucleic acids has been
greatly enhanced with the incorporation of an internal recognition modality such
as that of molecular beacons. In solution phase, hairpin loop structures have
allowed for numerous advantages including discriminating alleles and nucleotide
mutations,9,107,108 real-time detection of PCR products,109 mRNA in situ
hybridization110,111 and multiplexed detection of pathogenic retroviruses.112
Molecular beacons are single-stranded oligonucleotide probes that are
designed to possess complementary stems thus forming a hairpin shaped
molecule. These dual-labeled probe molecules consist of a quencher on one
stem and a fluorophore at the other and undergo contact quenching in the hairpin
loop form, Figure 1. The probes can be designed to allow for the loop region to
be specifically complementary to a target sequence of interest.

93
Figure 4.1: A schematic of the principle mechanism of molecular beacons. Stem-stem hybridization ensures hairpin structure and thus self-quenching of fluorophore. However, upon hybridization of target to loop region, the beacon undergoes conformational shift that compels the stem sequences apart and thus allows the emission of fluorescence.
94
Thus, upon the hybridization of the specific sequence to the loop of the hairpin,
the hybridized stems unravel and allow for the emission of a fluorescent signal
to be transduced from the probe. This completely unique blueprint, of the internal
FRET based molecular beacons, once immobilized allows for the simultaneous
multiplexed detection capability of various sequences, forgoing the need for target
separation steps in addition to generating high signaling capabilities innate to an
internal signal transduction system. An added advantage is the inherent
thermodynamic stability of the stem-loop structure allowing for a higher
stringency towards discriminating single nucleotide polymorphisms in
comparison with linear probes.108
The seminal immobilization work shown by Tan et al113 has since lead to
the adaptation of hairpin molecules within various heterogeneous sensors.114-116
Extensions of these approaches have included fiber optic gene arrays114,
electrochemical sensors117, and numerous planar microarrays.118-120 Although
molecular beacons have successfully been integrated within the various strategies,
the optimization steps entailed have all been channeled towards bridging the
disparity between the high signal to background efficiency of hairpins in solution
versus that of a tethered probe. Solution phase signal to background ratios for
molecular beacons are typically in the range of 10-200109,121 versus
<25115,119,122of those once immobilized. This limitation has restrained the full

95
extent of possible attributes that could be derived from immobilizing molecular
beacons.
More recently, several biosensor strategies have involved encompassing
the three-dimensional nature of functionalized polymeric films and
microspheres.17,90,120,123 This approach to combine the porous polymeric structures
containing high binding capacities with microarray technology, stems from the
impetus to create an ideal environment for the merger between homogeneous and
heterogeneous sensors.
The new work described in this Chapter will focus on the use and
optimization of molecular beacons as sensing ensembles incorporated into
agarose beads fashioned within the electronic taste chip arrays. The micro-
spherical supports, comprising the microbead array, are seen to provide a
specialized local environment where the electrostatic and steric effects associated
with combining the solid-liquid bead-beacon interface are mitigated. This
rationale has yielded great advantages towards creating the ideal environment for
the hybridization and discrimination of sequence specific microbead biosensors.
This array based sensor is instrumental in marrying the molecular attributes of a
high binding capacity, low background polymer with the pressure driven fluid
flow and recirculation capabilities of an integrated fluid delivery system. The
added feature aids to circumvent mass transport limited restrictions and bridge the
divide between heterogeneous and solution based signal kinetics.

96
4.2 EXPERIMENTAL SECTION
4.2.1 Reagents
The molecular beacon sequences and their complements (Table 4.1) were
purchased from Integrated DNA Technologies, Inc (Coralville, IA). All hairpin
structural designs were validated with the mfold program.124 The MB1 and MB2
hairpin structures were designed to be complementary to target sequences from
the HIV-1 gag gene; whereas MB3 is specific to the 16S rRNA region of Bacillus
anthracis (Sterne). The lyophilized DNA samples were reconstituted with DI
H2O. Aldehyde-terminated agarose microbeads were purchased from XC
Corporation (Lowell, MA). Hybridization buffer contained 20mM Tris-HCl
(Sigma Chemical Co.) and 300mM MgCl2 (Mallinckrodt AR) pH 7.8, unless
otherwise mentioned. High stringency washing buffers (1X) were diluted from a
concentrated stock solution of 5X (pH 7.8) containing 5 M NaCl (J.T. Baker Inc),
1 M Tris buffer, pH 7.6 (Sigma Chemical Co.) and 0.5 M EDTA pH 8.0
(Spectrum Chemical MFG. Corp.) Buffer also contained 1 M Urea (diluted from 4
M stock solution), (Mallinckrodt AR) and 35% Formamide (diluted from 80%
stock solution), (Sigma Chemical Co.).
Hybridization buffer was used for the target incubation period for all
assays (unless otherwise mentioned); high stringency buffers were used for the
rinse phase of regeneration studies (vide infra).

97
Table 4.1: Stem-Loop structures and target sequences (5’ 3’)
4.2.2 DNA Functionalization
Avidin was coupled to the aldehyde-terminated agarose microspheres via
reductive amination. The method involves forming initially reversible Schiff’s
base complexes between the aldehyde functional groups found throughout the
microbeads (500 µL) and the amine residues of the glycoprotein avidin (300 µL)
(Pierce) in carbonate buffer, pH 9.6 (640 µL), to form initially reversible Schiff’s
base complexes. Subsequently, the Schiff’s complexes were selectively reduced
and stabilized so as to form covalent linkages using sodium cyanoborohydride (60

98
µL). A solution of 1% Triton-X (Sigma Chemical Co.) was also included in the
reaction volume. The biotinylated molecular beacon sequences (concentrations as
specified) (20 µL) were reacted over a period of 12 hrs with the avidin conjugated
agarose beads (10 µL) in a microcentrifuge tube on a shaker at room temperature.
The oligonucleotide-immobilized beads were rinsed 4 times with DI H2O and
stored in the refrigerator at 4 ºC.
4.2.3 Instrumentation and Analysis Protocols
The imaging and analysis systems for the microbead array have been
discussed previously.22 Fluid samples were introduced into the flow cell with
peristaltic pumps from FIA labs (Bellevue, WA). All fluid introduction steps were
completed using FIA lab software. The fluid sample was circulated over the beads
in a continuous manner via a fluidics loop. Typical flow rates for sample and
buffer introduction ranged from 1 to 3 mL/min. An optical setup was assembled
with components provided by Olympus (Melville, NY). The station was equipped
for epifluorescent imaging of the microbead array using a 100 W Hg light source.
The custom-made system also contained interchangeable objectives and
removable filters to control the excitation and emission wavelengths. For the
purposes of DNA hybridization detection, a 5x objective was utilized in
conjunction with a set of two interchangeable filters: FITC (λex = 480 nm, λem =
535 nm), Texas Red (λex = 560 nm, λem = 645 nm) purchased from Chroma
Technology Corp. (Brattleboro, VT). Optical data were captured using a DVC
1412M (Austin, TX) 12-bit charge-coupled device (CCD) monochrome camera
and the data was analyzed using Image Pro Plus 4.1 (IPP) software from Media
99
Cybernetics (Carlsbad, CA). The CCD measurements were taken with exposure
times ranging from 100 ms to 1.0 s or as specified. To monitor the DNA
hybridization progress, an area of interest (AOI) for each of the beads was defined
using the IPP analysis software and then the relevant intensity values as a function
of time were recorded by the CCD. The average pixel intensity for each of the
beads was exported to a spreadsheet. The data measurement and quantitation steps
were completed in an automated fashion using software macros created for these
specific purposes.
4.2.4 Signal to Background Studies
The MgCl2 concentration studies on S/B were acquired with hairpin loop
MB2-gag. The array consisted of beads immobilized with MB2-gag as well as a
column of controls. The array was exposed to 1350 µL of a 0.1µM perfect target
solution (T2-23) for 60 min at a flow rate of 2 mL/min under recirculation.
Fluorescence images were taken before (Ic) and after (Io) sample introduction with
a camera exposure of 826ms. All signal to background ratios herein were
calculated from Io/Ic. All bead types mentioned herein were contained with the
array at least in triplicate if not more. The probe density studies were conducted
with beads immobilized with MB1-gag at concentrations of 10, 1 and 0.1µM. The
measurements were carried out with a column of each bead type as well as a
column of control beads isolated within an array. The array was hybridized with a
0.1µM solution of perfect target T1-23 under recirculation and images were
captured with camera exposures of 1s before and after the hybridization of the
target sequence. The studies for the location of tether on the hairpin were

100
explored with MB4-loop and MB4-stem. The array consisted of microbeads
previously immobilized to MB4-loop and MB4-stem. The amount of 1.75µM
(600µL) of the complementary target sequence was hybridized with the array
under flow at 1mL/min. The before and after target hybridization images of the
array were captured at a CCD integration of 590ms. The target length dependent
experiments were carried out with beads immobilized with 1 and 10µM of MB1-
gag hairpin structures. Solutions (1350µL) of target sequences (T1-23 and T1-
100) were delivered separately under recirculation to an array consisting of the
two bead types and a control column of beads. The before and after images, were
acquired with a camera exposure of 200ms and 1s for the 10 and 1µM bead types
respectively. The immobilization strategies explored all involved the
hybridization of 0.1µM of the T1-100 target under recirculation at 1.5mL/min
flow rate. The immobilization procedures for beads with probe density 10 and
1µM were mentioned in Section 4.2.2. The immobilization of dual hairpin loop
structures MB1-gag and MB2-gag involved the incubation of 10µL of a 1.0µM
solution of each hairpin with 10µL of avidin conjugated polymer beads overnight.
The beads were rinsed in DI H2O the next day and stored in 4 °C. Similarly, for
the immobilization of the hairpin and linear probe bead type, 10µL of a 1.0µM
solution of MB1-gag and 20µL of a 1µM solution of LnrLp2 were incubated
overnight with 10µL of avidin conjugated polymer beads. The rinse and storage
procedures were as previously mentioned. The signal to background ratios and
assay conditions were similar to the previously mentioned length dependent
assay.

101
4.2.5 Discrimination Studies
The microbead array used for discrimination experiments contained three
columns of microbeads previously immobilized to 1.0µM MB1-gag. A column of
avidin coated microbeads was included here to serve as a negative control. Each
sequence type was hybridized with a new array of microbeads under buffer
conditions of 20mM Tris-HCl, 5mM MgCl2 pH 7.8. Data was obtained using
specific selective filters (see Instrumentation and Analysis Protocols above) in
conjunction with CCD camera exposure times of 800ms.
4.2.6 Regeneration
The microbead array was exposed to 0.1 µM (500 µL) of PM-23 target
sample that was contained within a circulation loop. At a flow rate of 1.5 mL/min,
the DNA analyte was circulated over the beads immobilized with MB1-gag
(Table 1) for 20 min. After target hybridization the array was regenerated by the
introduction of the high stringency washing buffer (vide Reagents) at room
temperature for 6 min. At this point, a rinse was initiated with hybridization
buffer (vide Reagents) for 2min. This procedure was repeated 3 times using the
complementary target (T1-23) to the molecular beacon immobilized on the
microspheres (MB1-gag). The images were acquired at intervals of 60s per image
with a camera exposure time of 1s.
4.2.7 Bacillus anthracis Hairpin Loop
The immobilization of MB3-anth (Texas Red) to polymer beads involved
the incubation of 1, 10 and 50µM of a 20µL solution of the hairpin with 10µL of
beads respectively, overnight. The three bead types were then rinsed in DI H2O

102
and stored in 4 °C. The immobilization of MB3-anth (FAM-6) was identical to
the previously mentioned procedure. The experiments for Figure 10A and B
involved the hybridization of 1µM of T3-90 with an array consisting of the bead
types mentioned in the respective figures, including a column of control beads.
These images were acquired with a camera exposure of 100ms for the Texas Red
excitation and at 700ms for the FAM-6 excitation. The topographical maps for
Figure 11 were generated with IPP software. In Figure 11, (A) the 1µM MB1-gag
bead was part of an array incubated with 1µM (500µL) of T1-100; (B) the 10µM
MB3-anth (Texas Red) bead was part of an array incubated with 1µM (500µL) of
T3-90bp; (C) the 50µM MB3-anth (FAM-6) bead was part of an array incubated
with 1µM (500µL) of T3-90bp. All images were captured with camera exposures
of 1s.
4.2.8 Multiplexing
The microbead array consisted of three rows of microspheres immobilized
with 1.0µM MB1-gag, 10µM MB3-anth and avidin (to serve as a negative
control) respectively. The multiplexing experiments were undertaken with the
hybridization of targets T1-23 and T3_27 at a 1.0µM (500µL) concentration under
recirculation conditions with a flow rate of 1.5mL/min. For the data captured in
Figure 13A, the recirculation solution consisted of 1µM of T3-27, Figure 13B,
consisted of 1µM of T1-23 and Figure 13C consisted of 1µM of both T1-23 and
T3-27. A new array of beads was used for each experiment. The images were
acquired with a camera exposure of 500ms and images were captured at 150s
intervals.

103
4.3 RESULTS AND DISCUSSION
4.3.1 Microbead Platform in Tandem with Molecular Beacons
As described in Chapter 2, the initial progress towards nucleic acid
detection involved the isothermal detection of single nucleotide polymorphisms
within the microbead array platform.23 These salient efforts allowed for the real-
time detection of point mutations within the confines of an integrated fluidics
system and thus established this approach within the evolving realms of lab-on-a-
chip based DNA detection. As exemplified earlier, this micro-sphere based
platform has also shown great efficacy for the rapid detection of various classes of
analytes.22,92 Thus, a simple yet robust idea for the immobilization of various
molecules to a sensing element in tandem with the capabilities of a fluid delivery
method has allowed for the development of a real-time multi-analyte sensor. The
core component of the sensor is the polymer micro-sphere which is chemically
derivatized to allow for the immobilization of specific receptors. This ability to
tailor the microsensors towards a specific sub-class and or a range of molecules of
interest in conjunction with spatially localizing a single microsphere to an
individual well allows for rapid multiplexing in a specific manner, Figure 2A.
Since both the bottom and the top of the truncated pyramids contain an opening,
the well serves not only as an optimal holding vessel for the sensor element, but
also allows efficient fluid flow with flow rates up to 10mL/min to be directed
through the polymer microsphere, Figure 2B. The etched silicon wafer, containing
the micro-spheres is enclosed in between an assembly of fluid delivery
components which allow for both the encapsulation of the silicon wafer and for

104
the delivery of reagents to the sensor elements, Figure 2C. In addition, the optical
transparency of the PMMA components in conjunction with the pyramidal well
openings allows for either the transmission of light through the polymer
microspheres for absorbance based quantitative measurements or rapid epi-
fluorescence events to be measured. Simultaneous sensor elements in array sizes
of 3X4 up to 5X7 can be concurrently analyzed. These separate components are
encased within an aluminum structure to complete a flow cell, Figure 2D, which
serves to maintain the integrity of the desired fluid path by allowing fluid delivery
to the top of the array through the sensor microspheres and out via the base to a
recirculation valve or to waste. The design of the flow cell has the necessary
architectural flexibility to allow for high throughput fluid delivery in a single flow
through direction or in a re-circulated manner.

105
Figure 4.2: (A) A scanning electron microscope image of etched pyramidal wells within the silicon chip. The well openings allow for the localization of the micro-spherical sensor elements. (B) Cross-sectional schematic of the micro-sphere localized within the etched pyramidal well. The pyramidal cavity extends through the entire thickness of the silicon wafer, thus facilitating the easy flow of fluid away from the micro-sphere. Transmission of light through the optically viable polymer is also available due to the openings of the truncated pyramidal cavities. (C) A schematic depicting the components of the fluid delivery module. The PMMA disks consist of chemically inert high pressure tubing (PEEK) fitted within machined channels. The channels extend through the depth of the disks to exit in the x-y plane of the silicon wafer. Thus fluid is delivered via the PEEK tubing of the top PMMA insert to the sensor array and concomitantly, the fluid exits the sensor array through the tubing contained within the bottom insert. The two PMMA disks are affixed with a layer of polyvinyl tape which serve as gaskets and provide structural support to the silicon wafer. The polyvinyl tapes contain openings which frame the array, thus allowing for the transmission of light. (D) Diagonal view of a completed flow cell module complete with inlet and outlet tubing.

106
4.3.2 Optimization of Signal to Background
In order to successfully channel the attributes of a label free molecular
beacon modality towards a high signal to background sensor, it is important to
optimize initial hairpin formation in efforts to reduce the inherent background
fluorescence. In addition to the typical cationic concentration requirements and
beacon design considerations necessary for stable hairpin formation in solution
phase, additional parameters such as the immobilized beacon probe density as
well as the location of tether on the hairpin need to be investigated for successful
implementation into a heterogeneous format. One of the key differences in the
reduction of background fluorescence from the immobilized beacon versus in
solution is the importance of establishing a stable stem-loop conformation. In the
solution phase, the lack of steric barriers to an efficient loop formation as well as
solution kinetics allow for high binding efficiencies for both the stem formation as
well as for the target hairpin hybrid. Thus, various parameters were probed in
order to facilitate an efficient adaptation of hairpin loop structures within the
microbead array.
4.3.2.1 Signal to Background dependence on MgCl2 [M]
Due to the electrostatic charges associated with the negatively charged
phosphate backbone of nucleic acid sequences, it is necessary to passivate the
charges to ensure a stable stem helix formation leading to near total quenching.
Numerous studies completed within heterogeneous platforms, to determine the
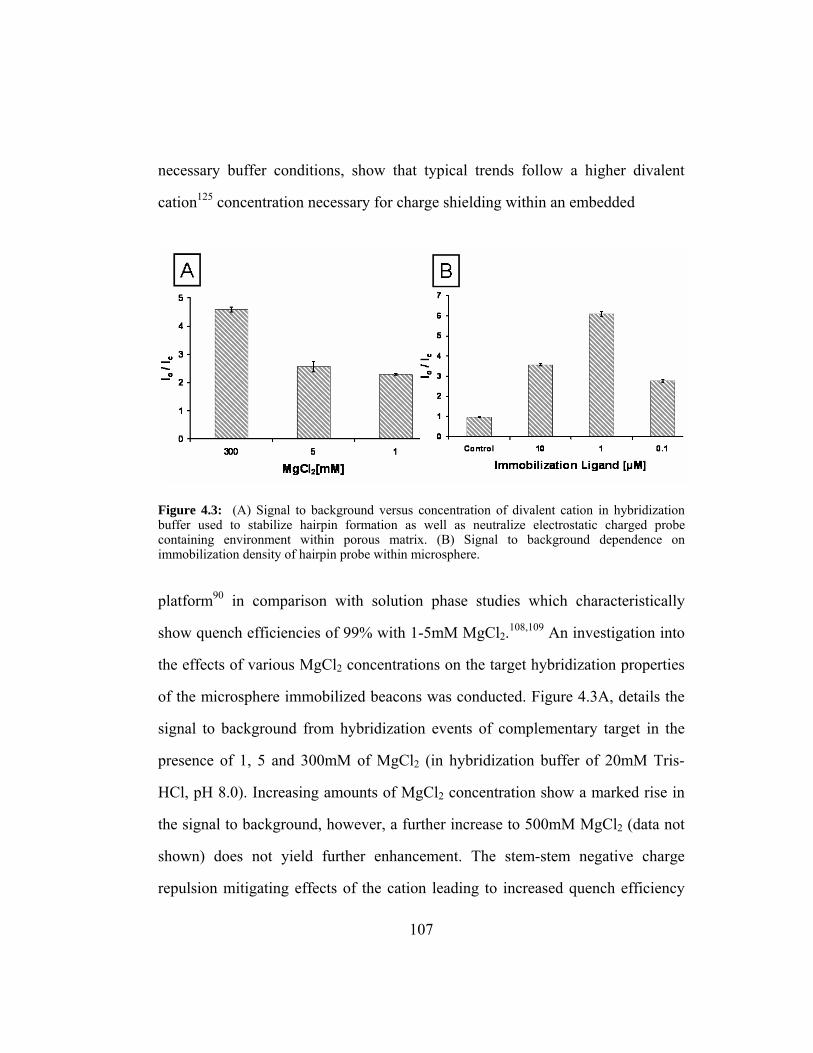
107
necessary buffer conditions, show that typical trends follow a higher divalent
cation125 concentration necessary for charge shielding within an embedded
Figure 4.3: (A) Signal to background versus concentration of divalent cation in hybridization buffer used to stabilize hairpin formation as well as neutralize electrostatic charged probe containing environment within porous matrix. (B) Signal to background dependence on immobilization density of hairpin probe within microsphere.
platform90 in comparison with solution phase studies which characteristically
show quench efficiencies of 99% with 1-5mM MgCl2.108,109 An investigation into
the effects of various MgCl2 concentrations on the target hybridization properties
of the microsphere immobilized beacons was conducted. Figure 4.3A, details the
signal to background from hybridization events of complementary target in the
presence of 1, 5 and 300mM of MgCl2 (in hybridization buffer of 20mM Tris-
HCl, pH 8.0). Increasing amounts of MgCl2 concentration show a marked rise in
the signal to background, however, a further increase to 500mM MgCl2 (data not
shown) does not yield further enhancement. The stem-stem negative charge
repulsion mitigating effects of the cation leading to increased quench efficiency
108
and therefore to a higher signal to background could be impeded with an excess of
positively charged ions enriched on the hairpin and target sequences. Thus, the
decrease in electrostatic repulsion is reversed and positive charge-charge
repulsion between the target and loop could occur. Similar trends have been
observed with other immobilized hairpin based sensors where an excess of
divalent cation concentration has either hampered the S/B ratios from the hairpin
target complex on slides as seen by Yao et al126 or not produced further
enhancement as seen by Wang et al90 on agarose films. Therefore, the buffer
conditions within the microbead array were optimized to ensure efficient stem-
stem and eventual loop-target hybridization.
4.3.2.2 Effects of Immobilized Hairpin Density on S/B
In conjunction with charge effects, density of immobilized probe within
the confines of the microsphere could lead to lower signal to background ratios if
not optimized. This key parameter unique only to tethered hairpin sensors could
influence the immobilized environment and alleviate steric barriers to allow for
efficient stem-stem as well as loop-target formation. For static or contact
quenching based mechanisms involved with molecular beacons where the stems
form blunt ends and are completely complementary with each other, the Texas
Red fluorophore is seen to be quenched by ~98% with the BHQ-1 dark
quencher.127 Thus, the density studies could also delineate the outcome of not
just the structural implications for an optimized quantity of target-loop hybrids to
yield an enhanced signal, but also ensure close contact of the fluorophore and
quencher during hairpin conformation so high quenching efficiency in
109
comparison with solution phase is achieved. Probe density studies previously
carried out (data not shown) points to the importance of establishing optimal
hybridization densities within the microsphere to maintain thermodynamically
viable interactions in contrast with sterically motivated hybrids. Similar studies
were elegantly demonstrated by Peterson et al for hybridizations with probes
immobilized on planar surfaces.104 Figure 3B shows the probe density effects on
the signal to background for the immobilized hairpin MB1-gag hybridized to a
complementary target. There is an almost ~55% increase in the S/B from a probe
immobilization solution of concentration 0.1µM to 1µM, but a ~40% decrease in
the S/B from 1 to 10µM. This trend for an optimal probe density leading to an S/B
maxima is consistent for all hairpin structures immobilized within the microbead
array.
4.3.3 Various Immobilization Strategies
4.3.3.1 Stem versus Loop Immobilization
The biotin-avidin bridging mechanism has become a frequent method for
the attachment of bio-molecules to surfaces of biosensors and has shown higher
signaling capabilities within sensor platforms.122 This was the method employed
to tether the hairpin molecules to the porous microspheres of the microbead array.
Therefore, in addition to the considerations made towards beacon immobilization,
multiple biotinylation sites on the hairpin were also investigated to allow for a
stable hairpin formation as well as a non-sterically hindered environment to allow
for target hairpin complex formation. Traditionally, for planar sensors, the
biotinylated tether is attached on the quencher stem, so as to reduce any effects

110
that biotin may have on the fluorophore and thus on the S/B.113,128 Preliminary
studies undertaken with attaching the biotin on the stem of the hairpin yielded
unsatisfactory signal to background values of less than 2, however, with a switch
to biotinylation on the loop of the hairpin increased the signal to background
almost 2-fold. Since there could be the non-specific interaction of negatively
charged targets and hairpins with the cationic glycoprotein avidin as seen by Tan
et al for biotinylated hairpins immobilized to avidin coated cover slips,126 control
experiments were also undertaken to ensure lack of non-specific interactions
between the negatively charged oligonucleotides and the neutravidin coated
microspheres.
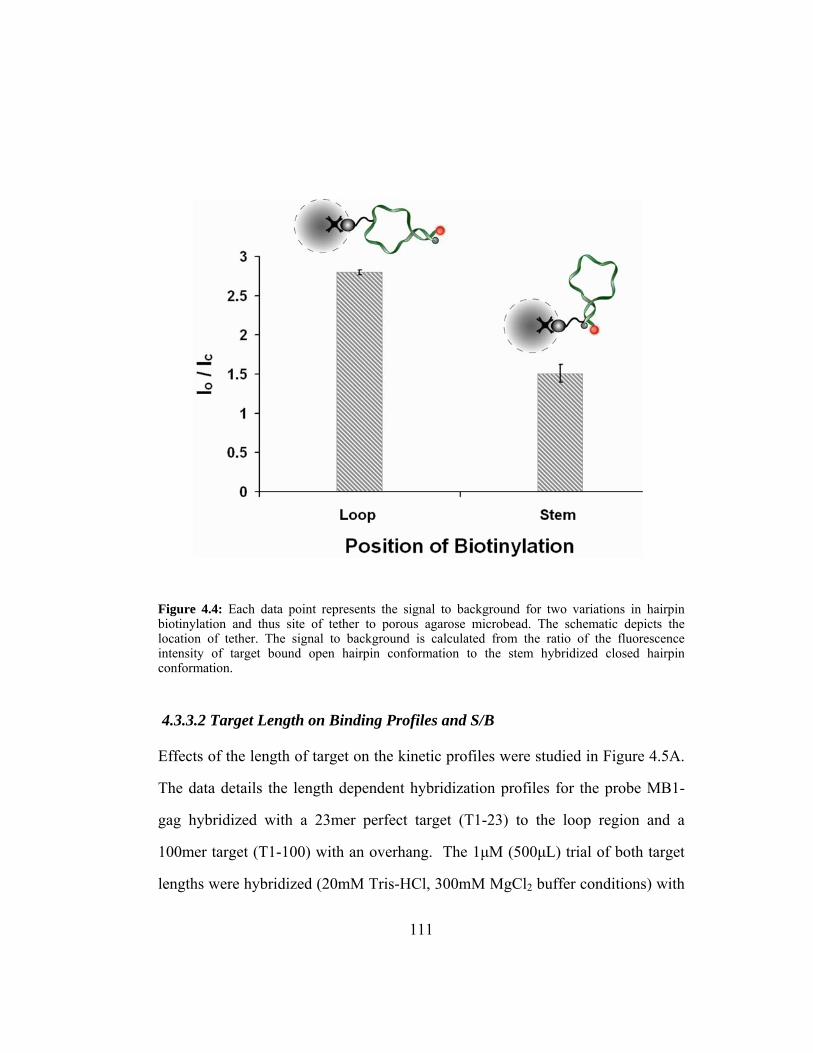
111
Figure 4.4: Each data point represents the signal to background for two variations in hairpin biotinylation and thus site of tether to porous agarose microbead. The schematic depicts the location of tether. The signal to background is calculated from the ratio of the fluorescence intensity of target bound open hairpin conformation to the stem hybridized closed hairpin conformation.
4.3.3.2 Target Length on Binding Profiles and S/B
Effects of the length of target on the kinetic profiles were studied in Figure 4.5A.
The data details the length dependent hybridization profiles for the probe MB1-
gag hybridized with a 23mer perfect target (T1-23) to the loop region and a
100mer target (T1-100) with an overhang. The 1µM (500µL) trial of both target
lengths were hybridized (20mM Tris-HCl, 300mM MgCl2 buffer conditions) with
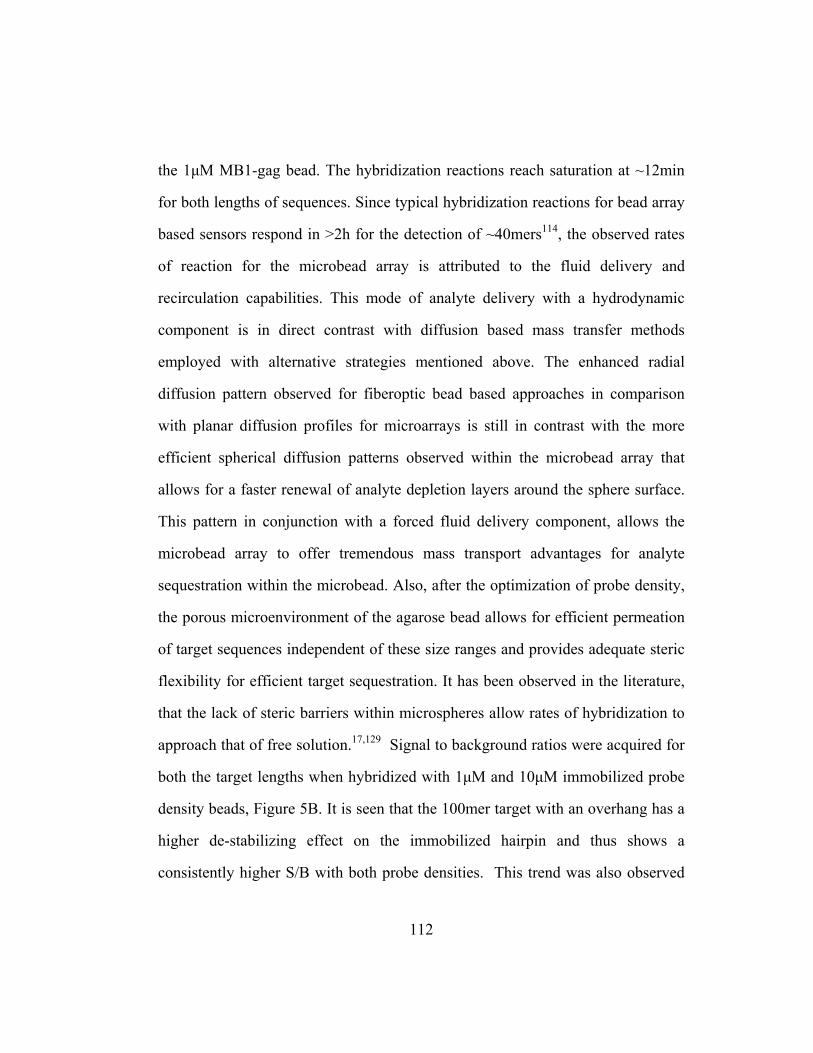
112
the 1µM MB1-gag bead. The hybridization reactions reach saturation at ~12min
for both lengths of sequences. Since typical hybridization reactions for bead array
based sensors respond in >2h for the detection of ~40mers114, the observed rates
of reaction for the microbead array is attributed to the fluid delivery and
recirculation capabilities. This mode of analyte delivery with a hydrodynamic
component is in direct contrast with diffusion based mass transfer methods
employed with alternative strategies mentioned above. The enhanced radial
diffusion pattern observed for fiberoptic bead based approaches in comparison
with planar diffusion profiles for microarrays is still in contrast with the more
efficient spherical diffusion patterns observed within the microbead array that
allows for a faster renewal of analyte depletion layers around the sphere surface.
This pattern in conjunction with a forced fluid delivery component, allows the
microbead array to offer tremendous mass transport advantages for analyte
sequestration within the microbead. Also, after the optimization of probe density,
the porous microenvironment of the agarose bead allows for efficient permeation
of target sequences independent of these size ranges and provides adequate steric
flexibility for efficient target sequestration. It has been observed in the literature,
that the lack of steric barriers within microspheres allow rates of hybridization to
approach that of free solution.17,129 Signal to background ratios were acquired for
both the target lengths when hybridized with 1µM and 10µM immobilized probe
density beads, Figure 5B. It is seen that the 100mer target with an overhang has a
higher de-stabilizing effect on the immobilized hairpin and thus shows a
consistently higher S/B with both probe densities. This trend was also observed
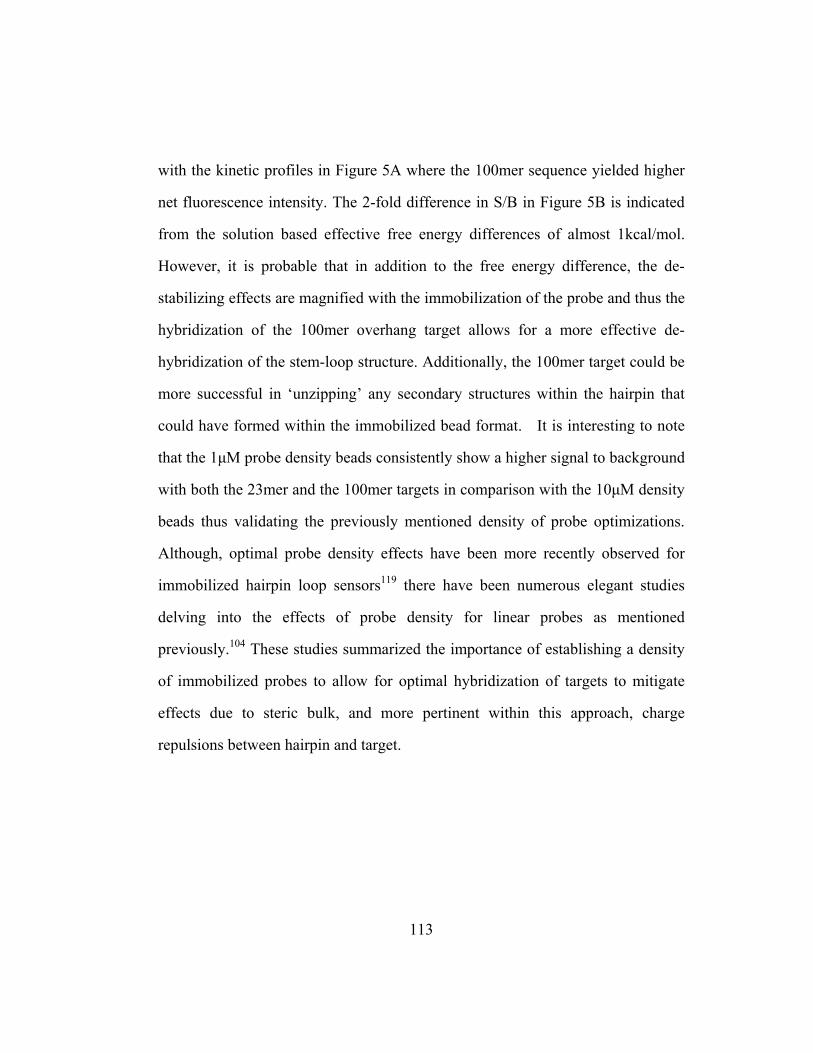
113
with the kinetic profiles in Figure 5A where the 100mer sequence yielded higher
net fluorescence intensity. The 2-fold difference in S/B in Figure 5B is indicated
from the solution based effective free energy differences of almost 1kcal/mol.
However, it is probable that in addition to the free energy difference, the de-
stabilizing effects are magnified with the immobilization of the probe and thus the
hybridization of the 100mer overhang target allows for a more effective de-
hybridization of the stem-loop structure. Additionally, the 100mer target could be
more successful in ‘unzipping’ any secondary structures within the hairpin that
could have formed within the immobilized bead format. It is interesting to note
that the 1µM probe density beads consistently show a higher signal to background
with both the 23mer and the 100mer targets in comparison with the 10µM density
beads thus validating the previously mentioned density of probe optimizations.
Although, optimal probe density effects have been more recently observed for
immobilized hairpin loop sensors119 there have been numerous elegant studies
delving into the effects of probe density for linear probes as mentioned
previously.104 These studies summarized the importance of establishing a density
of immobilized probes to allow for optimal hybridization of targets to mitigate
effects due to steric bulk, and more pertinent within this approach, charge
repulsions between hairpin and target.
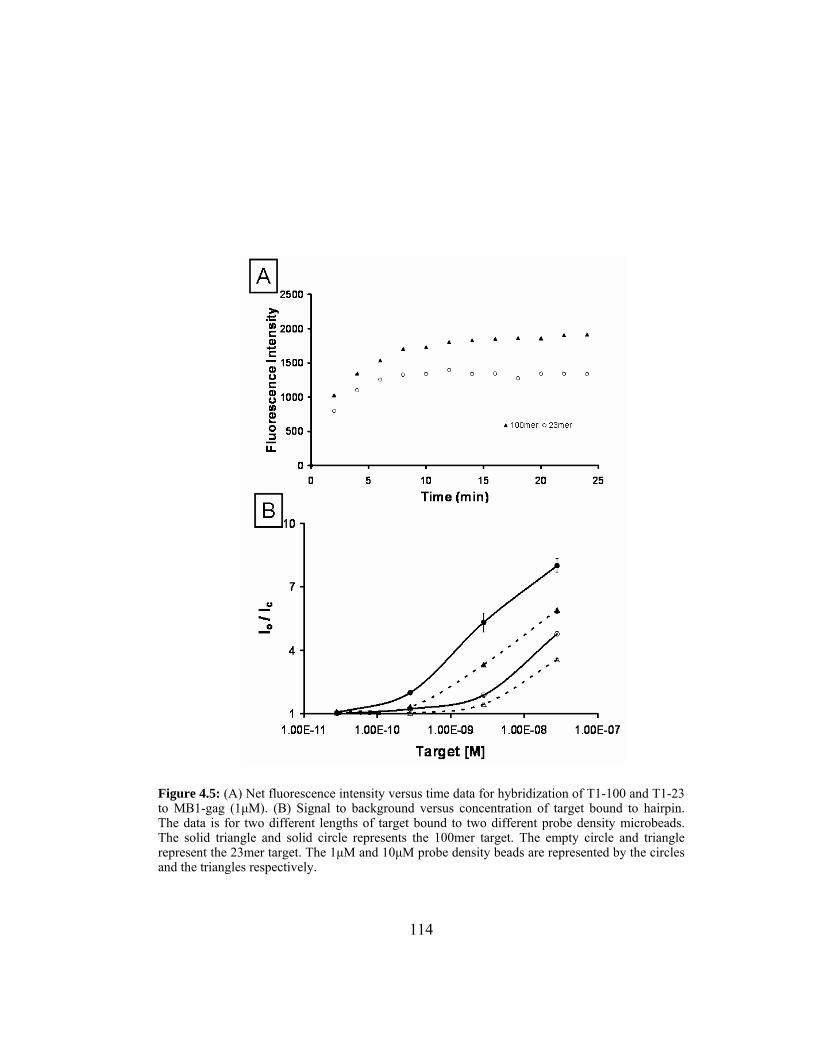
114
Figure 4.5: (A) Net fluorescence intensity versus time data for hybridization of T1-100 and T1-23 to MB1-gag (1µM). (B) Signal to background versus concentration of target bound to hairpin. The data is for two different lengths of target bound to two different probe density microbeads. The solid triangle and solid circle represents the 100mer target. The empty circle and triangle represent the 23mer target. The 1µM and 10µM probe density beads are represented by the circles and the triangles respectively.

115
4.3.3.3 Immobilization Strategies
Additional target hybridization options were explored in order to gain
further insight into the probe-target duplex formation events occurring within the
complex polymeric microsphere. The schematic in Figure 6A depicts the
traditional duplex formation possibility occurring within the polymer bead. In
efforts to possibly increase the binding events of the 100mer target with a pseudo
bi-dentate approach, a hairpin loop for the free end of the target was designed.
The schematic in 6B details the hybridization events envisioned for the
‘coordination’ of the 100mer target with the bi-beacon approach. The hope here
was that the two–prong mechanism to hybridizing the target could possibly
increase the binding events within the microsphere and lead to a higher effective
signal to background. Figure 7 shows the S/B for duplex target formation with the
MB1-gag hairpin structure. As aforementioned the higher S/B seen for the 1µM
probe density bead type in comparison with the 10µM was validated with
reference to steric influences hindering the effective signal acquisition of the
higher density probe in conjunction with a higher effective background. Thus, the
similar S/B for the dual-beacon approach in comparison with the 1µM probe
density bead is not surprising, Figure 7. The addition of a second bulky hairpin
molecule (MB2-gag) within the microsphere did not alleviate any steric burden
and in effect could increase quenching with the addition of an extra pair of labels.

116
Figure 4.6: Schematic hybridizing target with (A) hairpin and (B) dual hairpin approach and (C) hairpin and additional linear probe.

117
This steric influence was explored an extra step by introducing a linear probe
within the bead matrix in lieu of the second hairpin molecule as shown in Figure 6
C. This immobilized linear region was identical in sequence to the loop region of
MB2-gag. This step would essentially mimic the dual-beacon approach with one
beacon and one linear probe. Interestingly enough as seen in Figure 7, this
alternative approach using a second linear sequence is found to lead to almost a
50% increase in S/B for the immobilization of the 100mer target in comparison
with the 1µM probe density. This data helps in shedding some light on the
complex molecular interactions occurring within the polymer matrix.

118
Figure 4.7: S/B for the hybridization of 100mer target with various immobilization strategies within the bead matrix.
4.3.4 Mismatch Discrimination
In efforts to explicate the specificity of the hairpin loop structure, once
immobilized within the microbead sensor element, artificial mutations of the
perfect target (T1-23) to MB1-gag were generated. The perfect match to MB1-gag

119
Table 4.2: Mismatched sequences for discrimination studies (5’ 3’)
has a Tm of 78.1 °C, T1-MM1 with a A:C base mismatch has a Tm of 73.7 °C, T1-
MM2 with a T:T base mismatch has a Tm of 73.8 °C, T1-MM3 with double
mutations G:T; G:T has a Tm of 74.6 °C and T1-MM4 also with double
mutations A:A; A:G has a Tm of 77.5 °C. Thus, to determine the degree of
specificity for the microbead array, 0.1µM (1350 µL) of samples T1-23, T1-
MM1, T1-MM2, T1-MM3 and T1-MM4 were hybridized with a new array of
MB1-gag immobilized beads (1µM) consecutively in 20mM Tris-HCl, 5mM
MgCl2. Figure 8A shows the signal to background after hybridization of the
complement and mismatched samples versus the change in melting temperature
for each type relative to the perfect complement. As the data indicates the perfect
complement with the higher free energy and thus most stable hybrid yields the
higher S/B whereas as expected the single base mutations with the least stability

120
offer the lowest S/B. More interestingly, however, is the efficacy of the
microbead array to distinguish between sequences with closely separated Tm’s as
seen with the selectivity of T1-MM4 which displays a Tm value of only 0.6 °C
lower than that of the perfect target. The difference in stability is expected from
the thermodynamic data for the sequences as well as type and location of
mismatch, but this is duly represented by the 30 % reduction in signal to
background ratio for T1-MM4 in comparison to the perfect target. Although, there
has been an efflux of heterogeneous microarrays capable of SNP detection, the
extension of the feasibility towards more complex conditions such as multiple
mutations is still lacking.120 Thus, the capability of the microbead array towards
the detection of multiple mutations with a higher stability is consistent with
previously demonstrated linear probe SNP detection thresholds for this bead
array,23 but more importantly furthers the progress of biosensor flexibility towards
mutational analysis as a whole.
Figure 8C details the topographic profiles of the raw photomicrographs of
a single bead from the array of microspheres used for the selectivity experiments.
As seen from the data, the mismatched topographical maps clearly show a
reduction in the increase of the raw signal. The net reduction in signal intensity is
especially valid since the background fluorescence prior to any hybridization for
all five bead conditions are within <5% RSD of each other, Figure 8D.
Additionally, an effective discrimination ratio could be calculated from the ratio
of the perfect match fluorescence intensity to that of the mismatched. The above
mentioned discrimination studies yielded selectivity indices of ~23.38 and ~6.94

121
for the one base paired mismatch T1-MM-1 (A:C) and T1-MM2 (T:T)
respectively. This data far surpasses similarly studied mismatches yielding ratios
of 2.89 for a A:C118 (Figure 8B) and 1.8 for a T:C125. Although, the selectivity
indices for T1-MM3 and T1-MM4 are reduced as expected to 1.65 and 1.35
respectively, these ratios are still extremely viable in establishing the overall
utility of the microbead array towards discriminating a spectrum of mutations.
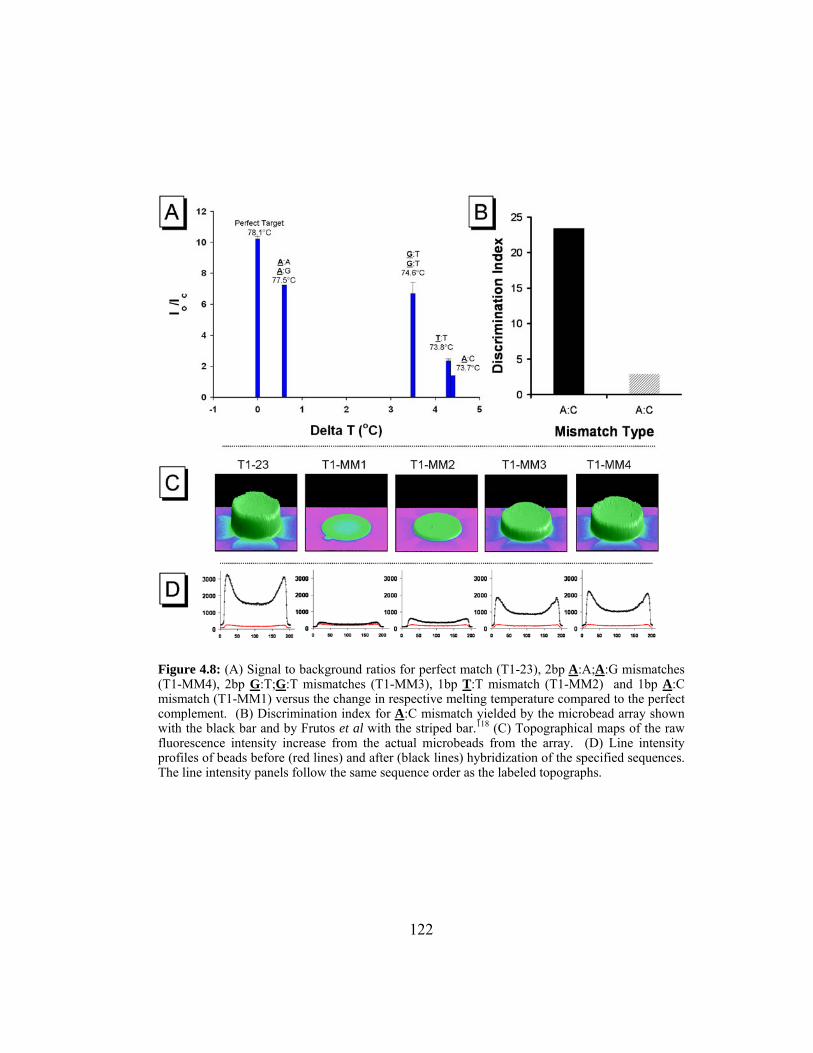
122
Figure 4.8: (A) Signal to background ratios for perfect match (T1-23), 2bp A:A;A:G mismatches (T1-MM4), 2bp G:T;G:T mismatches (T1-MM3), 1bp T:T mismatch (T1-MM2) and 1bp A:C mismatch (T1-MM1) versus the change in respective melting temperature compared to the perfect complement. (B) Discrimination index for A:C mismatch yielded by the microbead array shown with the black bar and by Frutos et al with the striped bar.118 (C) Topographical maps of the raw fluorescence intensity increase from the actual microbeads from the array. (D) Line intensity profiles of beads before (red lines) and after (black lines) hybridization of the specified sequences. The line intensity panels follow the same sequence order as the labeled topographs.
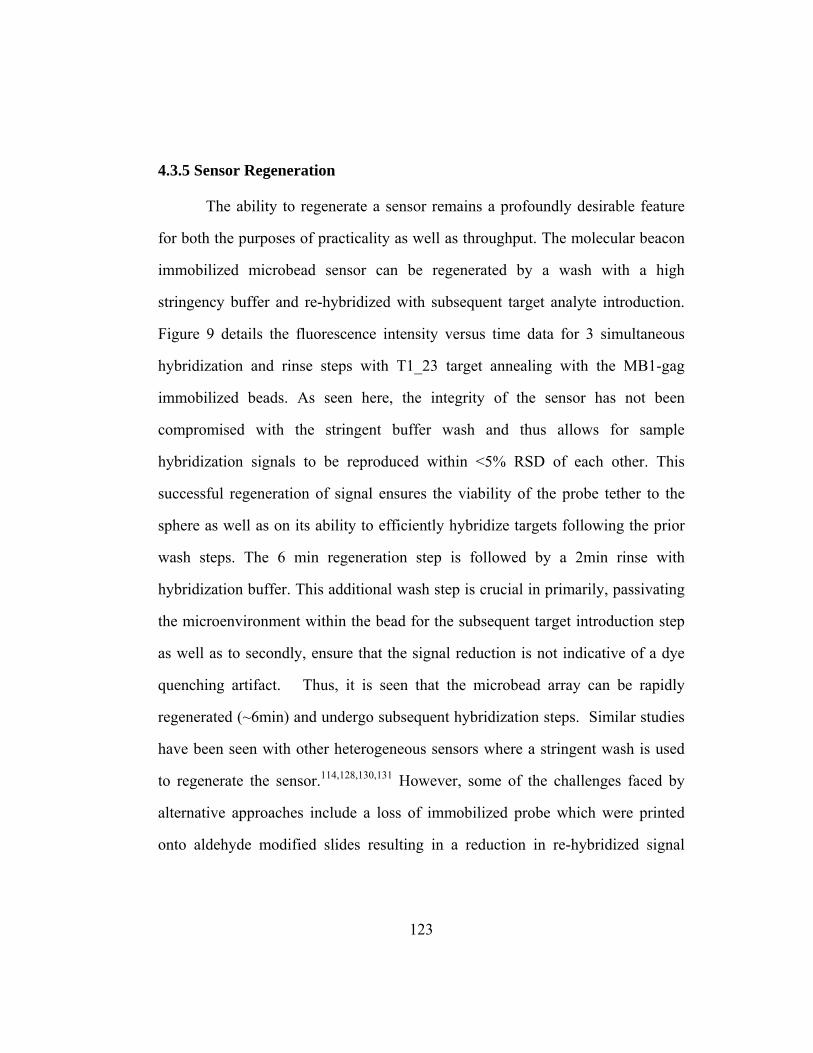
123
4.3.5 Sensor Regeneration
The ability to regenerate a sensor remains a profoundly desirable feature
for both the purposes of practicality as well as throughput. The molecular beacon
immobilized microbead sensor can be regenerated by a wash with a high
stringency buffer and re-hybridized with subsequent target analyte introduction.
Figure 9 details the fluorescence intensity versus time data for 3 simultaneous
hybridization and rinse steps with T1_23 target annealing with the MB1-gag
immobilized beads. As seen here, the integrity of the sensor has not been
compromised with the stringent buffer wash and thus allows for sample
hybridization signals to be reproduced within <5% RSD of each other. This
successful regeneration of signal ensures the viability of the probe tether to the
sphere as well as on its ability to efficiently hybridize targets following the prior
wash steps. The 6 min regeneration step is followed by a 2min rinse with
hybridization buffer. This additional wash step is crucial in primarily, passivating
the microenvironment within the bead for the subsequent target introduction step
as well as to secondly, ensure that the signal reduction is not indicative of a dye
quenching artifact. Thus, it is seen that the microbead array can be rapidly
regenerated (~6min) and undergo subsequent hybridization steps. Similar studies
have been seen with other heterogeneous sensors where a stringent wash is used
to regenerate the sensor.114,128,130,131 However, some of the challenges faced by
alternative approaches include a loss of immobilized probe which were printed
onto aldehyde modified slides resulting in a reduction in re-hybridized signal

124
following subsequent wash steps or due to instability of the label in the wash
buffer.117,131
Figure 4.9: Real-time hybridization data of the recirculation of T1-23 over an array of MB1-gag beads where the same array was regenerated over three trials. Fluorescence images were taken every 60s with a CCD exposure time of 1s.
4.3.6 Design of Molecular Beacon
Extensive studies have been undertaken in solution phase to help elucidate
the effect of the lengths of stem and loop as well as the stem binding targets on
the stability of the hairpin structure which is directly related to the signal to
background as well as on the ability of the hairpin to discriminate mutations.132
The basic trend derived from thermodynamic studies133 shows that longer stem
lengths tend to be more efficient at discriminating mutations over a wider
temperature range. The disadvantage of the longer stem length is a decreased rate
of target hybridization by the hairpin. Similar to the behavior noted for linear

125
probes, increasing probe length in the loop also tends to decrease specificity by
decreasing the range of temperatures within which discrimination of mutations
from perfect complements can occur.133 Additionally, increasing probe lengths
tend to lower dissociation constants and increase kinetic rate constants and can be
explained by the structural mechanism for hybridization. This hybridization
process is postulated to follow a sequence of three steps initiated by target
hybridization to a few base pairs in the probe. When the ensuing ‘zipping’ of the
target to probe region increases, the stems are ‘unzipped’ and the hairpin structure
opens. This second step is followed by the base pairing of the remaining probe
and target complementary regions. Thus, the kinetic effects of lengths of probes
and stems are explained by the reasonable assumption that the primary target
binding to probe region tends to pose the largest constraint since the target needs
to conform to the initial loop structure of the probe. Longer probe lengths would,
therefore, allow for easier conformation and thus increase kinetic rate constants
and subsequently lower the probe target dissociation constant. Consequently, the
length of stems would influence the second step of the hybridization process by
either decreasing rate of hybridization with a longer stem length or vice versa.
These trends have been thoroughly explored in solution phase by Tsourkas et
al.132-134 Although typical efficient probe lengths range from 15-25 bases9,109 with
stem lengths in the range of 5-7 bases,126 a fine balance needs to be attained
between the probe and stem lengths since this design of the hairpin structure
could lead to crucial differences in the ability to discriminate SNPs efficiently as
well as attain high specific signal to background ratios for higher sensitivities.

126
4.3.6.1 Stem Binding Target for Bacillus anthracis
The hairpin molecule MB1-gag which consisted of a seven base pair stem
showed S/B ratios of ~10-12 which exceed typical heterogeneous sensors with
S/B ratios in the range of ~2-590,130 in addition to excellent mismatch
discriminatory ability for single base pair mutations relative to other immobilized
beacon sensors.118,125 However, in order to further study the effect of structural
variations within a hairpin molecule in combination with the microbead array, a
stem-loop structure was designed whose loop region is complementary to a target
from the conserved 16S rRNA region of the Bacillus anthracis (Sterne) strain.
This hairpin region also consists of a seven basepair stem as the HIV gag specific
beacon, but contains a longer twenty-seven basepair loop region. Furthermore, the
target hybridized with one additional base in the stem of the hairpin. Shared stem
molecules are shown to form more stable duplexes with targets, but could lose
their discriminatory abilities if the stem lengths are too short. Therefore, the seven
base pair stem was retained in order to avail discrimination capabilities with
possible advantages over stability. These few changes resulted in tremendous
differences in the signal to background ratios generated from the microbead array
immobilized to MB3-anth. Figure 10A details the signal to background versus
probe density of the immobilized hairpin with hybridization of the 90bp target. In
this case the 10µM probe density microbeads show the most optimized signal to
background ratio of ~27. This ratio is almost a 3-fold increase in comparison with
MB1.
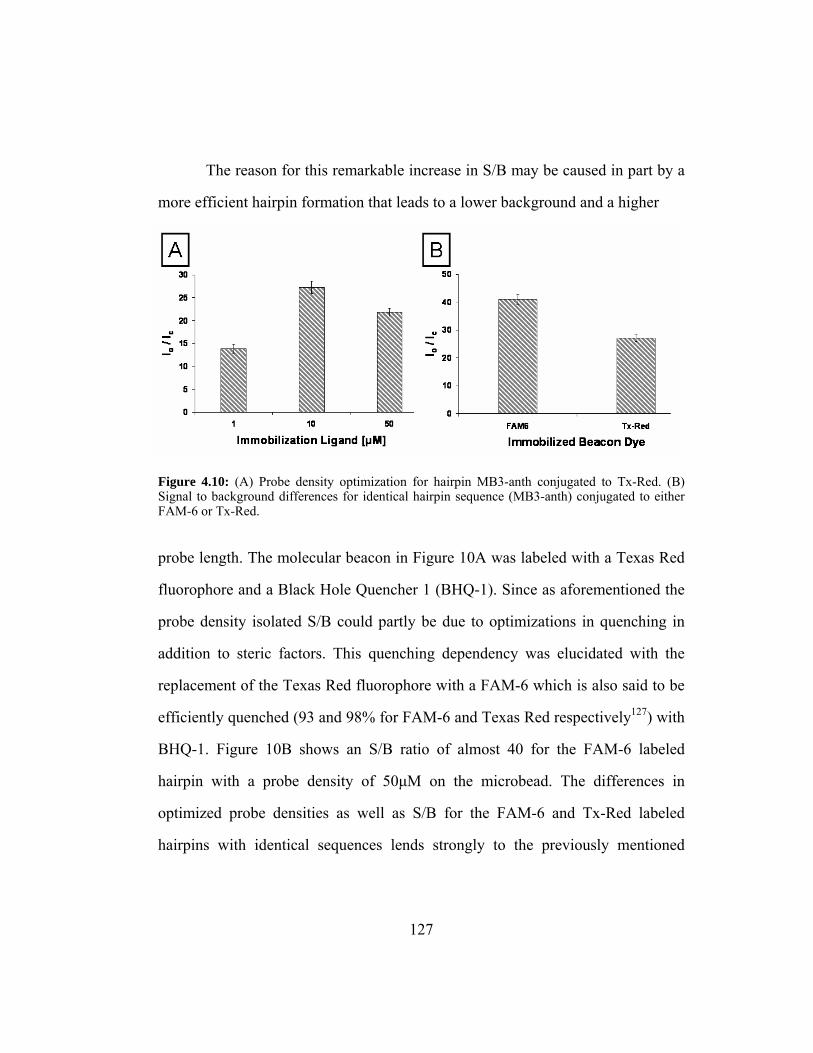
127
The reason for this remarkable increase in S/B may be caused in part by a
more efficient hairpin formation that leads to a lower background and a higher
Figure 4.10: (A) Probe density optimization for hairpin MB3-anth conjugated to Tx-Red. (B) Signal to background differences for identical hairpin sequence (MB3-anth) conjugated to either FAM-6 or Tx-Red.
probe length. The molecular beacon in Figure 10A was labeled with a Texas Red
fluorophore and a Black Hole Quencher 1 (BHQ-1). Since as aforementioned the
probe density isolated S/B could partly be due to optimizations in quenching in
addition to steric factors. This quenching dependency was elucidated with the
replacement of the Texas Red fluorophore with a FAM-6 which is also said to be
efficiently quenched (93 and 98% for FAM-6 and Texas Red respectively127) with
BHQ-1. Figure 10B shows an S/B ratio of almost 40 for the FAM-6 labeled
hairpin with a probe density of 50µM on the microbead. The differences in
optimized probe densities as well as S/B for the FAM-6 and Tx-Red labeled
hairpins with identical sequences lends strongly to the previously mentioned

128
speculation that the probe densities also affect the effective quenching abilities of
the hairpins.
Figure 4.11: Fluorescence photomicrographs and corresponding topomaps of microspheres immobilized with beacon (A) MB1-gag conjugated to Tx-Red, (B) MB3-anth conjugated to Tx-Red and (C) MB3-anth conjugated to FAM-6. The left hand photomicrograph and corresponding topo map within each panel (A,B and C) detail the background signal of the beacon immobilized microsphere and the right-hand photomicrograph and topomap within each panel detail the signal after the hybridization of targets. The epi-fluorescent images were taken at 1s camera exposure for all panels. T1-100 was hybridized with A and T3-90 was hybridized with B and C, all at concentrations of 0.4µM.
Figure 11 details the signal to background intensities derived from the
three discussed hairpin structures. From the raw photomicrographs and the
corresponding intensity topographical maps it is possible to view the background
and attenuated signal disparities between the three different molecular beacons.
Figure 11A details the 1µM probe density bead type of the MB1-gag hairpin. The
image and topomap on the left of panel (A) show the background signal
associated with this beacon. The fluorescence intensity increase after the
hybridization of a 1µM solution of complementary 100bp target is detailed in the
image and topomap on the right hand side of the panel. Subsequently similar
images and topomaps are represented in panels B and C for MB3-anth:TxRd and

129
MB3-anth:FAM-6 respectively. The anthracis specific beacons were also
hybridized with a 1µM solution of their 90bp complementary target.
Analysis of these three panels can provide insight into the origin of the
background differences associated with the three hairpin loops, where the MB1-
gag beacon (A) has the highest effective background and the MB3-anth:FAM6
(C) has the lowest. Also, it is apparent that although the background for the MB3-
anth:TxRed (B) beacon-bead is not much lower (21%) than MB1-gag, the
effective signal acquisition is at saturation under the same conditions. Therefore,
to reiterate it is the combination of both low background provided by a stable
hairpin formation within the porous agarose matrix and high target hairpin duplex
formation enhanced with target-stem binding and high binding capacity of sensor
that provides the optimal signal transduction to background from the hairpin
immobilized bead. Thus, the efficacy of the microbead array towards utilizing
immobilized hairpin loop structures with enhanced signal to background ratios of
>40 have been shown. These values are on par with solution phase based S/B
ratios in the range of 10-200109 versus that of previously immobilized sensors
yielding ratios of <25115,119,122
4.3.6.2 LOD of 90bp 16S rRNA Bacillus anthracis Specific Sequence
Based on the excellent signal to background ratios acquired from the
preliminary experiments conducted with the FAM-6 conjugated MB3-anth hairpin
structure, limit of detection (LOD) thresholds for the 90bp anthracis target were
explored. For these experiments, the LOD corresponds to the minimum

130
concentration of target sequence that can be detected reproducibly by the
microbead array. The LOD is obtained as minimal concentration that exhibits
signal 3σ above the zero calibration blank. The dose dependent data were
determined from an array of MB3-anth (FAM-6) microspheres with the
hybridization of 500µL of T3-90 under recirculation over a range of 10-6 - 10-12M.
Figure 12 details the calibration curve established for this target where a limit of
detection of 130pM was successfully detected at 3σ above the mean background
level. Thus, the LOD of the microbead array is either comparable or significantly
lower in comparison with the most efficient existing fluorescence-based hairpin
immobilized sensors.114,115,122,126 These alternative approaches yield detection
limits of ~2.6nM for bead based assays with flow cytometer detection,122 ~1nM
for glass slide immobilized sensors,126 ~10nM for both agarose film immobilized
probes90 as well as for fluorophore-tagged hairpins attached to gold films,115 and
~100pM for bead-fiber-optic based hairpin sensors.114 Although elegant
developments for a ‘signal off’ electrochemical sensor provide detection limits of
~10pM,117 the inherent false-positive responses leading to complexity for
performing multiplexed assays reduces the overall impact of this approach.
Furthermore, the sensitivity thresholds afforded by the microbead array is in
perfect concert with the rates of reaction and high selectivity capabilities
mentioned herein and thus provides a facile method for the end-point detection of
amplified sequences.

131
Figure 4.12: Detection of Bacillus anthracis 90bp target (T3-90) with MB3-anth conjugated to FAM-6. Shown is the S/B versus concentration titration curve. The dashed line represents the 3σ above background level.
4.3.9 Multiplexed Detection of Bacillus anthracis and HIV gag isolates
The high specificity exhibited by hairpin structures naturally lends them to
be useful for the detection of multiple analytes in a multiplexed fashion. Solution
phase experiments have shown great prowess towards this very goal with multiple
beacons consisting of fluorophores, with well separated emission profiles, each
being utilized to specifically isolate a sequence, respectively.112,135 This aspect
was specially useful for solution phase PCR to allow for a sensitive, high-
132
throughput nucleic acid assay with simultaneous real-time detection.136,137
However, of equal importance, is the necessity of multiplexing within a
heterogeneous microarray platform.114
Figure 4.13: Multiplexed detection of 90bp Bacillus anthracis and 100bp HIV gag targets. The solid circles represent the signal from the microbeads immobilized with the Bacillus anthracis hairpin probe, whereas the empty squares represent the signal from the beads immobilized with the HIV gag specific beacon. (A) Signal versus time data for hybridization of only T3-27, the Bacillus anthracis isolate. (B) Signal versus time data for hybridization of only T1-23, the HIV gag isolate. (C) Signal versus time data for multiplexed detection of T3-27 and T1-23 simultaneously.
This capability will allow for the identification of multiple sequences for uses
such as a tool for rapid mutation detection or to elucidate various pathogenic
sequences in a simple yet simultaneous fashion. To this end, the multiplexed
detection of synthetic targets from the Bacillus anthracis Sterne strain and HIV-1
gag gene were completed with the microbead array. Since the reliability of
quantitative multiplexed assays is measured by the independent signal acquisition
of each probe by each specific target, the microbead array preliminary
experiments were isolated into three steps. Figure 13A details the hybridization of
the 90bp anthracis specific sequence (T3-90) with an array of microspheres

133
separately encoding hairpin loops MB1-gag (control) and MB3-anth. The specific
signal acquisition of the MB3-anth beads and the baseline response from the HIV
specific MB1-gag beads is indicative of a successful initial step towards
concurrent sequence detection. The reverse format as seen in Figure 13B, where
the HIV-1 gag specific target (T1-100) is hybridized with a similar array of
encoded beads, also yields a positive response only from the complementary
sequence containing MB1-gag beads and not from the control anthracis specific
hairpin. Thus, Figure 13C details the simultaneous detection of equimolar ratios
of target sequences T1-100 and T3-90 hybridizing specifically with
complementary microsphere encoded hairpins. This data is additionally validated
by observing that the separately delivered and multiplexed targets not only follow
similar patterns of signal acquisition, but that the attenuated signal intensities
yield a %RSD of ~5. Furthermore, hybridization times of < 10min are required
for the signal saturation level with these 1µM target solutions which further
strengthens the recognition of the microbead array’s capabilities towards high-
throughput, real-time multiplexed assays.
4.4 SUMMARY AND CONCLUSIONS
In conclusion, the incorporation of hairpin molecules consisting of an
inbuilt FRET based sensing system within the microbead format has shown great
efficacy for the multiplexed detection of isolates from the HIV gag gene and
Bacillus anthracis (Sterne) 16S rRNA region. The combination of the microbead
array with the hybridization capabilities of the molecular beacons, provides a
powerful tool for the multiplexed elucidation of sequence variations in disease

134
genes and allows for the rapid detection of 90mer oligonucleotides with signal to
background ratios of greater than 40. These large values for signal to background
are comparable to typical values obtained for homogeneous molecular beacon
systems and are superior to prior immobilized sensor approaches. This enhanced
signal to background ratio could in part be attributed to the sensor architecture
that allows for facile flexibility towards optimizing density of probes as well as to
the high binding capacity polymer support for probe immobilization whose
porous nature also allows for simple passivation of charge repulsions.
Additionally, the molecular detection capabilities are in perfect concert with the
integrated fluid delivery abilities of the microbead array and allow for signal
saturation rates of ~12min. These values are in contrast with existing approaches
exhibiting signal to background ratios of <25 and employing diffusion limited
transport mechanisms. Furthermore, the microbead array strategy has resulted in a
high-throughput sensor that exhibits excellent discrimination capabilities towards
SNP detection via immobilized hairpin-loop structures as well as for sensor
regeneration with capabilities for automation. Reproducible batch immobilization
of microspheres also greatly increases the throughput and reliability of this
approach. Thus, the culmination of forced fluid delivery resulting in rapid
reaction times and high signal to background sensors yielding sensitivities of ~
130pM with high selectivity for nucleotide mutation analysis has allowed the
DNA microbead array system to present itself as a reliable end-point detection
approach of amplified sequences.
135
Chapter 5: µ-Channel PCR Chip Based Amplification and Microbead Array Detection
5.1 INTRODUCTION
The amplification section of this Chapter was carried out in collaboration
with Dr. Shifeng Li and Mr. David Fozdar from the laboratories of Professor
Shaochen Chen in the Mechanical Engineering Department at The University of
Texas at Austin. Dr. Li and Mr. Fozdar were responsible for the chip fabrication
protocols mentioned herein in addition to numerous modeling parameters probed
to optimize thermal and fluid delivery patterns within the µ-channels. Detailed
descriptions of the various modeling techniques employed to validate the µ-
channel PCR chip have been published in a peer reviewed journal.138
Polymerase Chain Reaction (PCR) serves as commonly used methodology
to amplify specific regions of DNA between two known flanking base pair
sequences. The method of PCR has become one of the most widely utilized
scientific tools in molecular biology since its inception in the mid-1980s.
Conventional PCR has revolutionized fields like molecular biology and
biochemistry and has become an important tool in forensics, genetics, the
evolutionary sciences, clinical research, and in many other areas.139 Its
applications range from diagnosis of infectious disease to analysis of specific
gene mutations that occur in a variety of genetic disorders.
PCR amplification is obtained using short oligonucleotide primers which
exactly complement the flanking sequences. Once attached to the host strands,

136
the primers are extended by a DNA polymerase enzyme in the presence of
deoxynucleoside triphosphates (dNTPs). Reaction conditions and heat transfer
rates must be optimized for the PCR process to be run smoothly and efficiently.
PCR can be conveniently divided into three distinct phases: denaturation
(melting), annealing (hybridization), and extension (replication). In the
denaturation phase, dsDNA (double-stranded DNA) is heated to approximately
85-98°C so that the two strands of nucleotides divide into two single strands
(ssDNA). Once the strands have separated, the temperature is cooled to 50-60°C
for the annealing phase where the primers hybridize to a flanking sequence on
each ssDNA template. Finally, the temperature is increased to 70-75°C and the
target region is extended by means of a Taq polymerase enzyme starting from the
flanking sequence and ending at the other end of the template. The Taq enzyme
essentially extends the primers by pulling the dNTPs from the sample solution to
complete the new copies of the target sequence. In contrast to denaturation and
hybridization, which occur almost instantly, the length of the extension phase is
restricted by the 100 nucleotide per second extension rate of the Taq enzyme.
Theoretically, the time limiting factor for the reaction is the extension phase.140
Realistically, the time constraining factor for the reaction involves limitations in
the achievable heating and cooling rates of the sample.
In the past decade, microfabrication technology has led to the
development of a variety of high-throughout miniature PCR microdevices. This
technology has allowed for a drastic increase in heat transfer rates due to the high
surface area-to-volume ratio associated with microstructures. Such devices have

137
been mainly constructed under two basic design platforms. The more common
platform consists of etched microchambers in silicon that host immobilized
(stationary) samples in contact with heating elements that cycle the
temperature.141-144 The other platform is based on a continuous-flow format
where the sample is spatially cycled in a serpentine microchannel through three
well-distinguished permanent temperature zones.145-152
Since optimum reaction temperatures and exposure times of the sample to
each temperature are key to successful DNA amplification, thermal / fluid control
of heat transfer rates, temperature distributions, and sample velocities within the
microchip and of the DNA sample is a critical issue in PCR technology.153
Typical problems associated with current flow-through PCR microdevices
include: failure to maintain uniform temperatures in each of the three monolithic
temperature zones due to lateral heat conduction between the heaters and
unnecessarily extended transitional times, the periods in which the DNA sample is
not at one of the three optimal phase temperatures (the region between the
temperature zones). Obstacles like nonspecific amplification and low product
yield typically arise from exceedingly long transitional times between the optimal
temperatures of each phase and by unnecessarily extended exposure times to the
high denaturation temperature. The way in which the heating and cooling of the
samples is implemented in PCR is vital for high product yields and specificity.
Although efforts have been made to study thermal / fluid transport phenomena
within continuous-flow PCR devices, design approaches for better thermal / fluid
control have not yet been explored.145-147
138
Here is presented a continuous-flow PCR microdevice with “regional
velocity control” and a better heating configuration for the efficient chemical
amplification of DNA. The microdevice contains a serpentine microchannel with
varying widths serving to regulate the flow velocities of the DNA sample through
the channel limiting transitional times, the time periods in which the sample is
traveling between temperature zones (denaturation, annealing, and extension
zones). Channel width variations were made by sets of periodically arranged
expanding and contracting conduits. Successful amplification of a 90 base pair
isolate from the 16S rRNA region of the Bacillus anthracis genome was achieved
using this variable channel width PCR microchip.
5.2 EXPERIMENTAL DETAILS AND DISCUSSION
5.2.1 Design Features/Fabrication of the Continuous-Flow PCR Microdevice
In designing the continuous-flow PCR microdevice with regional velocity
control, the following aspects were found to be very important: 1) microchip
material selection, 2) serpentine microchannel geometry / dimensions (i.e. number
of reaction cycles, length ratio ~ a ratio of the channel lengths traversing each
temperature zone per geometrical thermal cycle), 3) microchip / heating assembly
fabrication, and 4) heater spacings (the spacing between the temperature zones).

139
5.2.1.1 Microchip Material Selection
Polymers have been extensively used for biomedical microdevices since
many are cheap as well as biocompatible, and lend themselves to unique features
which depend on the particular material and application.142,144,147 However,
because most polymers are highly permeable to gases, they are usually
insufficient for use in PCR microdevices.144 Silicon and glass have been the most
widely used materials in lab-on-a-chip devices since a vast array of well-
established integrated circuit (IC) and microfabrication technologies are available.
The high thermal conductivity of silicon makes it difficult to maintain discrete
well-regulated temperature zones due to lateral heat conduction and its opaque
optical characteristics restrict the utilization of real-time fluorescence detection
techniques. To the contrary, glass is an excellent choice for PCR microdevices
since it is impermeable to gases, is readily treated by a variety of surface coating
agents to reduce DNA and enzyme adsorption, is transparent to visible light
making it amenable to fluorescence detection,154 and has a thermal conductivity
suitable for establishing uniform temperature zones within a confined area while
limiting lateral heat conduction.
5.2.1.2 Serpentine Microchannel Geometry and Heater Assembly Spacings
The geometry and arrangement of the serpentine microchannel with
respect to the three temperature zones must ensure that the microchannel
sufficiently traverses through each temperature zone, reduces the possibility for
flow recirculation / bubble formation, and limits overall microchip dimensions.
The layout of the channel must be consistent with the orientation and

140
configuration of the heating assemblies. The velocity of a sample in a typical
serpentine channel of constant cross-sectional area for PCR is the same
throughout; velocities in both the transitional regions and temperature zones are
monotonous. This results in unnecessarily extended denaturation, hybridization,
and transitional periods that degrade enzyme activity and spawn the improper
duplication of spurious DNA species. To eliminate these extended periods, the
width of the microchannel in the flow-through chip was made variable in a
periodic arrangement throughout its length by integrating expanding and
contracting conduits, linear expansions and contractions in the side-walls of the
microchannel. Small channel widths were set in the transitional zones so that the
sample would have relatively high flow velocities in these regions. Larger widths
were set in the temperature zones (denaturation, annealing, and extension) to
provide for optimal exposure times. The dimensions of the channel were
carefully chosen to avoid flow recirculation, which nucleates bubbles. The
exposure time ratio of the sample to each temperature zone was decided at 1:2:4
for denaturation, hybridization, and extension, respectively. The widths for
denaturation, hybridization, and extension (100 µm, 273 µm, and 340 µm,
respectively) were predetermined by considering, to a close approximation, the
relative exposure needs of commonly amplified DNA fragments. The channel
width in the transition zones was set to 10 µm to coerce the sample through these
interim regions at high velocities. The depth of the channel was maintained at 30
µm throughout its length so that the magnitude of the cross-sectional area was
controlled by channel-width alone. To determine the channel-widths and

141
microchannel length-ratio, the spacing between the heaters was optimized to limit
lateral heat conduction, which smears the temperature zones. Twenty identical
channel oscillations (thermal cycles) for a 20-cycle PCR reaction were designed
into the microchip. In addition to the normal reaction cycles, a preliminary
extended melting cycle, providing for “hot start” PCR, and an extended post-
extension cycle were appended to maximize replication.
5.2.1.3 Microchip / Heating Assembly Fabrication
To create the etched serpentine microchannel, a 100 nm amorphous silicon
thin-film was initially deposited on a four-inch diameter borosilicate glass wafer.
Amorphous silicon was chosen as the masking material due to its selective nature
to the etchant.155 After patterning, the channel was etched to 30 µm with
hydrofluoric acid (HF) and stripped by reactive ion etching with CF4 plasma. On a
separate glass wafer, three holes of 1.0 mm diameter were powder blasted as
inlets and outlets for access to the channel (additional assembly required). The
patterned wafer and the separate glass piece with the holes were fusion bonded to
the wafer with the serpentine microchannel.
To provide access to the channel, Headless Coned Nanoport Assemblies
(UpChurch Scientific, N-126H, WA, USA) accommodating 0.79-mm (1/32-inch)
tubing (OD) were bonded over the powder blasted holes on the upper wafer halve
(after fusion bonding). Prior to affixation, the bottom surfaces of the Nanoports
were soaked in isopropyl alcohol (IPA) for 5 min and the fused glass PCR
microchip was cleaned in a Piranha solution (1600 ml H2SO4 + 800 ml H2O2) for

142
10 min. Both substrates were dried with N2 gas and placed on a 100 °C hot plate
for 20 min to remove residual moisture. Two layers of a ring-shaped
biocompatible epoxy were attached to each of the Nanoports to bind them to the
glass directly superseding the holes. Alignment with the holes was achieved by
threading a glass capillary of 0.4 mm diameter through the Nanoports and placing
the far end of the capillary into the holes. The ports were positioned by letting
them slide down the capillary directly onto the holes. Manual pressure was
subsequently applied to the Nanoport to ensure complete adherence to the glass.
The bond was made permanent by clamping the ports down while baking at 120 oC for 90 min. The length, width, and thickness of the assembled chip measure 75
mm, 48 mm, and 1 mm, respectively.
Three heating assemblies, consisting of thin-film resistive Kapton Heaters
(Minco, HK5160R157L12, MN, USA) appended to rectangular copper blocks,
were integrated onto the chip to create the three discrete temperature zones. The
copper blocks, measuring 60 mm long x 12 mm wide x 7 mm high, provided for
more uniform temperature zones due to their lumped thermal capacitance and
high thermal conductivity. The Kapton Heaters were bonded to the copper blocks
using a single layer of a thermally conductive epoxy (Minco, PSA #10, MN,
USA). The heater / copper block compilations were later applied to the glass
substrate using two layers of the same adhesive. Thermocouples (Minco,
S245PD12245, MN, USA) were cemented to each of the three copper blocks for
temperature feedback via a connection to three digital PID (proportional, integral,
and derivative) temperature controllers (Minco, CA16A2010-9502, MN, USA)

143
Figure 5.1: (A) A schematic of the thermally-optimized 20-cycle continuous-flow PCR microdevice with “regional velocity control”. (B) A top view of the microchip (mask). (C) One cycle of the microchannel showing the varying widths.

144
and a homemade voltage amplification circuit. Schematics of the microchip
assembly, devised mostly in Solid Works graphics software, are shown in Figure
5.1.
5.2.2 Thermal / Fluid Analysis of the PCR Microdevice The optimized spacings between the heaters were determined using a
finite element analysis (FEA) and semi-analytical heat transfer model (data not
shown). Results from the analyses were compared to validate their accuracy and
precision. Simulation results were also compared with empirically-obtained IR
surface temperature data. An initial estimate of the geometry and dimensions of
the microchannel was made from information found in prior literature. Using this
information and noting that the optimal flow rate of the sample inside the
microchannel was around 1 µl/min, the thermal mass ratio of the DNA sample
and the glass substrate per unit time was found to be less than 0.01 so the effect
on the temperature distribution due to the convective heat transfer inside the
microchannel was assumed to be negligible. The primary goal of the thermal
investigations was to determine the size of the heater spacings in order to form
finely tuned temperature zones while avoiding lateral heat conduction. An FEA
simulation of fluid flow in the microchannel was also conducted to predict flow
velocities and study the influences of the expanding and contracting conduits on
flow recirculation and bubble nucleation.

145
5.2.2.1 Thermal Finite Element Analysis (FEA)
ANSYS 5.6 software was employed in the thermal FEA to optimize the
spacings between the heaters. The following properties were used in the analysis:
1) the thermal conductivity of glass ≈ 1.13 W/m⋅K and of the copper ≈ 400
W/m⋅K and 2) the convective heat transfer coefficient with the air ≈ 7.5 W/m2⋅K.
The configuration of the three copper heating assemblies on the glass substrate is
shown in Figure 5.1.
To optimize channel geometry and to produce discreet temperature zones
without lateral heat conduction, we investigated spacings ranging from 3 mm to
12 mm between juxtaposing heaters. The three heaters were positioned onto the
bottom surface of the substrate and then adjusted in terms of the spacing between
them. Temperature distributions in the x-direction with heater spacings of 3 mm-
3 mm (“spacing between 96 ºC and 72 ºC” – “spacing between 72 ºC and 60 ºC”),
7 mm-7.2 mm, and 12 mm-12 mm are shown in Figure 5.2. A spacing of 3 mm-3
mm was found to result in superfluous lateral heat conduction that partially
smeared the temperature distribution between contiguous zones. Because of this,
larger spacings were deemed necessary to enhance temperature zone isolation and
uniformity. However, we found that some spacing confinement was necessary to
keep the absolute size of the microchip to a minimum. Increasing the spacings
does indeed improve zone isolation; however, it does so at the expense of
increasing the dimensions of the microchip. Unnecessarily large heater spacings
also result in increased flow distances required in the transitional regions between
temperature zones (for a given heater width) elongating transitional periods.

146
Heater spacings of 7.0 mm between the denaturation (96 ºC) and extension (72
ºC) zones and 7.2 mm between the extension and hybridization (60 ºC) zones
produced finely tuned temperature zones that were uniform and isolated with little
lateral heat conduction.
The particular optimized heater spacings were derived by instilling a zero
heat flux boundary condition in the y-direction at the leading edges of each of the
heaters. Due to the 96 ºC heater, a negative temperature gradient exists in the
positive x direction. The presence of each heater creates a section of constant
temperature with a size equal to the width of the heater. The heater used to create
the extension zone was positioned first (middle heater) and the hybridization /
annealing heater was positioned second (furthest from the 96 ºC heater). Along
the length of each of the second two heaters (i = 2,3), the
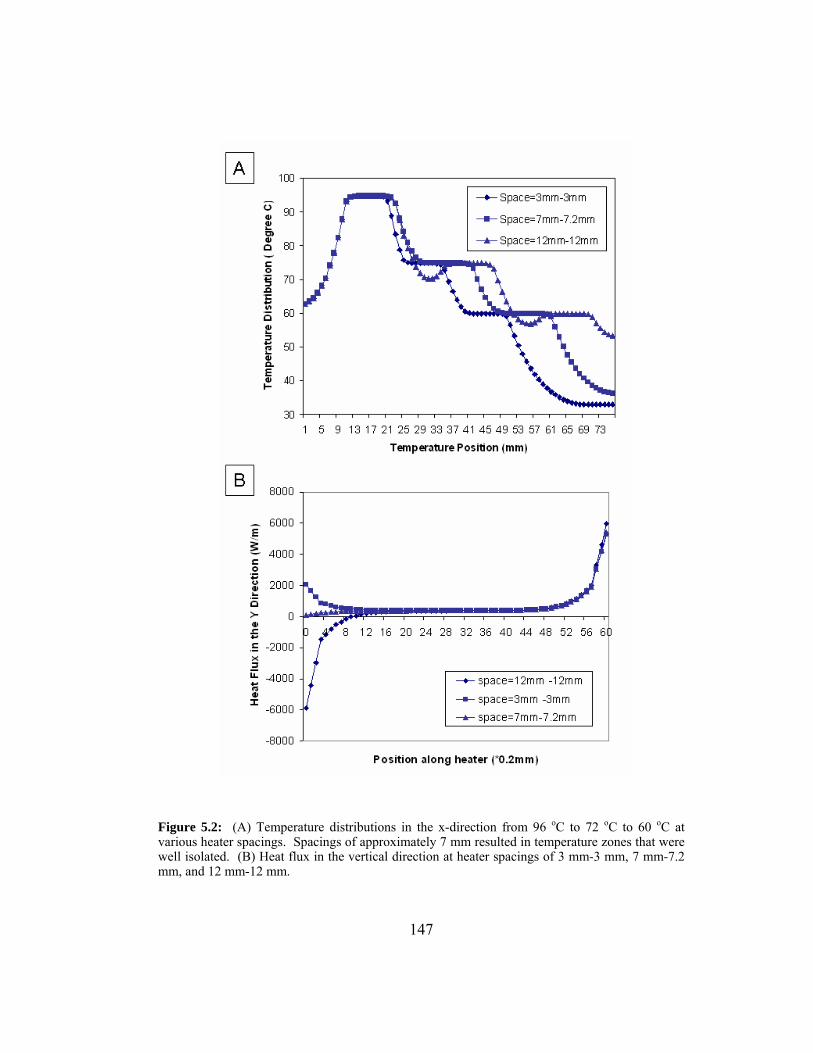
147
Figure 5.2: (A) Temperature distributions in the x-direction from 96 oC to 72 oC to 60 oC at various heater spacings. Spacings of approximately 7 mm resulted in temperature zones that were well isolated. (B) Heat flux in the vertical direction at heater spacings of 3 mm-3 mm, 7 mm-7.2 mm, and 12 mm-12 mm.
148
heat flux in the vertical y-direction into the microchip varied due to disparities in
the temperature difference between the superimposing differential heating
element and the temperature of the underlying substrate. The “zero-heat-flux”
boundary condition is the idea that the optimal positions for the heaters are
located where the heat flux between the leading heating element of the lower
temperature heaters (i = 2,3) and the underlying glass substrate (t1) are zero. This
is where the heater and the surface temperature are the same. By utilizing this
condition and locating the complying positions, the heaters could be rearranged so
that the leading edges of the two lower temperature heaters (72 ºC and 60 ºC)
coincided with the locations with zero heat flux. As shown in Figure 5.2, when
the heater spacings were approximately 7 mm, the temperature zones were found
to be isolated and uniform in the x-direction. At the same time, the absolute
dimensions of the microchip were minimized as much as possible. Temperature
variation in the z-direction was very small so temperature in the z-direction was
assumed uniform.
5.2.2.2 Infrared (IR) Surface Temperature Measurements
Since the components of the PCR cocktail (mixture) and amplification
reaction are temperature-sensitive, it was important to know, at least as a rough
estimate, the temperature in the channel so that the thermocouples could be
calibrated and the set points on the PID (proportional, integral, and derivative)

149
controllers could be adjusted properly. Therefore, surface temperatures were
measured at the top surface of the microchip and used as a baseline for
determining temperatures within the microchannel. An infrared (IR) camera was
used to measure surface temperatures. Before any measurements were taken, the
IR camera was calibrated to compensate for the effects of the environment, i.e. the
emissivity was determined and accounted for, etc. After the temperature readings
stabilized, the surface emissivity was measured using a TrueRMS Supermeter
(HHM290, OMEGA, USA) so the value could be inputted into the camera. An
IR image showing the experimental surface temperature distribution is shown in
Figure 5.3. Temperatures at locations in the direction of the thickness of the chip
(y-direction) were estimated using the IR surface temperature measurements (at y
= t1 + t2) as a reference. The heater spacings and temperature profiles in the x-
direction predicted by a semi-analytical model (data not shown) and FEA
matched those from the IR measurement.

150
Figure 5.3: An IR picture showing the temperature distribution on the top surface of the microchip (opposite the side in contact with the three heating assemblies)
5.2.2.3 Flow Simulation within the Serpentine Microchannel
It was hypothesized that having a serpentine channel of varying widths
could potentially cause flow recirculation that would nucleate bubbles in the
regions with the expanding and contracting conduits.149 Bubbles induce
temperature gradients within the sample that significantly reduce or inhibit
amplification while flow recirculation increases flow resistance (and may nucleate
bubbles). Flow recirculation occurs when the back pressure supersedes the
pressure drop in the flow direction resulting in forward and backward flows
within different regions of the cross-section. The maximum Re number for the

151
flow in the microchannel of our microchip was 18 at typical flow rates in our
experiments (1-5 µl/min).
The fluid in the channel was observed to be highly constricted in some
instances without lingering obstructions blocking the flow. Flow recirculation
caused by both excessive back pressure and microchannel geometry was thought
to be the culprit. If a reasonable pressure drop exists in the downstream direction,
then it is highly improbable that flow recirculation will occur. Oppositely,
adverse pressure gradients (backpressure) are much more likely to induce some
recirculation regimes near the microchannel wall.
It was found in the literature that when the angles of the converging /
diverging conduits were small, the probability of flow recirculation is minimized
vis-à-vis steep profiles. Furthermore, an angle of 7° was found to be the best wall
profile slope of the conduit expansions and retractions for minimizing
recirculation effects.156 Figure 5.4 shows colorimetric velocity fields given by the
FEA inside the expanding and contracting conduits within the microchannel.
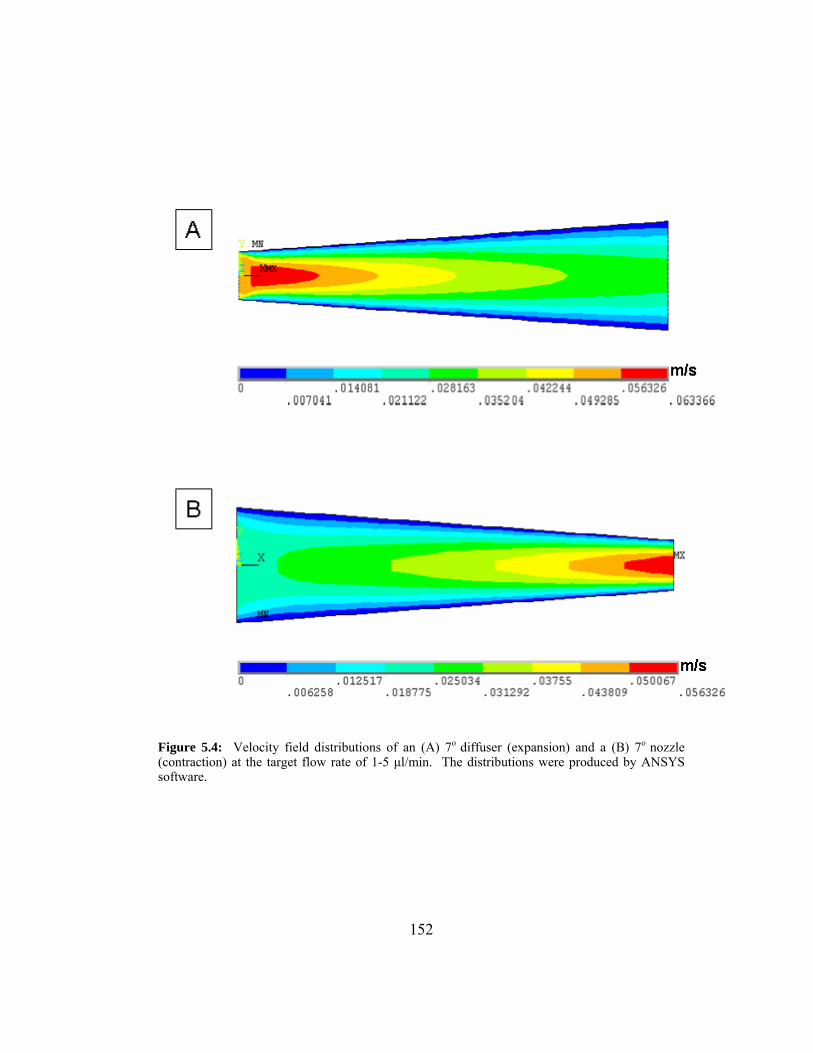
152
Figure 5.4: Velocity field distributions of an (A) 7o diffuser (expansion) and a (B) 7o nozzle (contraction) at the target flow rate of 1-5 µl/min. The distributions were produced by ANSYS software.

153
5.2.3 PCR Amplification Experiments
Figure 5.4: The experimental setup for running DNA amplification experiments and the wiring diagram of the temperature control system.
The experimental setup for PCR amplification is shown in Figure 5.4. A
100 µl gastight syringe (Hamilton Company, UK) was connected to a
programmable syringe pump (Ne-1000, New Era Pump System, NY). The

154
syringe pump was connected to the PCR chip using PEEK tubing (UpChurch,
WA). In order to avoid channel blockage, an in-line 0.5 µm microfilter
(UpChurch, WA) was installed in front of the glass chip to remove particulate
residuals inside the solution. A 90 bp sequence from the 16S rRNA region of the
Bacillus anthracis (Sterne) strain was used to test the PCR chip. The upstream
DNA primer was 5’AATCTTCCGCAATGGACG3’ and the downstream primer
was 5’TTCTTCCCTAACAACAGAG3’. Initially, deionized (DI) water and
ethanol were flushed through the microchannel at a flow rate of 10 µl/min.
SigmaCote (Sigma, USA) was used to silanize the inner wall of the microchannel
to prevent the adsorption of Taq enzyme to the surface of the microchannel. After
silanization, ethanol was used to remove excess silane and DI water was once
again flushed through the microchannel at a flow rate of 10 µl/min. The heating
elements were then turned on and allowed to stabilize. At this point, liquid buffer
was pumped through the chip at a flow rate of 1 µl/min to prime the channel. The
buffer contained 5µg/µl and 10 % Tween 20 surfactant. DNA amplification (100
µl) sample was then pumped through the microchannel at a flow rate of 1 µl/min
and the amplified product was collected from the outlet in 15 µl aliquots and
placed in small vials for further analysis using slab-gel electrophoresis. A
negative control was run without enzyme to make sure that the amplified product
was specific. Figure 5.5 shows the results from gel electrophoresis. The leftmost
lane (lane 1) is the DNA ladder, which was used to determine whether amplified
sequence was of the proper length. Lanes 2-4 show the highly amplified DNA
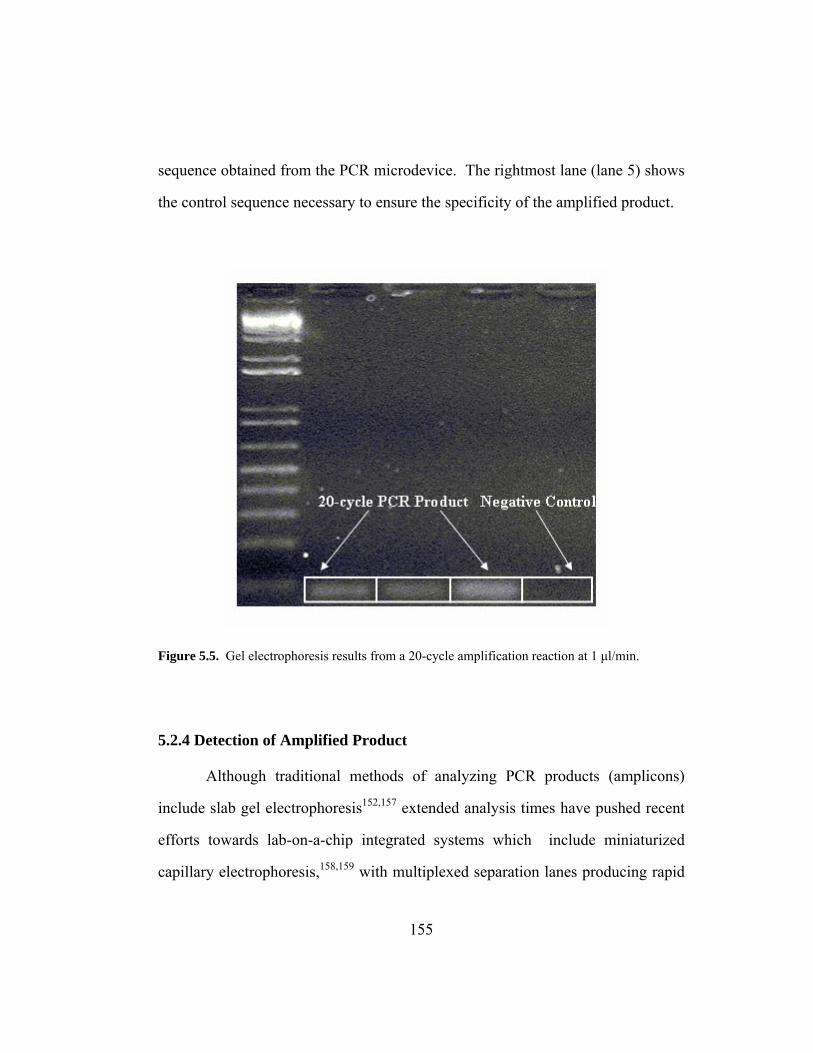
155
sequence obtained from the PCR microdevice. The rightmost lane (lane 5) shows
the control sequence necessary to ensure the specificity of the amplified product.
Figure 5.5. Gel electrophoresis results from a 20-cycle amplification reaction at 1 µl/min.
5.2.4 Detection of Amplified Product
Although traditional methods of analyzing PCR products (amplicons)
include slab gel electrophoresis152,157 extended analysis times have pushed recent
efforts towards lab-on-a-chip integrated systems which include miniaturized
capillary electrophoresis,158,159 with multiplexed separation lanes producing rapid
156
and orthogonal separations. However, few approaches have integrated alternative
high-throughput DNA analyses systems such as microarrays within the
microfluidic amplification approaches. Although planar microarray technology
has thoroughly advanced genetics research, the long analysis times of several
hours for hybridization due to diffusion dependent mass transport have limited the
possible integration advantages.160,161 More recently, DNA array chips have been
integrated with microfluidic components such as mixing valves and circulation
channels160,162 in combination with integrated pumps to aid in the convective
delivery of reagents.163 Additionally, to enhance reaction times by reducing
diffusional transport distances, porous substrates and hydrogel plugs have been
utilized as probe immobilization surfaces.164 The use of porous surfaces have
allowed for enhanced rates of hybridization. The ‘electronic taste chip’ approach
is such a detection system that utilizes the advantages of a high binding capacity
polymer bead in conjunction with an integrated fluidic delivery component.
Multiple classes of analytes including nucleic acids have been quantitatively and
selectively been analyzed with this approach.23,91,92 Therefore, preliminary steps
were undertaken to facilitate the combination of the established microbead array
detection of nucleic acids with molecular beacons (Chapter 4) for the end-point
detection of amplified samples with the µ-channel PCR chip.

157
5.2.4.1 Magnetic Separation of Amplified Sequence
A magnetic bead-based amplicon separation step was implemented as a
means to introduce single stranded target molecules for hybridization with the
microbead array. Magnetic beads have been used for a myriad of applications
ranging from cell capture,165 poly(A) isolation from cells166 and more recently for
numerous nucleic acid purification and detection steps.167 168 Preliminary studies
to determine efficacy of utilizing magnetic bead-based separation of amplified
target prior to microbead array detection were explored. The principle strategy
was to design the molecular beacon immobilized on the bead to be
complementary to one half of a sequence of the double stranded template of
interest. Thus, after amplification of the double stranded template, one half of the
template is retained on the magnetic beads while the other half is hybridized with
the bead array conjugated with the previously optimized molecular beacon
specific for the amplified target of interest. Since the magnetic beads are avidin
functionalized, the primer for the retained sequence is biotinylated ensuring that
half the sequences in the amplified template are also biotinylated post PCR
allowing for easy separation of the template molecules. An optimized procedure
for the PCR amplified template separation and bead based capture is outlined in
Figure 5.6. The 90bp double stranded template from the 16S rRNA region of
Bacillus anthracis is amplified with primers where the 5’ primers are biotinylated.
This ensures that the amplified doublestranded template will consist of one half of
biotinylated sequences. The amplified template is incubated with an aliquot of
avidin coated Dynal magnetic beads of 2.8µm diameter (Invitrogen, CA). After a

158
Figure 5.6: Schematic of the optimized steps for microbead based detection of amplified sample. (A) Amplification of double stranded template using PCR with 5’ primers biotinylated so that half of amplified template is also biotinylated. (B) Addition of amplified sequence consisting of one half biotinylated template to avidin coated magnetic beads. Once the double stranded amplicons are immobilized to the avidin coated magnetic beads, the aliquot is heat denaturated to separate the double stranded template. (C) A quick freeze separation step immediately after the denaturation step ensures availability of separated double stranded template. (D) Magnetic beads immobilized with biotinylated amplicons are localized with a magnet and the supernatant consisting of free half of amplified sequences necessary for end point detection are retrieved. (E) The supernatant is diluted in hybridization buffer and is recirculated over microbeads immobilized with molecular beacons specific to amplified target sequence thus allowing for a fluorescent mode of detection.
brief incubation period, the aliquot is heat denatured to separate the double
stranded template. This is immediately followed with a freeze separation step to

159
maintain the separation of the double stranded template. Thus with the use of a
magnet, the beads and the immobilized sequences are isolated. The resulting
supernatant solution of single stranded amplified sequences is diluted with
hybridization buffer and hybridized with the molecular beacon immobilized
microbead array specific for the capture of the amplified sequence. The molecular
beacon based bead array was previously optimized (Chapter 4) for the capture of
amplified 90bp sequences. Figure 5.7 details the resulting hybridization results of
the 500µL of diluted amplified sequence with the microbead array under
recirculation conditions. Figures 5.7A and C detail the photomicrographs prior to
and post hybridization with the amplified target. The two hour incubation step
clearly shows an increase in signal for the molecular beacons thus establishing
efficacy for the bead based endpoint detection of amplified sequences. These
studies will aid to establish the parameters necessary to integrate the µ-channel
PCR amplification with subsequent nucleic acid detection using the microbead
array. Various adjustments to the separation protocols will be optimized for
integration of the various components. The use of a filter chamber to house the
avidin coated separation beads negating the need for magnetic separation. This
chamber could also be equipped with a thermocycler in order to aid in the
denaturation of the double stranded amplified amplicon. Additionally, these
separate components including the microbead array could be contained within a
single module thereby allowing for rapid endpoint detection of the amplified
sample.
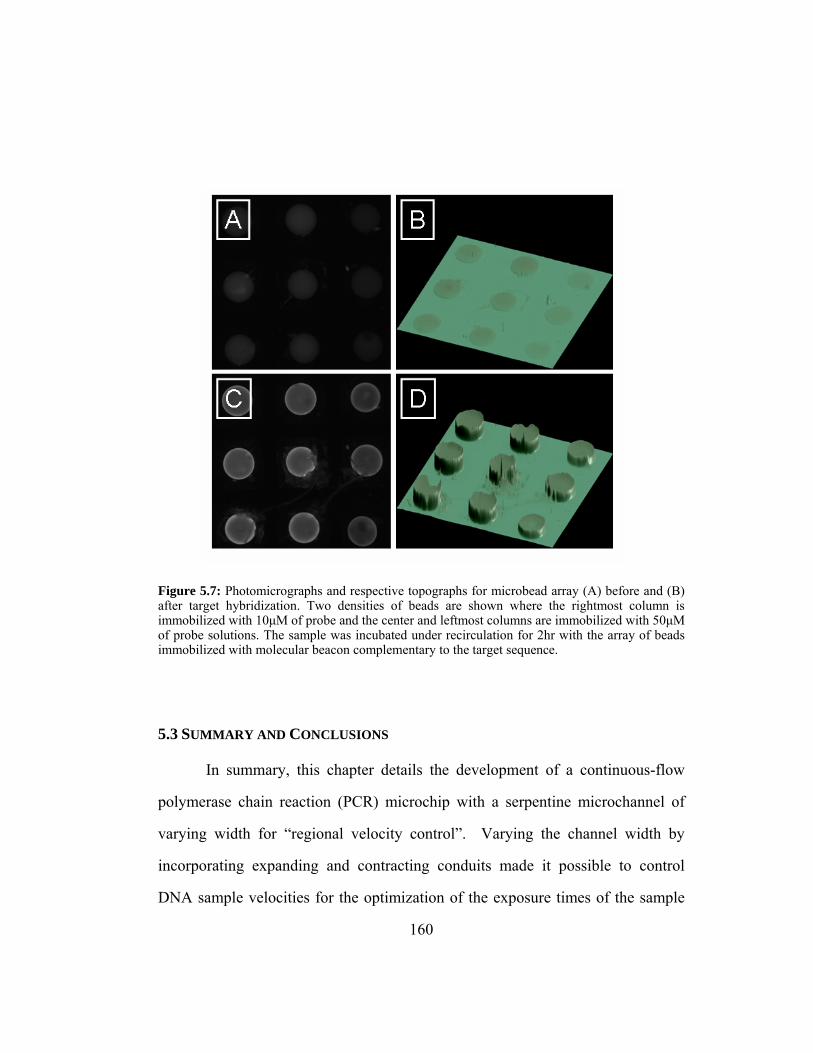
160
Figure 5.7: Photomicrographs and respective topographs for microbead array (A) before and (B) after target hybridization. Two densities of beads are shown where the rightmost column is immobilized with 10µM of probe and the center and leftmost columns are immobilized with 50µM of probe solutions. The sample was incubated under recirculation for 2hr with the array of beads immobilized with molecular beacon complementary to the target sequence.
5.3 SUMMARY AND CONCLUSIONS
In summary, this chapter details the development of a continuous-flow
polymerase chain reaction (PCR) microchip with a serpentine microchannel of
varying width for “regional velocity control”. Varying the channel width by
incorporating expanding and contracting conduits made it possible to control
DNA sample velocities for the optimization of the exposure times of the sample

161
to each temperature phase while minimizing the transitional periods during
temperature transitions. A finite element analysis (FEA) was used to determine
the distances between the three heating assemblies that are responsible for
creating the denaturation (96 °C), hybridization (60 °C), and extension (72 °C)
temperature zones within the microchip. Predictions from the thermal FEA were
compared with temperature measurements obtained from an infrared (IR) camera.
Flow-field FEAs were also performed to predict the velocity distributions in the
regions of the expanding and contracting conduits to study the effects of the
microchannel geometry on flow recirculation and bubble nucleation. Successful
amplification of a 90 base pair Bacillus anthracis DNA fragment was achieved.
Additionally, sequence specific magnetic separation procedures for
amplified double stranded template were explored. These preliminary studies will
serve to bridge the integration of chip based amplification with microbead based
detection. The microbead array has shown great efficacy for the detection of
oligonucleotides23 and will thus serve as a unique three-dimensional tool for the
end-point detection of amplified samples. This integration step will allow for the
establishment of a µ-chip amplification device with subsequent microbead
detection and could thus be used for the simultaneous detection of multiple
segments of a disease gene.

162
References
1. Kwok, P.-Y. Single Nucletide Polymorphisms. Methods in Molecular Biology
212 (2003).
2. Kruglyak, L. & Nickerson, D. A. Variation is the spice of life. Nat. Genetics 27,
234-237 (2001).
3. Daly, M. J., Rioux, J. D., Schaffner, S. F., Hudson, T. J. & Lander, E. S. High-
resolution haplotype structure in the human genome. Nat. Genet. 29, 229-232
(2001).
4. Clark, A. G. et al. Haplotype structure and population genetic inferences from
nucleotide-sequence variation in human lipoprotein lipase. Am. J. Hum. Gener.
63, 595-612 (1998).
5. Sanger, F., Nicklen, S. & Coulson, A. R. DNA sequencing with chain-
terminating inhibitors. PNAS 74, 5463-7 (1977).
6. Kwok, P.-Y. Methods for Genotyping Single Nucleotide Polymorphisms. Annu.
Rev. Genomics Hum. Genet. 2, 235-258 (2001).
7. Kwok, P.-Y. & Chen, X. Detection of single nucleotide polymorphisms. Genetic
Engineering, Principles and Methods 20, 125-34 (1998).
8. Livak, K. J. Allelic discrimination using fluorogenic probes and the 5' nuclease
assay. Genet. Anal. 14, 143-149 (1999).
9. Kostrikis, L. G., Tyagi, S., Mhlanga, M. M., Ho, D. D. & Kramer, F. R. Spectral
genotyping of human alleles. Science 279, 1228-1229 (1998).
10. Laken, S. J. et al. Genotyping by mass spectrometric analysis of short DNA
fragments. Nat. Biotechnology 16, 1352-1356 (1998).
11. Barany, F. Genetic disease detection and DNA amplification using cloned
thermostable ligase. PNAS 88, 189-193 (1991).
12. Hall, J. G. et al. Sensitive detection of DNA polymorphisms by the serial
invasive signal amplification reaction. PNAS 97, 8272-8277 (2000).

163
13. Kwok, P.-Y. High-throughput genotyping assay approaches. Pharmacogenomics
1, 95-100 (2000).
14. Schena, M. et al. Microarrays: biotechnology's discovery platform for functional
genomics. TIBTECH 16, 301-306 (1998).
15. Lipshutz, R. J., Fodor, S. P. A., Gingeras, T. R. & Lockhart, D. J. High density
synthetic oligonucleotide arrays. Nature Genet. 21, 20-24 (1999).
16. Ramsay, G. DNA chips: State-of-the art. Nat. Biotechnology 16, 40-44 (1998).
17. Fuja, T., Hou, S. & Bryant, P. A multiplex microsphere bead assay for
comparative RNA expression analysis using flow cytometry. J. Biotechnology
108, 193-205 (2004).
18. Schena, M., Shalon, D., Davis, R. W. & Brown, P. O. Science 270, 467-470
(1995).
19. Blanchard, A. Genetic Engineering, Principles and Methods. Plenum Press 20,
111-124 (1998).
20. Pease, A. C. et al. Light-generated oligonucleotide arrays for rapid DNA
sequence analysis. PNAS 91, 5022-5026 (1994).
21. Hacia, J. G. Resequencing and mutational analysis using oligonucleotide
microarrays. Nat. Genet. 21, 42-7 (1999).
22. Christodoulides, N. et al. A Microchip-based Multianalyte Assay System for the
Assessment of Cardiac Risk. Anal. Chem. A (2002).
23. Ali, M. F. et al. DNA Hybridization and Discrimination of Single-Nucleotide
Mismatches Using Chip-Based Microbead Arrays. Anal. Chem. 75, 4732-4739
(2003).
24. Curey, T. et al. Characterization of Multicomponent Monosaccharide Solutions
Using an Enzyme-Based Sensor Array. Anal. Biochem. 293, 178-184 (2001).
25. Steemers, F. J., Ferguson, J. A. & Walt, D. R. Screening unlabeled DNA targets
with randomly ordered fiber-optic gene arrays. Nature Biotechnol. 18, 91-94
(2000).
26. Epstein, J. R., Lee, M. & Walt, D. R. High-Density Fiber-Optic Genosensor
Microsphere Array Capable of Zeptomole Detection Limits. Anal. Chem. 74,
1836-1840 (2002).

164
27. Ferguson, J. A., Steemers, F. J. & Walt, D. R. High-Density Fiber-Optic DNA
Random Microsphere Array. Anal. Chem. 72, 5618-5624 (2000).
28. Yershov, G. et al. DNA analysis and diagnostics on oligonucleotide microchips.
PNAS 93, 4913-4918 (1996).
29. Afanassiev, V., Hanemann, V. & Wolfi, S. Preparation of DNA and protein
micro arrays on glass slides coated with an agarose film. Nucleic Acids Res. 28,
e66 (2000).
30. Kashkin, K. N. et al. Detection of Single-Nucleotide Polymorphisms in the p53
Gene by LDR/RCA in Hydrogel Microarrays. Molecular Biology 39, 26-34
(2005).
31. Tudos, A. J., Besselink, G. J. & Schasfoort, R. B. Trends in miniaturized total
analysis systems for point-of-care testing in clinical chemistry. Lab Chip 1, 83-95
(2001).
32. Verpoorte, E. Microfluidic chips for clinical and forensic analysis.
Electrophoresis 23, 677-712 (2002).
33. Huang, Y., Mather, E. L., Bell, J. L. & Madou, M. MEMS-based sample
preparation for molecular diagnostics. Anal Bioanal Chem 372, 49-65 (2002).
34. Vo-Dinh, T. & Cullum, B. Biosensors and biochips: advances in biological and
medical diagnostics. Fresenius J. Anal. Chem. 366, 540-551 (2000).
35. Manz, A., Graber, N. & Widmer, H. M. Miniaturized total chemical analysis
systems: a novel concept for chemical sensing. Sens. Actuators, B B1, 244-8
(1990).
36. Huang, X. C., Quesada, M. A. & Mathies, R. A. Capillary array electrophoresis
using laser-excited confocal fluorescence detection. Analytical Chemistry 64,
967-72 (1992).
37. Huang, X. C., Quesada, M. A. & Mathies, R. A. DNA sequencing using capillary
array electrophoresis. Analytical Chemistry 64, 2149-54 (1992).
38. Woolley, A. T. & Mathies, R. A. Ultra-high-speed DNA fragment separations
using microfabricated capillary array electrophoresis chips. Proceedings of the
National Academy of Sciences of the United States of America 91, 11348-52
(1994).

165
39. Simpson, P. C. et al. High-throughput genetic analysis using microfabricated 96-
sample capillary array electrophoresis microplates. Proceedings of the National
Academy of Sciences of the United States of America 95, 2256-2261 (1998).
40. Paegel, B. M., Emrich, C. A., Wedemayer, G. J., Scherer, J. R. & Mathies, R. A.
High throughput DNA sequencing with a microfabricated 96-lane capillary array
electrophoresis bioprocessor. Proceedings of the National Academy of Sciences
of the United States of America 99, 574-579 (2002).
41. Emrich, C. A., Tian, H., Medintz, I. L. & Mathies, R. A. Microfabricated 384-
lane capillary array electrophoresis bioanalyzer for ultrahigh-throughput genetic
analysis. Analytical Chemistry 74, 5076-5083 (2002).
42. Manz, A., Harrison, D. J., Verpoorte, E. & Widmer, H. M. Advances in
Chromatography (eds. Brown, P. R. & Crushka, E.) (Marcel Dekker, New York,
1993).
43. Service, R. F. Science 282, 396-401 (1998).
44. Effenhauser, C. S., Paulus, A., Manz, A. & Widmer, H. M. Anal. Chem. 66,
2949-2953 (1994).
45. Duffy, D. C., McDonald, J. C., Schueller, O. J. A. & Whitesides, G. M. Rapid
Prototyping of Microfluidic Systems in Poly(dimethylsiloxane). Anal. Chem. 70,
4974-4984 (1998).
46. Wang, J. & Chatrathi, M. P. Microfabricated Electrophoresis Chip for Bioassay
of Renal Markers. Anal. Chem. 75, 525-529 (2003).
47. Chiem, N. & Harrison, D. J. Anal. Chem. 69, 373-378 (1997).
48. Woolley, A. T., Sensabaugh, G. F. & Mathies, R. A. Anal. Chem. 69, 2181
(1997).
49. Soper, S. A. et al. Sanger DNA-Sequencing Reactions Performed in a Solid-
Phase Nanoreactor Directly Coupled to Capillary Gel Electrophoresis. Anal.
Chem. 70, 4036-4043 (1998).
50. Lapos, J. A., Manica, D. P. & Ewing, A. G. Dual Fluorescence and
Electrochemical Detection on an Electrophoresis Microchip. Anal. Chem. 74,
3348-3353 (2002).

166
51. Schafer, A. J. & Hawkins, J. R. DNA variation and the future of human genetics.
Nature Biotechnol. 16, 33 (1998).
52. Wang, D. G. et al. Large-Scale Identification, Mapping, and Genotyping of
Single-Nucleotide Polymorphisms in the Human Genome. Science 280, 1077
(1998).
53. Jain, K. K. Biochips for Gene Spotting. Science 294, 621-625 (2001).
54. Chee, M. et al. Accessing Genetic Information with High-Density DNA Arrays.
Science 274 (1996).
55. Winzeler, E. A. et al. Direct Allelic Variation Scanning of the Yeast Genome.
Science 281, 1194-1197 (1998).
56. Ferguson, J. A., Boles, T. C., Adams, C. P. & Walt, D. R. A fiber-optic DNA
biosensor microarray for the analysis of gene expression. Nature Biotechnol. 14,
1681-1684 (1996).
57. Umek, R. M. et al. Electronic Detection of Nucleic Acids. J. Mol. Diagn. 3, 74-
84 (2001).
58. Yu, C. J. et al. Electronic Detection of Single-Base Mismatches in DNA with
Ferrocene-Modified Probes. J. Am. Chem. Soc. 123, 11155-11161 (2001).
59. Proundnikov, D., Timofeev, E. & Mirzabekov, A. Immobilization of DNA in
Polyacrylamide Gel for the Manufacture of DNA and DNA-Oligonucleotide
Microchips. Analytical Biochemistry 259, 34-41 (1998).
60. Radtkey, R. et al. Rapid, high fidelity analysis of simple sequence repeats on an
electronically active DNA microchip. Nucleic Acids Res. 28, e17 (2000).
61. Westin, L. et al. Anchored multiplex amplification on a microelectronic chip
array. Nature Biotechnol. 18, 199-204 (2000).
62. Borch, R. F., Bernstein, M. D. & Durst, H. D. J. Am. Chem. Soc 93, 2897-2904
(1971).
63. Buranda, T. et al. Biomolecular Recognition on Well-Characterized Beads
Packed in Microfluidic Channels. Anal. Chem. 74, 1149-1156 (2002).
64. Seong, G. H. & Crooks, R. M. Efficient Mixing and Reactions within
Microfluidic Channels Using Microbead-Supported Catalysts. J. Am. Chem. Soc
124, 13360-13361 (2002).

167
65. Taton, T. A., Lu, G. & Mirkin, C. A. Two-Color Labeling of Oligonucleotide
Arrays via Size-Selective Scattering of Nanoparticle Probes. J. Am. Chem. Soc.
123, 5164-5165 (2001).
66. Park, S., Taton, T. A. & Mirkin, C. A. Array Based Electrical Detection of DNA
with Nanoparticle Probes. Science 295, 1503-1506 (2002).
67. Zlatanova, J. & Mirzabekov, A. in DNA Arrays:Methods and Protocols (ed.
Rampal, J. B.) 17-38 (Humana Press Inc., Totowa, NJ, 2001).
68. Blake, R. D. & Delcourt, S. G. Thermodynamic effects of formamide on DNA
stability. Nucleic Acids Res. 24, 2095-2103 (1996).
69. Moran, L. A., Scrimgeour, K. G., Horton, H. R., Ochs, R. S. & Rawn, J. D.
Biochemistry (ed. Pratt, C.) (Neil Patterson Publishers/Prentice-Hall, Inc.,
Englewood Cliffs, NJ, 1994).
70. (i) Two nucleotide mismatches in the central region of a 25-nucleotide capture
sequence yielded discrimination ratio value of ~10 relative to perfect
complement using agarose films 44; values of 2.5-100 have been reported for
various 17-nucleotide sequences with respect to single nucleotide mismatches
using polyacrylamide gel pads 65; values of ~2 were obtained for the 15-
nucleotide sequence relative to a single mismatch using bead-fiber optic
approach 46; resistivity ratios of 105 have been reported using gold nanoparticles
near the conductivity percolation threshold for experiments using 12-nucleotide
capture strands, 27-nucleotide target DNA and 15-DNA base attached to Au
nanoparticles 53.
71. Peyret, N., Seneviratne, P. A., Allawi, H. T. & John SantaLucia, J. Nearest-
Neighbor Thermodynamics and NMR of DNA Sequences with Internal A·A,
C·C, G·G, and T·T Mismatches. Biochemistry 38, 3468-3477 (1999).
72. SantaLucia, J., Jr. Hyther web site:
http://ozone.chem.wayne.edu/Hyther/hytherm4main.html.
73. Knight, J. B., Ashvin, V., Brody, J. P. & Austin, R. H. Phys. Rev. Lett. 80, 3863-
3866 (1998).
74. Brody, J. P., Yager, P., Goldstein, R. E. & Austin, R. H. Biophys. J. 71, 3430-
3441 (1996).

168
75. Healey, B. G., Matson, R. S. & Walt, D. R. Fiberoptic DNA Sensor Array
Capable of Detecting Point Mutations. Anal. Biochem. 251, 270-279 (1997).
76. Walt, D. R. MOLECULAR BIOLOGY:Bead-based Fiber-Optic Arrays. Science
287, 451-452 (2000).
77. Mikhailovich, V. et al. Identification of Rifampin-Resistant Mycobacterium
tuberculosis Strains by Hybridization, PCR, and Ligase Detection Reaction on
Oligonucleotide Microchips. J. of Clin. Microbiol. 39, 2531-2540 (2001).
78. Fodor, S. P. A. Science 277, 393 (1997).
79. Proudnikov, D., Timofeev, E. & Mirzabekov, A. Immobilization of DNA in
Polyacrylamide Gel for the Manufacture of DNA and DNA-Oligonucleotide
Microchips. Anal. Biochem. 259, 34-41 (1998).
80. Taton, T. A., Mirkin, C. A. & Letsinger, R. L. Scanometric DNA Array
Detection with Nanoparticle Probes. Science 289, 1757-1760 (2000).
81. Bakker, E., Buhlmann, P. & Pretsch, E. Carrier-Based Ion-Selective Electrodes
and Bulk Optodes. 1. General Characteristics. Chem. Rev. 97, 3083-3132 (1997).
82. Lander, E. S. et al. Initial sequencing and analysis of the human genome. Nature
409, 860-921 (2001).
83. Venter, J. C. et al. The sequence of the human genome. Science 291, 1304-1351
(2001).
84. Khan, J., Bittner, M. L., Chen, Y., Meltzer, P. S. & Trent, J. M. DNA microarray
technology: the anticipated impact on the study of human disease. Biochim.
Biophys. Acta 1423, 17-28 (1999).
85. Diamandis, E. P. Sequencing with microarray technology-a powerful new tool
for molecular diagnosis. Clin. Chem 46, 1523-1525 (2000).
86. Afanassiev, V., Hanemann, V. & Wolfl, S. Preparation of DNA and protein
micro arrays on glass slides coated wtih an agarose film. Nucleic Acids Res. 28,
e66 (2000).
87. Spiro, A., Lowe, M. & Brown, D. A Bead-Based Method for Multiplexed
Identification and Quantitation of DNA Sequences Using Flow Cytometry.
Applied and Environmental Microbiology 66, 4258-4265 (2000).

169
88. Stevens, P. W., Henry, M. R. & Kelso, D. M. DNA hybridization on
microparticles: determining capture-probe density and equilibrium dissociation
constants. Nucleic Acids Res. 27, 1719-1727 (1999).
89. Kohara, Y., Noda, H., Okano, K. & Kambara, H. DNA probes on beads arrayed
in a capillary, 'Bead-array', exhibited high hybridization performance. Nucleic
Acids Res. 30, e-87 (2002).
90. Wang, H. et al. Label-free hybridization detection of a single nucleotide
mismatch by immobilization of molecular beacons on an agarose film. Nucleic
Acids Rsch 30 (2002).
91. Christodoulides, N. et al. Application of microchip assay system for the
measurement of C-reactive protein in human saliva. Lab on a Chip 5, 261-269
(2005).
92. Goodey, A. et al. Development of Multianalyte Sensor Arrays Composed of
Chemically Derivitized Polymeric Microspheres Localized in Micromachined
Cavities. J. Am. Chem. Soc. 123, 2559-2570 (2001).
93. Wouterlood, F. G., Sauren, Y. M. & Pattiselanno, A. Compromises between
penetration of antisera and preservation of ultra structure in pre-embedding
electron microscopic immunocytochemistry. J Chem Neuroanat 1, 65-80 (1988).
94. Karande, P., Jain, A. & Mitragotri, S. Discovery of Transdermal Penetration
Enhancers by High-Throughput Screening. Nat. Biotechnology 22, 192-197
(2004).
95. Kress, J. et al. Which Sites React First? Functional Site Distribution and Kinetics
on Solid Supports Investigated Using Confocal Raman and Fluorescence
Microscopy. J. Comb. Chem. 5, 28-32 (2003).
96. Shi, Q. H., Zhou, X. & Sun, Y. A Novel Superporous Agarose Medium for High-
Speed Protein Chromatography. Biotechnology and Bioengineering 92, 643-651
(2005).
97. Heule, M. & Manz, A. Sequential DNA hybridisation assays by fast
micromixing. Lab on a Chip 4, 506-511 (2004).

170
98. Sosnowski, R. G., Tu, E., Butler, W. F., O'Connell, J. P. & Heller, M. J. Rapid
determination of single base mismatch mutations in DNA hybrids by direct
electric field control. PNAS 94, 1119-1123 (1997).
99. Wightman, R. M. Microvoltammetric Electrodes. Anal. Chem. 53, 1125-1134
(1981).
100. Ching, S., Dudek, R. & Tabet, E. Cyclic Voltammetry with Ultramicroelectrodes.
J. Chem. Education 71, 602-605 (1994).
101. Bard, A. J. & Faulkner, L. R. Electrochemical Methods, John Wiley and Sons,
Inc (2001).
102. Peterson, A. W., Heaton, R. J. & Georgiadis, R. Kinetic Control of Hybridization
in Surface Immobilized DNA Monolayer Films. JACS 122, 7837-7838 (2000).
103. Peterson, A. W., Wolf, L. K. & Georgiadis, R. M. Hybridization of Mismatched
or Partially Matched DNA at Surfaces. JACS 124, 14601-14607 (2002).
104. Peterson, A. W., Heaton, R. J. & Georgiadis, R. M. The effect of surface probe
density on DNA hybridization. Nucleic Acids Res. 29, 5163-5168 (2001).
105. Steel, A. B., Levicky, R. L., Herne, T. M. & Tarlov, M. J. Immobilization of
Nucleic Acids at Solid Surfaces: Effect of Oligonucleotide Length on Layer
Assembly. Biophysical Journal 79, 975-981 (2000).
106. Gustavsson, P. E., Mosbach, K., Nilsson, K. & Larsson, P. O. Superporous
agarose as an affinity chromatography support. J Chromatography A 776, 197-
203 (1997).
107. Piatek, A. S. et al. Molecular beacon sequence analysis for detecting drug
resistance in Mycobacterium tuberculosis. Nature Biotechnology 16, 359-363
(1998).
108. Tyagi, S., Bratu, D. P. & Kramer, F. R. Multicolor molecular beacons for allele
discrimination. Nature Biotechnology 16, 49-53 (1998).
109. Tyagi, S. & Kramer, F. R. Molecular Beacons: Probes that Fluoresce upon
Hybridization. Nature Biotechnology 14, 303-308 (1996).
110. Sokol, D. L., Zhang, X., Lu, P. & Gewirtz, A. M. Real-time detection of
DNA.RNA hybridization in living cells. PNAS 95, 11538-11543 (1998).

171
111. Matsuo, T. In situ visualization of messenger RNA for basic fibroblast growth
factor in living cells. Biochim. Biophys. Acta 1379, 178-184 (1998).
112. Vet, J. A. M. et al. Multiplex detection of four pathogenic retroviruses using
molecular beacons. PNAS 96, 6394-6399 (1999).
113. Fang, X., Liu, X., Schuster, S. & Tan, W. Designing a Novel Molecular Beacon
for Surface-Immobilized DNA Hybridization Studies. J. Am. Chem. Soc 121,
2921-2922 (1999).
114. Steemers, F. J., Ferguson, J. A. & Walt, D. R. Screening unlabled DNA targets
with randomly ordered fiber-optic gene arrays. Nature Biotechnology 18, 91-94
(2000).
115. Du, H., Disney, M. D., Miller, B. L. & Krauss, T. D. Hybridization-Based
Unquenching of DNA Hairpins on Au Surfaces: Prototypical "Molecular
Beacon" Biosensors. J. Am. Chem. Soc 125, 4012-4013 (2003).
116. Piestert, O. et al. A Single-Molecule Sensitive DNA Hairpin System Based on
Intramolecular Electron Transfer. Nano Letters 3, 979-982 (2003).
117. Fan, C., Plaxco, K. W. & Heeger, A. J. Electrochemical interrogation of
conformational changes as a reagentless method for the sequence-specific
detection of DNA. PNAS 100, 9134-9137 (2003).
118. Frutos, A. G., Pal, S., Quesada, M. & Lahiri, J. Method for Detection of Single-
Base Mismatches Using Bimolecular Beacons. J. Am. Chem. Soc 124, 2396-2397
(2002).
119. Bockisch, B., Grunwald, T., Spillner, E. & Bredehorst, R. Immobilized stem-loop
structured probes as conformational switches for enzymatic detection of
microbial 16S rRNA. Nucleic Acids Rsch 33 (2005).
120. Broude, N. E., Woodward, K., Cavallo, R., Cantor, C. R. & Englert, D. DNA
microarrays with stem-loop DNA probes: preparation and applications. Nucleic
Acids Rsch 29 (2001).
121. Bonnet, G., Tyagi, S., Libchaber, A. & Kramer, F. R. Thermodynamic basis of
the enhanced specificity of structured DNA probes. PNAS 96, 6171-6176 (1999).
122. Horejsh, D. et al. A molecular beacon, bead-based assay for the detection of
nucleic acids by flow cytometry. Nucleic Acids Rsch 33, e13- (2005).

172
123. Brown, L. J., Cummins, J., Hamilton, A. & Brown, T. Molecular beacons
attached to glass beads fluoresce upon hybridisation to target DNA. Chem.
Comm., 621-622 (2000).
124. Zuker, M. Mfold web server for nucleic acid folding and hybridization
prediction. Nucleic Acids Rsch 31, 3406-3415 (2003).
125. Liu, X. & Tan, W. A Fiber-Optic Evanescent Wave DNA Biosensor Based on
Novel Molecular Beacons. Anal. Chem. 71, 5054-5059 (1999).
126. Yao, G. & Tan, W. Molecular-beacon-based array for sensitive DNA analysis.
Analytical Biochemistry 331, 216-223 (2004).
127. Marras, S. A. E., Kramer, F. R. & Tyagi, S. Efficiencies of fluorescence
resonance energy transfer and contact-mediated quenching in oligonucleotide
probes. Nucleic Acids Rsch 30, e122 (2002).
128. Fang, X., Li, J. J., Perlette, J., Tan, W. & Wang, K. Molecular Beacons: Novel
Fluorescent Probes. Anal. Chem., 747 (2000).
129. Iannone, M. A. et al. Multiplexed single nucleotide polymorphism genotyping by
oligonucleotide ligation and flow cytometry. Cytometry 39, 131-140 (2000).
130. Liu, X., Farmerie, W., Schuster, S. & Tan, W. Molecular Beacons for DNA
Biosensors with Micrometer to Submicrometer Dimensions. Analytical
Biochemistry 283, 56-63 (2000).
131. Ramachandran, A., Flinchbaugh, J., Ayoubi, P., Olah, G. A. & Malayer, J. R.
Target discrimination by surface-immobilized molecular beacons designed to
detect Francisella tularensis. Biosensors and Bioelectronics 19, 727-736 (2004).
132. Tsourkas, A., Behlke, M. A. & Bao, G. Structure-function relationships of
shared-stem and conventional molecular beacons. Nucleic Acids Rsch 30, 4208-
4215 (2002).
133. Tsourkas, A., Behlke, M. A., Rose, S. D. & Bao, G. Hybridization kinetics and
thermodynamics of molecular beacons. Nucleic Acids Rsch 31, 1319-1330
(2003).
134. Tsourkas, A., Behlke, M. A., Xu, Y. & Bao, G. Spectroscopic Features of Dual
Fluorescence/Luminescence Resonance Energy-Transfer Molecular Beacons.
Anal. Chem. (2003).

173
135. Marras, S. A. E., Kramer, F. R. & Tyagi, S. Multiplex detection of single-
nucleotide variations using molecular beacons. Genetic Analysis: Biomolecular
Engineering 14, 151-156 (1999).
136. O'Shea, M. K. & Cane, P. A. Development of a highly sensitive semi-
quantitative real-time PCR and molecular beacon probe assay for the detection of
respiratory synctial virus. J. Virological Methods 118, 101-110 (2004).
137. Galil, K. H. A. E. et al. Combined Immunomagnetic Separation-Molecular
Beacon-Reverse Transcription-PCR Assay for Detection of Hepatitis A Virus
from Environmental Samples. App. and Environ. Microbiology 70, 4371-4374
(2004).
138. Li, S. et al. A Continuous-Flow Polymerase Chain Reaction Microchip with
Regional Velocity Control. JMEMS 15, 223-235 (2006).
139. Mullis, K. B. The polymerase chain-reaction (nobel lecture). Angewandte
Chemie-International Edition in English 33, 1209-1213 (1994).
140. Wittwer, C. T. et al. The lighcycler a microvolume multisample fluorimeter with
rapid temperature control. Biotechniques 22, 176-181 (1997).
141. Lin, Y. C., Huang, M. Y., Young, K. C., Chang, T. T. & Wu, C. Y. A rapid
micro-polymerase chain reaction system for hepatitis C virus amplification.
Sensors and Actuators B-Chemical 71, 2-8 (2000).
142. Hong, J. W., Fujii, T., Seki, M., Yamamoto, T. & Endo, I. Integration of gene
amplification and capillary gel electrophoresis on a polydimethylsiloxane-glass
hybrid microchip. Electrophoresis 22, 328-333 (2001).
143. Lagally, E. T., Emrich, C. A. & Mathies, R. A. Fully integrated PCR-capillary
electrophoresis microsystem for DNA analysis. Lab on a Chip 1, 102-107 (2001).
144. Shin, Y. S. et al. PDMS-based micro PCR chip with parylene coating. J.
Micromechan. Microeng. 13, 768-774 (2003).
145. Li, S. & Chen, S. Design, simulation and micro-fabrication of integrated, heat
conduction based DNA chip. J. Manufact. Process 6, 24-31 (2003).
146. Chen, Z. Y., Qian, S. Z., Abrams, W. R., Malamud, D. & Bau, H. H.
Thermosiphon-based PCR reactor: Experiment and modeling. Anal Chem 76,
3707-3715 (2004).

174
147. Hashimoto, M. et al. Rapid PCR in a continuous flow device. Lab on a Chip 4,
638-645 (2004).
148. Schneegass, I., Brautigam, R. & Kohler, J. M. Miniaturized flow-through PCR
with different template types in a silicon chip thermocycler. Lab on a Chip 1, 42-
49 (2001).
149. Schneega, I. & Kohler, J. M. Flow-through polymerase chain reactions in chip
thermocyclers. Rev. Mole. Biotechnol 82, 101-121 (2001).
150. Chou, C. F. et al. A miniaturized cyclic PCR device-modeling and experiments.
Microelectronic. Eng. 61, 921-925 (2002).
151. Liu, J., Enzelberger, M. & Quake, S. A nanoliter rotary device for polymerase
chain reaction. Electrophoresis 23, 1531-1536 (2002).
152. Kopp, M. U., Mello, A. J. d. & Manz, A. Chemical amplifications: Continuous-
flow PCR on a chip. Science 280, 1046-1048 (1998).
153. Yoon, D. S. et al. Precise temperature control and rapid thermal cycling in a
micromachined DNA polymerase chain reaction chip. J. Micromechan.
Microeng. 12, 813-823 (2002).
154. Obeid, P. J. & Christopoulos, T. K. Continuous-flow DNA and RNA
amplification chip combined with laser-induced fluorescence detection.
Analytica. Chimica. Acta 494, 1-9 (2003).
155. Simpson, P. C., Woolley, A. T. & Mathies, R. A. Microfabrication technology
for the production of capillary array electrophoresis chips. Biomed. Microdev. 1,
7-26 (1998).
156. Japikse, D. & Baines, N. C. Diffuser design technology. Concepts ETI (1998).
157. Findlay, J. B., Atwood, S. M. & Bergmeyer, L. Clin. Chem. 39, 1927-1933
(1993).
158. Woolley, A. T. et al. Anal Chem 68, 4081-4086 (1996).
159. Harrison, D. J. et al. Science 261 (1993).
160. Yuen, P. K., Li, G., Bao, Y. & Muller, U. R. Lab Chip 3, 46-50 (2003).
161. Schena, M. Microarray Biochip Technology Eaton Publishing, 87-187 (2000).
162. Anderson, R. C., Su, X., Bogdan, G. J. & Fenton, J. A miniature integrated
device for automated multistep genetic assays. Nuc. Acds. Rsch. 28, e60 (2000).
175
163. Lenigk, R. et al. Anal. Biochem. 311, 40-49 (2002).
164. Cheek, B. J., Steel, A. B., Torres, M. P., Yu, Y.-Y. & Yang, H. Anal. Chem. 73,
5777-5783 (2001).
165. Liu, R. H., Yang, J., Lenigk, R., Bonanno, J. & Grodzinski, P. Self-Contained,
Fully Integrated Biochip for Sample Preparation, Polymerase Chain Reaction
Amplification, and DNA Microarray Detection. Anal Chem 76, 1824-1831
(2004).
166. Hornes, E. & Korsnes, L. Magnetic DNA hybridization properties of
oligonucleotide probes attached to superparamagnetic beads and their use in the
isolation of poly(A) mRNA from eukaryotic cells. Genetic Analysis: Techniques
and Applications 7, 145-50 (1990).
167. Levison, P. R. et al. Recent developments of magnetic beads for use in nucleic
acid purification. Journal of Chromatography, A 816, 107-111 (1998).
168. Weizmann, Y., Patolsky, F., Lioubashevski, O. & Willner, I. Magneto-
Mechanical Detection of Nucleic Acids and Telomerase Activity in Cancer Cells.
J. Am. Chem. Soc. 126, 1073-1080 (2004).

176
Vita
Mehnaaz Fatima Ali was born in Calcutta, India on October 21, 1976, the
first child of K.P. Asgar and Baseera Ali. She grew up in Dhaka, Bangladesh
where in 1993 she graduated from St. Francis Xaviers GH International School,
with a General Certificate of Secondary Education (GCSE) administered by the
University of Cambridge in the UK. In the Fall of 1996, she entered The
University of Texas at Austin, and spent the following four years earning a
Bachelor of Science degree in Biochemistry. After spending a year working as a
research technician on a myriad of bioanalytical projects, she enrolled into the
graduate program at The University of Texas at Austin. Here she began work
towards a doctoral degree in Chemistry under the auspices of Professor John T.
McDevitt and has since received the Dorothy B. Banks Research Fellowship.
Permanent address: House # 6, Road # 98, Gulshan, Dhaka, Bangladesh.
This dissertation was typed by the author.