Embed Size (px)
Citation preview

Copyright
by
Meng Zhao
2006

The Dissertation Committee for Meng Zhao Certifies that this is the approved
version of the following dissertation:
Genetic and Biochemical Studies on the Differential Modulation of RNA
Decay and Processing by Inhibitory Proteins in Escherichia coli
Committee:
George Georgiou, Supervisor
Ian J. Molineux
Charles F. Earhart, Jr.
Vishwanath Iyer
Richard J. Meyer

Genetic and Biochemical Studies on the Differential Modulation of RNA
Decay and Processing by Inhibitory Proteins in Escherichia coli
by
Meng Zhao, B.M., M.S.
Dissertation
Presented to the Faculty of the Graduate School of
The University of Texas at Austin
in Partial Fulfillment
of the Requirements
for the Degree of
Doctor of Philosophy
The University of Texas at Austin
December, 2006

Dedication
To my family, to whom I owe everything

v
Acknowledgements
First, I want to thank my advisor, George Georgiou, for being such a great mentor
the past five (or so) years. Your trust in my ability, encouragement, support and guidance
will never be forgotten. I am grateful to my committee members, Ian Molineux, Charles
Earhart, Vishwanath Iyer, and Richard Meyer, for their interest in this work and helpful
suggestions. I would like to thank Yasuaki Kawarasaki and Li Zhou for their assistance
on the RraA and RraB regulation work; Junjun Gao, Kangseok Lee and Stanley Cohen,
for their collaborations on the characterization of RraB function; Chainaya Jain for his
suggestion on the design of genetic screen. I would also like to thank Aiko Umeda,
Ashwini Devkota, and Jeff Chan, for their help on making the degradosome component
expression constructs. I am grateful to Alan Lambowitz and Andy Ellington, who
allowed me to use their labs for the RNA related experiments. I acknowledge Robert
Simons, Charles Yanofsky, Andrew Emily, Sidney Kushner and Lin-Chao Sue for
sharing strains and antibodies. I thank Danielle Tullman-Ercek and Clinton Leysath for
proofreading this dissertation. Then there are so many other lab members –Karl
Griswold, Andrew Hayhurst, Xiaoming Zhan, Lluis Masip, Laura Segatori, and Navin
Varadarajan who all helped me so much with both research and keeping my sanity. And
thanks also to everyone else who has made the lab such a fun place to work. Beyond the
lab, special praise goes to Jo Frederick and her family. Thank you for introducing the
love of God to me, which has changed my life. I would like to express my deepest
appreciation to my parents and my sister for their unconditional love and support. And
finally, my husband, Yibin, gets the most thanks for his love, understanding and support,
over the last four and a half years.

vi
Genetic and Biochemical Studies on the Differential Modulation of RNA
Decay and Processing by Inhibitory Proteins in Escherichia coli
Publication No._____________
Meng Zhao, Ph.D.
The University of Texas at Austin, 2006
Supervisor: George Georgiou
The regulation of mRNA decay is a critical post-transcriptional step in the control
of gene expression. In E. coli, RNase E carries out the first and rate-limiting step in the
decay of most mRNAs, as well as in the processing of ribosomal, transfer RNAs and
small regulatory RNAs. The RNase E protein has two domains: the catalytic N-terminal
half and the C-terminal half containing the scaffold region for the assembly of an RNA
degrading machine termed the degradosome. Earlier studies in our lab identified the
trans-acting proteins, RraA and RraB, which inhibit RNase E activity through direct-
interaction with the enzyme.
The present work explores several mechanistic, physiological and biotechnology-
related aspects of the modulation of E. coli RNA decay and processing by inhibitory
proteins. We found that, in contrast to RraA, RraB interacts with a different site on
RNase E, results in distinct changes in degradosome composition, and interferes with
cleavage of a different set of transcripts. Therefore, our results revealed a novel

vii
mechanism whereby a selective remodeling of the degradosome by endonuclease binding
proteins serves to differentially regulate RNA decay and processing in E. coli.
We developed protocols to express and purify the C-terminal truncated forms of
RNase E. A system to reconstitute part of the degradosome and determine the
consequences of RraA and RraB binding to the kinetics of RNA degradation in vitro was
established.
We showed that rraA is transcribed predominantly from its own promoter (PrraA)
located in the menA - rraA intergenic region. Transcription from PrraA is σs-dependent
and is induced upon entry into stationary phase. Moreover, the synthesis of RraA is
regulated at the post-transcriptional level by RNase E, suggesting the existence of a
feedback regulatory circuit between RraA and RNase E.
RraB is transcribed from a promoter (PrraB) which is divergent from the argI
promoter. Contrary to the previous data, we could not find any evidence that rraB
promoter activity, mRNA abundance and protein level are affected by changes in
tryptophan or arginine metabolism. In contrast to RraA, the expression of RraB does not
change during different growth phases.

viii
Table of Contents
Chapter 1 Introduction and Background ............................................................ 1 Post-transcriptional control of gene expression: mRNA decay in E. coli ..... 1
Ribonucleases control RNA decay and processing ............................ 2 5'-end events in mRNA decay .............................................................. 5 3'-end events in mRNA decay .............................................................. 6 Small regulatory RNAs......................................................................... 8
RNase E and the degradosome ...................................................................... 9 RNase E .............................................................................................. 9 Function of the degradosome ............................................................ 15
RNase E Action............................................................................................ 21 RNase E cleavage specificity.............................................................. 21 RNase E autoregulation ...................................................................... 26
RraA, the trans-acting factor modulating RNase E activity ........................ 26 Research outline........................................................................................... 30
Chapter 2 RraB: A second RNase E-inhibitory protein that differentially modulates the mRNA abundance ......................................................................................... 32
Introduction.................................................................................................. 32 Materials and methods ................................................................................. 34
Strains and plasmids ........................................................................... 34
β-galactosidase assays ........................................................................ 34 RNA work........................................................................................... 35 Microarray procedures ........................................................................ 37 Surface plasmon resonance analysis................................................... 37 Pull-down assay .................................................................................. 37 SPA purification of degradosomes ..................................................... 38 Mass spectrometry .............................................................................. 39

ix
Results.......................................................................................................... 40 Transcript-specific inhibition of the endonuclease activity of RNase E by RraB............................................................................ 40 RraA and RraB interact differently with the CTH domain of RNase E .......................................................................................... 45 Binding of RraA and RraB affects the degradosome composition..... 49
Discussion .................................................................................................... 53
Chapter 3 Reconstitution of Degradosomes and Kinetic Analysis of RNA Degradation in vitro .............................................................................................. 57
Introduction.................................................................................................. 57 Materials and methods ................................................................................. 59
Strains and plasmids ........................................................................... 59 Expression and purification of truncated versions of RNase E .......... 61 Production and purification of RraA, RraB, PNPase, RhlB and Enolase ......................................................................................... 63 RNA cleavage assay ........................................................................... 63
Results.......................................................................................................... 64 Purification of C-terminal truncated RNase E.................................... 64 Determination of the kinetic parameters of RNase E ......................... 67 Consequences of RraA and RraB binding to the kinetics of RNA
degradation in vitro .................................................................... 71 Production and purification of PNPase, RhlB and Enolase................ 73
Discussion .................................................................................................... 74
Chapter 4 Regulation of RraA, the Prototypical Protein Inhibitor of RNase E-mediated RNA Decay ........................................................................................... 78
Introduction.................................................................................................. 78 Materials and methods ................................................................................. 79
Strains and plasmids ........................................................................... 80 Growth conditions............................................................................... 80

x
RNA methods...................................................................................... 80 Construction of β-galactosidase fusions ............................................. 82 β-galactosidase assays......................................................................... 83 Western Immunoblotting .................................................................... 83
Results.......................................................................................................... 85 Identification of the PrraA promoter .................................................. 85 Genetic analysis of expression PrraA using lacZ transcriptional fusions ................................................................................................. 89 rraA expression in stationary phase.................................................... 91 Transcriptional regulation of rraA by RpoS ....................................... 92 The decay of the rraA transcript is dependent on RNase E................ 96
Discussion .................................................................................................... 97
Chapter 5 Studies on the Regulation of rraB Expression ................................ 101 Introduction................................................................................................ 101 Materials and methods ............................................................................... 103
Strains and plasmids ......................................................................... 103 Growth conditions............................................................................. 103 RNA methods.................................................................................... 107 Construction of β-galactosidase fusions ........................................... 108 β-galactosidase assays....................................................................... 108 Western Immunoblotting .................................................................. 109 Real-Time PCR................................................................................. 109
Results........................................................................................................ 110 Identification of the rraB promoter by DNA sequence analysis ...... 110 Experimental identification of the rraB promoter ............................ 114 RraB expression is not affected by tryptophan availability .............. 119 The regulation of rraB expression is not affected by arginine metabolism........................................................................................ 121 Toward understanding the physiological significance of RraA and RraB ........................................................................................... 123

xi
Discussion .................................................................................................. 124
Chapter 6 Conclusions and Recommendations................................................ 127 Recommendation for further studies.......................................................... 130
Author's Publication List .................................................................................... 134
Bibliography ....................................................................................................... 136
Vita .................................................................................................................... 158

1
Chapter 1: Introduction and Background
POST-TRANSCRIPTIONAL CONTROL OF GENE EXPRESSION: MRNA DECAY IN ESCHERICHIA COLI
Studies over the past 50 years have revealed that virtually every event involved in
gene expression appears to be subject to regulation. The rates of gene transcription and of
mRNA decay determine the steady-state level of transcripts. Transcript levels, together
with translation rates, then dictate the amount of protein produced. The various steps of
gene expression are highly coordinated and inter-dependent with each other. Whereas the
effect of transcription and protein turnover on protein abundance in the cell has been
appreciated for some time, mRNA decay is only now emerging as a critical post-
transcriptional control point and as a major contributor to the regulation of gene
expression. The significance of mRNA decay as a mechanism for controlling gene
expression in either eukaryotic or prokaryotic cells is well established (Kushner 2004).
For example, in E. coli, the different abundance of the protein products from the
polycistronic pap operon is readily explained by the difference in their mRNA stability
(the papA mRNA half-life is estimated to be 20 min, whereas the half-life of the papBA
transcript is 2.5 min) (Nilsson and Uhlin 1991). In human cells, the mechanisms
controlling mRNA stability are relevant in determining the level of chemokine gene
expression during chronic inflammatory conditions (Mata et al. 2005).
While in eukaryotic cells, the typical mRNA lifetimes range from 25 minutes
(yeast) to 16 hours (in human HeLa cells) (Singer and Penman 1973; Warner and
Gorenstein 1978), in bacteria mRNAs are subject to very rapid turnover. The continuous

2
breakdown and re-synthesis of prokaryotic mRNA allows rapid changes in protein
synthesis to occur and is important for the rapid adaptation of micro-organisms to a
changing environment. Nonetheless the decay rates of specific bacterial mRNAs can
differ significantly. In E. coli, the half-life of individual mRNAs range from just a few
seconds to more than an hour (Belasco 1993).
The work described in this dissertation is focused on E. coli. However, it is worth
mentioning that recent results show that the similarities between mRNA decay in the
prokaryotes and eukaryotes are greater than were generally believed. Despite the clearly
distinct molecular mechanisms of mRNA turnover in these two biological realms,
evidence has been established that mRNA degradation in all organisms is regulated by
trans-acting factors, as well as cis-acting RNA sequences. Moreover, both prokaryotes
and eukaryotes adjust the activity of trans-effectors and the accessibility of the cis-acting
regulatory sequences in order to provide fine-tuning of the mRNA degradation process.
Furthermore, recurrent themes exist in both phyla, e.g. common RNA structural elements
and functionally analogous multicomponent RNA/protein complexes such as the
"degradeosome" and "exosome," all involved in RNA processing and decay (BAKER
and CONDON 2004).
Ribonucleases control RNA decay and processing
The most direct trans-acting factors controlling mRNA stability in both
eukaryotes and prokaryotes are ribonucleases (RNases). After more than 30 years of
studies, it is now known that E. coli contains more than a dozen ribonucleases, and the
list is still growing. Based on the manner in which they cleave the substrate, RNases can
be broadly classified into two groups: endoribonucleases, which cleave internal

3
phosphodiester bonds within RNA, and exoribonucleases, which cleave RNA chains
from the 3’ or the 5’ terminus. In contrast to eukaryotes, no 5’ to 3’ exoribonuclease has
been found in eubacteria and archaea (Zuo and Deutscher 2001).
The first, and rate limiting, step of mRNA decay (as well as in the maturation of
tRNAs and of the 5S ribosomal RNA) in E. coli and many other bacteria is primarily due
to endonucleolytic attack, generally carried out by the essential enzyme, RNase E (Misra
and Apirion 1979; Deutscher 2006). As discussed later, studies of total mRNA turnover
and breakdown of individual messages have confirmed the important role of RNase E in
RNA decay and processing. Nevertheless, a number of other endoribonucleases such as
RNase G, RNase P, and RNase III also participate in mRNA decay to a limited degree.
RNase G is a homolog of RNase E, which might serve as a backup in both mRNA decay
and 5S rRNA maturation when RNase E is inactivated (Lee et al. 2002; Ow et al. 2003).
RNase III, whose action is specifically on double-stranded RNAs, is primarily involved
in the maturation of rRNA and the processing of certain polycistronic operons. However,
RNase III probably does not play a major role in initiating mRNA decay since this
enzyme is not essential for cell viability (Kushner 2004). Finally, RNase P is an
enzyme acting primarily on tRNA precursors and certain polycistronic operons (Li and
Deutscher 2004).
Following an initial endonucleolytic cleavage, additional cleavages break the
mRNA into fragments. In E. coli, three processive 3’-5’ exoribonucleases, i.e. PNPase
(polyribonucleotide nucleotidyltransferase), RNase II and RNase R, are primarily
responsible for degradation of the mRNA fragments. PNPase is a phosphorolytic
nuclease which releases nucleoside 5’-diphosphates (Soreq and Littauer 1977). RNase
II and RNase R are hydrolytic and generate nucleoside monophosphates (Gupta et al.
1977; Cheng et al. 1998). Interestingly, mutant cells lacking one of the three nucleases

4
grow normally, indicating that the three enzymes have significant functional overlap.
PNPase seems to have broad specificity to carry out all essential functions in mRNA
decay (after the initial endonucleolytic attack) since cells lacking both RNase II and
RNase R do not exhibit any significant defects. As detailed later, degradation by
PNPase is further stimulated by its interaction with the RhlB RNA helicase, particularly
when it is associated with the RNase E-based degradosome (Coburn et al. 1999).
All three processive exoribonucleases are single-strand specific nucleases and
their action is inhibited by secondary structure. None of these enzymes can complete
the degradation of mRNA fragments because they are relatively inactive against short
oligonucleotides. These residual products are digested to mononucleotides by
oligoribonuclease, an exoribonuclease belonging to the DEDD exonuclease superfamily
which is named after the characteristic core comprised of four invariant acidic amino
acids and display specificity for very short nucleotide chains (4-7 nt). In fact, this step has
been shown to be essential for cell viability (Zhang et al. 1998; Ghosh and Deutscher
1999) (Figure 1.1).

5
mRNA RNases Initiation of E mRNA Decay G III P mRNA fragments Terminal II Steps R PNPase
oligonucleotides
oligonuclease
mononucleotides
Figure 1.1 mRNA decay in E. coli. The endoribonucleases, RNase E, G, III and P, carry out the initial cleavages during mRNA decay. Depending on the process, a particular enzyme may play the primary role. Terminal steps in mRNA degradation involve the processive exoribonucleases, PNase II, R or PNPase, followed by oligoribonuclease to remove 5’ terminal oligonucleotides.
5’- end events in mRNA decay
The influence of the 5' terminus on the susceptibility of mRNA to degradation is
well documented for both bacteria and higher organisms. In eukaryotes, the 5’methyl
guanosine cap prevents 5’-3’ exonucleolytic decay. Thus its removal from the mRNA by
the decapping complex often constitutes the rate-limiting step in mRNA turnover (Coller
and Parker 2004). In E. coli, differences in mRNA longevity are frequently determined
by features of the 5’ untranslated region. The presence of a stem-loop structure at an

6
RNA 5’ end often increases RNA stability, a finding that is somewhat surprising in view
of the absence of prokaryotic 5’ exoribunuclease and the central role of endonucleolytic
cleavage in bacterial RNA degradation. For example, the 5’-most stem-loop and a 30-nt
single-stranded region surrounding the ribosome binding site (RBS) of the ompA mRNA
are found to account for the unusual stability of the ompA transcript (t1/2=17 minutes)
(Emory et al. 1992). On the other hand, the addition of as few as five unpaired
nucleotides to the 5’ end of the stem-loop can significantly reduce the stability of the
ompA mRNA. These results suggest that the initial step in degradation requires access to
the mRNA by an RNase that needs a single-stranded region at the 5’ end for binding
(Lundberg et al. 1990). As will be detailed later, this decay-initiating RNA cleavage
event is catalyzed by RNase E, and the 5’-terminal triphosphate in an intact transcript
acts to stabilize the mRNA from this endoribonucleatic attack (Mackie 1998, 2000). In
fact, RNase E strongly favors monophosphorylated RNA substrates, which is believed to
ensure that once decay of an mRNA is initiated, continued degradation of the 3’ cleavage
product is preferred over an intact triphosphorylated RNA.
3’-end events in mRNA decay
Just like the 5’ terminus of an mRNA is important to its stability, the 3’ end also
plays a critical role in controlling degradation through the polyadenylation process. In
contrast to eukaryotes in which stable poly (A)-tails at the 3’end helps maintain mRNA
stability, polyadenylation stimulates RNA degradation in prokaryotes and in eukaryotic

7
organelles (Kushner 2002). At least a fraction of E. coli mRNAs, including the rpsO,
lpp, and ompA mRNAs, are polyadenylated as a prerequisite for degradation (Hajnsdorf
et al. 1994; Hajnsdorf et al. 1995). None of the exonucleases (PNPase, RNase II or
RNase R), are able to act on a completely double-stranded RNA molecules due to their
inability to bind the substrate (Deutscher 2006). Thus the polyadenylation of structured
RNA seems to destabilize the transcript by creating a single-stranded RNA binding site
that provokes exonucleolytic digestion of the substrate by various 3’-5’ exonucleases.
We now know that polyadenylation in bacteria results from a balance between the
activities of a poly(A) polymerase I (PAP I) and of exoribonucleases that remove poly(A)
tails. PAP I adds adenylate residues to the 3’ end of RNA using ATP as a donor
(August et al. 1962; Cao et al. 1996). Deletion of the pcnB gene (encoding PAP I)
reduces polyadenylylation by over 90% and dramatically stabilizes the lpp, ompA, and
trxA mRNAs (O'Hara et al. 1995). It was thought that only a small fraction of E. coli
mRNA was polyadenylated at any time. However, recent comparisons of the
transcriptomes of wild-type and the pcnB deletion strains demonstrated that majority
mRNAs undergo some degree of polyadenylylation by PAP I. The studies on the
molecular mechanism of polyadenylation-dependent mRNA degradation suggest that in
E. coli Rho-independent transcriptional terminators at the 3’ end of many mRNAs serve
as the specific polyadenylation signals for PAP I. The binding of the Sm-like protein,
Hfq, to the terminator modifies this substrate specificity and enhances activity for
polyadenylation catalyzed by PAP I. Specifically, inactivation of the hfq gene leads to a
reduction in the ability of PAP I to add poly(A) tails at the 3’ end of full-length mRNAs
containing Rho-independent transcription terminators. Under these conditions, PNPase

8
performs the primary poly(A)/polynucleotide-adding activity in the cell, producing short
heteropolymeric additions on RNA decay intermediates (Mohanty et al. 2004).
Paradoxically, the binding of Hfq to poly(A) tail is also shown to protect the 3’ terminus
from exonucleolytic attack by RNase II and PNPase (Folichon et al. 2005). Clearly,
further investigation is required to clarify the role of Hfq in regulating polyadenylation-
dependent mRNA degradation.
Small regulatory RNAs
In recent years there has been increased evidence for the interaction of small
regulatory RNAs (sRNA) with their target mRNAs and their role in decay. Bacteria use
a very heterogeneous group of small non-coding RNAs which have been identified as
crucial regulatory elements in stress responses and in virulence. More than 70 small, non-
coding RNAs, usually 80-100 nt in length, have been confirmed in E. coli, based on
genome-wide searches (1–2% of the number of known protein-coding genes) (Gottesman
2005). A major class of E. coli sRNAs, which comprise about one third of all known
sRNAs, act by base-paring with the target mRNAs, i.e. by antisense mechanisms, to carry
out their regulatory functions (Zhang et al. 2003). The bacterial regulatory RNAs are
bound to the RNA chaperone Hfq, and are presented to their pairing targets, generally the
5’ end of the mRNA, to affect their stability or translation (Storz et al. 2004). Hfq is a
well-conserved homohexameric ring protein which is closely related to Sm and Sm-like
proteins involved in RNA splicing in eukaryotes (Sauter et al. 2003). Through strong
interactions with the single-stranded AU-rich regions on both small non-coding RNAs

9
and the target mRNAs, Hfq stimulates pairing between small RNAs and their targets. A
well-studied E. coli small regulatory RNA is RyhB, which is expressed in response to
iron limitation as a result of the released repression by Fur protein. RyhB causes the rapid
degradation of several target mRNAs encoding nonessential Fe-binding proteins, such as
the sodB mRNA which encodes an iron superoxide dismutase, thus reducing the
intracellular requirement for Fe (Masse and Gottesman 2002). Interestingly, degradation
of both mRNA targets and small regulatory RNAs, i.e. sodB and RyhB, has been shown
to depend on RNase E. Since Hfq and RNase E bind similar sites on the RNA, it is
suggested that pairing may precipitate the loss of Hfq and access of RNase E (Lin-Chao
et al. 1999; Masse et al. 2003). Nevertheless, as will be discussed later, a model of the
ribonucleoprotein complexes formed by RNase E, Hfq and sRNA has been implicated in
degradation as well (Morita et al. 2005).
It should be pointed out that mediating mRNA decay is only one of the
multifaceted functions of the small RNAs. The outcome of the sRNA-target mRNA
pairing can be inhibition of translation (e.g. OxyS negatively regulates the synthesis of
two transcriptional regulators, RpoS and FhlA); stimulation of translation (e.g. DsrA and
RprA increase levels of translation of RpoS) and stabilization of mRNA (e.g. GadY
increased levels of the GadA and GadB glutamate decarboxylases (Gottesman 2005)).
RNASE E AND THE DEGRADOSOME
RNase E

10
RNase E has received intensive study for its role in RNA decay ever since it was
first identified in the late 70s. In 1978, Ghora and Apirion characterized RNase E in a
temperature-sensitive mutant (rne-3071) based on the observation that 5S rRNA
precursor accumulated at the nonpermissive temperature (Ghora and Apirion 1978).
Independent work by Ono and Kuwano identified the ams-1 (altered mRNA stability)
gene because its inactivation significantly slowed down the decay of total pulse-labeled
RNA at elevated temperature (Ono and Kuwano 1979). It took several research groups
almost 10 years to confirm that the ams-1 and rne-3071 mutations are alleles of the same
gene, now named rne (Mudd et al. 1990; Babitzke and Kushner 1991; Melefors and von
Gabain 1991; Taraseviciene et al. 1991). Located at 24.6 min on the linkage map of E.
coli, the rne open reading frame (ORF) is 3.4 kb long. The promoter of the rne gene is
located 361 nucleotides upstream of the initiation codon. Right after the stop codon there
is a typical Rho-independent terminator consisted of an inverted repeat followed by 6
consecutive Us.
More than 25 years of extensive studies have revealed that the functions of RNase
E in RNA metabolism include the processing of ribosomal and transfer RNAs (Li and
Deutscher 2002; Ow and Kushner 2002); the degradation of sRNAs such as DsrA (Masse
et al. 2003), RyhB (Masse and Gottesman 2002), and SgrS (Morita et al. 2004); and, most
importantly, the turnover of numerous cellular mRNAs (Mudd et al. 1990; Mackie 1991;
Regnier and Hajnsdorf 1991; Bernstein et al. 2002). Complete deletion of the rne gene is
lethal. Initially, defects in 9S rRNA processing and mRNA decay were thought to be
responsible for the defect in viability associated with the inactivation of RNase E (Ghora
and Apirion 1978). However, recent data suggest that the essential role of RNase E is the
initiation of tRNA maturation (Ow et al. 2000; Ow and Kushner 2002).

11
The E. coli RNase E protein contains 1,061 amino acids, with a calculated
molecular mass of 118 kDa, and is one of the larger proteins in this organism. Based on
amino acid composition and the presence of functional sites, the full-length RNase E
protein can be divided into two functional portions: an N-terminal half (NTH, amino acid
residues 1–500), and a C-terminal half (CTH, aa residues 501-1061) (Figure1.2). Also
known as the catalytic domain, the NTH carries out the catalytic function of RNase E
(McDowall and Cohen 1996). The crystal structure of the catalytic domain of RNase E
(aa residues 1–529) was recently solved as trapped allosteric intermediates with RNA
substrates. This 529 aa RNase E fragment is composed of two globular portions, referred
to as the ‘small’ (aa residues 400-529) and ‘large’ domains (aa residues 1–400). The
‘large’ domain is further divided into subdomains according to the established folds. The
N-terminal 279 aa residues are structurally related to the RNase H endoribonuclease
family. Embedded in the RNase H fold are an S1 domain (aa residues 36–118) which is
a widely occurring RNA-binding structural motif, and a 5’ sensor fold (aa residues 119–
215) which participates in the recognition of the 5’ terminus of the bound RNA. The
remaining component of the large domain (aa residues 280-440) encompassing the active
site is structurally congruent to the endo-deoxyribonuclease, DNase I, making a
surprising link in the evolution of RNA and DNA nucleases. The catalytic domain of
RNase E forms a homotetramer which is organized as a dimer-of-dimers. This quaternary
organization requires that the intra-domain linkers cross and coordinate a zinc ion
through a pair of cysteine residues (Figure 1.2). Importantly, mutation of the
coordinating four cysteine residues results in disruption of the RNase E tetramer into
stable dimers, which are capable of binding RNA but have no catalytic activity. On the
other hand, tetrameric RNase E, formed by chemical crosslinking in the absence of zinc,
is catalytically active. These results suggest that a tetrameric quaternary structure is

12
required for RNase E to carry out its core enzymatic functions (Adams et al. 2001;
Callaghan et al. 2003; Callaghan et al. 2005).
The S1 domain has also been found in at least three other E. coli ribonucleases,
including RNase G, RNase II and PNPase (Bycroft et al. 1997). The first clue
suggesting that the S1 domain is important for the activity of RNase E comes from the
fact that two separate point mutations within the domain, rne-3071 (L68F) and ams-1
(G66S), are both lethal at nonpermissive temperatures (McDowall et al. 1993). Using
site-directed mutagenesis and structural modeling, Joel Belasco and co-workers suggest
the role of the RNase E S1 domain is more complex than simply providing an RNA-
binding surface. They identified two functionally distinct regions on the surface of the S1
domain: one group, including Phe-57, Phe-67 and Tyr-112, is important for the
ribonucleolytic activity of the enzyme, while the other group, comprising Lys-37 and
Tyr-60, is dispensable for catalysis in vitro but is required for feedback regulation of
RNase E expression (Diwa et al. 2002). Moreover, structural studies of the S1 domain of
RNase E as determined by both X-ray crystallography and NMR spectroscopy indicate
that the S1 domain serves a role in dimerization, to assist the formation of the tetrameric
quaternary structure of RNase E. Thus, functional investigations of the S1 domain in
RNase E point to a complex role in facilitating substrate recognition, autoregulation and
subunit assembly (Schubert et al. 2004).
The NTH is essential for cell viability (Kido et al. 1996) and has numerous
homologues, most notably the paralogue RNase G encoded by the rng gene (Wachi et al.
1999). In contrast, the C-terminal half (CTH) of RNase E, containing residues 501-
1061, is poorly conserved and is dispensable for cell survival (Kido et al. 1996; Kaberdin
et al. 1998; Ow et al. 2000). Based on functionality, the CTH can be further divided into
two functional domains. One is the central domain (residues 501-750) containing a

13
secondary RNA binding site which is arginine-rich (ARRBS, residues 604-688)
(McDowall and Cohen 1996). However, in contrast with the S1 domain located in the
NTH of RNase E, the ARRBS appears to have a more marginal role in RNA recognition
since it is not required for ribonucleolytic activity, feedback regulation or cell growth
(Abee and Wouters 1999; Diwa and Belasco 2002).
The rest of RNase E C-terminal half (residues 734-1061) is called the “scaffold
region” because it is involved in interactions with other proteins. A. J. Carpousis et al.
first reported that, when purified from E. coli cells, RNase E is present in a large
multiprotein complex, i.e., the RNA degradosome, that also contains the exoribonuclease
polynucleotide phosphorylase (PNPase), the DEAD-box RNA helicase RhlB, and the
glycolytic enzyme enolase (Carpousis et al. 1994; Py et al. 1994; Py et al. 1996). Several
other degradosome-associated proteins including the protein chaperones GroEL and
DnaK (Miczak et al. 1996), polyphosphate kinase (PPK) and PAP I (Raynal and
Carpousis 1999) may also be present in sub-stoichiometric amounts (Blum et al. 1997).
Through a combination of deletion, yeast two-hybrid analysis and co-immunopurification
experiments, the binding sites of the three major degradosome components were mapped
to adjacent but different sites on the C-terminal domain of RNase E. Residues 734-738
are required for RhlB binding, while enolase binds to residues 738-845 on RNase E. The
binding site for PNPase is within the last 217 residues at the C-terminus, which consists
of residues 844-1045 (Vanzo et al. 1998). Recently, the protein–protein interactions
among degradosome components were further examined using chemical cross-linking,
size-exclusion chromatography, partial proteolysis and Nanoflow mass spectrometry
analysis. The residues within the 728–784 regions are found to be important for the
interaction with RhlB. The enolase-binding site was narrowed down to residues 833–850
of RNase E. Moreover, the crystal structure of enolase in complex with a synthetic

14
peptide corresponding to this 18 amino acid stretch of RNase E (833–850) was recently
obtained and showed that a single molecule of an RNase E-derived peptide binds
asymmetrically in a conserved cleft at the interface of the enolase dimer. The segment
containing residues 1022-1061 of RNase E was shown to bind PNPase, which is in
agreement with the earlier finding that PNPase binds at the end of C-terminus (Callaghan
et al. 2004). Although the reported molar ratios of these four major components from
purified degradosomes vary, it is recognized that RNase E associates with a molar excess
molar of PNPase and an equal molar amount of RhlB (Carpousis et al. 1994; Khemici et
al. 2004; Lin and Lin-Chao 2005).
The degradosome-organizing domain of RNase E has little structure under native
conditions and is unlikely to be extensively folded within the degradosome. Among the
few segments of structural propensity in RNase E CTH, a larger segment of 80 residues is
predicted to form a coiled coil and could possibly interact with RNA. The other three
isolated segments of 10–40 residues are possibly the site of self-recognition and protein-
protein interaction. It has been suggested that the “scaffold region” of RNase E may act
as a flexible tether of the degradosome components since binding of the three major
degradosome components does not induce significant folding of the CTH (Callaghan et
al. 2004). Given its intrinsically unstructured nature, it is not surprising that the CTH
domain is highly divergent amongst the members of the RNase E family. The presence of
the CTH may confer selective advantages to E. coli and closely related bacteria in term of
fine-tuning the transcript dynamics within the cell through the assembly of the
degradosome.

15
RNase H S1 5’ sensor RNase H DNase I Zn-link
1 35 118 215 279 400 415 500 604 688 1061
RhlB PNPase
N-terminal Catalytic DomainC-terminal Domain
Degradosome Components Interactions
EnolaseARRBSRNase H S1 5’ sensor RNase H DNase I Zn-link
1 35 118 215 279 400 415 500 604 688 1061
RNase H S1 5’ sensor RNase H DNase I Zn-link
1 35 118 215 279 400 415 500 604 688 1061
RhlB PNPase
N-terminal Catalytic DomainC-terminal Domain
Degradosome Components Interactions
EnolaseARRBS
Figure 1.2 Schematic representation of the structure of RNase E. Linear representation of the subdomain boundaries within the N-terminal catalytic domain. The degradosome-scaffolding C-terminal domain has binding regions for RNA/helicase, enolase and PNPase (Modified from Callaghan, 2005).
Function of the degradosome
Many cellular functions are carried out in vivo by multicomponent
macromolecular complexes (i.e., cellular machines) rather than by individual freely
diffusable proteins. Well recognized and extensively studied examples of such complexes
include ribosomes, replisomes, and proteasomes. The E. coli RNA degradosome is the
prototype of a family of multiprotein machines involved in the processing and
degradation of RNA. Complexes analogous to the degradosome, sometimes sharing
homologous components are found in eukaryotic cells as well. For example, the
exosome and mtEXO are degradosome-like complexes involved in RNA processing and
degradation identified in yeast and its mitochondria (Margossian et al. 1996; Mitchell et
al. 1997). The mtEXO complex contains a PNPase homologue and a putative DExH-box
helicase. Similarly, two ATP-dependent RNA helicases are associated with the exosome
(Anderson and Parker 1998; de la Cruz et al. 1998). Finally, a PNPase homologue is part
of a multiprotein complex implicated in the regulation of chloroplast message stability
(Hayes et al. 1996). The identification of multiprotein complexes in both prokaryotic and

16
eukaryotic cells suggests that assemblies of ribonucleases with other enzymes such as
RNA helicases is a common feature in RNA processing and decay.
The association of an endoribonuclease, an exoribonuclease and an RNA helicase
would seem to make the degradosome ideally suited to breakdown RNA molecules. The
different steps in the degradation of mRNAs are speculated to be orchestrated by the
degradosome in a coordinated manner: when the degradation of mRNA is initiated by
RNase E-mediated endonucleolytic cleavage, the newly generated 3’ ends can be directly
attacked by PNPase which is capable of breaking down RNAs from the 3’ end to the 5’
end; thus eliminating the potentially slow step in which free PNPase locates the 3’ end of
the substrate. The presence of an ATP-dependent RNA helicase, RhlB, in the
degradosome presumably helps unwind unfavorable RNA secondary structures that could
block the action of PNPase and RNase E, both of which are single-strand specific
ribonucleases.
Notwithstanding the isolation of multicomponent RNase E-based complexes from
E. coli, it has been difficult to demonstrate its physiological significance,for several
reasons. (1) Truncated RNase E protein lacking the CTH, and therefore not capable of
assembling the degradosome, is sufficient for cell survival and for RNA degradation in
vivo. (2) Purified RNase E devoid of other degradosome components is functional in
vitro. (3) The scaffold region that interacts with other degradosome proteins is not
conserved in the RNase E homologues in certain other bacteria, e.g. Synechocystis sp.
Recent evidence that reveals physiological roles of the degradosome have begun
to emerge. Electron microscopy studies using immunogold labeling and freeze-fracture
methods demonstrate that degradosomes exist in vivo in E. coli as multicomponent
structures that associate with the cytoplasmic membrane via the N-terminal region of
RNase E (Liou et al. 2002). Nearly all the RNase E C-terminal truncation mutants

17
exhibit some degree of impaired growth. Furthermore, deletion of the CTH of RNase E
containing both ARRBS and the scaffold region significantly slows down the degradation
of bulk RNA, although the processing of rRNA is not affected (Ow et al. 2000). A recent,
more extensive analysis of degradosome function using DNA microarrays revealed that
all four degradosome components, including RNase E, PNPase, RhlB, and enolase, are
necessary for normal mRNA degradation in E. coli. Decay of some E. coli mRNAs in
vivo also depends on the action of assembled degradosomes (Bernstein et al. 2004).
In addition, there is increasing experimental evidence that individual
degradosome components functionally interact during decay of at least some RNAs.
PNPase is a major 3' to 5' exoribonuclease of E. coli and functions both in the
degradation of mRNA and stable RNA species and as a poly(A) polymerase. PNPase
cooperates with RNase E in the degradation of RNA I, an antisense regulator of
replication of ColE1-type plasmids (Xu and Cohen 1995).
RhlB is one of the five DEAD-box proteins in E. coli; the other four are CsdA
(formerly called DeaD), DbpA, RhlE and SrmB (Iost and Dreyfus 2006). They are
members of a family of RNA helicases that contain a characteristic DEAD-box core (350
amino acids). The DEAD-box proteins are now known to be part of the widely
distributed DExD/H-box family of helicases that participate in many RNA unwinding
and remodeling reactions (Tanner and Linder 2001). The DExD/H-box proteins together
with other RNA and DNA unwinding enzymes constitute a helicase superfamily
containing a structurally conserved ATPase domain with RecA-like architecture
(Gorbalenya and Koonin 1993; Caruthers and McKay 2002). The sequence alignment of
the DEAD-box proteins shows that the conserved catalytic core is flanked by C-terminal
extensions that differ both in size (from 70 to 290 amino acids) and sequence. These non-
conserved extensions are thought to mediate the interactions of DEAD-box proteins with

18
their specific partners or with RNA substrates (Silverman et al. 2003). As one of the
smallest members of the DExD/H-box family, RhlB contains little more than the
common DEAD-box core. In contrast with the other four DEAD-box proteins, RhlB
lacks detectable ATPase and RNA helicase activities unless it is stimulated by binding to
the CTH of RNase E. Interestingly, studies with different RNase E fragments reveal
that the stimulation of the helicase activity is dependent on an arginine-rich region of
RNase E (residues 789–820), which might contribute to RNA binding and thus facilitate
the interaction of RNA substrate with the helicase core (Vanzo et al. 1998; Silverman et
al. 2003; Iost and Dreyfus 2006).
Inactivation of the rhlB gene severely impedes the degradation of mRNAs
containing stable secondary structures, such as REP (repeated extragenic palindrome)
elements (Py et al. 1996; Coburn et al. 1999; Khemici and Carpousis 2004). Studies using
in vitro reconstituted degradosome show that a complex containing all three components,
RNase E, PNPase and RhlB, is required to degrade the highly structured malE REP
sequence (Coburn et al. 1999). RhlB also facilitates the degradation of ribosome-free,
highly RNase E-sensitive mRNAs in vivo. The mRNAs transcribed by bacteriophage T7
RNA polymerase contain long stretches of ribosome-free mRNAs because transcription
outpaces translation as a result of higher mRNA elongation rate by the bacteriophage T7
RNA polymerase compared with the E. coli counterpart. These ribosome-free mRNAs are
exceptionally sensitive to inactivation and degradation by RNase E (Iost and Dreyfus
1995). Deletion of the rhlB gene stabilizes the ribosome-free lacZ and other mRNAs
transcribed by bacteriophage T7 RNA polymerase. Primer extension analysis confirmed
that RhlB facilitates the endoribonucleolytic cleavage of lacZ mRNA by RNase E
(Khemici et al. 2005). These results suggest that RhlB mediates the unwinding of these
structures that otherwise would impede the processivity of RNase E and PNPase.

19
The 48 kDa enolase is a universally conserved enzyme of glycolytic metabolism
that is found in archaea, eubacteria and eukaryotes. The enzyme catalyzes the
interconversion of phosphoenolpyruvate and 2-phospho-d-glycerate, which proceeds
through the reversible elimination of water. In E. coli, roughly 10% of the total enolase is
sequestered in the degradosome (Liou et al. 2001). Unlike RNase E, RhlB or PNPase,
whose presence in the degradosome is well explained by their individual roles in RNA
metabolism, the function of the enolase is not clear. In fact, a functionally active
“minimal” degradosome containing only RNase E, RhlB and PNPase can be reconstituted
from individually purified components (Coburn et al. 1999). However, analysis of
transcript levels using DNA microarrays has shown that disruption of enolase’s
interaction with RNase E in E. coli affects the turnover of some mRNAs, particularly, the
transcripts encoding enzymes of energy-generating metabolic routes (Lee et al. 2002;
Bernstein et al. 2004). It has also been reported that the association of enolase with
RNase E is required for the response to excess phosphosugar (Morita et al. 2004;
Kawamoto et al. 2005). Under this condition, the small regulatory RNA, SgrS, is induced
and recruited to the degradosome via Hfq, resulting in the targeted degradation of the
transcript encoding the transmembrane glucose transporter, ptsG (Morita et al. 2005).
These results suggest that the function of enolase may serve to link cellular metabolic
status with post-transcriptional gene regulation. Nevertheless, the direct interaction of
enolase and RNase E is not required for the induction of SgrS or for ptsG transcript
turnover. Additional investigations will be needed to reveal the exact function of
enolase in the degradosome.
The emerging picture of the RNA degradosome suggests RNase E-based
complexes that are much more versatile than originally thought. For example, recent
work indicates that degradosomes vary in composition in response to altered

20
environment. A specialized degradosome containing CsdA, whose expression is
induced by cold shock, is found to form at low temperatures. Reconstitution of a complex
containing RNase E, PNPase and CsdA shows that CsdA can furnish an ATP-dependent
activity that facilitates the efficient degradation of a model mRNA at low temperatures
(Prud'homme-Genereux et al. 2004). In addition, two other DEAD-box helicases, SrmB
and RhlE, are also able to interact with RNase E in vitro. Interestingly, mutation analyses
show that SrmB, RhlE and CsdA bind to RNase E at a site that is different from the RhlB
binding site. RhlE can fully replace RhlB and display RNA-dependent ATPase activity
in functional assays using the reconstituted minimal degradosomes prepared from
purified components (Khemici et al. 2004). Thus, RhlB, RhlE and CsdA are
interchangeable in assays of RNA degradation performed in vitro. Just like CsdA, the
recruitment of SrmB and RhlE to the degradosome might also depend on physiological
conditions which have yet to be identified. Taken together, these findings suggest that
the RNA degradosome is flexible and capable of adapting to changing cellular
environments.
To make the picture more complete, other recent work indicates that RNase E
may be part of multiple RNP complexes, and that the RNA degradosome is just one of
them. For example, RNase E forms variable ribonucleoprotein complexes with
Hfq/sRNAs (e.g. SgrS and RyhB) through its C-terminal scaffold region. These
complexes are distinct from the RNA degradosome since the Hfq/sRNAs appears to be
able to associate with RNase E only when its C-terminal scaffold region is not occupied
by other degradosome components (Morita et al. 2005). It is therefore suggested that
these RNase E-based ribonucleoprotein complexes may act as specialized RNA decay
machines that initiate the degradation of mRNAs targeted by individual sRNA.

21
It is also of considerable interest that recent data suggest degradosome proteins
are also found unattached to RNase E. While RNase E and the RhlB helicase are present
in E. coli cells in approximately equimolar amounts throughout cell growth, only 5–10%
of cellular enolase and 10–20% of PNPase are estimated to be present in the
degradosome complex in E. coli. Moreover, the molar ratios of enolase and PNPase to
RNase E fluctuate with the growth phase, suggesting a dynamic regulation of
degradosome composition in vivo (Py et al. 1996; Liou et al. 2002). Therefore
mutations in degradosome constituents may affect the actions of unassociated
constituents as well as the actions of proteins in assembled degradosomes. Consistent
with the possibility that degradosome components may function independent of the
degradosome, RhlB helicase has been shown to interact directly with PNPase
independently of RNase E (Lin and Lin-Chao 2005). Notably, the PNPase-RhlB
complex, is analogous to eukaryotic cell exosome complexes, which carry out 3’ to 5’
exonucleolytic RNA degradation and contain homologous PNPase and RNA helicase
(Mitchell et al. 1997; Anderson and Parker 1998). Collectively, these findings indicate
that different types of ribonuclease complexes exist, enabling bacterial cells to effectively
process and degrade a wide range of RNA substrates.
RNASE E ACTION
RNase E cleavage specificity
Given its central role in RNA processing and degradation in E. coli, the biochemical
properties of RNase E have been extensively investigated. Particularly, knowledge of the
substrate specificity allows the understanding of how different elements of RNA structure

22
individually contribute to the efficiency and specificity of RNase E cleavage. Through an
analysis of mutants in a bacteriophage T4 mRNA processing site, a consensus
pentanucleotide ((A/G)AUU(A/U)) that determines RNA substrate susceptibility to
RNase E cleavage was suggested (Ehretsmann et al. 1992). However, studies on the
degradation of rpsT mRNA indicate that rather than recognizing a particular consensus
sequence, RNase E is a single-strand-specific enzyme with few primary structural
constraints (Mackie 1992). Through introducing random mutations at the 5’ end of RNA
I and studying their effect on the position of the cleavage in vivo and in vitro, McDowall
et. al. demonstrated that an unstructured, AU-rich region is required for efficient cleavage
by RNase E (McDowall et al. 1994). A recent study utilizing an oligonucleotide-based
assay suggests the presence of a weak consensus motif
(G,A)(C,A)N(G)(G,U,A)↓(A,U)(C,U)N(C,A)(C,A) and that the G at position -2 is highly
conserved for efficient cleavage (Kaberdin 2003). It is now suggested that the
preference of RNase E for the AU-rich substrates arises mainly as a consequence of the
recognition of the RNA conformation, rather than the exact sequence. Specifically, the
crystal structure of the RNase E catalytic domain in complex with bound RNA shows that
the RNA follows the same stacking arrangement over the surface of the RNA-binding
channel, and only one of the bases directly contacts with RNase E through a hydrogen
bond. No other sequence recognition exists aside from that contact (Callaghan et al.
2005).
While the exact nature of an RNase E cleavage site is still unclear, it has been shown
that in vitro, RNase E prefers a 5’ monophosphate terminus to a 5’ triphosphate. Since
the cleavage product of RNase E is a 5’ monophosphate, the preference for

23
monophosphorylated RNA substrates ensures that once decay of an mRNA by RNase E
is initiated, continued degradation of the 3’ cleavage product is preferred over an intact
triphosphorylated RNA (Mackie 1998; Jiang and Belasco 2004). This indicates that
RNase E must somehow recognize an internal cleavage site and a 5’-terminal unpaired
nucleoside monophosphate residue as well. The crystal structure of the RNase E
catalytic domain shed some light on the mechanism whereby the recognition of the 5’-
terminus of the RNA triggers catalysis. In the proposed induced-fit model, the
engagement of the 5’monophosphate of the RNA in the 5’ sensing pocket causes an
allosteric change in RNase E, thus inducing the S1 domain to clamp down on the RNA
downstream and triggering cleavage (Callaghan et al. 2005). The sensitivity of RNase E
to the phosphorylation status at the 5’ end of RNA was previously attributed simply to
the relative affinity of the enzyme for monophosphorylated versus triphosphorylated
mRNA. However, a recent study using fluorogenic RNA substrates that allow more
accurate quantification of RNase E activity argues that 5’ monophosphate facilitates the
endoribonucleolytic reaction by increasing the catalytic efficiency and promoting
dimer/tetramer formation of RNase E (Jiang and Belasco 2004). This is in agreement
with the X-ray structure and biochemical studies which suggest that E. coli RNase E
protein functions as a homotetramer formed by the Zn linkage of dimers. Nevertheless,
this current model that a tetrameric quaternary structure is essential for the core
enzymatic functions of RNase E is challenged by the identification of a conserved
minimal RNase E peptide (aa residues 1-395) which preserves the core catalytic
functions. Despite its lack of the Zn-coordination site which is required for tetramer
formation, the RNase E 1-395 fragment is sufficient to carry out the various known

24
functions of RNase E, as well as to complement an rne deletion in vivo (Caruthers et al.
2006).
In an effort to understand how RNase E identifies its cleavage sites, Feng et al.
used synthetic oligoribonucleotides containing repeats of identical target sequences with
2’-O-methyl modifications at defined positions. They showed that the uncleavable target
sequence (i.e. 2’-O-methyl-modified nucleotides) impedes cleavages at unmodified sites
located 5’ to, but not 3’ to, the uncleavable target sequence. This observation indicates
that RNase E catalytic domain binds selectively to 5’-monophosphate RNA termini but
has an inherent mode of cleavage in the 3’ to 5’ direction in a quasi-prosesive manner.
Interestingly, RNase G, which has extensive structural homology with N-Rne, and can
functionally complement an rne null mutation, has a non-directional mode of action
(Feng et al. 2002).

25
5’ PPP
AA A
A
A
AA
PP
5’PPP 3’
3’
5’P
5’ 3’
5’P
5’ 3’5’ 3’
5’ PPP
AA A
A
A
AA
PP
5’PPP 3’
3’
5’P
5’ 3’5’ 3’
5’P
5’ 3’5’ 3’5’ 3’5’ 3’
Figure 1.3 mRNA decay catalyzed by the RNase E based degradosome. The degradosome contains RNase E, PNPase, RhlB and enolase. RNase E is present in the degradosome as a dimer or higher oligomer. RNase E recognizes an internal cleavage site and a 5'-terminal unpaired nucleoside residue. A monocistronic mRNA terminated with a Rho-independent transcription terminator (stem-loop structure) is shown as an example. Prior to the initiation of decay, the 3’ end of the transcript is polyadenylated by PAP I. The PNPase protein binds to the poly(A) tail while RNase E binds (inefficiently) to the 5’ triphosphate terminus. A 5’ monophosphate terminus generated by the first endonucleolytic cleavage by RNase E stimulates the activity of RNase E. At the same time, PNPase is degrading exonucleolytically from the 3’ terminus releasing nucleoside monophosphates. The oligonucleotides generated by RNase E cleavage would subsequently be degraded by the terminal steps as shown in figure 1.1. Mauve: RNase E and RNase E cleavage sites, Green: PNPase, Blue: RhlB, Yellow: Enolase.

26
RNase E autoregulation
The expression level of RNase E is tightly controlled by a negative feedback loop.
RNase E represses its own synthesis through the reduction of the cellular level of the rne
transcript which is cleaved by the enzyme (Mudd and Higgins 1993). The cleavage site is
within the 5’-terminal segment which contains the 361-nucleotide of 5’ untranslated
region (5’-UTR) and the first 28 codons of the rne protein-coding region. This 5’-
terminal 0.45-kb segment is sufficient to confer the feedback regulatory property onto a
heterologous transcript to which it is fused. As a consequence of autoregulation, the
half-life of the rne mRNA varies from less than 40 seconds in strains hosting a multicopy
plasmid to more than 8 minutes in an rne temperature-sensitive mutant strain, thus
maintaining the RNase E protein level within a narrow range (Jain and Belasco 1995).
RRAA, THE TRANS-ACTING FACTOR MODULATING RNASE E ACTIVITY
As discussed above, RNase E plays a central role in RNA decay and processing in
E. coli. The activity of RNase E is affected by the growth conditions. For example, the
processing of RNAs by RNase E is affected by anaerobiosis during cell growth
(Georgellis et al., 1993) and also to occur prominently in transcripts that encode proteins
involved in energy-generating pathways (Lee et al. 2002 and Bernstein et al. 2002).
The prototypical trans-acting modulator of RNase E activity, RraA (regulator of
ribonuclease activity A), was isolated in a genetic screen aimed at the identification of
genes whose overexpression enhances disulfide isomerase (DsbC) activity in E. coli.

27
Briefly, an E. coli genomic DNA library, cloned into the expression vector pTrc99A
downstream from the IPTG-inducible Trc promoter was screened for ability to confer
increased folding yield of the v-tPA (a truncated variant of human tissue plasminogen
activator [h-tPA]) by monitoring the formation of a clearance zone on fibrin plates. h-
tPA, a protease that converts plasminogen to plasmin and contains a total of 17 disulfide
bonds, is expressed in a catalytically active form in E. coli only in cells that produce
elevated levels of DsbC (Qiu et al. 1998). Thus, DsbC activity can be measured using h-
tPA as a model substrate. This screen yielded a clone corresponding to a fragment
containing an open reading frame (ORF) previously annotated as menG in the NCBI
database (Qiu 2001), later renamed as RraA based on its function.
The level of dsbC mRNA is highly sensitive to cellular RNase E activity, e.g. the
half-life of a dsbC transcript is less than a minute in the rne wild-type strain, however its
stability is increased by three-fold in rne mutants. Further experiments revealed that the
observed increase in DsbC protein level with RraA overexpression resulted from the
stabilization of the dsbC transcript. Adventitious expression of RraA inhibits the RNase E
mediated degradation of dsbC transcript, resulting in more than 5-fold increase in its half-
life (0.8 min to >4 min) (Zhan et al. 2004).
Subsequent extensive biochemical and genetic studies demonstrated that RraA
interacts with RNase E and inhibits it catalytic activity in vivo and in vitro (Lee et al.
2003). Overexpression of RraA inhibits the autoregulatory cleavage of RNase E at its
5’-UTR and results in a 3-4 fold increase in β-galactosidase activity from a chromosomal
rne-lacZ fusion (Jain and Belasco 1995) in which the 5’-terminal segment responsible for
feedback regulation of rne was fused upstream of lacZ. Purified RraA inhibits the

28
cleavage of various well-defined RNA substrates by full-length RNase E in vitro. The
direct interaction between RraA and RNase E in vivo was confirmed by co-precipitation
of RNase E by biotin-tagged RraA after nuclease treatment. Moreover, gel shift assays
demonstrated that RraA does not interact detectably with RNA substrates or inhibit the
binding of substrate RNA to RNase E. These findings argue that RraA affects the
ability of RNase E to disrupt phosphodiester bonds between nucleotides by a mechanism
that is independent of substrate binding. The absence of experimental evidence for
binding of RraA to RNA substrates is supported by the crystal structure of RraA, which is
found to form a ring-like trimer with a central cavity of approximately 12 Å in diameter
lacking any structural motif characteristic of nucleic acid binding (Figure 1.4) (Monzingo
et al. 2003). RraA interacts with full-length RNase E with an equilibrium dissociation
constant (KD) of 26 μM, which is of the same order as the one for proteins that perform
regulatory functions such as, for example, the interaction of transcription factors with the
core RNA polymerase enzyme.
RraA exhibited higher affinity and displayed more effective inhibition of RNA
processing by the full-length RNase E relative to a fragment containing only the catalytic
domain. For example, the processing of a well studied RNA substrate, pM1, by full-
length RNase E was inhibited by 50% at a 10:1 molar ratio of RraA monomer to purified
RNase E. The inhibitory effect of RraA on the cleavage of pM1 by the N-terminal
catalytic domain of RNase E was much weaker and the maximum inhibition of pM1
processing was 45% at the highest concentration of RraA used (200-fold molar excess of
monomer over N-terminal catalytic domain protein). Furthermore, no binding between
RraA and the N-terminal catalytic domain has been detected in vivo or in vitro. These

29
observations suggest that the C-terminal scaffold region of RNase E enhances the ability
of the catalytic domain of the ribonuclease to interact with RraA.
Figure 1.4 Models of RraA. (A) The backbone model of an RraA monomer. This stereo picture illustrates the fold of the protein and displays its secondary structural elements. Residues along the backbone are labeled to aid in following the polypeptide path. (B) The trimeric arrangement of RraA. RraA functions as a trimer, and a trimer is the asymmetric unit of the crystal. Three monomers pack around a pseudo 3-fold axis (Monzingo, 2003).
Microarray profiling shows that overexpression of RraA circumvents the effects of
an autoregulatory mechanism that normally maintains the RNase E cellular level within a
narrow range, resulting in the genome-wide accumulation of RNase E-targeted transcripts
(more than 2000). The absence of rraA destabilized the abundance of numerous (~80)
A B

30
transcripts at least 2-fold, consistent with the inhibitory effect of RraA on the
endoribonucleolytic activity of RNase E (Lee et al. 2003).
RraA-like genes are widely distributed in nature with homologues found in many
organisms that contain endonuclease genes homologous to RNase E, including Archae,
proteobacteria, and Arabidopsis. RraA also efficiently inhibited the cleavage of pM1
RNA by RNase ES, a functional ortholog of E. coli RNase E in S. coelicolor. The
conservation of function between RraA and RNase E homologues from two distantly
related bacterial species (i.e., S. coelicolor and E. coli) suggests that RraA may have a
phylogenetically conserved function in modulating ribonuclease activity.
RESEARCH OUTLINE
RraA represents a prototype for cellular proteins that modulate RNA decay and
processing by binding to ribonucleases and inhibiting their activity. The
characterization of additional cellular proteins that inhibit RNase E activity will improve
our understanding of the action mechanisms of these protein modulators. Together with
RraA, RraB was isolated in the same functional screen for genes that enhance disulfide
bond isomerization in the E. coli periplasm as a consequence of its ability to stabilize the
dsbC transcript. Subsequent research (Chapter 2) reveals RraB is a second adaptor
protein which interacts with a different site on RNase E and interferes with cleavage of a
different set of transcripts. Importantly, biochemical and genetic studies (Chapter 2 and
Chapter 3) led to the discovery of a novel mechanism whereby the selective remodeling

31
of the degradosome by endonuclease-binding proteins serves to dramatically alter the
steady state level of hundreds of transcripts in E. coli. An in vitro reconstitution system
for the mechanistic analysis of selective inhibition of RNA processing by RraA and RraB
is discussed in Chapter 3.
As with other post-translational mechanisms of regulation, the physiological
significance of inhibition of RNase E activity by RraA/RraB is probably to facilitate
rapid alterations in RNA degradation and/or processing in response to specific
environmental stimuli. Examining this hypothesis requires a better understanding of the
regulation of rraA/rraB expression. Previously, the regulation of rraA was thought to
be linked to the synthesis of the redox mediator menaquinone. In chapter 4, I present
evidence that transcription of rraA from its own promoter is elevated upon entry of
stationary phase in an rpoS-dependent manner and that the stability of the rraA transcript
is also dependent on RNase E activity. This suggests that the biological role for the σs-
dependent PrraA activity in early stationary phase may be to provide a means for the
protection of σs-dependent transcripts from the decay catalyzed by RNase E. Finally, I
have examined in some detail the regulation of the second RNase E modulator, rraB
(Chapter 5).

32
Chapter 2: RraB: A second RNase E-inhibitory protein that differentially modulates the mRNA abundance
INTRODUCTION
RNase E, an essential endoribonuclease of E. coli, is a major player in RNA
metabolism including the turnover of numerous cellular mRNAs, the processing of
ribosomal and tRNAs, and the degradation of small regulatory RNAs (Ghora and Apirion
1978; Li et al. 1999; Lin-Chao et al. 1999; Steege 2000; Bernstein et al. 2002; Kushner
2002; Li and Deutscher 2002; Masse et al. 2003). Not surprisingly, the regulation of
cellular level and activity of RNase E in E. coli is complex. First, the efficiency of
RNase E cleavage depends on the structural features of RNA substrates and the factors
affecting the accessibility of the cleavage sites. Binding to a 5’ monophosphate terminus
significantly stimulates enzymatic activity and promotes dimer and tetramer formation
(Mackie 1998; Jiang and Belasco 2004). In addition, RNA binding proteins, such as
Hfq, can reduce the efficiency of RNA processing, competing with RNase E for the same
A/U rich regions (Moll I et al. 2003). Second, the amount of RNase E in the cell is
another parameter which probably effects efficiency of RNA processing. RNase E
autoregulates its synthesis by modulating decay of its own mRNA, the stability of which
varies inversely with the cellular RNase E activity (Mudd and Higgins 1993; Jain and
Belasco 1995). Third, RNA decay is regulated by interaction with RraA (regulator of
ribonuclease activity A). RraA is an evolutionarilly conserved small protein which
binds directly to RNase E and inhibits its endonucleolytic cleavages (Lee et al. 2003).
Adventitious expression of RraA circumvents the effects of the autoregulatory

33
mechanism and modulates the accumulation of over 2,000 RNase E-targeted transcripts
(Lee et al. 2003).
The work described here was undertaken to determine whether cellular proteins
other than RraA might participate in the regulation of RNase activity in vivo. An E. coli
genomic DNA library was screened for clones that would increase disulfide
isomerization activity, which hinges on a protein encoded by an RNase E-cleavable
transcript with a short half-life (Zhan et al. 2004). This screen takes advantage of the
high sensitivity of disulfide isomerase (dsbC) mRNA to the action of RNase E, although
the screen for activities does not specifically require a regulator of RNase E. Here we
report the isolation and characterization of a second protein modulator of RNase activity,
previously annotated as YjgD and renamed as RraB (regulator of ribonuclease activity B)
based on its function. RraB and RraA share a number of common characteristics. Both
inhibit RNase E activity in vitro and in vivo by binding to the enzyme. Despite these
similarities, there are also striking differences between RraB and RraA. They interact
with RNase E at separate sites within RNase E and exert dramatic and distinct effects on
the composition of the degradosome. The combined action of the two proteins
differentially alters mRNA decay in a transcript-specific manner. Our results reveal a
novel mechanism for the global control of steady state mRNA abundance in E. coli that
appears to be mediated by dynamic remodeling of the degradosome composition in
response to elevated expression of RraA or RraB.
The work described in this chapter was done through collaboration between
researchers in the Georgiou laboratory and the Cohen laboratory (Stanford University).
Specifically, Dr. Junjun Gao (U. Texas) performed surface plasmon resonance analysis,
the SPA purification of degradosomes and proteomic analyses; Dr. Kangseok Lee

34
(Stanford) performed the in vitro cleavage assay and microarray analysis of the
transcription profile.
MATERIALS AND METHODS
Strains and plasmids
The strains and plasmids used in this work are listed in Table 2.1. The
construction of the chromosomal rne deleted E. coli strain KSL2000, KSL2009, and the
rraA null strain JQ004 have been previously described (Lee et al. 2002; Lee et al. 2003).
The rraB null strain JG002 was constructed using the chromosomal gene inactivation
method describe by Datsenko and Wanner (Datsenko and Wanner 2000). The rraA rraB
double null strain JG004 was constructed by transducing the allele into strain JQ004 with
P1 phage.
Plasmids pDW363-RraA and pDW363-RraB encoding a biotag-RraA and biotag-
RraB fusion were constructed by cloning the rraA or rraB gene into the XhoI-BamHI site
of vector pDW363 (Tsao et al. 1996). The chloramphenicol-resistant pTrc-RraA-Cm
plasmid was constructed by inserting the Cmr cassette into the Ampr cassette of the pTrc-
RraA plasmid.
β-galactosidase assay
E. coli cells transformed with pTrc-RraA or pTrc-RraB or empty vector were
cultured in LB media at 37oC. When culture A600 reached around 0.2, IPTG was added

35
to the final concentration of 0.5 mM. Cells were harvested after 1.5 hours and 100 μl of
the cell culture was chilled on ice for 10 minutes. Afterwards 400 μl of Z Buffer (60 mM
Na2HPO4, 40 mM NaH2PO4, 10 mM KCl, 1 mM MgSO4, 50 mM β-mercaptoethanol),
100 μl of CHCl3 and 50 μl of 0.1% SDS were added to the sample. The mixture was
vortexed vigorously for 20 seconds to completely lyse the cells. The reaction was started
by addition of 200 μl of ONPG (o-Nitrophenyl-β-D-galactoside, 4 mg/ml) to the mixture.
After sufficient yellow color had developed, the reaction was stopped by the addition of
250 μl of 1 M Na2CO3 solution and the total reaction time for each reaction was recorded.
The reaction mixture was centrifuged at 13,000 rpm for 5 minutes to remove any cell
debris. The optical density of the reaction at wavelength 405 nm was measured. The unit
of β-galactosidase was defined as 1 Miller Unit = 1000 x A405 / Time (in minutes) x
Volume (in milliliters) x A600.
RNA work
RNase protection assays were performed in cells grown, induced and harvested as
above. An aliquot was harvested 1.5 hour after induction to determine the steady state
level of rne transcripts and the rest of the cells were treated with rifampicin at a final
concentration of 200 μg/ml. Subsequently, cell samples harvested at different time points
were rapidly chilled in a liquid nitrogen bath and total RNA was prepared using an
RNeasy® kit (Qiagen, CA). The amount of RNA was quantified spectrophotometrically at
260 nm and RNase protection assays were carried out using the RPA III kit (Ambion,
TX) with a probe containing sequence complementary to to the -359 to +33 bp region of
rne transcript. The band intensity from each sample was quantified using the
ImageQuant® software.

36
Table 2.1 Strains and plasmids Strain / Plasmid Description Reference or Source JCB570 MC1000, phoR zih12::Tn10 (Bardwell et al.,1991) JQ004 JCB570, rraA (Lee et al., 2003) JG002 JCB570, rraB This work JG004 JCB570, rraA rraB This work BL21 (DE3) F- ΔompT hsdSB(rB
-mB-) gal dcm (DE3) Novagen
MC1061 araD39 Δ(ara,leu)7697 ΔlacX74 galU- galK- hsr-hsm+ strA
(Casadaban and Cohen, 1980)
CJ1825 MC1061, (λez1) (Jain et al., 2002)
CJ1825/BZ99 MC1061, rne(1-602) (λez1) C. Jain N3433 lacZ43, relA, spoT, thi-1 (Goldblum and
Apririon, 1981) KSL2000 lacZ43, relA, spoT, thi-1, rne::cat,
recA::Tn10 [pBAD-RNE] (Lee et al., 2002)
KSL2009 lacZ43, relA, spoT, thi-1, rne::cat, recA::Tn10 [pBAD-NRNE]
(Lee et al., 2002)
AC21 MC1061, zce-726::Tn10 (Carpousis et al., 1994)
AC23 MC1061, zce-726::Tn10, rne(ams) (Vanzo et al., 1998) AC24 AC23, rneΔ10(aaΔ844-1045) (Leroy et al., 2002) AC26 AC23, rneΔ18(aaΔ728-845) (Leroy et al., 2002) AC27 AC23, rne131 (Leroy et al., 2002) AC28 AC23, rneΔ14(aaΔ636-845) (Leroy et al., 2002) AC29 AC23, rneΔ17(aaΔ636-693) (Leroy et al., 2002) AC31 AC23, rneΔ21(aaΔ603-627) (Leroy et al., 2002) AC32 AC23, rneΔ22(aaΔ603-693) (Leroy et al., 2002) pBAD-stII-htPA p15A ori, Cmr, h-tPA with stII leader under
PBAD (Qiu et al., 1998)
pTrc-RraA ColE1 ori, Ampr, rraA under trc promoter (Lee et al., 2003) pTrc-RraB ColE1 ori, Ampr, rraB under trc promoter This work pTrc-RraA-Cm ColE1 ori, Cmr, rraA under trc promoter This work pDW363 pBR ori, Ampr, birA (Tsao et al., 1996) pDW363-RraA pBR ori, Ampr, birA, rraA-biotag under trc
promoter (Lee et al., 2003)
pDW363-RraB pBR ori, Ampr, birA, biotag-rraB under trc promoter
This work
pDW363-DsbA pBR ori, Ampr, birA, dsbA under trc promoter
(Lee et al., 2003)
pBAD-RNE pSC101 ori, Kmr, rne under PBAD (Lee et al., 2002) pBAD-NRNE pSC101 ori, Kmr, N-rne under PBAD (Lee et al., 2003) pLAC-RNE2 pSC101 ori, Ampr, rne under PLAC This work pET28A-RraA f1 ori, Kanr, rraA under T7 lac promoter (Lee et al., 2003) pET28A-RraB f1 ori, Kanr, rraB under T7 lac promoter This work

37
Microarray procedures
Relative mRNA levels were determined by parallel two-color hybridization to
DNA microarrays (Schena et al. 1995) on glass slides containing 4405 known and
predicted ORFs. Comparative measurements of transcript abundance were performed by
directly determining the abundance of each gene's transcript relative to the wild-type
sample, described by Khodursky et al. (2000). Analysis of data was performed using the
software available at http://genome-www5.stanford.edu/microarray/SMD and
http://rana.lbl.gov.
Surface plasmon resonance analysis
Surface plasmon resonance analysis was performed at 25°C using a BIACORE®
3000 instrument (Biacore AB, Sweden). 2,500 RU each of purified RNase E and bovine
serum albumin were immobilized on different flow cells of a CM5 sensor chip using
amine-coupling chemistry as described by the manufacturer (BIACORE® 3000
instrument handbook, Biacore AB). Purified RraB in the concentration range between 0
and 100 μM was injected at a constant flow rate of 30 μl/min.
Pull-down assay
E. coli AC21 and derivatives were transformed with pDW363-RraA or pDW363-
RraB and cultured in LB media containing 8 µg/ml of biotin (Sigma, MO) at 37 °C.
Expression of biotinylated RraA or biotinylated RraB was initiated by addition of 1 mM

38
of IPTG when the cell culture A600 reached ~0.4. Three hours after induction, the cells
were harvested by centrifugation at 5,000 rpm for 10 minutes and re-suspended in 1/5
volume of ice-cold NP-40 lysis buffer (150 mM sodium chloride, 1.0% NP-40, 50 mM
Tris, pH 8.0). Cells were lysed by passing through a French press (2,000 psi). The
lysate was centrifuged for 15 minutes at 4 oC to remove intact cells and cell debris and
the protein concentration in the supernatant was determined. Aliquots containing 5 mg of
protein were mixed with 100 µl of streptavidin bead slurry (Amersham Biosciences,
Sweden) and the volume was adjusted to 800 µl. Following rotation at 4 oC for one
hour, samples were centrifuged at 6,000 rpm for 5 minutes and the pellets were washed
extensively 5 times with ice-cold NP-40 buffer. Finally, the streptavidin beads were
recovered and proteins were released by boiling for 10 minutes in 2XSDS protein loading
buffer (100 mM Tris-Cl [pH 6.8], 4% SDS, 200 mM β-mercaptoethanol). The presence
of RNase E was analyzed by Western blotting using polyclonal anti-RNase E antiserum.
SPA purification of degradosomes
The protocol was adapted from Butland et al. (Butland et al., 2005) with
modifications. One liter of E. coli cultures was grown in Terrific Broth (TB) at 32 °C to
an A600 ~0.6. Expression of RraA or RraB was induced with 1 mM IPTG for 3 hours.
Harvested cells were re-suspended in lysis buffer (10 mM Tris•Cl pH 7.9, 100 mM NaCl,
0.2 mM EDTA, 0.5 mM DTT, 10% glycerol) with Complete® protease inhibitor cocktail
(Roche, IN) and lysed by French press. Cell debris was removed by centrifugation at
20,000Xg for 30 minutes. The whole cell extracts were first treated with Benzonase®
nuclease (Novagen, CA) for 30 minutes and Triton X-100 was added to the final
concentration of 0.1%. 100 μl of Anti-FLAG M2 agarose beads (Sigma, MO) were added

39
and incubated for 3 hours with rotation. After extensive washing, the beads were re-
suspended in 200 μl TEV buffer (50 mM Tris•Cl pH 7.9, 100 mM NaCl, 0.2 mM EDTA,
1mM DTT, 0.1% Triton X-100) and digested with 5 μl of TEV protease overnight at
4 °C. Following digestion, 400 μl TEV buffer and 1.2 μl of 1 M CaCl2 were added to the
eluate and then incubated with 50 μl calmodulin-sepharose beads (Amersham
Biosciences, Sweden) for 3 hours. After incubation, 400 μl of calmodulin binding buffer
(10 mM Tris•Cl, 100 mM NaCl, 2 mM CaCl2, 10 mM 2-mercaptoethanol, 0.1% Triton
X-100, pH 7.9), followed by 100 μl of calmodulin wash buffer (10 mM Tris•Cl, 100 mM
NaCl, 0.1 mM CaCl2, 10 mM 2-mercaptoethanol, 0.1% Triton X-100, pH 7.9) were used
to wash the beads. The purified complex proteins were recovered using 300 μl of
calmodulin elution buffer and analyzed by SDS-PAGE using NuPAGE® Novex 4-12%
Bis-Tris gel (Invitrogen, CA). The gel was visualized by colloidal blue staining
(Invitrogen, CA).
Mass spectrometry
The stained protein bands were cut out and in-gel digested with proteomic grade
trypsin (Sigma, MO) at 37 °C overnight. The tryptic peptide mixtures were subjected to
Q-TOF Premier® mass spectrometer (Waters, MA) and the ProteinLynx (version 2.2)
software was used to analyze each dataset for protein identification.

40
RESULTS
Transcript-specific inhibition of the endonuclease activity of RNase E by RraB
Consistent with the notion that RraB overexpression may decrease the activity of
RNase E, analysis of the β-galactosidase level expressed from a chromosomal rne-lacZ
fusion in E. coli strain CJ1825 (Jain and Belasco 1995), showed a 2-3 fold increase in β-
galactosidase activity following induction of RraB synthesis (Figure 2.1A). The
increase in β-galactosidase activity is similar to that observed for RraA. Further analysis
indicated that the observed increase in β-galactosidase activity resulted from decreased
RNase E cleavage of the fusion transcript, which previously had been shown to occur in
the 5’ UTR segment of the rne-encoded segment (Mudd and Higgins 1993; Jain and
Belasco 1995). The effect of RraB on the processing of the rne 5’ UTR was statistically
indistinguishable from that conferred by RraA expressed from an identical plasmid.
Examination of the processing kinetics of the rne 5’ UTR using RNase protection assays
revealed that the cleavage was inhibited in cells expressing RraB with the t1/2 increasing
from 90 seconds to over 225 seconds. The steady-state abundance of rne mRNA was also
increased under RraB overexpression condition (Figure 2.1B). Strain CJ1825/BZ99
contains a truncated version of the rne gene encoding a protein that consists only of the
catalytic, N-terminal domain of the enzyme (amino acids 1-602) and additionally,
contains the rne-lacZ fusion described above. Expression of RraB in this strain resulted in
a modest increase in β-galactosidase activity (Figure 2.1 A).

41
0
500
1000
1500
2000
2500
3000
3500
- +RraA +RraB
MC1061 (λez1) MC1061 (λez1) rne(1-602) - +RraA +RraB
β-g
alac
tosi
dase
act
ivity
( Mill
er U
nits
)
0
500
1000
1500
2000
2500
3000
3500
- +RraA +RraB
MC1061 (λez1) MC1061 (λez1) rne(1-602) - +RraA +RraB- +RraA +RraB
MC1061 (λez1) MC1061 (λez1) rne(1-602) - +RraA +RraB
β-g
alac
tosi
dase
act
ivity
( Mill
er U
nits
)
300 bp
+RraB-RraB
Remaining % 100 45 19 15 10 14 100 123 125 88 115 65
P
Time (sec)
500 bp
400 bp
45 90 135 180 225 27045 90 135 180 225 270
*300 bp
+RraB-RraB
Remaining % 100 45 19 15 10 14 100 123 125 88 115 65Remaining % 100 45 19 15 10 14 100 123 125 88 115 65
P
Time (sec)
500 bp
400 bp
45 90 135 180 225 27045 90 135 180 225 270
*
Figure. 2.1. RraB inhibits the activity of RNase E in vivo. (A) β-Galactosidase activity expressed from a chromosomal rne-lacZ fusion and measured as described in the Methods and Materials. Cells transformed with pTrc99A, pTrc-RraA or pTrc-RraB were grown in LB media and induced at A600=0.2. After 1.5 h induction, the cells were harvested and assayed for β-galactosidase activity. The result shown is the average from three independent experiments. (B) rne 5' UTR decay. Cells were induced with 0.5 mM IPTG and 90 minutes after induction, rifampicin was added to stop transcription. One ml aliquots were collected every 45 seconds, RNA was extracted and 5 μg of total RNA were used in RNase protection assays. The percentage of remaining rne 5' UTR at each time point was calculated by dividing with the signal intensity of the first lane (45 s sample). The experiment was carried out in triplicate and the variation in the t1/2 values between repetitions was <5%. P, free probe containing sequence complementary to the −360 to +33 region of rne transcript. Asterisks (*) indicate the position of rne 5' UTR transcript.
A
B

42
While the above results argue that RraB, like RraA, is an inhibitor of RNase E
activity, examination of the steady state level of RNAs on a global scale indicated that
RraA and RraB differentially affect the ability of RNase E to attack various substrate
RNAs. The transcript profile of E. coli cells expressing either RraA or RraB was
examined by microarray analysis. These experiments were performed in E. coli strain
KSL2000 and KSL2009 in which the synthesis of RNase E and the N-terminal catalytic
domain, respectively, is under the control of the arabinose promoter. In addition, the
rne transcript produced in these two strains lacks the 5’ UTR site that is subject to attack
by RNase E. As a result, in strains KSL2000 and KSL2009 the level of RNase E is
adjusted by the concentration of arabinose and is not subject to autocatalytic control (Lee
et al. 2002).
Relative RNA levels in the presence or absence of RraA or RraB were determined
by two-color hybridization to DNA microarrays containing 4,405 known and predicted E.
coli ORFs (Blattner et al. 1997). In these experiments the effect of RraA or RraB was
compared with the consequence of RNase E depletion by arabinose withdrawal (Figure
2.2A). Transcripts exhibiting the most dramatic increase (> three-fold) were individually
clustered and are shown in Figure 2.2B-F.
Adventitious expression of either RraA or RraB increased the steady state level of
18% of all E. coli transcripts (corresponding to 792 out of 4,405 known and predicted
ORFs) at least two-fold. In particular, RraA uniquely affected the abundance of 371
transcripts (8.4%), while RraB altered the steady-state level of a distinct set of 85
transcripts (1.9%). An additional 127 RNAs (2.9%) accumulated to a greater degree
during adventitious expression of either RraA or RraB; however, their abundance was not
affected by RNase E depletion alone. The transcription profiles of RraA or RraB
expression are distinct from that of RNase E depletion alone. Thus, the microarray

43
analyses reveal that instead of simply acting as general inhibitors of RNase E, RraA and
RraB specifically modulate RNA decay and therefore affect the intracellular levels of
distinct sets of transcripts.
RraA and RraB had a marginal effect on transcript abundance in cells expressing
the catalytic domain of RNase E (strain KSL2009) rather than the full-length protein
(strain KSL2000) (Figure 2.2), implying that the C-terminal half of RNase E is required
for these effects. Consistent with the notion that an elevated level of RraA and RraB is
important for the inhibition of RNase E activity, 28 transcripts showed significantly
decreased cellular levels relative to the isogenic parent in the rraA rraB double mutant.

44
-a A B -a A BRne A
N-Rne
B C
D
E
F
G

45
Figure 2.2 Effect of RraB and RraA expression on the E. coli transcript profile. (A) Gene clusters whose relative mRNA levels were 2-fold or more changed in at least 2 out of 4 slides. Cy-5-labeled cDNAs were synthesized with RNA samples taken from strains: −a, KSL2000 plus pTrc99A (Rne) or KSL2009 plus pTrc99A (N-Rne) followed by withdrawal of arabinose for 1.5 hours; A, KSL2000 plus pTrc-RraA or KSL2009 plus pTrc-RraA; B, KSL2000 plus pTrc-RraB or KSL2009 plus pTrc-RraB. RNA samples from KSL2000 plus pTrc99A (Rne) or KSL2009 plus pTrc99A (N-Rne) grown in the presence of 0.1% arabinose were labeled with Cy-3 and comparisons between paired cultures were done directly. (B) Cluster of genes whose transcript abundance was at least three-fold increased when RNase E is depleted or RraA is overexpressed or RraB is overexpressed in strain KSL2000. (C) Cluster of genes whose transcript abundance was at least three-fold increased when RNase E is depleted or RraA is overexpressed in strain KSL2000. (D) Cluster of genes whose transcript abundance was at least three-fold increased when RraA is overexpressed or RraB is overexpressed in strain KSL2000. (E) Cluster of genes whose transcript abundance was at least three-fold increased when RNase E is depleted in strain KSL2000. (F) Cluster of genes whose transcript abundance was at least three-fold increased when RraA is overexpressed in strain KSL2000. (G) Cluster of genes whose transcript abundance was at least three-fold increased when RraB is overexpressed in strain KSL2000.
RraA and RraB interact differently with the CTH domain of RNase E
The differential effect of RraA and RraB on the catalytic activity of RNase E
suggests that the mode of interaction of the two inhibitors with the enzyme may be
distinct. First, we examined the binding of purified RraB with RNase E by surface
plasmon resonance analysis on a BIACORE® 3000 instrument. Binding of RraB to the
purified RNase E immobilized on the CM5 chip was detected as an increase in response
units (RU). An equilibrium dissociation constant (KD) of 28.2 μM was calculated by
steady state analysis (Gao et al, 2006). This value is statistically indistinguishable from
the KD of 26 μM determined earlier for the interaction of RraA with full length RNase E
(Lee et al. 2003). Binding of the purified RNase E catalytic domain (amino acids 1-498)
to RraB could not be detected by surface plasmon resonance.

46
The contribution of the various domains of RNase E to the binding of RraA or
RraB was evaluated in vivo by co-precipitation analysis using a set of RNase E truncation
mutants. Carpousis and co-workers constructed a series of isogenic strains in which the
chromosomal rne gene was replaced by mutant alleles containing various C-terminal
deletions (Leroy et al. 2002). For our analysis, RraB was fused to a 21 amino acid
extension (Biotag), which encodes a peptide substrate of the E. coli biotin holoenzyme
synthetase (Schatz 1993). While fusion of the Biotag peptide at the C-terminus
destabilized the protein and gave no detectable expression, fusion at the N-terminus did
not impact the steady state accumulation of RraB relative to unfused protein (data not
shown). Furthermore, no significant change in solubility or localization of RraB after
biotinylation was observed. Expression of the Biotag-RraB fusion protein gave the
same phenotypes as unmodified RraB, including increased DsbC accumulation and
higher β-galactosidase activity expressed from the chromosomal rne-lacZ fusion.
Biotinylated RraB synthesized in the AC series of RNase E C-terminal truncation
mutants (Leroy et al. 2002) was precipitated with streptavidin beads and the presence of
RNase E in the precipitate was detected by Western blot analysis using an antibody that
recognizes the N-terminal domain. As expected, full-length RNase E was readily
observed in the precipitate from cells expressing Biotag-RraB (Figure 2.3B, first lane).
Pre-treatment of cell lysate with RNase A or Benzonase® nuclease (Novagen, WI) did not
affect the co-precipitation of RNase E, indicating that nucleic acids are not involved in
the ability of these two proteins to interact. No RNase E band was detected in cells
expressing the Rne131 protein lacking the whole CTH (amino acids 585-1061) or in
strain CJ1825/BZ99 expressing RNase E amino acids 1-602 (data not shown). Similarly,

47
the RneΔ14 protein lacking amino acids 636-845 was not co-precipitated with the
biotinylated RraB whereas RNase E mutant proteins lacking amino acids 603-693 and
728-845 gave a clear signal. This analysis suggests that the region between amino acids
694-727 is important for the binding of RraB to RNase E.
A similar experiment was performed using an RraA-Biotag fusion and the results
are presented in Figure 2.3C. Interaction between RraA and RNase E was detected for
all truncation mutants except for the Rne131 protein (RneΔ585-1061). It has been
shown that RraA at a large molar excess inhibits the catalytic activity of the RNase E
NTH in vitro but the interaction between the two proteins is weak and shows a KD in
excess of 200 uM (Lee et al. 2003). Thus, while it appears that RraA requires the C-
terminal half of RNase E for high affinity binding, we could not map the interaction of
the two proteins to a single contiguous epitope. This is in contrast to RraB and all the
major degradosome components which bind to defined continuous epitopes in the CTH.

48
Figure 2.3 Mapping the binding site of RraB and RraA on RNase E by co-precipitation analysis. (A) Schematic illustration of the structure of wild-type and truncated RNase E, adapted from Vanzo et al. 1998 and Leory et al. 2002. (B) Western blot analysis of proteins co-precipitated with in vivo synthesized Biotag-RraB. The same amount of cell lysate protein was used in each co-precipitation. Asterisks (*) indicate the expected electrophoretic migration of the RNase E truncated mutant proteins in the absence of proteolytic degradation. WT, wild-type. (C) The same as above except that RraA-Biotag was used for the co-precipitation analysis.

49
Consistent with their distinctive interaction pattern with RNase E, RraA and RraB
demonstrated different inhibitory effects on partially purified full-length RNase E or on
the catalytic domain. p23 RNA is a truncated pM1 RNA that is processed by RNase E to
a product termed 23 RNA (Kim et al. 1996). Addition of RraA in vitro resulted in a
greater degree of inhibition than RraB throughout the concentration range tested. For
example, at a 40-fold excess of inhibitor protein/RNase E, RraB resulted in 23%
inhibition of p23 RNA processing over the control, whereas RraA inhibited processing by
45%. RraB did not inhibit the processing of p23 by the purified N-terminal domain of
RNase E. In contrast, RraA inhibited the processing of p23 by the N-terminal domain,
albeit to a lesser extent than what was observed for the full-length protein (Figure 2.4).
Binding of RraA and RraB affects the degradosome composition
The fact that RraA and RraB interact with the scaffold region of RNase E at
different locations led us to speculate that these two inhibitors might differentially affect
the binding of other proteins to the CTH. To address this question, we took advantage
of a recently developed affinity purification system for the analysis of protein complexes
in E. coli (Butland et al. 2005). In strain DY330 rne-SPA, the chromosomal rne gene
had been fused to a DNA cassette that encodes a carboxyl-terminal sequential peptide
affinity (SPA) tag. The SPA tag is composed of a 3×FLAG tag and a calmodulin-
binding peptide (CBP) separated by a tobacco etch virus (TEV) protease cleavage site.
The tagged RNase E was used as the bait to purify its interacting proteins by sequential
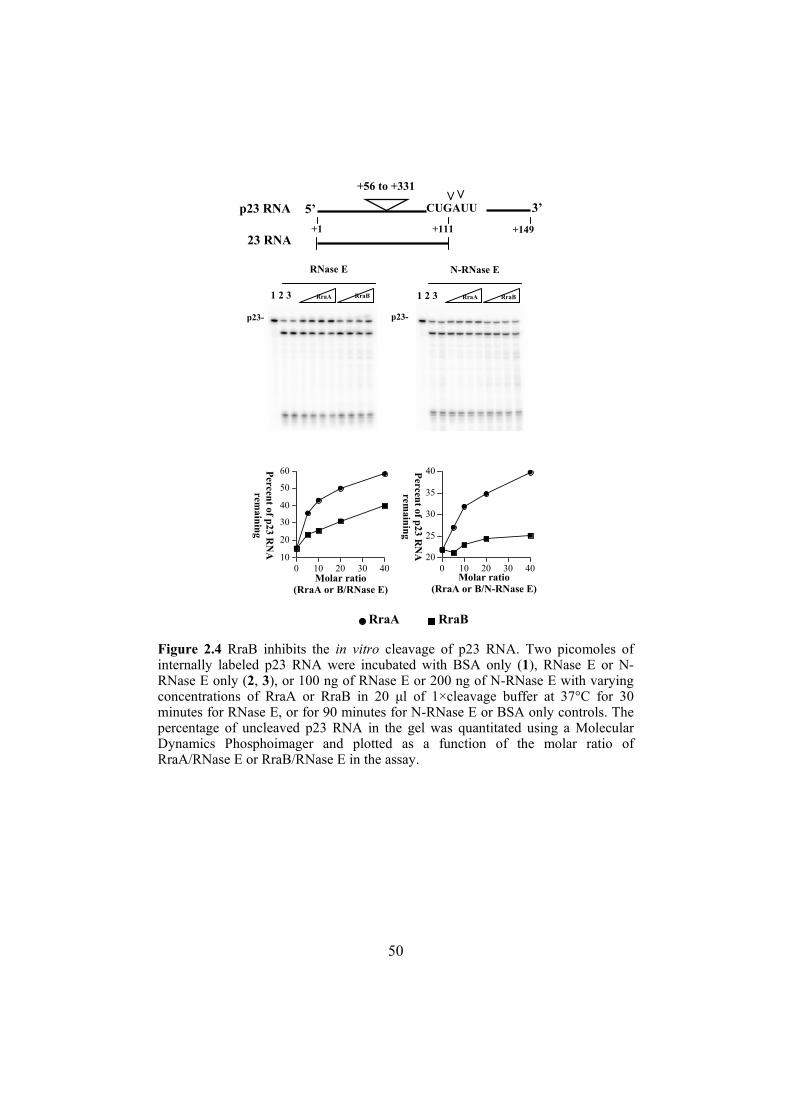
50
RraBRraA
Percent of p23 RN
A
remaining
Molar ratio (RraA or B/RNase E)
10
20
30
40
50
60
0 10 20 30 4020
25
30
35
40
0 10 20 30 40Molar ratio
(RraA or B/N-RNase E)
Percent of p23 RN
A
remaining
CUGAUU
p23- p23-
23 RNA +149+111+1
RNase E
1 2 3 RraA
N-RNase E
1 2 3
3’
+56 to +331
5’ p23 RNA
> >
RraB RraBRraA
Figure 2.4 RraB inhibits the in vitro cleavage of p23 RNA. Two picomoles of internally labeled p23 RNA were incubated with BSA only (1), RNase E or N-RNase E only (2, 3), or 100 ng of RNase E or 200 ng of N-RNase E with varying concentrations of RraA or RraB in 20 μl of 1×cleavage buffer at 37°C for 30 minutes for RNase E, or for 90 minutes for N-RNase E or BSA only controls. The percentage of uncleaved p23 RNA in the gel was quantitated using a Molecular Dynamics Phosphoimager and plotted as a function of the molar ratio of RraA/RNase E or RraB/RNase E in the assay.

51
affinity purification. The integrity and expression level of RNase E in the tagged strain
are not affected, as judged by Western blot analysis (data not shown).
The components of purified degradosomes were resolved by SDS-PAGE and
visualized by colloidal blue staining (Figure 2.5). To compare the relative abundance of
individual degradosome components, protein samples loaded on each lane were
normalized to the same amount of RNase E. The region of gel containing each of the
detected bands was individually excised, proteolytically digested, and subjected to mass
spectrometry analysis. As seen in Figure 2.5, overexpression of RraA or RraB had a
dramatic effect on the degradosome composition, most strikingly on the abundance of
RNase E-bound PNPase. In degradosomes purified from control cells without RraA or
RraB overexpression, the molar ratios of the major protein components to RNase E were
as follows: PNPase, 5.4; RhlB, 2; enolase, 1.3. For clarity, all the above ratios were
calculated based on relative polypeptide amounts without taking into account the
oligomeric states of the respective proteins. The relative abundance we determined for
these degradosome components in our experiments is comparable to those reported
earlier by others (Py et al. 1996; Coburn et al. 1999). By contrast, in degradosomes
isolated from cells expressing RraA, the ratios of PNPase, RhlB, and enolase to RNase E
were substantially lower, namely 0.7, 0.3, and 0.1, respectively. Similarly, in cells
expressing RraB the ratios of RNase E-bound PNPase, RhlB, and enolase dropped to 1.1,
0.9, and 0.6, respectively. Interestingly, RNase E from cells expressing RraA was found
associated with markedly less RhlB compared to cells expressing RraB (RhlB to RNase E
ratio of 0.3 vs. 0.9). It is also noteworthy that expression of RraB, but not RraA, resulted
in a moderate increase in RNase E-associated amounts of two non-stoichiometric
components of degradosomes: DnaK and CsdA (DeaD).

52
Figure 2.5 RraA and RraB differently affect the composition of degradosomes. Purified degradosomes with and without overproduction of RraA or RraB were separated by SDS-PAGE and visualized by colloidal blue staining. The identities of protein bands were confirmed by mass spectrometry. Bands denoted with an asterisk correspond to RNase E degradation products.

53
DISCUSSION
Both RraA and RraB were isolated genetically as a result of their ability to
facilitate disulfide bond isomerization in the periplasmic space of E. coli. In a manner
similar to RraA, RraB stabilized the dsbC transcript and resulted in accumulation of the
disulfide isomerase, DsbC. RraB, like RraA, inhibited endoribonucleolytic cleavage of
the 5’ UTR of rne transcripts strongly enough to circumvent the autoregulation of rne
that normally maintains the level of the enzyme within a narrow range (Figure 2.1).
Genome-wide analysis of mRNA abundance by DNA microarrays revealed that the
abundance of 18% of all E. coli transcripts (corresponding to 792 out of 4,405 known and
predicted ORFs, excluding small RNAs, Figure 2) were affected by 2-fold or more when
either RraA or RraB is expressed. Strikingly, however, not all RNAs were affected
equally by both inhibitors. Global analysis of steady state level of mRNA revealed that
while a large set of transcripts was affected similarly by either inhibitor protein, other
equally large sets of transcripts were stabilized exclusively by RraA or by RraB. In
particular, 336 transcripts corresponding to 7.6% of the transcriptome were stabilized
equally by either protein inhibitor, 371 transcripts (8.4%) were affected uniquely by the
expression of RraA and 85 transcripts (1.9%) were stabilized only by RraB. These
results clearly demonstrate that the two inhibitor proteins exert a differential effect on the
ability of RNA processing machinery to cleave various mRNAs, in turn giving rise to
distinct transcript profiles.
Neither the crystal structure of RraA (Monzingo et al. 2003) nor the solution
structure of the Vibrio cholerae RraB homologue, VC0424, contain putative nucleotide
binding sites (Ramelot et al. 2003). Not surprisingly, RraA and RraB do not appear to
interact directly with substrate RNAs (Lee et al. 2003). Instead, inhibition of RNA

54
cleavage results from the direct interaction of the two proteins with RNase E. RraA and
RraB exhibit nearly identical affinities for RNase E, with KD values determined by
surface plasmon resonance spectroscopy in the micromolar range. Similar weak binding
affinities have been measured for other proteins that modulate the specificity of
macromolecular machines. Examples include the binding of the adaptor protein SspB
with ClpX (Wah et al. 2002) and the interaction between the active forms of ClpB and
DnaK (KD= 17 mM) (Schlee et al. 2004).
Co-precipitation analysis using a set of RNase E mutants containing deletions in
the CTH (Leroy et al. 2002) revealed that RraA and RraB interact with the enzyme in
distinct ways. Even though RraA and RraB have a low pI they do not bind to the
positively charged arginine-rich motif of RNase E (amino acids 604 to 688). Amino
acids 694-727 were required for the binding of RraB to RNase E, similar to the major
degradosome components which bind to specific, continuous regions within the CTH (Py
et al. 1994; Miczak et al. 1996; Py et al. 1996; Vanzo et al. 1998; Coburn et al. 1999).
This region partially overlaps a stretch of amino acids extending from position 685 to 712
which is predicted to form half of a putative coiled-coil that may be important for binding
of the enzyme to structured RNAs (Callaghan et al. 2004). As expected, the
endonucleolytic activity of the N-terminal catalytic domain which lacks the CTH region
was unaffected by RraB, even when present at a large stoichiometric excess. In
contrast, RraA inhibited the endonuclease activity of the N-terminal catalytic domain in
vitro, albeit more weakly compared to the inhibition of the full length RNase E. Although
this inhibitory effect strongly suggests a physical interaction between the two proteins,
we could not detect the formation of a protein complex using surface plasmon resonance
analysis, presumably because of the low binding affinity.

55
On the basis of these results we propose that the distinct mode of interaction of
the two inhibitor proteins with RNase E is responsible for the selective stabilization of
different sets of transcripts. The selective stabilization of some transcripts but not others
is likely to be related to the way in which RraA and RraB mediate the remodeling of the
degradosome. The two inhibitors had a similar effect on the amount of some
degradosome components but reduced the level of other components in a distinct manner
that was specific to each of the two proteins. E. coli degradosomes contain an excess of
PNPase per RNase E polypeptide chain (Py et al. 1996; Coburn et al. 1999). However,
in degradosomes isolated from cells expressing RraA or RraB, PNPase and RNase E
were present in nearly equal amounts. On the other hand, RraA reduced the amount of
RhlB and enolase associated with RNase E by 7-fold and 13-fold respectively, whereas
RraB led to only a 2-fold reduction for both degradosome components. As a result of
these effects, the stoichiometry of PNPase to RhlB and enolase bound to RNase E is
different for control E. coli, for cells expressing RraA and for cells expressing RraB.
Recently, Lin-Chao and coworker (2005) reported that PNPase and the RhlB helicase
form an RNA-degrading complex independently of the attachment of both proteins to
RNase E. By changing the composition of the degradosome, RraA and RraB may also be
exerting an indirect effect on the amount of free, i.e. not RNase E-bound, PNPase and
RhlB, in turn affecting other RNA degrading complexes.
In addition to changes in the amount of PNPase, RhlB, and enolase bound to
RNase E, RraB gave rise to degradosomes that contained the non-canonical components
DnaK and CsdA. Such an effect was not observed in degradosomes isolated from cells
expressing RraA. The chaperone protein DnaK, which normally is present in
degradosomes in small amounts (Miczak et al. 1996), has been found to increase
significantly under certain stress conditions such as low temperature, RNase E

56
overexpression, or in cells lacking PNPase (Regonesi et al. 2005). CsdA was previously
found associated with the RNA degradation machinery only under cold-shock conditions
(Prud'homme-Genereux et al. 2004).
Comparison of the microarray data reported here with the genomic scale RNA
stability data of Bernstein et al. (Bernstein et al. 2002) did not reveal any substantial
difference between the t1/2 of transcripts that are affected by RraA and those affected by
RraB. We also failed to identify a pattern in the length or in the function of the 371 RraA-
specific or the 85 RraB-specific transcripts. Therefore more complex factors, possibly
related to secondary structure considerations, might determine whether a particular RNA
is stabilized through the action of RraA or RraB. While homologues of RraA are widely
distributed among archea, proteobacteria and plants, RraB homologues are found only in
γ-proteobacteria—suggesting that these proteins may have a more specialized role in
modulating RNA degradation. The existence of two proteins that exert a differential
effect on RNA decay via their interactions with RNase E and degradosome remodeling
argues that modulation of RNA stability may be a mechanism for global control of
transcript abundance in response to dynamic changes in the extracellular or intracellular
environment.

57
Chapter 3: Reconstitution of Degradosomes and Kinetic Analysis of
RNA Degradation in vitro
INTRODUCTION
RNase E functions as the core component of a multiprotein complex termed the
RNA degradosome. The degradosome is a 500-700 KDa complex formed by the
assembly of the exoribonuclease polynucleotide phosphorylase (PNPase), the DEAD-box
RNA helicase RhlB, and the glycolytic pathway enzyme, enolase, onto the CTH of the
RNase E protein. Several other proteins including the protein chaperones GroEL and
DnaK may also be present in sub-stoichiometric amounts. The overall significance of
the degradosome has been established by recent studies, however, the details regarding
how the individual components cooperate in carrying out RNA degradation and how
changes in the degradosome composition affect the decay of different transcripts remains
to be discovered.
As described in Chapter 2, the Georgiou laboratory recently discovered a novel
mechanism whereby the distinct, inhibitor-specific remodeling of the degradosome, by
RraA or RraB, is associated with the selective alteration of the steady state level of
different transcripts in E. coli. Nevertheless, little is known regarding the molecular
details of this mechanism and its importance in gene regulation. For example, is the
stabilization of transcripts due to the direct inhibitory effect of RraA/RraB on the
endonucleolytic activity of RNase E or is it due to the degradosome remodeling? Why are
certain transcripts stabilized by RraA, others by RraB and yet a third class is not
stabilized by either inhibitor? How does the binding of RraA or RraB and the resulting

58
changes in degradosome composition affect the detailed kinetics of hydrolysis of
different RNAs?
To answer these questions, we sought to develop a system for the reconstitution of
degradosomes and determine the consequences of RraA and RraB binding to the kinetics
of RNA degradation in vitro. This will allow us to carry out a systematic analysis of the
contribution of: 1) the sequence and structure of the RNA substrate, including the
importance of the phosphorylation status at the 5’ end, 2) the effect of the different
domains within the CTH of RNase E, and 3) the effects of minor degradosome
components.
The purpose of the studies described in this chapter was to produce purified
proteins for subsequent reconstitution experiments. Unfortunately, the 1061 aa RNase E
that forms the core of the degradosome is very susceptible to proteolytic degradation
during purification. To date, there has not been any evidence that the full length RNase
E can be purified in any significant amounts. A recent biophysical study suggests the
CTH of RNase E is mainly unstructured and highly susceptible to degradation, which
accounts for the low yield of the intact protein (Callaghan et al. 2004). To overcome
this problem, we made a series of C-terminal truncated forms of RNase E, which contain
the binding sites for the degradosome components RhlB and enolase and part of the
epitope recognized by PNPase, as well as the binding sites for RraA and RraB. In this
study, we show that the C-terminal truncated forms of RNase E are amenable to
preparative expression and purification. In addition to truncated RNase E, we also
purified individual degradosome components (PNPase, RhlB and enolase). Using this
truncated RNase E and purified degradosome components, we can now pursue the
reconstitution of RNA degrading complexes containing at least some of the components
of the intact degradosome.

59
Previous studies of RNA hydrolysis by RNase E have been based on limited
kinetic data under conditions that have not been rigorously defined. With this in mind,
we have adopted the fluorescence resonance energy transfer (FRET) methodology,
originally described by Belasco’s group (Jiang and Belasco 2004), that allows the
determination of the kinetic parameters in RNA cleavage in a continuous, real-time
fashion. We have optimized the reaction condition for truncated forms of RNase E and
determined the Michaelis-Menten parameters for these enzymes. A pilot study on the
consequences of RraA/RraB binding to the kinetics of RNA degradation in vitro is also
presented here.
Dr. Junjun Gao assisted in making the C-terminal truncated RNase E constructs.
MATERIALS AND METHODS
Strains and plasmids
The strains and plasmids used in this work are listed in Table 3.1. The C-
terminal truncated RNase E expression plasmids, pET28a- Rne752-His, pET28a-Rne845-
His, and pET28a-Rne1045-His were constructed as follows. Different fragments of the
rne gene were PCR amplified from the E. coli genome using the primers: Rne-NTH-up,
Rne-752-Dn, Rne-845-Dn and Rne-1045-Dn. The PCR products were digested with BsaI
/ XhoI and cloned into the commercial expression plasmid pET28a (Novagen, WI),
which had been linearized with NcoI/XhoI. The constructs encode for C-terminal hexa-
histidine tagged truncated versions of RNase E. To facilitate the purification of individual
degradosome components, the individual genes, either pnp, rhlB, or eno, with a DNA

60
cassette that encodes a carboxy-terminal SPA tag (Butland et al. 2005), were PCR
amplified from the E. coli genome. The PCR products were digested with NdeI and
HindIII and moved into the pET21a expression vector (Novagen, WI), which had been
linearized with NdeI/HindIII.
Table 3.1 Strains and plasmids Strain / Plasmid Description Reference or Source JCB570 MC1000, phoR zih12::Tn10 (Bardwell et al.,1991) N3433 lacZ43, relA, spoT, thi-1 (Goldblum and
Apririon, 1981) BL21 (DE3) F- ΔompT hsdSB(rB
-mB-) gal dcm (DE3) Novagen
MC1061 araD39 Δ(ara,leu)7697 ΔlacX74 galU- galK- hsr-hsm+ strA
(Casadaban and Cohen, 1980)
KSL2002 N3433, rne::cat, recA::Tn10 [pNRNE5] (Lee et al., 2002) pET28a- Rne752-His
f1 ori, Kanr, rne752 under T7 lac promoter This work
pET28a-Rne845-His
f1 ori, Kanr, rne845 under T7 lac promoter This work
pET28a-Rne1045-His
f1 ori, Kanr, rne1045 under T7 lac promoter This work
pNRNE5 pSC101 ori, Apr, N-rne under PlacUV5 (Lee et al., 2002) pET28a-RraA f1 ori, Kanr, rraA under T7 lac promoter (Lee et al., 2003) pET-RraB-His-28a f1 ori, Kanr, rraB under T7 lac promoter (Qiu, 2001) DY330 W3110, ΔlacU169 gal490 λc1857 Δ(cro-
bioA) (Zeghouf et al.,2004)
pET21a-Pnp-SPA f1 ori, Ampr, Pnp-SPA under T7 lac promoter
This work
pET21a-RhlB-SPA f1 ori, Ampr, RhlB-SPA under T7 lac promoter
This work
pET21a-Eno-SPA f1 ori, Ampr, Eno-SPA under T7 lac promoter
This work

61
Expression and purification of truncated versions of RNase E
The carboxy-terminally his6 tagged, truncated form of RNase E lacking the C-
terminal 562 residues, i.e. N-RNase E (RNase E 1-499aa), was purified from KSL2002
expressing the N-terminal catalytic domain of RNase E from the plasmid pNRNE5. Cells
were grown to mid-log phase, induced with 1 mM IPTG for 3 hrs and harvested by
centrifugation. The N-terminal catalytic domain of RNase E was purified under native
conditions by nickel-nitrilotriacetic acid (Ni-NTA) metal-affinity chromatography with
modifications, as suggested by the vendor (Qiagen, Valencia, CA). Briefly, the cell pellet
was washed and re-suspended in ice-cold native lysis buffer (50 mM NaH2PO4, 500 mM
NaCl, 10 mM Imidizole, 0.1%TritonX-100, pH 8.0) with Complete® protease inhibitor
cocktail (Roche, IN) at the manufacturer’s suggested working concentration. Cells were
lysed by passing through a French press (2,000 psi). The lysate was centrifuged for 15
minutes at 4 oC to remove intact cells and cell debris and the supernatant was clarified by
syringe filtration [with a Whatman 0.45-µm poly(vinylidene difluoride) filter disk]. 4ml
cell lysate supernatant was combined with 1 ml of Ni-nitrilotriacetic acid resin, and
gently agitated for 1hr at 4°C. The resin was separated by gravity filtration and washed
with five volumes of lysis buffer, and the tagged protein was eluted with a step gradient
of imidizole (60mM, 80, 100, 120, 150mM) in lysis buffer. The elution of protein peaked
at 120 mM imidazole. The protein in the peak was concentrated using an Amicon Ultra
concentrator (Millipore, MA) and dialyzed against the RNase E storage buffer (pH 7.5,
50 mM Tris-HCl, 1 mM EDTA, 500 M NaCl, 20 % (v/v) glycerol, 0.5% TritonX-100,
and 1 mM dithiothreitol). All steps were performed at 4oC.
The E. coli BL21(DE3) cells hosting C-terminal truncated RNase E expression
plasmids (other than the 1-499 aa protein whose purification is described above) were

62
grown in Terrific Broth (TB) media at 25˚C until the O.D. reached 0.5. IPTG was added
to a final concentration of 1 mM, and cells were harvested after three hours of induction.
Protein purifications were conducted under denaturing conditions and all steps were
performed at room temperature. Briefly, cell pellets were re-suspended in freshly made
denaturing lysis buffer A (100 mM NaH2PO4, 10 mM Tris·Cl, 8M urea, pH 8.0) (due to
the dissociation of urea, the buffer pH was adjusted immediately prior to use) with
Complete® protease inhibitor cocktail (Roche, IN) at the manufacturer’s suggested
working concentration. After lysis by French press at 2,000 psi, insoluble material was
removed by centrifugation at 15,000 rpm for 45 min at 4°C. The supernatant was clarified
by syringe filtration [with a Whatman 0.45-µm poly(vinylidene difluoride) filter disk],
combined with 1 ml of Ni-nitrilotriacetic acid resin, and gently agitated for 45 min at
25°C. The resin was separated by gravity filtration and washed twice with 4 ml buffer C
(100 mM NaH2PO4, 10 mM Tris·Cl, 8M urea, pH 6.3). Elution was carried out by
washing 4 times, each time with 0.5 ml of buffer D (100 mM NaH2PO4, 10 mM Tris·Cl,
8M urea, pH 5.9), followed by another 4 washes, each with 0.5 ml of buffer E (100 mM
NaH2PO4, 10 mM Tris·Cl, 8M urea, pH 4.5). The eluted proteins were concentrated using
an Amicon Ultra concentrator (Millipore, MA) and the purity of each collected fraction
was examined by SDS-PAGE. Only the fractions containing purified target proteins were
pooled and refolded by dialyzing against the RNase E storage buffer (pH 7.5, 50 mM
Tris-HCl, 1 mM EDTA, 500 M NaCl, 20 % (v/v) glycerol, 0.5% TritonX-100, and 1 mM
dithiothreitol) overnight at 4oC. The final protein concentration was determined by the
Bradford assay (Bio-Rad Laboratories, Hercules, CA).

63
Production and purification of RraA, RraB, PNPase, RhlB and Enolase
RraA was expressed from BL21(DE3) transformed with pET28a-RraA expression
vector and purified by ion exchange chromatography on a Mono Q® HR 5/5 anion
exchange column. The eluted protein was concentrated by Centricon® YM-3 Centrifugal
Filter Devices (Millipore, MA).
RraB was purified from BL21 (DE3) harboring plasmid pET-RraB-His-28a,
which expresses RraB with a C-terminal his6 tag, following the protocol suggested by the
vendor of the Ni-NTA metal-affinity chromatography resin (Qiagen).
The C-terminal SPA tagged PNPase, RhlB or Enolase (Butland et al. 2005) were
purified from the BL21 (DE3) strain transformed with pET21a-Pnp-SPA, pET21a-RhlB-
SPA, or pET21a-Eno-SPA expression vector using anti-FLAG M2 beads and following
the procedures outlined in the FLAG-tag immunoaffinity purification manual (Sigma).
RNA cleavage assay
The fluorogenic oligonucleotide P-BR14-FD was synthesized and HPLC-purified
by TriLink (San Diego, CA). RNA cleavage was carried out at 25°C in RNase E cleavage
buffer (pH 7.5, 20 mM Tris-HCl, 100 mM NaCl, 15mM MgCl2, 5 % (v/v) glycerol, 0.1%
TritonX-100, and 1 mM dithiothreitol). To establish the optimum level of MgCl2, the
concentration was varied from 0 to 150 mM. To measure the kinetics of hydrolysis of the
fluorogenic substrate, various concentrations of P-BR14-FD were combined with a
limiting amount of N-RNase E or RNase E845 (50nM) in a total volume of 50 µl.
Measurements of initial rates were taken on a Synergy HT fluorescent plate reader (Bio-
Tek, Burlington, VT) using a 485/20 excitation filter and a 516/20 emission filter. P-

64
BR14-FD substrate concentrations were varied from 0.05 to 5 µM (50 nM N-RNase E or
RNase E 845); The PRISM 4 software (GraphPad, San Diego) was used for determination
of Vmax and Km values. The cleavage reactions were also monitored discontinuously by
gel electrophoresis. Reaction mixtures were incubated at 25 °C, and aliquots were taken
at appropriate time points. Samples were quenched by mixing aliquots with an equal
volume of 20 mM EDTA and were analyzed by gel electrophoresis. This was followed by
analysis with a Molecular Dynamics Fluor Imager.
To examine the effects of RraA/RraB on the in vitro hydrolysis of P-BR14-FD,
200 nM N-RNase E or RNase E845 and various amounts (0, 50, 100, 200, 400, and
1000-fold stoichiometric excess) of RraA or RraB were mixed in 1xRNA cleavage buffer
and preincubated at 37°C for 10 minutes; the reaction was started by adding the RNA
substrate P-BR14-FD at serial concentrations (0.1, 0.2, 0.5, 1, 2,5,10, 20 μM). This
preincubation was necessary to obtain reproducible FRET kinetic data as well as maximal
inhibition by these inhibitors. Longer preincubation was not performed because the
enzymatic activity of RNase E started decreasing. The reaction was performed at 37°C.
PRISM4 software (GraphPad, San Diego) was used for determination of kinetic
parameter values.
RESULTS
Purification of C-terminal truncated RNase E

65
The full-length RNase E is highly unstable to degradation once the cells are lysed.
Therefore, initial attempts at purification of the full-length RNase E under native
conditions were unsuccessful largely. Even though a protease inhibitor cocktail was
added prior to cell lysis and all steps were performed at 4˚C, the yield of full-length
protein was negligible and the intact protein was barely detectable by Western bloting.
Since the preparative production of full length RNase E did not appear feasible in
our hands, we elected to study four C-terminal truncated RNase E expression constructs.
The plasmid pNRNE5 encodes a polypeptide (RNase E 499, i.e.N-RNase E) lacking the
CTH, which has been employed previously for investigation of substrate specificity,
mode of action, and inhibition by RraA/RraB. The other three longer truncated RNase E
proteins contain binding sites for RraA, RraB and at least some of the degradosome
components of interest (Figure3.1 A). The plasmid pET28a- Rne752-His encodes a
polypeptide (RNase E 752) consisting of residues 1-752 of RNase E, which includes the
RhlB and RraB binding sites. The plasmid pET28a-Rne845-His encodes a polypeptide
(RNase E 845) which contains the residues 1-845 of RNase E and thus contains, the
enolase binding epitope, in addition to those for RhlB and RraB. Finally, the plasmid
pET28a-Rne1045-His expresses a polypeptide (RNase E1045) that covers nearly the full-
length RNase E except the last 16 residues, which are potentially responsible for high-
affinity binding of RraA. With the exception of the 1045 aa fragment of RNAse E the
other three proteins could be expressed as fusions containing a C-terminal His6 tag host.
N-RNase E was purified to near homogeneity by Ni-NTA affinity chromatography under
native condition using a step gradient of imidizole. About 600μg N-RNase E protein was
obtained per liter per O.D. cell culture.

66
RraB
694-727
RraA?
1045-1061
RraA?
RraB
694-727
RraA?
1045-1061
RraA?RraA?
250
150
10075
50
37
Kd (M)
RNase E845 RNase E752
N-RNase E
250
150
10075
50
37
Kd (M)250
150
10075
50
37
Kd (M)
RNase E845 RNase E752
N-RNase E
Figure 3.1 (A) Schematic illustration of the structure of full-length RNase E and the binding sites for RraA, RraB and the major degradosome components (see Chapter 3, also Vanzo et al 1998). (B) GelCode Blue Staining of the purified RNase E proteins. N-RNase E was purified under native conditions. RNase E 752 and RNase E 845 were purified under denaturing conditions.
B
A

67
For the other three truncated RNase E proteins, Ni-NTA affinity chromatography
was carried out under denaturing conditions, i.e. in the presence of 8 M urea, to minimize
proteolysis. Following purification, the denatured RNaseE proteins were refolded under
optimized conditions. Unfortunately, the purification of RNase E1045 and full-length
RNase E failed. This is presumably because the CTH is largely unstructured and
therefore highly susceptible to proteolysis. The high susceptibility of the CTH domain
to protease degradation cannot be completely overcome even under denaturing
conditions.
RNase E752 and RNase E845 were successfully purified to near homogeneity
(Figure 3.1 B). A yield of about 400 μg RNase E752 protein and 180 μg RNase E845
protein was obtained per liter per O.D. cell culture following the procedure described in
the Materials and Methods section. The refolded proteins were active, as seen by their
ability to cleave the FRET RNA substrate (P-BR14-FD). The specific cleavage was
monitored continuously by fluorometry (excitation at 485 nm; emission at 516 nm) and
discontinuously by gel electrophoresis of samples quenched at time intervals (Figure 3.2
B, C).
Determination of the kinetic parameters of RNase E
To determine the kinetic parameters for RNase E and the consequences of RraA
and RraB binding on the kinetics of RNA degradation in vitro, we adopted the synthetic
fluorogenic RNA substrate reported earlier by Jiang et al. (Jiang and Belasco 2004). This
14 nucleotide RNA substrate (P-BR14-FD; Figure 3.2 A) contains a sequence resembling
the 5’-terminal segment of pBR322 RNA I, an untranslated regulatory RNA that bears a
single major RNase E cleavage site. The key features of the synthetic substrate are a

68
fluorescein dye upstream of the expected RNase E cleavage site and a fluorescence-
quenching dabcyl group downstream of the cleavage site, which quenches most of the
fluorescein fluorescence in the uncleaved RNA. Five of the nucleotides upstream of the
cleavage site were 2’-O-methylated to protect them from RNase E digestion. The extent
of RNase E cleavage can be detected by the increase in fluorescence due to release of the
dabcyl upon cleavage. The fluorogenic oligonucleotide was synthesized with a
monophosphate group at the 5’-terminus (P-BR14-FD) which is cleaved much faster by
RNase E than the corresponding primary transcripts with the terminal 5’-triphosphate
group.
First, the reaction conditions for cleavage by N-RNaseE, which comprises of the
catalytic N-terminal half of the protein (residues 1–499), were optimized using a stepwise
approach. The optimum concentration of Mg2+ in a buffer containing 100 mM NaCl was
found to be between 10 and 20 mM, with the highest cleavage rate obtained with 15 mM
Mg2+. The effect of salt on the rate of RNA hydrolysis by RNaseE was also investigated
in a buffer containing 15 mM Mg2+, and the optimum concentration was found to be 100
mM NaCl. The maximal rate of RNA hydrolysis was achieved under these conditions.
Upon cleavage of P-BR14-FD by N-RNase E, there is an increase in fluorescence at 517
nm due to the release of the dabcyl group. To confirm that the increase in fluorescence
accurately reflects the extent of RNA cleavage, digestion of P-BR14-FD by N-RNase E,
RNase E752, and RNase E845 was monitored by both fluorometry and gel
electrophoresis. The time course of cleavage reactions performed under the same reaction
conditions was very similar when measured by either of these assays (Figure 3.2 B, C).
As expected, the initial cleavage rates were dependent on the enzyme concentration and
showed saturation at high substrate concentrations.

69
5’ PO4 – AmCmAmCdTmCmAGUAUUdTG 3’
FluoresceinRNase E
DabcylA
5’ PO4 – AmCmAmCdTmCmAGUAUUdTG 3’
FluoresceinRNase E
Dabcyl
5’ PO4 – AmCmAmCdTmCmAGUAUUdTG 3’
FluoresceinRNase E
DabcylA
0
2000
4000
6000
8000
10000
12000
14000
16000
18000
0 500 1000 1500 2000 2500 3000 3500 4000
Time (s)
M 4
85/5
16 M 485/516 F9
Fluo
resc
ence
(RFU
)
Time (sec)
0 3 10 30 60 120 (min) 0 3 10 30 60 120 (min)
N-RNase E RNase E 845
Substrate
Product
B
C
0
2000
4000
6000
8000
10000
12000
14000
16000
18000
0 500 1000 1500 2000 2500 3000 3500 4000
Time (s)
M 4
85/5
16 M 485/516 F9
Fluo
resc
ence
(RFU
)
Time (sec)
0 3 10 30 60 120 (min) 0 3 10 30 60 120 (min)
N-RNase E RNase E 845
Substrate
Product
0
2000
4000
6000
8000
10000
12000
14000
16000
18000
0 500 1000 1500 2000 2500 3000 3500 4000
Time (s)
M 4
85/5
16 M 485/516 F9
Fluo
resc
ence
(RFU
)
Time (sec)
0
2000
4000
6000
8000
10000
12000
14000
16000
18000
0 500 1000 1500 2000 2500 3000 3500 4000
Time (s)
M 4
85/5
16 M 485/516 F9
Fluo
resc
ence
(RFU
)
Time (sec)
0 3 10 30 60 120 (min) 0 3 10 30 60 120 (min)
N-RNase E RNase E 845
Substrate
Product
B
C
Figure 3.2 (A) Sequence of the fluorogenic oligonucleotide substrate, P-BR14-FD (modified from Jiang and Belasco, 2004). (B) Continuous fluorometric assay of P-BR14-FD (1 µM) cleavage by N-RNase E (50 nM). (C) Discontinuous electrophoretic assays comparing the cleavage of P-BR14-FD cleavage by N-RNase E and RNase E 845. The reactions were performed under the same conditions as in (A) and analyzed on a 16% polyacrylamide/7 M urea gel. thin arrow: substrate, thick arrow: product.

70
To measure the Michaelis-Menten parameters for the fluorogenic substrate,
various concentrations of P-BR14-FD (0.05 to 5 µM) were mixed with a limiting amount
of N-RNase E (50nM) or RNase E 845 (50nM) in the cleavage buffer (pH 7.5, 20mM
Tris-HCl, 15 mM MgCl2 and 100mM NaCl), and the initial rate of RNA cleavage was
measured by fluorometry. The data were then analyzed using the PRISM 4 software and
Vmax and Km values were extracted. Each value is the average of three independent
measurements using the same batch of purified enzyme. Km values were within the
same range: 0.57±0.1µM for N-RNase E versus 1.1±0.19µM for RNase E845 (Figure
3.3). Importantly, the Km value obtained with N-RNase E is statistically identical to
the Km value reported earlier by Jiang et. al. (0.60 ± 0.07µM). The Vmax/Km value of N-
RNase E and RNase E 845 were 49.1 RFU/(μM*Sec) and 44.4 RFU/(μM*Sec),
respectively. Since the same amount of enzymes (50nM) was used in each assay, the
enzyme efficiency of N-RNase E and RNase 845 was essentially identical.

71
Substrate-Velocity Graph
0 1 2 3 4 5 605
1015202530354045
v. RFU/uM.S
Std. Error VMAX KM
3.5230.1923
Best-fit values VMAX KM
49.071.105
[S]. uM
RNase E 845 (50nM) N-RNase E (50nM)
Substrate-Velocity Graph
0.0 0.5 1.0 1.5 2.0 2.50
5
10
15
20
25
RFU/uM.S
Std. Error VMAX KM
1.9700.1061
Best-fit values VMAX KM
27.980.5697
[S].uM
V (RFU/sec) V (RFU/sec)
VMAX/KM 44.4 VMAX/KM 49.1
Substrate-Velocity Graph
0 1 2 3 4 5 605
1015202530354045
v. RFU/uM.S
Std. Error VMAX KM
3.5230.1923
Best-fit values VMAX KM
49.071.105
[S]. uM
RNase E 845 (50nM) N-RNase E (50nM)
Substrate-Velocity Graph
0.0 0.5 1.0 1.5 2.0 2.50
5
10
15
20
25
RFU/uM.S
Std. Error VMAX KM
1.9700.1061
Best-fit values VMAX KM
27.980.5697
[S].uM
V (RFU/sec) V (RFU/sec)
VMAX/KM 44.4 VMAX/KM 49.1 Figure 3.3 Michaelis-Menten parameters for the hydrolysis of P-BR14-FD oligonucleotide substrates. The reaction buffer used for these experiments had a pH of 7.5 and contained 15 mM MgCl2 and 100 mM NaCl. The concentration of RNase E protein in each reaction was 50 nM. Initial rates were determined as described in Materials and Methods. Each V value is the average of three independent measurements using the same batch of purified enzyme. The lines represent the best fit of data to the Michaelis-Menten equation.
Consequences of RraA and RraB binding to the kinetics of RNA degradation in vitro
As described earlier in chapter 2, the effect of RraA /RraB on RNA processing by
RNase E was examined by monitoring the cleavage of a radiolabeled substrate by RNase
E. That assay cannot be used to obtain quantitative information on the cleavage
kinetics. By contrast, as shown above using the P-BR14-FD FRET substrate, kinetic
parameters can be obtained with relative ease. On the basis of the in vitro binding
affinities between RraA / RraB and the full-length RNase E measured by surface plasmon
resonance analysis (KD = 26μM for RraA and 28μM for RraB), assays were carried out

72
using 200 nM of N-RNase E or RNase E 845. To ensure the formation of the enzyme-
inhibitor complex, the RNase Es and RraA/B were preincubated in 1x cleavage buffer at
37oC for 10 minutes. Preincuation of truncated RNase E alone had no effect on the
catalytic activity of the enzyme and did not result in a change in the initial rates of
reaction. Consistent with in vitro observation (Kenneth J. McDowall, personal
communication), no inhibitory effect on the processing of the FRET substrate by N-
RNase E was detected with up to 200-fold molar excess of RraA monomer. For RNase
E 845, weak inhibition (a 36% decrease in catalytic activity) was observed at a 200:1
molar excess of RraA to RNase E845 (Figure 3.4). Higher concentrations of RraA, e.g.
500-fold excess (100uM) or 1000-fold excess (200uM) RraA did not result in further
inhibition. Additionally, up to 200-fold excess RraB had no effect on the FRET
substrate cleavage by either RNase E 845 or N-RNase E.
Substrate-Velocity Graph
0 5 10 15 20 250
50100150200250300350400450
No RraA40 uM RraA
[s]. uM
V (RFU/sec)40 μM RraA
VMAX 427.1±23.75 KM 5.599±0.7964
No RraA
VMAX 450.9±12.23KM 3.779±0.2952
VMAX/KM 119.32
VMAX/KM 76.28
RNase E 845 (200nM)
Substrate-Velocity Graph
0 5 10 15 20 250
50100150200250300350400450
No RraA40 uM RraA
[s]. uM
V (RFU/sec)40 μM RraA
VMAX 427.1±23.75 KM 5.599±0.7964
No RraA
VMAX 450.9±12.23KM 3.779±0.2952
VMAX/KM 119.32
VMAX/KM 76.28
40 μM RraA
VMAX 427.1±23.75 KM 5.599±0.7964
No RraA
VMAX 450.9±12.23KM 3.779±0.2952
VMAX/KM 119.32
VMAX/KM 76.28
RNase E 845 (200nM)
Figure 3.4 Substrate-Velocity graph for the hydrolysis of P-BR14-FD substrate by RNase E 845 with and without RraA. The concentration of RNase E845 in each reaction was 200 nM. Square: no RraA; Triangle: 200 fold excess (40μM) RraA. Each V value is the average of three independent measurements using the same batch of purified enzyme. The lines represent the best fit of data to the Michaelis-Menten equation.

73
Production and purification of PNPase, RhlB and Enolase
The recently reported sequential peptide affinity (SPA) purification makes use of
two consecutive tags: a FLAG and a calmodulin binding peptide (CBP) separated by a
tobacco etch virus (TEV) sequence. The presence of an SPA tag allows for the
purification to near homogeneity, under native conditions, of proteins and protein
complexes expressed in bacteria (Butland et al. 2005). To facilitate the purification of
individual degradosome components, the individual gene, either pnp, rhlB, or eno, with a
DNA cassette that encodes a carboxy-terminal SPA tag, was PCR amplified and moved
into the pET21a expression vector. All SPA-tagged individual proteins were purified
from the BL21 (DE3) strain using anti-FLAG M2 beads and following the procedures
outlined in the manual (Sigma, St. Louis, MO). The proteins in each preparation were
greater than 95% pure as judged by GelCode Blue Staining (Pierce, Rockford, IL) of
samples run in SDS/polyacrylamide gel (Figure 3.5).

74
25015010075
50
37
Kd (M)
Eno
lase
-SP
A
PN
Pase
-SP
A
Rhl
B-S
PA
25015010075
50
37
Kd (M)
Eno
lase
-SP
A
PN
Pase
-SP
A
Rhl
B-S
PA
Figure 3.5 GelCode Blue staining of the purified degradosome components: PNPase-SPA, RhlB-SPA and Enolase-SPA.
DISCUSSION
The purification of full-length RNase E that forms the core of the degradosome
posses a significant challenge. The full-length RNase E is a 1061 aa protein and is very
susceptible to proteolytic degradation. For this reason, it has not yet been possible to
purify full length RNase E in any significant amount. Nearly all biochemical analyses of
RNase E have been carried out using the N-RNase E truncation, which contains the
catalytically active N-terminal half, but lacks the C-terminal region which functions as
the scaffold to assemble the degradosome and interact with RraA / RraB. Recent
biophysical characterization of the RNase E CTH indicates that it is mainly unstructured

75
and hydrophobic (Callaghan et al. 2004). The CTH alone is extremely unstable and can
be purified only under denaturing conditions. The susceptibility of the CTH to
degradation accounts for the low yield of the intact RNase E protein. Here we have
developed protocols to successfully overexpress and purify truncated forms of RNase E
at the milligram scale under denaturing conditions. These RNase E truncation proteins
can be used to assemble partial degradosomes in vitro and study the effects of the
respective components (RhlB, enolase etc) or inhibitors (RraA and RraB) on RNA decay
kinetics. Monitoring RNA cleavage by RNase E using electrophoretic techniques is not
adequate for performing initial rate measurements needed for the in-depth kinetic analysis
of the enzyme. Recently the Belacso lab developed a FRET (fluorescence resonance
energy transfer) RNA substrate and showed that it can be used to monitor the catalytic
properties of N-RNase E consisting of aa 1-499. We found that the FRET substrate
allows for initial rate measurements to be taken very quickly (multiple rate measurements
can be completed at once using 96 well plates, and hundreds of experiments can be done
in an hour), something which is clearly not possible with techniques requiring the
electrophoretic separation of RNA cleavage products. We examined the catalytic
properties of the C-terminal truncated RNase E lacking residues 846-1061 (RNase E 845)
and compared them to those of N-RNase E. The Km values for the cleavage of the P-
BR14-FD substrate were 0.57±0.1 µM and 1.1±0.19µM, for N-RNase E and RNase
E845, respectively. For the same concentration of enzyme (50nM), the two enzymes
exhibited identical catalytic efficiencies (Vmax/Km values) : 49.1 RFU/(μM*sec) for N-
RNase E and 44.4 RFU/(μM*sec) for RNase E845. This result demonstrates that RNase
E845 has the same catalytic properties as N-RNase E and can also to be used to study the
effects of RhlB, Enolase, RraB and RraA.

76
The effect of RraA/RraB on the hydrolysis of P-BR14-FD substrate by N-RNase
E or RNase E845 was examined as well. At 200-fold excess of inhibitor protein vs.
RNase E, RraA cause a maximum of 36% inhibition on the processing of the 14-
nucleotide substrate by RNase E 845, whereas 200-fold excess RraB hardly had an effect.
In the case of N-RNase E, 200-fold excess RraA had no effect on the processing of the
same substrate. Along these lines, 200-fold excess RraA failed to inhibit the cleavage of a
similar, 3'-fluorescein-labeled short RNA substrate (p-BR13-Fl: 5’-
pGGGACAGUAUUUG- fluorescein) by N-RNase E (Kenneth J. McDowall, personal
communication). These results suggest that RraA and RraB exert at most minor effect
on the cleavage of short RNAs.
Earlier studies by our lab showed that RraA and RraB at a much lower
stoichiometric ratio to partially purified full-length RNase E result in significant
inhibition of the cleavage of the p23 transcript (Gao et al. 2006). Thus, it is likely that
RraA/RraB selectively affect the cleavage of longer transcripts. The 147 nucleotide p23
RNA is a truncated pM1 RNA transcript, which is processed by RNase E to a 111 nt
product termed p23 RNA. The secondary structure of p23 RNA has the same structural
features surrounding the processing site as those found in the intact pM1 RNA, a 415-nt
RNA which is cleaved at sites near the 3’ end by RNase E to give rise to M1, the 377-nt
catalytic component of the tRNA processing ribozyme RNase P (Kim et al. 1996).
Consistent with this hypothesis, it has been reported that the concentration of RraA that
causes 50% inhibition of RNase E-mediated RNA cleavage (Ki) vary depending on RNA
substrates (Lee et al. 2003). In addition, earlier microarray analysis has shown certain
transcripts are stabilized by RraA, others by RraB and yet a third class stabilized by either
inhibitor.

77
It will be of interest to examine the impact of the phosphorylation status of the
RNA 5’ terminus since RraA exhibits a stronger inhibitory effect on the cleavage of the
RNA with a 5’ triphosphate vs. a 5’monophosphate group (Lee, K., Cohen, S.N. and
Georgiou, G, unpublished). Future studies need to focus on determining the kinetics of
hydrolysis for RNAs of different length and complexity.
Alternatively, the lack of inhibition of RraA/B on the cleavage of the P-BR14-FD
substrate by purified truncated RNase E proteins suggests their inhibitory effects may
also be dependent on the assembled degradosome complex. To this end, other model
short RNAs and well studied structured substrates will be used to evaluate how the
degradosome components and RraA/RraB affect the hydrolysis of RNAs.

78
Chapter 4: Regulation of RraA, the Prototypical Protein Inhibitor of
RNase E-mediated RNA Decay
INTRODUCTION
The E. coli rraA gene is located at 88.7 min in the chromosome, downstream of
menA which encodes a 1, 4-dihydroxy-2-naphthoic acid (DHNA) octaprenyltransferase
that catalyzes the prenylation of the redox mediator menaquinone (Shineberg and Young
1976). RraA was previously annotated as MenG in the database entirely on the basis of
sequence analysis that had suggested it encodes an enzyme with S-adenosyl-L-methione-
dependent methyltransferase activity capable of catalyzing the methylation of
demethylmenaquinone, the last step in the biosynthesis of menaquinone (Meganathan
1996). However, the extensive biochemical, genetic and structural studies carried out in
the Georgiou laboratory clearly demonstrated that RraA is not involved in the
menaquinone synthesis pathway (Qiu 2001).
As described in Chapter 1, the function of RraA is to modulate RNA decay and
processing by inhibiting the activity of RNase E. Interestingly, this function of RraA
was uncovered in the course of genetic studies of a different pathway. rraA was isolated
in a screen for multicopy genes that enhanced the yield of correctly folded v-tPA (a
truncated variant of human tissue plasminogen activator (h-tPA) expressed in the E. coli
periplasm. The higher tPA activity phenotype conferred by expression of RraA resulted
from elevated levels of the disulfide isomerase DsbC protein, which in turn correlated
with a dramatic increase in the steady-state abundance and half-life of the dsbC mRNA
through the inhibition of RNase E. RraA binds to RNase E with an equilibrium

79
dissociation constant (KD) in the low micromolar range. High affinity binding requires
the C-terminal half (CTH) region of RNase E, which acts as a scaffold for the assembly
of a large multiprotein complex called the degradosome (Vanzo et al. 1998). RraA
serves as a trans-acting modulator of the endonuclease activity of the enzyme and it
appears to interact only with the enzyme and not with RNA substrates (Lee et al. 2003).
Gene chip analysis revealed that the action of RraA results in a dramatic change in the
global abundance of mRNAs in E.coli affecting over 15% of all cellular transcripts.
RraA homologs (>40% amino acid identity) are widely distributed in many organisms
that contain endonuclease genes homologous to RNase E, including archae,
proteobacteria, and Arabidopsis, suggesting a phylogenetically conserved function of
RraA in modulating ribonuclease activity.
Earlier, Meganathan proposed that rraA is transcribed from the upstream menA
promoter in a dicistronic mRNA (Meganathan 1996). Transcription of menA in turn
was shown to occur from a σ70-dependent promoter. In contrast to these earlier results,
in the present study we demonstrate that rraA is transcribed predominantly from its own
promoter (PrraA) located in the intergenic region between the menA and rraA genes.
Transcription from PrraA is σs-dependent and is induced upon entry into stationary
phase. Furthermore, we show that the synthesis of RraA is regulated at the post-
transcriptional level by RNase E, suggesting the existence of a feedback regulatory
circuit whereby induction of rraA transcription occurs in a σs-dependent manner and
results in inhibition of RNase E activity, in turn decreasing the degradation rate of the
rraA transcript and enhancing the cellular level of the RraA protein.
MATERIALS AND METHODS

80
Strains, plasmids and phage vectors
The strains, plasmid, and phage vectors used in this study are listed in Table 4.1.
The rpoS::kan mutation from strain ZK1000 was introduced into various strains by P1
transduction as described by Miller (Miller 1992). The transduction of the rpoS
disruption was confirmed by streaking single kanamycin-resistant transductants onto LB-
kanamycin agar plates and testing the ability of catalase to hydrolyze hydrogen peroxide.
Growth conditions
Luria-Bertani broth (LB) and M9 minimal medium containing thiamin
(50 μg/ml), 0.4% (w/v) glucose, and 0.2% (w/v) casein were supplemented with
antibiotics, as required (50 μg/ml ampicilin, 25μg/ml kanamycin or 15μg/ml tetracycline).
Unless otherwise stated, cells were grown in LB medium under aeration at 37oC, and the
growth was monitored by measuring the absorbance at 600 nm.
RNA methods
For reverse transcriptase-polymerase chain reaction (RT-PCR) analysis, total
RNA was isolated with the RNeasy kit (Qiagen, Valencia, CA) and treated with RNase-
free DNase (Ambion, Austin, TX). 50 ng of total RNA were subjected to RT-PCR
analysis using the One Step RNA PCR kit (TaKaRa, New York, NY).
Northern blots were performed using total RNA isolated from E. coli JCB570
grown as above. Samples were collected in one hour intervals throughout the
exponential and stationary phases. Five μg of total RNA per lane were loaded onto a
denaturing gel containing formaldehyde, then transferred to a positively charged nylon

81
membrane (Hybond N+, Amersham, UK). The AlkPhos direct nucleic acid labeling and
detection system (Amersham, UK) was used for probe (5’-tcgtttggcggacaaata-3’)
synthesis. Hybridization, washing of the membranes, and detection of signals were
carried out according the manufacturer's protocol.
For primer extension, a 5’ 32P-labeled oligonucleotide (5’-
gcggttccacgacgttaacatcttcttga-3’, or 5’-ccgtccgccaaagttggagaacagc-3’) was used as a
primer for the RT reaction with 5 μg of total RNA (SuperScript III RNase H- Reverse
Transcriptase (Invitrogen, Carlsbad, CA). The primer extension products were
separated on 6% polyacrylamide/7M urea gels. The dideoxy-DNA sequence ladder from
the same primer was prepared using the fmol DNA Cycle Sequencing System (Promega,
Madison ,WI).
For Ribonuclease Protection Assays, E. coli CH1827 (MC1061, zce-726::Tn10)
or CH1828 (CH1827, rne-1) were grown in LB at 30oC to an OD600=0.4 and then half of
the culture was transferred to 43.5oC and incubated for an additional 20 min. After the
addition of rifampicin (500 ug/ml), aliquots were withdrawn every 45 sec., immediately
chilled and stored in liquid nitrogen. Total RNA was prepared from the frozen samples
using RNeasy kit (Qiagen, Valencia, CA) and Ribonuclease Protection Assays were
performed using the RPA III kit (Ambion, Austin, TX) with the in vitro transcript from
the complementary strand of rraA gene (nucleotides +13 to +318 of rraA) as the probe.
The band intensity was quantified using the ImageQuant® software.

82
Construction of β-galactosidase fusions
We used polymerase chain reaction amplification to generate DNA fragments
containing different regions upstream of rraA, i.e. -1075 to -1nt of the rraA upstream
region that includes the PmenA, the menA coding sequence, and the menA-rraA intergenic
region, -1075 to -92 nt that includes the PmenA and menA coding sequence, and -92 to -1
nt of the menA-rraA intergenic region. We then cloned each fragment upstream of the
lacZ gene in a multicopy transcriptional fusion vector, pSP417 (Podkovyrov and Larson
1995). We generated plasmids pMZ002 {(-1075 to -1nt)-lacZ }, pMZ003{(-92 to -1nt)-
lacZ }, and pMZ004 {(-1075 to -92nt)-lacZ }. pMZ001 was the negative control vector.
The lacZ fusions in pMZ002, pMZ003 and pMZ004 were transferred onto the
chromosome using the transducing lambda phage system (Simons et al. 1987). The
fusions were transferred into λRS45, whereas the negative control fusion in pMZ001 was
transferred into λRS74 via a double recombination event. Plaques containing the
recombinant lambda phages were isolated based on their blue plaque phenotype. The
recombinant lambda phages were used to lysogenize EC-O (Δ(pro-lacZ)), and generated
strains: MZ001(EC-O, λp0-lacZ) with a chromosomal promoterless lacZ gene,
MZ002{EC-O, λ(-1075 to -1nt)-lacZ} encoding a lacZ fusion to nt -1075 to -1 of the
rraA upstream region, E. coli MZ003{EC-O, λ(-92 to -1nt)-lacZ} encoding a lacZ fusion
to -92 to -1nt of the menA-rraA intergenic region, and MZ004 {EC-O, λ(-1075 to -92nt)-
lacZ} encoding a lacZ fusion to nt -1075 to -92 of the rraA upstream region. All lysogens
were tested for mono-lysogenization by PCR (Powell et al. 1994).

83
β-galactosidase assays
Cultures grown with aeration at 37°C, in rich or M9 medium overnight, were
subcultured into the fresh medium. Samples were collected at exponential and
stationary phases. The samples were collected at 4°C and resuspended in an appropriate
volume of ice-cold Z buffer (60 mM Na2HPO4, 40 mM NaH2PO4, 10 mM M KCl, 1 mM
MgSO4; pH 7.0) (Miller 1972) to give A600 in the range from 0.6 to 0.9. β-galactosidase
activities were determined from at least three independent experiments, as previously
described (Miller 1992).
Western Immunoblotting
Cells were grown as specified, harvested by centrifugation, re-suspended in PBS
and lysed by passing through a French press (2,000 psi). The lysate was centrifuged for
15 minutes at 4oC to remove cell debris and the protein concentration in the supernatant
was determined by Bradford assay (Bio-Rad Laboratories, Hercules, CA). One μg of
total protein was separated by SDS-12% polyacrylamide gels. Western blots were
performed by standard methods using monoclonal ANTI-FLAG-M2-Peroxidase (HRP)
antibody-conjugate (Sigma, St. Louis, MO). Signal intensities were measured (Bio-Rad
Imaging Densitometer), quantified by using molecular analysis software (Quantity One,
Bio-Rad), and displayed below the blot image.

84
Table 4.1 Strains, plasmid and phage vectors
Strains, Plasmids, Phage vectors
Description Reference or Source
JCB570 (MC1000, phoR, zih12::Tn10) (Bardwell et al., 1991)
ZK1000 (W3110, ΔlacU16, tna-2, rpoS::kan) (Bohannon et al,. 1991)
EC-O (thi-1, relA1, Δ(pro-lac)X113[del = DE5] supE44 / F42-114(FTs) lac)
Lab collection
DY330 W3110, ΔlacU169 gal490 λc1857 Δ(cro-bioA) (Zeghouf et al.,2004)
MZ001 (EC-O, λp0-lacZ ) This study
MZ002 {EC-O, λ(-57 to 1019 nt)-lacZ } This study
MZ003 {EC-O, λ(927 to 1019 nt)-lacZ } This study
MZ004 {EC-O, λ(-57 to 927 nt)-lacZ } This study
MZ013 (MZ003, rpoS::kan ) This study
MZ014 (MZ004, rpoS::kan ) This study
MZ100 (JCB570, rpoS::kan ) This study
CH1827 (MC1061, zce-726::Tn10) (Ono et al., 1979)
CH1828 (CH1827, rne-1) (Mudd et al., 1990)
pSP417 pBR ori, Ampr, (Podkovyrov, 1995)
pMZ002 {pSP417, (-57 to 1019 nt)-lacZ } This study
pMZ003 {pSP417, (927 to 1019 nt)-lacZ } This study
pMZ004 {pSP417, (-57 to 927 nt)-lacZ } This study
λRS 45 bla'-lacZsc imm21 ind + (Simons et al., 1987)
λRS74 placUV5-lacZ + imm21 ind + (Simons et al., 1987)
λMZ1 Same as λRS74, but with the p0-lacZ fusion This study
λMZ2 Same as λRS45, but with the (-57 to 1019 nt)-lacZ fusion This study
λMZ3 Same as λRS45, but with the (927 to 1019 nt)-lacZ fusion This study
λMZ4 Same as λRS45, but with the (-57 to 927 nt)-lacZ fusion This study

85
RESULTS
Identification of the PrraA promoter
Meganathan et al. had proposed that rraA is transcribed as a dicistronic mRNA
from the PmenA promoter (Meganathan 1996). The transcription initiation site for this
putative dicistronic transcript was identified at 57bp upstream of the menA translation
start site (Suvarna et al. 1998). Consistent with this hypothesis, a menA-rraA transcript
of the expected size was detected by RT-PCR analysis (Figure 4.1A), suggesting that the
rraA is transcribed together with the preceding menA gene as a dicistronic mRNA.
However, Northern blot analysis with two different rraA-specific probes revealed that the
predominant RNA in samples either in exponential or stationary phase corresponds to a
shorter species, ca 550 bases in length, representing the rraA monocistronic transcript
from an unidentified promoter that locates proximal to the rraA ORF. No bands around
1.5 kb (the expected size for menA-rraA dicistronic RNA) were detected even after a
longer exposure of the membrane to the X-ray film (Figure 4.1B). The finding that the
disictronic mRNA cannot be detected by Northern blotting suggests that most of the rraA
mRNA is likely transcribed from the unidentified proximal promoter that is located
proximal to the rraA ORF, throughout log to stationary phases. The contribution of
PmenA to rraA mRNA synthesis is negligible, when the cells were grown in LB media
under aerobic condition.

86
A
(nt) Mks +RT -RT
1650
500
200
menA rraA
PmenAP-RT-stop
P4
1 927 1019 1505 nt
(nt) Mks +RT -RT
1650
500
200
(nt) Mks +RT -RT
1650
500
200
menA rraA
PmenAP-RT-stop
P4
1 927 1019 1505 nt
menA rraA
PmenAP-RT-stop
P4
1 927 1019 1505 nt
B
23S rRNA(2.9kb)
16S rRNA(1.5kb)
1 2 3 4 5 6 7 8 9 10 11
23S rRNA(2.9kb)
16S rRNA(1.5kb)
23S rRNA(2.9kb)
16S rRNA(1.5kb)
1 2 3 4 5 6 7 8 9 10 11
23S rRNA(2.9kb)
16S rRNA(1.5kb)
23S rRNA(2.9kb)
16S rRNA(1.5kb)
1 2 3 4 5 6 7 8 9 10 11
23S rRNA(2.9kb)
16S rRNA(1.5kb)
23S rRNA(2.9kb)
16S rRNA(1.5kb)
1 2 3 4 5 6 7 8 9 10 11
23S rRNA(2.9kb)
16S rRNA(1.5kb)
Figure 4.1: (A) RT-PCR analysis. (left) The annealing positions of the reverse primer (P-RT-stop) and forward primer (P4) used in the RT-PCR analysis of the menA-rraA region. (right) RT-PCR analysis of the rraA transcript using the primers P4 and P-RT-stop. - RT: the negative controls containing the same amounts of RNA, primers, and Taq polymerases, but no reverse transcriptase. (B) Northern Blotting. (left) The growth curve and sampling time. (right) The predominant rraA mRNA corresponds to the monocistronic transcript from a promoter that locates proximal to rraA ORF., ca 550 bases in length, throughout exponential and stationary phases. The result was confirmed using a different rraA-specific probe.
Primer extension of RNA isolated from E. coli JCB570 using the 5’-32P labeled
oligonucleotide probe 32P-gcggttccacgacgttaacatcttcttga revealed an rraA transcript that is
initiated at an A residue 28 nt upstream from the ATG codon (Figure 4.2A). In addition

87
to this major transcript, the data in Figure 4.2A also show a faint band at the position of
the initiation codon of rraA (indicated by an open arrowhead). However, this band was
not detected in a primer extension assay using an alternative primer (32P-
ccgtccgccaaagttggagaacagc) that anneals to a different location within the rraA RNA
(located 23 bp upstream from the first primer) suggesting that the minor band likely
corresponds to a premature stop product of the reverse transcriptase.
DNA sequence analysis of the menA-rraA intergenic region suggested the
existence of a putative promoter (PrraA) (Figure 4.2B). RraA and menA are separated
by a 92bp intergenic region that shows a significant degree of conservation among
closely related bacteria such as Shigella flexneri (92/92 bp, 100% identity in the
intergenic region), and Salmonella typhimurium (86/92bp, 93% identity in the intergenic
region). A lower degree of sequence identity was observed for phylogenetically more
distant bacteria such as Yersinia pestis, Erwinia carotovora and Photorhabdus
luminescens. Analysis using GENETYX-MAC 11.2.5 identified regions that match the
σ70 consensus -35 and -10 sequences, centered at 32 and 8 nucleotides, respectively,
upstream of transcription initiation site (Figure 4.2B). Multiple sequence alignment,
using CLUSTAL W 1.81, among the bacterial species which have close homologs (>80%)
of the E. coli K-12 rraA revealed that the sequence of the PrraA promoter is conserved
among γ-proteobacteria. As shown in Figure 4.2B, the -35 and -10 regions are identical,
except from Photorhabdus luminescens, whose -35 region differs from that of E. coli. K-
12 by one bp.

88
Transcription initiation siteTranscription initiation site
A

89
-35 -10-35 -10
Figure 4.2 (A) Primer extension. Five μg total RNA isolated from E. coli JCB570 cells grown to log phase (A600 = 0.7) was reverse transcribed using the primer (5’-gcggttccacgacgttaacatcttcttga-3’) complementary to nucleotides +36 to +64 of rraA. Filled arrowhead: the reverse transcription product; open arrowhead: the premature stop product of the reverse transcriptase. (B) Multiple sequence alignment of the menA-rraA intergenic sequence: Abbreviations: Eco, Escherichia coli K-12 ; Sfl, Shigella flexner I ; Sen, Salmonella enterica ; Ype, Yersinia pestis ; Eca, Erwinia carotovora ; Plu, Photorhabdus luminescens. Transcript start site is indicated by a solid arrow. -35, -10 sites are indicated by empty boxes.
Genetic analysis of expression PrraA using lacZ transcriptional fusions
We used PCR amplification to generate DNA fragments containing different
regions upstream of rraA extending up to, and including, the menA promoter, as shown in
Figure 4.3A: -57 to 1019 nt of the rraA upstream region that includes the PmenA, the
menA coding sequence, and the menA-rraA intergenic region; -57 to 927 nt that includes
the PmenA and menA coding sequence; 927 to 1019 nt of the menA-rraA intergenic
region, and cloned each fragment upstream of the lacZ gene in a multicopy
transcriptional fusion vector, pSP417 (Podkovyrov and Larson 1995). In this way, we
B

90
generated plasmids pMZ002 {(-57 to 1019 nt) -lacZ }, pMZ003{(927 to 1019 nt) -lacZ },
and pMZ004 {(-57 to 927 nt) -lacZ }; pMZ001 was the negative control vector.
To rule out the possibility that differences in the β-galactosidase activity
expressed from the above transcriptional fusions might be partially due to plasmid copy
number effects, we made single chromosomal copy isolates of each construct using the
transducing lambda phage system (Simons et al. 1987). The lacZ fusions in pMZ001,
pMZ002, pMZ003 and pMZ004 were transferred into either λRS74 or λRS45 via a double
recombination event to generate λMZ1, λMZ2, λMZ3 and λMZ4. Subsequently, E. coli
EC-O was lysogenized with the recombinant phages to generate strains carrying a single
copy of each promoter-lacZ fusion. As show in Figure 4.3B, strain MZ003{EC-O, λ
(927 to 1019 nt)-lacZ }, with only the menA-rraA intergenic region fused to lacZ, showed
identical levels of β-galactosidase activity to those observed in MZ002 {EC-O, λ (-57 to
1019 nt)-lacZ } which contained a fusion to the rraA upstream region, including the
PmenA and the menA coding sequence. In contrast, MZ004 {EC-O, λ (-57 to 927 nt)-
lacZ} containing a fusion to -57 to 927 nt of the rraA upstream region that lacked the
menA-rraA intergenic region, showed 50% lower activity.

91
B
menA rraA
1 927 1019 1505 nt
PmenA (known)
-57
-57 1019
1019927
-57 927
MZ002
MZ003
MZ004
PrraA
A
0
50
100
150
200
250
300
( Mill
er U
nits
)MZ001 MZ002 MZ003 MZ004
β-g
alac
tosi
dase
act
ivity
B
menA rraA
1 927 1019 1505 nt
PmenA (known)
-57
-57 1019
1019927
-57 927
MZ002
MZ003
MZ004
PrraA
A
0
50
100
150
200
250
300
( Mill
er U
nits
)MZ001 MZ002 MZ003 MZ004
β-g
alac
tosi
dase
act
ivity
menA rraA
1 927 1019 1505 nt
PmenA (known)
-57
-57 1019
1019927
-57 927
MZ002
MZ003
MZ004
PrraA
menA rraA
1 927 1019 1505 nt
PmenA (known)PmenA (known)
-57
-57 1019
1019927
-57 927
MZ002
MZ003
MZ004
-57 1019
1019927
-57 927
MZ002
MZ003
MZ004
PrraAPrraA
A
0
50
100
150
200
250
300
( Mill
er U
nits
)MZ001 MZ002 MZ003 MZ004
β-g
alac
tosi
dase
act
ivity
0
50
100
150
200
250
300
( Mill
er U
nits
)MZ001 MZ002 MZ003 MZ004
β-g
alac
tosi
dase
act
ivity
Figure 4.3 (A) Schematic of the transcriptional rraA –lacZ fusions used in this study. (B) β-galactosidease activities in MZ001, MZ002, MZ003 and MZ004 cells. MZ001 (EC-O, λp0-lacZ) has a chromosomal promoterless lacZ gene; strain MZ002{EC-O, λ(-57 to 1019 nt)-lacZ } encodes a lacZ fusion to nt -57 to 1019 of the rraA upstream region; MZ003 {EC-O, λ(927 to 1019 nt)-lacZ } encodes a lacZ fusion to nt 927 to 1019 of the menA-rraA intergenic region; MZ004{EC-O, λ(-57 to 927 nt)-lacZ } encodes a lacZ fusion to nt -57 to 927 of the rraA upstream region. Cells were grown in LB under aeration at 37°C, and harvested in log phase (A600= 0.5-0.8). Samples were normalized by O.D. and enzymatic activities were measured in Miller units. The data presented are the average of at least three independent determinations and error bars correspond to the standard deviation.
rraA expression in stationary phase
Earlier microarray studies had shown that the rraA mRNA level is increased upon
entrance to stationary phase ( https://asap.ahabs.wisc.edu/annotation/php/ASAP1.htm ).
The abundance of the RraA protein in exponential and stationary phase cells was
examined by Western blotting using strain DY330-rraASPA (Butland et al. 2005) in
which sequential peptide affinity (SPA) tags are fused to the C terminus of the rraA open
reading frame within the chromosome. We found that the level of RraA protein
reproducibly increased by about 2-fold in stationary phase (Figure 4.4).

92
Anti-Flag
Log Stationary
1 1.9 + 0.3Relative intensity -
Anti-Flag
Log Stationary
1 1.9 + 0.3Relative intensity - Figure 4.4 Western immunoblot analysis of RraA level in exponential and stationary phases. Strain DY330-rraASPA, bearing a sequential peptide affinity (SPA) tag at the C terminus of rraA open reading frame, was cultured in LB medium at 32°C and harvested during exponential growth (A600=0.4) and stationary phase (A600=3.5). RraA is expressed at endogenous levels from its chromosomal promoter and is detected by the highly specific anti-FLAG antibody. Blots were replicated from three independent protein preparations. Replicate measurements were made on the same membrane to determine the reproducibility of the analysis. The intensity of the signal was observed to be linear by using a dilution series of total protein. The data are the mean and error of three separate blots.
In order to determine if rraA gene transcription is dependent on the growth phase,
we examined the rraA promoter activity in exponential or stationary phase cells grown in
LB medium at 37oC. Primer extension analysis of RNA from stationary phase cells
revealed a marked increase in the rraA transcript in stationary phase cells (Figure 4.5).
In addition to the rraA transcript, several minor bands were also evident in samples from
stationary phase cells. These correspond to premature termination or mis-annealing
products since they could neither be detected consistently nor were they detected in a
primer extension assay using a different primer.
Transcriptional regulation of rraA by RpoS
Many genes that are upregulated in stationary phase are part of the rpoS regulon.
The role of RpoS in the transcriptional regulation of rraA was examined using primer
extension analysis. An rpoS mutant strain ,MZ100 (JCB570, rpoS::kan) was made by
P1 transduction of a kan marked rpoS deletion allele (Bohannon et al. 1991). Primer
extension analysis of RNA extracted from stationary phase cells of MZ100 did not show

93
any change in the intensity of the band corresponding to the rraA transcript (Figure 4.5).
Together with the increased intensity of the rraA transcript in stationary phase observed
in the wild type cell sample, these results indicate that transcription from the PrraA
promoter increases in stationary phase and this effect is dependent on the transcription
factor σs.
The effect of rpoS on the transcriptional activity of the PrraA promoter was also
evaluated using lacZ fusions transcribed from the PrraA promoter. Specifically, β-
galactosidase activity was determined in strains MZ003, MZ004, MZ013 (MZ003,
rpoS::kan) and MZ014 (MZ004, rpoS::kan) grown to either exponential or stationary
phase. As shown in Figure 4.6, in strain MZ003, the β-galactosidase activity increased
more than 2-fold in stationary phase cultures (A600≈ 2.5) compared with log-phase cells
(A600≈ 0.6). In the isogenic rpoS mutant MZ013 the β-galactosidase activity was
comparable to the level observed in the parental E. coli MZ003 in exponential phase
cells. However, unlike the wt control, MZ013 did not exhibit an increase in β-
galactosidase activity in stationary phase. As a further control the β-galactosidase
activity of MZ004 and MZ014 cells where lacZ is transcribed from the upstream menA
promoter was neither growth phase dependent, nor was it affected by rpoS. These
results clearly suggest that σs is responsible for the increased transcription from the PrraA
upon entrance into stationary phase.

94
1 2 3 4
W.T. rpoS
Log Stat. Log Stat.
RT
G A T C
1 2 3 4
W.T. rpoS
Log Stat. Log Stat.
RT
G A T C
Figure 4.5 Primer extension analysis showing the transcription from PrraA in growth phases. Total RNA were prepared from isogenic strains JCB570 (w.t.) and MZ100 (JCB570, rpoS::kan) grown to log phase (A600=0.6) and stationary phase (A600=2.5). Equivalent amounts of RNA (5 μg) was reverse transcribed using the primer (5’-gcggttccacgacgttaacatcttcttga-3’) complementary to nucleotides +36 to +64 of rraA. The position of the reverse transcription products are shown by the arrowhead.

95
β-g
alac
tosi
dase
act
ivity
( Mill
er U
nits
)
0
100
200
300
400
500
600
MZ003 MZ003,rpoS MZ004 MZ004,rpoS
Log Stat Log Stat Log Stat Log Stat
menA rraA
1 927 1019 1505 nt
PmenA (known)
-57
-57 1019
1019927
-57 927
MZ002
MZ003
MZ004
PrraAβ
-gal
acto
sida
se a
ctiv
ity
( Mill
er U
nits
)
0
100
200
300
400
500
600
MZ003 MZ003,rpoS MZ004 MZ004,rpoS
Log Stat Log Stat Log Stat Log Stat
β-g
alac
tosi
dase
act
ivity
( Mill
er U
nits
)
0
100
200
300
400
500
600
MZ003 MZ003,rpoS MZ004 MZ004,rpoS
Log Stat Log Stat Log Stat Log Stat
menA rraA
1 927 1019 1505 nt
PmenA (known)
-57
-57 1019
1019927
-57 927
MZ002
MZ003
MZ004
PrraA
menA rraA
1 927 1019 1505 nt
PmenA (known)PmenA (known)
-57
-57 1019
1019927
-57 927
MZ002
MZ003
MZ004
-57 1019
1019927
-57 927
MZ002
MZ003
MZ004
PrraAPrraA
Figure 4.6 Effect of σs level on the transcriptional activity of the various Prra - lacZ fusions inexponential or stationary phase cells. Strains MZ003{EC-O, λ(927 to 1019 nt)-lacZ }, MZ004{ EC-O, λ(-57 to 927 nt)-lacZ }, MZ013 (MZ003, rpoS::kan) and MZ014 (MZ004, rpoS::kan) were in M9 medium supplemented with 0.2% casein with aeration, at 37°C and harvested either in exponential (A600=0.6) or stationary phase (A600=2.5). Samples were normalized by O.D. and enzymatic activities were measured in Miller units. The data presented are the average of at least three independent determinations and error bars correspond to the standard deviation.

96
The decay of the rraA transcript is dependent on RNase E
Since the function of RraA is to modulate the endonuclease activity of RNase E, it
was of interest to examine whether RNase E plays a role in the decay of the rraA
transcript. Because RNase E is an essential protein, the stability of the rraA mRNA was
examined in E. coli CH1828 which contains the temperature sensitive rne-1 allele.
Cells were grown at 30oC in LB medium under aerobic conditions to mid-logarithmic
phase, followed by a temperature upshift to 43.5oC for 20 min. Rifampicin was added
to inhibit transcription, samples were withdrawn at different times, and the level of rraA
was determined by Ribonuclease Protection Assays (Figure 4.5). In the parental strain
CH1827, the half-life of rraA, determined by fitting a linear regression model, was
virtually identical at 30oC or at 43.5oC, (t1/2 = 2.4 ± 0.3 and 2.9 ± 0.2 min respectively).
However, incubation of the rne-1 mutant strain at the non-permissive temperature
resulted in a significant (2-fold) stabilization of the rraA transcript, whose t1/2 increased
to 6.1 ± 1.1 min. Since RraA acts an inhibitor of RNase E activity, the finding that the
processing of the rraA transcript is RNase E-dependent suggests the existence of a
feedback mechanism: induction of rraA synthesis, possibly by environmental triggers
that stimulate σs-dependent transcription, would be expected to result in higher
accumulation of RraA protein, in turn inhibiting RNase E activity and thus leading to
stabilization of the rraA transcript. The net result would be a further increase in the
level of RraA protein and greater inhibition of RNase E activity.

97
CH1827
CH1827, ren-1
Time (sec) 0 45 90 135 180 225 270 315 360 405 450 495
CH1827
CH1827, ren-1
Time (sec) 0 45 90 135 180 225 270 315 360 405 450 495
Figure 4.7 Ribonuclease protection assays and total RNA isolation were done as described in Materials and Methods on strains CH1827 (MC1061, zce-726::Tn10) and CH1828 (CH1827, rne-1). Time points in seconds were taken after rifampicin addition. Equivalent amounts of RNA (5 ug) were used in RNA protection assays and loaded into each lane of a 6% polyacrylamide/7M urea gel. The band intensity was quantified using the ImageQuant® software. Degradation rates were determined by fitting linear regression models and represent the average of two independent determinations.
DISCUSSION
The recently discovered RraA protein represents the prototypical cellular protein
that modulates RNA decay and processing by binding to the essential endoribonuclease
RNase E and inhibiting its activity. Interestingly, inhibition of RNase E activity by
RraA does not require the RNase E carboxy-terminal scaffold region important in
formation of the RNA degradosome; however, RraA binding is enhanced by the CTH of
RNase E. RraA does not interact detectably with RNA substrates, suggesting that it
affects the ability of RNase E to cleave phosphodiester bonds between nucleotides by a
mechanism that is independent of substrate binding. Microarray profiling showed that
adventitious expression of RraA affects the abundance of more than 2000 E. coli
transcripts, giving rise to an mRNA profile that was very similar to the transcript
signature observed during RNase E depletion. The absence of rraA altered the
abundance of ~80 transcripts at least 2-fold. Most of these RNAs were destabilized in

98
an rraA null mutant, consistent with the inhibitory effect of RraA on the
endoribonucleolytic activity of RNase E (Lee et al. 2003).
The relatively small number of transcripts affected in the rraA null strain,
combined with the normal growth of this strain when cultured at 37˚C suggests that the
physiological effects of RraA might occur under more specialized environmental
conditions. Since RraA acts as an inhibitor of RNase E, its maximal effect on cell
physiology is expected to occur under conditions where its cellular concentrations are
elevated.
In this study we showed that rraA is expressed from its own promoter, PrraA,
located in the menA-rraA intergenic region. Primer extension and lacZ fusion analysis
revealed that transcription from PrraA is elevated upon entry into stationary phase in a
σs-dependent manner. Finally, western blot confirmed that the RraA protein is
accumulated in stationary phase.
E. coli cells experience morphological and physiological changes during the
transition to stationary phase (Hengge-Aronis, 1999). In stationary phase, transcription is
essentially controlled by the alternative sigma factor σs (or σ38, RpoS), leading to the
expression of more than 100 stationary phase-specific genes (Ishihama 1997).
The E. coli rpoS regulon also comprises genes that are upregulated under certain
stress conditions such as hyperosmolarity, low PH, and oxidative and temperature
stresses. They function largely in stress response, carbon metabolism and cell envelope
biogenesis (Hengge-Aronis 2002). Recently, using microrarray analysis Hengge-
Aronis’s group identified over 400 genes which are positively controlled by σs in E. coli.
While rraA was not recognized as an σs dependent gene in this study, we note that 33 out
of the 87 genes which had been experimentally shown to be σs-controlled in earlier
studies also failed to be detected in the microarray experiments (Weber et al. 2005).

99
Many σs promoters contain an extended -10 region KCTAYRCTTAA (nucleotide
-14 to -4, K stands for T or G, Y stands for T or C, and R stands for A or G) (Weber et al.
2005). Particularly, C at -13 has been shown to interact directly with lysine 173 in the
region 2.5 of σs (Becker and Hengge-Aronis 2001; Weber et al. 2005). Nevertheless,
despite its importance, this C at -13 is not absolutely essential for more efficient promoter
utilization by σs than by σ70, as shown with mutant variants of the aidB promoter (Lacour
et al. 202; Hengge-Aronis 2002). The extended -10 motif is found only on the genes
which are σs-dependent under all three growth and stress conditions (i.e. transition into
stationary phase growth, hyperosmotic shift and low pH). They account for less than
30% of the total genes which are positively controlled by rpoS and were named the “core
set” of σs-dependent genes (Weber et al. 2005). Genes that display σs dependence only
under certain conditions do not contain this extended -10. In PrraA, the -10 box
(gaTATACT ), contains an A rather than a C at -13 suggesting that additional factors may
be involved in sigma factor selectivity. For example, the well-characterized σs-
controlled gene, csiD, which is mainly induced by carbon starvation, contains an A at -13
(-10 sequence: gaTATTTT) (Weichart et al. 1993; Marschall et al. 1998) and requires
cyclic AMP(cAMP) - cAMP receptor protein (CRP) for sigma factor selectivity. We
could not identify sequences resembling either the distal or the proximal UP element
which has been proposed to enhance σs selectivity. The absence of an apparent UP
element is not surprising as such sequences are absent in more than 50% of the known σs-
dependent promoters (Typas and Hengge-Aronis 2005). It should be noted that
extensive earlier studies have revealed that σs promoter selectivity is affected by a
number of factors including DNA supercoiling, topology and by the action of additional
protein regulators (Kusano et al. 1996; Colland et al. 2000).

100
Along with changes in transcription, the mechanisms that control RNA stability
are also altered during stationary phase, although very little is known about these latter
effects. A possible biological role for the σs-dependent regulation of rraA expression is
that it might provide a means for the stabilization of stationary phase-induced transcripts.
The translation of RpoS is positively regulated by the small non-coding RNA
DsrA. DsrA interacts with one strand of the rpoS mRNA, interfering with the formation
of the stem structure that otherwise inhibits translation. DsrA is degraded by RNase E
(Repoila and Gottesman 2001). It is conceivable that the elevated expression of RraA
reduces the cleavage of DsrA by RNase E ,and in turn stimulates the translation of rpoS,
ultimately allowing further expression of rraA.
We found evidence that the expression of rraA may be regulated at the post-
transcriptional level as well. The stability of the rraA transcript is dependent on RNase E
activity suggesting the involvement of a feedback circuit in the regulation of the RraA
level in E. coli: induction of rraA synthesis, possibly by environmental triggers that
stimulate σs-dependent transcription, would be expected to result in higher accumulation
of RraA protein, in turn inhibiting RNase E activity and thus leading to stabilization of
the rraA transcript. The net result would be a further increase in the level of RraA
protein and greater inhibition of RNase E activity.

101
Chapter 5: Studies on the Regulation of rraB Expression
INTRODUCTION
RraB is a 15.6 KDa protein which interacts with RNase E and inhibits RNase E
endonucleolytic cleavages in E. coli, thus regulating gene expression at the
posttranscriptional level. Similar to RraA, RraB does not alter RNase E cleavage site
specificity or interact detectably with the substrate RNAs. RraB also possesses the same
affinity for RNase E as RraA, with KD values in the micromolar range. However, RraB
exhibits key differences in its mode of action, its effects on transcript profile and its
phylogenetic distribution. For example, RraB interacts with residue 694-727 at the CTH
of RNase E. In contrast, no single contiguous epitope in RNase E has been found
responsible for binding RraA. Adventitious expression of RraB induces dramatic and
specific changes in degradosome composition that are distinct from RraA overexpression.
DNA microarrays revealed that the action of RraB results in a dramatic change in the
global abundance of mRNAs that is different from that obtained through the action of
RraA (Gao et al. 2006). Finally, in contrast to the widely distributed RraA homologues,
RraB homologues are only found in γ-proteobacteria, suggesting that these proteins may
have a more specialized role in modulating RNA degradation.
The existence of two proteins that exert a differential effect on RNA decay via
their interactions with RNase E and degradosome remodeling argues that modulation of
RNA stability may be a mechanism for global control of transcript abundance in response
to dynamic changes in the extracellular environment. The E. coli rraB gene is 417 bp in

102
length and is located at 96.4 minutes in the chromosome. Prior to the discovery of its
function as an RNase E inhibitor, RraB protein was annotated as a hypothetical protein,
YjgD, in the NCBI database.
As the first step to understanding the physiological significance of the modulation
of mRNA decay by RraB, we studied the transcription and regulation of rraB. RraB was
shown to be expressed throughout exponential and stationary phase growth. We
demonstrated that rraB is transcribed from a promoter (PrraB) which is divergent from
the argI promoter and overlaps with the arginine repressor binding site (ARG boxes)
located in the argI-rraB intergenic region. This indicates that the expression of rraB
could be regulated by the transcription factor ArgR and may be involved in arginine
metabolism. Along these lines, previous microarray analysis suggested that the
expression of rraB (yjgD) may be correlated with expression of argI in response to the
changes in tryptophan metabolism (Ramelot et al. 2003; Khodursky et al. 2000).
In E. coli K-12 strains, arginine biosynthesis starts from glutamate and
carbamoylphosphate. The enzymes responsible for these reactions are coded by the
arginine regulon. This regulon is currently known to be composed of 12 genes, among
which only a few are organized in an operon. However, all the genes in the arginine
regulon are regulated by a master transcriptional regulator and repressor, ArgR, which
functions as a direct sensor of arginine availability. The binding of six L-arginine
molecules at the trimer-trimer interface of ArgR activates the regulator, allowing it to
bind to the ARG boxes which spans nearly 40 bp and consist of two neighboring 18-bp
palindromic sequences, separated by three nucleotides (Maas 1994).

103
E. coli has five principal operons, trp, aroH, mtr, trpR, and aroL, known to be
involved in tryptophan biosynthesis, transport, and regulation. All of these operons are
transcriptionally regulated by the tryptophan-activated Trp repressor (Pittard 1996). The
five proteins, TrpA, TrpB, TrpC, TrpD and TrpE, required for tryptophan biosynthesis
from the aromatic branch point intermediate, chorismate, are encoded by the trp operon.
Transcription of the trp operon is regulated by transcription attenuation as well as by
repression (Yanofsky et al. 1999).
We examined the possibility that the expression of rraB is regulated in response
to changes in the availability of these two amino acids. However, we find that contrary
to the gene chip data we could not find any evidence that rraB promoter activity, mRNA
abundance and RraB protein level are affected by changes in either tryptophan or
arginine metabolism.
MATERIALS AND METHODS
Strains, plasmids and phage vectors
The strains, plasmid, and phage vectors used in this study are listed in Table 5.1.
Growth conditions
Vogel and Bonner minimal medium (Heatwole and Somerville 1992) + 0.2%
glucose, supplemented with L-tryptophan (50 µg/ml) or indole acrylic acid (15 µg/ml)

104
was used for tryptophan limited growth experiments. For arginine limitation, MD
medium (Minimal medium with Davis salts) (Suiter et al. 2003) supplemented with
amino acids (with excess arginine (20mM) or no arginine) and vitamins was used
throughout. Arginine free medium (AF) is MD with the following added from a sterile
25-fold concentrated stock: 580 mg of DL-alanine, 60 mg of L-aspartatic acid, 70 mg of
L-cysteine, 400 mg of L-glutamic acid, 160 mg of glycine, 50 mg of L-histidine, 320 mg
of DL-isoleucine, 270 mg of L-leucine, 360 mg of L-lysine, 120 mg of L-methionine, 560
mg of DL-phenylalanine, 140 mg of L-proline, 330 mg of DL-serine, 55 mg of L-
tryptophan, 60 mg of L-tyrosine, 200 mg of L-threonine, 330 mg of L-valine, 200 mg of
L-asparagine, 20 mg of guanosine, 20 mg of adenosine, 20 mg of uracil, 1 mg of
pantothenic acid, 1 mg of riboflavin, 1 mg of thiamine, 1 mg of nicotinic acid, 1 mg of
biotin, and 1 mg of pyridoxine). Media were supplemented with antibiotics, as required
(50 μg/ml ampicilin, 25μg/ml kanamycin or 10μg/ml chloramphenicol). Unless
otherwise stated, cells were grown in Luria-Bertani broth (LB) under aeration at 37oC,
and the growth was monitored by measuring the absorbance at 600 nm of the culture.

105
Table 5.1 Strains, plasmid and phage vectors
Strains, plasmids, and phage vectors
Description Reference or Source
JCB570 (MC1000, phoR zih12::Tn10) (Bardwell et al., 1991)
W3110 (lacL8, lacIq) (Khodursky et al., 2000)
AK11 ( W3110, argR::cam) (Kiupakis et al., 2002)
EC-O ( thi-1, relA1, Δ(pro-lac)X113[del = DE5] supE44 / F42-114(FTs) lac)
Lab collection
DY330 (W3110, ΔlacU169 gal490 λc1857 Δ(cro-bioA)) (Zeghouf et al.,2004)
MZB001 (EC-O, λ p0-lacZ ) This study
MZB002 {EC-O, λ (-239 to -1 nt)-lacZ } This study
MZB003 {EC-O, λ (-152 to -1 nt)-lacZ } This study
MZB004 {EC-O, λ (-239 to -153 nt)-lacZ } This study
CY15682 (W3110, trpR2) (Khodursky et al., 2000)
pSP417 pBR ori, Ampr, (Podkovyrov et al., 1995)
pMZB002 {pSP417, (-239 to -1 nt)-lacZ } This study
pMZB003 {pSP417, (-152 to -1 nt)-lacZ } This study
pMZB004 {pSP417, (-239 to -153 nt)-lacZ } This study
λRS 45 bla'-lacZsc imm21 ind + (Simons et al., 1987)
λRS74 placUV5-lacZ + imm21 ind + (Simons et al., 1987)
λMZB1 Same as λRS74, but containing the p0-lacZ fusion This study
λMZB3 Same as λRS45, but containing the (-152 to -1 nt)-lacZ fusion This study

106
Table 5.2 Growth condition examined and strains compared
A Minimal medium vs. excess tryptophan trpR+ (Min) vs. trpR+ (Min + Trp)* Nonstarved vs. tryptophan-starved trpR+ (Min) vs. trpR+ (Min + 15 µg/ml indole acrylate)* trpR+ vs. trpR2 (repressor minus) trpR+ (Min) vs. trpR2 (Min)
Strains used were: W3110 (wild type); CY15682, (trpR2 , repressor minus)
(Min) = Vogel and Bonner Minimal medium; (Min + Trp) = minimal + 50 µg/ml L-
tryptophan. * Time-course experiments; samples taken at different intervals.
B Minimal medium vs. excess arginine argR+ (Min) vs. argR+ (Min + Arg)* Nonstarved vs. arginine-starved argR+ (Min) vs. argR+ (cells were shifted and incubated without arginine for 2 hrs to achieve transient arginine starvation ) argR+ vs. argR- (repressor minus) argR+ (Min) vs. argR- (Min)
Strains used were: W3110 (wild type); AK11(argR::cam)
(Min) = MD minimal medium; (Min + Arg) = MD minimal + 20mM arginine. * Time-course experiments; samples taken at different intervals.

107
RNA methods
For reverse transcriptase-polymerase chain reaction (RT-PCR) analysis, total
RNA was isolated with the RNeasy kit (Qiagen, Valencia, CA) and treated with RNase-
free DNase (Ambion, Austin, TX). 50 ng of total RNA were subjected to RT-PCR
analysis using the One Step RNA PCR kit (TaKaRa, New York, NY). Northern blots
were performed using total RNA isolated from E. coli JCB570 grown in LB medium
under aeration at 37oC. Samples were collected in one hour intervals throughout the
exponential and stationary phase. Five μg of total RNA per lane were loaded onto a
denaturing gel containing formaldehyde, then transferred to a positively charged nylon
membrane (Hybond N+, Amersham, UK). The AlkPhos direct nucleic acid labeling and
detection system (Amersham, UK) was used to synthesize the oligonucleotide probe
specific to rraB gene (5’-aacaactgatgacgctggca-3’). Hybridization, washing of the
membranes, and detection of signals were carried out according the manufacturer's
protocol.
For primer extension, 5’ 32P-labeled oligonucleotide (5’-
acaccactgacattgcctccaccttt -3’) was used as a primer for the RT reaction with 5 μg of total
RNA (SuperScript III RNase H- Reverse Transcriptase (Invitrogen, Carlsbad, CA). The
primer extension products were separated on 6% polyacrylamide/7M urea gels. The
dideoxy-DNA sequence ladder from the same primer was prepared using the fmol DNA
Cycle Sequencing System (Promega, Madison ,WI).

108
Construction of β-galactosidase fusions
PCR amplification was used to generate DNA fragments containing three
different regions: -239 to -1 nt, -152 to -1 nt, and -239 to -153 nt, upstream of rraB, and
each fragment was cloned upstream of the lacZ gene in the multicopy transcriptional
fusion vector, pSP417. Plasmids pMZB002 {(-239 to -1 nt)-lacZ }, pMZB003{(-152 to
-1 nt)-lacZ }, pMZB004 {(-239 to -153 nt)-lacZ } were thus constructed. pMZB001 was
used as a negative control. The lacZ fusion in pMZB003 was transferred onto the
chromosome using the transducing lambda phage system. The fusions were transferred
into λRS45, whereas the negative control fusion in pMZB001 was transferred into λRS74
via a double recombination event (Simons et al. 1987). Plaques containing the
recombinant lambda phages were isolated based on their blue plaque phenotype. The
recombinant lambda phages were used to lysogenize EC-O (Δ(pro-lacZ)), and generated
strains: MZB001 (EC-O, λp0-lacZ) with a chromosomal promoterless lacZ gene;
MZB002 {EC-O, λ(-239 to -1 nt )-lacZ}, MZB003{EC-O, λ(-152 to -1 nt )-lacZ}
encodes a lacZ gene fused to nt -239 to -1 and nt -152 to -1 of the rraB upstream region,
respectively. All lysogens were tested for mono-lysogenization by PCR.
β-galactosidase assays
Cultures were grown with aeration at 37°C, in the medium specified in Table 5.2.
Samples were collected during exponential and stationary phases. The samples were
collected at 4°C and resuspended in an appropriate volume of ice-cold Z buffer (60 mM
Na2HPO4, 40 mM NaH2PO4, 10 mM M KCl, 1 mM MgSO4; pH 7.0) to give A600 in the

109
range from 0.6 to 0.9. β-galactosidase activities were determined from at least three
independent experiments, as described in Chapter 4.
Western Immunoblotting
Western Blots were performed as described in Chapter 4.
Real-Time PCR
E. coli strains were grown in the conditions described in Table 5.2. Total RNA was
isolated with the RNeasy kit (Qiagen, Valencia, CA) and treated with RNase-free DNase
(Ambion, Austin, TX). To exclude the possibility of DNA contamination during RNA
preparation, RNA samples were subjected to PCR amplification without prior reverse
transcription. No amplification was obtained during this step. Reverse transcription of 2
μg of total RNA was performed with random hexanucleotides and SuperScript III RNase
H- Reverse Transcriptase (Invitrogen, Carlsbad, CA) according to the instructions of the
manufacturer. For expression analysis, the primers specific for the genes, rraB, trpE, argI,
and dnaX, were used. Real-time PCR was performed with an ABI Prism 7700 machine
(Applied Biosystems) using the relative standard curve method under the universal
cycling conditions (2 min at 50°C, 10 min at 95°C, 40 cycles of 15 s at 95°C, and 1 min
at 60°C) as described by the manufacture. The reaction mixture (20 μl) for SYBR Green
assay contained 2× SYBR Green PCR Master Mix (PE Applied Biosystems), 10 pmol of
forward and reverse primers, and 5 μl of cDNA (0.1-100 ng). Reat time PCR was carried

110
out in a MicroAmp optical 96-well reaction plate with optical caps (PE Applied
Biosystems). At each cycle, accumulation of PCR products was detected by monitoring
the increase in fluorescence of the dsDNA-binding SYBR Green. After the PCR, a
dissociation curve (melting curve) was constructed in the range of 60°C to 95°C.
Sequence-specific standard curves were generated by using 10-fold serial dilutions of
cDNA. The quantity of cDNA for the investigated genes was normalized to the quantity
of dnaX cDNA in each sample. The dnaX gene encoding the DNA polymerase III
holoenzyme was chosen as an internal standard because it is a ubiquitously expressed
housekeeping gene that is frequently used for the normalization of gene expression in
quantitative reverse transcription-PCR experiments in E. coli. Cycle threshold (CT)
values were determined by automated threshold analysis with ABI Prism version 1.0
software. Calculations were performed with Microsoft Excel. Analysis of dissociation
profiles was performed with ABI Prism version 1.6 software. Each experiment was
performed at least three times with two independent RNA preparations.
RESULTS
Identification of the rraB promoter by DNA sequence analysis
First, the DNA sequence around the rraB gene was analyzed using bioinformatics
tools. A promoter search using GENETYX-MAC 11.2.5 suggested the existence of two
putative promoters that match the σ70 consensus -35 and -10 sequences. The proximal

111
pair is centered at 128 and 104 nucleotides upstream of the rraB translation start site. The
distal pair is located at a further 64 nucleotides upstream of the start codon of rraB
(Figure 5.1A). Sequence similarity search using BLAST revealed that the E. coli K-12
rraB gene and its upstream region containing the putative promoter sequence are well
conserved (>=80% sequence identity) among γ-proteobacteria including E. coli, Shigella
flexneri, Salmonella typhimurium, Yersinia pestis, Erwinia carotovora and Photorhabdus
luminescens. Multiple sequence alignment using CLUSTAL X 1.8, among the bacterial
species which have close homologues of the E. coli K-12 rraB, revealed that the
sequence of the -35 and -10 regions of the putative rraB promoter is conserved among γ-
proteobacteria (Figure 5.1B). Moreover, a protein BLAST search identified eight
bacterial homologues of approximately the same length as RraB (134–153 residues) with
significant sequence identity (>50%).
RraB is located at 96.4 minutes in the E. coli chromosome and is adjacent to argI
which is transcribed from the opposite strand and codes for ornithine
carbamoyltransferase I and is involved in arginine biosynthesis. Thus, rraB and argI are
adjacent genes arranged in a head-to-head alignment on opposite DNA strands in E. coli.
Interestingly, genome context analysis showed that the rraB homologues in S.
typhimurium and Y. pestis are in the same head-to-head alignment with argI. Although a
homologue of argI is not found near the rraB homologue, VC0424, in the V. cholerae
genome, VC0424 is in a similar head-to-head alignment with VC0423, which codes for
an arginine deiminase (ADI) that is involved in arginine catabolism (Figure 5.1C).
Inspection of the nucleotide sequence in the argI-rraB intergenic region revealed an
arginine repressor (ArgR) binding site ARG boxes, which consists of two neighboring
18-bp palindromic sequence separated by three nucleotides (Figure 5.1A). Based on these
observations we decide to examine whether the expression of rraB is regulated by the

112
transcription factor ArgR . Earlier,the transcription of RraB was found to be correlated
with argI expression in previous microarray analysis (Ramelot et al. 2003; Khodursky et
al. 2000).
Rho-independent terminator?Rho-independent terminator?
Figure 5.1 (A) Two pairs of putative promoters (red letter) that match the σ70 consensus -35 and -10 sequences were identified using GENETYX-MAC 11.2.5. Green box: arginine repressor binding sites (ARG boxes); underlined letter: previously identified argI promoter sequence.
A

113
Figure 5.1 (B) Multiple sequence alignment of the argI-rraB intergenic sequence: Abbreviations: Eca, Erwinia carotovora ; EcoB, Escherichia coli B, EcoK12, Escherichia coli K-12 ; EcoO157, Escherichia coli O-157, EcoCFT073 Escherichia coli CFT073, Sfl, Shigella flexner I ; Salmonella, Salmonella enterica ; Ype, Yersinia pestis ; Plu, Photorhabdus luminescens. Transcript start codon, -35, -10 sites are indicated by empty boxes.
B

114
RraBRraB
Figure 5.1 (C) Genome context analysis showed the head-to-head alignment of rraB and argI is conserved in E. coli and related bacteria.
Experimental identification of the rraB promoter
Northern blot analysis with rraB-specific probes revealed that rraB mRNA is
expressed from its chromosomal copy throughout exponential and stationary phase. The
transcript is around 500 bases in length, thus corresponding to a monocistronic mRNA
transcribed from the putative promoter predicted by the sequence analysis (Figure 5.2A).
Primer extension of RNA isolated from wild-type E. coli JCB570 using the 5’-32P
labeled oligonucleotide probe 32P-gcggttccacgacgttaacatcttcttga revealed a single rraB
transcript that is initiated at a T residue 88bp upstream from the ATG codon (Figure
5.2B), which corresponds to the predicted proximal promoter (-35:ttaaaa, -10:attatt). This
promoter was designated PrraB. No other bands were detected.
C

115
16S23S
16S23S
16S23S
16S23S
Figure 5.2 (A) Northern Blotting (left) The growth curve and sampling time. (right) rraB transcript is around 500 bases in length and is expressed constitutively throughout exponential and stationary phase growths.
A

116
GATGATTATTCATTTGCAAGTCTAAAG
GCCATG
CTACTAATAAGTAAACGTTCAGATTTC
CGGTAC
-10
*
rraBstart codon
… …
G A T C RT
Transcription initiation site
GATGATTATTCATTTGCAAGTCTAAAG
GCCATG
CTACTAATAAGTAAACGTTCAGATTTC
CGGTAC
-10
*
rraBstart codon
… …
G A T C RT
Transcription initiation site
Figure 5.2 (B) Primer extension. Five μg total RNA isolated from E. coli JCB570 cells grown to log phase (A600 = 0.7) was reverse transcribed using the primer (5’- acaccactgacattgcctccaccttt -3’) complementary to rraB. Arrow: the reverse transcription product.
B

117
The promoter activity of PrraB was further analyzed using lacZ transcriptional
fusions. The different regions upstream of rraB extending up to the putative distal
promoter as shown in Figure 5.3A, were amplified by PCR and cloned upstream of the
lacZ gene in the low copy transcriptional fusion vector, pSP417. In this way, we
generated plasmids pMZB002 {(-239 to -1 nt)-lacZ}, pMZB003{(-152 to -1 nt) -lacZ },
and pMZB004 {(-239 to -153 nt)-lacZ }; pMZ001 was the negative control vector.
To rule out the possibility that differences in the β-galactosidase activity
expressed from the above transcriptional fusions might be partially due to plasmid copy
number effects, we made single chromosomal copy isolates of each construct using the
transducing lambda phage system (Simons et al. 1987). The lacZ fusions in pMZ001,
pMZB002, pMZB003 were transferred into either λRS74 or λRS45 via a double
recombination event. Subsequently, E. coli strain EC-O was lysogenized with the
recombinant phages to generate strains carrying a single copy of each promoter-lacZ
fusion.
As shown in Figure 5.3B, strain MZB003{EC-O, λ(-152 to -1 nt)-lacZ }, with the
rraB upstream region including the proximal promoter fused to lacZ, showed identical
levels of β-galactosidase activity to those observed in MZB002 {EC-O, λ(-239 to -1 nt)-
lacZ } which contains a fusion to the rraB upstream region including both the proximal
and the distal putative promoter sequences. In contrast, MZB004 {EC-O, λ(-239 to -
153 nt)-lacZ} containing a fusion to -239 to -153 nt of the rraB upstream region that
lacks the proximal promoter region did not give any activity higher than the background.
Thus, the transcriptional fusion experiments also confirmed that the rraB is transcribed
from the proximal promoter (PrraB).
In Chapter 4 we showed that expression of the rraA gene is induced in stationary
phase. We now examined the transcription of rraB in both the exponential and

118
stationary phase. In contrast to rraA, the transcription level of rraB remained unchanged
during various growth phases. Specifically, there is no change in the β-galactosidase
activities from the PrraB-lacZ fusion in cells grown in exponential or stationary phases
(Figure 5.3C). Northern blot analysis also showed that the rraB mRNA level stays same
during both growth phases (Figure5.2).
A
0
50
100
150
200
250
300
350
1 2 3 4MZB001 MZB002 MZB003 MZB004
( Mill
er U
nits
)β
-gal
acto
sida
se a
ctiv
ity
B
rraB
argI
MZB002
MZB004MZB003
-239 -152 -1
0
50
100
150
200
250
300
350
1 2
log
Stationary
MZB003 MZB004
β-g
alac
tosi
dase
act
ivity
( Mill
er U
nits
)
C
A
0
50
100
150
200
250
300
350
1 2 3 4MZB001 MZB002 MZB003 MZB004
( Mill
er U
nits
)β
-gal
acto
sida
se a
ctiv
ity
B
rraB
argI
MZB002
MZB004MZB003
-239 -152 -1
rraB
argI
MZB002
MZB004MZB003
-239 -152 -1
0
50
100
150
200
250
300
350
1 2
log
Stationary
MZB003 MZB004
β-g
alac
tosi
dase
act
ivity
( Mill
er U
nits
)
C
Figure 5.3 (A) Schematic of the transcriptional rraB –lacZ fusions used in this study. (B) and (C): β-galactosidease activities in MZB001, MZB002, MZB003 and MZB004 cells. MZB001 (EC-O, λ p0-lacZ) has a chromosomal promoterless lacZ gene; strain MZ002{EC-O, λ (-239 to -1 nt)-lacZ } encodes a lacZ fusion to nt -239 to -1 of the rraB upstream region; MZ003 {EC-O, λ (-152 to -1 nt)-lacZ } encodes a lacZ fusion to nt -152 to -1 of the argI-rraB intergenic region; MZ004{EC-O, λ (-239 to -153 nt)-lacZ } encodes a lacZ fusion to nt -239 to -153 of the rraB upstream region. Cells were grown in LB under aeration at 37°C, and harvested in log phase (A600= 0.5) and stationary phase (A600= 1.6). Samples were normalized by O.D. and enzymatic activities were measured in Miller units. The data presented are the average of at lease three independent determinations and the error bars correspond to the standard deviation.

119
RraB expression is not affected by tryptophan availability
Previous DNA microarray analysis of gene expression in response to
physiological and genetic changes affecting tryptophan metabolism showed that
expression of the rraB gene is repressed in response to tryptophan starvation (Khodursky
et al. 2000). To evaluate the expression pattern of rraB in the context of tryptophan
availability, we examined the transcriptional activity level and steady state mRNA level
from rraB under three conditions, which have distinct effects on tryptophan metabolism
(Table 5.2). First, excess tryptophan was added to cultures growing in minimal medium
(+Trp). Second, cultures were partially starved of tryptophan (-Trp) by addition of the
tryptophan analog, indole acrylate. The presence of indole acrylate in the growth
medium relieves both repression and attenuation of the trp operon because it prevents the
trp repressor from acting and inhibits the charging of tRNATrp by tryptophanyl-tRNA
synthetase. Third, the effect of inactivating the tryptophan repressor was examined using
a strain which does not produce a functional trp repressor because of a frameshift
mutation in trpR (trpR2).
As shown in Figure 5.4, similar β-galactosidase activities of the PrraB::lacZ
fusion were obtained from cell grown in normal minimal medium, with excess
tryptophan or with tryptophan starvation. This indicates that rraB promoter activity is
not altered by changes in tryptophan availability.
The steady state level of the rraB gene was examined by real-time PCR. Cells
were subjected to tryptophan starvation induced by addition of indole acrylate, to excess
tryptophan, or neither, and the changes in mRNA levels with time were measured and
compared.

120
0
50
100
150
200
250
300
350
400
1 2 3 4
Excess Tryptophan
( Mill
er U
nits
)β
-gal
acto
sida
se a
ctiv
ity
0
50
100
150
200
250
300
350
400
450
1 2 3 4
Tryptophan Starvation( M
iller
Uni
ts )
β-g
alac
tosi
dase
act
ivity
0 15 60 200 (mins) 0 15 60 200 (mins)0
50
100
150
200
250
300
350
400
1 2 3 4
Excess Tryptophan
( Mill
er U
nits
)β
-gal
acto
sida
se a
ctiv
ity( M
iller
Uni
ts )
β-g
alac
tosi
dase
act
ivity
0
50
100
150
200
250
300
350
400
450
1 2 3 4
Tryptophan Starvation( M
iller
Uni
ts )
β-g
alac
tosi
dase
act
ivity
0 15 60 200 (mins)0
50
100
150
200
250
300
350
400
450
1 2 3 4
Tryptophan Starvation( M
iller
Uni
ts )
β-g
alac
tosi
dase
act
ivity
( Mill
er U
nits
)β
-gal
acto
sida
se a
ctiv
ity
0 15 60 200 (mins) 0 15 60 200 (mins) Figure 5.4 β-galactosidase activities from the PrraB::lacZ fusion were measured with excess tryptophan (+50 µg/ml L-tryptophan) or with tryptophan starvation (+15 µg/ml indole acrylate), as described in the Material and Methods. Samples taken at different intervals as indicated.
The change in rraB mRNA level was also analyzed in trpR mutant and its
parental strain W3110. trpE, encoding the anthranilate synthase component I, was used
as a positive control because it belongs to the trp operon and is known to be negatively
regulated by TrpR. Equal amounts of total RNA from cells grown under the various
experimental conditions described above were reverse transcribed and used to quantitate
the transcript levels of rraB and trpE genes by real-time PCR. The data were normalized
to the expression of the dnaX gene in the two strains and different growth conditions.
Instead of using a specific fluorescence-labeled probe (TaqMan) for the detection of
amplicons, we used SYBR green dye. Since SYBR green binds only to double-stranded
and not to single stranded DNA molecules, PCR product concentrations can be recorded
at each cycle, yielding a real-time amplification curve suitable for automated threshold
analysis and quantification. The specificity of SYBR green-based real-time RT-PCR was
ascertained by comparing the melting temperatures (Tms) of the amplification products
from different samples to that of the positive control sample. Dissociation curves of all
PCR products showed a sharp peak at the expected Tm of the products (Zhao and

121
Georgiou, unpublished data). These results indicate that each real-time PCR specifically
amplified the target DNA. A twofold difference in transcription was interpreted as a
significant difference in expression under different conditions. As shown in Table 5.4,
trpE mRNA abundance is decreased in response to excess tryptophan {(6.67±0.55)-fold
decrease after 15 mins, (3.75±0.46)-fold decrease after 60 mins}. It is dramatically
increased in response to tryptophan starvation {(259.27±30.89)-fold increase after 15
mins, (392.92±38.67) -fold increase after 60 mins}. Expression of trpE increased
(18.12±1.36) fold in the trpR mutant compared to the wild type. The results obtained with
trpE confirmed the reliability of the real-time PCR system. However, contrary to the
earlier microarray data, the rraB mRNA level was not affected by any of the
physiological or genetic changes in tryptophan metabolism tested.
We further examined the abundance of the RraB protein under these conditions by
Western blotting using strain DY330-rraBSPA in which sequential peptide affinity (SPA)
tags are fused to the C terminus of the rraB open reading frame within the chromosome.
Consistent to what was observed in steady mRNA level, the abundancy of RraB protein
was not influenced by changes in tryptophan availability (Zhao and Georgiou,
unpublished data).
The regulation of rraB expression is not affected by arginine metabolism
The expression of rraB expression as a function of arginine availability was also
investigated. The influence of changes in arginine availability was examined following
arginine up shift and down shift. First, excess arginine (20mM) was added to cultures
growing in minimal medium (+Arg). Second, arginine-grown cells were shifted and
incubated without arginine for two hours to achieve transient arginine starvation. Third,

122
the arginine repressor was inactivated to examine its effect on rraB transcription. The
transcription activity of PrraB, deduced from the β-galactosidase activity levels from
cells grown in medium with excess amount of arginine or without arginine, were in the
same range as those from cells grown in medium with a normal amount of arginine
(Figure5.5). In addition, the steady level of rraB mRNA was measured by real-time
PCR using argI as a positive control. As shown in Table 5.4, argI mRNA level decreased
in response to excess arginine {(1.92±0.23)-fold decrease after 15 mins, (2.86±0.32)-fold
decrease after 200 mins}. It increased under condition of arginine starvation
{(144.98±20.45)-fold increase after 2hours}. Expression of argI increased (93.51±12.32)
fold in the argR mutant compared to the wild type. The expected pattern of argI
expression validated the real-time PCR system. In contrast, no statistically significant
change in the level of rraB mRNA was detected under the conditions tested.
0
50
100
150
200
250
300
350
400
1 2 3 4
( Mill
er U
nits
)β
-gal
acto
sida
se a
ctiv
ity
0
50
100
150
200
250
300
350
400
1 2
( Mill
er U
nits
)β
-gal
acto
sida
se a
ctiv
ity
0 15 60 200 (mins) Normal growth Arginine Starvation
A BExcess Arginine
0
50
100
150
200
250
300
350
400
1 2 3 4
( Mill
er U
nits
)β
-gal
acto
sida
se a
ctiv
ity( M
iller
Uni
ts )
β-g
alac
tosi
dase
act
ivity
0
50
100
150
200
250
300
350
400
1 2
( Mill
er U
nits
)β
-gal
acto
sida
se a
ctiv
ity( M
iller
Uni
ts )
β-g
alac
tosi
dase
act
ivity
0 15 60 200 (mins) Normal growth Arginine Starvation
A BExcess Arginine
Figure 5.5 β-galactosidase activities of the PrraB::lacZ fusion were measured with excess arginine (+20mM arginine) or with arginine starvation, as described in the Material and Methods. Samples taken at different intervals as indicated.

123
Table 5.4 mRNA abundance measured by Real-Time PCR
Growth condition examined and strains compared Relative Abundance Tryptophan Metabolish rraB trpE
trpR+ (Min) 1 1 trpR+ (Min + Trp) (15min) 1.06 0.15 trpR+ (Min + Trp) (60min) 1.35 0.27 trpR+ (Min, tryptophan-starved ) (15min) 1.21 259.27 trpR+ (Min, tryptophan-starved ) (60min) 0.83 392.92 trpR2 (repressor minus) 1.02 18.12 Arginine Metabolism rraB argI argR+ (Min) 1 1 argR+ (Min + Arg) (15min) 0.99 0.52 argR+ (Min + Arg) (200min) 0.87 0.35 argR+ (Min, arginine-starved) 1.11 144.98 ArgR- (repressor minus) 1.36 93.51 Strains used were W3110 (wild type); CY15682, (trpR2), AK11(argR::cam). The results were the average of three independent measurements (variance was ≦20% of the mean). mRNA abundance were measured as described in Material and Methods.
Toward understanding the physiological significance of RraA and RraB
Three null mutant strains JQ004 (rraA-), JG002 (rraB-) and JG004 (rraA- rraB-)
were used to examine the effect of RraA and RraB on growth under different condistions.
Earlier, DNA microarray analysis by K Lee at Stanford had revealed that the absence of
rraA or rraB altered the abundance of a small set of transcripts. Most of these RNAs
were destabilized in the rraA or rraB deleted strains, consistent with the inhibitory effect
of RraA/RraB on the endoribonucleolytic activity of RNase E. However, the three null
mutant strains exhibited normal growth under typical growth conditions (37oC, in LB

124
media). To further discern any phenotypes resulting from deletion of the RNAse E
inhibitors the rraA- rraB- double mutant (JG004) was subjected to Phenotype
MicroArray (Biolog, Hayward, CA) analysis, which is a comprehensive method that
determines the phenotype of bacterial mutant. These studies showed that the rraA- rraB-
double mutant is unable to grow when L-Tryptophan was used as the sole nitrogen source
and it was more susceptible to toxic compounds, e.g. patulin, hexachlorophene, 8-
hydroxyquinoline.
DISCUSSION
The identification of RraB as the second protein inhibitor of RNase E led to the
discovery of a new mechanism for the global regulation of mRNA stability. In
comparison RraB modulates the composition of the degradosome and differentially
affects the ability of the RNA degrading machinery to recognize and cleave different
RNAs. Understanding the regulation of rraB gene expression is essential to pinpointing
the physiological significance of these effects. RT-PCR and Northern blot analysis
confirmed that rraB is expressed from its chromosomal copy throughout exponential and
stationary growth phases. Primer extension and lacZ transcriptional fusion experiments
demonstrated that rraA is transcribed from its own promoter (PrraB) located 88 bp
upstream from the translation start codon. In the genomes of E. coli and other bacteria,
such as S. typhimurium, Y. pestis and V. cholerae, rraB homologues are arranged in a
head-to-head alignment with the adjacent gene, argI. argI, a member of the arginine
regulon, encoding the ornithine carbamoyltransferase I, is known to be regulated by the

125
specific repressor, ArgR. The binding site for ArgR i.e. ARG boxes, is located in the
rraB-argI intergenic region and overlaps the argI promoter in E. coli. Interestingly, the
-10 and -35 boxes of the experimentally confirmed rraB promoter completely reside in
these two ARG boxes. It was presumed that by binding to the -10 and -35 boxes of the
promoter, ArgR would block the access of DNA polymerase to both the rraB and argI
promoter elements, thus preventing transcription initiation. In fact, this simultaneous
regulation of two divergent promoters by ArgR has been described for a number of
adjacent genes, for example, argE and argC, both are involved in arginine biosynthesis;
argG and metY, argG is involved in arginine biosynthesis and metY encodes one of the
two methionine tRNAs required for the initiation of protein synthesis (Krin et al. 2003).
This assumption that rraB expression may be related to arginine availability was
further supported by several independent, global analyses. Previous microarray analysis
indicated that the expression of rraB (yjgD) is correlated with expression of argI in
response to the changes in tryptophan metabolism. The microarray data suggested that
the expression of argI and rraB genes is repressed in response to tryptophan starvation
(Khodursky AB et al. 2000; Ramelot et al. 2003). Consistent with these observations
the rraA- rraB- double mutant was unable to grow when tryptophan was used as the sole
nitrogen source in a phenotype microarray analysis. The expression of rraB gene in
response to that the availability of tryptophan or arginine metabolism was examined.
Contrary to the microarray data, we found that expression of rraB does not respond to the
changes in neither tryptophan nor arginine availability. This unexpected result
emphasizes that information from public databases should be used with caution.
As with other posttranslational mechanisms of regulation, RraB may facilitate
rapid alterations in RNA decay and/or processing in response to specific environmental
stimuli, although at this time, cellular conditions that may affect RraB production and/or

126
activity have not been identified. While homologues of RraA are widely distributed
among archea, proteobacteria and plants, RraB homologues are found only in γ-
proteobacteria, suggesting that these proteins may have a more specialized role in
modulating RNA degradation. The different effect on RNA decay via its distinctive
interactions with RNase E and degradosome remodeling also argues that modulation of
RNA stability by RraB may be a response to different stimuli (e.g. stress response) in the
extracellular or intracellular environment. There are several explanations for the lack of
a strong phenotype in the rraA, rraB deletion strains JQ004 (rraA-), JG002 (rraB-) and
JG004 (rraA- rraB-). First, since RraA and RraB act as inhibitors of RNase E, their
maximal effect on cell physiology is expected under conditions where their cellular
concentrations are elevated. Therefore, it is not surprising that so far we have only
detected rather subtle defects of these null mutants. The lack of a strong phenotype for
the rraA rraB null mutation may also be due to the presence of additional cellular
proteins capable of modulating the catalytic function of RNase E and whose functions
may partially overlap that of RraA/RraB.

127
Chapter 6: Conclusions and Recommendations
The significance of the RNase E based degradosome in RNA metabolism has
been studied extensively over the past decade. However, the mechanistic details of how
the ribonucleolytic activity and degradosome composition are modulated and how this in
turn affects the decay of transcripts, remains to be resolved. In this work, different
approaches were used to understand and characterize the newly discovered regulatory
proteins which modulate RNA abundance by interacting with the RNase E. Comparison
of the actions of RraB and RraA revealed a novel mechanism whereby the selective
remodeling of the degradosome by adaptor proteins serves to dramatically modulate
RNA degradation and processing in E. coli. A system was developed for investigating
the function of the degradosome and the role of RraA/RraB in RNA processing in vitro.
The expression of RraA and RraB is regulated differently, suggesting their physiological
role is to modulate transcript abundance in response to distinct changes in the cellular
environment.
The discovery of RraA as the prototypical protein inhibitor of RNase E-mediated
RNA decay prompted us to look for additional cellular proteins which might participate
in the regulation of RNase E activity. In a manner analogous to RraA, RraB was
isolated as a consequence of its ability to inhibit the cleavage of the dsbC mRNA by
RNase E. Similar to RraA, RraB inhibited endoribonucleolytic cleavage of the 5’ UTR
of rne transcripts strongly enough to circumvent the autoregulation of rne that normally
maintains the level of the enzyme within a narrow range. RraB physically interacts with
full length RNase E in vivo and in vitro with an affinity that is nearly indistinguishable

128
from RraA. Importantly, however, RraA and RraB interact differently with the enzyme:
Co-precipitation analysis with a set of RNase E mutants bearing deletions within the
degradosome organizing domain demonstrates that RraB recognizes a well defined
epitope located between aa residues 694-727 whereas RraA requires both the N-terminus
and the distal C-terminus (aa residues 1045-1061) of RNase E for binding. Proteomic
analysis further shows that RraA and RraB exert dramatic, distinct, and inhibitor-specific
effects on the composition of the degradosome, most notably on the amount of
degradosome-bound PNPase and RhlB. Microarray analysis reveals that RraA and
RraB exert differential effects on the ability of the RNA degrading machinery to cleave
various mRNAs, in turn giving rise to distinct transcript profiles. Certain transcripts are
stabilized by RraA, others by RraB and yet a third class is stabilized by either inhibitor.
Notably, the global transcript abundance profiles associated with RraA or RraB
expression are dissimilar to the profile observed during RNase E deficiency. Our results
revealed a novel mechanism whereby binding of inhibitors to distinct sites within RNase
E serves to differentially regulate RNA cleavages in E. coli.
As a continuing study to explore the molecular details of this novel mechanism,
we developed a system for the partial reconstitution of degradosomes and determination
of the consequences of RraA and RraB binding to the kinetics of RNA degradation in
vitro. To overcome the susceptibility to proteolytic degradation of RNase E CTH, we
made a series of C-terminal truncated forms of RNase E containing the binding sites for
RraA, RraB and some of the degradosome components. We have developed protocols to
successfully overexpress and purify the C-terminal truncated RNase E proteins at the
milligram scale under denaturing condition. RraA, RraB, PNPase, RhlB and enolase
expression constructs have been made and the proteins have been purified via ion

129
exchange chromatography or affinity chromatography. This work laid the foundation
for reconstituting partial degradosomes in vitro and for examining the effect of RrA/RraB
on the composition of the complex. A system for the detailed kinetic analysis of
degradation of a model short RNA substrate (P-BR14-FD) has been established. RNase
E845 (1-845aa) was found to have the same catalytic properties as N-RNase E (1-499aa)
for P-BR14-FD and can also be used to study the effects of RhlB, enolase, RraB and
RraA. Interestingly, the inhibition parameters of RraA/B on RNase E-mediated RNA
cleavage seem to vary depending on RNA substrates of different length and structure.
To understand the physiological significance of the differential modulation of E.
coli RNA decay and processing by inhibitory proteins, we studied the regulation of RraA/
RraB expression. Transcription of rraA had been proposed to occur from the upstream
menA promoter which was shown to be σ70-dependent (Meganathan 1996). In contrast
to these earlier results, we demonstrate that rraA is transcribed predominantly from its
own promoter (PrraA) located in the menA - rraA intergenic region. Transcription from
PrraA is σs-dependent and is induced upon entry into stationary phase. Moreover, the
synthesis of RraA is regulated at the post-transcriptional level by RNase E, suggesting the
existence of a feedback regulatory circuit whereby induction of rraA transcription occurs
in a σs-dependent manner and results in inhibition of RNase E activity, in turn decreasing
the degradation rate of the rraA transcript and enhancing the cellular level of the RraA
protein.
We showed that rraB is transcribed from a promoter (PrraB) which is divergent
from the argI promoter and overlaps with the arginine repressor binding site (ARG
boxes) located in the argI-rraB intergenic region. Based on previous gene chip analysis

130
data, we examined the possibility that the expression of rraB is regulated in response to
changes in the availability of tryptophan or arginine. However, we find that, contrary to
earlier published data, there is no evidence that rraB promoter activity, mRNA
abundance and RraB protein level are affected by changes in metabolism of either amino
acid. In contrast to rraA, rraB is expressed constitutively during exponential and
stationary phases.
RECOMMENDATION FOR FURTHER STUDIES
As described in Chapter 4, we found RraA and RraB exert a small effect on the
cleavage of the short RNAs (P-BR14-FD and p-BR13-Fl) by N-RNase and RNase E845
in vitro. In contrast, RraA and RraB significantly inhibit the cleavage of a longer
transcript (149 nt p23) by the partially purified full-length RNase E. Thus, it is likely that
the effect of RraA/RraB is dependent on the assembled degradosome complex and on the
intrinsic character of the substrate RNAs. To understand both the function of
degradosome and of the role of RraA/RraB, purified degradosome component proteins
(C-terminal truncated RNase E proteins, PNPase, RhlB and enolase) could be used to
reconstitute the degradosome in vitro and determine the consequences of RraA and RraB
binding to the kinetics of RNA degradation. The subunit stoichiometry of the
reconstituted degradosomes complexes could be evaluated by SDS-PAGE. The effect of
RraA/RraB on the composition of the complex could be determined by adding different
molar ratios of these proteins. Subsequently, the reconstituted degradosomes with or
without the inhibitory proteins could be used to determine the kinetics of cleavage of
RNAs of different length and structure. For examples, the 14 nt FRET RNA (P-BR14-

131
FD) could be used as a model short RNA whereas the 147 nt transcript p23 could be used
to evaluate how the degradosome components and RraA/RraB affect the hydrolysis of
structured RNAs. Michaelis-Menten parameters and enzyme inhibition constants for
RrA/RraB could be obtained. It would also be of interest to examine the impact of the
phosphorylation status of the RNA 5’ terminus since RraA has been shown to exhibit a
stronger inhibitory effect on the cleavage of the RNA with a 5’ triphosphate vs. a
5’monophosphate group (Lee, K., Cohen, S.N., and Georgiou, G., unpublished).
Alternative strategies should be considered to understand the regulation of rraB
expression. Screening a plasmid-encoded genomic library in the strain with the
chromosomal PrraB::lacZ fusion is a promising way to identify genes encoding
regulatory factors for rraB expression. Gene products that up-regulate the transcription
from rraB promoter will enhance the β-galactosidase activity encoded from the
PrraB::lacZ fusion; hence a positive regulator will be identified as blue colonies on X-gal
plates. The genes down-regulating rraB expression will be identified as white colonies as
a result of decreased β-galactosidase activity. Complementarily, a transposon
mutagenesis library could be used to screen the rraB transcription regulators based on
loss-of-function. Moreover, analysis of the structural characteristics of RraB by solving
its crystal structure will also provide key insight about its physiological function and
regulation.
Gene chip studies showed that overexpression of RraA and RraB differentially
altered the steady state level of hundreds of transcripts in E. coli. Microarray analysis
carried out by other groups revealed that all of the four degradosome components,
including. RNase E, PNPase, RhlB, and enolase, are required for the normal turn over of

132
mRNA. It is of great interest to determine to what extent these degradosome
components and inhibitory proteins that modulate RNA degradation affect the abundance
of protein in cell. Shotgun proteomics, in which proteins are digested into peptide
fragments, and analyzed by 2D-HPLC coupled with tandem mass spectrometry
LC/LC/MS/MS (Mirgorodskaya et al. 2000; Washburn et al. 2001; Yao et al. 2001;
Conrads et al. 2002; Yi et al. 2005), provides a high throughput measurement of the
complete set of proteins expressed by a genome. Various approaches have been
developed to quantify the relative abundance of proteins by introducing internal reference
standards. Recently, Marcotte et al. developed a method for large-scale absolute protein
expression measurements (APEX) by mass spectrometry (Marcotte, E., personal
communication). Proteomic profiles of cells under the following conditions: 1) RraA or
RraB overexpression, 2) deletion mutation in RraA or RraB, and 3) deletion mutation in
the major degradasome components, could be determined using these quantitative
proteomic studies. Furthermore, comparison between the protein expression profiles with
the transcript profiles will allow us to determine whether protein abundance levels are
correlated to mRNA steady levels, thus leading to an estimation of the relative
contributions of transcriptional and translational regulation in the steady state levels of
proteins.
The lack of a strong phenotype for the rraA rraB null mutant strain may be due to
the presence of additional cellular proteins capable of modulating the catalytic function of
RNase E and whose functions may partially overlap that of RraA/RraB. As both RraA
and RraB were isolated as a result of their abilities to stabilize dsbC mRNA, other
proteins that bind to RNase E and selectively affect the stability of sets of transcripts with
different features could be discovered by the application of alternative genetic screens.

133
For example, a transcriptional fusion, in which the autoregulatory region of rne gene
fused to an antibiotic resistance gene (e.g. rne-kan) or an enzyme gene (e.g. rne-lacZ),
could be used for the screening. Genes encoding other E. coli proteins that inhibit the
activity of RNase E based degradosome could be identified by screening a plasmid-
encoded genomic library in the rraA rraB mutant background. Any cellular proteins that
suppress the catalytic activity of RNAse E activity would result in less cleavage of the
rne-kan or rne-lacZ mRNA, thus producing more antibiotic resistant protein or higher β-
galactosidase activity. Hence, RNase E inhibitor genes will be identified as colonies able
to grow on higher concentration of antibiotic plates or as bluer colonies on X-gal plates.
The effect of the respective proteins on the inhibition of RNase E activity, on
degradosome composition, and on the transcript profile could also be determined.

134
Author’s Publication List
Zhao M, Zhou L, Kawarasaki Y, Georgiou G. Regulation of RraA, the Protein Inhibitor
of RNase E-mediated RNA Decay. Journal of Bacteriology, 2006
May;188(9):3257-63.
Gao J, Lee K, Zhao M, Qiu J, Zhan X, Saxena A, Moore CJ, Cohen SN, Georgiou G.
Differential Modulation of E. coli mRNA Abundance by Inhibitory Proteins that
Alter the Composition of the Degradosome. Molecular Microbiology, 2006 Jul;
61(2):394-406.
Xu L, Zhao WL, Xiong SM, Su XY, Zhao M, Wang C, Gao YR, Niu C, Cao Q, Gu BW,
Zhu YM, Gu J, Hu J, Yan H, Shen ZX, Chen Z, Chen SJ. Molecular
Cytogenetic Characterization and Clinical Relevance of Additional, Complex
and/or Variant Chromosome Abnormalities in Acute Promyelocytic Leukemia.
Leukemia. 2001 Sep;15(9):1359-68.
Zhang QH, Ye M, Wu XY, Ren SX, Zhao M, Zhao CJ, Fu G, Shen Y, Fan HY, Lu G,
Zhong M, Xu XR, Han ZG, Zhang JW, Tao J, Huang QH, Zhou J, Hu GX, Gu J,
Chen SJ, Chen Z. Cloning and Functional Analysis of cDNAs with Open
Reading Frames for 300 Previously Undefined Genes Expressed in CD34+
Hematopoietic Stem/Progenitor Cells. Genome Research. 2000 Oct;
10(10):1546-60.
Zhao M, Chen S. Centric and Pericentric Chromosome Rearrangements in
Hematopoietic Malignant Diseases. Hereditas. 2001; 23(4): 384-388.

135
Zhao M, Chen SJ, Chen Z. 2002. Gene Amplification in Human Tumor: the Biological
and Clinical Significance, P60-75. in Chen SJ, Huang W, Fan QS (ed.),
Technologies in Human Genome Research. People’s Military Medical
Publisher, Beijing, China.
Zhao M, Chen B, Wang L, Xu L, Cao Q, Su X, Chen S. Establishment and Application
of Multiplex FISH in Detection of the Complex Chromosome Abnormalities in
Leukemia. Chinese Journal of Medical Genetics. 2002 Oct; 19(5):375-8.
Chen S, Zhao M, Chen Z. Progress of All-Trans Retinoic Acid Plus Arsenic Trioxide in
Treating Active Promyelocytic Leukemia. Tumor. 2001 Nov; 21(6):415-418.
Wu Y, Xue Y, Zhao M, Chen S, Pan J, Lu D. Clinical and Experimental Study of Two
Cases of Myelodysplastic Syndrome with t(3; 5) (q25; q34) Translocation.
Chinese Journal of Hematology. 2002 Jun; 23(6):304-6.

136
Bibliography
Abee, T. and J. A. Wouters (1999). "Microbial stress response in minimal processing."
Int J Food Microbiol 50(1-2): 65-91.
Adams, P., R. Fowler, N. Kinsella, G. Howell, M. Farris, P. Coote and C. D. O'Connor
(2001). "Proteomic detection of PhoPQ- and acid-mediated repression of
Salmonella motility." Proteomics 1(4): 597-607.
Anderson, J. S. J. and R. Parker (1998). "The 3' to 5' degradation of yeast mRNA is a
general mechanism for mRNA turnover that requires the SKI2 DEVH box protein
and 3' to 5' exonucleases of the exosome complex." EMBO J 17: 1497-1506.
August, J. T., P. J. Ortiz and J. Hurwitz (1962). "Ribonucleic acid-dependent
ribonucleotide incorporation. I. Purification and properties of the enzyme." J Biol
Chem 237: 3786-93.
Babitzke, P. and S. R. Kushner (1991). "The Ams (altered mRNA stability) protein and
ribonuclease E are encoded by the same structural gene of Escherichia coli." Proc
Natl Acad Sci U S A 88(1): 1-5.
BAKER, K. E. and C. CONDON (2004). Under the Tucson sun: A meeting in the desert
on mRNA decay. RNA. 10: 1680-1691.
Becker, G. and R. Hengge-Aronis (2001). "What makes an Escherichia coli promoter
sigma(S) dependent? Role of the -13/-14 nucleotide promoter positions and region
2.5 of sigma(S)." Mol Microbiol. 39: 1153-65.
Belasco, J. G. (1993). Control of mRNA Stability. San Diego, Academic Press.

137
Bernstein, J. A., A. B. Khodursky, P. H. Lin, S. Lin-Chao and S. N. Cohen (2002).
"Global analysis of mRNA decay and abundance in Escherichia coli at single-
gene resolution using two-color fluorescent DNA microarrays." Proc Natl Acad
Sci U S A 99(15): 9697-702.
Bernstein, J. A., P. H. Lin, S. N. Cohen and S. Lin-Chao (2004). "Global analysis of
Escherichia coli RNA degradosome function using DNA microarrays." Proc Natl
Acad Sci U S A 101(9): 2758-63.
Blattner, F. R., G. Plunkett, 3rd, C. A. Bloch, N. T. Perna, V. Burland, M. Riley, J.
Collado-Vides, J. D. Glasner, C. K. Rode, G. F. Mayhew, J. Gregor, N. W. Davis,
H. A. Kirkpatrick, M. A. Goeden, D. J. Rose, B. Mau and Y. Shao (1997). "The
complete genome sequence of Escherichia coli K-12." Science 277(5331): 1453-
74.
Blum, E., B. Py, A. J. Carpousis and C. F. Higgins (1997). "Polyphosphate kinase is a
component of the Escherichia coli RNA degradosome." Mol Microbiol 26(2):
387-98.
Bohannon, D. E., N. Connell, J. Keener, A. Tormo, M. Espinosa-Urgel, M. M. Zambrano
and K. Roberto (1991). "Stationary-phase-inducible "gearbox" promoters:
differential effects of katF mutations and role of sigma 70." J Bacteriol. 173:
4482-492.
Butland, G., J. M. Peregrin-Alvarez, J. Li, W. Yang, X. Yang, V. Canadien, A.
Starostine, D. Richards, B. Beattie, N. Krogan, M. Davey, J. Parkinson, J.
Greenblatt and A. Emili (2005). "Interaction network containing conserved and
essential protein complexes in Escherichia coli." Nature 433(7025): 531-7.

138
Bycroft, M., T. J. Hubbard, M. Proctor, S. M. Freund and A. G. Murzin (1997). "The
solution structure of the S1 RNA binding domain: a member of an ancient nucleic
acid-binding fold." Cell 88(2): 235-42.
Callaghan, A. J., J. P. Aurikko, L. L. Ilag, J. Gunter Grossmann, V. Chandran, K. Kuhnel,
L. Poljak, A. J. Carpousis, C. V. Robinson, M. F. Symmons and B. F. Luisi
(2004). "Studies of the RNA degradosome-organizing domain of the Escherichia
coli ribonuclease RNase E." J Mol Biol 340(5): 965-79.
Callaghan, A. J., J. G. Grossmann, Y. U. Redko, L. L. Ilag, M. C. Moncrieffe, M. F.
Symmons, C. V. Robinson, K. J. McDowall and B. F. Luisi (2003). "Quaternary
structure and catalytic activity of the Escherichia coli ribonuclease E amino-
terminal catalytic domain." Biochemistry 42(47): 13848-55.
Callaghan, A. J., M. J. Marcaida, J. A. Stead, K. J. McDowall, W. G. Scott and B. F.
Luisi (2005). "Structure of Escherichia coli RNase E catalytic domain and
implications for RNA turnover." Nature 437: 1187-1191.
Cao, G. J., J. Pogliano and N. Sarkar (1996). "Identification of the coding region for a
second poly(A) polymerase in Escherichia coli." Proc Natl Acad Sci U S A
93(21): 11580-5.
Carpousis, A. J., G. Van Houwe, C. Ehretsmann and H. M. Krisch (1994).
"Copurification of E. coli RNAase E and PNPase: evidence for a specific
association between two enzymes important in RNA processing and degradation."
Cell 76(5): 889-900.

139
Caruthers J. M. , Feng Y, McKay DB and C. SN (2006). "Retention of core catalytic
functions by a conserved minimal ribonuclease E peptide that lacks the domain
required for tetramer formation." J Biol Chem 15(28): 27046-51.
Caruthers, J. M. and D. B. McKay (2002). "Helicase structure and mechanism." Curr.
Opin. Struct. Biol 12: 123-133.
Cheng, Z.-F., Y. Zuo, Z. Li, K. E. Rudd and M. P. Deutscher (1998). "The vacB gene
required for virulence in Shigella flexneri and Escherichia coli encodes the
exoribonuclease RNase R." J. Biol. Chem 273: 14077-14080.
Coburn, G. A., X. Miao, D. J. Briant and G. A. Mackie (1999). "Reconstitution of a
minimal RNA degradosome demonstrates functional coordination between a 3'
exonuclease and a DEAD-box RNA helicase." Genes Dev 13(19): 2594-603.
Colland, F., M. Barth, R. Hengge-Aronis and A. Kolb (2000). "Sigma factor selectivity of
Escherichia coli RNA polymerase: role for CRP, IHF and lrp transcription
factors." EMBO J 19: 3028-37.
Coller, J. and R. Parker (2004). "Eukaryotic mRNA decapping." Annu.Rev. Biochem. 73:
861-890.
Conrads, T. P., H. J. Issaq and T. D. Veenstra (2002). "New tools for quantitative
phosphoproteome analysis." Biochem Biophys Res Commun 290(3): 885-90.
Datsenko, K. A. and B. L. Wanner (2000). "One-step inactivation of chromosomal genes
in Escherichia coli K-12 using PCR products." Proc Natl Acad Sci U S A 97(12):
6640-5.

140
de la Cruz, J., D. Kressler, D. Tollervey and P. Linder (1998). "Dob1p (Mtr4p) is a
putative ATP-dependent RNA helicase required for the 3' end formation of 5.8s
rRNA in Saccharomyces cerevisiae." EMBO J 17: 1128-1140.
Deutscher, M. P. (2006). "Degradation of RNA in bacteria: comparison of mRNA and
stable RNA." Nucleic Acids Research 34(2): 659-666.
Diwa, A. A. and J. G. Belasco (2002). "Critical features of a conserved RNA stem-loop
important for feedback regulation of RNase E synthesis." J Biol Chem 277(23):
20415-22.
Diwa, A. A., X. Jiang, M. Schapira and J. G. Belasco (2002). "Two distinct regions on
the surface of an RNA-binding domain are crucial for RNase E function." Mol
Microbiol 46(4): 959-69.
Ehretsmann, C. P., A. J. Carpousis and H. M. Krisch (1992). "Specificity of Escherichia
coli endoribonuclease RNase E: in vivo and in vitro analysis of mutants in a
bacteriophage T4 mRNA processing site." Genes Dev 6(1): 149-59.
Emory, S. A., P. Bouvet and J. G. Belasco (1992). "A 5'-terminal stem-loop structure can
stabilize mRNA in Escherichia coli." Genes Dev 6(1): 135-48.
Feng, Y., T. A. Vickers and S. N. Cohen (2002). "The catalytic domain of RNase E
shows inherent 3' to 5' directionality in cleavage site selection." Proc Natl Acad
Sci U S A 99(23): 14746-51.
Folichon, M., F. Allemand, P. Regnier and E. Hajnsdorf (2005). "Stimulation of poly(A)
synthesis by Escherichia coli poly(A)polymerase I is correlated with Hfq binding
to poly(A) tails." Febs J 272(2): 454-63.

141
Gao, J., K. Lee, M. Zhao, J. Qiu, X. Zhan, A. Saxena, C. Moore, S. Cohen and G.
Georgiou (2006). "Differential modulation of E. coli mRNA abundance by
inhibitory proteins that alter the composition of the degradosome." Mol
Microbiol. 61(2): 394-406.
Georgellis, D., Barlow, T., Arvidson, S. and von Gabain, A., 1993. Retarded RNA
turnover in Escherichia coli: a means of maintaining gene expression during
anaerobiosis. Mol. Microbiol. 9, pp. 375–381.
Ghora, B. K. and D. Apirion (1978). "Structural analysis and in vitro processing to p5
rRNA of a 9S RNA molecule isolated from an rne mutant of E. coli." Cell 15(3):
1055-66.
Ghosh, S. and M. P. Deutscher (1999). "Oligoribonuclease is an essential component of
the mRNA decay pathway." Proc Natl Acad Sci U S A 96(8): 4372-7.
Gorbalenya, A. E. and E. V. Koonin (1993). "Helicases: amino acid sequence
comparisons and structure-function relationships." Curr. Opin. Struct. Biol 3: 419-
429.
Gottesman, S. (2005). "Micros for microbes: non-coding regulatory RNAs in bacteria."
Trends Genet 21(7): 399-404.
Gupta, R. S., T. Kasai and D. Schlessinger (1977). "Purification and some novel
properties of Escherichia coli RNase II." J Biol Chem 252(24): 8945-9.
Hajnsdorf, E., F. Braun, J. Haugel-Nielsen and P. Regnier (1995). "Polyadenylylation
destabilizes the rpsO mRNA of Escherichia coli." Proc Natl Acad Sci U S A
92(9): 3973-7.

142
Hajnsdorf, E., O. Steier, L. Coscoy, L. Teysset and P. Regnier (1994). "Roles of RNase
E, RNase II and PNPase in the degradation of the rpsO transcripts of Escherichia
coli: stabilizing function of RNase II and evidence for efficient degradation in an
ams pnp rnb mutant." Embo J 13(14): 3368-77.
Hayes, R., J. Kudla, G. Schuster, L. Gabay, P. Maliga and W. Gruissem (1996).
"Chloroplast mRNA 3'-end processing by a high molecular encoded RNA binding
proteins." EMBO J 15: 1132-1141.
Heatwole, V. and R. Somerville (1992). "Synergism between the Trp repressor and Tyr
repressor in repression of the aroL promoter of Escherichia coli K-12." J
Bacteriol. 174(1): 331-5.
Hengge-Aronis, R. (2002). "Signal transduction and regulatory mechanisms involved in
control of the sigma(S) (RpoS) subunit of RNA polymerase." Microbiol Mol Biol
Rev 66(3): 373-95, table of contents.
Hengge-Aronis, R. (2002). "Stationary phase gene regulation: what makes an Escherichia
coli promoter σs -selective?" Curr Opin Microbiol 5: 591-5.
Iost, I. and M. Dreyfus (1995). "The stability of Escherichia coli lacZ mRNA depends
upon the simultaneity of its synthesis and translation." EMBO J 14: 3252-3261.
Iost, I. and M. Dreyfus (2006). "DEAD-box RNA helicases in Escherichia coli." Nucleic
Acids Research.
Ishihama, A. (1997). "Adaptation of gene expression in stationary phase bacteria." Curr
Opin Genet Dev 7: 582-588.

143
Jain, C. and J. G. Belasco (1995). "RNase E autoregulates its synthesis by controlling the
degradation rate of its own mRNA in Escherichia coli: unusual sensitivity of the
rne transcript to RNase E activity." Genes Dev 9(1): 84-96.
Jiang, X. and J. G. Belasco (2004). "Catalytic activation of multimeric RNase E and
RNase G by 5'-monophosphorylated RNA." Proc Natl Acad Sci U S A 101(25):
9211-6.
Kaberdin, V. R. (2003). "Probing the substrate specificity of Escherichia coli RNase E
using a novel oligonucleotide-based assay." Nucleic Acids Res 31(16): 4710-6.
Kaberdin, V. R., A. Miczak, J. S. Jakobsen, S. Lin-Chao, K. J. McDowall and A. von
Gabain (1998). "The endoribonucleolytic N-terminal half of Escherichia coli
RNase E is evolutionarily conserved in Synechocystis sp. and other bacteria but
not the C-terminal half, which is sufficient for degradosome assembly." Proc Natl
Acad Sci U S A 95(20): 11637-42.
Kawamoto, H., T. Morita, A. Shimizu, I. T. and H. Aiba (2005). " Implication of
membrane localization of target mRNA in the action of a small RNA: mechanism
of post-transcriptional regulation of glucose transporter in Escherichia coli."
Genes Dev. 19: 328-338.
Khemici, V. and A. J. Carpousis (2004). "The RNA degradosome and poly(A)
polymerase of Escherichia coli are required in vivo for the degradation of small
mRNA decay intermediates containing REP-stabilizers." Mol Microbiol 51(3):
777-90.

144
Khemici, V., L. Poljak, I. Toesca and A. J. Carpousis (2005). "Evidence in vivo that the
DEAD-box RNA helicase RhlB facilitates the degradation of ribosome-free
mRNA by RNase E." Proc Natl Acad Sci U S A 102(19): 6913-8.
Khemici, V., I. Toesca, L. Poljak, Vanzo, NF and A. Carpousis (2004). "The RNase E of
Escherichia coli has at least two binding sites for DEAD-box RNA helicases:
functional replacement of RhlB by RhlE." Mol Microbiol. 54(5): 1422-30.
Khodursky, A., B, B. J. Peter, N. R. Cozzarelli, D. Botstein, P. O. Brown and C.
Yanofsky (2000). "DNA microarray analysis of gene expression in response to
physiological and genetic changes that affect tryptophan metabolism in
Escherichia coli." PNAS 97(22): 12170-12175.
Khodursky AB, Peter BJ, Cozzarelli NR, Botstein D, Brown PO and Y. C (2000). "DNA
microarray analysis of gene expression in response to physiological and genetic
changes that affect tryptophan metabolism in Escherichia coli." Proc Natl Acad
Sci U S A. 97(22): 12170-12175.
Khodursky, A. B., B. J. Peter, N. R. Cozzarelli, D. Botstein, P. O. Brown and C.
Yanofsky (2000). "DNA microarray analysis of gene expression in response to
physiological and genetic changes that affect tryptophan metabolism in
Escherichia coli." Proc Natl Acad Sci U S A 97(22): 12170-5.
Kido, M., K. Yamanaka, T. Mitani, H. Niki, T. Ogura and S. Hiraga (1996). "RNase E
polypeptides lacking a carboxyl-terminal half suppress a mukB mutation in
Escherichia coli." J Bacteriol 178(13): 3917-25.

145
Kim, S., H. Kim, I. Park and Y. Lee (1996). "Mutational analysis of RNA structures and
sequences postulated to affect 3' processing of M1 RNA, the RNA component of
Escherichia coli RNase P." J Biol Chem 271(32): 19330-7.
Krin, E., C. Laurent-Winter, P. Bertin, A. Danchin and A. Kolb (2003). "Transcription
regulation coupling of the divergent argG and metY promoters in Escherichia coli
K-12." J Bacteriol. 185(10): 3139-3146.
Kusano, S., Q. Ding, N. Fujita and A. Ishihama (1996). " Promoter selectivity of
Escherichia coli RNA polymerase E sigma 70 and E sigma 38 holoenzymes.
Effect of DNA supercoiling." J Biol Chem 271: 1998-2004.
Kushner, S. (2004). "mRNA decay in prokaryotes and eukaryotes: different approaches
to a similar problem." IUBMB Life. 56(10): 585-94.
Kushner, S. R. (2002). "mRNA decay in Escherichia coli comes of age." J Bacteriol
184(17): 4658-65; discussion 4657.
Lacour, S., A. Kolb, A. Boris Zehnder and P. Landini (202). "Mechanism of specific
recognition of the aidB promoter by sigma(S)-RNA polymerase." Biochem
Biophys Res Commun 292: 922-30.
Lee, K., J. A. Bernstein and S. N. Cohen (2002). "RNase G complementation of rne null
mutation identifies functional interrelationships with RNase E in Escherichia
coli." Mol Microbiol 43(6): 1445-56.
Lee, K., X. Zhan, J. Gao, J. Qiu, Y. Feng, R. Meganathan, S. N. Cohen and G. Georgiou
(2003). "RraA. a protein inhibitor of RNase E activity that globally modulates
RNA abundance in E. coli." Cell 114(5): 623-34.

146
Leroy, A., N. F. Vanzo, S. Sousa, M. Dreyfus and A. J. Carpousis (2002). "Function in
Escherichia coli of the non-catalytic part of RNase E: role in the degradation of
ribosome-free mRNA." Mol Microbiol 45(5): 1231-43.
Li, Z. and M. P. Deutscher (2002). "RNase E plays an essential role in the maturation of
Escherichia coli tRNA precursors." Rna 8(1): 97-109.
Li, Z. and M. P. Deutscher (2004). "Exoribonucleases and endoribonucleases." In Curtiss,
R., III (Ed.). EcoSal-Escherichia coli and Salmonella: Cellular and Molecular
Biology, Chapter 4.6.3.
Li, Z., S. Pandit and M. P. Deutscher (1999). "RNase G (CafA protein) and RNase E are
both required for the 5' maturation of 16S ribosomal RNA." Embo J 18(10): 2878-
85.
Lin-Chao, S., C. L. Wei and Y. T. Lin (1999). "RNase E is required for the maturation of
ssrA RNA and normal ssrA RNA peptide-tagging activity." Proc Natl Acad Sci U
S A 96(22): 12406-11.
Lin, P.-H. and S. Lin-Chao (2005). "RhlB helicase rather than enolase is the -subunit of
the Escherichia coli polynucleotide phosphorylase (PNPase)–exoribonucleolytic
complex." PNAS 102 (46): 16590-16595.
Lin, P. H. and S. Lin-Chao (2005). "RhlB helicase rather than enolase is the beta-subunit
of the Escherichia coli polynucleotide phosphorylase (PNPase)-
exoribonucleolytic complex." Proc Natl Acad Sci U S A 102(46): 16590-5.
Liou, G., W. Jane, S. Cohen, N. Lin and S. Lin-Chao (2001). "RNA degradosomes exist
in vivo in Escherichia coli as multicomponent complexes associated with the

147
cytoplasmic membrane via the N-terminal region of ribonuclease E." Proc Natl
Acad Sci U S A. 98(1): 63-8.
Liou, G. G., H. Y. Chang, C. S. Lin and S. Lin-Chao (2002). "DEAD box RhlB RNA
helicase physically associates with exoribonuclease PNPase to degrade double-
stranded RNA independent of the degradosome-assembling region of RNase E." J
Biol Chem 277(43): 41157-62.
Lundberg, U., A. von Gabain and O. Melefors (1990). "Cleavages in the 5' region of the
ompA and bla mRNA control stability: studies with an E. coli mutant altering
mRNA stability and a novel endoribonuclease." Embo J 9(9): 2731-41.
Maas, W. K. (1994). "The arginine repressor of Escherichia coli." Microbiol Rev. 58(4):
631-40.
Mackie, G. A. (1991). "Specific endonucleolytic cleavage of the mRNA for ribosomal
protein S20 of Escherichia coli requires the product of the ams gene in vivo and in
vitro." J Bacteriol 173(8): 2488-97.
Mackie, G. A. (1992). "Secondary structure of the mRNA for ribosomal protein S20.
Implications for cleavage by ribonuclease E." J Biol Chem 267(2): 1054-61.
Mackie, G. A. (1998). "Ribonuclease E is a 5'-end-dependent endonuclease." Nature
395(6703): 720-3.
Margossian, S. P., H. Li, H. P. Zassenhaus and R. A. Butow (1996). "The DExH box
protein Suv3p is a component of a yeast mitochondrial 3' to 5' exoribonuclease
that suppresses group I intron toxicity." Cell 84: 199-209.
Marschall, C., V. Labrousse, M. Kreimer, D. Weichart, A. Kolb and R. Hengge-Aronis
(1998). "Molecular analysis of the regulation of csiD, a carbon starvation-

148
inducible gene in Escherichia coli that is exclusively dependent on sigma s and
requires activation by cAMP-CRP." J Mol Biol 276: 339-53.
Masse, E., F. E. Escorcia and S. Gottesman (2003). "Coupled degradation of a small
regulatory RNA and its mRNA targets in Escherichia coli." Genes Dev 17(19):
2374-83.
Masse, E. and S. Gottesman (2002). "A small RNA regulates the expression of genes
involved in iron metabolism in Escherichia coli." Proc Natl Acad Sci U S A
99(7): 4620-5.
Masse, E., N. Majdalani and S. Gottesman (2003). "Regulatory roles for small RNAs in
bacteria." Curr Opin Microbiol 6(2): 120-4.
Mata, J., S. Marguerat and J. Bahler (2005). "Post-transcriptional control of gene expression: a
genome-wide perspective." TRENDS in Biochemical Sciences 30(9): 506-514.
McDowall, K. J. and S. N. Cohen (1996). "The N-terminal domain of the rne gene
product has RNase E activity and is non-overlapping with the arginine-rich RNA-
binding site." J Mol Biol 255(3): 349-55.
McDowall, K. J., R. G. Hernandez, S. Lin-Chao and S. N. Cohen (1993). "The ams-1 and
rne-3071 temperature-sensitive mutations in the ams gene are in close proximity
to each other and cause substitutions within a domain that resembles a product of
the Escherichia coli mre locus." J Bacteriol 175(13): 4245-9.
McDowall, K. J., S. Lin-Chao and S. N. Cohen (1994). "A+U content rather than a
particular nucleotide order determines the specificity of RNase E cleavage." J
Biol Chem 269(14): 10790-6.

149
Meganathan, R. (1996). Biosynthesis of the isoprenoid quinones menaquinone (vitamin
K2) and ubiquinone (coenzyme Q). Washington, D.C., American Society for
Microbiology.
Melefors, O. and A. von Gabain (1991). "Genetic studies of cleavage-initiated mRNA
decay and processing of ribosomal 9S RNA show that the Escherichia coli ams
and rne loci are the same." Mol Microbiol 5(4): 857-64.
Miczak, A., V. R. Kaberdin, C. L. Wei and S. Lin-Chao (1996). "Proteins associated with
RNase E in a multicomponent ribonucleolytic complex." Proc Natl Acad Sci U S
A 93(9): 3865-9.
Miller, J. H. (1972). "Experiments in Molecular Genetics."
Miller, J. H. (1992). A short course in bacterial genetics: a laboratory manual and
handbook for Escherichia coli and related bacteria, Cold spring harbor laboratory
press.
Mirgorodskaya, O. A., Y. P. Kozmin, M. I. Titov, R. Korner, C. P. Sonksen and P.
Roepstorff (2000). "Quantitation of peptides and proteins by matrix-assisted laser
desorption/ionization mass spectrometry using (18)O-labeled internal standards."
Rapid Commun Mass Spectrom 14(14): 1226-32.
Misra, T. K. and D. Apirion (1979). "RNase E, an RNA processing enzyme from
Escherichia coli." J Biol Chem 254(21): 11154-9.
Mitchell, P., E. Petfalski, A. Shevchenko, M. Mann and D. Tollervey (1997). "The
exosome: A conserved eukaryotic RNA processing complex containing multiple
3'-5' exoribonucleases." Cell 91: 457-466.

150
Mohanty, B. K., V. F. Maples and S. R. Kushner (2004). "The Sm-like protein Hfq
regulates polyadenylation dependent mRNA decay in Escherichia coli." Mol
Microbiol 54(4): 905-20.
Moll I, Afonyushkin T, Vytvytska O, Kaberdin VR and B. U. (2003). "Coincident Hfq
binding and RNase E cleavage sites on mRNA and small regulatory RNAs." RNA
9(11): 1308-14.
Monzingo, A. F., J. Gao, J. Qiu, G. Georgiou and J. D. Robertus (2003). "The X-ray
structure of Escherichia coli RraA (MenG), A protein inhibitor of RNA
processing." J Mol Biol 332(5): 1015-24.
Morita, T., H. Kawamoto, T. Mizota, T. Inada and H. Aiba (2004). "Enolase in the RNA
degradosome plays a crucial role in the rapid decay of glucose transporter mRNA
in the response to phosphosugar stress in Escherichia coli." Mol Microbiol 54(4):
1063-75.
Morita, T., K. Maki and H. Aiba (2005). "RNase E-based ribonucleoprotein complexes:
mechanical basis of mRNA destabilization mediated by bacterial noncoding
RNAs." Genes Dev. 19: 2176-2186.
Mudd, E. A. and C. F. Higgins (1993). "Escherichia coli endoribonuclease RNase E:
autoregulation of expression and site-specific cleavage of mRNA." Mol Microbiol
9(3): 557-68.
Mudd, E. A., H. M. Krisch and C. F. Higgins (1990). "RNase E, an endoribonuclease, has
a general role in the chemical decay of Escherichia coli mRNA: evidence that rne
and ams are the same genetic locus." Mol Microbiol 4(12): 2127-35.

151
Nilsson, P. and B. Uhlin (1991). "Differential decay of a polycistronic Escherichia coli
transcript is initiated by RNaseE-dependent endonucleolytic processing." Mol.
Microbiol. 5: 1791- 99.
O'Hara, E. B., J. A. Chekanova, C. A. Ingle, Z. R. Kushner, E. Peters and S. R. Kushner
(1995). "Polyadenylylation helps regulate mRNA decay in Escherichia coli." Proc
Natl Acad Sci U S A 92(6): 1807-11.
Ono, M. and M. Kuwano (1979). "A conditional lethal mutation in an Escherichia coli
strain with a longer chemical lifetime of messenger RNA." J Mol Biol 129(3):
343-57.
Ow, M. C. and S. R. Kushner (2002). "Initiation of tRNA maturation by RNase E is
essential for cell viability in E. coli." Genes Dev 16(9): 1102-15.
Ow, M. C., Q. Liu and S. R. Kushner (2000). "Analysis of mRNA decay and rRNA
processing in Escherichia coli in the absence of RNase E-based degradosome
assembly." Mol Microbiol 38(4): 854-66.
Ow, M. C., T. Perwez and S. R. Kushner (2003). "RNase G of Escherichia coli exhibits
only limited functional overlap with its essential homologue, RNase E." Mol
Microbiol 49(3): 607-22.
Pittard, A. J. (1996). "in Escherichia coli and Salmonella: Cellular and Molecular
Biology, eds. Neidhardt, F. C., Curtis, R., III, Ingraham, J. L., Lin, E. C. C., Low,
K. B., Magasanik, B., Reznikoff, W. S., Riley, M., M., Schaecter, A. &
Umbarger, H. E." 1: 458-484.

152
Podkovyrov, S. M. and T. J. Larson (1995). "A new vector-host system for construction
of lacZ transcriptional fusions where only low-level gene expression is desirable."
Gene 156(1): 151-2.
Powell, B. S., M. P. Rivas, D. L. Court, Y. Nakamura and C. L. Turnbough (1994).
"Rapid confirmation of single copy lambda prophage integration by PCR."
Nucleic Acids Res 22: 5765-766.
Prud'homme-Genereux, A., R. K. Beran, I. Iost, C. S. Ramey, G. A. Mackie and R. W.
Simons (2004). "Physical and functional interactions among RNase E,
polynucleotide phosphorylase and the cold-shock protein, CsdA: evidence for a
'cold shock degradosome'." Mol Microbiol 54(5): 1409-21.
Py, B., H. Causton, E. A. Mudd and C. F. Higgins (1994). "A protein complex mediating
mRNA degradation in Escherichia coli." Mol Microbiol 14(4): 717-29.
Py, B., C. F. Higgins, H. M. Krisch and A. J. Carpousis (1996). "A DEAD-box RNA
helicase in the Escherichia coli RNA degradosome." Nature 381(6578): 169-72.
Qiu, J. (2001). Ph. D. Thesis. Austin, The University of Texas at Austin.
Qiu, J., J. R. Swartz and G. Georgiou (1998). "Expression of active human tissue-type
plasminogen activator in Escherichia coli." Appl Environ Microbiol 64(12): 4891-
6.
Ramelot, T. A., S. Ni, S. Goldsmith-Fischman, J. R. Cort, B. Honig and M. A. Kennedy
(2003). "Solution structure of Vibrio cholerae protein VC0424: a variation of the
ferredoxin-like fold." Protein Sci 12(7): 1556-61.
Raynal, L. C. and A. J. Carpousis (1999). "Poly(A) polymerase I of Escherichia coli:
characterization of the catalytic domain, an RNA binding site and regions for the

153
interaction with proteins involved in mRNA degradation." Mol Microbiol 32(4):
765-75.
Regnier, P. and E. Hajnsdorf (1991). "Decay of mRNA encoding ribosomal protein S15
of Escherichia coli is initiated by an RNase E-dependent endonucleolytic cleavage
that removes the 3' stabilizing stem and loop structure." J Mol Biol 217(2): 283-
92.
Regonesi, M. E., M. Del Favero, F. Basilico, F. Briani, L. Benazzi, P. Tortora, P. Mauri
and G. Deho (2005). "Analysis of the Escherichia coli RNA degradosome
composition by a proteomic approach." Biochimie.
Repoila, F. and S. Gottesman (2001). "Signal transduction cascade for regulation of
RpoS: temperature regulation of DsrA." J Bacteriol. 183(13): 4012-23.
Sauter, C., J. Basquin and D. Suck (2003). "Sm-like proteins in eubacteria: the crystal
structure of the Hfq protein from Escherichia coli." Nucleic Acids Res 31: 4091-
4098.
Schatz, P. J. (1993). "Use of peptide libraries to map the substrate specificity of a
peptide-modifying enzyme: a 13 residue consensus peptide specifies biotinylation
in Escherichia coli." Biotechnology (N Y) 11(10): 1138-43.
Schena, M., D. Shalon, R. W. Davis and P. O. Brown (1995). "Quantitative monitoring of
gene expression patterns with a complementary DNA microarray." Science
270(5235): 467-70.
Schlee, S., P. Beinker, A. Akhrymuk and J. Reinstein (2004). "A chaperone network for
the resolubilization of protein aggregates: direct interaction of ClpB and DnaK." J
Mol Biol 336(1): 275-85.

154
Schubert, M., R. E. Edge, P. Lario, M. A. Cook, N. C. Strynadka, G. A. Mackie and L. P.
McIntosh (2004). "Structural characterization of the RNase E S1 domain and
identification of its oligonucleotide-binding and dimerization interfaces." J Mol
Biol 341(1): 37-54.
Shineberg, B. and I. Young (1976). "Biosynthesis of bacterial menaquinones: the
membrane-associated 1,4-dihydroxy-2-naphthoate octaprenyltransferase of
Escherichia coli." Biochemistry 15: 2754-8.
Silverman, E., G. Edwalds-Gilbert and R. J. Lin (2003). "DExD/H-box proteins and their
partners: helping RNA helicases unwind." Gene 312: 1-16.
Simons, R. W., F. Houman and N. Kleckner (1987). "Improved single and multicopy lac-
based cloning vectors for protein and operon fusions." Gene 53(1): 85-96.
Singer, R. H. and S. Penman (1973). "Messenger RNA in HeLa cells: kinetics of
formation and decay." J Mol Biol 78(2): 321-34.
Soreq, H. and U. Z. Littauer (1977). "Purification and characterization of polynucleotide
phosphorylase from Escherichia coli. Probe for the analysis of 3' sequences of
RNA." J Biol Chem 252(19): 6885-8.
Steege, D. A. (2000). "Emerging features of mRNA decay in bacteria." Rna 6(8): 1079-
90.
Storz, G., J. A. Opdyke and A. Zhang (2004). "Controlling mRNA stability and
translation with small, noncoding RNAs." Curr Opin Microbiol 7(2): 140-4.
Suiter, A., O. Banziger and A. Dean (2003). "Fitness consequences of a regulatory
polymorphism in a seasonal environment." Proc Natl Acad Sci U S A. 100(22):
12782-6.

155
Suvarna, K., D. Stevenson, R. Meganathan and M. E. Hudspeth (1998). "Menaquinone
(vitamin K2) biosynthesis: localization and characterization of the menA gene
from Escherichia coli." J Bacteriol 180(10): 2782-7.
Tanner, N. K. and P. Linder (2001). "DExD/H box RNA helicases: from generic motors
to specific dissociation functions." Mol. Cell 8: 251-262.
Taraseviciene, L., A. Miczak and D. Apirion (1991). "The gene specifying RNase E (rne)
and a gene affecting mRNA stability (ams) are the same gene." Mol Microbiol
5(4): 851-5.
Tsao, K. L., B. DeBarbieri, H. Michel and D. S. Waugh (1996). "A versatile plasmid
expression vector for the production of biotinylated proteins by site-specific,
enzymatic modification in Escherichia coli." Gene 169(1): 59-64.
Typas, A. and R. Hengge-Aronis (2005). "Differential ability of sigma and sigma of
Escherichia coli to utilize promoters containing half or full UP-element sites."
Mol Microbiol 55: 250-260.
Vanzo, N. F., Y. S. Li, B. Py, E. Blum, C. F. Higgins, L. C. Raynal, H. M. Krisch and A.
J. Carpousis (1998). "Ribonuclease E organizes the protein interactions in the
Escherichia coli RNA degradosome." Genes Dev 12(17): 2770-81.
Wachi, M., G. Umitsuki, M. Shimizu, A. Takada and K. Nagai (1999). "Escherichia coli
cafA gene encodes a novel RNase, designated as RNase G, involved in processing
of the 5' end of 16S rRNA." Biochem Biophys Res Commun 259(2): 483-8.
Wah, D. A., I. Levchenko, T. A. Baker and R. T. Sauer (2002). "Characterization of a
specificity factor for an AAA+ ATPase: assembly of SspB dimers with ssrA-
tagged proteins and the ClpX hexamer." Chem Biol 9(11): 1237-45.

156
Warner, J. R. and C. Gorenstein (1978). "Yeast has a true stringent response." Nature
275(5678): 338-9.
Washburn, M. P., D. Wolters and J. R. Yates, 3rd (2001). "Large-scale analysis of the
yeast proteome by multidimensional protein identification technology." Nat
Biotechnol 19(3): 242-7.
Weber, H., T. Polen, J. Heuveling, V. F. Wendisch and R. Hengge-Aronis (2005).
"Genome-wide analysis of the general stress response network in Escherichia
coli: sigmaS-dependent genes, promoters, and sigma factor selectivity." J
Bacteriol. 187: 1591-603.
Weichart, D., R. Lange, N. Henneberg and R. Hengge-Aronis (1993). "Identification and
characterization of stationary phase-inducible genes in Escherichia coli." Mol.
Microbiol. 10: 407-420.
Xu, F. and S. N. Cohen (1995). "RNA degradation in Escherichia coli regulated by 3'
adenylation and 5' phosphorylation." Nature 374(6518): 180-3.
Yanofsky, C., E. W. Miles, K. Kirschner and R. Bauerle (1999). "in The Encyclopedia of
Molecular Biology, ed. Creighton, T. E." 4: 2676-2689.
Yao, X., A. Freas, J. Ramirez, P. A. Demirev and C. Fenselau (2001). "Proteolytic 18O
labeling for comparative proteomics: model studies with two serotypes of
adenovirus." Anal Chem 73(13): 2836-42.
Yi, E. C., X. J. Li, K. Cooke, H. Lee, B. Raught, A. Page, V. Aneliunas, P. Hieter, D. R.
Goodlett and R. Aebersold (2005). "Increased quantitative proteome coverage
with (13)C/(12)C-based, acid-cleavable isotope-coded affinity tag reagent and
modified data acquisition scheme." Proteomics 5(2): 380-7.

157
Zhan, X., J. Gao, C. Jain, M. J. Cieslewicz, J. R. Swartz and G. Georgiou (2004).
"Genetic analysis of disulfide isomerization in Escherichia coli: expression of
DsbC is modulated by RNase E-dependent mRNA processing." J Bacteriol
186(3): 654-60.
Zhang, A., K. M. Wassarman, C. Rosenow, B. C. Tjaden, G. Storz and S. Gottesman
(2003). "Global analysis of small RNA and mRNA targets of Hfq." Mol
Microbiol 50(4): 1111-24.
Zhang, X., L. Zhu and M. P. Deutscher (1998). "Oligoribonuclease is encoded by a
highly conserved gene in the 3'-5' exonuclease superfamily." J Bacteriol 180(10):
2779-81.
Zuo, Y. and M. P. Deutscher (2001). "Exoribonuclease superfamilies: structural analysis
and phylogenetic distribution." Nucleic Acids Res 29(5): 1017-26.

158
Vita
Meng Zhao was born in Henan, China on January 29, 1975, the daughter of
Fengqin Yao and Tieshan Zhao. She graduated with High Honors from Shanghai’s
Higher Education and received the degree of Bachelor of Medicine (equivalent of M.D.
in U.S.) in Clinic Medicine from Medical College of TongJi University, Shanghai, China,
in July 1998. She then entered Shanghai Second Medical University, Shanghai, China,
where she received the degree of Master of Medicine with a specialization in Biomedical
Science in July 2001. In August 2001 she entered the Graduate School of The
University of Texas at Austin to work towards her Doctorate in Cell and Molecular
Biology.
Permanent address: 302, 22, 177 Nong, TianShan Road, Shanghai, China, 200336
This dissertation was typed by the author.