Embed Size (px)
Citation preview

Copyright
by
Yoganand Mandali
2013

The Thesis Committee for Yoganand Mandali Certifies that this is the approved version of the following thesis:
Applications of microsimulation traffic data in infrastructure
construction projects using 3D/4D CAD models
APPROVED BY
SUPERVISING COMMITTEE:
William J.O’Brien
Randy B.Machemehl
Supervisor:

Applications of microsimulation traffic data in infrastructure
construction projects using 3D/4D CAD models
by
Yoganand Mandali, B.Tech
Thesis
Presented to the Faculty of the Graduate School of
The University of Texas at Austin
in Partial Fulfillment
of the Requirements
for the Degree of
Master of Science in Engineering
The University of Texas at Austin
May 2013

iv
Acknowledgements
I would like to express my sincere appreciation to Dr. William O’Brien for being my
advisor and for the privilege of working with him. I thank for his insights and advice
throughout my association with him and motivation to dig deep into research. I would
also like to thank Dr.Randy Machemehl for reviewing my thesis. Special thanks to
Ambareesha Nittala, Cameron Schmeits, Jean Goyat and Mason Gemar for their valuable
help in research as well as the case studies. I also wish to specially thank Nabeel Khwaja
for providing me this wonderful opportunity to work with CTR and for instilling the
stimulus in me to push the limits.
v
Abstract
Applications of microsimulation traffic data in infrastructure
construction projects using 3D/4D CAD models
Yoganand Mandali, M.S.E
The University of Texas at Austin, 2013
Supervisor: William J.O’Brien
Transportation projects often involve communication of project information
between diverse parties and have been a challenge with increasing complexity.
Communication, review and feedback are very important for planners,
builders/developers and traffic engineers for successful project execution. Past research
was successful in finding effective ways to communicate to stakeholders and improve
project performance. 3D/4D CAD modeling has been one among them which offers
potential benefits from planning to construction phase owing to its wide range of
capabilities. However, there is no single tool to analyze traffic conditions and changing
geometry during construction for reviewing and better decision-making. A methodology
to use DTA models as a source for traffic information and development of traffic
visualization during construction with microsimulation output is discussed in this thesis.
The benefits of adding traffic information to 3D/4D CAD models and some potential
areas of application are explored. Two case studies on TxDOT transportation

vi
construction projects are considered to explain the modeling and analysis for better
understanding of different phases of the projects. Also, a small construction scenario was
analyzed to validate the traffic data generated from DTA models for their use as an input
to microsimulation models.

vii
Table of Contents
List of Tables ......................................................................................................... xi
List of Figures ....................................................................................................... xii
List of Acronyms ................................................................................................. xvi
Chapter 1 Introduction .............................................................................................1
Readers guide ..................................................................................................2
Chapter 2 Literature Review ....................................................................................4
Project Development Process .........................................................................4
Planning and programming ....................................................................4
Preliminary design .................................................................................5
Environmental ........................................................................................5
Right of Way utilities .............................................................................5
PS&E development ................................................................................5
Letting ....................................................................................................6
Traffic Data in Different Phases of a Project ..................................................6
Project planning and design ...................................................................6
TMP planning ........................................................................................8
Construction and public information (PI) ..............................................9
Traffic Data Modeling ..................................................................................11
Planning models ...................................................................................12
Highway Capacity Manual (HCM) models .........................................12
Macroscopic simulation models ..........................................................13
Mesoscopic simulation models ............................................................13
Microscopic simulation models ...........................................................13
Chapter 3 Microsimulation Visualization ..............................................................16
Need For Microsimulation ............................................................................16
Microsimulation ............................................................................................17
General characteristics of microsimulation models .............................18

viii
Time steps ...................................................................................18
Randomization ............................................................................18
Vehicle generation ......................................................................18
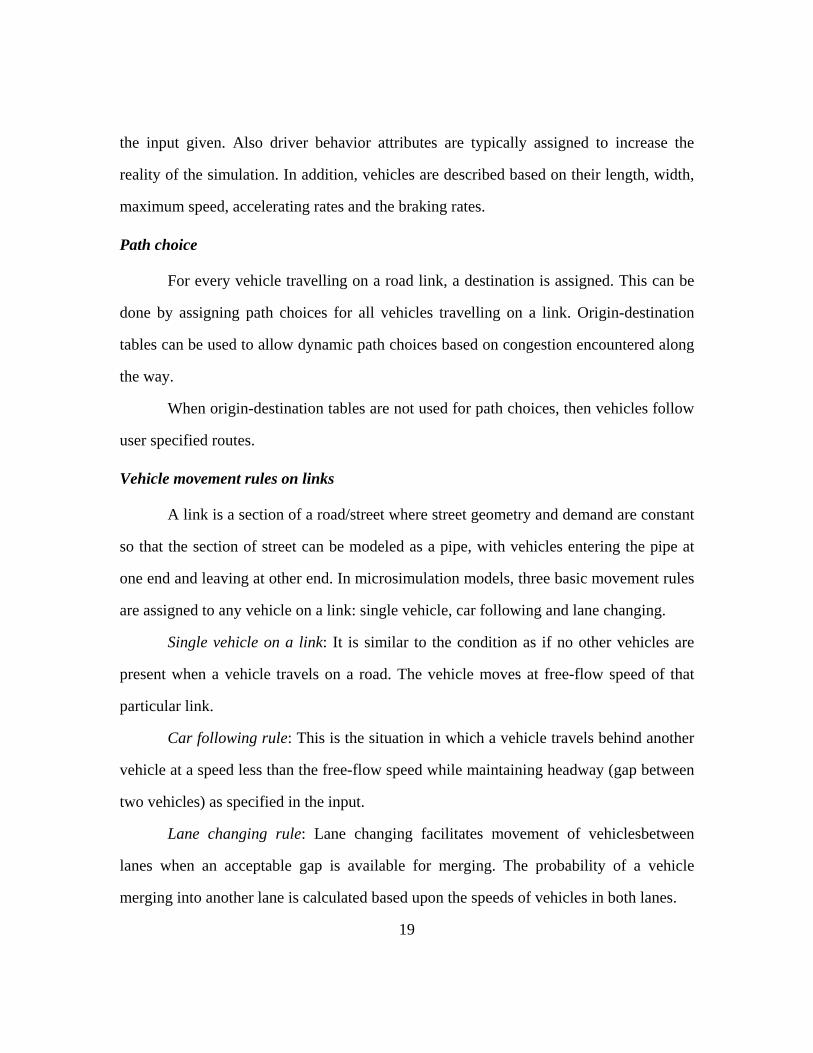
Path choice ..................................................................................19
Vehicle movement rules on links ................................................19
Vehicle movement rules within the intersection (at the node) ...20
Typical microsimulation analysis steps ...............................................20
Project scope ...............................................................................20
Data collection ............................................................................21
Model creation ............................................................................21
Error checking .............................................................................22
Calibration...................................................................................22
Alternative analysis .....................................................................22
Results .........................................................................................23
Traffic Visualization in Construction Projects .............................................24
Capabilities of 3D/4D CAD Modeling .........................................................26
Chapter 4 Research Methodology ..........................................................................31
Problem Statement ........................................................................................31
Anticipated benefits of traffic visualization in 3D/4D CAD models ............32
Methodology .................................................................................................33
Software ........................................................................................................34
Data Collection .............................................................................................34
Modeling & applications ...............................................................................36
Model development .............................................................................36
Using the model & validation ..............................................................37
Areas not modeled ........................................................................................38
Chapter 5 Case studies ...........................................................................................41
North Tarrant Express Project ......................................................................42
Overview ..............................................................................................42
Challenges ............................................................................................43
ix
Building 3D/4D CAD model ...............................................................44
Scope of the model......................................................................44
Terrain and context information .................................................45
Construction sequencing visualization .......................................45
North Beach Intersection .....................................................................49
Existing conditions......................................................................50
Construction scope ......................................................................51
Construction phasing ..................................................................52
Geometry models ........................................................................54
Traffic information models .........................................................55
Combining geometry and traffic models ....................................59
Visualization of construction phasing .........................................60
Using the models: .......................................................................74
Observations ...............................................................................79
FM 2347 George Bush Interchange Project ..................................................81
Overview ..............................................................................................81
Challenges ............................................................................................82
Use of 3D/4D CAD models for TMP ..................................................83
Use of 3D/4D models with traffic ........................................................84
Virtual reality ..............................................................................85
Virtual drive through...................................................................86
Observations ...............................................................................87
JW Marriott - Austin Downtown ..................................................................88
Overview ..............................................................................................88
Traffic control ......................................................................................89
Validation .............................................................................................90
Chapter 6 Conclusions ...........................................................................................95
Benefits .........................................................................................................95
Implementation Challenges ........................................................................100
Recommendations .......................................................................................101
x
Appendix ..............................................................................................................103
North Tarrant Express .................................................................................103
FM 2154 and George Bush Drive Intersection ...........................................105
JW Mariott Austin .......................................................................................110
References ............................................................................................................113

xi
List of Tables
Table 2.1: Usage of traffic information in various construction phases ................11
Table 2.2: Relevance of traffic analysis tools with respect to analytical context
(FHWA, 2004) ..................................................................................15
Table 3.1: Relevance of traffic analysis tool categories with facility types (FHWA,
2004) .................................................................................................17
Table 5.1 Vehicle turn movement counts observed at 2nd and 3rd street intersections
...........................................................................................................90
Table 5.2 Vehicle volumes for 2nd and 3rd street intersections in microsimulation
model.................................................................................................91
Table 5.3 Vehicle turn movement volumes for 2nd and 3rd street intersections in
microsimulation model .....................................................................91
Table 5.4 Vehicle volumes for 2nd and 3rd street intersections in microsimulation
model for construction scenario ........................................................91
Table 6.1 Summary table for TMP planning phase ...............................................97
Table 6.2 Summary table for Construction phase ..................................................98
xii
List of Figures
Figure 2.1 Overview of transportation analysis process (FHWA, 2004) ..............14
Figure 3.1 Microsimulation in 2D (Garrick et al, 2005) ........................................25
Figure 3.2 Microsimulation in 3D (Garrick et al, 2005) ........................................25
Figure 3.3 Traffic control measures for construction (Liapi et al, 2003) ..............28
Figure 4.1 Benefits of traffic visualization with 3D/4D CAD models ..................32
Figure 4.2 Flow chart for traffic visualization in 3D/4D CAD ..............................33
Figure 5.1 NTE project map (NTE, North Tarrant Express, 2012) .......................43
Figure 5.2 NTE project construction phasing plan ................................................46
Figure 5.3 NTE project 4D CAD visualization .....................................................46
Figure 5.4 4D animations being displayed during TxDOT public meeting (NTE,
2012) .................................................................................................47
Figure 5.5 Public viewing 4D CAD animations during public meetings (NTE, 2012)
...........................................................................................................48
Figure 5.6 Virtual reality renderings of proposed project after construction ........49
Figure 5.7 Google Maps® showing IH35/IH 820 intersection and N. Beach Street .
...........................................................................................................50
Figure 5.8 Google Maps® satellite view of existing N. Beach Street ...................51
Figure 5.9 Proposed expansion of N. Beach street ................................................52
Figure 5.10 Schedule showing pavement construction of N. Beach street ............53
Figure 5.11 Existing conditions of N. Beach Street...............................................60
Figure 5.12 South side of N. Beach intersection ...................................................61
Figure 5.13 North side of N. Beach intersection ...................................................61
Figure 5.14 Phase 1-A – South side of N. Beach intersection in TCP ..................63

xiii
Figure 5.15 Phase 1-A – South side of N. Beach intersection in 3D model ..........63
Figure 5.16 Phase 1-A – North side of N. Beach intersection in TCP ..................64
Figure 5.17 Phase 1-A – North side of N. Beach intersection in 3D model ..........64
Figure 5.18 Phase 1- A – Queuing on south bound N. Beach Street in 3D model 65
Figure 5.19 Phase 1-B – South side of N. Beach intersection in TCP ...................65
Figure 5.20 Phase 1-B – South side of N. Beach intersection in 3D model ..........66
Figure 5.21 Phase 1-B – North side of N. Beach intersection in TCP ...................66
Figure 5.22 Phase 1-B – North side of N. Beach intersection in 3D model ..........67
Figure 5.23 Phase 1-B – Queuing on south side of N.Beach intersection in 3D model
...........................................................................................................67
Figure 5.24 Phase 1-B – Queuing on north side of N. Beach intersection in 3D model
...........................................................................................................68
Figure 5.25 Phase 1-C – South side of N. Beach intersection in TCP ...................69
Figure 5.26 Phase 1-C – South side of N. Beach intersection in 3D model ..........69
Figure 5.27 Phase 1-C – North side of N. Beach intersection in TCP ...................70
Figure 5.28 Phase 1-C – North side of N. Beach intersection in 3D model ..........70
Figure 5.29 Phase 1-D – South side of N. Beach intersection in TCP ..................71
Figure 5.30 Phase 1-D – South side of N. Beach intersection 3D model ..............72
Figure 5.31 Phase 1-D – North side of N. Beach intersection in TCP ..................72
Figure 5.32 Phase 1-D – North side of N. Beach intersection in 3D model ..........73
Figure 5.33 Phase 1-D – Queuing on north side of N. Beach intersection in 3D model
...........................................................................................................73
Figure 5.34 Bar chart showing use of 3-D models with traffic in various phases of
project ...............................................................................................75
xiv
Figure 5.35 Pie chart showing use of 3D models with traffic in project planning phase
...........................................................................................................76
Figure 5.36 Pie chart showing use of 3D models with traffic in project design phase
...........................................................................................................76
Figure 5.37 Pie chart showing use of 3D models with traffic in TMP phase ........77
Figure 5.38 Pie chart showing use of 3D models with traffic in construction phase
...........................................................................................................77
Figure 5.39 Map overview of proposed George Bush and Wellborn Road intersection
...........................................................................................................81
Figure 5.40 4-D model showing construction phasing with one lane open (Goyat,
2012) .................................................................................................84
Figure 5.41 3D model with vehicle showing the expected traffic volume during this
phase of construction ........................................................................85
Figure 5.42 Virtual drive through showing planned future traffic conditions of the
project after finish of construction ....................................................87
Figure 5.43 Rendering of proposed JW Marriott hotel in Austin downtown ........89
Figure 5.44 Graphic denoting detours around JW Marriott hotel site ...................90
Figure 5.45 Bar chart comparing total volumes at 3rd street intersection from
microsimulation model and field vehicle counts ..............................92
Figure 5.46 Bar chart comparing left and through movements at 2nd street intersection
from microsimulation model and field vehicle counts .....................92
Figure 5.47 Image showing sink locations based on which vehicle volumes are
derived...............................................................................................93
Figure 7.1 Traffic data for the NTE project .........................................................103
Figure 7.2 Traffic data for the NTE project .........................................................104
xv
Figure 7.3 Traffic data for the FM 2154 project ..................................................105
Figure 7.4 Traffic data for the FM 2154 project ..................................................106
Figure 7.5 Traffic data for the FM 2154 project ..................................................107
Figure 7.6 Traffic data for the FM 2154 project ..................................................108
Figure 7.7 Average daily traffic volumes for FM 2154 project ...........................109
Figure 7.8 Traffic data for the JW Marriott project .............................................110
Figure 7.9 Traffic data for the JW Marriott project .............................................111
Figure 7.10 Traffic data for the JW Marriott project ...........................................112
xvi
List of Acronyms
AASHTO American Association of State Highway and Transportation Officials
CAD Computer Aided Design
DOT Department of Transportation
DTA Dynamic Traffic Assignment
FHWA Federal Highway Administration
HCM Highway Capacity Manual
ITS Intelligent Transportation System
MUTCD Manual of Uniform Traffic Control Devices
NTE North Tarrant Express
PS&E Plans Specifications and Engineering
PI Public Information
ROW Right of Way
TCP Traffic Control Plan or Traffic Control Planning
TMP Traffic Management Plan or Traffic Management Planning
TxDOT Texas Department of Transportation
VPD Vehicles Per Day
1
Chapter 1 Introduction
The thesis aims at assessing the applications of 3-Dimensional and 4-Dimensional
Computer Aided Design (CAD) models combined with traffic data in different phases of
transportation infrastructure construction projects by addressing planning, review and
communication of proposed project plans.
Transportation projects involve construction activities taken up hand-in-hand with
moving traffic on most of the projects. Effective maintenance of traffic is essential to
ensure safety in construction work sites and mobility of the road users. Efficient co-
ordination among transportation planners, design engineers, Traffic Management
Planning (TMP) personnel and construction crew is necessary to accomplish these
objectives.
Construction of highway projects involve high level of geometric complexity;
traffic planning that gets changed continually with changing geometric configuration and
complex project management involving multiple stakeholders from builders/ contractors
to public and government. To facilitate better decision making and project execution of
highway planning & construction, many tools are currently being employed to maintain
smooth flow of traffic when construction is being carried out. Some of them are
microsimulations, 3D/4D CAD models and other techniques. Project area traffic
visualization along with proposed project geometry using 3D/4D CAD models can help
better understanding of projects and identify challenges related to planning, construction
phasing and traffic management which are overlooked by the tools that are currently
being used.

2
READERS GUIDE
This thesis is comprised of six chapters. The following chapter introduces various
phases in a transportation construction project. More detailed explanation is given on
importance of traffic information during various project phases, identifying the type of
information needed and how it can be used. Later, it describes briefly different types of
traffic analysis tools that are currently used to model traffic conditions and their prime
characteristics.
Chapter 3 explains the need for microsimulation and its advantages over other
traffic analysis tools. It also describes general characteristics of microsimulation and how
microsimulation analysis is done. Further, literature to support the need for traffic
visualization in construction projects is presented with current practices being followed.
The chapter ends with a recap on the applications of 3D/4D CAD models that are put
forth in past research and discusses the scope of using traffic information with CAD
models.
Chapter 4 describes the problem statement and research methodology adopted for
this thesis to address the issues explained in the problem statement. The chapter mainly
concentrates on the methodology adopted to collect traffic data from mesoscopic
Dynamic Traffic Assignment (DTA) models, signal timing plan and other traffic related
information. The modeling process is explained and the areas which are not covered
under the scope of this analysis are also explained. Finally, the software used for each
step of modeling is listed.
Chapter 5 is comprised of three case studies – two TxDOT projects illustrating the
applications of 3D/4D CAD models with traffic data in various phases of construction
and one case study to validate the vehicle volumes generated for microsimulation model
from DTA models. The first case study, North Tarrant Express project illustrates

3
applications during construction phase after schedule and Traffic Control Plans (TCP) are
fully developed. The next case study, FM 2154 and George Bush Drive Intersection
project shows how these models can be used to communicate TMP planning accurately
during planning & design phase to the stakeholders. Final case study is the construction
of JW Marriott hotel in downtown Austin. Detours are analyzed in traffic analysis tools
and compared with vehicle counts on field for validation.
Chapter 6 covers conclusions from the research and provides recommendations
for future work on the topic.

4
Chapter 2 Literature Review
Roadway construction projects involve many phases and are spread across many
disciplines. For proper execution of a roadway project, diverse information is required
viz., Right of Way (ROW) data, utility locations, traffic counts/peak hour durations etc.,
besides the geometry details for the proposed construction. This chapter tries to capture
the importance of traffic information in major phases of roadway construction projects.
This chapter is important to understand the activity during each phase of a project and the
role of traffic information particular to that place. The types of traffic information
required and the intended audience for each phase are described. Subsequently, a brief
explanation is given regarding the traffic analysis tools that are being used for traffic
analysis by various transportation agencies.
PROJECT DEVELOPMENT PROCESS
As per TxDOT manuals (TxDOT, Manual Notice 2012-1, October, 2012), a
project development process consists of the following steps:
• Planning and Programming
• Preliminary Design
• Environmental
• Right of way and Utilities
• Plans Specifications and Engineering (PS&E) development
• Letting
Planning and programming
The need for roadway development and expansions is identified and authorization
is sought from concerned authorities. Scope of the project is defined for planning
compliance and submitted for construction funding.

5
Preliminary design
Considering the planning information, design concept of the project is framed
during this phase and the resultant preliminary schematics are put forth for approval.
Public meetings are held to seek approval of the preliminary schematics and feedback is
used to further refine the schematics.
Environmental
Preliminary environmental clearances are sought for the preliminary designs after
collecting environmental data of the proposed layout and its impact on nearby natural
resources like waterways and floodplains is assessed. Environmental documentation
stating all the survey information for the project need and its impact is filed and
submitted for interagency coordination/permits.
Right of Way utilities
During this phase, preliminary right of way research is done with the District
Right of Way office and required information is gathered. Boundaries of the existing
ROW are established. Identification of parcels that are to be acquired for new ROW is
done and owners of the property (residents and business owners) are helped with
relocation assistance. Existing utilities are identified and cross-checked with as-built
plans for any relocations during operations.
PS&E development
Detailed design is performed during this phase. All the required information from
previous phases like traffic data, right of way maps, as-built plans, utilities data and other
information are pooled to complete the geometry configuration of the proposed project.
Traffic control planning is also done during this phase to facilitate efficient construction
and maximize mobility/safety during construction. Alignments and profiles are finalized

6
based on hydraulic data collected. Further, roadway and bridge design is done including
signal planning, signing/striping and intelligent transportation systems. Utilities like
drainages, culverts, retaining walls are also designed for construction.
Letting
Review of PSE’s is performed by factoring in the traffic operations, construction
and general services and FHWA before issuance of construction bids. Funding approval
and PS&E are sought before concluding the final proposal for the project. The contract is
awarded after bid review. The construction phase follows after the bid is awarded.
TRAFFIC DATA IN DIFFERENT PHASES OF A PROJECT
Based on the above project phases, author arrived at a conclusion that the role of
traffic information in decision making can be grouped and analyzed under the following
phases after conducting interviews with TxDOT officials and researchers in Centre for
Transportation Research (CTR):
• Project planning
• Design alternatives
• TMP planning
• Construction & Public Information
Project planning and design
Project planning is a fundamental and challenging activity in the management and
execution of highway projects. Highway construction and other infrastructure projects are
very sensitive as their execution impacts public convenience. Detailed planning is needed
to reduce the impact of lane closures and delays on the commuters as well as residents in
the vicinity of project work zones (O'Brien et al, 2012). Traffic data is necessary to
analyze the extent of improvements to be made to existing facilities, the impact due to

7
construction on existing road networks and future capacities of the transportation
systems. Many DOT’s use ITS traffic data to plan the lane closure schedule during
construction and maintenance to reduce the impact on motorists. Hourly traffic
volumeand/or speed data can tell when lanes should be closed and re-opened(Yu &
Fengxiang, 2002). Hourly traffic volumes are also of value for pavement and bridge
maintenance to determine the degree of infrastructure usage to estimate maintenance
needs.
Needs for transportation projects is triggered by the estimation of future travel
demands using traffic modeling and comparing them with current travel demand data
(TxDOT, 2012). Depending on the requirement, the traffic data may include daily counts,
vehicle classification, speeds, weights, directional factor, truck factor, and design hour
factor. This data is typically needed for plans leading to construction, traffic
improvements and pavement maintenance projects. Traffic forecasting data is also
required for reconstruction, resurfacing, adding lanes, bridge replacement and major
interchange improvement projects(FDOT, 2012). Traffic data reflects the effect of future
traffic growth relative to historical trends, the addition of major development, the
diversion of traffic to nearby facilities and the impact of capacity constraints.
The design of a road or any part thereof should be based upon factual data, among
which are those relating to traffic. Cost, quality of foundations, availability of materials,
and other factors have an important bearing on the design, but traffic indicates the service
for which the road is being built and directly affects the geometric features of design such
as width, alignment, grades, etc. Traffic information serves to establish the "loads" for
geometric road design.

8
TMP planning
The aging of roadways and highways periodically requires reconstruction,
maintenance and repair which result in construction work zones. Also, expansion of
transportation systems often involves construction activity on an operating network
where construction has to be carried out when the roadways are open to motorists. In
addition, roadway traffic volumes are increasing rapidly even though the transportation
system capacity is not. This results in added complexity in the execution of construction
activities in an operating roadway facility. Considering the delays caused by the
construction projects and safety concerns in the work zones, the Federal Highway
Administration (FHWA) passed a regulation in 2004 to develop Transportation
Management Plans (TMP) for road construction and maintenance projects (U.S.
Department of Transportation Federal Highway Administration Office of Operations,
2005).
As defined by FHWA, “TMP lays out a set of coordinated strategies and describes
how these strategies will be used to manage the work zone impacts of a project. The
scope, content, and level of detail of a TMP may vary based on the agency’s work zone
policy and the anticipated work zone impacts of the project.”(Federal Highway
Administration, U.S. DOT, 2010). A TMP contain mitigation strategies to help in
minimizing impacts such as delay and to provide safety in and around work zones. TMPs
temporary traffic control plans. Some major projects may also contain transportation
operations and public information components where greater impacts to safety and
mobility are anticipated.
The efficiency of highway construction operations highly depends on appropriate
traffic control measures taken throughout the project execution. Traffic control planning
(TCP) should be taken-up hand-in-hand with construction activity planning and

9
scheduling. Improper handling of traffic in the workzone can result in schedule delays
due to traffic conflicts with construction operations, unexpected costs due to delays and
most importantly, safety issues to the construction crews and commuters in the work zone
(Russell et al, 1992). Research has suggested that studies should be performed on site
characteristics and traffic patterns in the work zone to schedule the activities better and
reduce costs. It was also emphasized that traffic analysis should begin during the
planning phase with inputs from construction (Anderson et al, 1999).
Existing and future traffic conditions are required to develop project TCP. For the
project area, the typical data needed will be- existing roadway characteristics (history,
roadway classification, number of lanes, geometrics, urban/suburban/rural), existing and
historical traffic data (volumes, speed, capacity, volume/capacity, percent trucks, queue
length, peak traffic hours), existing traffic operations (signal timing, traffic controls),
traffic growth rates (for future construction dates), and traffic predictions during
construction (volume, delay, queue). Construction phasing and staging greatly affect the
safety and mobility of work zones. TMP planners consult with traffic engineers and
traffic operations personnel to obtain the aforementioned data for developing construction
phasing/staging plans (U.S. Department of Transportation Federal Highway
Administration Office of Operations, 2005). Hence, it can be said that existing and
predicted future traffic data plays an important role in formulating and implementating
TCPs in project work zones.
Construction and public information (PI)
Public information to road users and the nearby community forms an important
component of the project team’s efforts to reduce work zone impacts by providing zone
specific and updated information. This not only improves safety conditions for

10
construction workers in the work zone but also mitigates potential impacts on both safety
and the level of service of the commuters while using the road in the construction zone
(U.S. Department of Transportation Federal Highway Administration Office of
Operations, 2005).
In addition to the travel lane information (partial and complete lane closures),
traffic data also plays an important role in conveying the workzone information to
commuters. DOT’s collect traffic volumes in project work zones to assess the peak
volume hours. Motorists can be encouraged to use alternative routes or plan trips to avoid
the peak traffic hoursso that congestion can be managed effectively during the project
construction. Based on historical data, travel demand is predicted for the work
zone.However, if the collected traffic volumes are higher than the predicted, travel speeds
in the work zone can be assessed with the real-time data and disseminated in regular
intervals corresponding to the changing traffic. Travel times and construction delays can
also be conveyed to motorists in the work zone to enforce appropriate driving and travel
behavior (Mai, 2009).
From the above discussion, the importance of traffic information and phases ofthe
project where it can be used in different phases of project can be tabulated as

11
Challenges Conceptual
Planning
Design
alternatives
TMP
Planning
Construction
Communication
Traffic control
Workzone management
Legend:
- Major relevance to the phase
- Minor relevance to the phase
Table 2.1: Usage of traffic information in various construction phases
TRAFFIC DATA MODELING
The Intermodal Surface Transportation Efficiency Act (ISTEA) has legislated
deployment of sophisticated hardware and software system management methodologies
to predict and evaluate various improvement plans without the inconvenience of a field
experiment, to manage traffic and control the existing roadway networks
capacity(FHWA, 2004). Traffic analysis tools were developed using software packages,
methodologies and procedures for
• Simulating and optimizing the operations of transportation facilities and
systems
• Modeling existing operations and predicting probable outcomes for proposed
design alternatives
• Evaluating various analytical contexts, including planning, design, and
operations/construction.
Traffic analysis tools are being used by practitioners to
• Improve decision making process

12
• Evaluate and prioritize planning/operational alternatives
• Improve design and evaluate time and costs
• Reduce disruptions to traffic
• Present strategies to the public/stakeholders
• Operate and manage existing roadway capacity
• Monitor performance of existing facilities
Different types of traffic operations analysis tools that are commonly employed are
(Dowling et al, 2002):
Planning models
Planning tools allow for the evaluation of specific projects or alternatives without
conducting an in-depth engineering analysis. Such techniques are primarily used to
prepare preliminary budgets and proposals, and are not considered to be a substitute for
the detailed engineering analysis often needed later in the project implementation
process. Sketch-planning approaches are typically the simplest and least costly of the
traffic analysis techniques. Sketch-planning tools perform some or all of the functions of
other analytical tool types, using simplified analyses techniques and highly aggregated
data. However, such techniques are usually limited in scope, analytical robustness, and
presentation capabilities.
Highway Capacity Manual (HCM) models
HCM models are designed for operations analysis of isolated segments and points
of transportation systems. These models are good for predicting capacity, density, speed
and delay, but are less accurate at predicting the extent of congestion and queuing that
may occur when demand exceeds capacity.

13
Macroscopic simulation models
Macroscopic simulation models are based on the deterministic relationships of the
flow, speed, and density of the traffic stream. The simulation in a macroscopic model
takes place on a section-by-section basis rather than by tracking individual vehicles.
Macroscopic models have considerably fewer demanding computer requirements than
microscopic models. However, they do not have the ability to analyze transportation
improvements in as much detail as the microscopic models.
Mesoscopic simulation models
Mesoscopic simulation models combine the properties of both microscopic
(discussed below) and macroscopic simulation models. As in microscopic models, the
mesoscopic models’ unit of traffic flow is the individual vehicle. Their movement,
however, follows the approach of the macroscopic models and is governed by the average
speed on a particular route. In this casse, travel simulation takes place on an aggregate
level and does not consider dynamic speed/volume relationships. As such, mesoscopic
models provide less reliability than the microsimulation tools, but are superior to the
typical planning analysis techniques.
Microscopic simulation models
Microscopic models simulate the movement of individual vehicles based on car-
following and lane-changing theories. Typically, vehicles enter a transportation network
using a statistical distribution of arrivals (a stochastic process) and are tracked through
the network over small time intervals (e.g., 1 second or a fraction of a second). Typically,
upon entry, each vehicle is assigned a destination, a vehicle type, and a driver type.
Computer time and storage requirements for microscopic models are large, usually
limiting the network size and the number of simulation runs that can be completed.
14
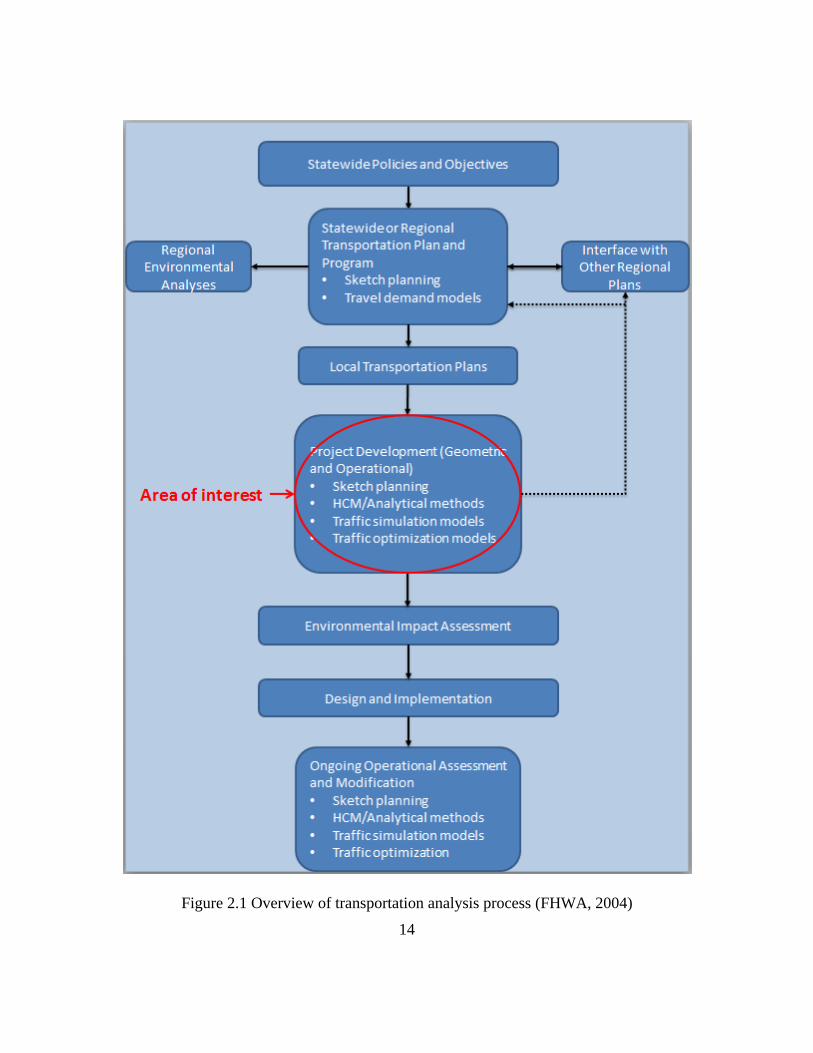
Figure 2.1 Overview of transportation analysis process (FHWA, 2004)

15
Figure 2.1 presents an overview of the transportation analysis process, along with
its various evaluation contexts and the types of traffic analysis tools that are typically
used in each context. It can be seen that project development usually involves the
application of more rigorous and detailed techniques, such as traffic simulation and
optimization.
Among the types of traffic analysis tools described, Table 2.2 presents the general
relevance of each tool category for each analytical context including planning, design,
and operations/construction.
Legend: ● Specific context is generally addressed by the corresponding analytical tool/methodology.
F Some of the analytical tools/methodologies address the specific context and some do not.
The particular analytical methodology does not generally address the specific context.
N/A The particular methodology is not appropriate for use in addressing the specific context.
Table 2.2: Relevance of traffic analysis tools with respect to analytical context (FHWA, 2004)
16
Chapter 3 Microsimulation Visualization
NEED FOR MICROSIMULATION
The traditional models like macroscopic models and mesoscopic models are
generally ineffective in evaluating strategies designed to influence travel choices and
optimize system performance. Also, they cannot capture traffic dynamics, intersection
control delays, vehicle-pedestrian interactions, geometric design impacts or traveler-
specific responses to route-guidance systems. Microscopic models overcome these
limitations through their ability to model detailed system operations and analyze the
management strategies, when provided with details about transportation facilities and
observed travel behavior. The use of microscopic models is warranted for their
capabilities to simulate, analyze and visualize congested traffic conditions. Visual
animation of the traffic conditions can help to increase understanding of the modeling
process and demonstrate to the key stakeholders (Sbyati & Roden, 2010).
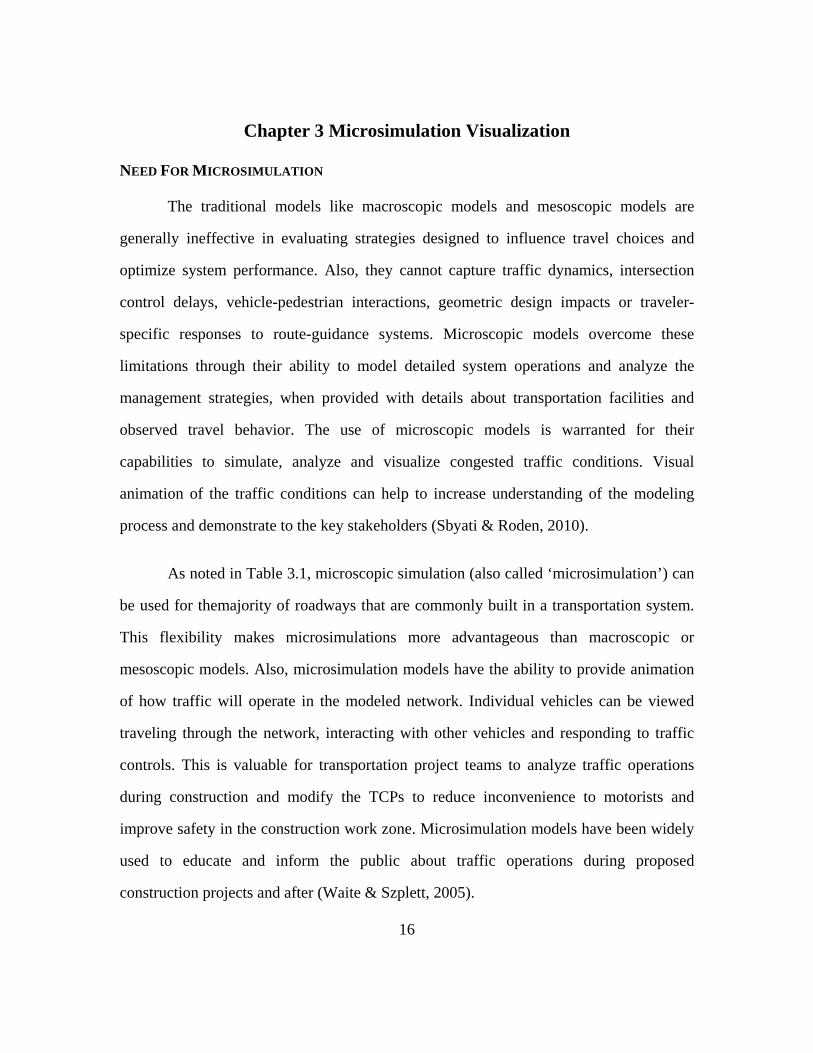
As noted in Table 3.1, microscopic simulation (also called ‘microsimulation’) can
be used for themajority of roadways that are commonly built in a transportation system.
This flexibility makes microsimulations more advantageous than macroscopic or
mesoscopic models. Also, microsimulation models have the ability to provide animation
of how traffic will operate in the modeled network. Individual vehicles can be viewed
traveling through the network, interacting with other vehicles and responding to traffic
controls. This is valuable for transportation project teams to analyze traffic operations
during construction and modify the TCPs to reduce inconvenience to motorists and
improve safety in the construction work zone. Microsimulation models have been widely
used to educate and inform the public about traffic operations during proposed
construction projects and after (Waite & Szplett, 2005).
17
Legend:
Specific content is generally addressed by the corresponding analytical tool/methodology
Some of the analytical tools/methodologies address the specific content and some do not
Table 3.1: Relevance of traffic analysis tool categories with facility types (FHWA, 2004)
MICROSIMULATION
Microsimulation is a dynamic and stochastic modeling of individual vehicle
movements within a system of transportation facilities. Each vehicle is moved through
the network of transportation facilities on a split second by split second basis according to
the physical characteristics of the vehicle, fundamental rules of motion and rules of driver
behavior (Dowling et al, 2002).

18
Microsimulation typically includes a combination of procedures for identifying
the location, speed and acceleration of vehicles in the highway network at each moment
of time. A set of relatively simple rules is used to move the vehicles through the network.
Statistics are tabulated on the vehicle activity, and two outputs are generally produced –
text reports and visual animations.
General characteristics of microsimulation models
Time steps
The simulation of vehicle movements is done in a series of time steps. The
vehicle position, velocity, and rate of acceleration/deceleration are computed at the end of
each time step andsummary statistics are collected on the results.The number of time
steps per second influences both the accuracy and duration of a microsimulation model
run. The more time steps per second, the greater the potential precision of the model
results.
Randomization
Microsimulation models are to be randomized for better results as they produce
the same pattern and represent similar behavior in all the runs without randomization.
Computer software uses a random number generator to generate each set of random
numbers. The generator requires a starting number, or “seed” to produce a unique
sequence of numbers. Different seed numbers can be used to vary performance of the
model.
Vehicle generation
Vehicles are generated by the simulation, at the start of each step in the
microsimulation. Vehicles are generally released from the start or end of a link based on
19
the input given. Also driver behavior attributes are typically assigned to increase the
reality of the simulation. In addition, vehicles are described based on their length, width,
maximum speed, accelerating rates and the braking rates.
Path choice
For every vehicle travelling on a road link, a destination is assigned. This can be
done by assigning path choices for all vehicles travelling on a link. Origin-destination
tables can be used to allow dynamic path choices based on congestion encountered along
the way.
When origin-destination tables are not used for path choices, then vehicles follow
user specified routes.
Vehicle movement rules on links
A link is a section of a road/street where street geometry and demand are constant
so that the section of street can be modeled as a pipe, with vehicles entering the pipe at
one end and leaving at other end. In microsimulation models, three basic movement rules
are assigned to any vehicle on a link: single vehicle, car following and lane changing.
Single vehicle on a link: It is similar to the condition as if no other vehicles are
present when a vehicle travels on a road. The vehicle moves at free-flow speed of that
particular link.
Car following rule: This is the situation in which a vehicle travels behind another
vehicle at a speed less than the free-flow speed while maintaining headway (gap between
two vehicles) as specified in the input.
Lane changing rule: Lane changing facilitates movement of vehiclesbetween
lanes when an acceptable gap is available for merging. The probability of a vehicle
merging into another lane is calculated based upon the speeds of vehicles in both lanes.

20
Vehicle movement rules within the intersection (at the node)
Vehicles can be ordered to facilitate which lane vehicles have higher preference at
controlled intersections. The vehicle speed can also be altered at an intersection. The
reduced speed may be customized to a particular turn movement.
Examples of Microsimulation software are: CORSIM, VISSIM, Simtraffic,
andTransmodeler. These software are capable of stochastically modeling individual
vehicle movements as function of time and space.
Typical microsimulation analysis steps
1. Project scope
2. Data collection
3. Model creation
4. Model checking
5. Calibration
6. Alternatives testing
7. Results
Before starting a microsimulation it is recommended to assess exactly what the
analysis is to accomplish. In order to achieve this, identifying the project objectives,
scope of the project and appropriate approach is very important.
Project scope
Project scope is needed to set the geographic and temporal bounds of the analysis,
the temporal bounds of the analysis, the range of alternatives to be tested and the
numerical output to be produced. A microsimulation in general has moderately large
geographic bounds and a user defined time frame.

21
Data collection
Data collection involves collecting the necessary input data for microsimulation
model and the output data to calibrate the model.
The required model input data are:
• Geometry – Lanes, curvature
• Controls – Signal timing, signs
• Existing demands – Traffic flows, turn movements
Data collection also includes use of aerial photos, agency files and field
measurements to obtain the input data. The scope of the model defined by area
boundaries, intersections and highway segments is also identified. Intersection and
highway segment geometry can be obtained from aerial photos and field inspection.
Signal control data can be obtained from the agency operations/TCP files.
Existing demand and turning movements at intersections can be measured in the
field or can be extracted from operational DTA models.
Model creation
In this step the data collected on network geometry, control and demands is input
into the microsimulation model. The basic steps of modeling are:
• Model network geometry (lanes, lengths, etc.)
• Model control data (signs, signal timing)
• Model demands
In brief, modeling can be summarized as:
• Import and size overlay image (aerial photo or as-built CAD file) for
network creation as per the right co-ordinates
• Rough drafting of links and node locations over aerial photo
• Create link attributes(lanes, free-flow speeds)

22
• Create intersection attributes (control type, control parameters, turn lane
designations, stop bars, turn pockets)
• Create source/sink zones or nodes
• Createroute attributes and origin-destination tables/vehicle flows
• Review/Revise default global parameters (vehicle characteristics, vehicle
mix etc.)
Error checking
The initial network coding for the microsimulation model is checked in this step.
The steps followed in error checking are:
• Check routing attributes for proper vehicle movements as intended
• Review intersection attributes for turn movements
• Review demand inputs at the start of links
• Run model at very low volumes to identify errors
• Trace selected vehicles through the network
Calibration
Calibration is determining if the simulation model is reasonably consistent with
the real scenario. The calibration process involves error checking to make sure that the
inputs and default values of the fixed parameters are assigned as desired. The most
frequently used approach is to collect field data for the network of interest and compare
model results with the field data. The model is then tuned against this data if any
discrepancies are identified.
Alternative analysis
The model is run to test various alternatives. Coding of alternatives and testing
involves some baseline forecast of future demand. The existing network is then edited for
23
each alternative. Finally, the model is run numerous times for each alternative and
statistics are gathered from the model reports.
Results
Microsimulation results can be represented in numerical or graphical format.
Most of the existing microsimulation software supports graphical representation of a road
network with vehicles. Numerical results can be reported in text files with accumulated
statistics on the performance of the network. Presentation of results depends upon the
intended audience for the simulation. Traffic engineers can understand reports generated
in text files for review of vehicle simulation whereas for the non-technical audience like
public and government bodies, results can be shown in graphical/animation format.
The effective presentation of traffic impacts to the public is an essential part of the
approval process for proposed transportation changes. Many transportation agencies use
the results of a microsimulation program as a basic data source that is combined with
corresponding visual aids to create technically effective and more appealing presentations
(Garrick et al, 2005).
Microsimulation models are mainly used to investigate the operational effects of
the geometric design of the proposed project. They can be used to analyze route location,
planning of alternatives and support decision-making process. The same thing can be
applied to construction too. A visual representation of traffic that can be imported from
microsimulation to CAD models can help one to reproduce the actual traffic conditions in
construction work zones and also the accurate geometry at any point of interest.
However, traffic simulation requires extensive manual labor to input the different kinds
of traffic data into simulation programs.

24
TRAFFIC VISUALIZATION IN CONSTRUCTION PROJECTS
A significant difference between construction scheduling for standard projects
and highway interchange projects is that the construction phasing of the latter is directly
related to the traffic planning. Accordingly, contemporary and future tools should allow
for the integration of traffic planning, and effective communication of traffic control
decisions. It should also allow for the visual evaluation of various traffic control options
during project construction(Liapi et al, 2003).
Traffic simulation visualization provides the capability to view traffic information
that is output from various traffic analysis tools, added to a 3D model and can be
displayed as animation. Traffic analysis tools can provide data in 2D or in 3D space.
Visualizing the traffic simulation enables project teams to evaluate the traffic
performance of the design within the virtual models, without waiting for the construction
to begin. Instead of evaluating the numerical traffic data and geometric design separately,
combining visualization of the output from traffic microsimulation models and 3D
geometric models will result in a real-time simulation demonstrating not only the project
configuration but also the future behavior of the traffic realistically. The 3D simulation of
moving vehicles can also be valuable when the proposed designs are visualized from the
driver’s perspective with fully-loaded traffic conditions (FHWA, 2010).
Traffic visualization can be implemented in either 2D or 3D space. Figure 3.1
shows an example of traffic simulation of a proposed roadway improvement based on a
2D model. The background image is imported from a digital photograph. The proposed
roadway (intersections, number of lanes etc.) is overlaid on the background image.
Traffic simulation in 2D can reflect the actual traffic volumes, vehicles, roadway
geometry and signal control plan used in the design. Traffic simulation in 3D can also be
implemented as shown in Figure 3.2. In addition to features of 2D traffic simulation,

25
background detail such as sky, trees, buildings etc., can be added for life-like realism. 3-
D traffic simulation can include not only the views of traffic and geometry but also the
driver perspectives through when driving through the project area.
Figure 3.1 Microsimulation in 2D(Garrick et al, 2005)
Figure 3.2 Microsimulation in 3D(Garrick et al, 2005)

26
2D traffic simulation can reach a medium level of visual realism using CAD
drawing or aerial photographs as background images. The loss of realism is due to
rudimentary road geometric features (such as intersection, median) that are typically
generated by traffic simulation software and loss of perspective view of the roadway
geometry. Visualization of traffic in 3D (figure 3.2) within a microsimulation program
does not perform much better than 2D visualization. This is due to relative simple 3D
modeling in the traffic simulation software compared to the 3D engineering software that
are being employed for project visualization. (Wang, 2005). Photorealistic 3D
visualization is generally developed from a standpoint of enabling the involved
stakeholders (both engineering and non-engineering) to arrive more quickly at a common
understanding of the more ‘physical’ elements of a proposed design (e.g., geometric
design elements, spatial location, likely visual appearance from the standpoint of
different users, signing, surface markings, etc.). The absence of photo realistic detailing
in microsimulation graphic outputs orients the audience to focus more on the operational
effects of designs, while highly realistic visual simulations can improve the
comprehensive understanding of a proposed facility. Previous research had strongly
recommended the merger of analytical microsimulation modeling and visual simulations
like CAD models to enable highly realistic, real time, graphic output capabilities (Hughes
et al, 2007). In addition, 3D visualization with geometrical accuracy may enable the
detection of potential errors in simulation results, which is hard to achieve with tables and
2D maps.
CAPABILITIES OF 3D/4D CAD MODELING
The transportation industry has been benefitting from 3D modeling in many ways
(Gau, 2009). Unlike building and other vertical construction projects, transportation

27
projects have a wide area of impact be it Right of Way (ROW) acquisition, level of
service to the motorists in the project area and local business that get affected. The
visualization capabilities of 3D models were instrumental in receiving public approval for
infrastructure projects during public meetings and between State Departments of
Transportation (DOT’s) and the public (Gau, 2009). 3D/4D CAD models also play a
prominent role in improving communication and understanding of the project in both the
design and construction phases. During the construction phase, CAD models are used for
detecting spatial conflicts and utility conflicts which are difficult to identify using
traditional 2D drawings(Schmeits, 2011). Using 4D models, other project aspects like
ROW acquisition, work sequencing and traffic phasing may also be reviewed, and
potential delays can be avoided pro-actively. 3D and 4D CAD models also proved to be a
valuable asset in work area management pertaining to placement of equipment and
material logistics (O’Brien et al, 2012).
During the construction of a highway interchange project, the continuously
changing geometric configurations affect traffic planning decisions and complicate the
overall project management. Without a good understanding of the changing 3D geometry
of the structure during construction, traffic control strategies are difficult to optimize and
implement effectively (Liapi et al, 2003). 3D/4D CAD models, which are effective in
communicating project planning and schedule information, should also allow for the
integration of traffic planning and visual evaluation of various traffic control options
during project construction.
28
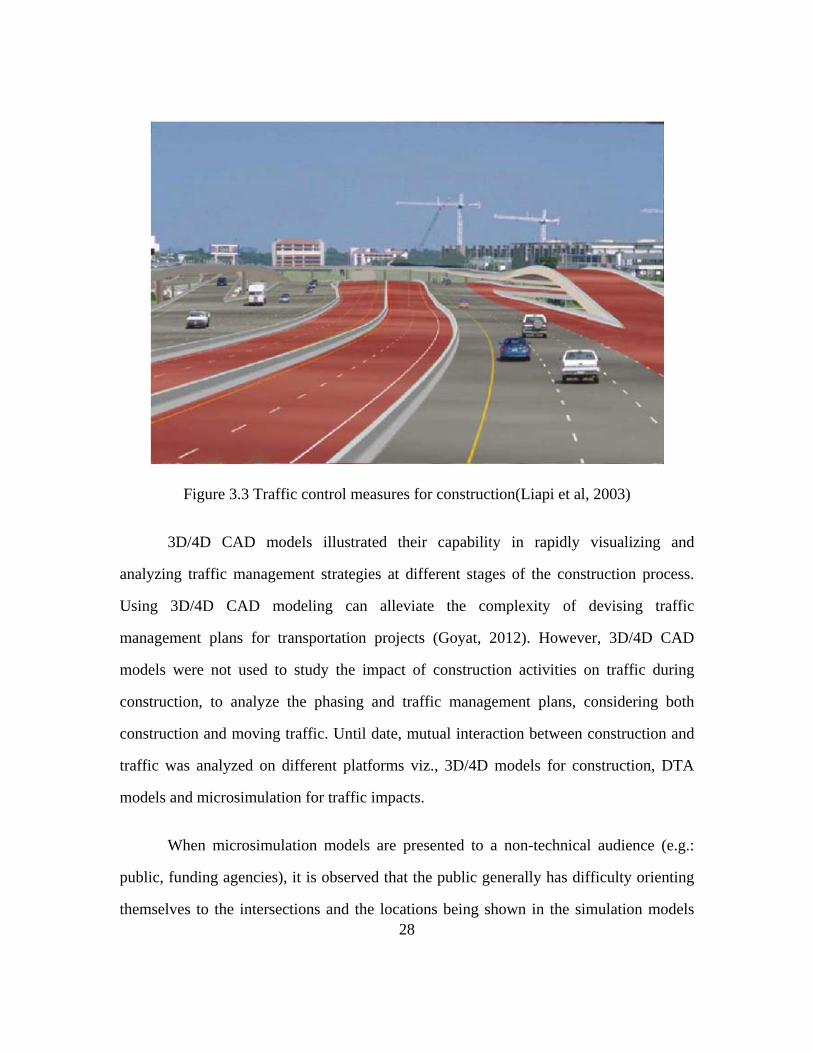
Figure 3.3 Traffic control measures for construction(Liapi et al, 2003)
3D/4D CAD models illustrated their capability in rapidly visualizing and
analyzing traffic management strategies at different stages of the construction process.
Using 3D/4D CAD modeling can alleviate the complexity of devising traffic
management plans for transportation projects (Goyat, 2012). However, 3D/4D CAD
models were not used to study the impact of construction activities on traffic during
construction, to analyze the phasing and traffic management plans, considering both
construction and moving traffic. Until date, mutual interaction between construction and
traffic was analyzed on different platforms viz., 3D/4D models for construction, DTA
models and microsimulation for traffic impacts.
When microsimulation models are presented to a non-technical audience (e.g.:
public, funding agencies), it is observed that the public generally has difficulty orienting
themselves to the intersections and the locations being shown in the simulation models

29
(Waite & Szplett, 2005). Since 3D/4D CAD models are a very efficient tool in virtually
re-creating the real geometry conditions and landmarks with the advanced rendering
capabilities available with fewer efforts (Schmeits, 2011), combining both traffic
simulation models and CAD models would help better understanding of traffic operations
during construction. Improved inter-operability and computational capacities of software
have facilitated exchange of data from microsimulation software to CAD modeling
software (Goyat, 2012). Goyat in his Master’s thesis demonstrated the capability of
current CAD modeling software to visualize traffic along with 3D geometry. Taking
advantage of this development, output from microsimulation can be used in CAD models
to develop comprehensive models for roadway construction project management.
Currently, vehicles are visualized to show vehicle movements during construction
detours and after construction of proposed facilities. In the LBJ expressway project, by
using TCPs and placing 3D vehicle objects along open lanes animations were created to
represent travel lanes available during construction. A member of the research team is
actively involved in updating 3D/4D CAD models with TCPs and generating animations
for communication through local media and social networking webpages of the project
(Goyat, 2012). Wyoming DOT, in the Wyoming Diverging Diamond Interchange project,
used 3D object files in 3D geometry models to generate videos conveying traffic
movement from above the interchange as well as from a driver’s perspective (Bentley
systems, 2012). Display of those videos at public meetings helped the public understand
how the interchange would look and work. Though these representations improved
communication to an extent, the degree of reality with respect to vehicle animations was
a constantly raised issue. Simulation of vehicles in virtual models without complying
with actual traffic volumes can sometimes mislead the audience during communication of

30
project scenarios and details. Hence there is a need of using actual traffic information
during communication for credibility and justification of project need and planning. Also,
lack of 3D representation of construction geometry might result in lack of perspective of
changing geometry during design of TCP by TMP planners/traffic engineers.
The previous paragraphs explained the need for microsimulation modeling and
the process for developing a model. Though microsimulation modeling software possess
basic visualization capabilities, the disadvantages of those are detailed and improvements
to add more meaning to microsimulations are suggested. Capabilities of 3D/4D models
are briefed based on past research and their value towards improving project review and
communication. As mentioned earlier, 3D visualization of surrounding project geometry
is necessary to review the extent to which existing infrastructure can be used for traffic
detouring instead of constructing temporary pavements, which can escalate project cost
and duration. Having explained the areas which can be improved by the integration of
traffic information with 3D/4D CAD modeling, a specific approach is described in the
following chapter that can facilitate the integration. The criteria to be defined for the
analysis and validation of models are also explained.
31
Chapter 4 Research Methodology
Based on the literature review in previous chapters, a framework for visualization
of microsimulation traffic data with 3D and 4D CAD models is described in this chapter.
The phases of project to be analyzed are identified, development of results and validation
of the results are explained. The feasibility of benefits observed in the literature is studied
using two case studies on transportation projects that are in different phases of project
development.
PROBLEM STATEMENT
Previous research suggests creation of a single platform to analyze both traffic
information and geometry details of construction projects. The main objective of this
report is to explore the applications of visualizing traffic information in construction
3D/4D CAD models to overcome the decision-making and communication challenges
identified in previous chapters. The potential benefits that result through integrating
traffic information with CAD models will be explored. Currently, road geometry
configuration and traffic impact during construction are being analyzed on different
platforms viz., 3D/4D CAD models for construction and microscopic/mesoscopic traffic
simulation for traffic analysis (FHWA, 2010). Based on the discussion in previous
chapter, it is evident that 3D/4D CAD modeling is capable of adding traffic data for
visualization. In this thesis, the integration is performed using geometry modeled in 3D
CAD models and traffic data from microsimulation models.
The process adopted to accomplish visualization of traffic in CAD models will be
explained in detail and once visualization is accomplished, the areas in which the
integrated models are analyzed for is also explained. Additional benefits that are implied
with visualization of dynamic traffic in virtual reality, which is not being done on a large
32
scale for construction projects, that can be beneficial from conceptual planning to
construction and traffic management are also mentioned. Assumptions that are taken
while modeling traffic data and also the assumptions while analyzing CAD models with
traffic will be mentioned.
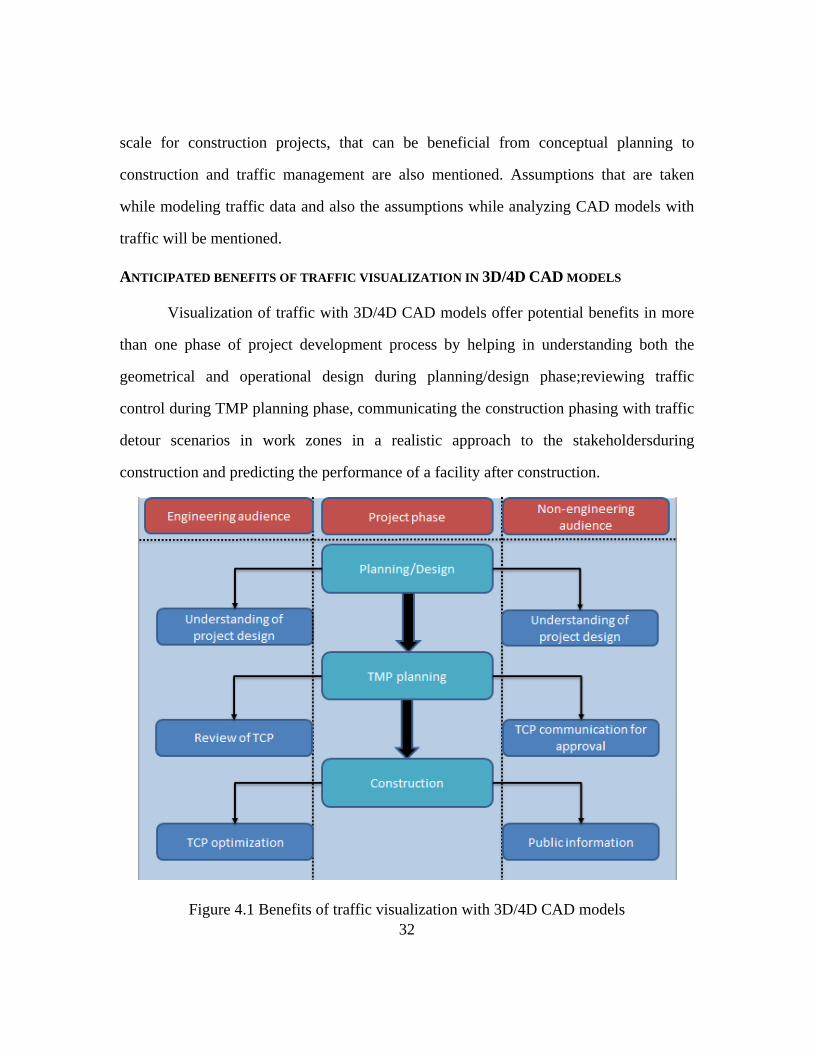
ANTICIPATED BENEFITS OF TRAFFIC VISUALIZATION IN 3D/4D CAD MODELS
Visualization of traffic with 3D/4D CAD models offer potential benefits in more
than one phase of project development process by helping in understanding both the
geometrical and operational design during planning/design phase;reviewing traffic
control during TMP planning phase, communicating the construction phasing with traffic
detour scenarios in work zones in a realistic approach to the stakeholdersduring
construction and predicting the performance of a facility after construction.
Figure 4.1 Benefits of traffic visualization with 3D/4D CAD models

33
METHODOLOGY
The work flow to integrate traffic information with CAD models is similar to that
of (Goyat,2012) but with a change that the construction schedule based 4-D models are
not used for geometry when importing microsimulation traffic data into the CAD models.
The reason for this being a lack of sufficient detail in scheduleswhen phasing is done for
huge projects like NTE (Chapter 5). Moreover, fully developed schedules may not be
available if the analysis is performed during TMP formulation phase.Alternatively, TCPs
were utilized in addition to construction schedules forgeneration of accurate geometry in
the time period for which microsimulation analysis was run. This facilitated creation of
accurate geometry which was not reflected by the schedule. In general, changes in
schedule also result in changes to TCPs as lane closures and widenings are conditional to
prior completed activities. Usage of geometry from updated schedules for traffic
simulation does not accommodate the changes that are made to TCPs due to schedule
updates.
Figure 4.2 Flow chart for traffic visualization in 3D/4D CAD

34
SOFTWARE
3D geometry is created in Autodesk Civil 3D®, whereas 4D simulations are
developed to analyze schedules in Navisworks®. 3D geometry and traffic data are
combined in 3ds Max® and the same program is used for advanced visualizations. PTV
VISSIM is used for the creation of microsimulation models. VISTA® is used to run DTA
models to extract volumes. Neither the authors nor TxDOT has any monetary interest in
PTV America, Inc., the company that owns copyrights to VISSIM or Autodesk, the
company that owns the copyrights to Civil 3D, Navisworks and 3ds Max. The same can
also be done using other software available which are mentioned earlier.
DATA COLLECTION
Data collection involves gathering the required information to develop 3D models
and microsimulation models. Increase in computational power made it easier for
developing software which can perform microsimulation analysis and also can export the
file in a compatible format to CAD modeling software. From literature review, it is
evident that microsimulation needs traffic volumes, turning movement information and
signal timings as inputs. However, it is challenging to collect information for a particular
area of interest as it is a very time consuming and expensive task. DOTs and other
transportation operations agencies normally use macroscopic/mesoscopic models for their
operations and planning(Chiu, 2011). Use of these macroscopic/mesoscopic models for
traffic information can make the analysis less time intensive and also reduce the efforts.
The author collaborated with a transportation graduate student, Mason Gemar, and
worked on Dynamic Traffic Assignment (DTA) models for extracting peak hour volumes
and turn movement information from them.

35
DTA models are being developed by Centre for Transportation Research (CTR)
for Texas state road networks. These models are used for generation of microsimulation
input data. DTA models are analyzed in a program named VISTA. VISTA models
consist of individual vehicle information for the period in which it is analyzed. From this,
time-dependent network performance of vehicles can be calculated, but due to the
limitation of traffic simulator that is implemented within the DTA network, the
performance metrics (like vehicle turning, yielding and stop) does not take into
consideration all required characteristics. Hence, DTA outputs are being used to generate
microsimulation models for better performance metrics. The graduate student with whom
the author worked developed a process to generate microsimulation inputs from DTA
models.
Among the three methods developed for extracting information out of DTA
models, the method with vehicle flows and turning movements is used for generation of
microsimulation input data. In this approach, the vehicle trajectories in the DTA model
are translated into vehicle inputs at the periphery of the microsimulation network, and
turning movements at the corresponding intersections. This provides two categories for
inputs: vehicle inputs and routing decisions at an intersection or a junction. This method
has implementation ease as a major advantage although the routing decisions on each
route have to be manually coded. One more disadvantage is that for a particular peak
hour consideration, the turning movement probabilities remain constant which may not
be the same in a real situation.
Signal timing plans and lane configuration of the project area during construction
are obtained through review of TCP plans issued by TxDOT for development of 4D
models. TCP plans are 2-D representative plans with minimum detail of explanation in
36
terms of words. The author spent a substantial time in figuring out how construction is
being done as one of the case studies is a huge project, which is divided into 4 major
phases, and each phase of construction had 5 to 6 sub phases. To develop the lane
configuration for microsimulation during construction, all the lanes that are partially
closed and completely closed are to be looked for because these lanes will not be carrying
traffic anymore and the volumes have to be zeroed during analysis. At the same time, the
traffic volumes must be added to adjacent lanes that are open and carrying traffic.
Next will be the geometry modeling in 3-D for different case studies. Unlike
microsimulation, where the same procedure can be used for all case studies, it is not the
same in the case of geometry modeling as the project phase defines the information
available for modeling. Also, the objectives of case studies with respect to the project
phase in which they are being analyzed are different from one another. Visualization of
fully developed and approved TCP for construction, preliminary study of TCP planning
using existing geometry and traffic information, conveying TMP strategies to the public
using enhanced visualization capabilities assisted the DOT to receive public approval.
Hence the type of information needed to generate geometry will be different for each
project.
MODELING & APPLICATIONS
The model creation and their applicationin case studies are as follows:
Model development
Based on the construction phase the project is in and the scope of work, the
objectives of modeling are defined. Level of detail of elements in the model is chosen
considering the type of analysis that is being done.Every roadway construction project
37
generally has vast amounts of data including plans, drawings, TCPs and schedules.
Filtering of needed information in the early stage of modeling is necessary to i). Check
for any missing information and ii). Estimate the level of effort needed to develop all the
information collected into 3-D models.
Using the alignment, profiles and number of lanes from design schematics and as-
built plans, 3-D models are developed. TxDOT monthly interim schedules are used for
construction sequencing analysis for ongoing projects. Once the 3-D geometry modeling
is completed, outputs from microsimulation and 3-D models are input into the third
software set to visualize traffic and perform analysis. Details of modeling process are
elaborated in Goyat’s thesis (Goyat, 2012).
Using the model& validation
The primary goal of studying the construction phasing, TMP planning and
building these models is to share project information with the stakeholders prior to any
construction to receive feedback and eventually seek approval to continue with detailed
designs or modify the proposed designs. Ideal case would be presenting the results from
these models in public meetings and project team meetings to educate the involved
personnel with project details. Feedback from these meetings could be used as a basis to
judge the effectiveness of traffic visualization models in achieving the perceived benefits.
The criteria chosen to evaluate the application of these models are to examine
how many of the challenge areas, identified in Table 2.1, are addressed with these
visualizations. Literature review emphasizes the accuracy of traffic visualization to
justify project planning and phasing. These CAD models with traffic visualization arealso
evaluated for their enhanced capabilities in communicating the TCPs and construction
38
phasing plans when compared to the previous methods viz., using 3D fly through
animation with static vehicles and 4D animations. The effectiveness of these models in
making the users understand traffic operations with changing geometry is presented in the
case studies as an additional criterion.
Unfortunately, public meetings are not held during the span of research to present
the results and evaluate these models. However, these results are displayed to traffic
engineers, researchers and non-engineers in a research symposium organized by Centre
for Transportation Research. Feedback is collected using a small survey and the results
are graphically shown in case studies. In addition, additional benefits that are identified
during this process are also documented in the case studies.
Both geometric and traffic models are validated to reflect actual conditions.
Geometric models are compared to project images to the extent available. Google maps®
was also used to validate existing geometry wherever necessary. For traffic model
validation, a small case study is taken up to which field access is easily available and is
less time intensive. As the traffic data collection approach from DTA model is still in
evolving stage, the extent to which the data can be relied upon is tested in the case study
(Chapter 5).
AREAS NOT MODELED
Virtual modeling is a vast domain. There is no limit to the level of detail that can
be shown in virtual models to exactly represent the real conditions. However, considering
time limitations and value addition that the level of detail can add to a final audience,
modeling detail is limited to existing and proposed geometry. In the NTE case study,
temporary pavements on IH 820 mainlines are not shown as the prime focus was on the
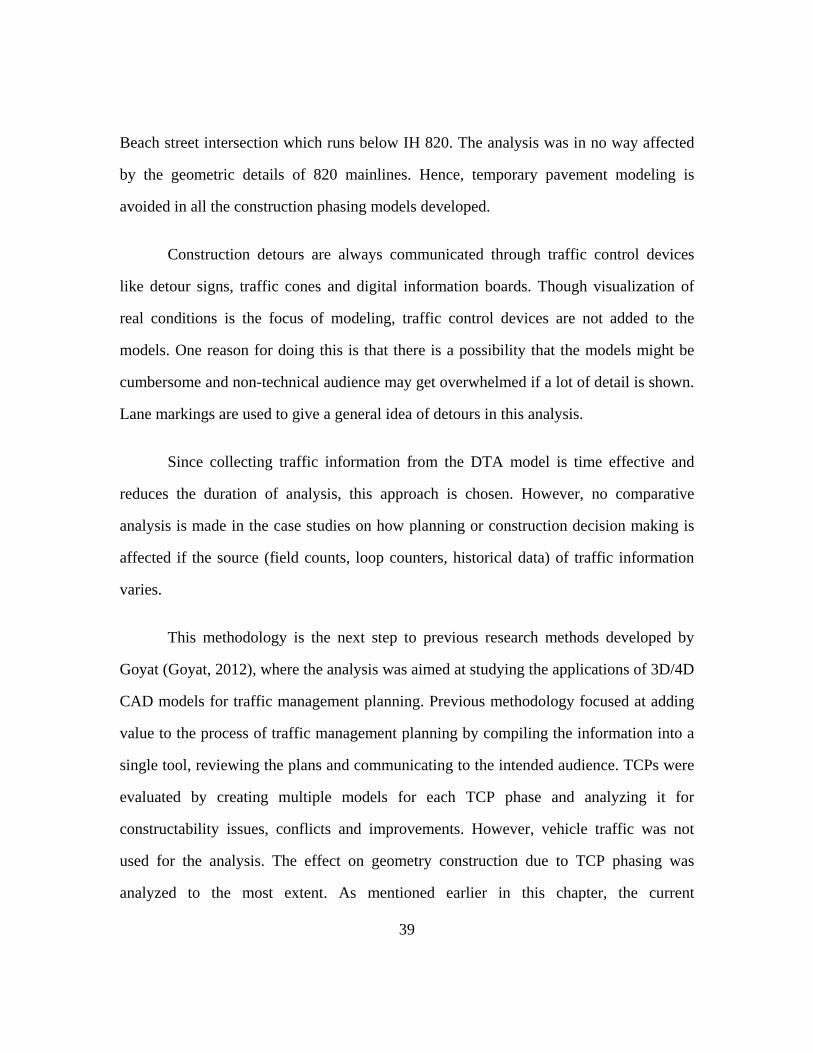
39
Beach street intersection which runs below IH 820. The analysis was in no way affected
by the geometric details of 820 mainlines. Hence, temporary pavement modeling is
avoided in all the construction phasing models developed.
Construction detours are always communicated through traffic control devices
like detour signs, traffic cones and digital information boards. Though visualization of
real conditions is the focus of modeling, traffic control devices are not added to the
models. One reason for doing this is that there is a possibility that the models might be
cumbersome and non-technical audience may get overwhelmed if a lot of detail is shown.
Lane markings are used to give a general idea of detours in this analysis.
Since collecting traffic information from the DTA model is time effective and
reduces the duration of analysis, this approach is chosen. However, no comparative
analysis is made in the case studies on how planning or construction decision making is
affected if the source (field counts, loop counters, historical data) of traffic information
varies.
This methodology is the next step to previous research methods developed by
Goyat (Goyat, 2012), where the analysis was aimed at studying the applications of 3D/4D
CAD models for traffic management planning. Previous methodology focused at adding
value to the process of traffic management planning by compiling the information into a
single tool, reviewing the plans and communicating to the intended audience. TCPs were
evaluated by creating multiple models for each TCP phase and analyzing it for
constructability issues, conflicts and improvements. However, vehicle traffic was not
used for the analysis. The effect on geometry construction due to TCP phasing was
analyzed to the most extent. As mentioned earlier in this chapter, the current

40
methodology aims at determining how traffic visualization in 3D/4D CAD models can
enable better understanding of the construction as well as TCP phasing and improve
communication with the stakeholders. Two case studies are presented in next chapter to
justify the benefits that are mentioned in this chapter.

41
Chapter 5 Case studies
The current chapter illustrates the benefits of visualizing traffic in 3D/4D
CAD models through two case studies on roadway construction projects – one in
construction phase in Fort Worth, TX and the other in pre-construction phase in College
Station, TX.One more case study for a detour scenario in Austin, TX is also described
which is done to validate the traffic data generated from mesoscopic models. In each case
study, a brief introduction is provided describing the project scope of work, estimated
budget, duration of the project and the phase in which the project is modeled. Challenges
specific to the project are also explained to justify why these case studies are selected for
evaluation of traffic visualization models. Further, modeling process for the creation of
geometry and traffic data is explained and justification for level of detail in the models is
also explained. A detailed explanation is provided on the usage of models and the
benefits that are identified.
The first case study, North Tarrant Express project, focuses on application
of these models in construction phase and for TCP review of a project. The results of
these visualizations showing their effectiveness in achieving the benefits are graphically
shown at the end of case study based on the feedback received from traffic engineers and
non-engineers. Second case study, FM 2154 and George Bush Drive Intersection, is an
extension of the research findings put forth by a former member of the team. Extensive
analysis was done on this project in evaluating use of 3D/4D models for traffic
management planning (Goyat, 2012). In addition to that, traffic visualization is also
added in the present case study to further reinforce the research analysis. The final case
study, JW Marriott Austin, is a construction project being executed in downtown Austin,
TX. The detour scenario resulted due to this construction is analyzed for data validation.

42
NORTH TARRANT EXPRESS PROJECT
This project is used as a case study to illustrate how traffic data can be
incorporated into 3D/4D CAD models and the development of traffic data visualization in
CAD models in conjunction with traffic control plans. These models will be used to
explain the benefits of using traffic information to visually analyze the traffic control
plans developed during traffic management planning and how the information can be
communicated to various stakeholders (construction crew, motorists, local public and
government agencies). This project serves as an example for applications of traffic data
visualization in construction zones during the construction phase, besides its regular
applications in 3-D visualization and construction sequencing with time.
Overview
The North Tarrant Express (NTE) project consists of a series of major highway
improvements to the Tarrant County’s most congested highways Interstate 820 and State
Highways 121 and 183 (Airport Freeway) corridors between I-35 West and Industrial
Boulevard in North Tarrant County, Texas. The main aim of the NTE project is to
improve mobility along the aforementioned freeways through construction of new
managed lanes system. NTE provides eight to ten lanes on I-820 and SH 121/183. The
project is being designed and built concurrently by NTE Mobility Partners (NTEMP)
(TxDOT, 2012).
The salient features of this $ 2.5 Billion project are:
• Segment 1 (I-820 from I-35W to Northeast Interchange)
– 6.4 miles
• Segment 2W (Northeast Interchange to FM 157/Industrial Boulevard)
– 6.9 miles
• Complete reconstruction to upgrade existing general purpose lanes
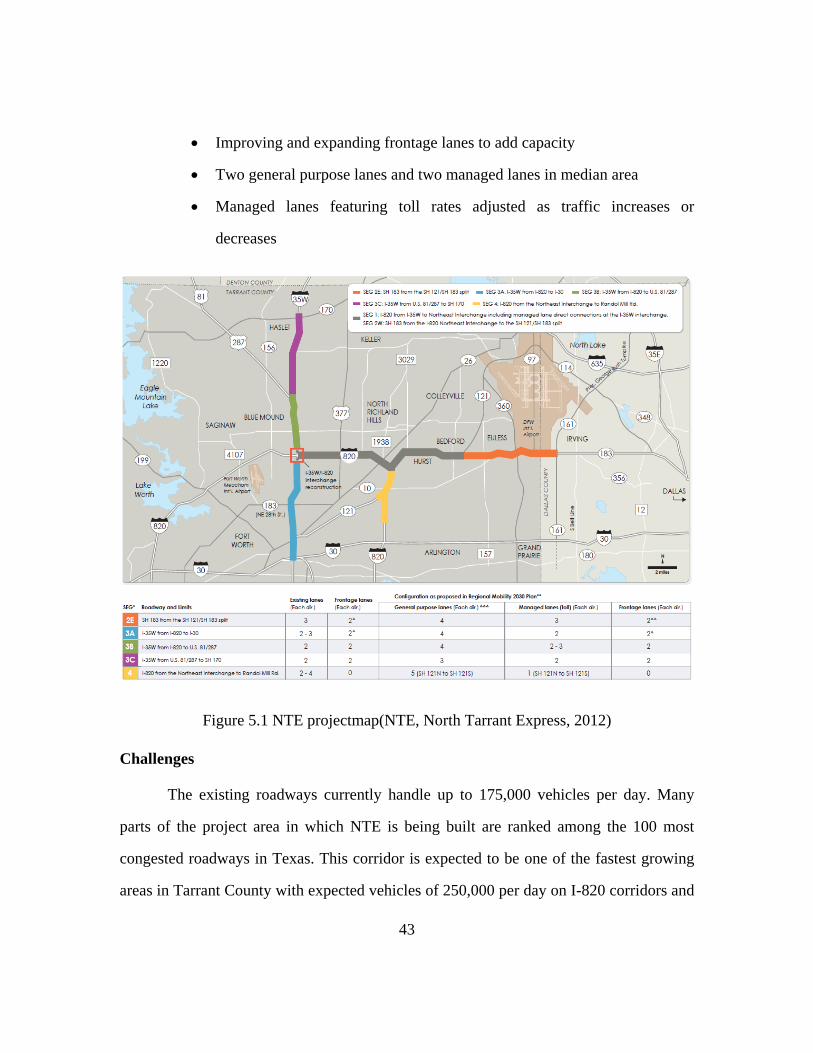
43
• Improving and expanding frontage lanes to add capacity
• Two general purpose lanes and two managed lanes in median area
• Managed lanes featuring toll rates adjusted as traffic increases or
decreases
Figure 5.1 NTE projectmap(NTE, North Tarrant Express, 2012)
Challenges
The existing roadways currently handle up to 175,000 vehicles per day. Many
parts of the project area in which NTE is being built are ranked among the 100 most
congested roadways in Texas. This corridor is expected to be one of the fastest growing
areas in Tarrant County with expected vehicles of 250,000 per day on I-820 corridors and
44
317,000 vehicles a day in SH 183 by the year 2030. Also, Dallas-Fort worth International
Airport (DFW), the third busiest airport in the world, generates a huge amount of traffic
in this region.
The above facts depict the importance of traffic management during construction
phase of this project. The project is spread over a vast area, the construction activities not
only affect the local community but also commuters along freeways due to partial lane
closures, narrowing of open lanes, reduced stopping sight distance (SSD) due to
obstructed views by construction equipment and congestion on roads.
Texas Department of Transportation (TxDOT) and the construction agency, NTE
Mobility Partners are committed to keeping traffic moving safely during construction by
installing signs along highways to inform drivers of closed ramps and lanes, detours or
traffic switches. In addition to these efforts, communication of these changes prior to
construction by leveraging the capabilities of 3D/4D CAD models to use traffic
information from DTA models is expected to add great value to the public information
part of traffic management planning.
Building 3D/4D CAD model
Scope of the model
The first step in building the 3-D model is assessing the project scope through
review of plans provided by TxDOT. The length of the project being over 13 miles, it is
divided into 2 segments (West segment–1 and East segment-2) with different lanes
(managed, general purpose, frontage, ramps, cross roads and direct connectors) in
westbound and eastbound directions. In order to capture the phasing and construction
sequence of the project different lanes are given a color code for easy identification.
Initially, the main intent of building the model was 4-D visualization of new construction
45
for communication during public meetings with stakeholders and the public. Hence, only
future conditions are modeled for the entire project because modeling of both existing
and future conditions takes a considerable time without much added value. However,
USGS data is used as a background when visualizing these models, to co-relate existing
conditions for understanding the expansion of the lanes and the new ROW acquisition.
Terrain and context information
As mentioned in previous reports, adding terrain data to 3-D models improves
visualization when compared to hanging objects in 3-D space. LIDAR data in .tin format
was used to extract terrain information for the project area. Using Autodesk surface
editing tools, better ways to optimize the information to fit into 3-D models were applied.
The terrain information received is for existing conditions. Data was edited to incorporate
changes in ground elevations, cuts and fills while accommodating new roads and ramps.
Construction sequencing visualization
Interim schedules from TxDOT monthly updates were used to visualize the
construction by linking 3-D models with construction schedules in Autodesk Navisworks.
Construction phasing plans provided by TxDOT helped delineate the schedule into
different phases and figuring out the section wise construction of the project. 4-D
animations are created to visualize the schedule and for public information during public
meetings organized by TxDOT. Figure 5.3 shows one of the 4-D animations being
displayed during a public meeting.

46
Figure 5.2 NTE project construction phasing plan
Figure 5.3 NTE project 4D CAD visualization
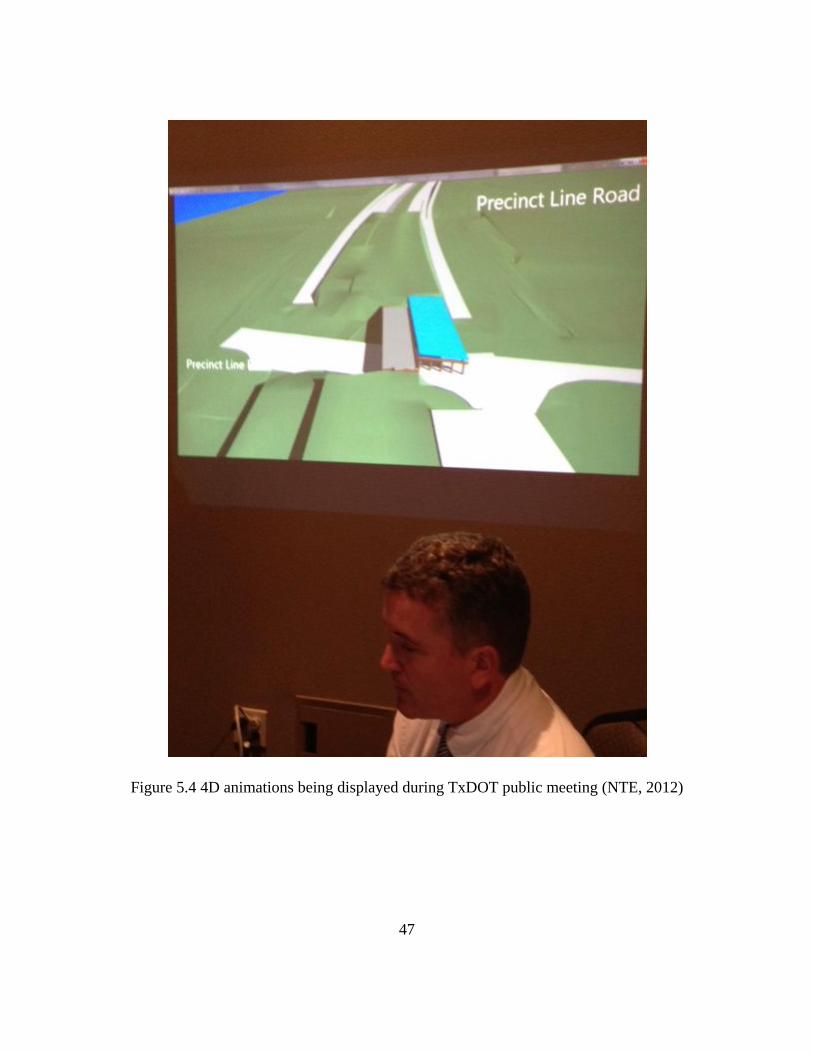
47
Figure 5.4 4D animations being displayed during TxDOT public meeting (NTE, 2012)

48
It was during public meetings that feedback was collected from local people and
motorists who commute through the area regarding the inconvenience being faced due to
construction of crossroads at intersections. Based on the information gathered, TxDOT
public information officers concluded that construction around North Beach street
intersection has been causing major impact on level of service offered to commuters
travelling in the project area.
Figure 5.5 Public viewing 4D CAD animations during public meetings (NTE, 2012)
Also, advanced renderings of future conditions were displayed during public
meetings to show how the project looks after completion. Vehicle rendering was also
done to augment the virtual reality of these visualizations. Though the vehicle number,
speeds, chainage and headway are not as per real conditions, the intent was to help

49
thepublic to understand lane configurations, exit and entry ramps and cross street
expansions. As a response to the renderings, simulation of real time traffic conditions
during construction and TCP visualization were suggested. N.Beach street intersection
was chosen for simulating traffic information into 3D/4D CAD models as analysis on this
intersection can add public information value.
Figure 5.6 Virtual reality renderings of proposed project after construction
North Beach Intersection
N.Beach Intersection construction is a part of NTE project segment 1. It is located
between chainage 730+00.00 and 732+00.00 of IH 820 in the perpendicular direction.
Based on information from TxDOT officials, Beach Street is one of the busiest cross
streets near IH35 W/IH820 interchange because of the residential housing in the vicinity
and presence of many commercial businesses along the street. Also, construction near
IH35W/IH820 (circled in red) resulted in commuters avoiding the interchange and

50
usingN Beach (highlighted in black) to enter/exit IH 820 towards DFW (Dallas-Fort
Worth International Airport).
Figure 5.7 Google Maps® showing IH35/IH 820 intersection and N. Beach Street
Existing conditions
N. Beach intersection consists of 2 lanes each in Northbound and Southbound
directions. It also has 1 turning movement for entry and exit on both Eastbound and
Westbound Frontage roads. IH-820 runs perpendicularly to Beach Street on two grade
separated bridges (West and East bound).

51
Figure 5.8 Google Maps® satellite view of existing N. Beach Street
Construction scope The scope of construction around N.Beach street intersection involves:
1. Pavement laying and new configuration of existing lanes
2. Free U-turn movement from Eastbound frontage road to Westbound frontage road
3. Free U-turn movement from Westbound frontage road to Eastbound frontage road
4. Increasing number of lanes from 2 to 4 in both Northbound and Southbound
directions under the IH820 bridges
5. Re-arrangement of road alignments to accommodate new IH-820 bridges
The scope of construction is derived from schematic plans of the project as shown in
the figure 5.9

52
Figure 5.9 Proposed expansion of N. Beach street
Construction phasing
The construction schedule was analyzed to understand the phasing of N.Beach
construction. However, the level of detail observed in the schedule was not
comprehensive enough to be able to explain construction of new pavement and
modification of the existing pavement through a 4-D simulation. 4-D simulation of the
schedule activities was not very instrumental in conveying the construction phasing
scenario and traffic de-touring to the public audience as less information on lane
configuration changes was available.
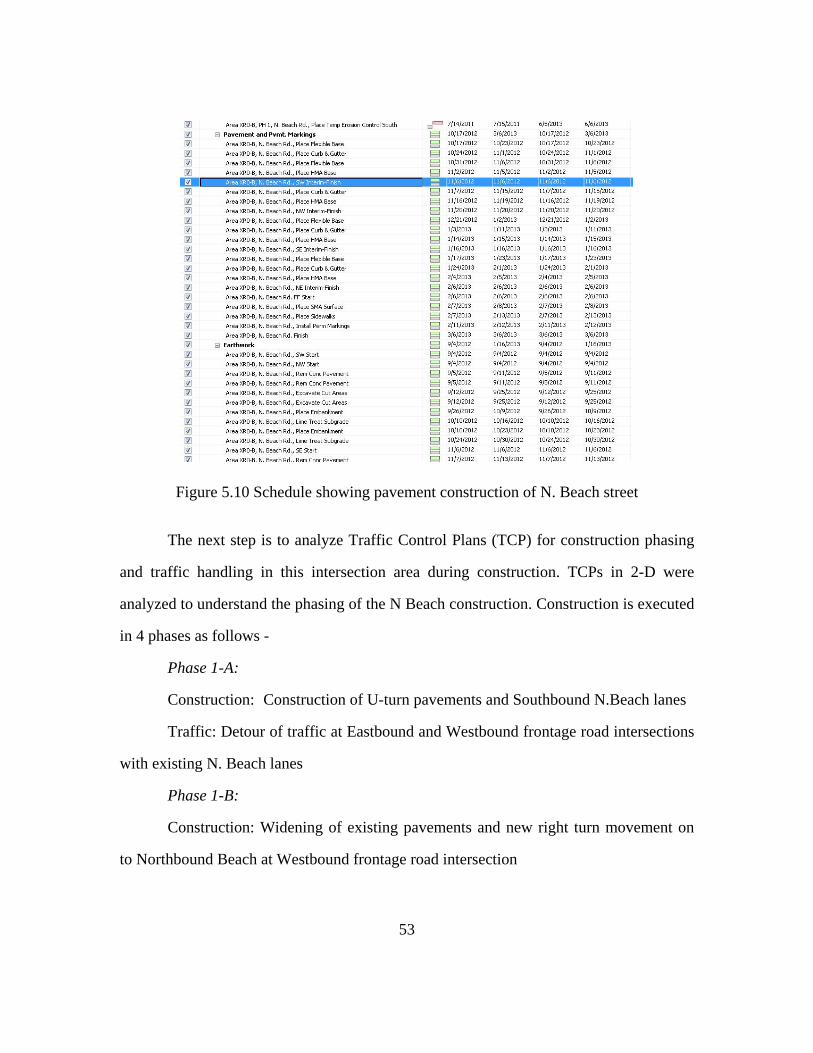
53
Figure 5.10 Schedule showing pavement construction of N. Beach street
The next step is to analyze Traffic Control Plans (TCP) for construction phasing
and traffic handling in this intersection area during construction. TCPs in 2-D were
analyzed to understand the phasing of the N Beach construction. Construction is executed
in 4 phases as follows -
Phase 1-A:
Construction: Construction of U-turn pavements and Southbound N.Beach lanes
Traffic: Detour of traffic at Eastbound and Westbound frontage road intersections
with existing N. Beach lanes
Phase 1-B:
Construction: Widening of existing pavements and new right turn movement on
to Northbound Beach at Westbound frontage road intersection

54
Traffic: Detour of Northbound and Southbound Beach traffic to new lanes under
IH820 bridges. Addition of a lane along Northbound Beach Street to accommodate a
right turn at the intersection with the Eastbound frontage road.
Phase 1-C:
Construction: Patch construction on Northbound Beach lanes. New lane along
Westbound frontage road at the intersection with N Beach street
Traffic: Reduction of the number of Northbound lanes to 2 from 3. Re-opening of
a separate right turn lane to theEastbound frontage road. Also, right turn movement from
the Westbound frontage road to Northbound Beach is re-opened.
Phase 1-D:
Construction: Median construction along North and Southbound Beach.
Construction of 2 lanes along Southbound Beach.
Traffic: De-touring Northbound and Southbound traffic to U-turn movement lanes
2-D TCP schematics from which the above phasing was inferred are shown along
with 3D models. Although 2-D TCP plans helped to decipher the construction scenario, it
was difficult to assess the impact on traffic using this information. For example,
reduction of westbound frontage lanes to 1 can have a big impact on traffic queuing at the
intersection as both the left turning movements and straight movements are constrained to
one lane. Compared to 2D paper plans, the construction phasing and traffic congestion
can be easily represented through visualizing the impacted traffic conditions along with
changed lane configurations.
Geometry models
As mentioned earlier, with changing geometry a single 4D model cannot be used
for visualizing traffic, therefore multiple models had to be created for different

55
construction stages. The intersection construction is divided into 4 phases. Hence 4
different models are created using updated TCP plans to represent open lanes during
construction and the lanes that are built during that phase as follows:
Model 1 – Existing conditions (before start of construction)
Model 2 – Intersection during construction phase 1-A
Model 3 – Intersection during construction phase 1-B
Model 4 – Intersection during construction phase 1-C
Model 5 – Intersection during construction phase 1-D
Traffic information models
Fort Worth district traffic assignment model is used for generation of traffic
information for this case study. The model is run in a program called VISTA. Peak hour
volumes are considered for this analysis as peak hour volumes represent the worst case
scenario in terms of congestion and inconvenience caused to motorists. Using a java
script code and manual observations, the traffic volumes and turn movements for road
network in this intersection are calculated and used as an input for microsimulation of
existing lane geometry. But for traffic conditions representing ongoing construction, the
traffic volumes extracted from the model may not be the same as real conditions since
there are construction activities going on before and after the Beach intersection along IH
820, which might affect the amount of traffic at Beach. 2-D TCP documents were
analyzed to identify activities that could impact traffic in this intersection while Beach
Street is under construction. The activities that were identified are listed below according
to the phase and stage in which they occur:
ADVANCE PACKAGE – 01
STAGE 2

56
• Shift eastbound and westbound traffic on GP lanes to shoulder and widened
pavement
• Construct managed lane pavement from STA 737+00 to 810+00
ADVANCE PACKAGE-02
STAGE 1, STEP1
IH-820
• Construct Eastbound Frontage road
• Construct temporary widening along existing Eastbound 820 Mainlines
• Construct temporary EB entrance ramp from Beach
• Construct steps 1Aand 1B of Beach street staging
• Close Altair Blvd. and detour traffic. Construct Altair and reopen prior to closure
of N.Riverside dr. and Endicott eve.
• Close Riverside and Endicott, and construct, prior to moving traffic onto new
frontage road pavement
• Close EB Frontage Rd. east of Beach entrance ramp and Anderson street
STAGE 1, STEP 2
IH-820
• Divert traffic onto new EB frontage road pavement and construct remaining
portion of frontage road
• Close existing 820 EB entrance ramp from Beach and open temporary ramp
• Permanently close existing EB exit ramp to Beach St
STAGE 2, STEP 1
IH-820
• Divert EB IH-820 and NB IH-35 connector traffic onto temporary widening.
construct permanent EB general purpose (GP) lanes and EB GP bridge at Beach
57
• Construct temporary widening, west of IH 35W connector, along existing EB 820
Mainlanes and temporary detour pavement, east of beach, from proposed EB GP
lanes to existing EB 820.
STAGE 2, STEP 2
IH-820
• Divert EB IH-820 and IH-35W NB connector traffic onto new GP lanes and
construct remaining portions of permanent pavement
ADVANCE PACKAGE - 03
No relevant activities
ADVANCE PACKAGE – 04
PHASE 4B
STAGE 1, STEP 0
• Construct temporary widening of WB frontage road
STAGE1, STEP1
• Begin construction of proposed WB Frontage road from FRWB2 3662+00 to
3762+00
• Construct temporary WB detour pavement at approximate FRWB2 STA 3760+00
• Construct temporary widening on the WB frontage road from Haltom Rd to
FRWB2 3780+00
• Close flagstone street detouring traffic to N.Riverside drive
• Begin Beach street phasing, Fossil Creek Blvd phasing and N.Riverside Drive
phasing
STAGE 2, STEP1
• Shift traffic onto proposed WB frontage Road
• Construct temporary detour pavement from existing WB mainlanes to existing
WB frontage road at IH 820 Sta 735+00
58
• Construct temporary detour pavement from existing EB mainlanes to existing WB
mainlanes to IH 820 Sta 690+00
• Complete construction of frontage road from FRWB2 Sta 3693+00 to Beach St
• Construct WB exit ramp to Fossil Creek Blvd and begin WB General Purpose
lane construction from IH 820 709+00 to Sta 766+00
• Construct temporary detour pavement from WB proposed General Purpose Lanes
to existing WB mainlanes to IH 820 Sta 750+00
STAGE 2, STEP 1A
• Close N. Riverside Drive and detour traffic to Flagstone Street
• Shift WB Frontage road traffic at N. Riverside Drive and complete construction
of the WB frontage road and intersecting street
STAGE 2, STEP 2
• Complete WB frontage road construction
• Shift WB mainlane traffic from existing WB mainlanes to detours constructed in
Stage 2 Step 1
• Continue construction of WB General Purpose lanes from GP820W 682+00 to
Sta 728+00
STAGE 3, STEP 1
• Shift WB mainlane traffic to proposed WB General Lanes
• Complete construction of WB Managed Lanes to IH 820 737+00
• Complete construction of Beach Street
Among these construction activities, it was observed that the IH 820 mainlanes do
not have considerable effect on Beach intersection traffic as mainlanes have full capacity
(2 lanes each west and east bound) using temporary pavements. But construction on
frontage roads, permanent closing of old ramps; closing/opening of temporary ramps and
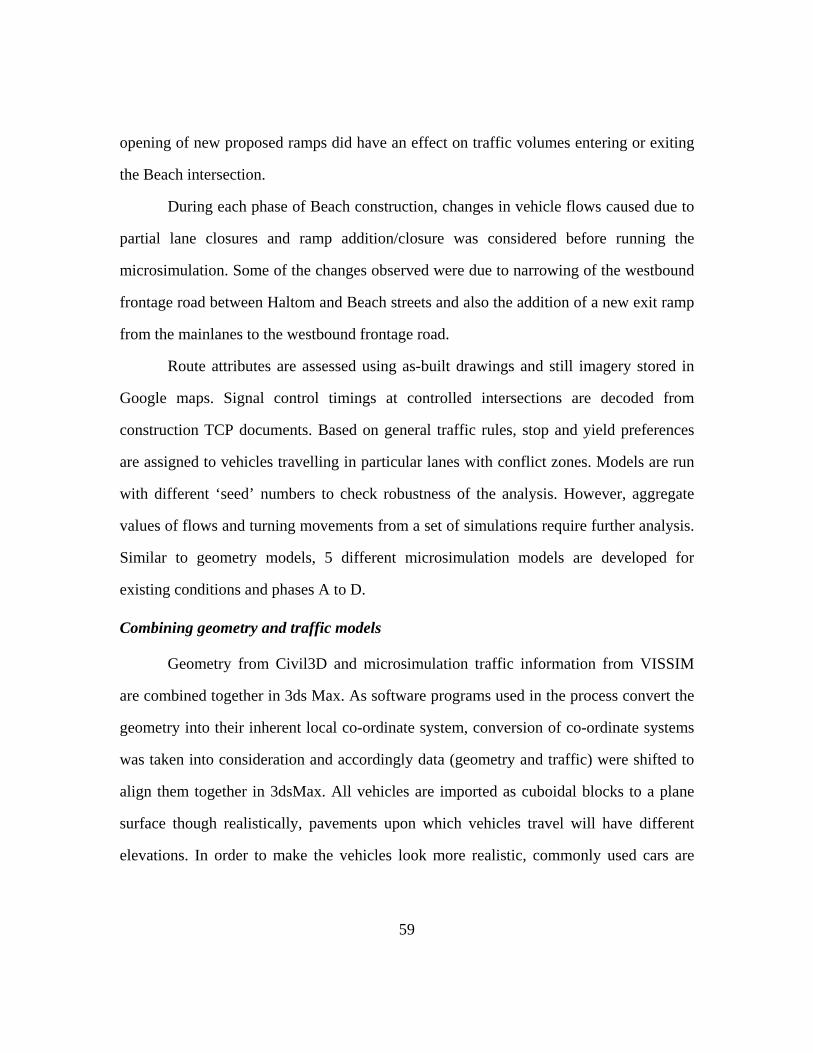
59
opening of new proposed ramps did have an effect on traffic volumes entering or exiting
the Beach intersection.
During each phase of Beach construction, changes in vehicle flows caused due to
partial lane closures and ramp addition/closure was considered before running the
microsimulation. Some of the changes observed were due to narrowing of the westbound
frontage road between Haltom and Beach streets and also the addition of a new exit ramp
from the mainlanes to the westbound frontage road.
Route attributes are assessed using as-built drawings and still imagery stored in
Google maps. Signal control timings at controlled intersections are decoded from
construction TCP documents. Based on general traffic rules, stop and yield preferences
are assigned to vehicles travelling in particular lanes with conflict zones. Models are run
with different ‘seed’ numbers to check robustness of the analysis. However, aggregate
values of flows and turning movements from a set of simulations require further analysis.
Similar to geometry models, 5 different microsimulation models are developed for
existing conditions and phases A to D.
Combining geometry and traffic models
Geometry from Civil3D and microsimulation traffic information from VISSIM
are combined together in 3ds Max. As software programs used in the process convert the
geometry into their inherent local co-ordinate system, conversion of co-ordinate systems
was taken into consideration and accordingly data (geometry and traffic) were shifted to
align them together in 3dsMax. All vehicles are imported as cuboidal blocks to a plane
surface though realistically, pavements upon which vehicles travel will have different
elevations. In order to make the vehicles look more realistic, commonly used cars are

60
used to replace these blocks adding more meaning to the visualization. Also, the vehicles
are attached to pavements beneath them to ensure high-quality and more realistic visuals.
Visualization of construction phasing
Existing conditions:
The figure 5.12 shows the Beach street intersection before the start of
construction with two fully open lanes on north & south bound on the Beach streets as
well as eastbound frontage and west bound frontage roads.
Figure 5.11 Existing conditions of N. Beach Street

61
Figure 5.12 South side of N. Beach intersection
Figure 5.13 North side of N. Beach intersection
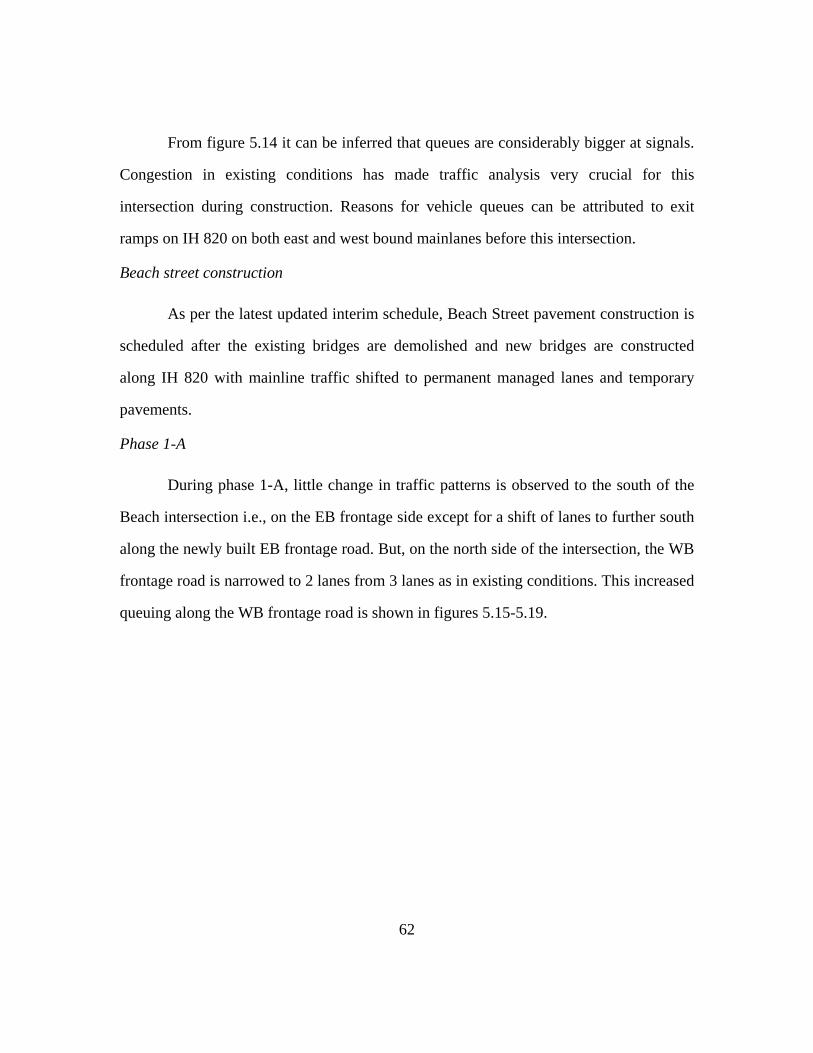
62
From figure 5.14 it can be inferred that queues are considerably bigger at signals.
Congestion in existing conditions has made traffic analysis very crucial for this
intersection during construction. Reasons for vehicle queues can be attributed to exit
ramps on IH 820 on both east and west bound mainlanes before this intersection.
Beach street construction
As per the latest updated interim schedule, Beach Street pavement construction is
scheduled after the existing bridges are demolished and new bridges are constructed
along IH 820 with mainline traffic shifted to permanent managed lanes and temporary
pavements.
Phase 1-A
During phase 1-A, little change in traffic patterns is observed to the south of the
Beach intersection i.e., on the EB frontage side except for a shift of lanes to further south
along the newly built EB frontage road. But, on the north side of the intersection, the WB
frontage road is narrowed to 2 lanes from 3 lanes as in existing conditions. This increased
queuing along the WB frontage road is shown in figures 5.15-5.19.

63
Figure 5.14 Phase 1-A – South side of N. Beach intersection in TCP
Figure 5.15 Phase 1-A – South side of N. Beach intersection in 3D model

64
Figure 5.16 Phase 1-A – North side of N. Beach intersection in TCP
Figure 5.17 Phase 1-A – North side of N. Beach intersection in 3D model

65
Figure 5.18 Phase 1- A – Queuing on south bound N. Beach Street in 3D model
Phase 1-B:
Figure 5.19 Phase 1-B – South side of N. Beach intersection in TCP

66
Figure 5.20 Phase 1-B – South side of N. Beach intersection in 3D model
Figure 5.21 Phase 1-B – North side of N. Beach intersection in TCP

67
Figure 5.22 Phase 1-B – North side of N. Beach intersection in 3D model
Figure 5.23 Phase 1-B – Queuing on south side of N.Beach intersection in 3D model

68
In phase 1-B, traffic volume on the EB frontage road is reduced due to permanent
closure of the exit ramp from IH 820 prior to Beach Street. Also, merging of the right
turn lane with through lanes along NB Beach has reduced traffic congestion in that
direction. Open lanes along Beach Street are shifted west to facilitate paving of existing
Beach lanes. Whereas on the other side of the intersection, traffic congestion on WB
frontage road increased due to opening of a temporary pavement from IH 820 mainlines
onto the frontage road. Also, removal of the separate right turn lane onto the WB frontage
road also increased congestion along SB Beach Street.
Figure 5.24 Phase 1-B – Queuing on north side of N. Beach intersection in 3D model

69
Phase 1-C:
Figure 5.25 Phase 1-C – South side of N. Beach intersection in TCP
Figure 5.26 Phase 1-C – South side of N. Beach intersection in 3D model

70
Figure 5.27 Phase 1-C – North side of N. Beach intersection in TCP
Figure 5.28 Phase 1-C – North side of N. Beach intersection in 3D model

71
No major changes in traffic are observed during this phase. But there are shifts of
lanes on both sides of the intersection. The separate right turn movement is re-opened to
EB frontage road from NB Beach Street. Also, open WB frontage lanes are shifted north
for paving of the existing lanes.
Phase 1-D:
Figure 5.29 Phase 1-D – South side of N. Beach intersection in TCP
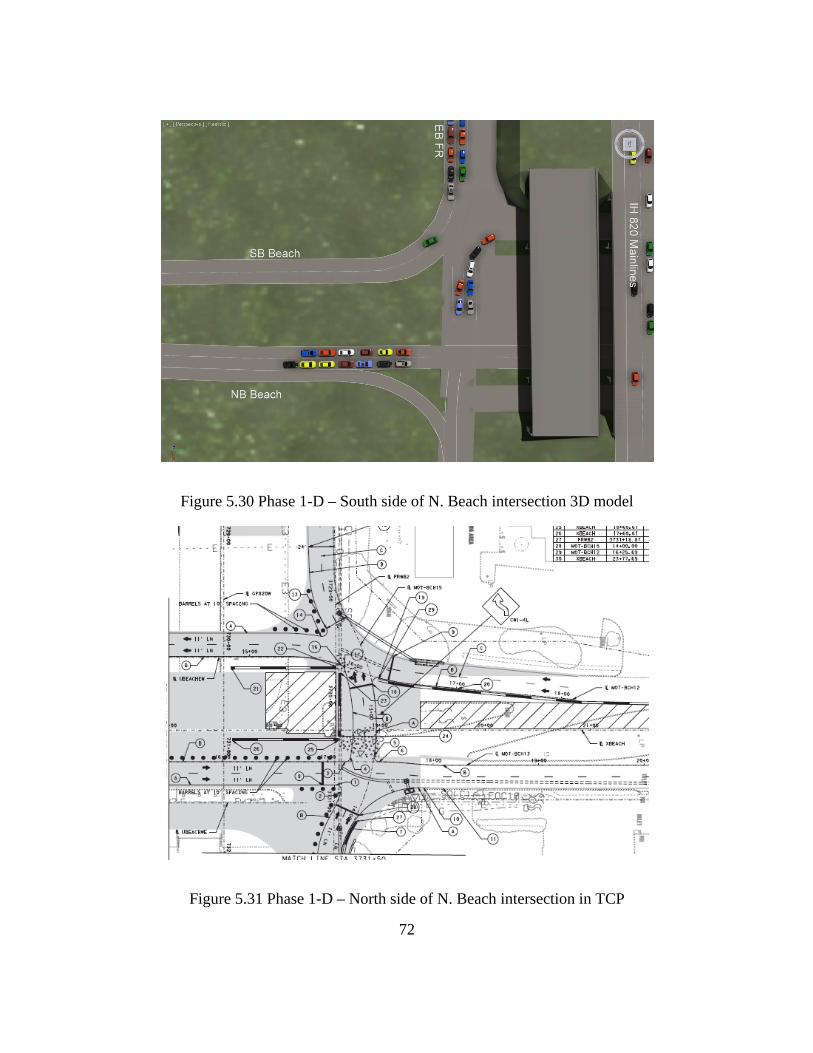
72
Figure 5.30 Phase 1-D – South side of N. Beach intersection 3D model
Figure 5.31 Phase 1-D – North side of N. Beach intersection in TCP
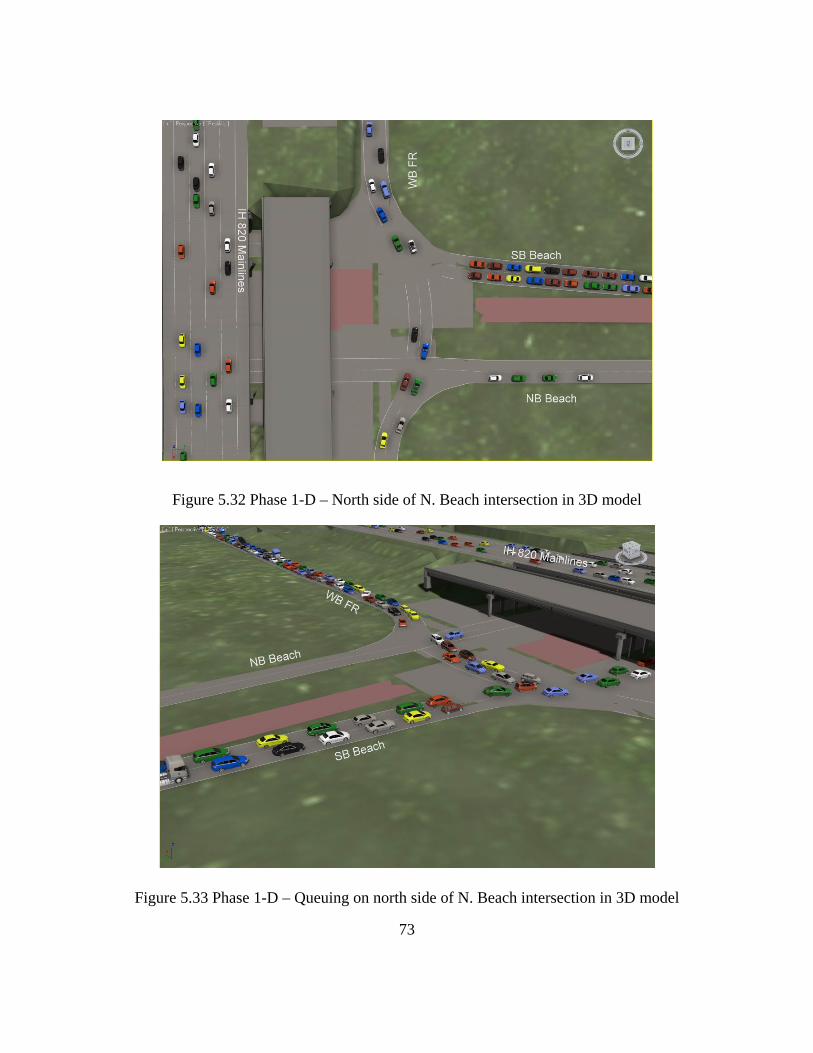
73
Figure 5.32 Phase 1-D – North side of N. Beach intersection in 3D model
Figure 5.33 Phase 1-D – Queuing on north side of N. Beach intersection in 3D model

74
It is observed that queuing is long on the north side of N.Beach intersection along
the westbound frontage road as shown in figure 5.34, due to addition of one more signal
before turning on to South Beach Street. On reviewing the TCP for this phase, it is
suggested that one more lane can be open on the frontage road to facilitate free
movement of traffic
Using the models:
The main objective of developing these models is to increase the level of
understanding of construction phasing and thereby enhance communication across
stakeholders including TMP planners, the public and motorists. Addition of traffic to 3-D
models moves virtual modeling a step closer to reality as both construction and traffic
parameters can both be analyzed on a single platform instead of moving back and forth
between 2-D plans and 2-D traffic microsimulation visuals.
These models were displayed to traffic engineers as well as other officials of
TxDOT and researchers of the Center for Transportation Research (CTR) during an
annual symposium event to collect feedback through interviews on how effective these
models are in conveying TCP information and their application to DOT projects. The
processes of acquiring traffic information, basis for geometry modeling from TCPs and
the integration process were explained. Animations showing traffic flow during each
construction phase were run and a small questionnaire was given to each participant at
the end. Having explained the integration process and demonstrated the capabilities of
these models, each participant was asked how they could use this tool in their daily job.
Among the 15 participants, most of them concluded that these models can be definitely
useful in more than one phase of a project, provided the constraints of time and level of
detail are met as per project’s requirement. Also, traffic engineers explained many

75
situations they faced when managing their regular projects where traffic management in
construction zones become very critical and opined that availability of such a pro-active
tool can reduce impacts on construction.
The interviews are summarized as follows:
Applicability of these models based on project phase is shown in figure 5.35. As
per the interviews, 60% agree that 3-D models with traffic information can be used in the
conceptual design phase of a transportation project. Similarly, 20%, 80% and 87% agree
that the models can be used for project design, TMP and construction phases
respectively.
Figure 5.34 Bar chart showing use of 3-D models with traffic in various phases of project
Further during each of the above mentioned phases, specific areas of application
were sought and the opinion based results are explained in following figures:
60%
20%
80% 87%
0%
20%
40%
60%
80%
100%
ConceptualPlanning
ProjectDesign
TMP Construction
Use of 3-D models with traffic
Use of 3-D modelswith traffic
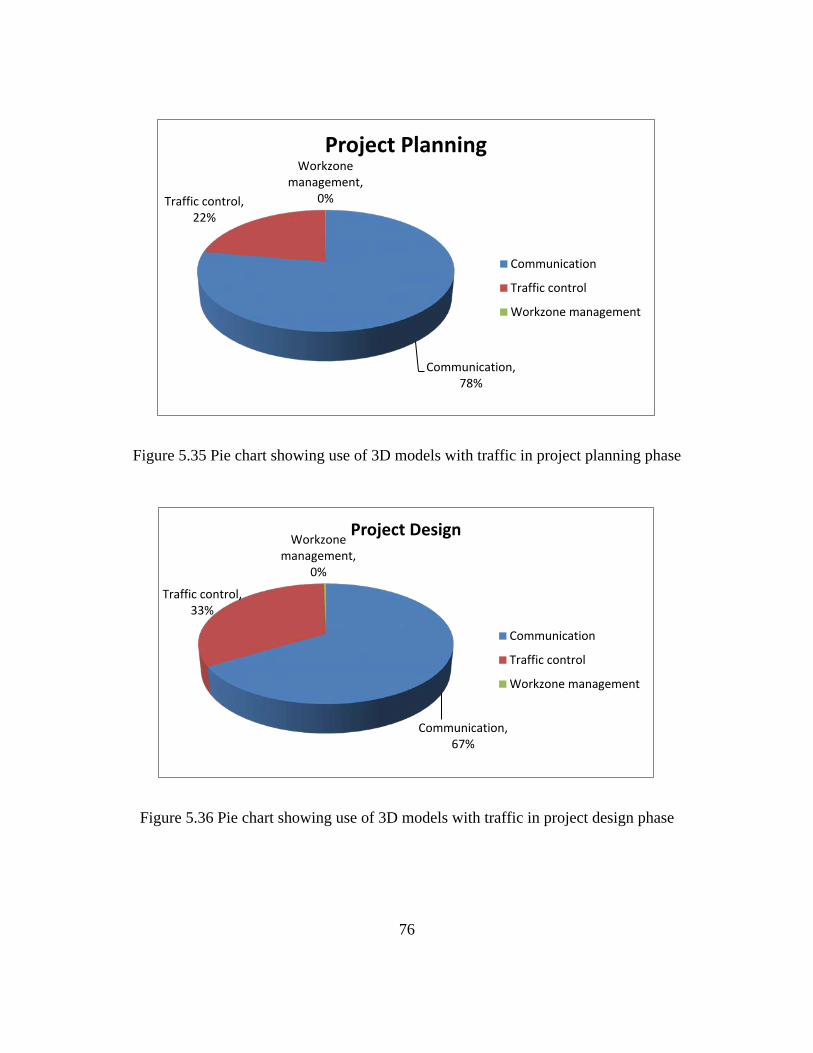
76
Figure 5.35 Pie chart showing use of 3D models with traffic in project planning phase
Figure 5.36 Pie chart showing use of 3D models with traffic in project design phase
Communication, 78%
Traffic control, 22%
Workzone management,
0%
Project Planning
Communication
Traffic control
Workzone management
Communication, 67%
Traffic control, 33%
Workzone management,
0%
Project Design
Communication
Traffic control
Workzone management
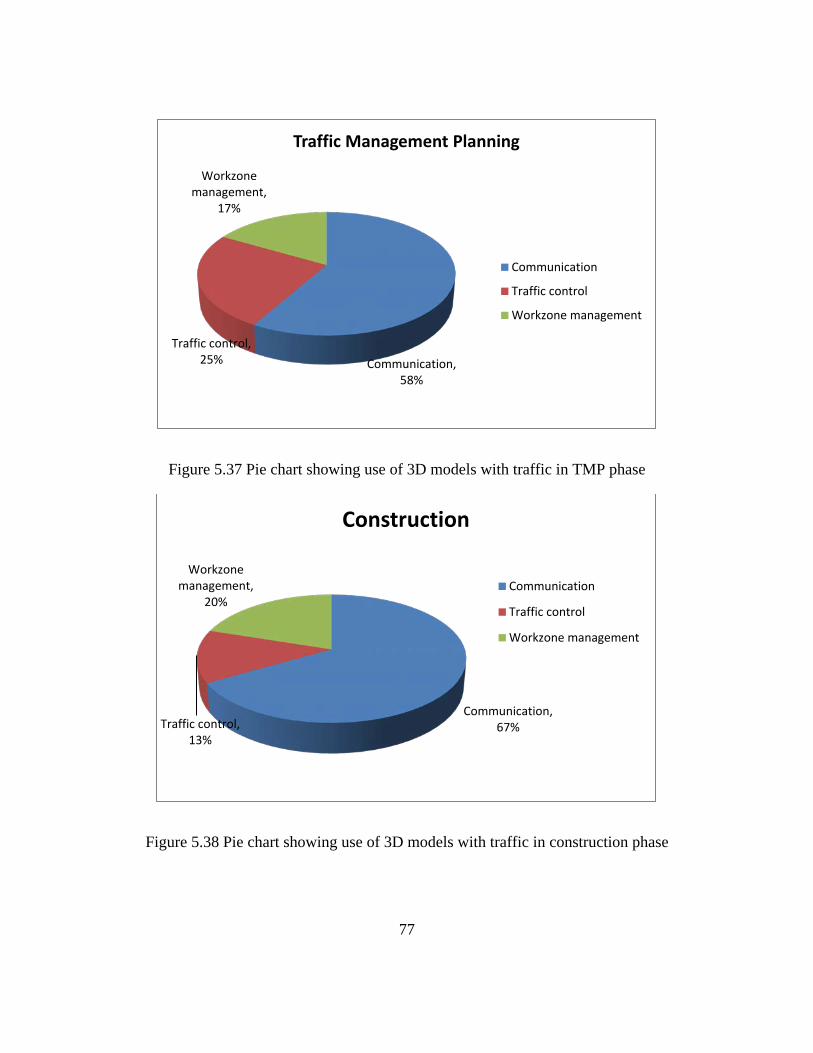
77
Figure 5.37 Pie chart showing use of 3D models with traffic in TMP phase
Figure 5.38 Pie chart showing use of 3D models with traffic in construction phase
Communication, 58%
Traffic control, 25%
Workzone management,
17%
Traffic Management Planning
Communication
Traffic control
Workzone management
Communication, 67% Traffic control,
13%
Workzone management,
20%
Construction
Communication
Traffic control
Workzone management

78
Figure 5.39 indicates 67% of the participants agree that during construction these
models can be used for communication across various stakeholders. Similarly, 13% agree
that these can be used for traffic control and 20% for workzone management.
The areas of application of these models are:
Construction phasing visualization – The models facilitated accurate
representation of TCP plans describing how the intersection will look while it is being
constructed in phases. As the intersection is scheduled to be constructed in a span of 19
weeks and the intersection is one of the busiest along IH 820, it is definitely useful to the
local businesses and residents to understand the phasing and traffic patterns. They can
focus on discussing their concerns with DOT officials and builders, more easily than with
separate traffic and geometry visualization.
Public information – Level of service is reduced during construction of most of
the intersections. The observations (increased congestion, changes in lane
configurations) made earlier in the visualization section can be justified and the reasons
for lane detours, closures and shifts can be explained to the public. This helps in
receiving public approval prior to construction and thereby reduces the chances of
construction delays or design changes as the communication is done pro-actively.
Rapid TCP analysis – During TCP design, parametric study can be done on
various alternatives under consideration and their performance can be checked
immediately. During project execution, any changes in the TCPs can be immediately
visualized. Construction schedule slippage might result in excess or reduced stretch of
pavement for traffic movement. TCP at any point of interest can be optimized by
visualizing as-built geometry up to that point of time from 4-D simulation.
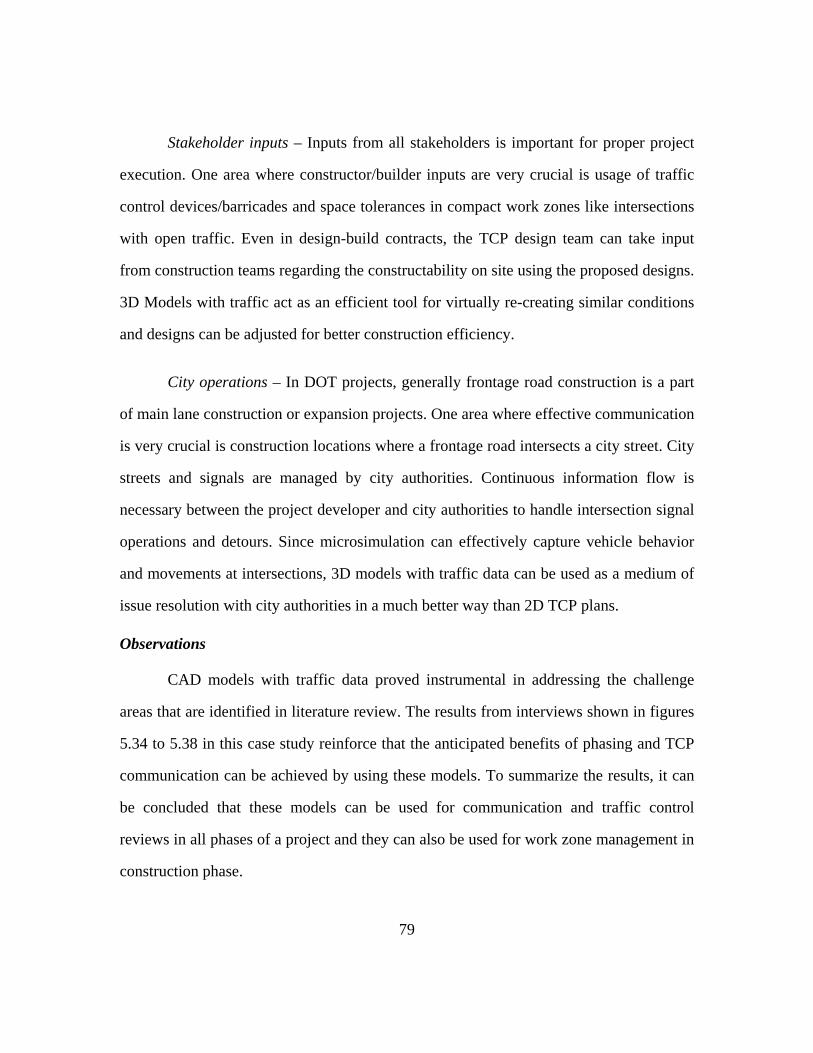
79
Stakeholder inputs – Inputs from all stakeholders is important for proper project
execution. One area where constructor/builder inputs are very crucial is usage of traffic
control devices/barricades and space tolerances in compact work zones like intersections
with open traffic. Even in design-build contracts, the TCP design team can take input
from construction teams regarding the constructability on site using the proposed designs.
3D Models with traffic act as an efficient tool for virtually re-creating similar conditions
and designs can be adjusted for better construction efficiency.
City operations – In DOT projects, generally frontage road construction is a part
of main lane construction or expansion projects. One area where effective communication
is very crucial is construction locations where a frontage road intersects a city street. City
streets and signals are managed by city authorities. Continuous information flow is
necessary between the project developer and city authorities to handle intersection signal
operations and detours. Since microsimulation can effectively capture vehicle behavior
and movements at intersections, 3D models with traffic data can be used as a medium of
issue resolution with city authorities in a much better way than 2D TCP plans.
Observations
CAD models with traffic data proved instrumental in addressing the challenge
areas that are identified in literature review. The results from interviews shown in figures
5.34 to 5.38 in this case study reinforce that the anticipated benefits of phasing and TCP
communication can be achieved by using these models. To summarize the results, it can
be concluded that these models can be used for communication and traffic control
reviews in all phases of a project and they can also be used for work zone management in
construction phase.

80
In the present case study for the Beach Street intersection, it is observed that the
congestion on the westbound frontage road is much higher when compared to that on the
Beach Street and the eastbound frontage road. Using these visualizations, the
understanding of construction impact on traffic operations due to the partial lane closures
is greatly enhanced than reviewing 2D TCP plans or 4D construction animations. This
can be a very effective tool for the traffic engineers to oversee traffic operations during
construction.Moreover, the ability of these models to integrate different file types from
different programs and to export results in a variety of formats like videos, rendered
images can greatly help in communicating the project information across different
platforms viz., project meetings, open house public meetings, project websites and social
media.These features enable the models to be used by both traffic engineers and non-
engineers.
The current method of realistic traffic visualization takes considerable time to
produce the desired results. Accuracy of inputs and level of detail are the two main
factors that can affect the output of these models. Discussion on improvement for current
method is mentioned in chapter 6.

81
FM 2347 GEORGE BUSH INTERCHANGE PROJECT
The following project demonstrates usefulness of traffic visualization in 3-D
models during the project TMP planning phase. This project was extensively analyzed to
explain how 3D/4D CAD models can be used in conjunction with traffic management
planning to develop an integrated framework for developers to further review and
communicate the project strategies to stakeholders by former member of the team, Jean
Goyat in (Goyat, 2012) as a part of his Master’s thesis. As the next step, effectiveness of
traffic integrated 3D models to add further value to TMP planning is explored in this case
study.
Overview
Figure 5.39 Map overview of proposed George Bush and Wellborn Road intersection

82
This intersection reconstruction project is a $25 million project in College Station, Texas
to enhance mobility, pedestrian safety and reduce delays in the congested intersection in
peak hours since Union Pacific Railroad (UPRR) and both roads, George Bush Drive and
Wellborn Road (FM2154), with high traffic volumes share the same intersection.
The scope of this project includes:
• Excavation of existing grades to depress the mainlanes of the George Bush Drive
and Wellborn road
• Construction of a rail road bridge over the depressed sections of the roadway
while maintaining the existing tracks of UPRR
Challenges
The challenges involved with this project are discussed in detail by Jean Goyat (Goyat,
2012) a former researcher of the team, which primarily included heavy traffic, lack of
construction space because of Texas A&M University facilities nearby and the
construction schedule.
Two construction scenarios are proposed for construction of this intersection
Scenario 1 – This option tries to carry out the intersection construction with the
maximum possible number of lanes open throughout construction. Phasing of
construction is expected to be complex and also escalates cost of the project.
Scenario 2 – As per this scenario, the intersection is closed for all road users which will
reduce the duration and cost of building the intersection.
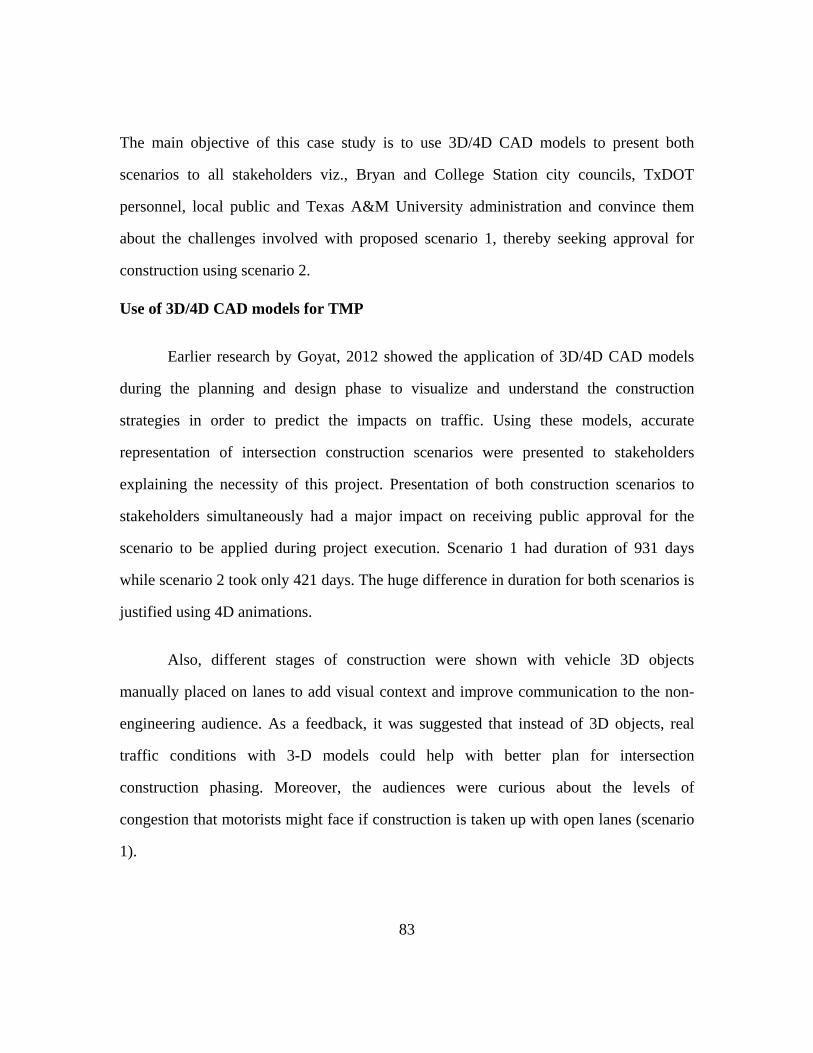
83
The main objective of this case study is to use 3D/4D CAD models to present both
scenarios to all stakeholders viz., Bryan and College Station city councils, TxDOT
personnel, local public and Texas A&M University administration and convince them
about the challenges involved with proposed scenario 1, thereby seeking approval for
construction using scenario 2.
Use of 3D/4D CAD models for TMP
Earlier research by Goyat, 2012 showed the application of 3D/4D CAD models
during the planning and design phase to visualize and understand the construction
strategies in order to predict the impacts on traffic. Using these models, accurate
representation of intersection construction scenarios were presented to stakeholders
explaining the necessity of this project. Presentation of both construction scenarios to
stakeholders simultaneously had a major impact on receiving public approval for the
scenario to be applied during project execution. Scenario 1 had duration of 931 days
while scenario 2 took only 421 days. The huge difference in duration for both scenarios is
justified using 4D animations.
Also, different stages of construction were shown with vehicle 3D objects
manually placed on lanes to add visual context and improve communication to the non-
engineering audience. As a feedback, it was suggested that instead of 3D objects, real
traffic conditions with 3-D models could help with better plan for intersection
construction phasing. Moreover, the audiences were curious about the levels of
congestion that motorists might face if construction is taken up with open lanes (scenario
1).

84
With traffic volumes received from TxDOT, the feasibility of adding traffic data
to 3-D models was attempted by our team for the first time. Owing to the modeling and
time constraints, only existing conditions were modeled in 3D. Constraints regarding
modeling efforts, level of detail of model elements and implementation challenges were
noted for future evolution of the integration process.
Use of 3D/4D models with traffic
Further to earlier research, traffic microsimulation models were developed for
construction scenarios using TxDOT provided volumes in spreadsheets in contrast to the
NTE model where traffic assignment models were used to extract volumes.
Figure 5.40 4-D model showing construction phasing with one lane open (Goyat, 2012)

85
Virtual reality
Use of real traffic data in visualization avoids miscommunication of predicted
volumes during construction. It can be observed that in figure 5.41 George Bush Drive is
so congested in the 3D model where vehicles are manually placed as 3D objects.
However, when actual construction phase volumes are imported to 3D model from
microsimulation models, congestion is observed to be less severe than in earlier
visualizations. Road user traffic in work zones is generally added to provide the public
with a sense of congestion expected as a result of the on-going construction. As the
animationsfrom the models with traffic and construction are shared with the public
through eAlerts in project websites, updated in social networking websites like Twitter
and Facebook and local television media news, accuracy of visualization in construction
and traffic is very crucial for the acceptance by the public.
Figure 5.41 3D model with vehicle showing the expected traffic volume during this phase of construction
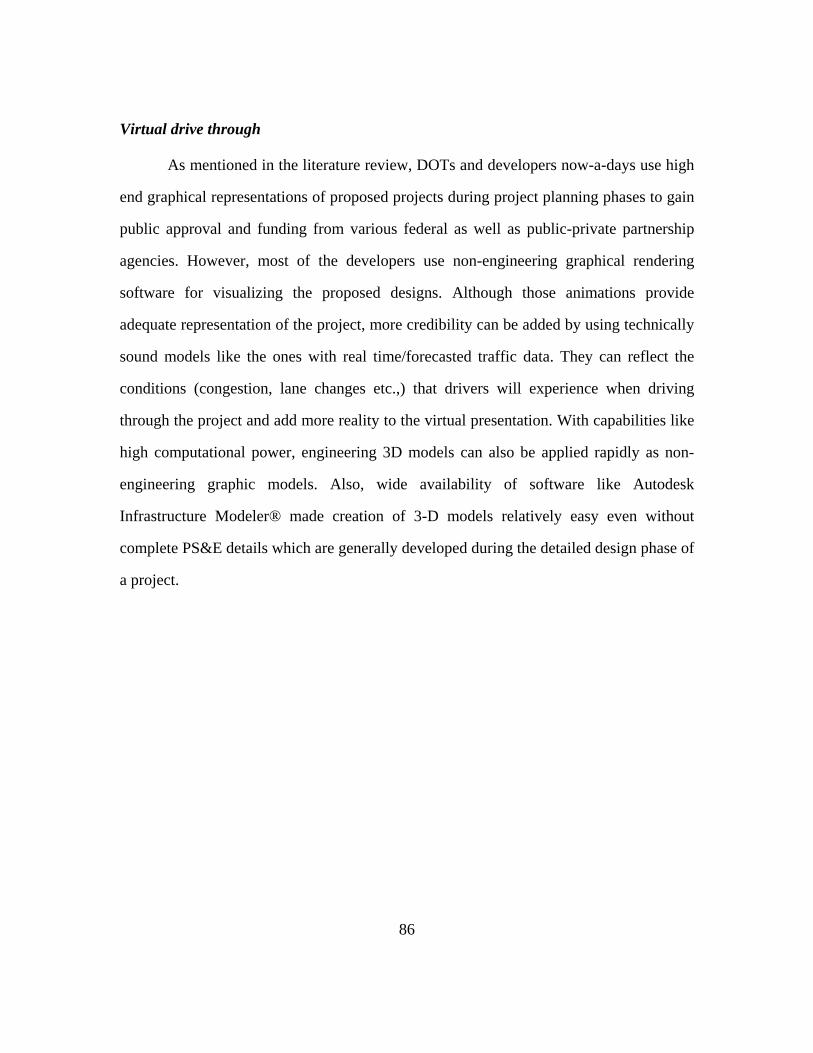
86
Virtual drive through
As mentioned in the literature review, DOTs and developers now-a-days use high
end graphical representations of proposed projects during project planning phases to gain
public approval and funding from various federal as well as public-private partnership
agencies. However, most of the developers use non-engineering graphical rendering
software for visualizing the proposed designs. Although those animations provide
adequate representation of the project, more credibility can be added by using technically
sound models like the ones with real time/forecasted traffic data. They can reflect the
conditions (congestion, lane changes etc.,) that drivers will experience when driving
through the project and add more reality to the virtual presentation. With capabilities like
high computational power, engineering 3D models can also be applied rapidly as non-
engineering graphic models. Also, wide availability of software like Autodesk
Infrastructure Modeler® made creation of 3-D models relatively easy even without
complete PS&E details which are generally developed during the detailed design phase of
a project.

87
Figure 5.42 Virtual drive through showing planned future traffic conditions of the project after finish of construction
Observations
From this case study it can be said that the CAD models with traffic are the next
frontier for visualization in roadway construction projects because of their ability to
replicate the existing traffic conditions into CAD models. Additionally, the future traffic
conditions can also be visualized for different scenarios like during construction and
during regular operations after facility construction. This will be a very useful tool for
traffic engineers and TMP planners to communicate their plans not only to non-engineers
but also to developers and city agencies for review/approval.

88
JW MARRIOTT - AUSTIN DOWNTOWN
Collection of field traffic data for a project area of interest is time consuming and
labor intensive process for any project team. In research methodology for this thesis, it
was proposed that instead of collecting the field data separately using existing techniques
(volume count/take-off from field/CCTV footage or loop counters), DTA models run by
DOTs for regular operation can be used. However, DTA models are mesoscopic models
which act as a transition between microscopic models and macroscopic models.
Macroscopic models are characterized by density, volume and mean velocity of traffic
flow in a large network whereas microscopic models analyze behavior of each vehicle
and its interaction with surrounding environment like lane changes, yield, stops etc.,
(Rose, 2004) Mesoscopic models contain properties of both microscopic and
macroscopic models. Hence, there is a necessity to calibrate the microscopic models or
verify them with field data.
Overview
In order to validate the volumes and turning movements derived from mesoscopic
DTA model, a construction detour scenario is chosen in nearby Austin downtown.
Construction of 1,200,000 square-foot JW Marriott Austin hotel is being done on the
northeast corner of Congress Avenue and 2nd St in downtown Austin, Texas (Hunt,
2012). Construction began in August 2012 and is expected to continue until the first
quarter of 2015.

89
Figure 5.43 Rendering of proposed JW Marriott hotel in Austin downtown
Traffic control
TCP documents were not available to analyze the change in traffic volume due to
construction. Hence, the construction site was visited and traffic control was analyzed
using detours denoted by signage and traffic control devices placed around the
construction site. During construction, westbound lanes on 2nd street are narrowed from 3
to 1 between Congress and Brazos Street. Part of left turning traffic on Brazos Street to
West 2nd street is detoured on to West 3rd street. Westbound lanes are closed between
Brazos Street and Trinity Street. Left turning traffic from Trinity Street on to West 2nd
street is directed to West 3rd street. Right turning traffic on south bound San Jacinto is
detoured on to West 3rd street prior to reaching 2nd street.

90
Figure 5.44 Graphic denoting detours around JW Marriott hotel site
Validation
Traffic counts at intersections were collected to validate the volumes derived from
the DTA model. Counts were done during peak hour of 5 pm to 6 pm at intersections 2nd
Street-Congress Avenue and 3rd Street-Congress Avenue. Left turn, right turn and
through movements were counted at both the intersections.
The turn volumes during construction were observed as tabulated below
Outflow at Intersection Left turn Through Right turn Total
2nd& Congress 45 24 closed 69
3rd& Congress 93 84 6 183
Table 5.1 Vehicle turn movement counts observed at 2nd and 3rd street intersections
Legend: Closed lane Detour lane
JW Marriott site

91
In the microsimulation model with no construction scenario, the volumes are as
follows
Inflow at Intersection
From Brazos left turn
From San Jacinto right turn
From Trinity left turn
Total
2nd& Congress 86 135 1 222
3rd& Congress 1 0 0 1
Table 5.2 Vehicle volumes for 2nd and 3rd street intersections in microsimulation model
Outflow at Intersection Left turn Through Right turn Total
2nd& Congress 134 86 2 222
3rd& Congress 1 0 0 1
Table 5.3 Vehicle turn movement volumes for 2nd and 3rd street intersections in microsimulation model
The microsimulation model is set up such that volumes for turn movements at
every node are calculated based on the probabilities assigned for turn movements. It is
assumed that the same proportion of vehicles take turns even during construction and the
probabilities for turn movements is kept constant for the construction scenario. During
construction, inflow volumes at the nodes of interest are changed due to closure of west
2nd street and re-direction of traffic on to 3rd street as follows
Inflow at Intersection
From Brazos left turn
From San Jacinto right turn
From Trinity left turn
Total
2nd& Congress 86 0 (detour) 0 (detour) 86
3rd& Congress 1 135 1 137
Table 5.4 Vehicle volumes for 2nd and 3rd street intersections in microsimulation model for construction scenario

92
Figure 5.45 Bar chart comparing total volumes at 3rd street intersection from microsimulation model and field vehicle counts
Figure 5.46 Bar chart comparing left and through movements at 2nd street intersection from microsimulation model and field vehicle counts
137
183
100 120 140 160 180 200
Model
Count
Traffic volumes
Comparison of microsim model with vehicle volumes at 3rd street
Totalvolumes
52
34
45
24
0 10 20 30 40 50 60
Left turn
Through
Traffic volumes
Comparison of microsim model with vehicle counts at 2nd street
Count
Model

93
From the bar chart it is observed that the actual vehicle count at the intersection of 3rd
street and Congress Avenue is 183 which is 33.57 % more than the expected volume of
137 vehicles. This anomaly can be attributed to the assumptions considered during the
setup of the DTA model. When modeling the mesoscopic model, vehicle movements are
directed towards sinks in the network. Sink can be a business location or a recreation
place which is destination for many vehicles in a network. From the figure 5.48 it can be
observed that sink is located on 2nd street. According to the model, the vehicles ending or
originating in 3rd street at intersections with Brazos and San Jacinto come under the sink
on 2nd street as they are connected to the sink (green lines). That is also the reason for
volume for inflow at the intersection of 3rd street and Congress Avenue in the table 5.2
is 0. However in the real case scenario, 3rd street must have non-zero peak hour volumes.
Also for Trinity Street, the location of the Austin Convention Center is considered as a
sink in figure 5.48, hence turning volumes and through volumes are less than what they
should be.
Figure 5.47 Image showing sink locations based on which vehicle volumes are derived
94
Also the turning volumes at intersection of 2nd street and Congress Avenue are slightly
less than the predicted volumes in the microsimulation model as observed in figure 5.47.
The reduction in volumes on west 2nd street is due to the general driver behavior to avoid
construction zones. Since west 2nd street was narrowed down to 1 lane from 3 lanes and
the area looks congested due to the placement of barricades, some drivers might have
been prompted to use 3rd street instead of 2nd street.
From this analysis, it can be concluded that input data for microsimulation models
from DTA models has to be further streamlined if construction in minor arterial roadways
or city roads is considered. However, the traffic data generated for highway and major
roadways is expected to be much accurate as the number of origin or destination points
will be lower than city roads.

95
Chapter 6 Conclusions
BENEFITS
This thesis has proposed a new dimension to applications of 3D/4D CAD
modeling in transportation construction projects. It is based on using mesoscopic DTA
models run by DOTs to collect traffic information for the project area of interest and
simulate real traffic conditions in microsimulation models. Output from microsimulation
models is added to 3D/4D CAD models to further evaluate TCPs and communicate them
better, rather than communicating the geometry and traffic conditions separately. To our
knowledge, this is the first such modeling of using DTA models to represent traffic
conditions in construction projects using CAD models based on our literature review.
The models turned out to be an efficient way to incorporate vehicular traffic
conditions in addition to spatial and temporal conditions that CAD models have been
addressing. Computational power and improved interoperability between software has
facilitated to consider all parameters that can influence execution of infrastructure
projects. These models are instrumental in communicating construction phasing, TCPs
during each phase of construction, proposed geometric designs to convey complete
information about the project. The final product is one virtual model, which can be used
to communicate multiple aspects of the project as mentioned above. Models being
incorporated with proposed geometry, TCP information and real-time traffic conditions,
from which animations or pictures can be easily generated, they can be used by engineers
(traffic engineers, TMP planners, builders) and non-engineers (local public, funding
agencies, government bodies) for review of proposed plans. Change management process
becomes consistent and easier as all the stakeholders can use a single model instead of
multiple tools (3D geometry models, microsimulation animations). The same has been

96
mentioned in the feedback collected by the author from transportation researchers and
traffic engineers.
The thesis has laid down a framework for better planning, design analysis and
communication of transportation projects across various stakeholders involved with the
project. The methodology used to collect data is less time consuming than other
traditional methods. However, the process of extracting regional traffic data from huge
DTA models is still in evolving stage as the parameters considered for mesoscopic
models and microscopic models are different. A concrete methodology is yet to be
developed to bridge the gap between these two types of models to generate accurate data
reflecting the real conditions. This is evident through the case study done in this thesis to
validate the microscopic models generated using DTA models. Further refining is
needed, when the localized details such as volumes of local streets are needed for
analysis. Since DTA model generally allocates vehicle movement based on locations of
sinks, the volumes might not reflect the actual conditions at micro level. Based on the
results observed in case studies, this approach suits better for projects involving freeway
and highway construction, as less number of sinks are encountered when compared to
construction projects undertaken in urban or business areas.
As explained in the case studies, the prime focus of this report was directed
towards traffic visualization during construction and TMP planning phases of a roadway
construction project. Based on the observations and the feedback from surveys, the areas
of challenge, the benefits achieved, their audience and relevance to that particular
challenge area are tabulated as follows:
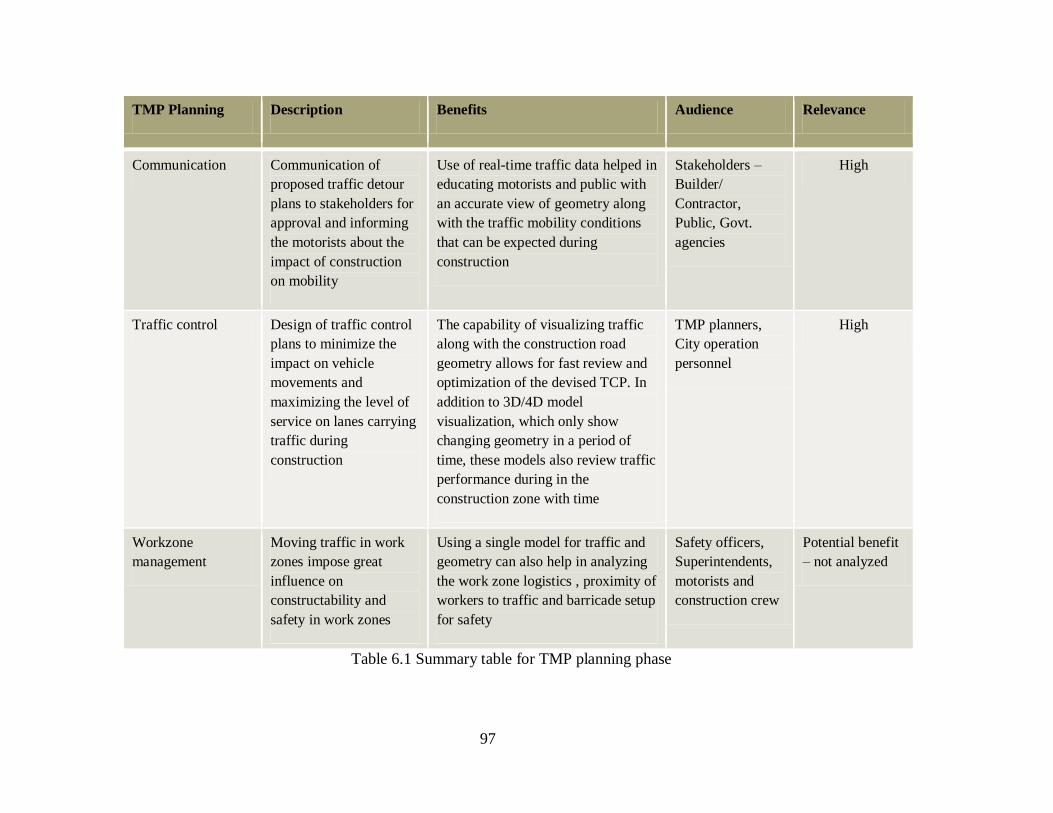
97
TMP Planning Description Benefits Audience Relevance
Communication Communication of
proposed traffic detour
plans to stakeholders for
approval and informing
the motorists about the
impact of construction
on mobility
Use of real-time traffic data helped in
educating motorists and public with
an accurate view of geometry along
with the traffic mobility conditions
that can be expected during
construction
Stakeholders –
Builder/
Contractor,
Public, Govt.
agencies
High
Traffic control Design of traffic control
plans to minimize the
impact on vehicle
movements and
maximizing the level of
service on lanes carrying
traffic during
construction
The capability of visualizing traffic
along with the construction road
geometry allows for fast review and
optimization of the devised TCP. In
addition to 3D/4D model
visualization, which only show
changing geometry in a period of
time, these models also review traffic
performance during in the
construction zone with time
TMP planners,
City operation
personnel
High
Workzone
management
Moving traffic in work
zones impose great
influence on
constructability and
safety in work zones
Using a single model for traffic and
geometry can also help in analyzing
the work zone logistics , proximity of
workers to traffic and barricade setup
for safety
Safety officers,
Superintendents,
motorists and
construction crew
Potential benefit
– not analyzed
Table 6.1 Summary table for TMP planning phase
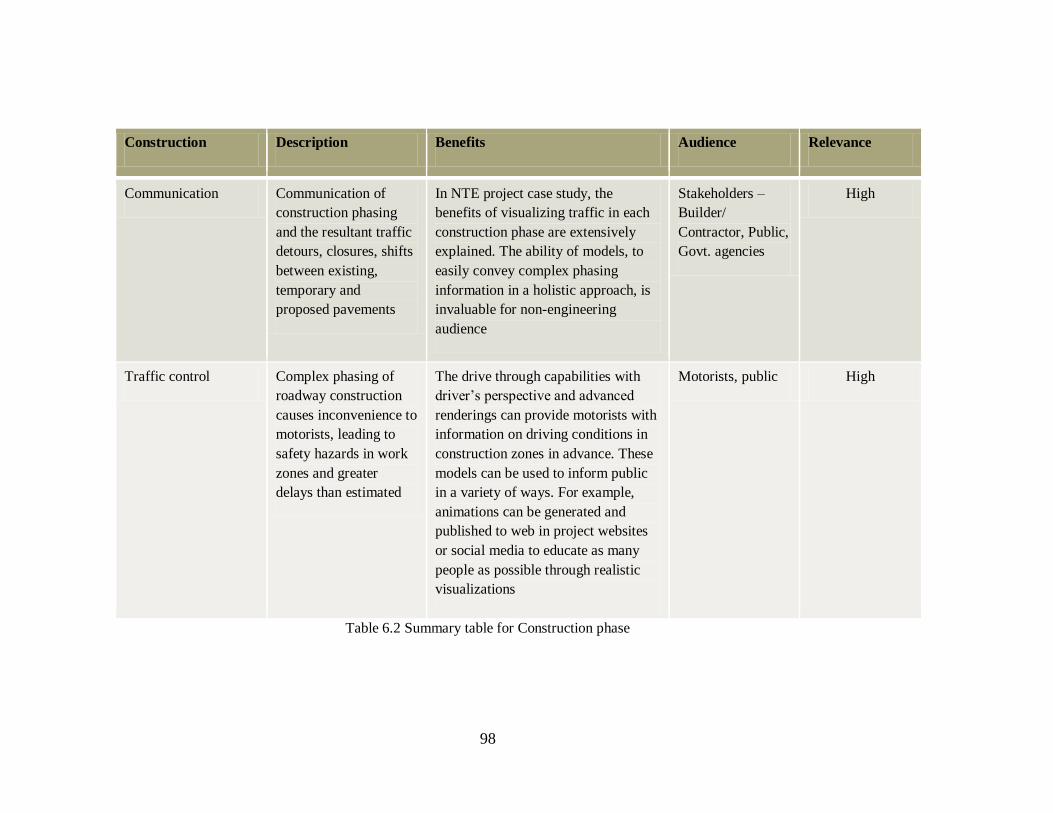
98
Construction Description Benefits Audience Relevance
Communication Communication of
construction phasing
and the resultant traffic
detours, closures, shifts
between existing,
temporary and
proposed pavements
In NTE project case study, the
benefits of visualizing traffic in each
construction phase are extensively
explained. The ability of models, to
easily convey complex phasing
information in a holistic approach, is
invaluable for non-engineering
audience
Stakeholders –
Builder/
Contractor, Public,
Govt. agencies
High
Traffic control Complex phasing of
roadway construction
causes inconvenience to
motorists, leading to
safety hazards in work
zones and greater
delays than estimated
The drive through capabilities with
driver’s perspective and advanced
renderings can provide motorists with
information on driving conditions in
construction zones in advance. These
models can be used to inform public
in a variety of ways. For example,
animations can be generated and
published to web in project websites
or social media to educate as many
people as possible through realistic
visualizations
Motorists, public High
Table 6.2 Summary table for Construction phase

99
Construction Description Benefits Audience Relevance
Workzone
management
Traffic control devices
form an integral part of
workzone safety during
construction with
moving traffic
3D models with traffic data can be
used to review the traffic control
device plans for adequacy and
effectiveness. They can be analyzed
from driver’s perspective and check if
sufficient reaction time is offered by
these devices for the drivers to react
Safety officers,
TCP planners and
motorists
Medium
Table 6.2 Summary table for Construction phase (cont.)

100
IMPLEMENTATION CHALLENGES
The benefits of these models are highly dependent on the accuracy of TCPs,
schedules and the DTA models used to generate microsimulation models. Non-
compliance of any of these can jeopardize the credibility of what these models
communicate. Continuous review of these models by project schedulers, TMP planners
and DOT operations is necessary for successful implementation of CAD models with
traffic information.
With the software that is used in this thesis, it is difficult to develop a single 3D
model with traffic data for huge construction project like North Tarrant Express, which is
spread over a length of about 13 miles. The results of traffic microsimulation models are
very much dependent on the surrounding conditions. Bigger the network, more are the
parameters that affect simulation model’s performance. Hence work zones for which
these models have to be developed should be chosen only if the project team decides it is
worthwhile to visualize traffic data with geometry. There are no parameters suggested in
this thesis that can suggest which work zone area has to be selected. Public meetings and
traffic planning/operations of DOTs are a good source to collect feedback on areas with
complex TCP and congestion for any project. For example, N.Beach intersection case
study was taken up based on interviews with public information officers of NTE project.
Any photorealistic representation of reality has to deal with the level of detail that
has to be incorporated into the virtual creation. Past research suggests thatthe level of
detail has to be ascertained based on the audience for the virtual models. During author’s
interviews with researchers and traffic engineers, feedback was sought for the same.
Many of the traffic engineers felt the level of detail used in NTE case study is sufficient
enough to communicate even to non-engineering audience as more details can confuse
101
audience and the objectives of these models might get lost. However, some opined that
inclusion of traffic control devices might add more reality to TCP communication as any
construction zone is accompanied by traffic control devices to communicate to driving
motorists.
RECOMMENDATIONS
Advanced computational power has made it possible to extract regional traffic
data from DTA models and combine them with 3D/4D CAD models using
microsimulation. More credibility can be added to these models with more contextual
information around work zone area. This can be achieved by using point cloud
technology and add existing infrastructure, landmarks etc. to improve communication as
well as consider all the space constraints when designing for temporary pavements during
TMP planning. Extraction of existing 3D models from point cloud data reduce time for
modeling, thereby more efforts can be put for TCP analysis and review.
Further refinement can be done when generating input data for microsimulation
models from DTA models. Area of interest (freeway, intersection, city streets) can be
used to customize DTA models and extract data which can represent the reality up to the
maximum extent. Most of the available software for modeling are customizable.
Application Program Interface (API) can be used to introduce plug-ins into the
application resulting in increased processing capabilities to combine 3D geometry
information, traffic data etc. In this thesis, multiple 3D models are developed to represent
each phase of construction and traffic information is added to each model. It would be
very advantageous if different traffic data can be imported during different phases of
construction in a 4D simulation using a single 3D model. That would tremendously

102
decrease the modeling time and output can be delivered with less man hour efforts. Use
of APIs in 4D simulators like Navisworks can make this possible.
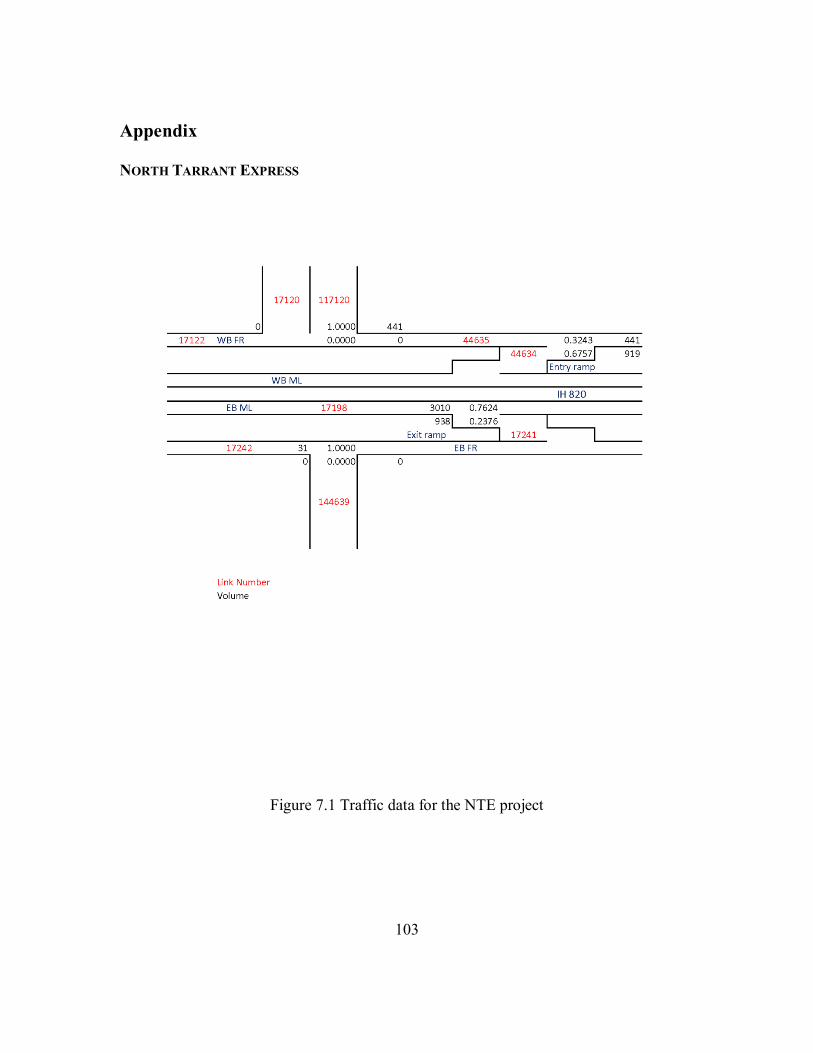
103
Appendix
NORTH TARRANT EXPRESS
Figure 7.1 Traffic data for the NTE project

104
Figure 7.2 Traffic data for the NTE project

105
FM 2154 AND GEORGE BUSH DRIVE INTERSECTION
Figure 7.3 Traffic data for the FM 2154 project

106
Figure 7.4 Traffic data for the FM 2154 project

107
Figure 7.5 Traffic data for the FM 2154 project
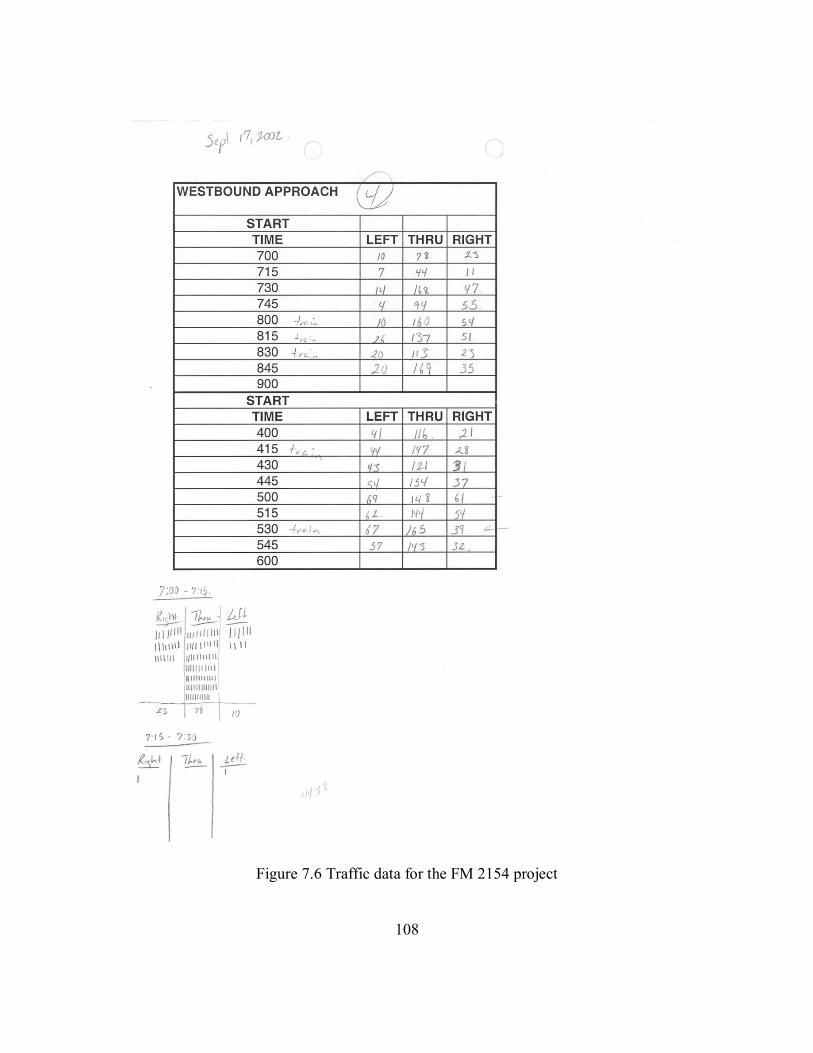
108
Figure 7.6 Traffic data for the FM 2154 project

109
Figure 7.7 Average daily traffic volumes for FM 2154 project

110
JW MARIOTT AUSTIN
Figure 7.8 Traffic data for the JW Marriott project

111
Figure 7.9 Traffic data for the JW Marriott project

112
Figure 7.10 Traffic data for the JW Marriott project

113
References
Anderson, S. D. (1999). Constructability Issues for Highway Projects. Journal of
Management in Engineering.
Bentley systems. (2012). www.bentley.com. Retrieved from www.bentley.com:
http://www.yearininfrastructure-digital.com/yearininfrastructure/2012#pg150
California Department of Transportation. (2002). Guidelines for Applying Traffic
Microsimulation Modeling Software.
Chiu, Y.-C. et al. (2011). Dynamic Traffic Assignment - A Primer. Transportation
Research Board.
FDOT. (2012). Project Traffic Forecasting Handbook. State of Florida.
FDOT. (2012). Project Traffic Forecasting Handbook. Department of Transportation,
State of Florida.
Federal Highway Administration, U.S. DOT. (2010). To Lessen Work Zone Impacts: Try
TMPs. Public Roads.
FHWA. (2004). Traffic Analysis Toolbox Volume I: Traffic Analysis Tools Primer. U.S.
Department of Transportation.
FHWA. (2004). Traffic Analyss Toolbox Volume II: Decision Support Methodology for
Selecting Traffic Analysis Tools. U.S. Department of Transportation.
FHWA, U.S. Department of Transportation. (2010). Visualization's Next Frontier.
FHWA-HRT-10-002.Volume 73. No.4
Garrick, N., Miniutti, P., Westa, M., Luo, J., & Bishop, M. (2005). Effective visualization
techniques for the public representation of transportation projects. The New
Englan Transportation Consortium.
Gau, P. (2009). Benefits of 3D/4D CAD Model Applications for Constructability Review
in Transportation Projects. Austin, TX: The University of Texas at Austin.
Goyat, J. (2012). Using 3D/4D CAD Modeling for Traffic Management Development
Review, and Communication. Austin, TX: The University of Texas at Austin.
Hughes et al. (2007). 3D Visualization and Micro-Simulation Applied to the
Identification and Evaluation of Geometric and Operational 'Solutions' for
Improving Visually Impaired Pedestrian Access to Roundabouts and Channelized
Turn Lanes.Denver CO.: Transportation Research Board

114
Hunt. (2012). www.huntconstructiongroup.com. Retrieved April 2013, from
http://www.huntconstructiongroup.com/jw-austin.html
Liapi, K., O'Connor, J., & Khwaja, N. (2003). Highway Interchanges: Construction
Schedule and Traffic Planning Visualization. Washington D.C.: Transportation
Research Board.
Mai, C. (2009). Project Level Traffic Management Plan. Oregon Department of
Transportation.
North Tarrant Express/Maps. (n.d.). Retrieved April 8, 2013, from North Tarrant
Express: http://northtarrantexpress.com/Maps.asp
NTE. (2012). http://www.northtarrantexpress.com. Retrieved April 2013, from
http://northtarrantexpress.com/Photos/4D%20Modeling.JPG
NTE. (2012). North Tarrant Express. Retrieved April 2013, from
http://northtarrantexpress.com/Maps.asp
NTE. (2012). www.northtarrantexpress.com. Retrieved April 2013, from
http://northtarrantexpress.com/Photos/DSC04333.JPG
O'Brien, W. J., Goyat, J., Khwaja, N., & Gau, P. (2012). Benefits of Three- and Four-
Dimentional Computer-Aided Design Model Applications for Review of
Constructability. Journal of Transportation Research Board, 2268/2012, 18-25.
Rose, M. (2004). Modeling of Freway Traffic. International Conference on Computing in
Ciivl and Building Engineering.
Russell, J., Radtke, M., & Gugel, J. (1992). Project level model and approaches to
implement constructability. Construction Industry Institute, University of Texas at
Austin.
Sbyati, H., & Roden, D. (2010). Best Practices in the Use of Micro Simulation Models.
American Association of State HIghway and Transportation Officials
(AASHTO).
Schmeits, C. (2011). Case Study Assessment of 3D and 4D Modeling Technques for Early
Constructability Review of Transportation Projects. Austin, TX: The University
of Texas at Austin.
TxDOT. (2012). http://www.dot.state.tx.us/. Retrieved April 2013, from
http://www.dot.state.tx.us/project_information/projects/fort_worth/north_tarrant_
express
115
TxDOT. (2012). Project Development Process Manual. Texas Department of
Transportation.
TxDOT. (October, 2012). Manual Notice 2012-1. Project Development Process Manual:
Texas Department of Transportation.
U.S. Department of Transportation. (2004). Traffic Analysis Toolbox Volume I: Traffic
Analysis Tools Primer.
U.S. Department of Transportation Federal Highway Administration Office of
Operations. (2005). Developing and Implementing Transportation Management
Plans for Work Zones.
Waite, C., & Szplett, D. (2005). Guidelines for Using Simulation Models for Public
Meetings. Institute of Transportation Engineers.
Wang, X. (2005). Integrating GIS, simulation models, and visualization in traffic impact
analysis. Computers, Environment and Urban systems, 29(4), 471-496.
Yu, L., & Fengxiang, Q. (2002). Using real-time traffic data for transportation planning.
Department of Transportation Studies.