Embed Size (px)
Citation preview

copyright by Zackary Johnson
2000


iv
Abstract
Marine photosynthesis accounts for approximately half of all global primary
production. It is crucial in providing the base of the marine food chain and a
critical component of the global carbon cycle. Because all but the upper few
meters of the ocean is light-limited with respect to photosynthesis,
photosynthesis and photosynthetic efficiency are often described using the
photosynthesis-irradiance curve. This curve is convenient to measure and varies
significantly with the environment. Nevertheless, the photosynthesis-irradiance
relationship only provides an empirical description of photosynthetic efficiency
and has little diagnostic and prognostic capacity. To understand modes of
photosynthesis-irradiance variability, I focus on photosystem II-specific
processes as a potentially dominant determinant of photosynthesis-irradiance
magnitude and structure. I use the marine diatom Skeletonema costatum as a
model marine phytoplankter and probe the role that photosystem II has in
determining photosynthesis-irradiance relationships in the context of very low
background light, photoacclimation and nitrogen limitation. I also use the fresh
water green alga Chlamydomonas reinhardtii that is mutant in the xanthophyll
cycle to investigate non-photochemical quenching. I relate photosystem II-
specific (fluorescence) measures in the presence of a background irradiance
gradient of conversion efficiency and cross-sectional area to observed carbon
uptake and oxygen evolution-based measures of photosynthesis-irradiance,
photosynthetic unit cross section, photosynthetic unit size and photosynthetic unit
turnover. These results demonstrate that under a variety of environmental
v
situations characteristic of natural oceanic variability, photosystem II properties
describe well the relative structure of photosynthesis-irradiance curves.
However, other processes not associated with photosystem II (or characterized
by fluorescence) and unique to each environmental situation can significantly
impact the magnitude of photosynthetic rates and efficiency. Combined, these
results demonstrate the utility of photosystem II properties as a function of
background irradiance in describing the irradiance structure of photosynthetic
efficiency, but also demonstrate the limitations of fluorescence techniques.

vi
Acknowledgements
This dissertation greatly benefited from the advice, support and encouragement
of many people. My advisor Dr. Barber, who guided me as an apprentice, gave
me professional and financial latitude to explore new ideas, make mistakes (and
profit from them) and encouraged me to grow as a thinker and scientist. My
committee members, Ramus, Kamykowski, Siedow and Falkowski supported me
academically, technically and financially and their input greatly advanced this
dissertation. I thank Lisa Borden, Anna Hilting, Tim Boynton, Patty Nolin and Bill
Hunnings as well as many others for technical and logistic support. I also thank
Dr. Sallie Chisholm, Melanie and Ronald Johnson and many others who kept me
motivated and encouraged. And thank you to all of my graduate student friends
at the Duke Marine Laboratory - you were the salt on my french fry of graduate
school life.
Thank you.
vii
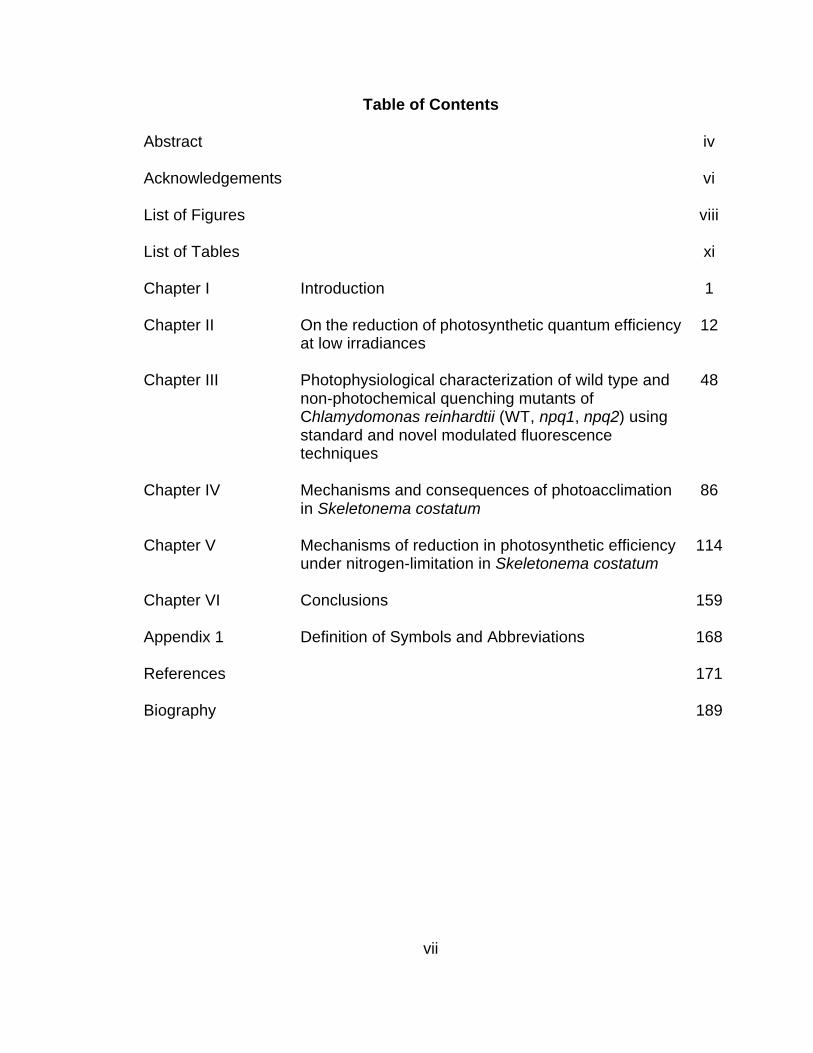
Table of Contents
Abstract
iv
Acknowledgements
vi
List of Figures
viii
List of Tables
xi
Chapter I
Introduction 1
Chapter II
On the reduction of photosynthetic quantum efficiency at low irradiances
12
Chapter III
Photophysiological characterization of wild type and non-photochemical quenching mutants of Chlamydomonas reinhardtii (WT, npq1, npq2) using standard and novel modulated fluorescence techniques
48
Chapter IV
Mechanisms and consequences of photoacclimation in Skeletonema costatum
86
Chapter V Mechanisms of reduction in photosynthetic efficiency under nitrogen-limitation in Skeletonema costatum
114
Chapter VI
Conclusions 159
Appendix 1
Definition of Symbols and Abbreviations 168
References
171
Biography 189

viii
List of Figures
Figure page II-1 Growth and Measurement Spectra
38
II-2 Contemporary models of photosynthesis-irradiance expressed in (a) P-E, (b) φ-E and (c) φ-log(E) formats
39
II-3 (a) P-E, (b) P-E (log E format) and (c) φC-E (log E format) for S. costatum
40
II-4 P-E and φ-E measured for a variety of cultured phytoplankton species using oxygen evolution (a,b) and carbon uptake (c,d)
41
II-5 P-E and φ-E measured for an Arctic field population using oxygen evolution (a,b) and carbon uptake (c,d)
42
II-6 (a) P-E and (b) φC-E measurements with different light colors for S. costatum and D. tertiolecta
43
II-7 Models of P-E with varying amounts of low light φ reduction expressed in (d) P-E, (e) φC-E and (f) φC-log(E) formats
45
II-8 (a) P-E, (b) P-E (log E format), (c) φC-E (log E format) and (d) fraction of maximum slope as a function of number of points used in linear regression for blue-grown and blue-measured S. costatum
46
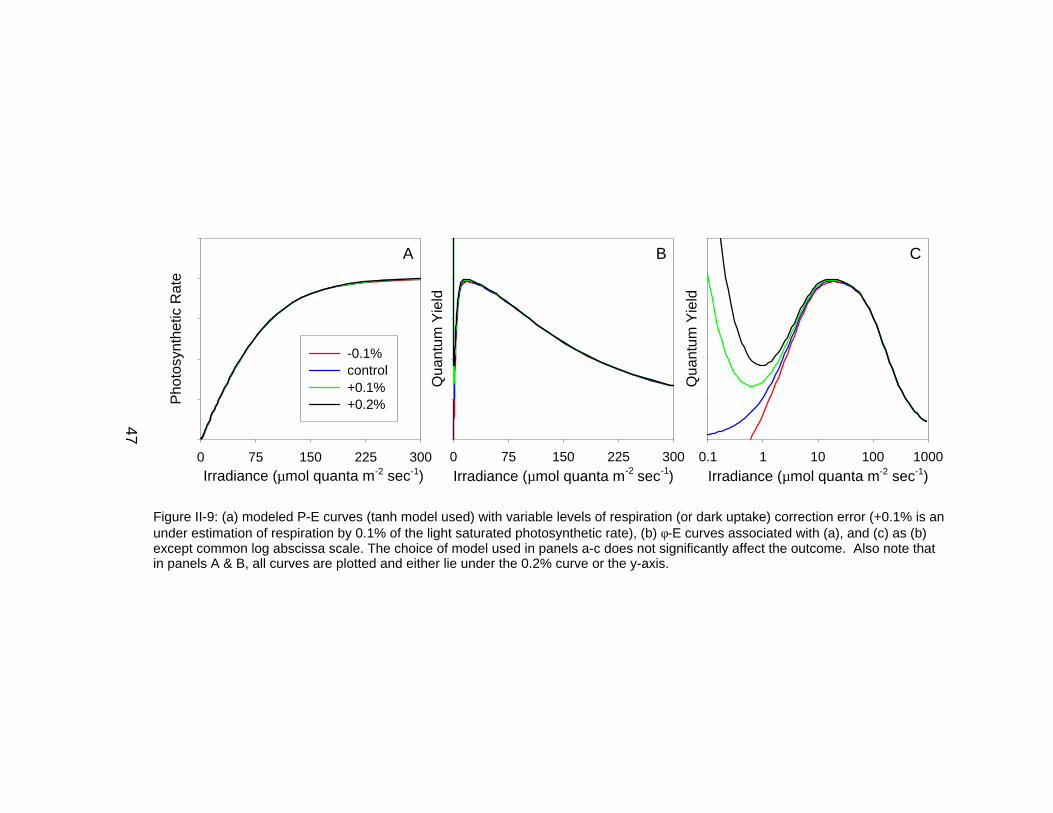
II-9 Models of P-E with varying amounts of respiration correction error expressed in (d) P-E, (e) φC-E and (f) φC-log(E) formats
47
III-1 Schematic block diagram of the BIG-FRRf
76
III-2 Representative BIG-FRRf output data from WT C. reinhardtii
77
III-3 (a) Chlorophyll a-specific absorption spectra for WT, npq1 and npq2 C. reinhardtii and (b) percent deviation from WT
79
III-4 Photosynthesis-irradiance curves for WT, npq1, and npq2 C. reinhardtii
80
III-5 Representative fluorescence excitation curves from BIG-FRRf
81
ix
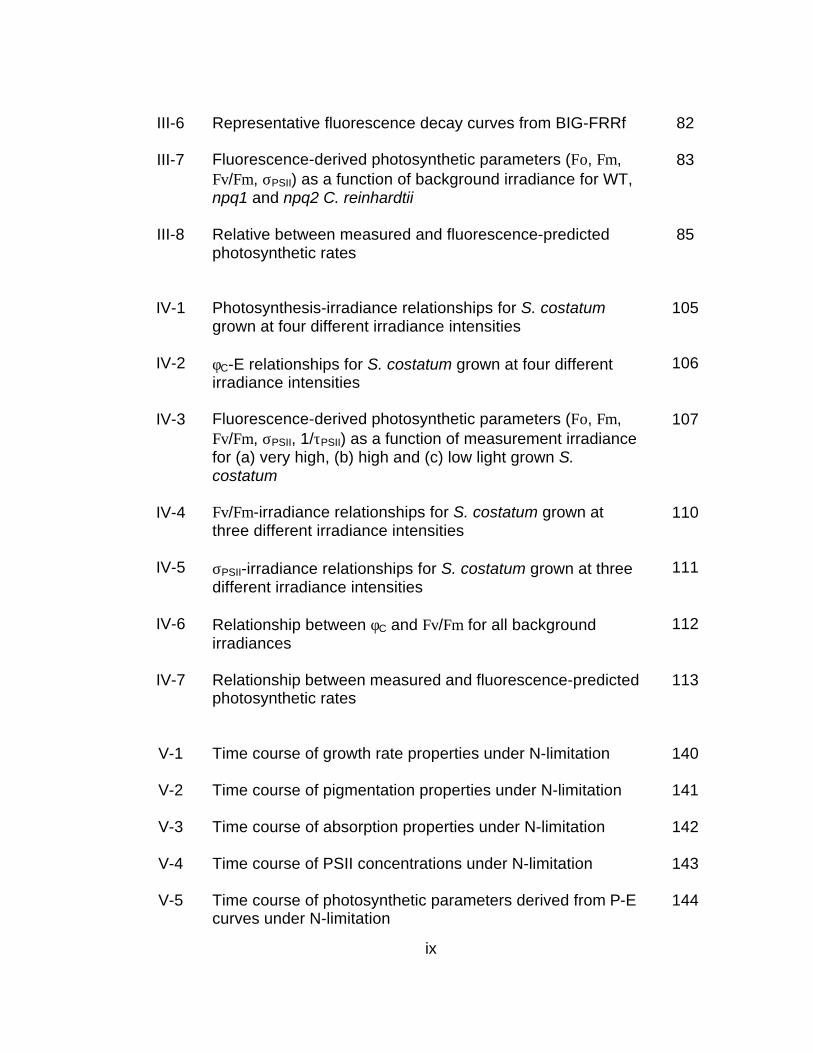
III-6 Representative fluorescence decay curves from BIG-FRRf
82
III-7 Fluorescence-derived photosynthetic parameters (Fo, Fm, Fv/Fm, σPSII) as a function of background irradiance for WT, npq1 and npq2 C. reinhardtii
83
III-8 Relative between measured and fluorescence-predicted photosynthetic rates
85
IV-1 Photosynthesis-irradiance relationships for S. costatum
grown at four different irradiance intensities
105
IV-2 φC-E relationships for S. costatum grown at four different irradiance intensities
106
IV-3 Fluorescence-derived photosynthetic parameters (Fo, Fm, Fv/Fm, σPSII, 1/τPSII) as a function of measurement irradiance for (a) very high, (b) high and (c) low light grown S. costatum
107
IV-4 Fv/Fm-irradiance relationships for S. costatum grown at three different irradiance intensities
110
IV-5 σPSII-irradiance relationships for S. costatum grown at three different irradiance intensities
111
IV-6 Relationship between φC and Fv/Fm for all background irradiances
112
IV-7 Relationship between measured and fluorescence-predicted photosynthetic rates
113
V-1 Time course of growth rate properties under N-limitation
140
V-2 Time course of pigmentation properties under N-limitation
141
V-3 Time course of absorption properties under N-limitation
142
V-4 Time course of PSII concentrations under N-limitation
143
V-5 Time course of photosynthetic parameters derived from P-E curves under N-limitation
144

x
V-6 Photosynthesis-irradiance curve comparison for different
levels of N-limitation
145
V-7 Time course of photosynthetic efficiency under N-limitation
146
V-8 Quantum yield-irradiance curve comparison for different levels of N-limitation
147
V-9 Fluorescence-derived photosynthetic parameters (Fo, Fm, Fv/Fm, σPSII) as a function of irradiance for (a) N-replete, (b) moderately N-limited and (c) severely N-limited conditions
148
V-10 Time-course of fluorescence-derived parameters measured in the dark and with background irradiance at 108 µmol quanta m-2 sec-1
151
V-11 Fv/Fm-irradiance curve comparison for different levels of N-limitation
152
V-12 PSII functional cross sectional area-irradiance curve comparison for different levels of N-limitation
153
V-13 Relationships between different measures of photosynthetic efficiencies (Fv/Fm(0), φC,max and α*)
154
V-14 Relationship between Pbmax and its components
155
V-15 Relationship between φC and Fv/Fm for all background irradiances
156
V-16 Relationship between measured and fluorescence-predicted photosynthetic rates
157
V-17 Time course comparison between measured and predicted light saturated photosynthetic rates
158
xi
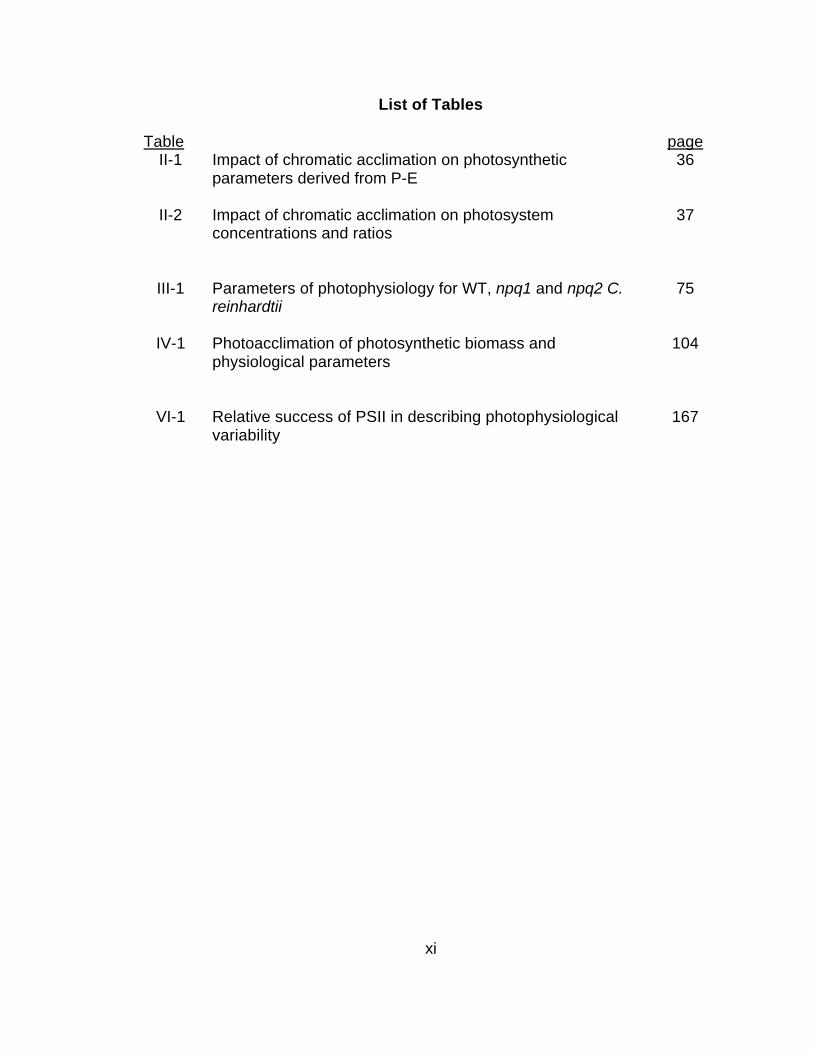
List of Tables
Table page II-1 Impact of chromatic acclimation on photosynthetic
parameters derived from P-E
36
II-2 Impact of chromatic acclimation on photosystem concentrations and ratios
37
III-1 Parameters of photophysiology for WT, npq1 and npq2 C.
reinhardtii 75
IV-1 Photoacclimation of photosynthetic biomass and
physiological parameters
104
VI-1 Relative success of PSII in describing photophysiological
variability 167

1
Chapter I
Introduction
2
The net primary production of the biosphere amounts to approximately
100 petagrams of carbon per year with the oceans accounting for about 40-50%
of this enormous biogeochemical flux (Antoine et al., 1996; Field et al., 1998).
Although marine primary production is difficult to directly quantify, the importance
of understanding it is two-fold: (1) as the base of the marine food web and (2) as
a major component in global biogeochemical cycles (Sverdrup et al., 1942;
Bougis, 1976; Falkowski, 1994). Photosynthetic rates are regulated by a function
of biomass, irradiance and efficiency. Because biomass and irradiance can be
measured with relative ease, presently the accuracy of the quantification of
global marine photosynthesis is limited by the estimation of photosynthetic
efficiency (Yoder et al., 1993; Behrenfeld and Falkowski, 1997). Understanding
historic or future variations in marine primary production may also require a
working knowledge of the mechanisms by which environmental factors regulate
marine photosynthetic efficiency (Martin, 1990; Sarmiento and Bender, 1994;
Sarmiento and LeQuere, 1996).
Although potentially important, the understanding of the regulation of in
situ marine photosynthetic efficiency is in its infancy (Behrenfeld and Falkowski,
1997). This state largely stems from two classes of difficulties including
inadequate sampling and non-mechanistic characterization of efficiency. The
first area of difficulty is derived from the spatial and temporal variability of the
marine environment, making it logistically difficult to assess the effects of forcing
on efficiency over the necessary space and times scales (Magnuson, 1990;
Dickey, 1991; Powell and Steele, 1995). Because photosynthetic efficiency can
3
vary significantly on time scales of less than 1 hour and over small (<1km) spatial
scales, standard estimates of photosynthetic efficiency made using radiotracers
that are performed with incubation periods of up to one day are not suited for
extensive spatial and temporal coverage (Steemann Nielsen, 1952; Harding et
al., 1981; Falkowski and Raven, 1997). Further, the response of photosynthetic
efficiency to an environmental regulator is often not instantaneous and can lag its
cause significantly (Post et al., 1984; Geider et al., 1993). These coverage and
time-dependent processes complicate the linkage between proximal regulation
and photosynthetic efficiency.
The second general source of difficulty to understanding photosynthetic
efficiency variability stems from most estimates centering on aggregate
responses (ex. Eppley, 1972; Balch et al., 1992; Behrenfeld and Falkowski,
1997). These measures of photosynthetic efficiency focus on broad responses
and use integrated water column averages, maximum water column efficiencies
or photosynthesis-irradiance relationships to provide an integrated photosynthetic
efficiency response to the effect of the environment (Morel, 1991; Karl, 1999;
Johnson and Howd, 2000; Marra et al., 2000). However, these process-
integrated measures of photosynthetic efficiency are composed of multiple steps
(absorption, photosynthetic light utilization, photosystem-specific processes,
photosynthetic electron transport chain efficiency, dark reactions, etc.) that can
vary independently. Thus, the mechanism by which environmental forcing
regulates the variability of aggregate estimates of efficiency remains difficult to
interpret because of imbedded complexity. Without a mechanistic
4
understanding, interpreting present day variability and predicting future variability
is not possible.
In this dissertation I focus on overcoming the inherent limitations
associated with non-mechanistic photosynthetic efficiency measurements. In
particular, I concentrate on the photosynthesis-irradiance (P-E) response curve
as a tool to uncover mechanisms of environmental regulation of marine
photosynthetic efficiency (Jassby and Platt, 1976). This photophysiological
characterization technique has been used extensively in both the laboratory and
field to document the response of phytoplankton photosynthetic efficiency to
diverse environments (Cleveland and Perry, 1987; Cullen, 1990; Sosik and
Mitchell, 1994; Babin et al., 1996; Lindley and Barber, 1998). Nevertheless,
despite these successes, the P-E relationship has limited overall diagnostic and
prognostic capability because of the aforementioned multiple steps between the
incident irradiance intensity and carbon fixation.
Towards addressing this limitation, I concentrate on the light reactions of
photosynthesis as a class of analytic components that in part regulate the
structure and magnitude of the P-E curve. Specifically, in this dissertation I am
interested in the role that photosystem II (PSII)-specific descriptions as measured
by room temperature fluorescence have in determining P-E and efficiency-
irradiance magnitudes and structures.
Previous investigations have provided a strong theoretical background for
the relationship of fluorescence (PSII) to photochemistry (Mauzerall, 1972;
Kitajima and Butler, 1975; Papageorgiou, 1975; Butler, 1978; Lazar, 1999). In
5
particular, fluorescence induction (Kautsy and Hirsch, 1931) and decay (Berens
et al., 1985; LaVergne and Trissl, 1995; Kolber et al., 1998) techniques have
been developed for use in natural marine phytoplankton populations to measure
PSII parameters that have strong correlations with photosynthetic rate and
efficiency estimates under a variety of environmental conditions (Falkowski and
Kiefer, 1985; Kiefer and Reynolds, 1992; Kolber and Falkowski, 1992; Falkowski
and Kolber, 1993). These types of measurements provide a step towards
uncovering the mechanisms that comprise the series of possible rate limiting
steps that regulate photosynthesis rates and efficiency. However, previous
investigations have focused on the properties of PSII in the dark and have not
related the changes in PSII-specific properties, such as PSII cross sectional area
and PSII photochemical conversion efficiency, to changes in photosynthetic rates
and efficiency with irradiance. Because many processes, such as state
transitions and non-photochemical quenching that affect PSII are background
light dependent, dark measurements of PSII may not be indicative of processes
occurring in the presence of light (Bonaventura and Myers, 1969; Demmig-
Adams and Adams, 1992).
The relationship between aggregate photosynthesis-irradiance
relationships and PSII-specific properties can be examined following analytic
descriptions of P-E and associated parameters in combination with similar
descriptions of PSII-specific measures. The P-E function can be mathematically
formulated based on Poisson target theory that is formalized by,
6
( )EP
PPSUPSUτσexp1
max
−= (I-1)
PSU
nP
τ894max = (I-2)
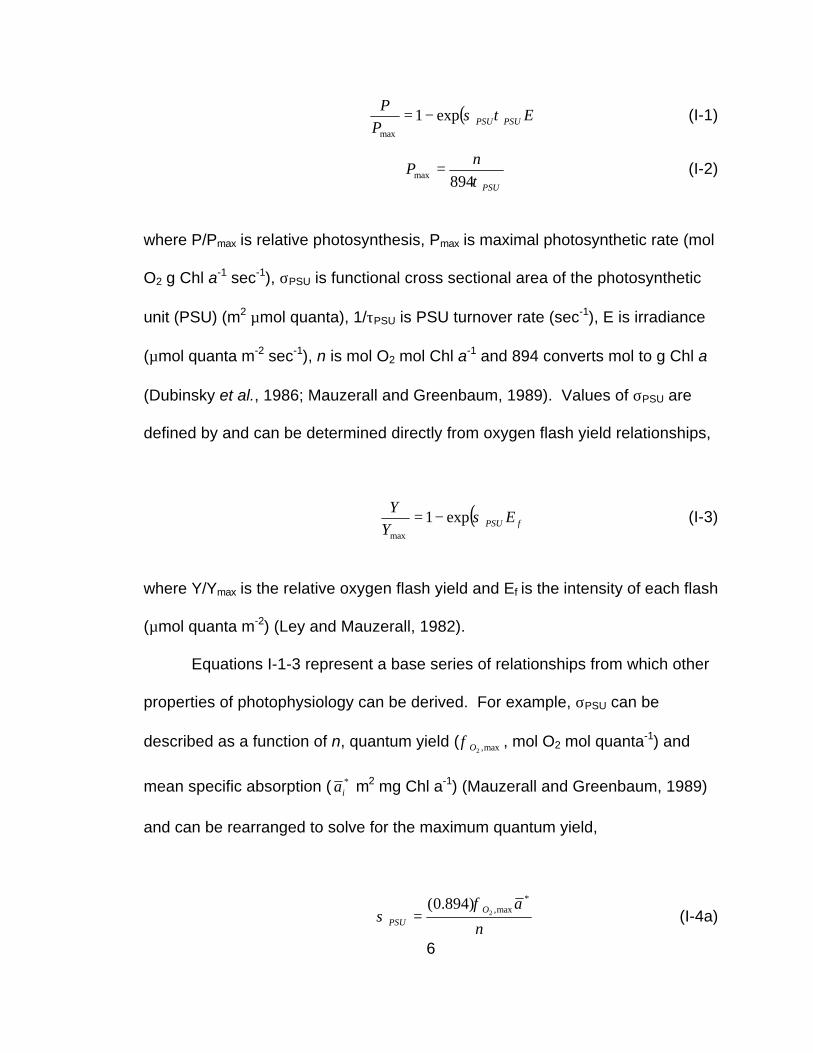
where P/Pmax is relative photosynthesis, Pmax is maximal photosynthetic rate (mol
O2 g Chl a-1 sec-1), σPSU is functional cross sectional area of the photosynthetic
unit (PSU) (m2 µmol quanta), 1/τPSU is PSU turnover rate (sec-1), E is irradiance
(µmol quanta m-2 sec-1), n is mol O2 mol Chl a-1 and 894 converts mol to g Chl a
(Dubinsky et al., 1986; Mauzerall and Greenbaum, 1989). Values of σPSU are
defined by and can be determined directly from oxygen flash yield relationships,
( )fPSU EY
Yσexp1
max
−= (I-3)
where Y/Ymax is the relative oxygen flash yield and Ef is the intensity of each flash
(µmol quanta m-2) (Ley and Mauzerall, 1982).
Equations I-1-3 represent a base series of relationships from which other
properties of photophysiology can be derived. For example, σPSU can be
described as a function of n, quantum yield ( max,2Oφ , mol O2 mol quanta-1) and
mean specific absorption ( *ia m2 mg Chl a-1) (Mauzerall and Greenbaum, 1989)
and can be rearranged to solve for the maximum quantum yield,
n
aO
PSU
*max,2
)894.0( φσ = (I-4a)
7
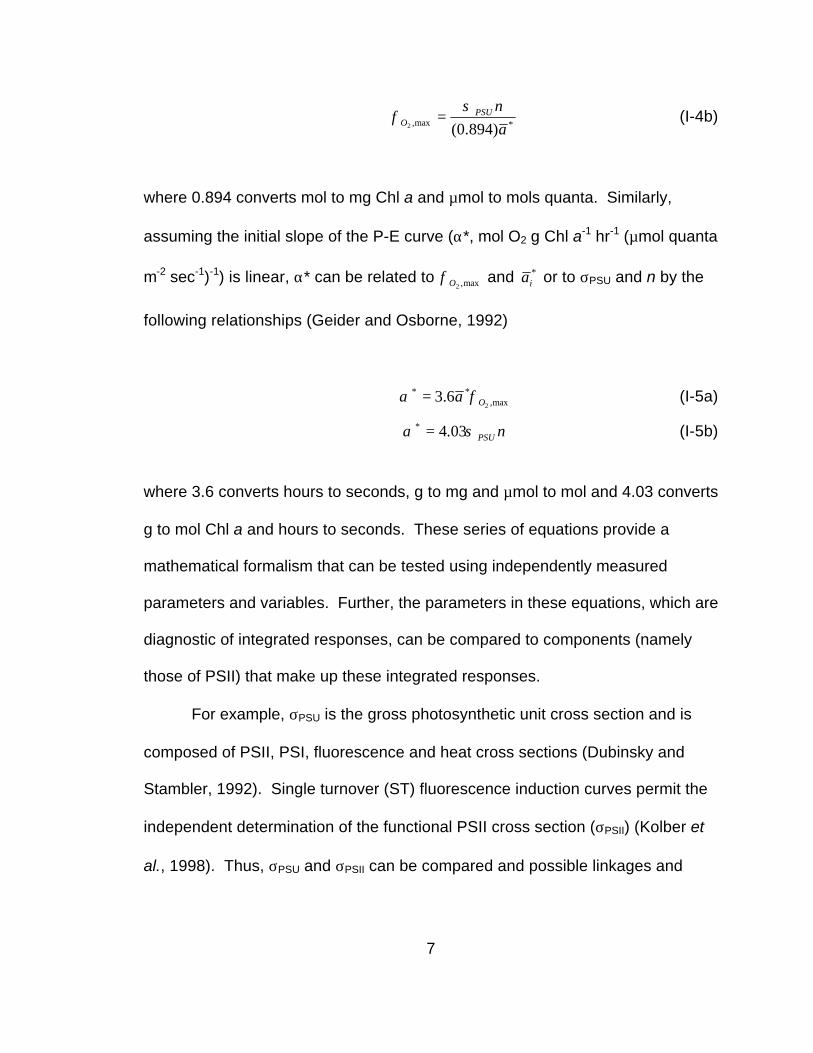
*max, )894.0(2 a
nPSUO
σφ = (I-4b)
where 0.894 converts mol to mg Chl a and µmol to mols quanta. Similarly,
assuming the initial slope of the P-E curve (α*, mol O2 g Chl a-1 hr-1 (µmol quanta
m-2 sec-1)-1) is linear, α* can be related to max,2Oφ and *ia or to σPSU and n by the
following relationships (Geider and Osborne, 1992)
max,**
26.3 Oa φα = (I-5a)
nPSUσα 03.4* = (I-5b)
where 3.6 converts hours to seconds, g to mg and µmol to mol and 4.03 converts
g to mol Chl a and hours to seconds. These series of equations provide a
mathematical formalism that can be tested using independently measured
parameters and variables. Further, the parameters in these equations, which are
diagnostic of integrated responses, can be compared to components (namely
those of PSII) that make up these integrated responses.
For example, σPSU is the gross photosynthetic unit cross section and is
composed of PSII, PSI, fluorescence and heat cross sections (Dubinsky and
Stambler, 1992). Single turnover (ST) fluorescence induction curves permit the
independent determination of the functional PSII cross section (σPSII) (Kolber et
al., 1998). Thus, σPSU and σPSII can be compared and possible linkages and
8
causalities established. This can be extended to include how variability in σPSII(0)
and σPSII-E influence P-E structures (equation I-1).
Similarly, ST-fluorescence induction curves can also be used to assess
the role of PSII in determining quantum yield of photosynthesis (φmax) variability.
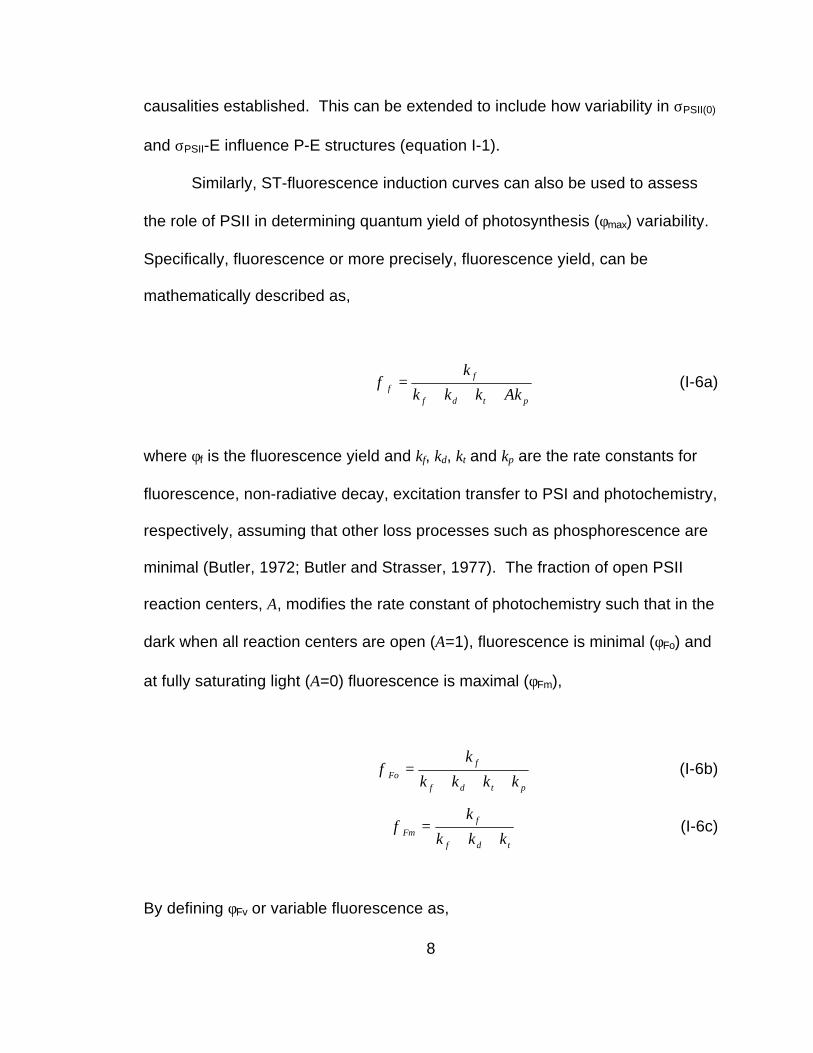
Specifically, fluorescence or more precisely, fluorescence yield, can be
mathematically described as,
ptdf
ff Akkkk
k
+++=φ (I-6a)
where φf is the fluorescence yield and kf, kd, kt and kp are the rate constants for
fluorescence, non-radiative decay, excitation transfer to PSI and photochemistry,
respectively, assuming that other loss processes such as phosphorescence are
minimal (Butler, 1972; Butler and Strasser, 1977). The fraction of open PSII
reaction centers, A, modifies the rate constant of photochemistry such that in the
dark when all reaction centers are open (A=1), fluorescence is minimal (φFo) and
at fully saturating light (A=0) fluorescence is maximal (φFm),
ptdf
fFo kkkk
k
+++=φ (I-6b)
tdf
fFm kkk
k
++=φ (I-6c)
By defining φFv or variable fluorescence as,
9
FoFmFv φφφ −= (I-7)
the ratio of φFv/φFm (or Fv/Fm) is related to the photochemical yield, or
photochemical conversion efficiency for PSII,
pptdf
pFmFv Pkkkk
k
Fm
Fvφφ =
+++==/ (I-8)
Similar to relating variability in σPSU to σPSII(0), variability in photosynthetic
quantum yield (2Oφ , mol O2 mol quanta-1), which is a aggregate property of
photosynthesis, can be related to φp (Fv/Fm), which is a photosystem II-specific
property. Values of Fv/Fm and quantum efficiency can also be compared over a
light gradient.
Thus, using these equations as a theoretical background, I focus on
aggregate photosynthetic rate and efficiency measurements like P-E and
quantum efficiency and PSII-specific measurements like σPSII and Fv/Fm made
over a background light gradient. Recognizing that additional components are
also important in determining the photosynthesis-irradiance response, here I
center on PSII-specific properties because they are easily measured and dark
measured PSII properties such as Fv/Fm and σPSII have been shown to co-vary
with aggregate photosynthesis-irradiance responses under some environmental
conditions (Geider et al., 1993). I use previous aggregate efficiency studies,
10
which have separately demonstrated the influence of environmental variables
such as light and nutrients on analytic components and P-E, as a springboard to
investigate the relationship between these PSII components and P-E. Thus, I
investigate the role that each component individually as well as PSII as a
combined unit play in structuring the P-E curve.
This dissertation is nominally divided into two major sections. In the first
section (chapter II), I focus on processes affecting photosynthetic rates at low
measurement irradiances with emphasis on observed reductions in quantum
efficiency at low irradiance in Skeletonema costatum and Dunaliella tertiolecta.
For these analyses, I use both quantum yield-irradiance and photosynthesis-
irradiance relationships along with aggregate and photosystem-specific biomass
and function properties.
In the second section (chapters III-V), I focus on mechanisms regulating
the structure and magnitude of the photosynthesis-irradiance response curve at
higher irradiances in the context of the photosynthetic electron transport chain.
In chapter III, I use wild type and fluorescence (non-photochemical quenching)
mutants of Chlamydomonas reinhardtii to examine the efficacy of a newly
developed modulated fluorometer to describe photophysiology by examining the
relationship between standard photosynthesis-irradiance relationships and
fluorescence-derived, mechanistic parameters of photosynthesis. In chapters IV
and V, I use this fluorescence induction technique in conjunction with additional
plant photophysiology measurements to uncover the effect of growth irradiance
intensity (chapter IV) and nutrient-limitation (chapter V) on analytical components
11
of photosynthesis-irradiance responses and their relationship to total P-E
responses in S. costatum. Finally, in chapter VI, I use the combined analyses
and conclusions from low light investigations (Chapter II), C. reinhardtii (chapter
III), photoacclimation (chapter IV), and nutrient-limitation (chapter V) chapters to
summarize the contribution of photosystem II-specific processes to the overall
photosynthesis irradiance response in the context of marine variability.

12
Chapter II
On the reduction of photosynthetic quantum efficiency at low irradiances

13
Photosynthesis-irradiance (P-E) curves are widely used to describe
photosynthetic efficiency and potential. In this context, there exist
numerous models of P-E that are helpful in describing data. All
contemporary models assume maximal photosynthetic quantum efficiency
(φφ) at low irradiances. But P-E observations from laboratory and field
studies for mixed populations and monotypic cultures made with both
oxygen evolution and carbon uptake techniques suggest that this is not
always the case. In the context of flashing light, several mechanisms have
been proposed to account for these reductions including S-state decay,
respiration and photosystem I (PSI) limitation. Here I investigate this low
light reduction in φφ using continuous light measurements of P-E with the
diatom Skeletonema costatum (Greville) Cleve and the chlorophyte
Dunaliella tertiolecta Butcher as two model phytoplankton that
photoacclimate using different dominant mechanisms. Under the present
experimental setup, S. costatum is affected by the reduction while D.
tertiolecta does not appear to be affected. Reductions for S. costatum are
relieved when measuring P-E using red-dominated light. From
photosystem-specific biomass estimates and P-E measurements made
with blue-green, white and red light I find that the low-light reductions in φφ
are likely dominated by PSI limitation. Using these measurements along
with modeling exercises, I demonstrate that regardless of the mechanism
responsible, the reductions in φφ at low irradiances are not readily
observable using traditional P-E analyses and are absent from PSII
14
descriptions of photosynthetic efficiency. Yet, the reductions in φφ can
result in significant errors (>50%) in the estimation of the initial slope of the
P-E curve and ultimately the maximum quantum yield of photosynthesis.
The combination of these results is discussed in the context of open ocean
spectral irradiance properties.
Introduction:
Photosynthesis-irradiance (P-E) curves have been used extensively to
probe the efficiency and capacity of photosynthesis with respect to light intensity.
These curves, which are constructed using either oxygen evolution or carbon
uptake, provide a convenient evaluation of photosynthesis in the context of
potential sources of variability. P-E curves have been used broadly in both the
field and laboratory to evaluate nutrient limitation, photoacclimation and
taxonomic effects on photosynthesis (Jassby and Platt, 1976; Perry et al., 1981;
Falkowski et al., 1986; Platt et al., 1987; Cullen et al., 1992; Lindley et al., 1995).
These measured P-E curves generally follow a sigmoidal-type functional
form with photosynthesis increasing with irradiance until it saturates at some
higher light level. Many mathematical models have been formulated to describe
the P-E relationship (Blackman, 1905; Smith, 1936; Jassby and Platt, 1976; Platt
et al., 1980; Leverenz et al., 1990; Geider and Osborne, 1992; Henley, 1995).
Although the specific values of the recovered parameters depends greatly on the
exact model used (Frenette et al., 1993; Henley, 1995), all contemporary models
are generally similar in shape and assume that quantum efficiency is maximal
15
and independent of background light for the low light portion of the quantum
efficiency - irradiance curve. Despite these assumptions, there is evidence that
photosynthetic efficiency is not always maximal at low irradiances (Forbush et al.,
1971; Diner and Mauzerall, 1973; Ley and Mauzerall, 1986). Indeed, there are
many biophysical and biochemical intermediates between initial light absorption
and subsequent carbon incorporation that are background irradiance dependent.
A priori, these multiple, non-linear steps could lead to a non-linear relationship
between excitation energy and photosynthetic rate at low irradiances.
Previous observations of reduced efficiency have been attributed to three
alternative, but not mutually exclusive processes including differential respiration
(the so-called Kok effect), S-state decay (S3 to S2) and imbalances in
photosystem excitation (Kok, 1948; Kok, 1949; Kok, 1956; Forbush et al., 1971;
Diner and Mauzerall, 1973). Each of these mechanisms can potentially reduce
the quantum efficiency at low irradiances such that the maximal quantum yield is
observed at higher irradiance levels. Diner and Mauzerall (1973) critically
examined each of the mechanisms using a variety of techniques including
inhibitors and variable frequency flash yields. They concluded that although all
three mechanisms may be acting to some degree in the presence of flashing
light, it is imbalances in photosystem excitation that dominate the reduction of the
quantum efficiency at low irradiances in Chlorella vulgaris and Phormidium
luridium (Diner and Mauzerall, 1973) (see below).
The observation of a reduction in quantum efficiency at low irradiances
violates the constant and maximal quantum efficiency assumption held by
16
contemporary P-E models. This violation may result in errors when using these
types of models in conjunction with data to evaluate photosynthetic efficiency.
Further, although Diner and Mauzerall (1973) deftly probed this reduction in
quantum efficiency in the presence of flashing light for C. vulgaris and P.
luridium, these responses may not be indicative of all natural populations (Healy
and Myers, 1971) or for continuous light P-E curves measured using 14C
techniques. Significant departures from their original findings could result if
estimates of photosynthesis are made using continuous light (P-E), if different
monotypic or mixed populations are used, or if illuminating wavelength differs.
Thus, the aim of this study is two-fold: (1) to examine the predominance of
the reduction in low light quantum efficiency in the context of different
phytoplankton species, incubation times and colors of continuous light (P-E)
using both oxygen and carbon-14 techniques and (2) to determine the effect of
the reduction on the interpretation of P-E data. My working hypothesis is that
similar to the mechanisms established for flashing light, there can be a reduction
in photosynthetic efficiency as a result of imbalances in the excitation between
photosystems. Because the two photosystems can have different absorption and
action spectra, which are most notable in the far red region, this reduction may
be affected by the species examined as well as spectral characteristics of the
irradiance field (Emerson and Lewis, 1943; Dubinsky et al., 1986). To test these
hypotheses, I evaluate photosystem-specific mechanisms by measuring both
aggregate and photosystem-specific biomass and physiological parameters.
These results are further analyzed in the context of using P-E to estimate
17
quantum efficiency. Finally, results from these experiments are discussed in
relation to open-ocean spectral irradiance properties.
METHODS
Culture conditions
Diatom (S. costatum (CCMP1332) (Greville, 1866; Cleve, 1873)) and chlorophyte
(D. tertiolecta (CCMP1320) (Butcher, 1959)) cultures, originally obtained from
Provasoli - Guillard National Center for Culture of Marine Phytoplankton, were
grown in semi-continuous batch culture at 19oC in sterile (0.2 µm filtered) air
bubbled f/2-amended media made with filtered (GF/F – Whatman) Sargasso Sea
water (Guillard and Ryther, 1962) and were periodically diluted to maintain
exponential growth. Continuous light, which was supplied by fluorescent bulbs,
was attenuated by neutral density and stage screening (Cinemills #019, #141,
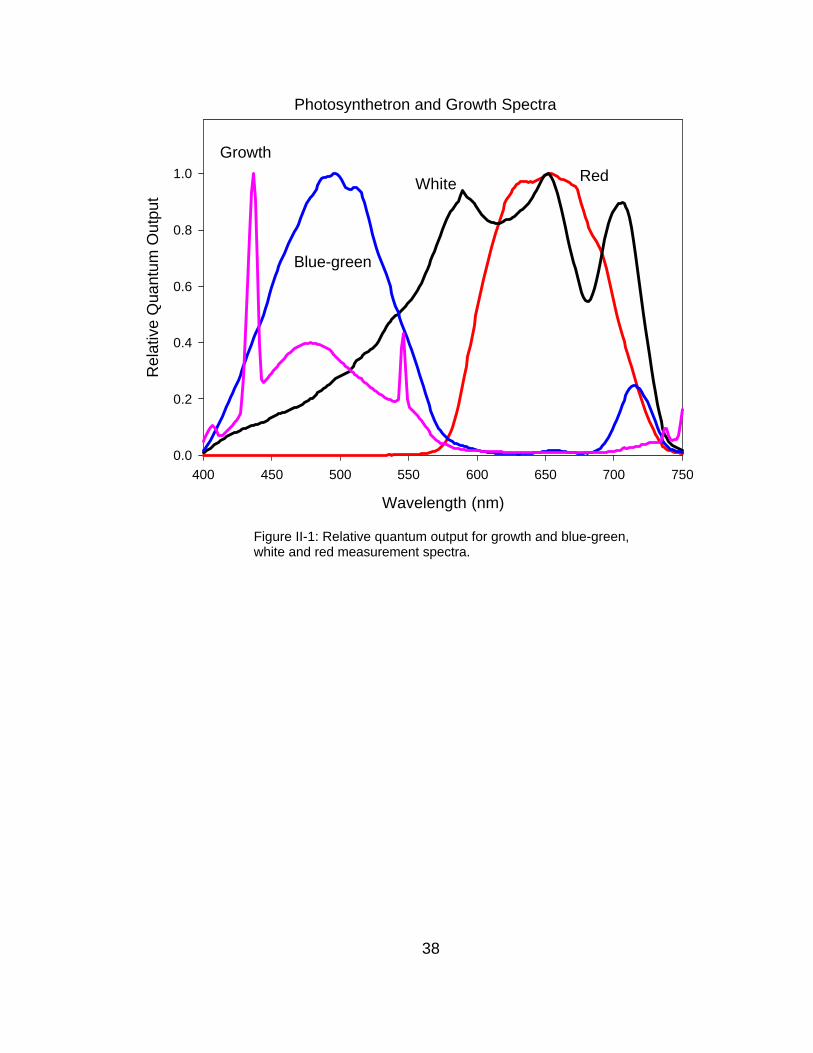
#210) to achieve the desired intensity and spectral quality (Figure II-1).
Irradiance intensity averages were as follows: S. costatum 24.3±3.4 and D.
tertiolecta 23.8±2.1 µmol quanta m-2 sec-1. Note that all error bars reported in
this text represent one standard error unless otherwise noted.
Absorption, Pigments, Fluorescence Excitation, Growth Rates, Cell Density
Spectral absorption measurements were made at 2 nm resolution with a 1 sec
integration time on samples in solution using an HP 8452 diode array
spectrophotometer with Labsphere (RSA-HP-84) integrating sphere. Absorption
at 750 nm was assumed to be non-cellular and was subtracted from the
18
absorption curve. Absorption coefficients were calculated following Kirk (1994).
Chlorophyll a was determined on 90% acetone extracts following Parsons et al.
(1984) except without MgCO3 addition, using the trichromatic equations of Jeffrey
and Humphrey (1975). Intrinsic growth rates were calculated from bulk
fluorescence measurements using a Turner Designs 10-005R fluorometer. Cell
concentrations were estimated using a hemacytometer.
Photosystem Quantification
Emerson and Arnold numbers (E&A or Chl a/O2) were measured using a
Hansatech oxygen electrode and a Stroboslave (Type1539A) tunable frequency,
saturating strobe light following Dubinsky et al. (1986). PSII/Chl a was calculated
as four times the initial slope of oxygen evolution rate versus flash frequency
assuming a stoichiometric 4 PSII/O2 relationship, and normalizing to chlorophyll a
concentration. PSI/Chl a were measured on thylakoid membranes using the
chemical oxidation/reduction technique and quantifying the absorption difference
at OD697 normalized to OD725 following Marsho and Kok (1971). Thylakoid
membranes were isolated from phytoplankton cells harvested by centrifugation
for 5 min at 9777×g, gentle sonication (~25 W) of resuspended pellet in 0.02%
Triton X-100 in 50 mM Trizma for 30 secs and then centrifugation at 25000×g for
2 min. Chlorophyll a concentrations of the thylakoid-containing supernatant were
calculated using 60 mM Chl a/OD680 (Thornber et al., 1977). P700
concentrations of thylakoid membranes were calculated using 64 mM
P700/∆OD697/725 where ∆OD697/725 represents the change in optical density from
19
oxidized to reduced spectra at 697 nm relative to 725 nm (Hiyama and Ke, 1972;
Melis and Brown, 1980). All optical density measurements for PSI/Chl a were
made using a split beam Cary 219 spectrophotometer with a 1 cm pathlength.
Photosynthesis vs Irradiance (P-E), Turnover Rates
Photosynthesis-irradiance measurements were made using temperature-
regulated custom-built photosynthetrons. Irradiance, which was supplied by a
250 W ENH projector bulb (Gray Supply), was spectrally modified and attenuated
using a combination of hot and cold mirrors (Optical Coating Laboratory) and
stage screening (Cinemills) (Figure II-1). Incubations of 1 ml samples inoculated
with ~7.4 kBq H14CO3 were terminated after 10 min using 100 µl 37%
formaldehyde and 200 µl HCl and allowed to degas overnight. Carbon uptake
rates were quantified using standard techniques (Barber et al., 1996).
Photosynthetic parameters of the Platt et al. (1980) model were optimized to fit
data using a custom written, non-linear least-squares Levenberg-Marquardt
technique,
( )( ) ( )( )bs
bs
bs
b PEPEPP /exp/exp1 * βα −−−= (II-1)
where Pb is chlorophyll a-normalized photosynthesis (mg C mg Chl a hr-1), E is
irradiance intensity (µmol quanta m-2 sec-1), β is a photoinhibition term (mg C mg
Chl a hr-1(µmol quanta m-2 sec-1)-1), Pbs is the theoretical maximum
photosynthetic rate if β is zero (mg C mg Chl a hr-1), and α* is the maximum light
20
utilization coefficient (mg C mg Chl a hr-1(µmol quanta m-2 sec-1)-1). The light-
saturated chlorophyll a-normalized photosynthetic rate (Pbmax) was calculated
from recovered parameters following Zimmerman et al. (1987). Ek was
calculated as Pbmax/α*. Optimization of model parameters to P-E data was
performed using PAR as the independent variable.
Maximum quantum yield (φC,max) was calculated using two techniques as
the mol C mol quanta-1 absorbed using absorption coefficients that were
spectrally weighted to incident measurement irradiance. In the first (standard)
technique, φC,max was estimated using the initial slope (α*) of the P-E curve
following equation II-2 (Geider and Osborne, 1992):
*
*
max,
0231.0
iC a
αφ = (II-2)
where α* is the maximum light utilization coefficient (mg C mg Chl a-1 hr-1 (µmol
quanta m-2 sec-1)-1), 0.0231 converts grams to moles, and hours to seconds and
**, λλλ aEai
o
= (II-3a)
∫
∫=
nm
nm
nm
nmi
E
aE
a700
400
700
400
*
*
λ
λλ
o
o
(II-3b)
21
where a*λ is the chlorophyll a-specific absorption coefficient at wavelength λ, o
λE
is the relative incident quantum flux at wavelength λ, a*i,λ is the chlorophyll a-
specific absorption coefficient normalized to incident irradiance at wavelength λ,
and *ia (m2 mg Chl a-1) is the mean a*
i,λ over 400-700 nm. In the second
(alternate) technique to calculate φC,max, φC-E curves were constructed from P-E
and normalized absorption (equation II-3) and φC,max was calculated as the
maximum value of the curve ( [ ]EC −φmax ). These values are referred to as
φC,max′.
Irradiance Measurements and Calculations
Spectral power was measured using an Analytical Spectral Devices
spectroradiometer (LabSPEC VNIR 512) with 1o field of view attachment and
converted to relative quantum spectral output using calibrations to a known
source and supplied software. Irradiance intensity, or PAR, was measured using
a Biospherical (QSL-100) 4π scalar irradiance meter. Photosynthetically usable
radiation, PUR, was calculated from PAR, absorption spectra and relative
quantum spectra following Sakshaug et al. (1997):
∫
∫=
nm
nm
nm
nm
i
PARPUR
E
a
a
EE700
400
700
400*
*,
)max(
λ
λ
λ
o
oo
(II-4)
22
where PUREo
is PUR and PAREo
is PAR.
Literature Data
Literature data were obtained from original journals (Perry et al., 1981;
Falkowski et al., 1986; Platt et al., 1987) by scanning in black and white line
mode at 300 dots per inch resolution and digitizing the center of each plotted
point. Relative quantum yield was calculated from recovered P-E data as
photosynthesis divided by incident irradiance following equation II-5:
aE
PX =φ (II-5)
where φX is quantum yield (mol X mol quanta-1), P is photosynthesis (mol X m-3
sec-1), a is absorption (m-1), and E is irradiance intensity (mol quanta m-2 sec-1),
where X is O2 evolved or C uptake. Note that equation II-5 is not the
mathematical first derivative of a P-E curve, but a cumulative derivative.
Results / Discussion:
Contemporary P-E Models
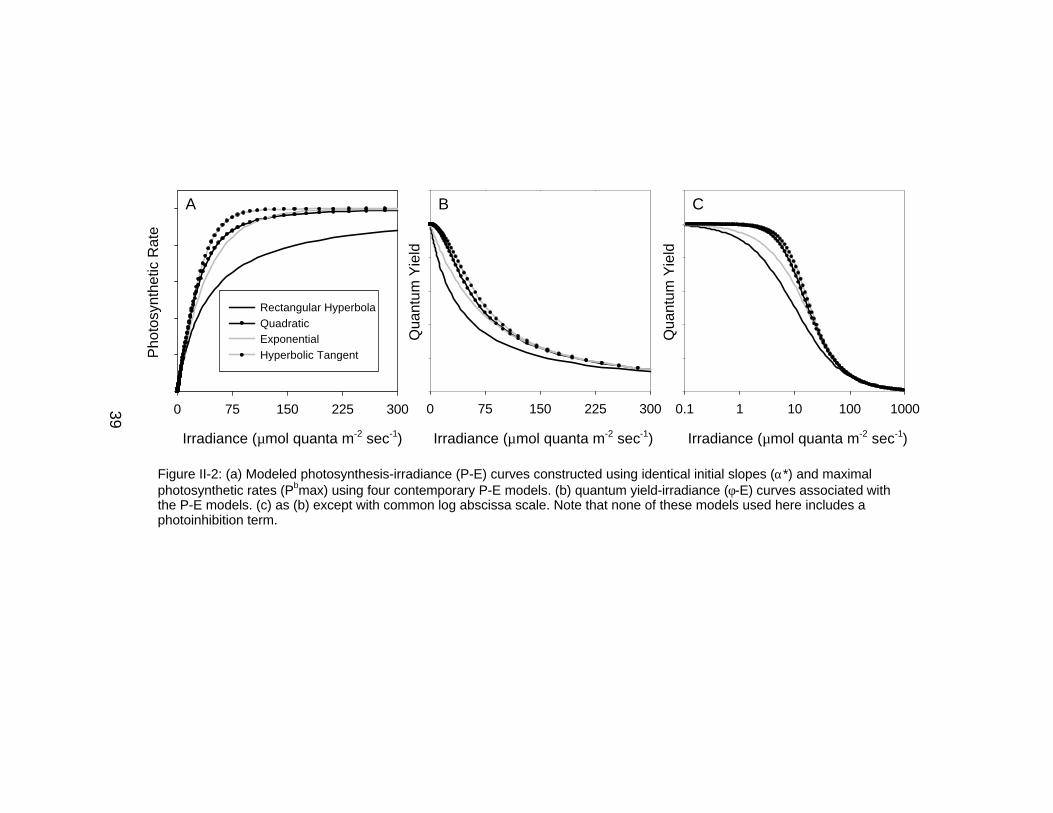
As previously suggested, contemporary models of the P-E relationship
such as the rectangular hyperbola, quadratic, exponential and hyperbolic tangent
functions have the same general shape with photosynthesis increasing with

23
irradiance at low light levels. Photosynthesis saturates to a maximal level at
higher irradiances (Figure II-2a). Similarly, when output from these models is
expressed in quantum yield format, all models have comparable functional forms
with maximal quantum yields at low light levels followed by decreasing values at
higher light levels (Figure II-2b-c).
Inherent in the formulation of these models, it is important to note that the
assumption of maximal and constant quantum yield at low irradiances does not
assume that processes are optimal for photosynthesis. Rather this assumption
simply states that for a given irradiance range comprised of low intensities,
quantum efficiency is maximal and independent of light level. As an example,
PSII and PSI excitation may be out of balance resulting in a reduced maximum
quantum yield, but the models assume that processes that regulate PSII and PSI
distribution are independent of light. Thus, in this example the absolute value of
the maximum quantum yield predicted by the model may be set by PSII / PSI
excitation balance, but not the structure of the φ-E curve at low irradiances.
Another example is nitrogen-limitation, which leads to decreased maximal
quantum yield. Although N-limitation decreases the magnitude of the φ-E curve,
it is assumed not to influence the structure of the curve at low irradiances.
Similar lines of reason can apply to other sources of variability for the φ-E curve
such as photoacclimation, other forms of nutrient limitation, etc.
Observations
24
Contrary to assumptions of constant and maximal efficiency at low light, multiple
observations suggest that quantum yield is variable and reduced at low light.
Multiple investigators have found that for several phytoplankton species O2 flash
yields are not maximal at low background irradiance levels (Forbush et al., 1971;
Diner and Mauzerall, 1973; Ley and Mauzerall, 1986; Falkowski and Raven,
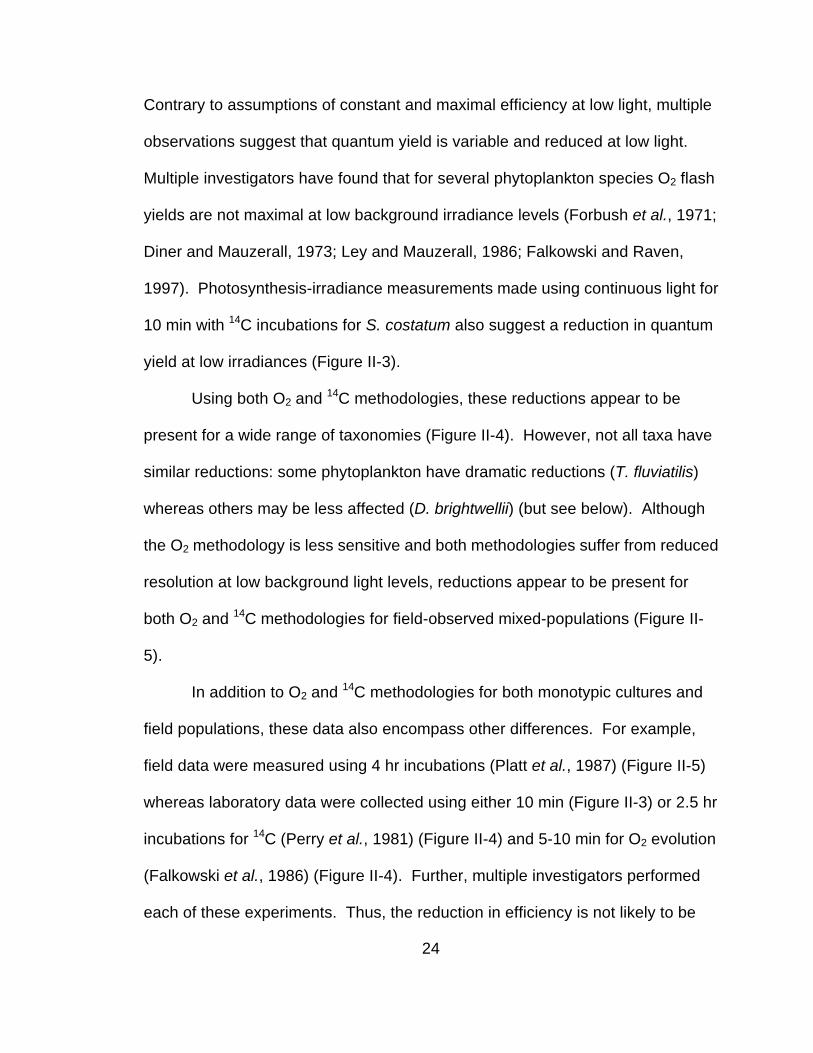
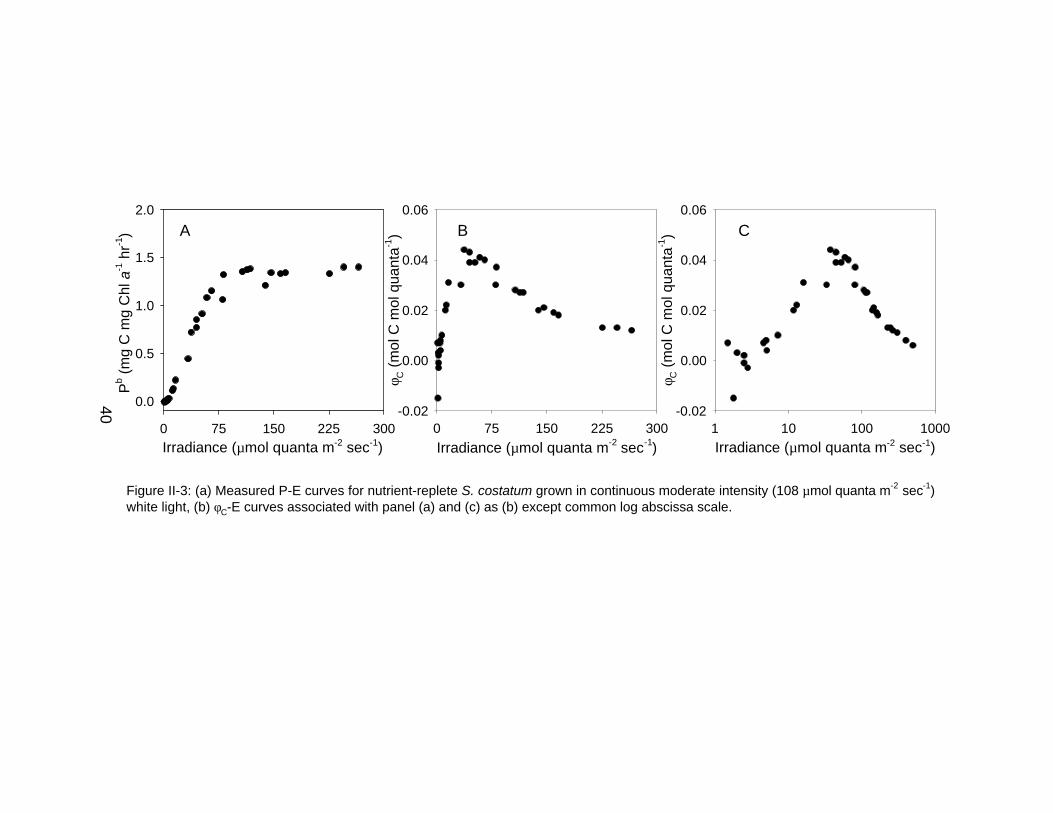
1997). Photosynthesis-irradiance measurements made using continuous light for
10 min with 14C incubations for S. costatum also suggest a reduction in quantum
yield at low irradiances (Figure II-3).
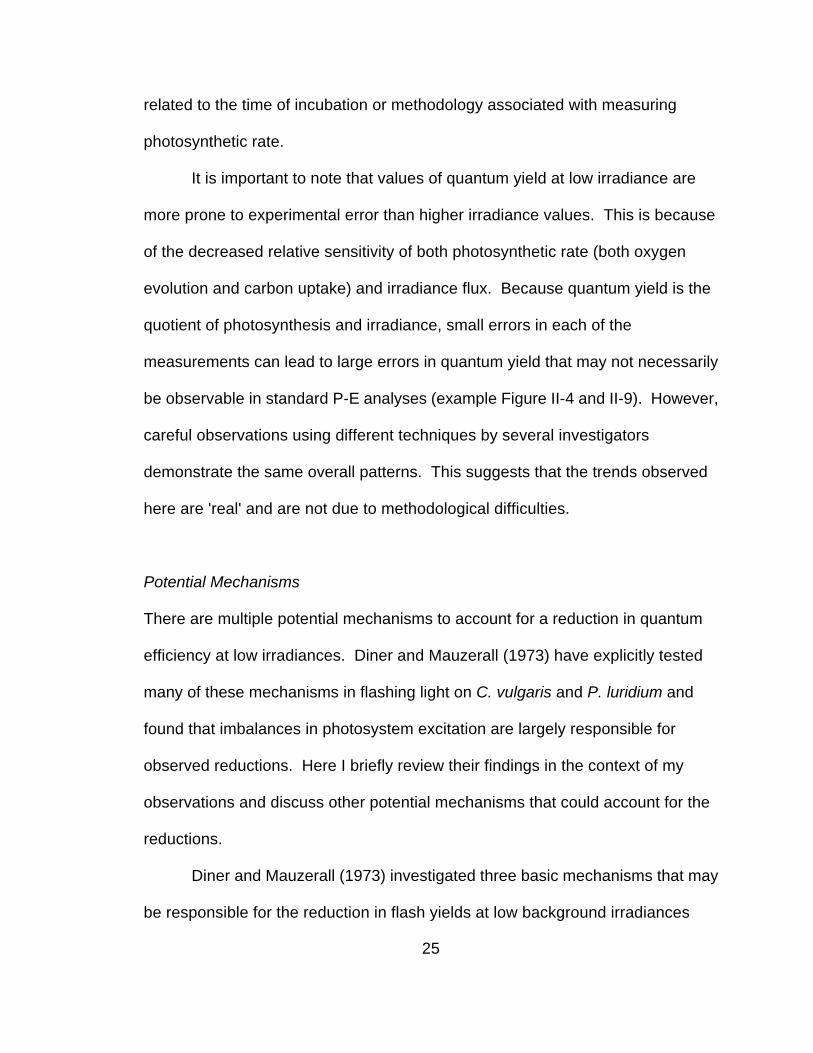
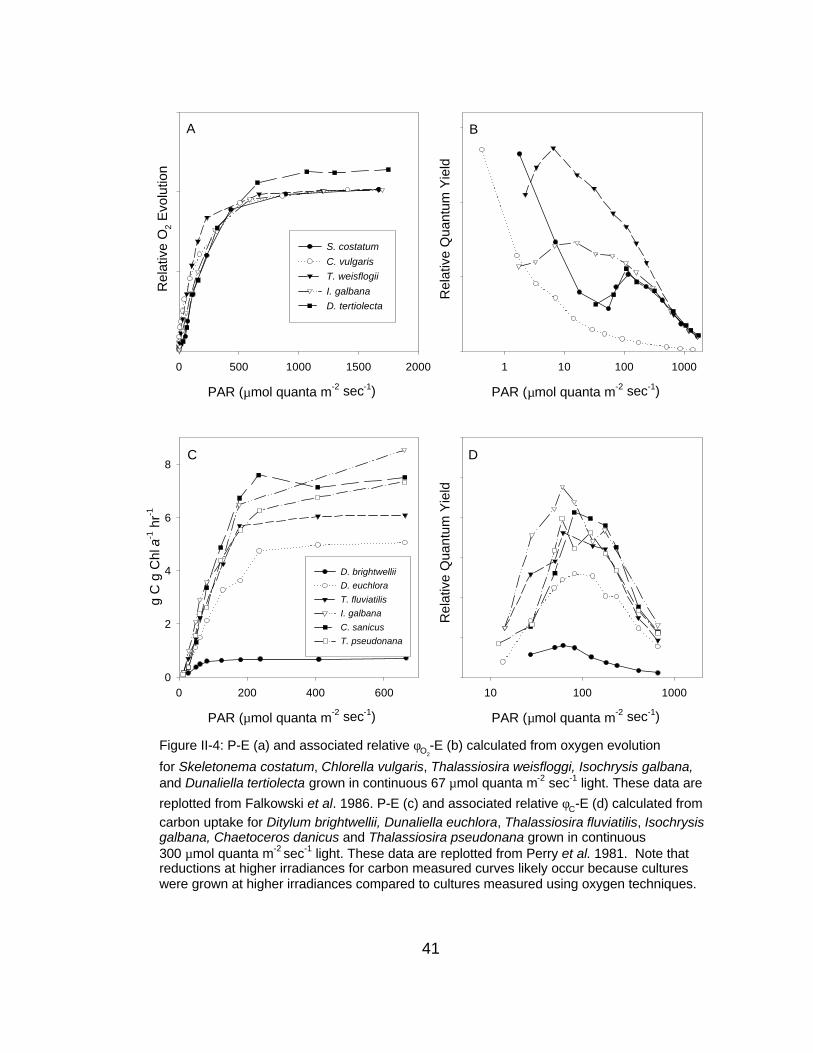
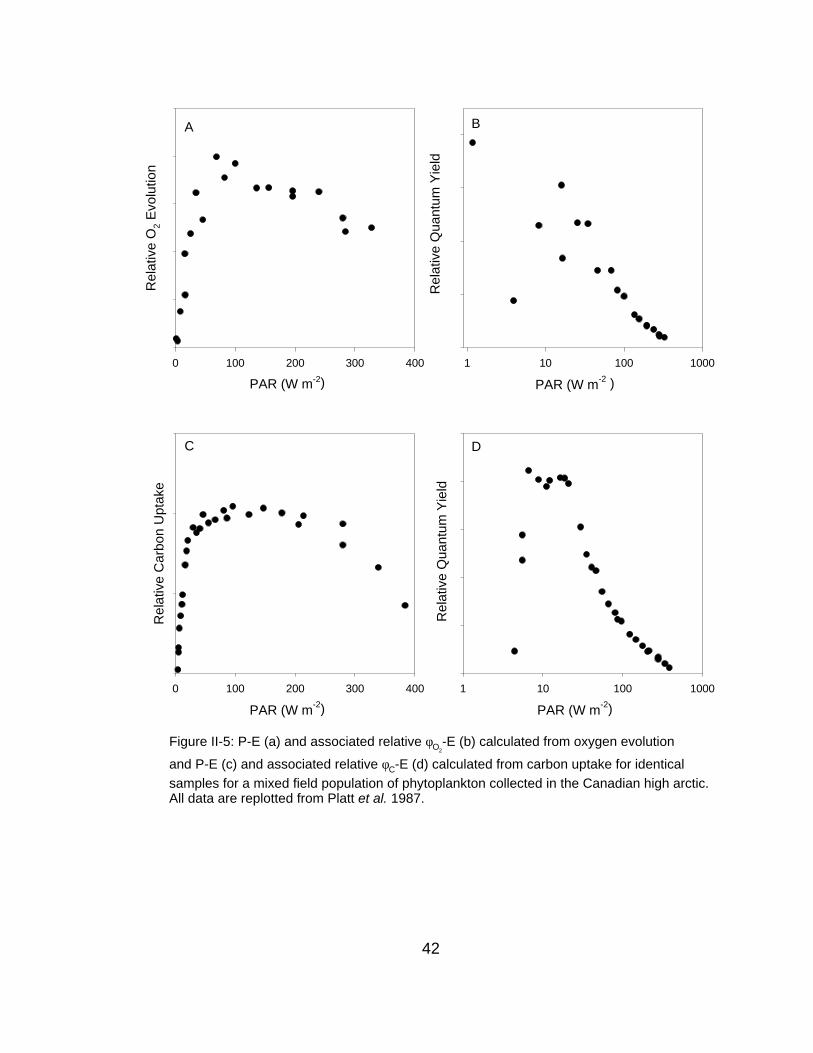
Using both O2 and 14C methodologies, these reductions appear to be
present for a wide range of taxonomies (Figure II-4). However, not all taxa have
similar reductions: some phytoplankton have dramatic reductions (T. fluviatilis)
whereas others may be less affected (D. brightwellii) (but see below). Although
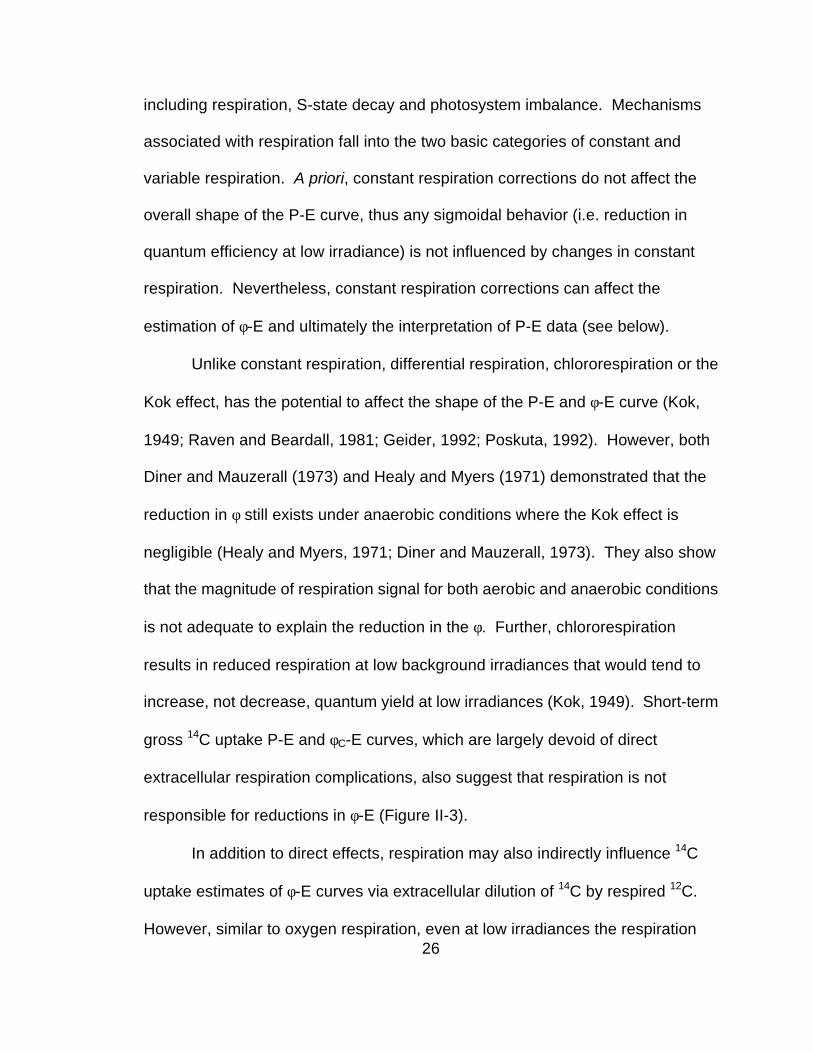
the O2 methodology is less sensitive and both methodologies suffer from reduced
resolution at low background light levels, reductions appear to be present for
both O2 and 14C methodologies for field-observed mixed-populations (Figure II-
5).
In addition to O2 and 14C methodologies for both monotypic cultures and
field populations, these data also encompass other differences. For example,
field data were measured using 4 hr incubations (Platt et al., 1987) (Figure II-5)
whereas laboratory data were collected using either 10 min (Figure II-3) or 2.5 hr
incubations for 14C (Perry et al., 1981) (Figure II-4) and 5-10 min for O2 evolution
(Falkowski et al., 1986) (Figure II-4). Further, multiple investigators performed
each of these experiments. Thus, the reduction in efficiency is not likely to be
25
related to the time of incubation or methodology associated with measuring
photosynthetic rate.
It is important to note that values of quantum yield at low irradiance are
more prone to experimental error than higher irradiance values. This is because
of the decreased relative sensitivity of both photosynthetic rate (both oxygen
evolution and carbon uptake) and irradiance flux. Because quantum yield is the
quotient of photosynthesis and irradiance, small errors in each of the
measurements can lead to large errors in quantum yield that may not necessarily
be observable in standard P-E analyses (example Figure II-4 and II-9). However,
careful observations using different techniques by several investigators
demonstrate the same overall patterns. This suggests that the trends observed
here are 'real' and are not due to methodological difficulties.
Potential Mechanisms
There are multiple potential mechanisms to account for a reduction in quantum
efficiency at low irradiances. Diner and Mauzerall (1973) have explicitly tested
many of these mechanisms in flashing light on C. vulgaris and P. luridium and
found that imbalances in photosystem excitation are largely responsible for
observed reductions. Here I briefly review their findings in the context of my
observations and discuss other potential mechanisms that could account for the
reductions.
Diner and Mauzerall (1973) investigated three basic mechanisms that may
be responsible for the reduction in flash yields at low background irradiances
26
including respiration, S-state decay and photosystem imbalance. Mechanisms
associated with respiration fall into the two basic categories of constant and
variable respiration. A priori, constant respiration corrections do not affect the
overall shape of the P-E curve, thus any sigmoidal behavior (i.e. reduction in
quantum efficiency at low irradiance) is not influenced by changes in constant
respiration. Nevertheless, constant respiration corrections can affect the
estimation of φ-E and ultimately the interpretation of P-E data (see below).
Unlike constant respiration, differential respiration, chlororespiration or the
Kok effect, has the potential to affect the shape of the P-E and φ-E curve (Kok,
1949; Raven and Beardall, 1981; Geider, 1992; Poskuta, 1992). However, both
Diner and Mauzerall (1973) and Healy and Myers (1971) demonstrated that the
reduction in φ still exists under anaerobic conditions where the Kok effect is
negligible (Healy and Myers, 1971; Diner and Mauzerall, 1973). They also show
that the magnitude of respiration signal for both aerobic and anaerobic conditions
is not adequate to explain the reduction in the φ. Further, chlororespiration
results in reduced respiration at low background irradiances that would tend to
increase, not decrease, quantum yield at low irradiances (Kok, 1949). Short-term
gross 14C uptake P-E and φC-E curves, which are largely devoid of direct
extracellular respiration complications, also suggest that respiration is not
responsible for reductions in φ-E (Figure II-3).
In addition to direct effects, respiration may also indirectly influence 14C
uptake estimates of φ-E curves via extracellular dilution of 14C by respired 12C.
However, similar to oxygen respiration, even at low irradiances the respiration
27
rate is low compared to net carbon uptake. For example, analyzing data from
Figure II-3, there is a ~50% reduction in φC relative to φC,max′ at ~25 µmol quanta
m-2 sec-1. A dilution of 14C by respired 12C would require a doubling of the
extracellular 14C pool over the course of the experiment, which in turn would
correspond to a ~2 mM change in ~10 min, or 200 µM/min. This rate exceeds
the light-saturated photosynthetic rate (~1.4 µM/min) by two orders of magnitude
and is therefore unlikely.
At low irradiance levels when extracellular carbon uptake is low, the
internal cellular inorganic carbon pool 14C/12C ratio may be significantly depleted
in 14C relative to the extracellular pool. This could also lead to an apparent drop
in efficiency. However, four lines of evidence suggest that this mechanism is not
dominant. First, the reduction in φ is observed with both continuous and flash
yield oxygen measurements, which are not influenced by carbon equilibration.
Second, the reduction is observed for longer-term (4 hr) measurements, which
should have reduced radiocarbon equilibration problems. Third, a priori
irradiance color should not have an effect on radiocarbon equilibration, but here it
dramatically affects the magnitude of the reduction. And finally, again using data
from Figure II-3, there is an approximately 50% reduction in φC relative to φC,max
at ~25 µmol quanta m-2 sec-1. This irradiance is ~30% of the Ek and well above
the compensation irradiance for S. costatum grown with similar conditions
(Falkowski and Owens, 1978), implying that there is significant carbon transport
across the cell membrane, which in turn would quickly equilibrate the carbon
pool. These lines of evidence do not support a reduction in φ at low irradiance

28
due to cellular inorganic carbon 14C/12C equilibration issues. Thus, evidence
from flash yields and continuous oxygen measurements as well as carbon uptake
measurements strongly suggests that respiration is not responsible for the
reduction in quantum efficiency at low irradiances.
Another potential mechanism to explain the reduction in φ is non-radiative
decay. Under low continuous light or low flash frequencies, the S-states of the
oxygen evolving complex can undergo non-radiative decay that can reduce φ
(Kok et al., 1970; Forbush et al., 1971). However, this deactivation is a relatively
slow process with the most rapid half times for C. vulgaris at 25 oC on the order
of ~1.5 secs (Diner and Mauzerall, 1973). The deactivation rate constant is
independent of background light intensity. Because reductions in φ occur in up to
~10% of the light-saturated value of photosynthesis and the photosynthetic unit
turnover time is less than ~20 msec for Chlorella spp., a ~1.5 secs S-state decay
half time is much too slow to account for reductions in φ even at low light levels
(Myers and Graham, 1971). These results are supported by repetitive double-
flash experiments that show that the deactivation of S3 to S2 on the donor side of
PSII is markedly slower than that necessary to account for the reduction in
φ (Diner and Mauzerall, 1973). S. costatum and D. tertiolecta grown under the
present conditions have similar turnover times (58±3 msec and 63±5 msec,
respectively), which are also much greater than typical S-state decay rates (see
below).
Unlike respiration or S-state mechanisms, several lines of evidence from
Diner and Mauzerall (1973) suggest that low-light reductions in φ are a result of
29
acceptor side limitation of PSII. Experiments with P. luridium using
benzoquinone, which replaces NADP+ as a terminal electron acceptor in the
photosynthetic electron transport chain, demonstrate that the reduction in φ for
flash yields is almost completely attenuated. Conversely, phenazine
methosulfate (PMS), which acts as a PSII acceptor side reducer, significantly
enhances the reduction for flash yields. Similarly, far-red light, which
preferentially excites PSI and ultimately oxidizes the PQ pool, also dramatically
attenuates the reduction in φ (Diner and Mauzerall, 1973). These lines of
evidence all support low light reductions in flash yields being driven by an
imbalance in photosystem excitation.
To examine the influence of this imbalance on continuous light P-E curves
made using short-term 14C incubations, I measured P-E and φC-E response
curves for S. costatum and D. tertiolecta in different colors of continuous light.
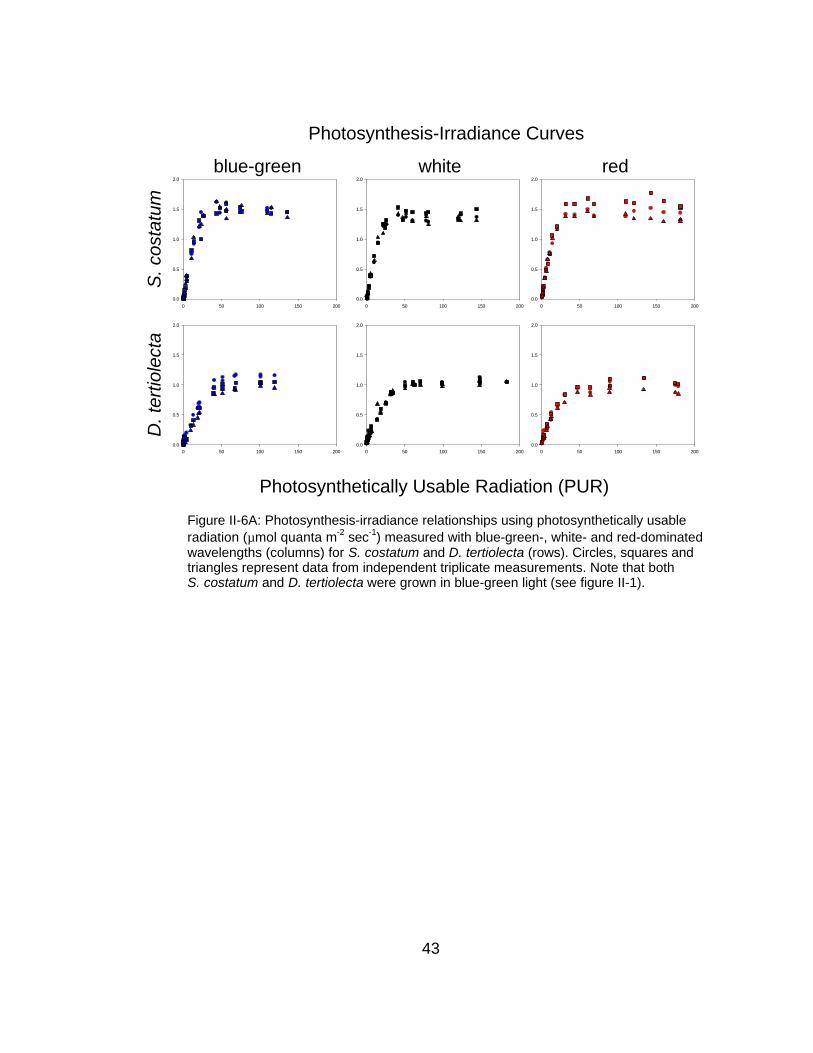
These P-E curves are similar in overall structure with identical light-saturated
photosynthetic rates (P>0.15), while the initial slopes are significantly different
among the different measurement colors for S. costatum (P<0.001) and nearly
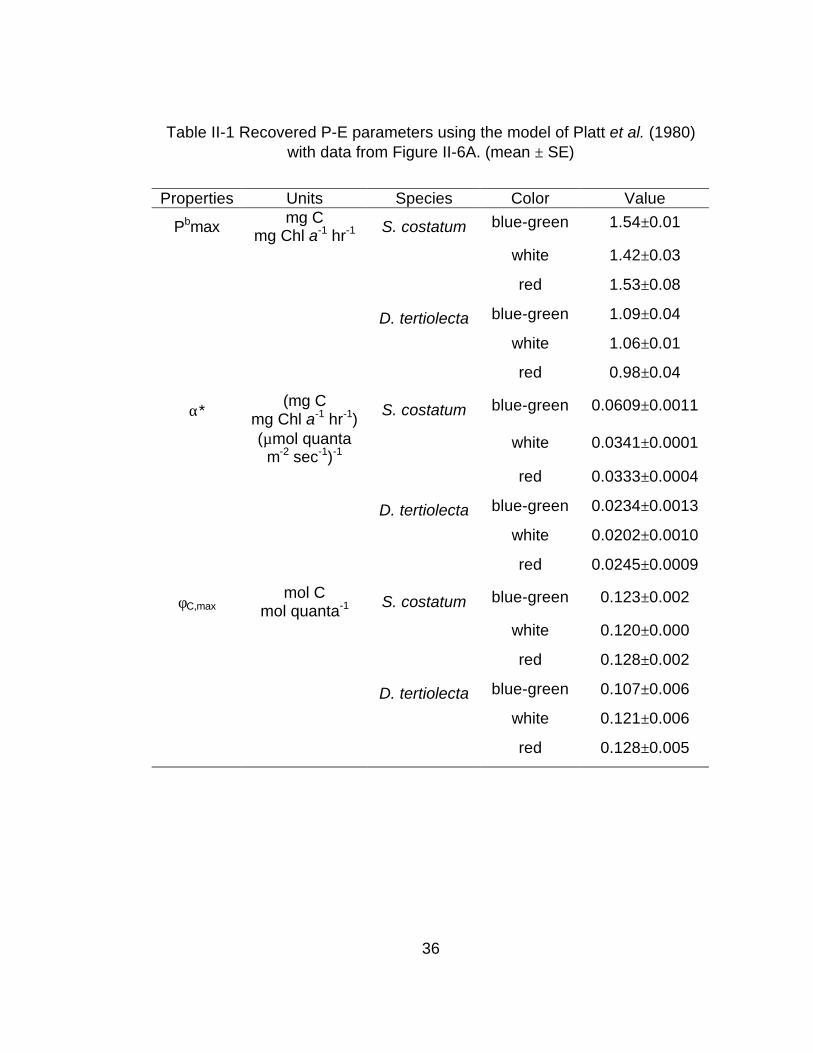
significantly different for D. tertiolecta (P=0.07) (Table II-1, Figure II-6A). All of
these P-E curves are similar in structure to contemporary P-E models (ex. Figure
II-2).
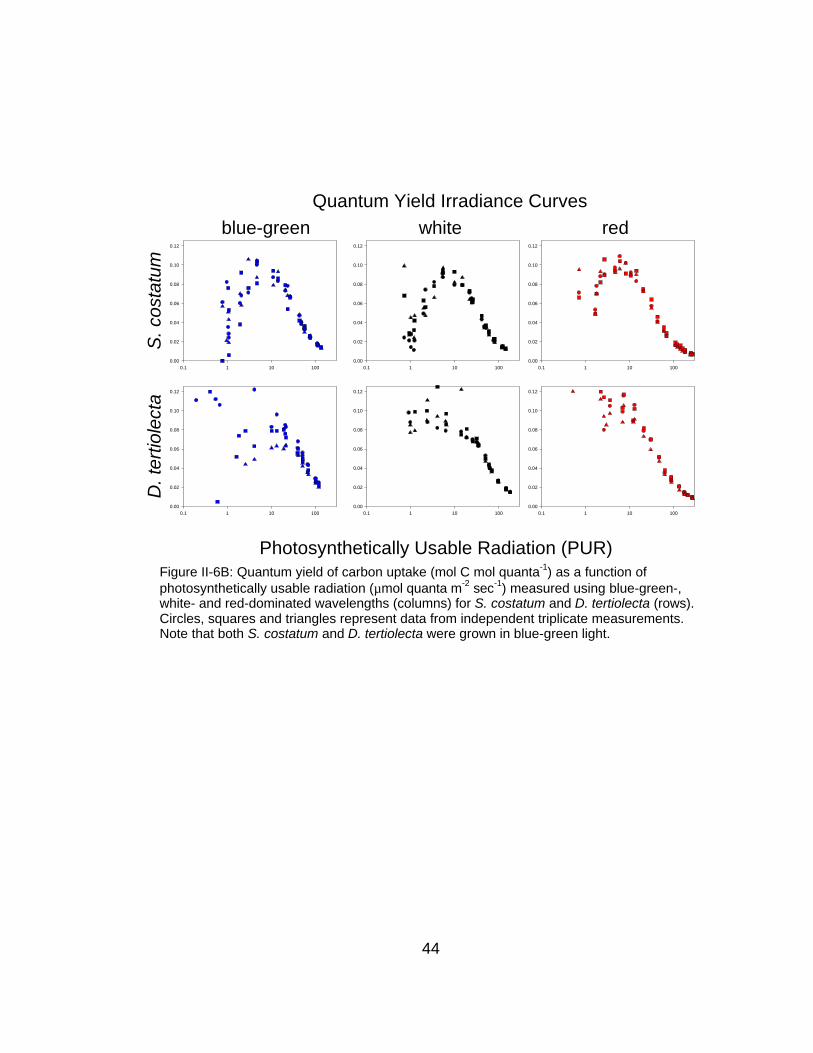
Although the functional form of the P-E curves are generally consistent
with the models, φC-E curves had a great deal more heterogeneity (Figure II-6B).
The maximum quantum yield of carbon uptake (φC,max) for S. costatum were
slightly different (P=0.043) for the different color measurements with the red-
30
measured value at 0.13 while the white and blue-green values were marginally
reduced at 0.12 mol C/mol quanta. Estimates of φC,max for D. tertiolecta were
statistically indistinguishable (P>0.1) for the different measurement colors (0.12
mol C/mol quanta).
The functional response of φC-E for D. tertiolecta is generally similar to that
predicted by widely-used photosynthesis-irradiance (P-E) empirical models
(Figure II-2); φC,max is observed at the lowest irradiances and φC decreases in an
exponential fashion approximately starting at the photosynthesis saturation
irradiance (Ek). However, functional responses of S. costatum φC are markedly
different with significant reductions in φC at low irradiances – the functional form
of the curve is more log-normal in nature. Decreases in φC at low irradiances for
S. costatum are most pronounced for blue-green- and white-measured curves,
but are significantly attenuated in red-measured populations. This color-
dependent reduction in φC at low irradiance is suggestive of imbalances in
photosystem excitation sensu Emerson and Lewis (1943).
Despite significant reductions for S. costatum, which are measurement
color dependent, the functional form of φC-E for D. tertiolecta remains largely
consistent between different treatments. This increased sensitivity for S.
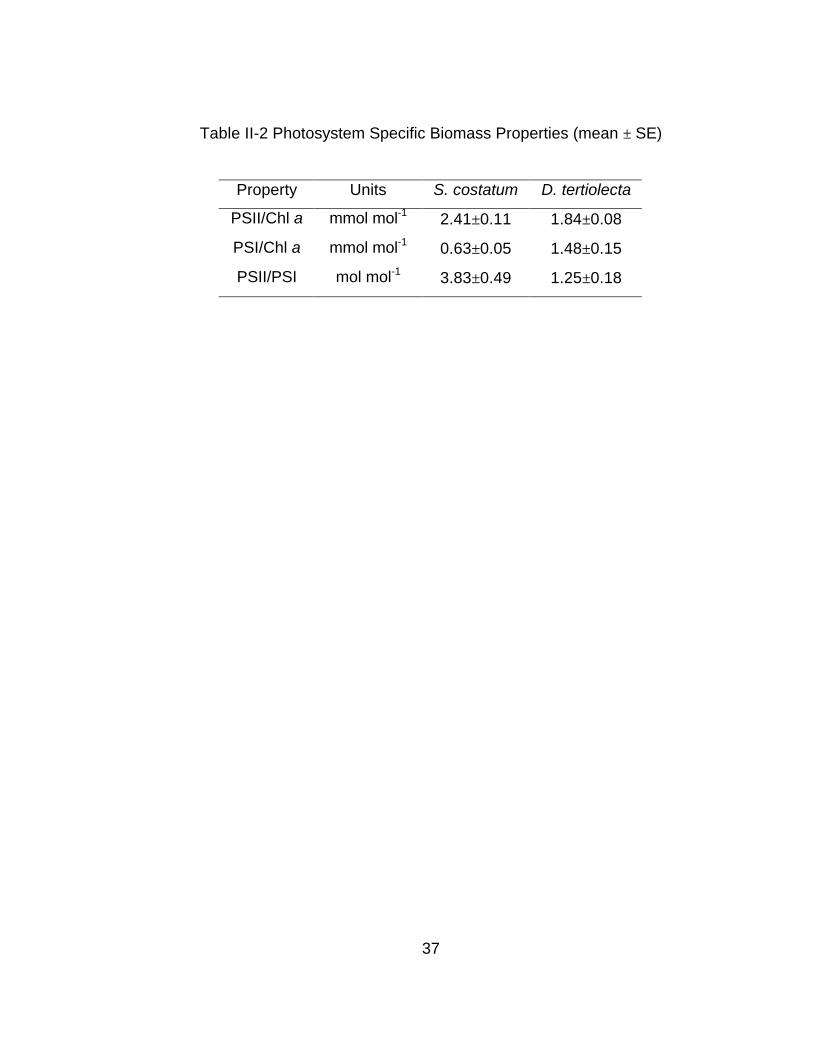
costatum relative to D. tertiolecta may be due to differences in PSII/PSI ratios: D.
tertiolecta has a PSII/PSI ratio that is near unity while S. costatum's PSII/PSI
ratio is significantly elevated (P<0.01) (Table II-2). D. tertiolecta's more balanced
photosystem ratio may permit mechanisms such as state transitions and non-
31
photochemical quenching, which in part regulate excitation energy distribution
between photosystems, to be more effective at relieving photosystem excitation
imbalance (Bonaventura and Myers, 1969; Demmig-Adams, 1990; Kroon et al.,
1993). For example, state transitions, which favor increased PSI cross sections
under blue light, would tend to mitigate photosystem excitation imbalances.
Conversely, S. costatum, which has a PSII/PSI that is much greater than unity,
may be more prone to excitation imbalance under non-favorable spectra. In spite
of a potentially increased threshold for photosystem excitation imbalance, at
much lower light levels D. tertiolecta may also have reductions in φ. These
results for S. costatum and D. tertiolecta using continuous light are consistent
with oxygen flash yield experiments and proposed PSI limitation mechanism
(Diner and Mauzerall, 1973). Photoacclimation studies, which show that the
reduction in φ is an antennae-dependent process, are also consistent with these
observations (Chapter IV). A reduction in quantum yield measured using
radiocarbon techniques that is possibly due to photosystem excitation imbalance,
does not exclude the role of carbon concentrating mechanisms; carbon
concentrating mechanisms are up-regulated under PSI-favorable light and may
account for decreased reductions for red light (Kaplan and Reinhold, 1999).
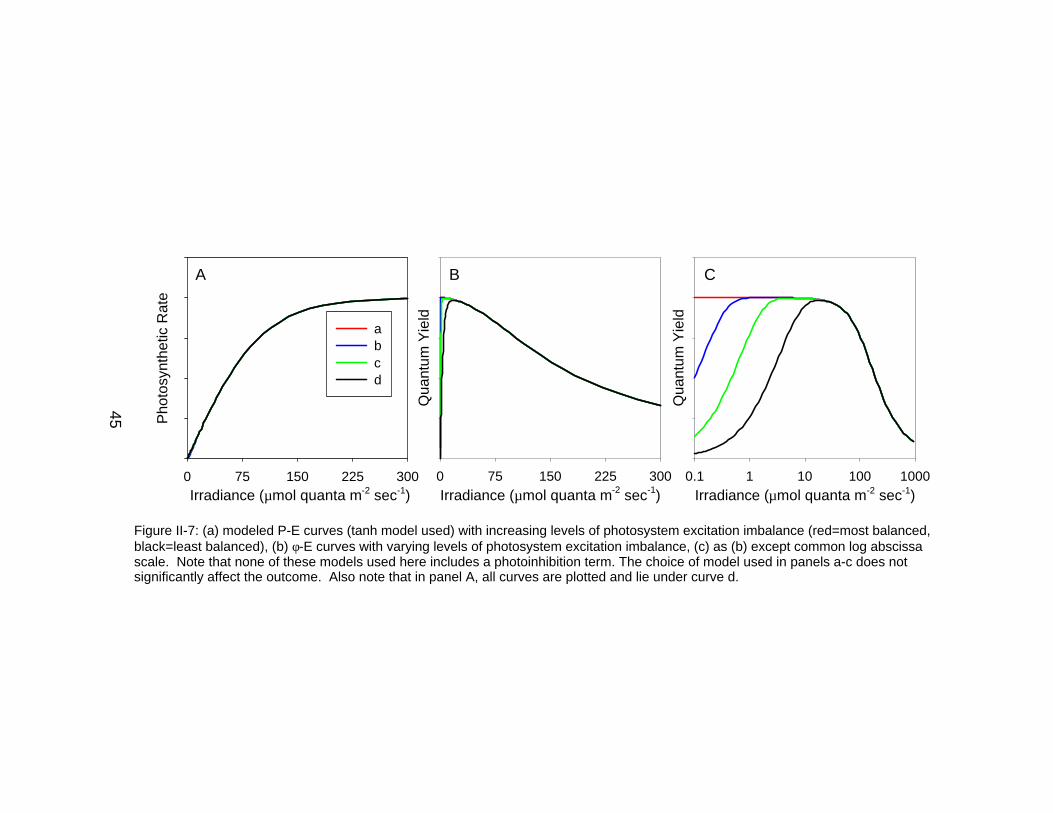
A Potential Source of Error in P-E Analysis
Regardless of the mechanism resulting in quantum yield reduction, to
examine the influence of reductions in quantum efficiency at low irradiances on
the structure of P-E curves, I selected the hyperbolic tangent P-E model as a
32
representative contemporary model and incorporated a low-light quantum yield
reduction term (Figure II-7). Four arbitrary levels of low-light quantum yield
reduction ranging from zero to strong affect the φ-E functional form (Figure II-
7b/c). These reductions are most apparent when using a logarithmic abscissa
because it expands the axis in the low light region. However, these effects are
negligible for the associated P-E curves (Figure II-7a). These results suggest
that reductions in quantum efficiency at low irradiance are not easily observable
using traditional P-E analyses.
Although low-light reductions in φ may not significantly modify the overall
structure of the P-E curve, they can affect the interpretation of the P-E curve. For
example, if the initial slope of the P-E curve is determined by linear regression
through the first several points of the P-E curve (Figure II-8a) and these points
are in the low-light reduced-quantum yield region (Figure II-8c), the estimated
initial slope may be significantly reduced compared to the maximum slope
(Figure II-8d). This type of error may be significant because this initial slope of
the P-E curve (α*) is used in conjunction with absorption measurements to
estimate the maximum quantum yield of photosynthesis (Geider and Osborne,
1992; Lindley et al., 1995; Falkowski and Raven, 1997). For the present case
(Figure II-8), φC,max could be under-estimated by greater than 50% unless the
appropriate (exact) number of points is used to construct the linear regression.
While the linear regression technique under-estimated the true maximum
quantum yield, other techniques such as fitting P-E model parameters to data
can over-estimate the maximum quantum efficiency. For example, using 51 P-E
33
curves that have a three-fold range in the maximum light utilization coefficient
(α*), the Platt et al. (1980) model over-estimates the true maximum quantum
yield by an average of 40% (data not shown). This problem is not unique to the
Platt et al. (1980) model: other P-E model formulations recover significantly
different parameter values that depart from the true values (Frenette et al., 1993;
Henley, 1995). Thus, because model structures are not consistent with observed
data patterns (i.e. low light reductions in φ), there are difficulties associated with
both linear and non-linear contemporary model regressions on P-E data.
Over- or under-estimates of the true maximum quantum efficiency is
highly data- and model-specific: large or small numbers of data points in the
reduced quantum yield region of the P-E curve significantly affects the degree of
error associated with the linear regression and Platt et al. (1980) techniques. To
avoid these potential errors, estimates of the maximum quantum yield of carbon
uptake should be performed using φ-E analyses.
In addition to errors associated with low-light φ reduction and curve fitting
analyses, there also exist additional errors in respiration corrections that can
affect the low-light region of the φ-E structure. Although, light-independent
(constant) respiration per se is not responsible for the sigmoidal structure of the
P-E curve, respiration or respiration-like corrections can affect the structure of the
φ-E curve. For example, using a generalized reduced quantum efficiency model
at low irradiances as a control case, various respiration errors are added to the
P-E and associated φ-E curves (Figure II-9). Similar to the previous conceptual
model graphs, this family of curves demonstrates that respiration errors are not
34
readily observed using traditional P-E analyses. However, when φ-E is analyzed
on a semi-log plot, there can be significant errors associated with small
respiration inaccuracies. For example, an error of +0.1% (under-estimation of
respiration by 0.1% of the light saturated photosynthetic rate), induces large
changes in the φ-E structure. Similarly, -0.1% leads to anomalous negative
values for φ. In the +0.2% case, maximum φ values become dramatically
elevated over the true value. These types of errors can be associated with
corrections made for oxygen respiration and for so-called dark uptake or
adsorption of 14C (Williams and Lefevre, 1996; Markager, 1998). This type of
error is most common when signal-to-noise levels are reduced and the
subtracted value (oxygen respiration or 14C adsorption/dark uptake) represents a
significant fraction of the signal level, such as is typically the case in the low light
region of the curve. Errors in low light φ linked to respiration (or 14C uptake)
corrections are commonly observed for both oxygen evolution and carbon uptake
field and laboratory experiments (Figures II-3-5) and proximally account for the
larger variability in estimated quantum yields at low background irradiances.
Environmental Significance
Observations of spectrally dependent photosynthetic efficiencies at low
irradiances, which are enhanced by red-wavelength light, suggest a mechanism
involving PSI limitation by which Emerson enhancement can take place. This
finding may be particularly important for oceanic photosynthesis; because low
irradiance intensities in the open ocean are associated with blue-dominated

35
irradiance spectra, low-light depressions in φ may significantly reduce light-limited
primary production (Jerlov, 1976; Kirk, 1994). Alternatively, phytoplankton that
dominate at low irradiance intensities such as Prochlorococcus spp. (Olson et al.,
1990) may have photosynthetic pigments or machinery that are optimized for
equal distribution of excitation energy between the two photosystems (Goericke
and Repeta, 1992; Garczarek et al., 1998; Vanderstaay et al., 1998; Johnson et
al., 1999). Indeed, photosynthetic bacteria that are enriched in PSI particles tend
to dominate at lower light levels, deep in the water column. Nevertheless,
reductions in quantum efficiencies at low irradiance have been observed for both
nutrient-replete and -limited surface phytoplankton populations. Regardless of
mechanism, these types of reductions are only apparent when data are analyzed
in a φ-E fashion and are not present for PSII-inferred descriptions of P-E and φC-
E because the reductions in φC are mediated by processes downstream of PSII
(Falkowski et al., 1986; Falkowski and Raven, 1997; Chapters III-V).
36
Table II-1 Recovered P-E parameters using the model of Platt et al. (1980) with data from Figure II-6A. (mean ± SE)
Properties Units Species Color Value
Pbmax mg C
mg Chl a-1 hr-1 S. costatum blue-green 1.54±0.01
white 1.42±0.03
red 1.53±0.08
D. tertiolecta blue-green 1.09±0.04
white 1.06±0.01
red 0.98±0.04
α* (mg C
mg Chl a-1 hr-1) S. costatum blue-green 0.0609±0.0011
(µmol quanta m-2 sec-1)-1
white 0.0341±0.0001
red 0.0333±0.0004
D. tertiolecta blue-green 0.0234±0.0013
white 0.0202±0.0010
red 0.0245±0.0009
φC,max mol C
mol quanta-1 S. costatum blue-green 0.123±0.002
white 0.120±0.000
red 0.128±0.002
D. tertiolecta blue-green 0.107±0.006
white 0.121±0.006
red 0.128±0.005
37
Table II-2 Photosystem Specific Biomass Properties (mean ± SE)
Property Units S. costatum D. tertiolecta
PSII/Chl a mmol mol-1 2.41±0.11 1.84±0.08
PSI/Chl a mmol mol-1 0.63±0.05 1.48±0.15
PSII/PSI mol mol-1 3.83±0.49 1.25±0.18
38
Photosynthetron and Growth Spectra
Wavelength (nm)
400 450 500 550 600 650 700 750
Rel
ativ
e Q
uant
um O
utpu
t
0.0
0.2
0.4
0.6
0.8
1.0
Blue-green
White Red
Figure II-1: Relative quantum output for growth and blue-green,white and red measurement spectra.
Growth
39
Irradiance (µmol quanta m-2 sec-1)
0.1 1 10 100 1000
Qua
ntum
Yie
ld
Irradiance (µmol quanta m-2 sec-1)
0 75 150 225 300
Pho
tosy
nthe
tic R
ate
Rectangular HyperbolaQuadraticExponentialHyperbolic Tangent
Irradiance (µmol quanta m-2 sec-1)
0 75 150 225 300Q
uant
um Y
ield
A B C
Figure II-2: (a) Modeled photosynthesis-irradiance (P-E) curves constructed using identical initial slopes (α*) and maximalphotosynthetic rates (Pbmax) using four contemporary P-E models. (b) quantum yield-irradiance (φ-E) curves associated withthe P-E models. (c) as (b) except with common log abscissa scale. Note that none of these models used here includes aphotoinhibition term.
40
Irradiance (µmol quanta m-2 sec-1)0 75 150 225 300
φ C (
mol
C m
ol q
uant
a-1)
-0.02
0.00
0.02
0.04
0.06
Irradiance (µmol quanta m-2 sec-1)0 75 150 225 300
Pb (
mg
C m
g C
hl a
-1 h
r-1)
0.0
0.5
1.0
1.5
2.0
Irradiance (µmol quanta m-2 sec-1)1 10 100 1000
φ C (
mol
C m
ol q
uant
a-1)
-0.02
0.00
0.02
0.04
0.06
A B C
Figure II-3: (a) Measured P-E curves for nutrient-replete S. costatum grown in continuous moderate intensity (108 µmol quanta m-2 sec-1)white light, (b) φC-E curves associated with panel (a) and (c) as (b) except common log abscissa scale.
41
PAR (µmol quanta m-2 sec-1)
0 500 1000 1500 2000
Rel
ativ
e O
2 E
volu
tion
S. costatum
C. vulgaris
T. weisflogii
I. galbana
D. tertiolecta
PAR (µmol quanta m-2 sec-1)
1 10 100 1000
Rel
ativ
e Q
uant
um Y
ield
PAR (µmol quanta m-2 sec-1)
0 200 400 600
g C
g C
hl a
-1 h
r-1
0
2
4
6
8
D. brightwellii
D. euchlora
T. fluviatilis
I. galbana
C. sanicus
T. pseudonana
PAR (µmol quanta m-2 sec-1)
10 100 1000
Rel
ativ
e Q
uant
um Y
ield
A B
C D
Figure II-4: P-E (a) and associated relative φO2-E (b) calculated from oxygen evolution
for Skeletonema costatum, Chlorella vulgaris, Thalassiosira weisfloggi, Isochrysis galbana,and Dunaliella tertiolecta grown in continuous 67 µmol quanta m-2 sec-1 light. These data are
replotted from Falkowski et al. 1986. P-E (c) and associated relative φC-E (d) calculated fromcarbon uptake for Ditylum brightwellii, Dunaliella euchlora, Thalassiosira fluviatilis, Isochrysisgalbana, Chaetoceros danicus and Thalassiosira pseudonana grown in continuous300 µmol quanta m-2 sec-1 light. These data are replotted from Perry et al. 1981. Note thatreductions at higher irradiances for carbon measured curves likely occur because cultures were grown at higher irradiances compared to cultures measured using oxygen techniques.
42
PAR (W m-2)
0 100 200 300 400
Rel
ativ
e O
2 E
volu
tion
PAR (W m-2 )
1 10 100 1000
Rel
ativ
e Q
uant
um Y
ield
PAR (W m-2)
0 100 200 300 400
Rel
ativ
e C
arbo
n U
ptak
e
PAR (W m-2)
1 10 100 1000
Rel
ativ
e Q
uant
um Y
ield
A B
C D
Figure II-5: P-E (a) and associated relative φO2-E (b) calculated from oxygen evolution
and P-E (c) and associated relative φC-E (d) calculated from carbon uptake for identicalsamples for a mixed field population of phytoplankton collected in the Canadian high arctic.All data are replotted from Platt et al. 1987.
43
blue-green white redS
. cos
tatu
mD
. ter
tiole
cta
Photosynthetically Usable Radiation (PUR)
0 50 100 150 200
0.0
0.5
1.0
1.5
2.0
0 50 100 150 200
0.0
0.5
1.0
1.5
2.0
0 50 100 150 200
0.0
0.5
1.0
1.5
2.0
0 50 100 150 2000.0
0.5
1.0
1.5
2.0
0 50 100 150 2000.0
0.5
1.0
1.5
2.0
0 50 100 150 2000.0
0.5
1.0
1.5
2.0
Photosynthesis-Irradiance Curves
Figure II-6A: Photosynthesis-irradiance relationships using photosynthetically usableradiation (µmol quanta m-2 sec-1) measured with blue-green-, white- and red-dominatedwavelengths (columns) for S. costatum and D. tertiolecta (rows). Circles, squares andtriangles represent data from independent triplicate measurements. Note that bothS. costatum and D. tertiolecta were grown in blue-green light (see figure II-1).
44
blue-green white red
S. c
osta
tum
D. t
ertio
lect
a
Photosynthetically Usable Radiation (PUR)
0.1 1 10 1000.00
0.02
0.04
0.06
0.08
0.10
0.12
0.1 1 10 1000.00
0.02
0.04
0.06
0.08
0.10
0.12
0.1 1 10 1000.00
0.02
0.04
0.06
0.08
0.10
0.12
0.1 1 10 1000.00
0.02
0.04
0.06
0.08
0.10
0.12
0.1 1 10 1000.00
0.02
0.04
0.06
0.08
0.10
0.12
0.1 1 10 1000.00
0.02
0.04
0.06
0.08
0.10
0.12
Quantum Yield Irradiance Curves
Figure II-6B: Quantum yield of carbon uptake (mol C mol quanta-1) as a function ofphotosynthetically usable radiation (µmol quanta m-2 sec-1) measured using blue-green-,white- and red-dominated wavelengths (columns) for S. costatum and D. tertiolecta (rows).Circles, squares and triangles represent data from independent triplicate measurements.Note that both S. costatum and D. tertiolecta were grown in blue-green light.
45
Irradiance (µmol quanta m-2 sec-1)0 75 150 225 300
Qua
ntum
Yie
ld
Irradiance (µmol quanta m-2 sec-1)0 75 150 225 300
Pho
tosy
nthe
tic R
ate
abcd
Irradiance (µmol quanta m-2 sec-1)0.1 1 10 100 1000
Qua
ntum
Yie
ld
A B C
Figure II-7: (a) modeled P-E curves (tanh model used) with increasing levels of photosystem excitation imbalance (red=most balanced,black=least balanced), (b) φ-E curves with varying levels of photosystem excitation imbalance, (c) as (b) except common log abscissascale. Note that none of these models used here includes a photoinhibition term. The choice of model used in panels a-c does notsignificantly affect the outcome. Also note that in panel A, all curves are plotted and lie under curve d.

46
PAR (µmol quanta m-2 sec-1)
0 50 100 150
Pb (
mg
C m
g C
hl a
-1 h
r-1)
0.0
0.5
1.0
1.5
# points used in slope determination
0 20 40 60 80
Fra
ctio
n of
Max
imum
Slo
pe (
alph
a)
0.0
0.2
0.4
0.6
0.8
1.0
PAR (µmol quanta m-2 sec-1)
1 10 100
φ C (
mol
C m
ol q
uant
a-1)
0.00
0.02
0.04
0.06
0.08
0.10
0.12
A
C D
PAR (µmol quanta m-2 sec-1)
0.1 1 10 100
Pb (
mg
C m
g C
hl a
-1 h
r-1)
0.0
0.5
1.0
1.5
B
Figure II-8: (a) P-E for blue-green-grown S. costatum and measured with whiteirradiance. (b) as (a) except on common log abscissa. (c) φC-E curve associated withpanels (a) and (b). (d) Fraction of maximum slope estimated by linear regression as afunction of the number of points used in the regression. Note that the photosynthesissaturating irradiance intensity (Ek) occurs at approximately data point number fifteen.
Irradiance (µmol quanta m-2 sec-1)0 75 150 225 300
Qua
ntum
Yie
ld
Irradiance (µmol quanta m-2 sec-1)0 75 150 225 300
Pho
tosy
nthe
tic R
ate
-0.1%control+0.1%+0.2%
Irradiance (µmol quanta m-2 sec-1)0.1 1 10 100 1000
Qua
ntum
Yie
ld
A B C
Figure II-9: (a) modeled P-E curves (tanh model used) with variable levels of respiration (or dark uptake) correction error (+0.1% is anunder estimation of respiration by 0.1% of the light saturated photosynthetic rate), (b) φ-E curves associated with (a), and (c) as (b)except common log abscissa scale. The choice of model used in panels a-c does not significantly affect the outcome. Also note thatin panels A & B, all curves are plotted and either lie under the 0.2% curve or the y-axis.
47
48
Chapter III
Photophysiological characterization of wild type and non-photochemical quenching mutants of Chlamydomonas reinhardtii (WT, npq1, npq2) using
standard and novel modulated fluorescence techniques

49
Non-photochemical quenching (NPQ) via the xanthophyll cycle is a
significant pathway in the regulation of photosynthetic excitation energy
distribution. Although the mechanism of NPQ is not fully understood and
may vary among different classes of plants, the basic pathway in part
involves the epoxidation and de-epoxidation of zeaxanthin, antheraxanthin
and violaxanthin pigments and specifically affects photosystem II (PSII).
Here using Chlamydomonas reinhardtii mutants with different epoxidase
and de-epoxidase genetic lesions (npq1 and npq2), I investigate the role of
NPQ on (1) photophysiology and (2) the relationship between PSII
parameters and photosynthetic rates and efficiency. npq1, which lacks
violaxanthin de-epoxidase activity and has a reduced NPQ capacity, has
increased chlorophyll b/a and reduced PSII/cell, light utilization,
photosynthetic capacity and quantum efficiency all relative to WT. npq2,
which lacks zeaxanthin epoxidase and has increased NPQ induction
kinetics (but also has reduced NPQ capacity), has reduced PSI/cell,
photosynthetic unit cross section, light utilization and quantum efficiency
relative to WT. Although both mutants are different than WT, npq1 is more
severely affected than npq2. On dark relaxed cells, measures of PSII cross
sectional area in the dark and in the presence of background light are
consistent with standard measurements and support NPQ acting as a
photosynthetic antenna excitation energy trap. The combination of
standard and fluorescence-derived results suggests that the xanthophyll
cycle directly and indirectly affects thylakoid composition and excitation
50
energy processing. In the context of NPQ, single turnover fluorescence
(PSII) measurements describe well the general patterns of measured
photosynthetic rates, but not absolute rates or efficiencies because of
indirect effects of the xanthophyll cycle.
INTRODUCTION
Oxygenic photoautotrophs must maintain a balance between having adequate
excitation energy to drive photosynthesis and limiting the effect of potentially
damaging over-excitation (Barber and Andersson, 1992). A primary mechanism
towards achieving this goal is the dissipation of excess excitation energy via the
xanthophyll cycle (Demmig-Adams and Adams, 1992; Niyogi, 1999). Although
complex and not fully characterized, this mechanism is based on the
interconversion of xanthophyll pigments by specific enzymes: under normal
conditions xanthophyll pigments absorb light and transfer excitation energy to
photochemistry, whereas under high-light, excess-excitation energy conditions
xanthophylls are converted to a form that dissipates the energy as heat (Demmig
et al., 1987; Demmig-Adams, 1990; Demmig-Adams and Adams, 1996; Niyogi et
al., 1997; Havaux and Niyogi, 1999; Lohr and Wilhelm, 1999). This pigment
interconversion is triggered by an elevated pH gradient across the thylakoid
membrane generated by reduction of the plastoquinone pool (Demmig-Adams
and Adams, 1992). These xanthophyll pigments are fully interconvertible and
provide a flexible mechanism to aid in the acclimation to naturally fluctuating light
conditions (Casper-Lindley and Bjorkman, 1998; Moisan et al., 1998).
51
Using Chlamydomonas reinhardtii as a model organism, Niyogi et al.
(1997) have created several algae mutant in specific pathways of xanthophyll
pigment interconversion to study this process. npq1 mutants lack violaxanthin
de-epoxidase activity and are unable to convert violaxanthin to zeaxanthin in high
light. Consequently they have a reduced, but non-zero capacity for non-
photochemical quenching (NPQ) of fluorescence (Niyogi et al., 1997).
Nonphotochemical quenching of fluorescence, which is highly light intensity and
duration dependent, can be defined mathematically as (Fm(0)-Fm(x))/Fm(x) where
Fm(0) is maximal fluorescence in the dark and Fm(x) is the maximal fluorescence
in the presence of background irradiance (x) (see below) (Niyogi et al., 1997).
Conversely, npq2 mutants lack zeaxanthin epoxidase activity and are unable to
convert zeaxanthin back to violaxanthin under normal excitation energy
conditions. Despite this lesion, npq2 NPQ returns to pre-illumination values in
the presence of low light because its maintenance requires both pigment
conversion and a pH gradient. Unexpectedly, npq2 NPQ is also lower than wild
type (WT), but is more quickly induced in the presence of high light (Niyogi et al.,
1997). Although the pathways lesioned in npq1 and npq2 are not responsible for
all NPQ, together with WT C. reinhardtii these mutants provide a window into the
photophysiological effects of NPQ (Niyogi, 1999).
Because npq1 and npq2 were originally isolated and characterized as
fluorescence mutants (Niyogi et al., 1997), they also provide a unique opportunity
to examine the effect of NPQ on fluorescence induction properties as they relate
to photophysiology. Fluorescence measures provide a rapid, non-destructive
52
assessment of the structure and function of photosystem II (Papageorgiou, 1975;
Schreiber et al., 1986; Dau, 1994; Kolber et al., 1998). From the magnitude and
kinetics of fluorescence induction and decay curves, specific measures of
photosystem II functional size, conversion efficiency, connectivity, turnover and
NPQ can be assessed (Ley and Mauzerall, 1982; Trissl et al., 1993; LaVergne
and Trissl, 1995; Lazar, 1999). In particular, single turnover type-fluorescence
measures of PSII functional cross sectional area provide a rapid assessment of
the effect of NPQ on the functional antennae size. Also, measures of PSII
conversion efficiency and cross sectional area as a function of background
irradiance intensity may provide insight into the effect of NPQ on the
photosynthesis-irradiance response curve.
Here I use measures of photosynthetic biomass properties such as
pigment concentrations, photosystem concentrations and absorption properties
and conventional measures of photosynthetic functionality such as
photosynthesis-irradiance relationships, flash yields and turnover time in
combination with a novel single turnover (ST)-type fluorometer to
photophysiologically characterize WT, npq1 and npq2 C. reinhardtii. Using these
data, my primary goal is to assess the influence of the xanthophyll cycle on
photophysiology. In the context of these findings, my secondary goal is to
investigate the role that PSII-specific processes (here the xanthophyll cycle and
NPQ), as probed by fluorescence measurements, have in regulating the overall
photosynthesis-irradiance (P-E) curve structure.
53
My working hypothesis is that the xanthophyll cycle through NPQ
proximally acts as an alternate non-photosynthetically active trap in the
photosynthetic antenna, effectively reducing the cross sectional area of the
photosynthetic unit. Thus, under NPQ favorable conditions, the first order result
of a lesioned xanthophyll cycle should be that the functional cross sectional area
is elevated for npq1 and reduced for npq2 relative to WT because of the relative
loss and addition, respectively, of traps to the antennae. Indirectly, NPQ lesions
may lead to altered pigmentation, cross sections, quantum efficiency and growth
rates relative to WT because of second order changes in pigmentation, damage
to reaction centers and alterations to PSII/PSI ratios. Since NPQ, by definition, is
a photophysiological process that affects fluorescence, fluorescence-based
estimates of P-E should reveal similar patterns as conventional methods in the
context of direct NPQ variability.
NPQ mutants are significantly different from WT in biomass and
physiological properties due to direct and indirect effects from xanthophyll cycle
lesions. Both standard and fluorescence induction analyses suggest that the
direct effects of these lesions are centered in antennae pigment-bed composition
and functionality with indirect manifestations including altered photosynthetic
conversion efficiencies, turnover times and photosystem ratios. Finally, in the
context of NPQ variability, ST-type fluorescence measurements do well in
describing P-E structure, but not in describing the magnitudes of P-E and max2Oφ .
METHODS
54
Culture conditions
Chlamydomonas reinhardtii (CC125 - WT), (CC3682 - npq1), (CC3683 - npq2)
obtained from Duke University Chlamydomonas Genetics Center were grown in
aqueous HS media (Sueoka, 1960). Semi-continuous batch cultures, grown in
continuous light at 200 µmol quanta m-2 sec-1 at 19oC and bubbled with 5% CO2,
were periodically diluted with fresh media to maintain exponential growth.
Absorption, Pigments, Growth Rates, Cell Density
Spectral absorption measurements were made at 2 nm resolution with a 1 sec
integration time on samples in solution using an HP 8452 diode array
spectrophotometer with Labsphere (RSA-HP-84) integrating sphere. Absorption
at 750 nm was assumed to be non-cellular and was subtracted from the
absorption curve. Absorption coefficients were calculated following Kirk (1994).
Chlorophyll a and b were determined on 90% acetone extracts following Parsons
et al. (1984), except without MgCO3 addition, using the trichromatic equations of
Jeffrey and Humphrey (1975). Intrinsic growth rates were calculated from bulk
fluorescence measurements made with a Turner Designs 10-005R fluorometer.
Cell concentrations were estimated using a hemacytometer.
Photosystem Quantification
Emerson-Arnold (E&A) numbers (Chl a/O2) were measured using a Hansatech
oxygen electrode and a Stroboslave (Type1539A) tunable frequency, saturating
strobe light following Dubinsky et al. (1986). PSII/Chl a was calculated as four
55
times the initial slope of oxygen evolution rate versus flash frequency, normalized
to chlorophyll concentration. Chl a/PSI were measured on thylakoid membranes
using the chemical oxidation/reduction technique and quantifying the absorption
difference at OD697 normalized to OD725 following Marsho and Kok (1971) and
Melis and Brown (1980). Thylakoid membranes were isolated from
phytoplankton cells harvested by centrifugation for 5 min at 9777×g, sonication
(25 W) of the resuspended pellet in 0.02% Triton X-100 in 50 mM Trizma for 30
seconds and then centrifugation at 25000×g for 2 min. Chlorophyll concentration
of the thylakoid-containing supernatant was calculated using 60 mM Chla/OD680
(Thornber et al., 1977). P700 (PSI) concentrations of thylakoid membranes were
calculated using 64 mM P700/∆OD697/725 where ∆OD697/725 represents the change
in optical density from oxidized to reduced spectra at 697 nm relative to 725 nm
(Hiyama and Ke, 1972; Melis and Brown, 1980). All optical density
measurements for Chl a/PS I were made using a split beam Cary 219
spectrophotometer with a 1 cm pathlength.
Photosynthesis vs Irradiance (P-E), Turnover Rates
Oxygen-based photosynthesis-irradiance measurements were made using an
automated Clark-type oxygen electrode with computer-controlled red LED light
source (Hansatech). Oxygen concentrations were sampled digitally and oxygen
evolution rates calculated using custom written software. Irradiance intensity
(PAR) was measured using a Biospherical Instruments (QSL-100) 4π scalar
irradiance meter. Photosynthetic parameters of the Platt et al. (1980) model (α*,
56
Ps, β) were optimized to fit the data using a custom written, non-linear least-
squares Levenberg-Marquardt technique. Optimization of model parameters to
P-E data was performed using PAR as the independent variable. Secondary
parameters (Pbmax and Ek) were calculated following Zimmerman et al. (1987).
Maximum quantum yield ( max2Oφ ) was calculated as the mol O2 evolved to mol
quanta absorbed using absorption coefficients that were spectrally weighted to
incident measurement irradiance (Sakshaug et al., 1997) following:
*
*
max, 2782
i
Oa
αφ = (III-1)
where α* is the maximum light utilization coefficient (mol O2 g Chl a-1 hr-1 (µmol
quanta m-2 sec-1)-1) and *ia is the spectrally-weighted mean chlorophyll a-specific
absorption coefficient (m2 g Chl a-1) (Chapter II) and 278 converts hours to
seconds and µmol to mol. Photosynthetic unit turnover rate constant (sec-1),
1/τPSU, was calculated as:
n
P b
PSU
max248.01 =τ (III-2)
where Pbmax is light-saturated photosynthesis (µmol O2 µg Chl a-1 hr-1), n is the
concentration of PSII (mol O2 mol Chl a-1) and 0.248 converts the units from
57
hours to seconds and grams to moles. The photosynthetic unit cross section
(σPSU) was calculated as α* multiplied by E&A and correcting for units.
Modulated Fluorescence
Modulated fluorescence measurements were performed with a custom-built fast
repetition rate type fluorometer (Kolber et al., 1998) with computer-controlled
background irradiance gradient (BIG-FRRf) (Figure III-1). This instrument is
centered around a cuff of super bright blue LEDs (Nichia NSPB500S) that
illuminate an aqueous sample of phytoplankton producing fluorescence. One
bank of LEDs (84) is operated in AC mode (1MHz) and is used to excite and
probe photosystem II. A second bank of LEDs (28) is operated in DC mode and
is used to provide a variable intensity, continuous background irradiance source
that is calibrated using a Biospherical Instruments (QSL-100) 4π scalar irradiance
meter. The fluorescence signal generated is isolated through a long pass
dichroic (Melles-Griot #RG665) and interference (Oriel #53970) filter set and
quantified by means of a photomultiplier tube (Hamamatsu #R2066). A fraction
of the excitation energy is quantified with a PIN photodiode (Hamamatsu
#S1722-02). Excitation and emission signals are synchronously sampled at 10
MHz and passed through an analog to digital converter (Gage Compuscope
1012PCI).
The measurement protocol is computer-controlled by custom-written
software via a graphical user interface (GUI). Four basic functions are supported
by the GUI including: excitation protocol, decay protocol, background irradiance
58
protocol and PMT gain settings. The software allows a great deal of flexibility in
experimental protocol and permits modification of intensity, duration and
frequency of both excitation and fluorescence decay protocols. The background
irradiance can be regulated both in intensity and duration. For this study, the
excitation protocol was run for 350 µsec at high intensity with a 100% duty cycle
followed by the decay protocol that was run for 7.5 msec at low intensity with a
1% duty cycle. The pre-illumination background irradiance duration was 500
msec. Samples were dark adapted for >15 min for each background irradiance
setting.
Raw data are internally processed by the same GUI to isolate excitation
and fluorescence signals from background noise. The frequency resolution of
the reduced data is 1 MHz. Reduced data are displayed graphically on the GUI.
Reduced data were analyzed with custom-written software (MATLAB 5.3v11).
Single turnover type fluorescence induction curves were fit using a custom
written, non-linear least-squares Levenberg-Marquardt technique following
Kolber et al. (1998) to determine Fo, Fm, σPSII and p where Fo is initial
fluorescence, Fm is the maximal fluorescence, σPSII is the functional cross-
sectional area, p is a connectivity parameter. Values of σPSII for Fv (Fm-Fo) <
0.075 were excluded from the analysis because of poor model fits to data.
Representative data from the BIG-FRRf is presented in Figure III-2. For
the experimental protocol used in this study, raw data output contains a 350 µsec
excitation region followed by a 7.5 msec decay region (Figure III-2a). Raw data
are in 0.1 µsec intervals and have not been corrected for background signals.
59
Raw fluorescence excitation data (Figure III-2b) contain little white noise, but are
strongly affected by background signals. Reduced fluorescence excitation data
(Figure III-2c) is in 1 µsec intervals and individual excitation points have been
binned and averaged over the 1 µsec blocks thus averaging out a great deal of
white noise. Fluorescence excitation has also been corrected for background
excitation (non-signal, DC voltage). Similarly, emission points have been binned
and averaged into 1 µsec blocks and have been corrected for background
fluorescence (non-signal, DC voltage) and have been normalized to the relative
excitation signal thus giving fluorescence yield. It is this fluorescence yield curve
in combination with a cumulative excitation curve, which is subsequently
analyzed.
Raw fluorescence decay curves are similar to fluorescence excitation
curves except that because the duty cycle is 1%, there are many short duration
peaks in the raw data (Figure III-2d/e). Both excitation and emission peaks have
a half-peak height of approximately 1 µsec and are easily isolated from the
background (non-signal, DC voltage) using simple signal extraction techniques.
Again, fluorescence is normalized to excitation to produce fluorescence yields
and this time-dependent curve can be analyzed (Figure III-2f).
For each background irradiance intensity, both fluorescence excitation and
decay curves are generated as in Figure III-2a. Hence, for each background
irradiance there is generated a suite of fluorescence-derived parameters. These
parameters are referred to with the subscript indicating the background
irradiance intensity. Thus, Fv/Fm(0) is photosystem II photochemical conversion
60
efficiency in the dark and σPSII(521) is the PSII functional cross sectional area at
521 µmol quanta m-2 sec-1.
RESULTS
Photosynthetic Biomass
Results from photosynthetic biomass measurements are summarized in Table III-
1. Chlorophyll a and absorption cross section per cell (σcell) were relatively
constant between WT and NPQ mutants. However, chlorophyll b/a pigment
ratios were significantly elevated for npq1 relative to WT. WT and npq1
chlorophyll a specific absorption coefficients (σChla) were similar while npq2
values were elevated. These increases were dominated by increases in the blue
and red regions of absorption (Figure III-3). Nevertheless, there were large
percentage increases in npq2 specific-absorption in the 500-600 nm region.
Similarly, photosynthetic unit cross sections (σPSU) were identical between WT
and npq1, but were reduced for npq2.
Photosystem concentrations were also dramatically different between WT
and NPQ mutants (Table III-1). Chlorophyll a/PSI sizes were significantly
reduced for npq1 and increased for npq2 relative to WT. Emerson-Arnold
numbers were similar between WT and npq2, but were significantly elevated
~50% for npq1. These differences in PSI and PSII concentrations also translated
into differences in PSII/PSI ratios. WT PSII/PSI molar ratios were near unity,
whereas npq1 were reduced ~50% and npq2 were elevated ~50%.
61
Photophysiology
Photosynthesis-irradiance curves (P-E) were dramatically different between WT
and NPQ mutants both in shape and magnitude (Figure III-4). WT and npq2 had
similar light-saturated photosynthesis, but npq1 Pbmax was significantly reduced.
The initial slope of the P-E curve, or maximum light utilization coefficient (α*),
was highest for WT and reduced ~30% for npq2 and ~45% for npq1 (Table III-1).
The maximum quantum yield of oxygen evolution ( max2Oφ ) largely followed
the patterns of α* with the highest values for WT and the lowest values for npq1.
Although σChla were somewhat different between WT and NPQ mutants, the
absolute changes were relatively small when compared to differences in α*.
Similarly, intrinsic growth rates of WT and NPQ mutants followed the same
general patterns as α* (r2=0.87) and max2Oφ (r2=0.85) with WT having the highest
growth rates followed by npq2 and npq1.
Because Pbmax and Emerson-Arnold numbers were similar for WT and
npq2, both also had similar photosystem turnover rates (1/τPSU). npq1 had
dramatically reduced Pbmax and despite an increase in E&A, its 1/τPSU was also
significantly reduced.
Fluorescence Induction
Characteristic fluorescence excitation and decay data are presented in Figures
III-5 and -6. These fluorescence excitation and decay curves are representative
of WT and NPQ mutant C. reinhardtii. Fluorescence excitation curves increased
62
in a saturating exponential fashion. Both Fo and Fm increased with increasing
background irradiance (Figure III-5, -7a,b). The increase in fluorescence as a
function of cumulative excitation energy, which is described by σPSII, was
influenced by background irradiance (see below). Fluorescence decay was also
significantly influenced by background irradiance (Figure III-6). Here, the
variable fluorescence, or relative amount of fluorescence recovery, declined
dramatically between low and high background irradiance intensities.
Differences in Fo and Fm structure and magnitude translated into
significant differences in Fv/Fm-irradiance curves (Fv/Fm-E) for WT, npq1 and
npq2 (Figure III-7c). All Fv/Fm-E curves decreased rapidly with increasing
irradiance such that at background irradiances above ~300 µmol quanta m-2 sec-1
Fv/Fm was less than 0.1. This decrease was nearly exponential in structure.
The overall magnitude of the WT Fv/Fm curve was greatest.
Photosystem II functional cross sectional area-irradiance curves (σPSII-E)
were less effected by background light and had only minor variations (Figure III-
7d). Values of σPSII(0) were reduced for npq2 relative to WT and npq1. These
small differences in σPSII(0) were also present at higher irradiance values on the
σPSII-E curve.
Overall, all modulated fluorescence photosynthetic parameters, with the
exception of σPSII, were strongly dependent on background irradiance intensity
(Figure III-7). The structure of this irradiance-dependence was also different
between WT and NPQ mutants. Nevertheless, all parameter curves were
63
generally consistent with those generated for other species under different
nutritional and irradiance regimes (Chapter IV & V).
DISCUSSION
Photosynthetic Biomass
Although some properties remain the same between WT and NPQ mutants,
there remain significant differences in the photosynthetic biomass between WT,
npq1 and npq2. For example, although cellular chlorophyll a concentrations and
σcell are similar between WT and NPQ mutants, which is likely due to a general
compensatory balance between photosystem-specific processes and
photosynthetically active and non-active accessory pigments, respectively, σChla
is significantly elevated for npq2 relative to WT. This increase may be due to an
accumulation of xanthophyll pigments relative to WT (Niyogi et al., 1997); since
npq2 lacks zeaxanthin epoxidase, any excess production of zeaxanthin cannot
be recycled and potentially leads to a surplus of xanthophyll pigments. An
increase in xanthophyll pigments is also consistent with the dramatic proportional
increase in chlorophyll a-normalized absorption in the 500-600 nm absorption
band relative to WT and the large absorption increase in the 400-500 nm
absorption band (Figure III-3) as well as the decrease in σPSU and σPSII(0) despite
increases in σChla.
In addition to bulk pigment concentrations, photosystem-specific
properties are also affected by modifications to the xanthophyll cycle. The
PSII/PSI molar ratio for WT is near unity suggesting that photosystem excitation
64
energy balancing mechanisms such as pigment complementation, state
transitions and NPQ are responsible for photosystem excitation balance
(Bonaventura and Myers, 1969; Murakami et al., 1997). The relative decrease in
functional cellular PSII concentration for npq1 and the decrease in cellular PSI
concentration for npq2 suggests that xanthophyll cycling significantly affects the
distribution of excitation energy through photosystem I and II. For example,
when the xanthophyll cycle has been abated and NPQ is reduced such as for
npq1, (Niyogi et al., 1997), there may be an excess of excitation energy through
PSII (Melis et al., 1989). Despite this potential increase, npq1 has an enhanced
E&A relative to WT. This increase, which is in the opposite direction one would
expect to decrease the probability of photon interception for PSII, is probably due
to the decreases in PSII/cell while PSI/cell remains constant. This is supported
by WT and npq1 having similar σPSII(0).
For npq2, the opposite is true: because of the accumulation of
photoprotective xanthophyll pigments and subsequent reduction in excitation
energy flux, an increase in the relative PSII concentrations may be expected
(Niyogi et al., 1997). A reduced flux through PSII leads to a reduced requirement
for PSI and may account for a ~40% reduction in npq2 PSI cellular
concentrations relative to WT. The overall effect of modification of PSI and PSII
concentrations as affected by the xanthophyll cycle is that npq1 has a reduced
PSII/PSI ratio whereas npq2 has an increased PSII/PSI. These modifications in
pigmentation and photosystem concentrations suggest that the xanthophyll cycle
can significantly alter the distribution of excitation energy between the two

65
photosystems. Therefore, it is likely a critical component in the acclimation to
both irradiance intensity and color (Kroon et al., 1993; Murakami et al., 1997;
Chapter II).
Photophysiology
In addition to differences in the pigmentation and photosystem complement
between WT, npq1 and npq2 there are significant differences in photophysiology.
Both α* and max2Oφ are reduced for npq1 and npq2 relative to WT. Evidence from
npq1 Fv/Fm(0) suggests that the decreases in α* and max2Oφ may be due to a
relative increase in damaged reaction centers. Because NPQ represents a
significant protection mechanism from over-excitation, npq1 PSII reaction centers
likely experience increased stress from oxygen radicals associated with over-
excitation (Aro et al., 1993; Anderson et al., 1998). This reaction center damage
may also in part lead to the observed ~50% reduction in Pbmax relative to WT.
This is consistent with similar σChla, σPSU and σPSII(0) between npq1 and WT, but
decreased max2Oφ . Relative to WT, npq2 also has reduced α* and max2Oφ , but here
reductions in efficiency are likely due to the over-accumulation of non-
photosynthetically active xanthophylls and not due to a net increase in PSII
reaction center damage (see below). This is supported by similar Pbmax values
for WT and npq2. A reduced σPSU and σPSII(0) for npq2 is consistent with excess
xanthophyll pigments, which acting as a competing trap, lead to smaller effective
absorption cross sections and α*.
66
The net result of these insults on the photophysiology of npq1 and npq2 is
a reduction in both of the growth rates relative to WT. Of the two mutants, the
growth rate of npq1, which is reduced by ~50%, is most significantly affected.
The reduction in growth rate is likely the direct result of photodamage to PSII, but
autotrophic growth is still possible because the lesion does not fully eliminate
NPQ (Niyogi et al., 1997). Further, additional pathways such as state transitions
and alteration of pigmentation help to avoid some damage (Demmig-Adams and
Adams, 1992 ; Long et al., 1994). It is also likely that protein turnover, especially
those proteins associated with the reaction center core such as D1/D2/CP43, is
increased relative to WT (Aro et al., 1993).
The growth rate for npq2 is also reduced relative to WT, but by only ~20%.
Here the reduction is likely due to the over-accumulation of non-photosynthetic
xanthophyll pigments (Niyogi et al., 1997). The over-accumulation of xanthophyll
pigments, which in turn is associated with de-excitation, likely reduces the flux of
excitation energy available to photochemistry and ultimately reduces the growth
rate.
Fluorescence Induction
Modulated fluorescence measurements provide further evidence of the direct and
indirect effects of npq1 and npq2 lesions on photophysiology. Photosynthetic
conversion efficiency of PSII (Fv/Fm(0)) was maximal for WT, but reduced for both
npq1 and npq2. The reduction in Fv/Fm(0) in npq1 is likely due to damage to PSII
67
reaction centers and is consistent with reductions in max2Oφ , α* and PSII/cell and
increases in E&A.
The reduction in the Fv/Fm(0) signal of npq2 is more complicated and may
not be due to reductions in PSII conversion efficiency per se: two lines of
evidence suggest that the apparent decrease in Fv/Fm(0) may be due to an
increase in antennae pigment fluorescence. The first line of evidence is that
other properties linked to PSII efficiency are not consistent with the magnitude of
reduction in Fv/Fm(0). For example, α* and max2Oφ are ~20% higher in npq2
relative to npq1, while Fv/Fm(0) is ~10% reduced. In addition, WT and npq2 have
similar E&A and PSII/cell, but different Fv/Fm(0). These data suggest that Fv/Fm(0)
may not be exclusively linked to true PSII efficiency estimates in npq2. The
second line of evidence is that the NPQ of npq2 is significantly reduced in spite
of an accumulation of NPQ-favorable zeaxanthin (Niyogi et al., 1997). An
increase in antennae pigment-based fluorescence, which could lead to an
increased dark Fm (and Fo), would reduce the measured NPQ and Fv/Fm(0).
Further, an increase in antennae-based fluorescence, which would provide an
additional de-excitation path not measured by NPQ, would also account for
discrepancies between reduced NPQ, but also reduced σPSU and σPSII(0) relative
to WT. This induction of antennae-based fluorescence may be the result of
abnormally high levels of zeaxanthin that in turn induces an alternate de-
excitation pathway. Regardless of the mechanism, efficiency estimates along
68
with NPQ evidence suggest that low npq2 Fv/Fm(0) may not be due to a true
reduction in PSII efficiency.
Values of σPSII(0) are also generally consistent with standard
photophysiological measurements. Similar to σChla, σcell and σPSU, σPSII(0) is
similar between WT and npq1. This suggests that in spite of a reduction in the
number of excitation traps that could lead to increases in the apparent cross
section, WT and npq1 cross sections remain similar because of small
compensatory changes in pigmentation and photosystem balance. Conversely,
the σPSII(0) of npq2 is reduced by ~10% relative to WT. This reduction is
consistent with increases in σChla due to elevated xanthophyll concentrations and
decreases in σPSU due to increased proportion of non-photosynthetically active
(i.e. xanthophyll) traps.
The irradiance structure for fluorescence-based parameters provides
further insight into WT, npq1 and npq2 photophysiology (Figure III-7). Initial (Fo)
and maximal (Fm) fluorescence both increase as a function of irradiance. Both
Fo and Fm likely continue to increase to some saturating value at very high
irradiance values. Generally, increases in Fo are largely due to a progressive
decrease in the fraction of open reaction centers: as the background irradiance
increases, the probability of a given reaction center processing excitation energy
increases. By definition, at a fully saturating background irradiance intensity, the
probability that any reaction center is closed is 1.0.
The general pattern of Fm as a function of background irradiance is largely
mediated by two general processes: NPQ and multiple turnovers (MT) of PSII.

69
Previous work has demonstrated a significant increase in Fm when it is
measured with MT flashes compared to a single turnover (ST) flash system
(Schreiber et al., 1986; Schreiber et al., 1989; Kolber et al., 1998). Differences in
Fm between ST and MT measurements in turn lead to significant differences in
reported Fv/Fm(0), which has generated controversy regarding the true saturation
of the PSII (Falkowski et al., 1994; Schreiber and Krieger, 1996; Kolber et al.,
1998). Similar to previously described fast repetition rate fluorometers that have
no background irradiance (i.e. Fm(0)), the BIG-FRRf measurement of Fm is most
consistent with a ST flash (Kolber and Falkowski, 1992; Kolber et al., 1998).
However, as the background irradiance increases, the plastoquinone pool
becomes progressively reduced and the Fm value becomes more similar to a MT
measured Fm(0), despite always being measured with a ST-like flash protocol.
Superimposed on this increase in Fm due to progressive reduction of the
plastoquinone pool is the effect of NPQ. Although each measurement of Fo and
Fm as a function of background irradiance was performed on a dark-adapted
cellular suspension, NPQ may have had an effect on fluorescence because of
the duration of the background irradiance. NPQ is strongly dependent on the
duration of the background irradiance and can increase several fold over the
course of just a few minutes (Niyogi et al., 1997; Casper-Lindley and Bjorkman,
1998). Although here the background irradiance duration was only 500 ms, this
may be sufficient to initiate a reduction in Fm from dark to low irradiance values
(Figure III-7). At greater irradiances, the increase in Fm due to convergence on a
MT-like Fm measurement overwhelms the reduction in Fm due to NPQ.
70
Although the overall patterns are similar, there remain differences
between WT, npq1, and npq2 Fo- and Fm-E curves that are the direct and
indirect result of modifications in xanthophyll cycling. For example, while the
structure of the WT and npq1 Fo-E curves are very similar, the magnitude of the
npq1 is generally higher and only converges with WT at very high irradiances.
This pattern is consistent with an overall reduction in the number of functional
reaction centers for npq1 relative to WT that was postulated from photosynthetic
biomass and photophysiology measurements. Further, although WT and npq1
P-E curves are quite different in magnitude, their normalized structure is similar
including comparable saturating irradiance intensities (Ek). This similarity is also
present for WT and npq1 Fo-E curves suggesting that the processes regulating
the structure of P-E curves may be similar to those regulating Fo-E. (see below).
Unlike npq1, the npq2 Fo-E structure is different in both magnitude and structure
when compared to WT suggesting that different regulatory processes may be
acting. From P-E relationships, which are also significantly different between
npq2 and WT, as well as σChla, σPSII(0) and σPSU, it is likely that there is an over-
accumulation of non-photosynthetic pigments. This over-accumulation increases
the irradiance intensity required to reduced PSII reaction centers and thus leads
to a reduced saturation rate. The magnitude of Fo may be elevated due to an
increase in antennae-based fluorescence (see above).
Fm-E curves show similar grouping between WT, npq1 and npq2: WT and
npq1 show similar patterns as Fo-E curves, but different magnitudes, whereas
npq2 curves have a somewhat different structure. Decreases in Fm at very low,
71
non-zero irradiances, which may be indicative of NPQ, are most pronounced for
WT and reduced for both npq1 and npq2. Predicted reductions in NPQ for both
npq1 and npq2 relative to WT are consistent with previous estimates (Niyogi et
al., 1997).
The net result of the structure and magnitude of the Fo- and Fm-E curves
is Fv/Fm-E curves that are similar to previously reported curves using ST flash
techniques such as pump and probe modulated fluorescence (Falkowski et al.,
1986). The general structure of the Fv/Fm-E curves is an exponential decay with
the maximal Fv/Fm observed in the dark (Fv/Fm(0)).
All Fv/Fm-E curves are generally in agreement with other measures of
photophysiology. Similar to P-E and Fo curves, WT and npq1 Fv/Fm-E curves
have nearly identical structures. Like Fo curves, these similarities are rooted in
the same photophysiological processes affecting both P-E and Fv/Fm-E curves.
The magnitude of the npq1 Fv/Fm-E curve is reduced relative to WT due to
increases in the magnitude of the Fo-E curve, which in turn are the result of a
reduction in the fraction of functional reaction centers. Similarly, the npq2 Fv/Fm-
E curve has an altered structure compared to WT and npq1 that is again due to
its Fo-E curve. In particular, the decrease in the rate of npq2 Fv/Fm-E decline as
a function of irradiance intensity is consistent with P-E curves and the increase in
non-photosynthetically active pigments in the PSII antennae leading to a
reduction in σPSII(0).
Unlike Fo, Fm and Fv/Fm-E curves, σPSII-E curves have relatively little
structure for WT, npq1 and npq2; σPSII-E curves decrease slightly at moderate
72
irradiance intensities, perhaps due to minor induction of NPQ from the brief
duration background light or from state 2 to state 1 transitions (Bonaventura and
Myers, 1969). This background irradiance-independent nature of σPSII is
consistent with previous oxygen flash yield observations that have also
demonstrated a relatively constant σPSII (Myers and Graham, 1971). Thus,
although the xanthophyll cycle does affect the magnitude of σPSII-E curves, it
does not dramatically modify the structure or shape of the σPSII-E curves for C.
reinhardtii.
Relationship between fluorescence and oxygen
There are many similarities between the patterns of standard physiology
measurements such as σPSU and P-E and fluorescence-derived measurements
such as σPSII(0) and Fo-E. Because both of these methodologies probe similar
(though not the same) portions of the photosynthetic apparatus (i.e. PSII), there
is good reason to expect a strong relationship between oxygen and fluorescence
(Butler and Kitajima, 1975; Papageorgiou, 1975; Butler and Strasser, 1977;
Genty et al., 1989; Lazar, 1999). Nevertheless, NPQ, which in part is regulated
by the xanthophyll cycle, is strictly a fluorescence phenomenon. Thus, changes
to the xanthophyll cycle (and NPQ) could differentially affect fluorescence and
oxygen measurements.
Despite this potential for divergence, WT, npq1 and npq2 fluorescence-
derived photosynthetic rates are strongly (r2=0.96) related to measured oxygen
evolution rates when using a known Pbmax (Figure III-8). This relationship is
73
most robust at light levels above the compensation irradiance (~0.2 eq. on Figure
III-8). This deviation may be due to respiration complications or photosystem
excitation balance considerations (Chapter II). Regardless, the fluorescence
measurements from WT, npq1 and npq2 all have similarly strong relationships
with oxygen P-E, thus changes in the xanthophyll cycle do not appear to
significantly modify the relative fluorescence-oxygen relationship.
Although the structure of fluorescence-determined P-E curves are
consistent with measured P-E, absolute rates are not. For the three samples
measured here, there is no significant relationship between oxygen and
fluorescence maximum Pbmax (r2<0.1). This lack of correlation is due to
processes that are downstream of PSII, such as RuBisCO concentrations and
turnover, regulating maximum photosynthetic rates (Sukenik et al., 1987; Stitt
and Schulze, 1994). Similarly, the correlation between Fv/Fm(0) and φC,max is
marginal (r2=0.51), suggesting that processes other than PSII conversion
efficiency, such as non-photosynthetic pigment concentrations, are regulating
efficiency. Thus, while PSII-specific processes may be regulating the general
shape and structure of the P-E curve via modifications of cross section, they are
not regulating its magnitude or efficiency.
Conclusions
There are significant differences in the photosynthetic biomass and physiology
between WT and xanthophyll mutants of Chlamydomonas reinhardtii (npq1 and
npq2). Loss of violaxanthin de-epoxidase (npq1), which leads to a reduced NPQ,

74
does not significantly affect biomass and photosynthetic cross sections, likely
due to compensatory changes in pigment type and distribution between
photosystems. But, npq1 does have a decreased PSII/PSI and reduced α*,
Pbmax, max2Oφ and Fv/Fm(0) relative to WT probably due to damage to PSII. Loss
of zeaxanthin epoxidase (npq2) results in increased xanthophyll pigments and
decreased photosystem cross sections along with increased PSII/PSI and
reduced α* and max2Oφ . Unexpectedly, both Fv/Fm(0) and NPQ are also reduced,
but this may be the result of induction or increase of an antenna pigment-based
fluorescence. Taken together, biomass and physiology measurements for npq1
and npq2 in relation to WT support the notion of the xanthophyll cycle and NPQ
acting as an antenna quencher of excitation energy, thus affecting the functional
photosynthetic cross section. Modification of the xanthophyll cycle (npq1 and
npq2) does not affect the robust structural (relative) relationships between
fluorescence and oxygen derived photosynthetic rates, but does influence the
correlation among absolute rates and efficiency.

75
Table III-1: Photophysiological parameters of WT, npq1, npq2 C. reinhardtii (mean ± SE, * P<0.05, ** P<0.01 different from WT)
Property Units WT npq1 npq2
Chlorophyll a pg Chla cell-1 1.15±0.12 0.93±0.06 1.02±0.09 σcell µm2 cell-1 8.10±0.93 7.03±0.33 8.69±0.67 σChla m2 g Chl a-1 7.0±0.1 7.6±0.2 8.6±0.1**
σPSII(0) a.u. 1.00±0.05 1.08±0.03 0.88±0.03* σPSU m2 (µmol quanta)-1 1.11±0.11 0.94±0.24 0.77±0.07*
Chlorophyll b/a g g-1 0.305±0.005 0.361±0.011** 0.319±0.007 Chla/P700 mol Chl a mol PSI-1 663±23 526±27** 996±77**
E&A mol Chl a mol O2-1 2537±99 3814±269** 2555±138
PSI / cell amol cell-1 1.94±0.27 1.98±0.23 1.15±0.19* PSII / cell amol cell-1 2.03±0.29 1.09±0.15* 1.79±0.25 PSII / PSI PSII PSI-1 1.05±0.08 0.55±0.07** 1.56±0.20*
α* mol O2 g Chl a-1 hr-1
(µmol quanta m-2 sec-1)-1 0.00176
±0.00011 0.00100
±0.00037* 0.00121
±0.00004**
Pbmax mol O2
g Chla-1 hr-1 0.301±0.005 0.122±0.045** 0.310±0.016
Ek µmol quanta m-2 sec-1 194±12 174±50 286±16** 1/τPSU sec-1 213±12 138±35* 219±23
max2Oφ mol O2 mol quanta-1 0.052±0.003 0.030±0.011* 0.035±0.001**
Fv/Fm(0) unitless 0.68±0.01 0.62±0.01* 0.55±0.01* growth rate day-1 1.04 0.46 0.81

76

77
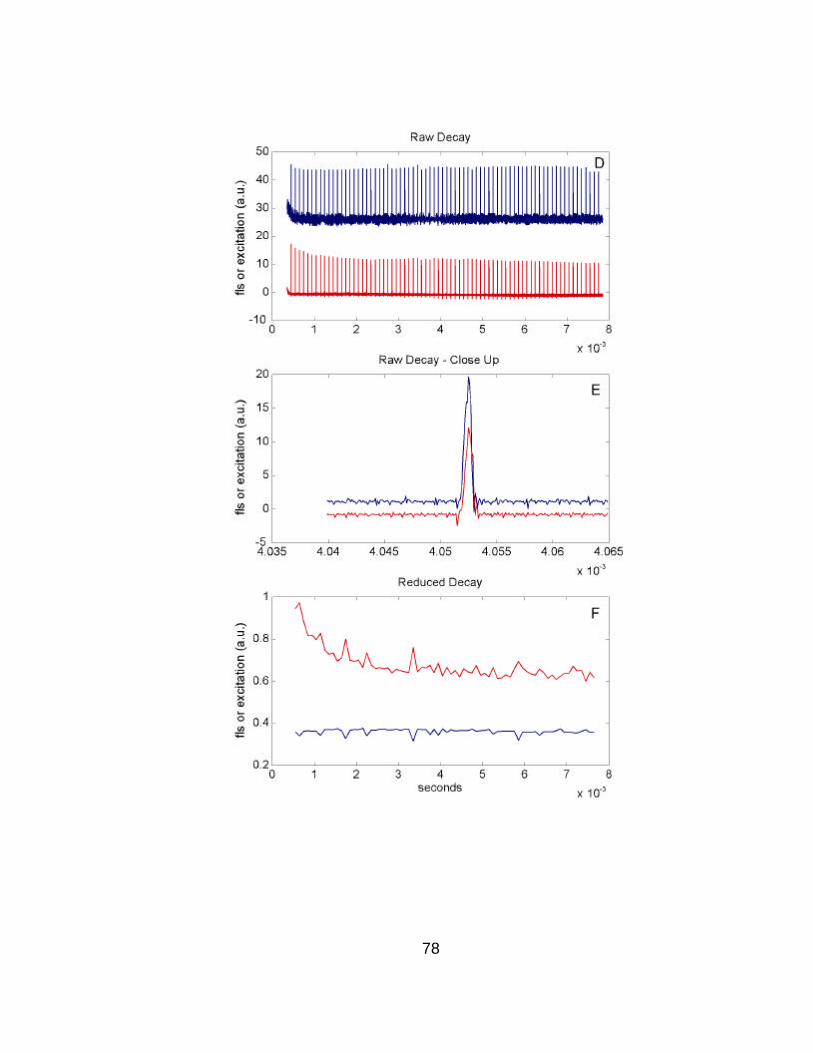
78
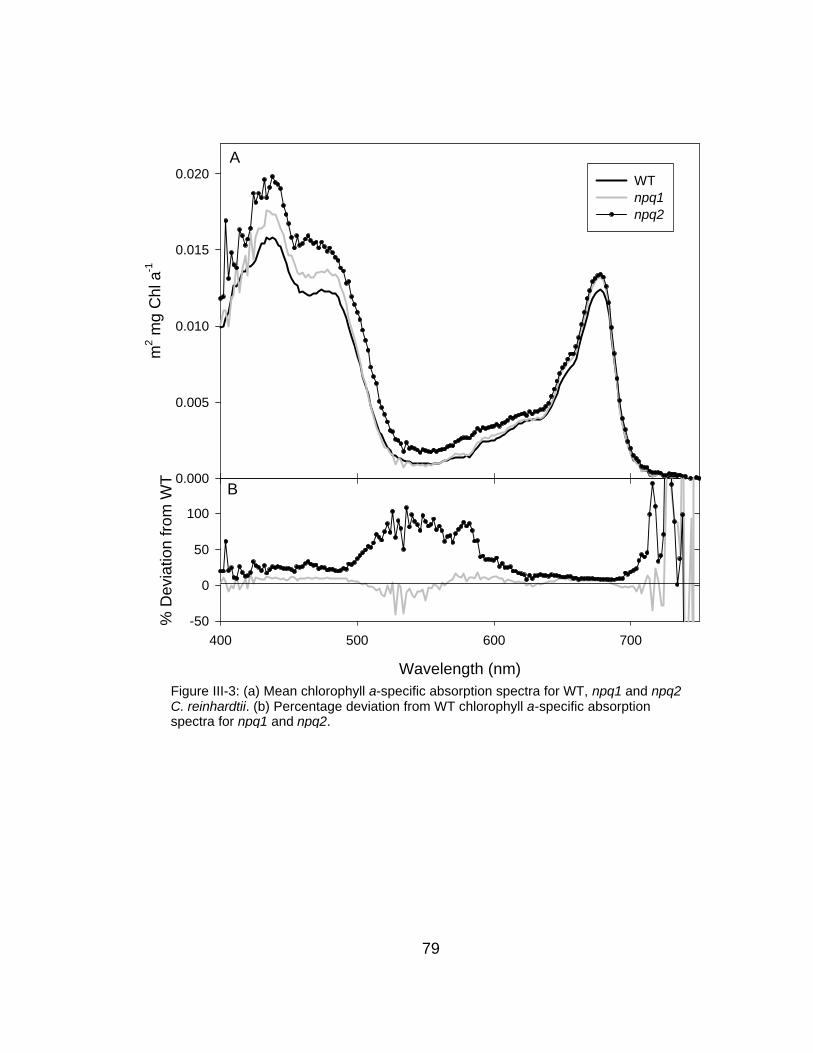
79
m2 m
g C
hl a
-1
0.000
0.005
0.010
0.015
0.020 WTnpq1npq2
Wavelength (nm)
400 500 600 700
% D
evia
tion
from
WT
-50
0
50
100
A
B
Figure III-3: (a) Mean chlorophyll a-specific absorption spectra for WT, npq1 and npq2C. reinhardtii. (b) Percentage deviation from WT chlorophyll a-specific absorptionspectra for npq1 and npq2.

80
Photosynthesis-Irradiance Response Curves
PAR (µmol quanta m-2 sec-1)
0 250 500 750 1000
mol
O2
gChl
a h
r-1
-0.1
0.0
0.1
0.2
0.3
WTnpq1npq2
Figure III-4: Photosynthesis irradiance response curves for WT, npq1 and npq2 C. reinhardtii.Curves represent the mean P-E model fit to data.
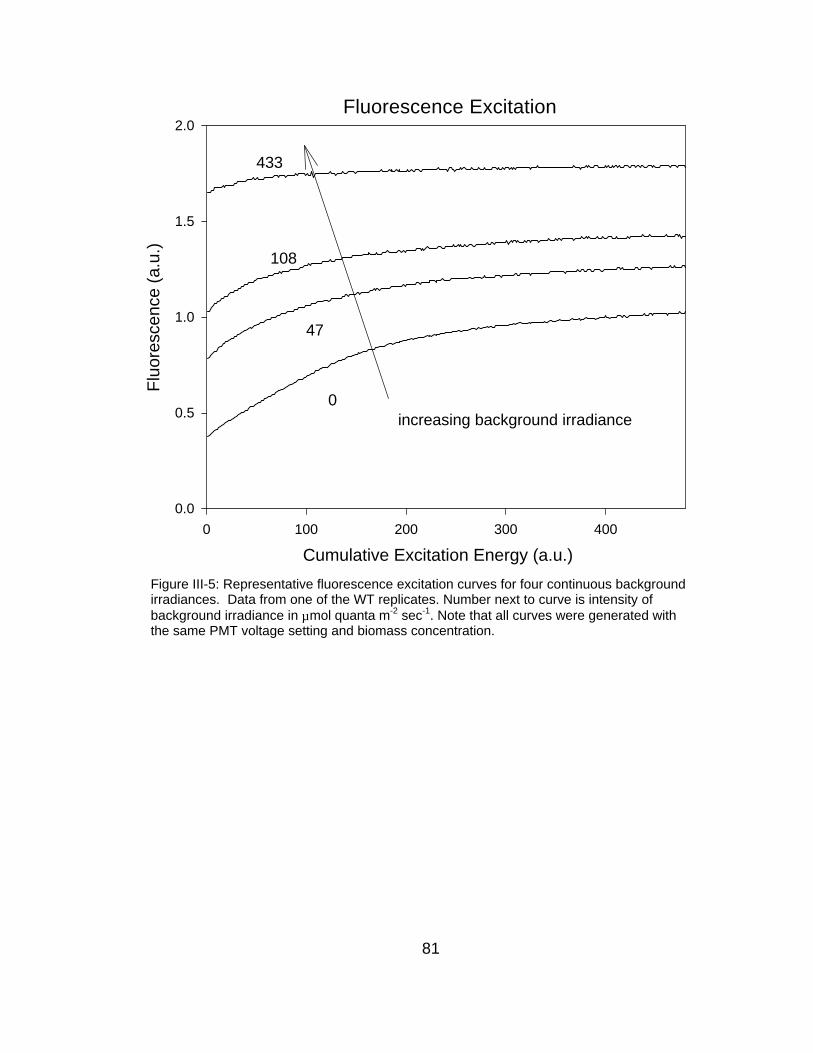
81
Fluorescence Excitation
Cumulative Excitation Energy (a.u.)
0 100 200 300 400
Flu
ores
cenc
e (a
.u.)
0.0
0.5
1.0
1.5
2.0
increasing background irradiance0
47
108
433
Figure III-5: Representative fluorescence excitation curves for four continuous backgroundirradiances. Data from one of the WT replicates. Number next to curve is intensity ofbackground irradiance in µmol quanta m-2 sec-1. Note that all curves were generated withthe same PMT voltage setting and biomass concentration.

82
Fluorescence Decay
Seconds
0.000 0.002 0.004 0.006 0.008
Flu
ores
cenc
e (a
.u.)
0.8
1.0
1.2
1.4
1.6
1.8
0
47
108
433
increasing background irradiance
Figure III-6: Fluorescence decay curves (normalized to fluorescence at 7 msec) for fourcontinuous background irradiances. Numbers as figure III-5.

83
Flu
ores
cenc
e (a
.u.)
0.0
0.2
0.4
0.6
0.8
1.0Fo (WT)Fo (npq1)Fo (npq2)
PAR (µmol quanta m-2 sec-1)
0 100 200 300 400 500
Flu
ores
cenc
e (a
.u.)
0.0
0.2
0.4
0.6
0.8
1.0
Fm (WT)Fm (npq1)Fm (npq2)
0 25 50 75 1000.0
0.2
0.4
0.6
0.8
0 25 50 75 1000.4
0.6
0.8
1.0
A
B
Figure III-7: Parameters (a) Fo, (b) Fm, (c) Fv/Fm and (d) σPSII derived from fluorescenceexcitation and decay curves as a function of irradiance for WT, npq1 and npq2C. reinhardtii. Fo and Fm curves have been normalized to Fm at 433 µmol quanta m-2 sec-1
for each respective population. Inset panels are close-up views of low irradiance values.
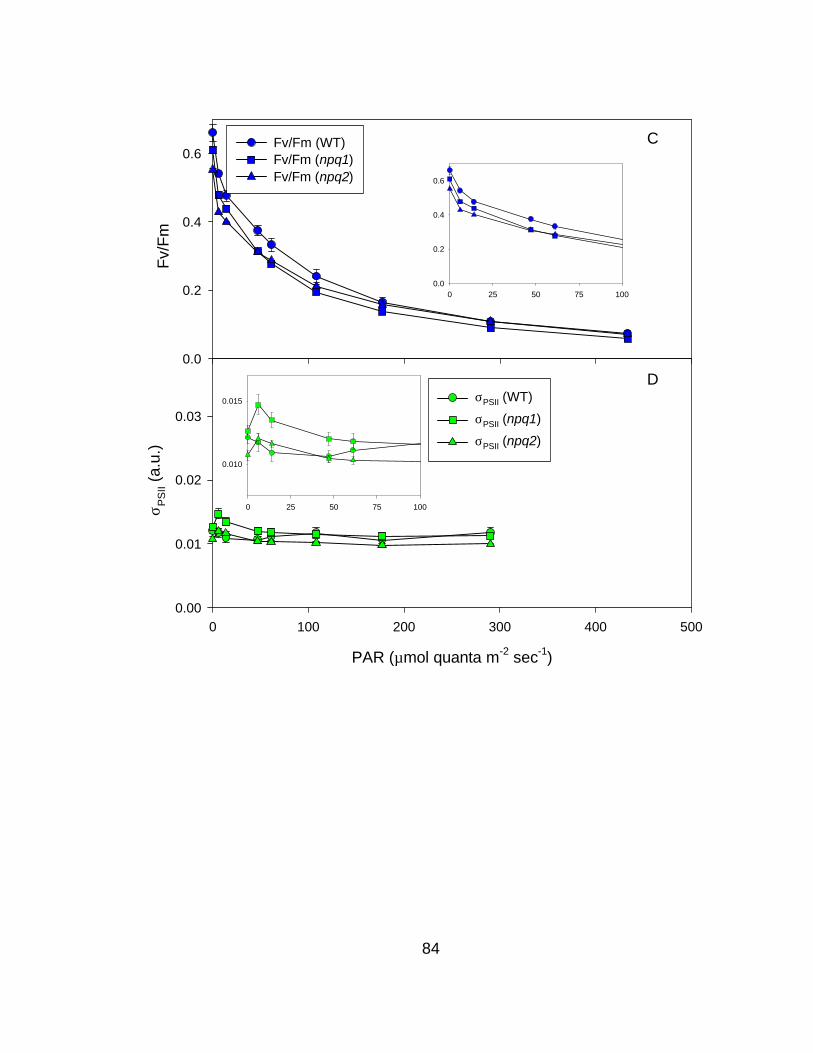
84
PAR (µmol quanta m-2 sec-1)
0 100 200 300 400 500
σ PS
II (a
.u.)
0.00
0.01
0.02
0.03
σPSII (WT)
σPSII (npq1)
σPSII (npq2)
0 25 50 75 100
0.010
0.015
D
Fv/
Fm
0.0
0.2
0.4
0.6Fv/Fm (WT)Fv/Fm (npq1)Fv/Fm (npq2)
C
0 25 50 75 1000.0
0.2
0.4
0.6

85
relative Fv/Fm-determined oxygen flux
0.0 0.2 0.4 0.6 0.8 1.0
rela
tive
mea
sure
d O
2 flu
x
0.0
0.2
0.4
0.6
0.8
1.0
WTnpq1npq2
Figure III-8: Relationship between measured oxygen evolution andfluorescence-derived oxygen flux. Fluorescence-derived measurementswere calculated using ((Fo-Fo(0))/Fo(0))-E curves that were normalized to
measured oxygen evolution Pbmaxs. The slope of the linear regressionis not significantly different from 1.0 with an r2=0.96.

86
Chapter IV
Mechanisms and consequences of photoacclimation to photosynthetic efficiency in Skeletonema costatum

87
Open ocean environments are complex light environments for
phytoplankton photosynthesis with irradiance intensities varying several
orders of magnitude. In this context, phytoplankton have multiple
mechanisms to acclimate, which in turn can affect both photosynthetic
rates and efficiency. Here using Skeletonema costatum as a model
organism, I expand on previous photoacclimation studies (1) to determine
the response of photosynthetic quantum yield-irradiance (φφC-E) curves to
photoacclimation and (2) to quantify the role that photosystem II (PSII)
plays in structuring φφC-E curves. High growth irradiance induces
significant increases in chlorophyll a-specific absorption, light saturated
photosynthesis, photosynthesis saturating irradiance and significant
decreases in cellular chlorophyll a, photosynthetic unit cross sectional
area, PSII cross sectional area, light utilization, maximum quantum yield
and Emerson and Arnold numbers. The net result of these changes in
photosynthetic biomass and photophysiology is high light φφC-E curves that
are reduced in magnitude and have increased irradiance at which φφC
decreases from φφC,max. Changes in relative P-E and φφC-E curves due to
photoacclimation are well-described by PSII specific measurements
including Fv/Fm-E and σσPSII-E. However, in the context of photoacclimation,
Pbmax and φφC,max are not well-described by fluorescence measures because
they are regulated by non-PSII processes such as non-photosynthetic
pigment absorption and processes downstream of PSII.
INTRODUCTION
88
In the open ocean, light is quickly attenuated with depth due to strong absorption
by water and biogenous materials such that only the upper skin of the open
ocean is light replete with respect to photosynthesis (Jerlov, 1976; Morel, 1988;
Kirk, 1994). Vertical mixing of phytoplankton within the euphotic zone from light-
saturated to light-limited regions can impose additional limitations on
photosynthesis (Sverdup, 1953; Marra, 1980; Johnson and Howd, 2000). Far
from statically responding to different light levels, phytoplankton have multiple
mechanisms of acclimation, which in turn can affect photosynthetic rates and
efficiencies.
There is a significant body of research devoted to understanding the role
that irradiance plays in regulating photosynthetic responses. For steady-state
light, photoacclimation is rooted as the effect of light intensity on gene expression
and protein production regulation via redox poise (Levings III and Siedow, 1995;
Durnford and Falkowski, 1997). This regulation occurs for both chloroplast and
nuclear encoded genes through sensing of the redox state of the plastoquinone
pool in the chloroplast or via production of reducing equivalents from PSI that
regulate thioredoxin (Danon and Mayfield, 1994; Escoubas et al., 1995; Durnford
and Falkowski, 1997; Dai et al., 2000). Although these mechanisms are not fully
characterized, they do point to irradiance-mediated gene-regulation and
ultimately protein production as the partial mechanistic basis for steady-state
photoacclimation.
Following this redox poise, light-mediated genetic basis of regulation,
previous studies have demonstrated that there are significant differences in
89
specific photosynthetic biomass properties in relation to photoacclimation. For
example, compared to low light grown cells, high light grown S. costatum have
reduced cellular chlorophyll a, cellular PSII and PSI concentrations and
photosynthetic accessory pigments (chlorophyll c and fucoxanthin) (Falkowski
and Owens, 1980; Falkowski et al., 1981; Perry et al., 1981; Gallagher et al.,
1984; Caron et al., 1988). Other proteins that are not directly involved in the light
harvesting process such as RuBisCO and D1 have also been shown in
phytoplankton to be influenced by light intensity (Laroche et al., 1991; Sciandra
et al., 1997; Shapira et al., 1997). It is these light harvesting and excitation
processing related proteins that are affected by photoacclimation that in part lead
to the observed changes in the photosynthetic rates and efficiency.
For example, photoacclimation to high light in S. costatum can increase
photosynthetic capacity (Pbmax) and decrease PSII functional cross sectional
area (σPSII(0)) and Emerson & Arnold numbers (E&A) (Falkowski et al., 1981;
Cosper, 1982; Gallagher et al., 1984; Kolber et al., 1988). High growth irradiance
has also been shown to dramatically reduce light utilization and quantum
efficiency relative to low light grown populations while not significantly effecting
the photochemical conversion efficiency of PSII (Fv/Fm(0)) (Kolber et al., 1988;
Herzig and Dubinsky, 1992; Lindley et al., 1995; Fisher et al., 1996; Marra et al.,
2000). Photosynthetic unit turnover rates can also be influenced by growth
irradiance (Falkowski et al., 1981; Dubinsky et al., 1986; Behrenfeld et al., 1998).
This body of evidence suggests that photoacclimation is fairly consistent between
90
species and embodies a series of standard biomass and photophysiological
responses.
Taken together, previous research has demonstrated a photoacclimation
response that affects photosynthetic efficiency, rates and biomass that is based
at the gene-regulation level. Although the effect of photoacclimation on biomass
and process components has been characterized for many phytoplankton
(Falkowski et al., 1981), there remain some gaps in the mechanistic linkage
between analytic components and processes. Specifically, there is no analytic
relationship for the role of PSII in regulating photosynthetic rates (P-E) and
efficiency (φC-E) as a function of background irradiance in the context of
photoacclimation.
To aid in closing these gaps, the goals of this study are (1) to characterize
the quantum efficiency-irradiance (φC-E) curve in the context of photoacclimation
and (2) to quantify the role of irradiance-dependent PSII-specific processes such
as σPSII-E and Fv/Fm-E in determining φC-E curves. For this investigation I use
standard photophysiological measures such as flash yields, radiocarbon uptake,
spectral absorption and pigment concentrations in combination with a newly
developed active fluorescence induction technique that measures PSII
photosynthetic parameters as a function of background irradiance (Chapter III).
Results from this study show (1) a decrease in the magnitude of φC-E
(φC,max) with increasing growth irradiance and (2) a lateral (irradiance) shift of the
φC-E curve that is consistent with growth irradiance and photosynthesis
saturating irradiances (Ek). This shift is also present for Fv/Fm-E curves and is
91
supported by altered σPSII(0), σPSU and E&A These data show that PSII-specific
measures describe well the relative φC-E and P-E structures, but that the
magnitudes of these curves are not well established by PSII-specific
measurements; in the context of photoacclimation, φC,max and Pbmax are in part
regulated by non-photosynthetic pigments and processes downstream of PSII,
respectively.
METHODS
Culture conditions
Skeletonema costatum (SKEL) cultures were grown in semi-continuous batch
culture at 19oC in sterile (0.2 µm filtered) air bubbled f/2-amended media made
with filtered (GF/F – Whatman) Sargasso Sea water (Guillard and Ryther 1962)
and were periodically diluted to maintain exponential growth. Continuous light (
211±8, 111±8, 20±0 and 8±1 µmol quanta m-2 sec-1), which was supplied by
fluorescent bulbs, was attenuated by neutral density and stage screening
(Cinemills) to achieve the desired intensity and spectral quality.
Absorption, Pigments, Growth Rates, Cell Density
Spectral absorption measurements were made at 2 nm resolution with a 1 sec
integration time on samples in solution using an HP 8452 diode array
spectrophotometer with Labsphere (RSA-HP-84) integrating sphere. Absorption
at 750 nm was assumed to be non-cellular and was subtracted from the
absorption curve. Absorption coefficients were calculated following Kirk (1994).
92
Chlorophyll a and b and carotenoids were determined on 90% acetone extracts
following Parsons et al. (1984), except without MgCO3 addition, using the
trichromatic equations of Jeffrey and Humphrey (1975). Intrinsic growth rates
were calculated from chlorophyll a concentrations. Cell concentrations were
estimated using a hemacytometer.
Photosystem Quantification
Emerson-Arnold numbers (Chl a/O2) were measured using a Hansatech oxygen
electrode and a Stroboslave (Type1539A) tunable frequency, saturating strobe
light following Dubinsky et al. (1986). PSII/Chl a was calculated as four times the
initial slope of oxygen evolution rate versus flash frequency, normalized to
chlorophyll concentration.
Photosynthesis vs Irradiance (P-E), Turnover Rates
Carbon-based photosynthesis-irradiance measurements were made using
custom-built temperature-regulated photosynthetrons. Irradiance, which was
supplied by a 250 W ENH projector bulb (Gray Supply), was spectrally modified
and attenuated using a combination of hot and cold mirrors (Optical Coating
Laboratory) and stage screening (Cinemills). Irradiance intensity (PAR) was
measured using a Biospherical Instruments (QSL-100) 4π scalar irradiance
meter. Incubations of 1 ml samples inoculated with ~7.4 kBq H14CO3 were
terminated after 10 min using 100 µl 37% formaldehyde and 200 µl HCl and
allowed to degas overnight. Carbon uptake rates were quantified using standard
93
techniques (Barber et al., 1996). Photosynthetic parameters of the Platt et al.
(1980) model (α*, Ps, β) were optimized to fit data using a custom written, non-
linear least-squares Levenberg-Marquardt technique (Frenette et al., 1993).
Optimization of model parameters to P-E data was performed using PAR as the
independent variable. Secondary parameters (Pbmax and Ek) were calculated
following Zimmerman et al. (1987). Maximum quantum yield (φC,max) was
calculated from model predicted α* as the mol C mol quanta-1 absorbed using
absorption coefficients that were spectrally weighted to incident measurement
irradiance (Chapter II). Maximum quantum yield (φC,max') calculated using the
[ ]EC −φmax method (Chapter II) yielded similar patterns, but ~25% reduced
values.
Photosynthetic unit turnover rate constant (sec-1), 1/τPSU, was calculated
using two methods. In the first (standard) method 1/τPSU was calculated as:
n
P b
PSU
max0269.01 =τ (IV-1a)
where Pbmax is light-saturated photosynthesis (mg C mg Chl a-1 hr-1), n is the
concentration of PSII (mol O2 mol Chl a-1) and 0.0269 converts the units from
hours to seconds and grams to moles and carbon to oxygen using a
photosynthetic quotient (PQ) of 1.3 (Laws, 1991). Because a constant PQ is
assumed, estimates of 1/τPSU should be interpreted with caution. In the second
94
(alternate) method relative 1/τPSU was calculated following Dubinsky et al. (1986)
as:
[ ]kPSIIPSU
E)0('1 στ = (IV-1b)
where σPSII(0) is the relative PSII functional cross sectional area and Ek is the
photosynthesis saturating irradiance. These estimates of relative 1/τPSU are
referred to as 1/τPSU'.
Modulated Fluorescence
Modulated fluorescence measurements were performed with a previously-
described custom-built fast repetition rate type fluorometer with computer-
controlled background irradiance gradient (BIG-FRRf) (Chapter III) (Kolber et al.,
1998). The background light is produced by super-bright blue LEDs and has a
maximum output wavelength of ~550 nm (Chapter III). For this study, the
excitation protocol was run for 350 µsec at high intensity with a 100% duty cycle
followed by the decay protocol that was run for 7.5 msec at low intensity with a
1% duty cycle. The pre-illumination background irradiance duration was 500
msec. Samples were dark adapted for >15 min for each background irradiance
setting. Data were analyzed using custom-written software based in MATLAB
5.3v11 following Kolber et al. (1998) to determine Fo, Fm, σPSII and p where Fo is
initial fluorescence, Fm is the maximal fluorescence, σPSII is the functional cross-
sectional area, p is a connectivity parameter.

95
For each background irradiance there is generated a suite of
fluorescence-derived parameters. These parameters are referred to with the
subscript indicating the background irradiance intensity. For example, Fv/Fm(0) is
photosystem II photochemical conversion efficiency in the dark and σPSII(521) is
the PSII functional cross sectional area at 521 µmol quanta m-2 sec-1.
RESULTS / DISCUSSION
Photosynthetic Biomass
Cellular chlorophyll a concentrations and chlorophyll a-specific absorption cross
sections (σChl a) were significantly affected by growth irradiance (Table IV-1).
These changes in pigmentation and absorption properties in response to different
growth irradiances likely involve the balance between two processes:
photosynthetic and non-photosynthetic protective pigment (NPP) optimization
with the balance shifting depending on whether there is limiting or excess light,
respectively. Increases in σChla with growth irradiance support the relative
proportion of NPP increasing with growth irradiance and suggest σChla being
dominated by NPP. Conversely, σcell remains constant with growth irradiance,
suggesting that there are compensatory changes in photosynthetic active
accessory pigments. Curiously, neither chlorophyll c/a nor carotenoid/chlorophyll
a mass ratios have significantly different values between growth irradiances
(Gallagher et al., 1984). However, the increase in the mean chlorophyll c/a that
is not statistically significant is consistent with previously measured increases in
chlorophyll c/a with decreased growth irradiance (Kolber et al., 1988). Similarly,
96
although relative measured carotenoid concentrations remain constant for
different growth irradiances, this stability may be influenced by imprecise
spectrophotometric carotenoid measurement; spectrophotometer estimates of
carotenoids can be significantly affected by other accessory pigments such as
fucoxanthin (Jeffrey et al., 1997). Although there are some inconsistencies,
taken together these data support a compensatory increase in NPP and
decrease in photosynthetically active pigments with increasing growth irradiance
that leads to a relatively constant cellular absorption cross section.
Commensurate with changes in aggregate biomass properties were
changes in photosystem biomass properties. Both the Emerson and Arnold
number (E&A) and photosynthetic unit cross sectional area (σPSU) increased
significantly with decreasing irradiance (Table IV-1) and are consistent with
previous observations of increased photosynthetic cross sections for decreased
light (Falkowski et al., 1981; Dubinsky and Stambler, 1992). Increases in the
photosynthetic cross section with decreased irradiance are also supported by
elevated σPSII(0) (see below).
Photophysiology
Photoacclimation, partially through changes in photosynthetic biomass
properties, dramatically affected the structure and magnitude of photosynthesis-
irradiance (P-E) curves as well as associated photophysiological parameters
(Table 1, Figure IV-1). Light saturated photosynthesis (Pbmax) and the maximum
light utilization coefficient (α*) generally followed opposite patterns with Pbmax
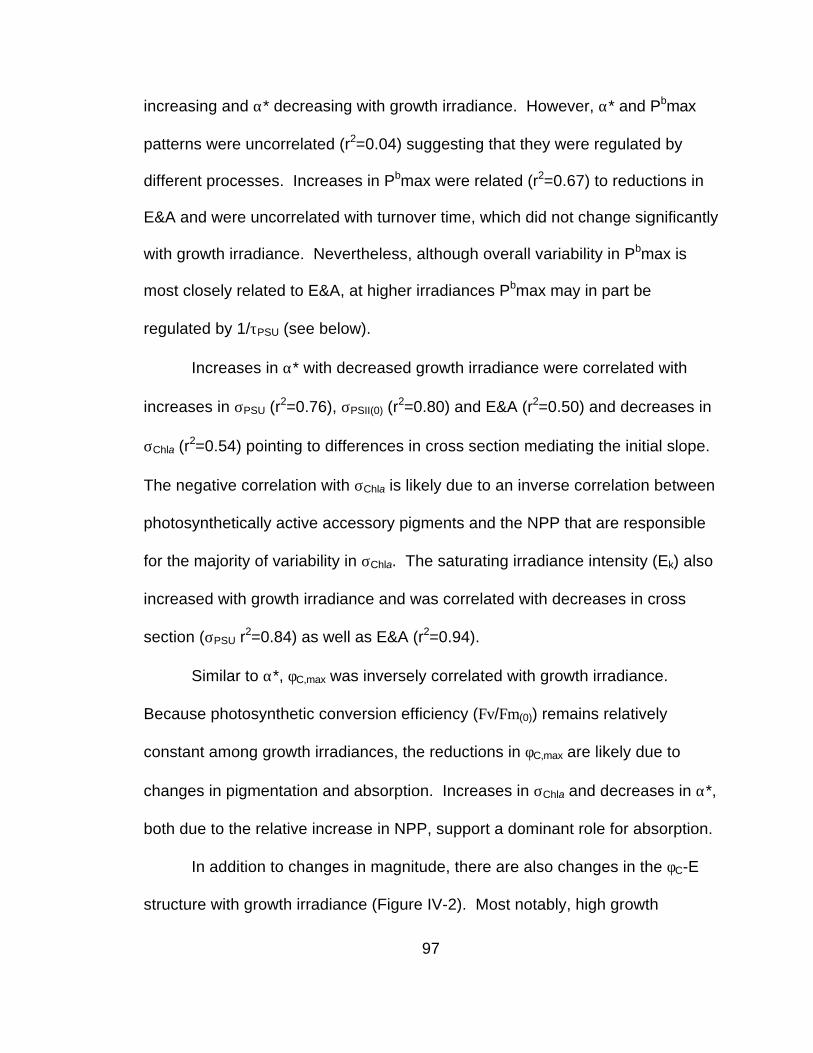
97
increasing and α* decreasing with growth irradiance. However, α* and Pbmax
patterns were uncorrelated (r2=0.04) suggesting that they were regulated by
different processes. Increases in Pbmax were related (r2=0.67) to reductions in
E&A and were uncorrelated with turnover time, which did not change significantly
with growth irradiance. Nevertheless, although overall variability in Pbmax is
most closely related to E&A, at higher irradiances Pbmax may in part be
regulated by 1/τPSU (see below).
Increases in α* with decreased growth irradiance were correlated with
increases in σPSU (r2=0.76), σPSII(0) (r2=0.80) and E&A (r2=0.50) and decreases in
σChla (r2=0.54) pointing to differences in cross section mediating the initial slope.
The negative correlation with σChla is likely due to an inverse correlation between
photosynthetically active accessory pigments and the NPP that are responsible
for the majority of variability in σChla. The saturating irradiance intensity (Ek) also
increased with growth irradiance and was correlated with decreases in cross
section (σPSU r2=0.84) as well as E&A (r2=0.94).
Similar to α*, φC,max was inversely correlated with growth irradiance.
Because photosynthetic conversion efficiency (Fv/Fm(0)) remains relatively
constant among growth irradiances, the reductions in φC,max are likely due to
changes in pigmentation and absorption. Increases in σChla and decreases in α*,
both due to the relative increase in NPP, support a dominant role for absorption.
In addition to changes in magnitude, there are also changes in the φC-E
structure with growth irradiance (Figure IV-2). Most notably, high growth
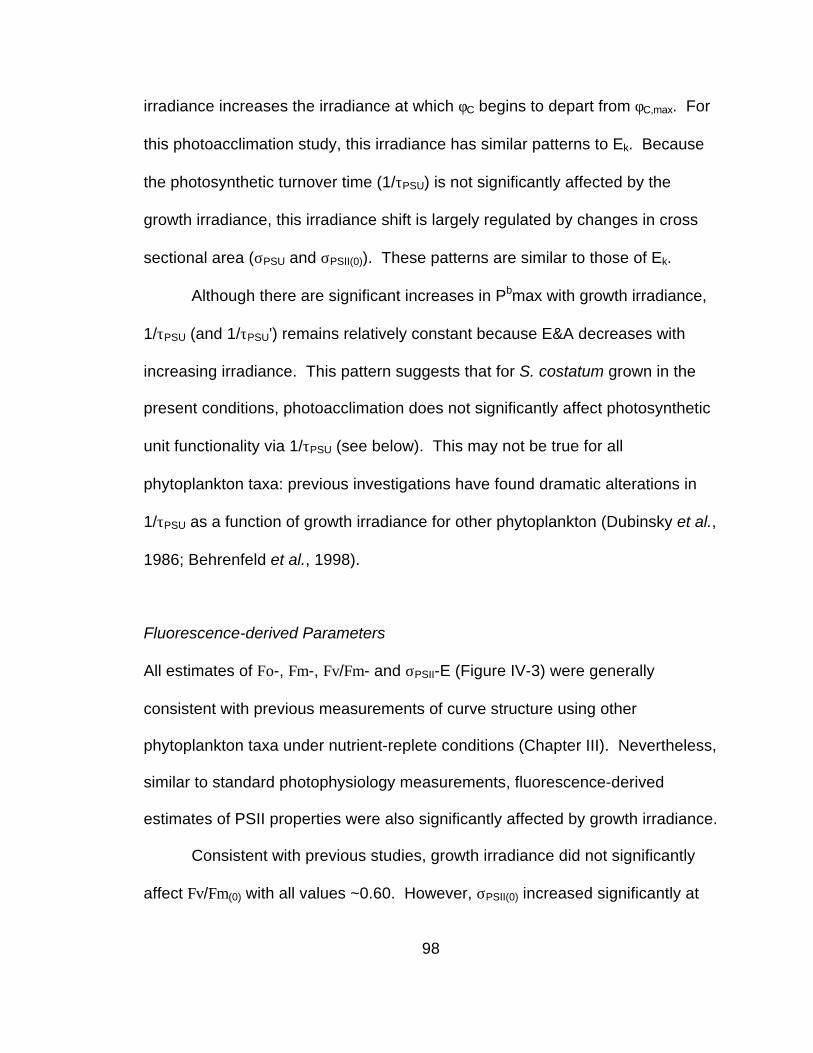
98
irradiance increases the irradiance at which φC begins to depart from φC,max. For
this photoacclimation study, this irradiance has similar patterns to Ek. Because
the photosynthetic turnover time (1/τPSU) is not significantly affected by the
growth irradiance, this irradiance shift is largely regulated by changes in cross
sectional area (σPSU and σPSII(0)). These patterns are similar to those of Ek.
Although there are significant increases in Pbmax with growth irradiance,
1/τPSU (and 1/τPSU') remains relatively constant because E&A decreases with
increasing irradiance. This pattern suggests that for S. costatum grown in the
present conditions, photoacclimation does not significantly affect photosynthetic
unit functionality via 1/τPSU (see below). This may not be true for all
phytoplankton taxa: previous investigations have found dramatic alterations in
1/τPSU as a function of growth irradiance for other phytoplankton (Dubinsky et al.,
1986; Behrenfeld et al., 1998).
Fluorescence-derived Parameters
All estimates of Fo-, Fm-, Fv/Fm- and σPSII-E (Figure IV-3) were generally
consistent with previous measurements of curve structure using other
phytoplankton taxa under nutrient-replete conditions (Chapter III). Nevertheless,
similar to standard photophysiology measurements, fluorescence-derived
estimates of PSII properties were also significantly affected by growth irradiance.
Consistent with previous studies, growth irradiance did not significantly
affect Fv/Fm(0) with all values ~0.60. However, σPSII(0) increased significantly at
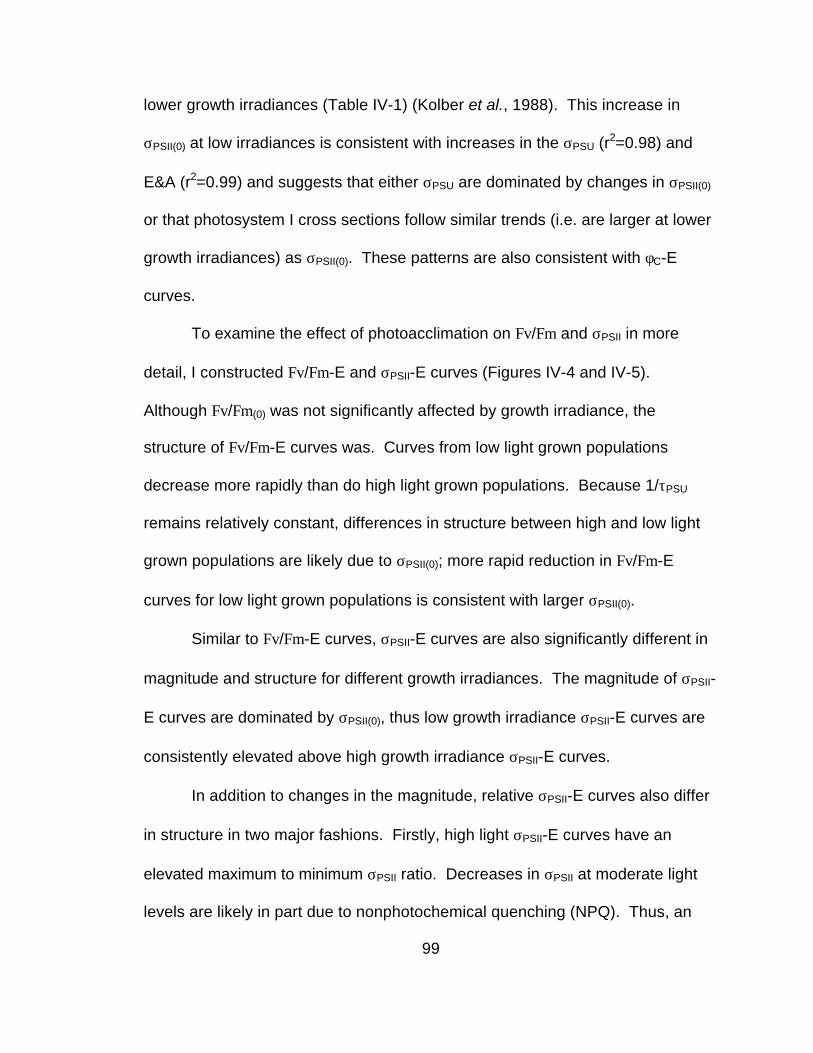
99
lower growth irradiances (Table IV-1) (Kolber et al., 1988). This increase in
σPSII(0) at low irradiances is consistent with increases in the σPSU (r2=0.98) and
E&A (r2=0.99) and suggests that either σPSU are dominated by changes in σPSII(0)
or that photosystem I cross sections follow similar trends (i.e. are larger at lower
growth irradiances) as σPSII(0). These patterns are also consistent with φC-E
curves.
To examine the effect of photoacclimation on Fv/Fm and σPSII in more
detail, I constructed Fv/Fm-E and σPSII-E curves (Figures IV-4 and IV-5).
Although Fv/Fm(0) was not significantly affected by growth irradiance, the
structure of Fv/Fm-E curves was. Curves from low light grown populations
decrease more rapidly than do high light grown populations. Because 1/τPSU
remains relatively constant, differences in structure between high and low light
grown populations are likely due to σPSII(0); more rapid reduction in Fv/Fm-E
curves for low light grown populations is consistent with larger σPSII(0).
Similar to Fv/Fm-E curves, σPSII-E curves are also significantly different in
magnitude and structure for different growth irradiances. The magnitude of σPSII-
E curves are dominated by σPSII(0), thus low growth irradiance σPSII-E curves are
consistently elevated above high growth irradiance σPSII-E curves.
In addition to changes in the magnitude, relative σPSII-E curves also differ
in structure in two major fashions. Firstly, high light σPSII-E curves have an
elevated maximum to minimum σPSII ratio. Decreases in σPSII at moderate light
levels are likely in part due to nonphotochemical quenching (NPQ). Thus, an

100
increase in the maximum to minimum σPSII ratio suggests that high light grown
populations have elevated NPQ related to low light grown populations. This is
consistent with increases in relative NPP concentrations suggested by increases
in σChla at high light and with previous studies suggesting an increased NPQ
potential for high light plants (Demmig-Adams and Adams, 1992; Casper-Lindley
and Bjorkman, 1998).
The second way photoacclimation influences σPSII-E structure is that high
light σPSII-E curves have a minor local peak at very low background light that is
not present for low light σPSII-E curves (Figure IV-5 bottom inset). Because of the
limited number of samples at low background light, using the present data it is
not possible to tell if the localized peak is present for all growth irradiances and
simply shifted laterally to lower irradiances or if the peak is simply not present for
low growth irradiance σPSII-E. Regardless, the very high light (211 µmol quanta
m-2 sec-1) localized peak is approximately 10% above measured σPSII(0). One
potential mechanism for this minor peak is that the increase is approximately the
same order as state transition effects (Bonaventura and Myers, 1969; Falkowski
and Raven, 1997). Populations at high growth intensities are likely in state 1 and
may require a low (non-zero) background light, potentially as a source of ATP, to
induce dephosphorylation of the pigment bed to initiate a change to state 2. This
process could lead to an effective increase in σPSII. This increase would not be
present for low growth irradiances because they are likely already in state 2. The
decrease in σPSII in all populations at moderate background light levels are due to
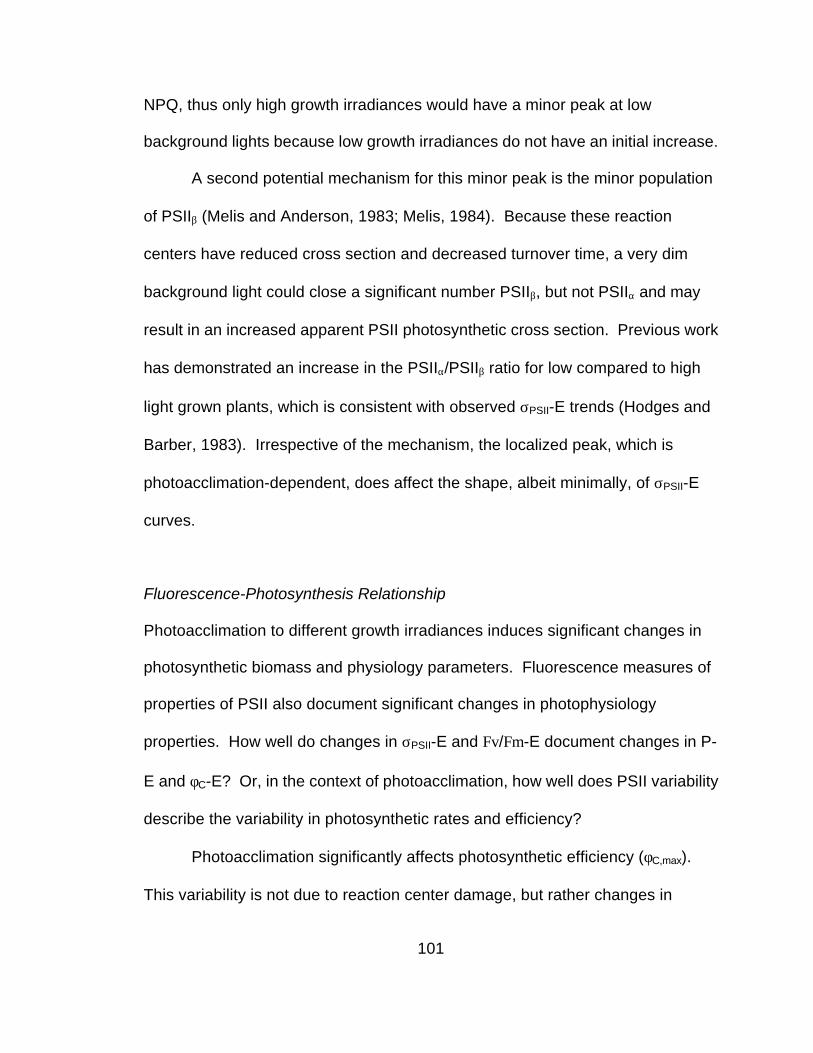
101
NPQ, thus only high growth irradiances would have a minor peak at low
background lights because low growth irradiances do not have an initial increase.
A second potential mechanism for this minor peak is the minor population
of PSIIβ (Melis and Anderson, 1983; Melis, 1984). Because these reaction
centers have reduced cross section and decreased turnover time, a very dim
background light could close a significant number PSIIβ, but not PSIIα and may
result in an increased apparent PSII photosynthetic cross section. Previous work
has demonstrated an increase in the PSIIα/PSIIβ ratio for low compared to high
light grown plants, which is consistent with observed σPSII-E trends (Hodges and
Barber, 1983). Irrespective of the mechanism, the localized peak, which is
photoacclimation-dependent, does affect the shape, albeit minimally, of σPSII-E
curves.
Fluorescence-Photosynthesis Relationship
Photoacclimation to different growth irradiances induces significant changes in
photosynthetic biomass and physiology parameters. Fluorescence measures of
properties of PSII also document significant changes in photophysiology
properties. How well do changes in σPSII-E and Fv/Fm-E document changes in P-
E and φC-E? Or, in the context of photoacclimation, how well does PSII variability
describe the variability in photosynthetic rates and efficiency?
Photoacclimation significantly affects photosynthetic efficiency (φC,max).
This variability is not due to reaction center damage, but rather changes in
102
absorption. Because Fv/Fm is absorption independent, Fv/Fm(0) remains
relatively constant despite significant decreases in φC,max with increasing growth
light (Figure IV-4). Nevertheless, Fv/Fm-E and φC-E have similar curve
structures, such that paired comparisons of Fv/Fm and φC over a background light
gradient are significant (r2=0.66) (Figure IV-6). However, this relationship is
driven almost exclusively by changes in the relative structure of Fv/Fm-E and φC-
E curves that are highly correlated (r2=0.93). Thus, factors that regulate the
shape and structure of efficiency curves (Fv/Fm-E and φC-E) such as
photosynthetic cross sections and turnover time appear to equally affect both
Fv/Fm-E and φC-E in the context of photoacclimation, but factors that affect
maximal efficiency such as NPP differentially affect Fv/Fm-E and φC-E.
From strong Fv/Fm and φC correlations, a priori one would expect equally
robust photosynthetic rate predictions, even though photoacclimation embodies
changes in cross section and concentration of photosynthetic units, that in turn
affect both the structure and magnitude of P-E related to photoacclimation.
Indeed, when normalizing to known Pbmax values, PSII rate variability describes
nearly all of the variability in both absolute (r2=0.97) and relative (r2=0.97)
photosynthetic rates (Figure IV-7). This finding is consistent with the robust
relationship between σPSU and σPSII(0) (r2=0.98) that describe the structure of the
P-E and fluorescence-predicted P-E curves, respectively.
However, Pbmax is not described well by fluorescence measurements
(r2=0.37). This is somewhat surprising given the small variability in 1/τPSU and a
103
robust σPSII(0) - E&A relationship (r2=0.99). The deviation between predicted and
observed Pbmax is mainly due to a fluorescence predicted increase (that is not
observed) in Pbmax for very high (211 µmol quanta m-2 sec-1) compared to high
(111 µmol quanta m-2 sec-1) grown populations. The lack of strong correlation
between predicted and observed Pbmax suggests that processes downstream of
PSII, such as RuBisCO concentration and turnover, are controlling maximum
photosynthetic rates (Sukenik et al., 1987; Stitt and Schulze, 1994). A corollary
of downstream regulation is that there is excess capacity available through PSII
such that if functional PSII reaction centers are removed, Pbmax is not
significantly affected (Behrenfeld et al., 1998). In the context of variable light
fields, this excess capacity may provide "insurance" against future reaction
center damage from potentially increased light levels (Neale, 1987; Aro et al.,
1993). At lower growth irradiances, the chance of incurring damage to PSII is
reduced and photosynthetic electron transport chain and downstream
components, such as RuBisCO concentrations and turnover, may be more
balanced (Genty and Harbinson, 1996). Regardless, this excess PSII capacity
leads to a divergence in the relationship between fluorescence-predicted and
observed Pbmax, limiting accurate descriptions of photosynthetic rate and
efficiency by fluorescence techniques to relative descriptions.
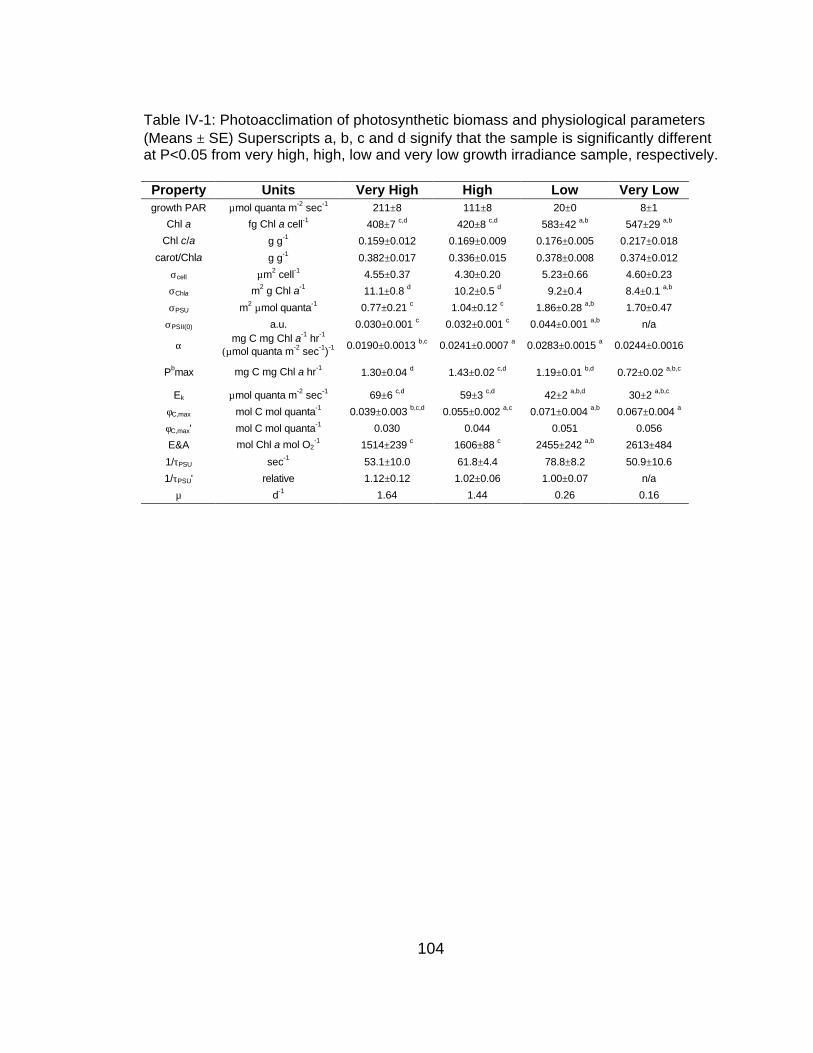
104
Table IV-1: Photoacclimation of photosynthetic biomass and physiological parameters (Means ± SE) Superscripts a, b, c and d signify that the sample is significantly different at P<0.05 from very high, high, low and very low growth irradiance sample, respectively.
Property Units Very High High Low Very Low growth PAR µmol quanta m-2 sec-1 211±8 111±8 20±0 8±1
Chl a fg Chl a cell-1 408±7 c,d 420±8 c,d 583±42 a,b 547±29 a,b
Chl c/a g g-1 0.159±0.012 0.169±0.009 0.176±0.005 0.217±0.018
carot/Chla g g-1 0.382±0.017 0.336±0.015 0.378±0.008 0.374±0.012
σcell µm2 cell-1 4.55±0.37 4.30±0.20 5.23±0.66 4.60±0.23
σChla m2 g Chl a-1 11.1±0.8 d 10.2±0.5 d 9.2±0.4 8.4±0.1 a,b
σPSU m2 µmol quanta-1 0.77±0.21 c 1.04±0.12 c 1.86±0.28 a,b 1.70±0.47
σPSII(0) a.u. 0.030±0.001 c 0.032±0.001 c 0.044±0.001 a,b n/a
α mg C mg Chl a-1 hr-1
(µmol quanta m-2 sec-1)-1 0.0190±0.0013 b,c 0.0241±0.0007 a 0.0283±0.0015 a 0.0244±0.0016
Pbmax mg C mg Chl a hr-1 1.30±0.04 d 1.43±0.02 c,d 1.19±0.01 b,d 0.72±0.02 a,b,c
Ek µmol quanta m-2 sec-1 69±6 c,d 59±3 c,d 42±2 a,b,d 30±2 a,b,c
φC,max mol C mol quanta-1 0.039±0.003 b,c,d 0.055±0.002 a,c 0.071±0.004 a,b 0.067±0.004 a
φC,max' mol C mol quanta-1 0.030 0.044 0.051 0.056
E&A mol Chl a mol O2-1 1514±239 c 1606±88 c 2455±242 a,b 2613±484
1/τPSU sec-1 53.1±10.0 61.8±4.4 78.8±8.2 50.9±10.6
1/τPSU' relative 1.12±0.12 1.02±0.06 1.00±0.07 n/a
µ d-1 1.64 1.44 0.26 0.16
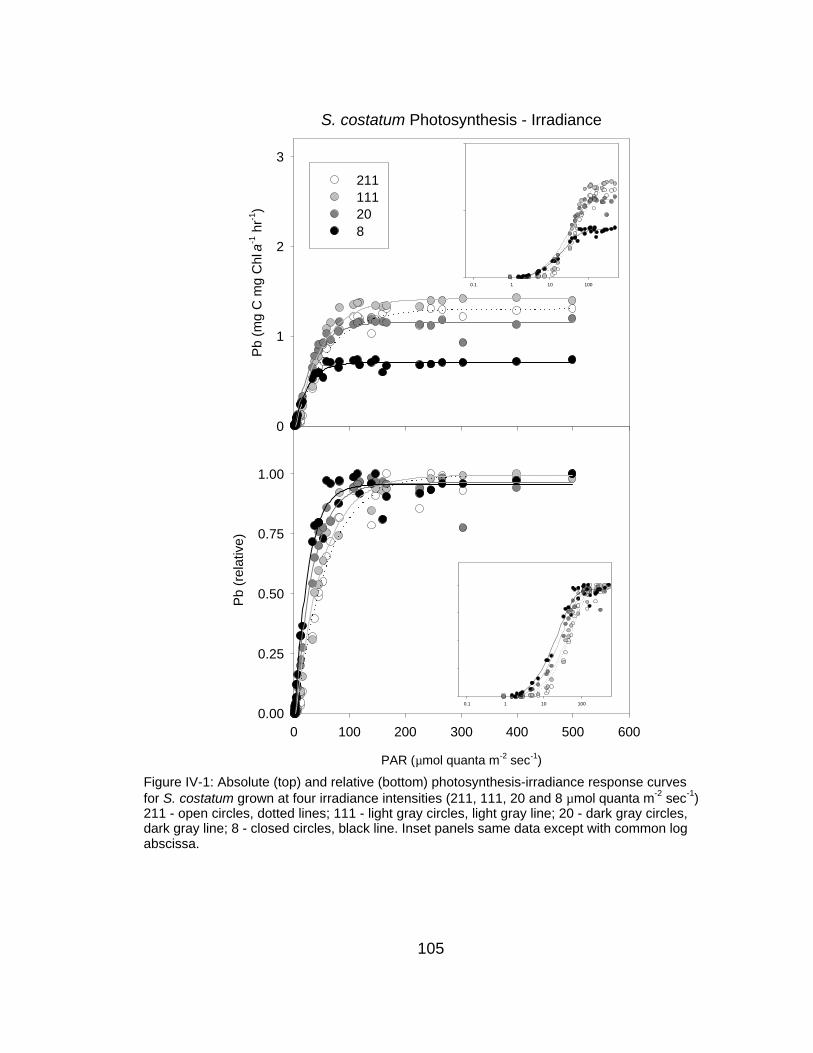
105
S. costatum Photosynthesis - Irradiance
Pb
(mg
C m
g C
hl a
-1 h
r-1)
0
1
2
3
211111208
0.1 1 10 100
PAR (µmol quanta m-2 sec-1)
0 100 200 300 400 500 600
Pb
(rel
ativ
e)
0.00
0.25
0.50
0.75
1.00
0.1 1 10 100
Figure IV-1: Absolute (top) and relative (bottom) photosynthesis-irradiance response curvesfor S. costatum grown at four irradiance intensities (211, 111, 20 and 8 µmol quanta m-2 sec-1) 211 - open circles, dotted lines; 111 - light gray circles, light gray line; 20 - dark gray circles,dark gray line; 8 - closed circles, black line. Inset panels same data except with common logabscissa.
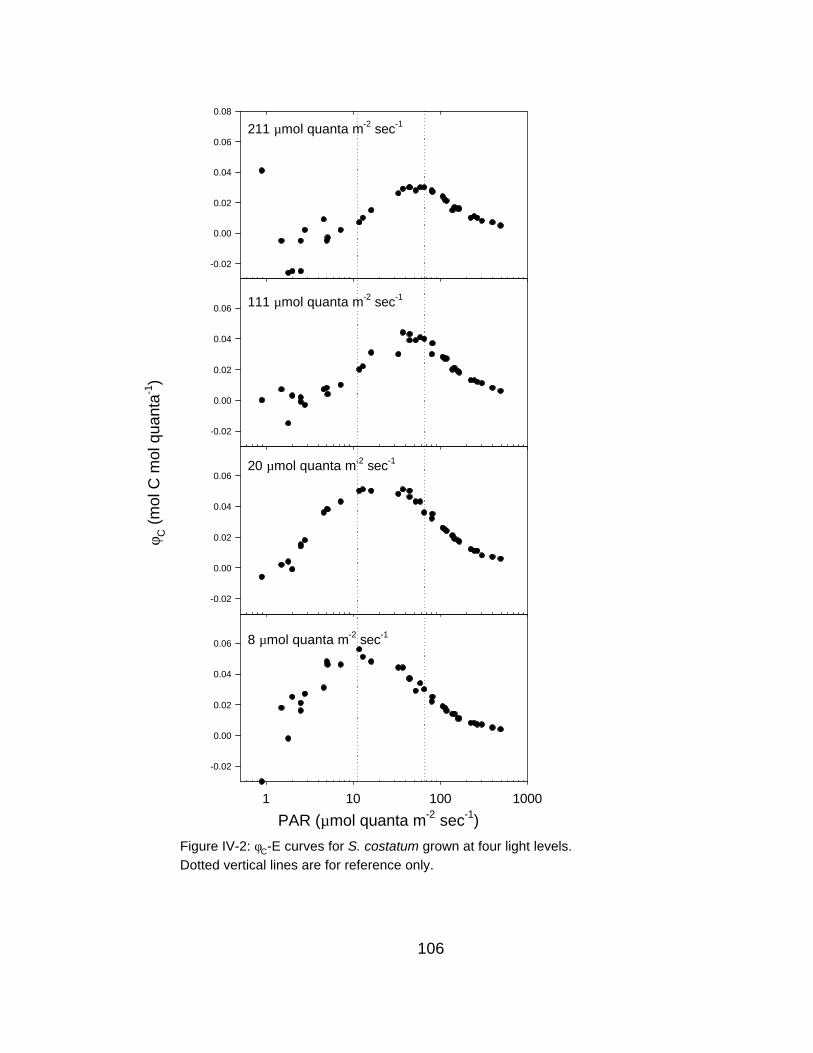
106
-0.02
0.00
0.02
0.04
0.06
0.08
211 µmol quanta m-2 sec-1
111 µmol quanta m-2 sec-1
20 µmol quanta m-2 sec-1
8 µmol quanta m-2 sec-1
φ C (
mol
C m
ol q
uant
a-1)
-0.02
0.00
0.02
0.04
0.06
-0.02
0.00
0.02
0.04
0.06
PAR (µmol quanta m-2 sec-1)1 10 100 1000
-0.02
0.00
0.02
0.04
0.06
Figure IV-2: φC-E curves for S. costatum grown at four light levels.Dotted vertical lines are for reference only.
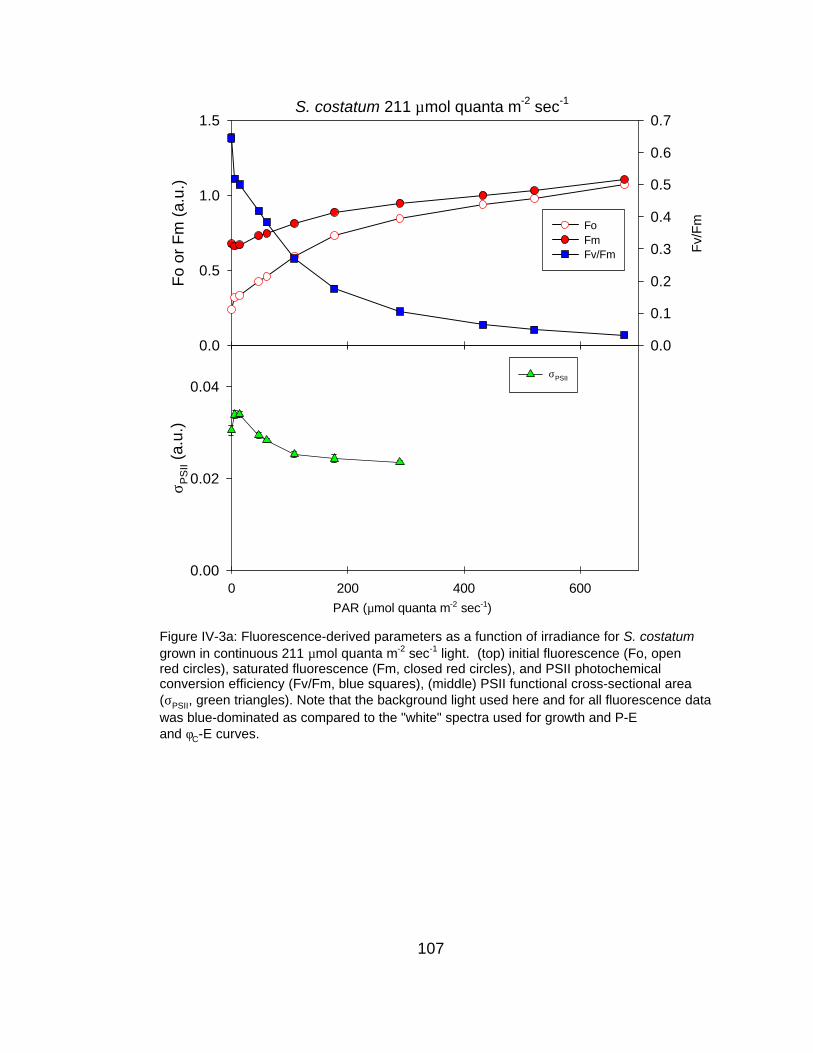
107
S. costatum 211 µmol quanta m-2 sec-1
Fo
or F
m (
a.u.
)
0.0
0.5
1.0
1.5
Fv/
Fm
0.0
0.1
0.2
0.3
0.4
0.5
0.6
0.7
FoFmFv/Fm
PAR (µmol quanta m-2 sec-1)
0 200 400 600
σ PS
II (a
.u.)
0.00
0.02
0.04σPSII
Figure IV-3a: Fluorescence-derived parameters as a function of irradiance for S. costatumgrown in continuous 211 µmol quanta m-2 sec-1 light. (top) initial fluorescence (Fo, openred circles), saturated fluorescence (Fm, closed red circles), and PSII photochemicalconversion efficiency (Fv/Fm, blue squares), (middle) PSII functional cross-sectional area(σPSII, green triangles). Note that the background light used here and for all fluorescence datawas blue-dominated as compared to the "white" spectra used for growth and P-Eand φC-E curves.
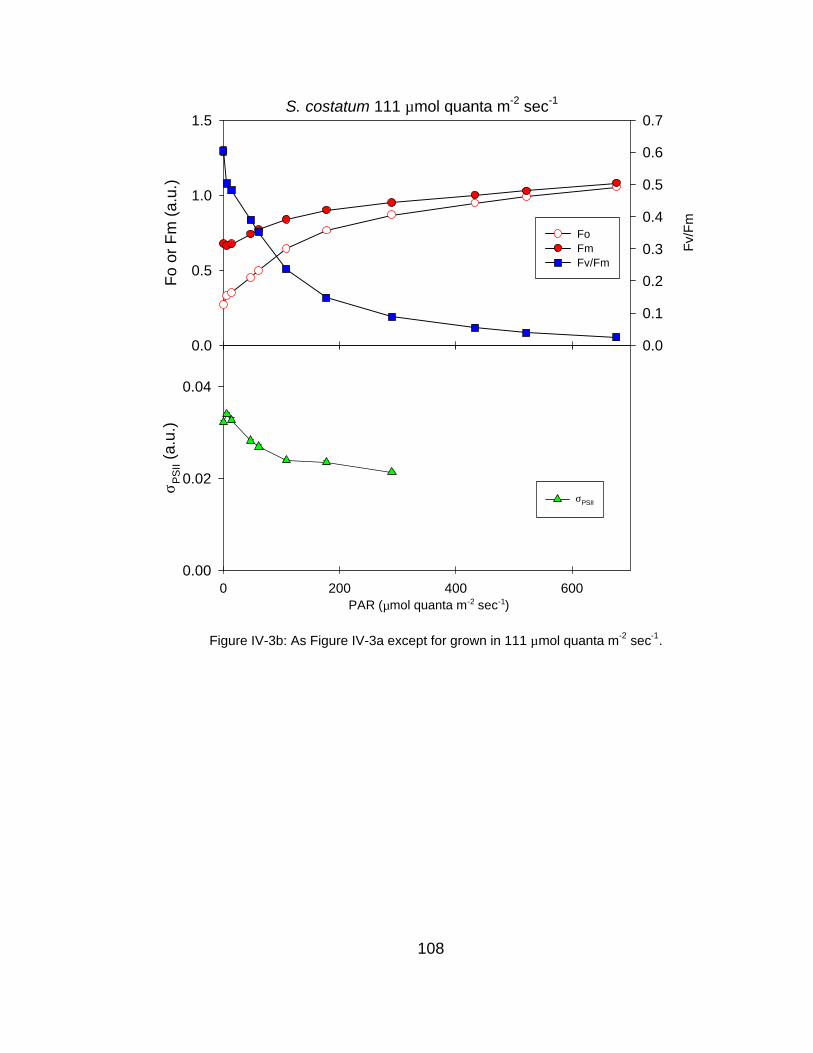
108
S. costatum 111 µmol quanta m-2 sec-1
Fo
or F
m (
a.u.
)
0.0
0.5
1.0
1.5
Fv/
Fm
0.0
0.1
0.2
0.3
0.4
0.5
0.6
0.7
FoFmFv/Fm
PAR (µmol quanta m-2 sec-1)0 200 400 600
σ PS
II (a
.u.)
0.00
0.02
0.04
σPSII
Figure IV-3b: As Figure IV-3a except for grown in 111 µmol quanta m-2 sec-1.
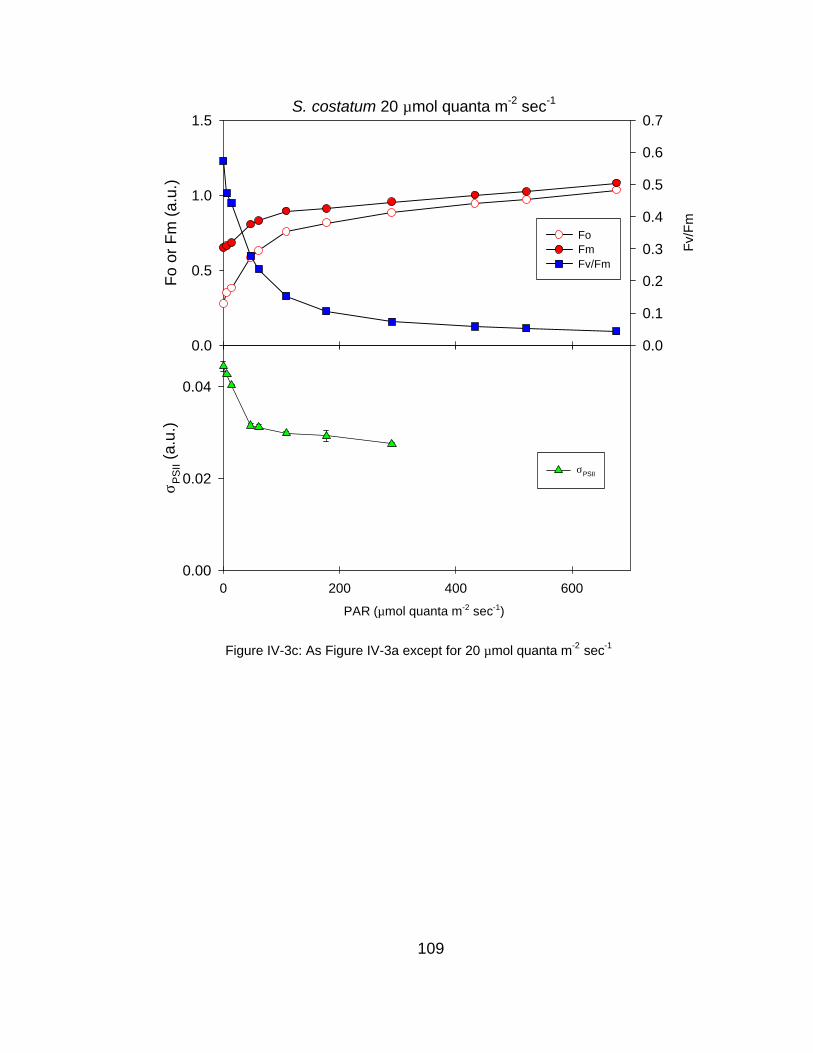
109
S. costatum 20 µmol quanta m-2 sec-1
Fo
or F
m (
a.u.
)
0.0
0.5
1.0
1.5
Fv/
Fm
0.0
0.1
0.2
0.3
0.4
0.5
0.6
0.7
FoFmFv/Fm
PAR (µmol quanta m-2 sec-1)
0 200 400 600
σ PS
II (a
.u.)
0.00
0.02
0.04
σPSII
Figure IV-3c: As Figure IV-3a except for 20 µmol quanta m-2 sec-1
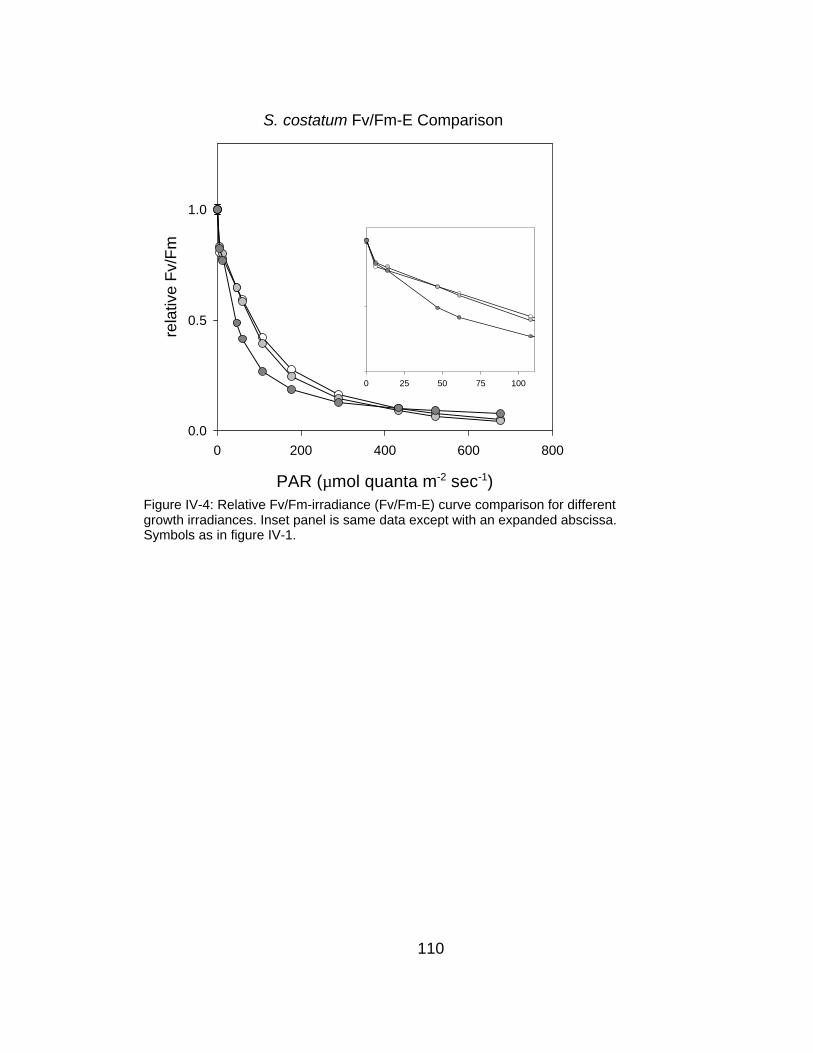
110
PAR (µmol quanta m-2 sec-1)
0 200 400 600 800
rela
tive
Fv/
Fm
0.0
0.5
1.0
0 25 50 75 100
Figure IV-4: Relative Fv/Fm-irradiance (Fv/Fm-E) curve comparison for differentgrowth irradiances. Inset panel is same data except with an expanded abscissa.Symbols as in figure IV-1.
S. costatum Fv/Fm-E Comparison

111
S. costatum PSII functional cross section
σ PS
II (a
.u.)
0.02
0.04
0.06
PAR (µmol quanta m-2 sec-1)
0 200 400 600 800
rela
tive
σ PS
II
0.0
0.5
1.0
1.5
0 25 50 75 100
0 25 50 75 100
Figure IV-5: PSII functional cross sectional area-irradiance (σPSII-E) curve comparison for
different growth irradiances. (top) Absolute σPSII-E curves (a.u.) and (bottom) relative σPSII-Ecurves. Inset panels are same data except with an expanded abscissa. Symbols as figure IV-1.

112
Measured
Fv/Fm(x) (all irradiances)
0.0 0.1 0.2 0.3 0.4 0.5 0.6 0.7
φ C(x
) (al
l irr
adia
nces
)
0.00
0.01
0.02
0.03
0.04
0.05
0.06
Relative
Normalized Fv/Fm(x) (all irradiances)
0.0 0.2 0.4 0.6 0.8 1.0
Nor
mal
ized
φC
(x) (
all i
rrad
ianc
es)
0.0
0.2
0.4
0.6
0.8
1.0
Figure IV-6: (top) Measured and (bottom) relative (to maximum observed infor Fv/Fm-E or φC-E curve, respectively) relationship between PSII conversion
efficiency (Fv/Fm) and photosynthetic quantum efficiency (φC) for all background
light intensities. For the purpose of interpolation, φC was assumed to approach
φC,max as the background light approached zero. Absolute r2=0.66 and relative r2=0.93.
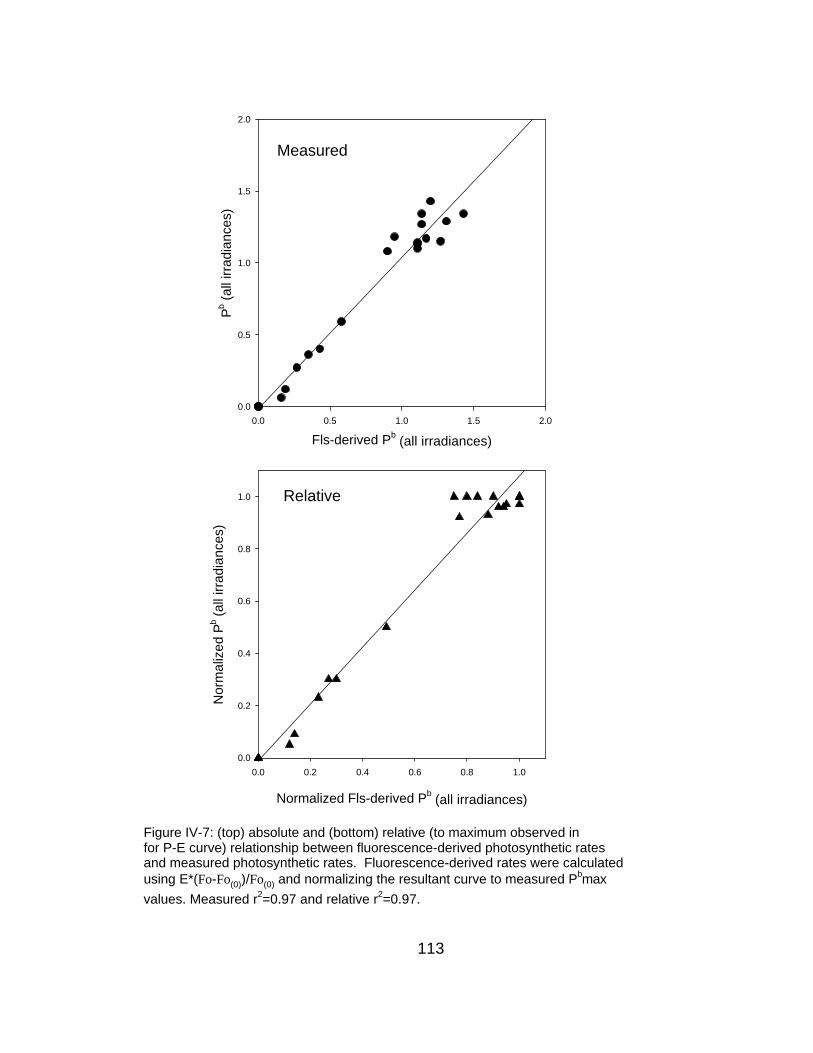
113
Measured
Fls-derived Pb (all irradiances)
0.0 0.5 1.0 1.5 2.0
Pb (
all i
rrad
ianc
es)
0.0
0.5
1.0
1.5
2.0
Relative
Normalized Fls-derived Pb (all irradiances)
0.0 0.2 0.4 0.6 0.8 1.0
Nor
mal
ized
Pb (
all i
rrad
ianc
es)
0.0
0.2
0.4
0.6
0.8
1.0
Figure IV-7: (top) absolute and (bottom) relative (to maximum observed infor P-E curve) relationship between fluorescence-derived photosynthetic ratesand measured photosynthetic rates. Fluorescence-derived rates were calculatedusing E*(Fo-Fo(0))/Fo(0) and normalizing the resultant curve to measured Pbmax
values. Measured r2=0.97 and relative r2=0.97.

114
Chapter V
Mechanisms of reduction in photosynthetic efficiency under nitrogen-limitation in Skeletonema costatum
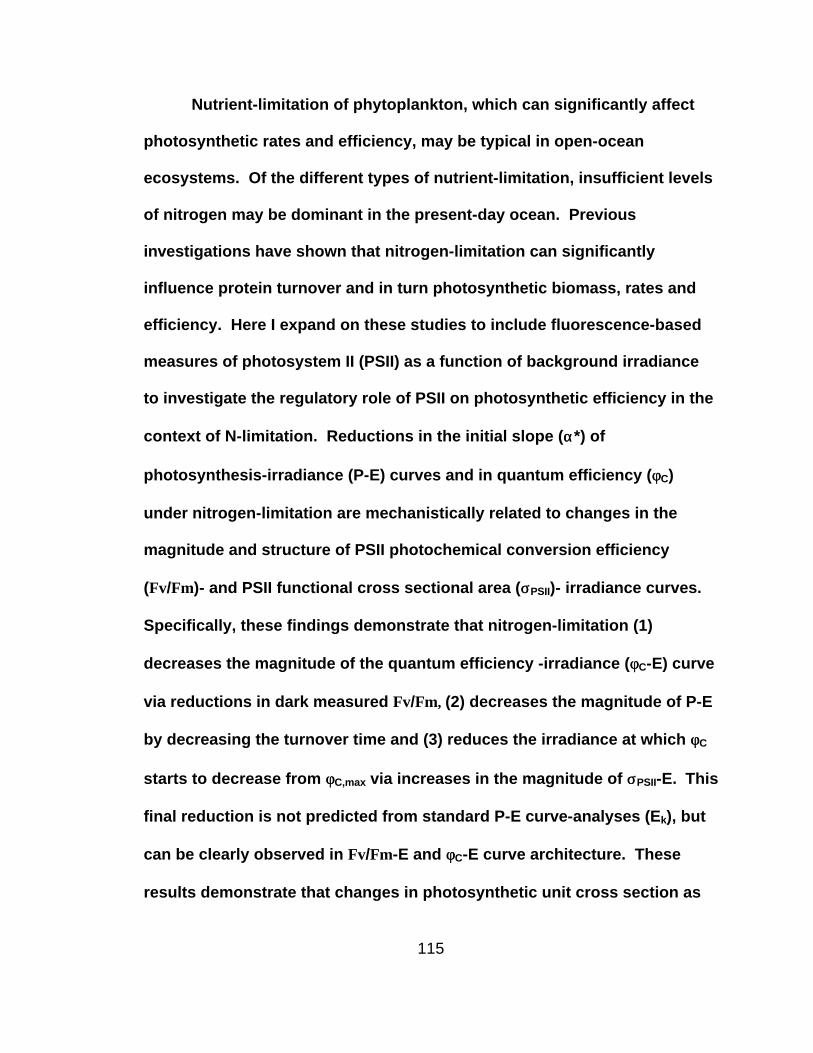
115
Nutrient-limitation of phytoplankton, which can significantly affect
photosynthetic rates and efficiency, may be typical in open-ocean
ecosystems. Of the different types of nutrient-limitation, insufficient levels
of nitrogen may be dominant in the present-day ocean. Previous
investigations have shown that nitrogen-limitation can significantly
influence protein turnover and in turn photosynthetic biomass, rates and
efficiency. Here I expand on these studies to include fluorescence-based
measures of photosystem II (PSII) as a function of background irradiance
to investigate the regulatory role of PSII on photosynthetic efficiency in the
context of N-limitation. Reductions in the initial slope (αα*) of
photosynthesis-irradiance (P-E) curves and in quantum efficiency (φφC)
under nitrogen-limitation are mechanistically related to changes in the
magnitude and structure of PSII photochemical conversion efficiency
(Fv/Fm)- and PSII functional cross sectional area (σσPSII)- irradiance curves.
Specifically, these findings demonstrate that nitrogen-limitation (1)
decreases the magnitude of the quantum efficiency -irradiance (φφC-E) curve
via reductions in dark measured Fv/Fm, (2) decreases the magnitude of P-E
by decreasing the turnover time and (3) reduces the irradiance at which φφC
starts to decrease from φφC,max via increases in the magnitude of σσPSII-E. This
final reduction is not predicted from standard P-E curve-analyses (Ek), but
can be clearly observed in Fv/Fm-E and φφC-E curve architecture. These
results demonstrate that changes in photosynthetic unit cross section as
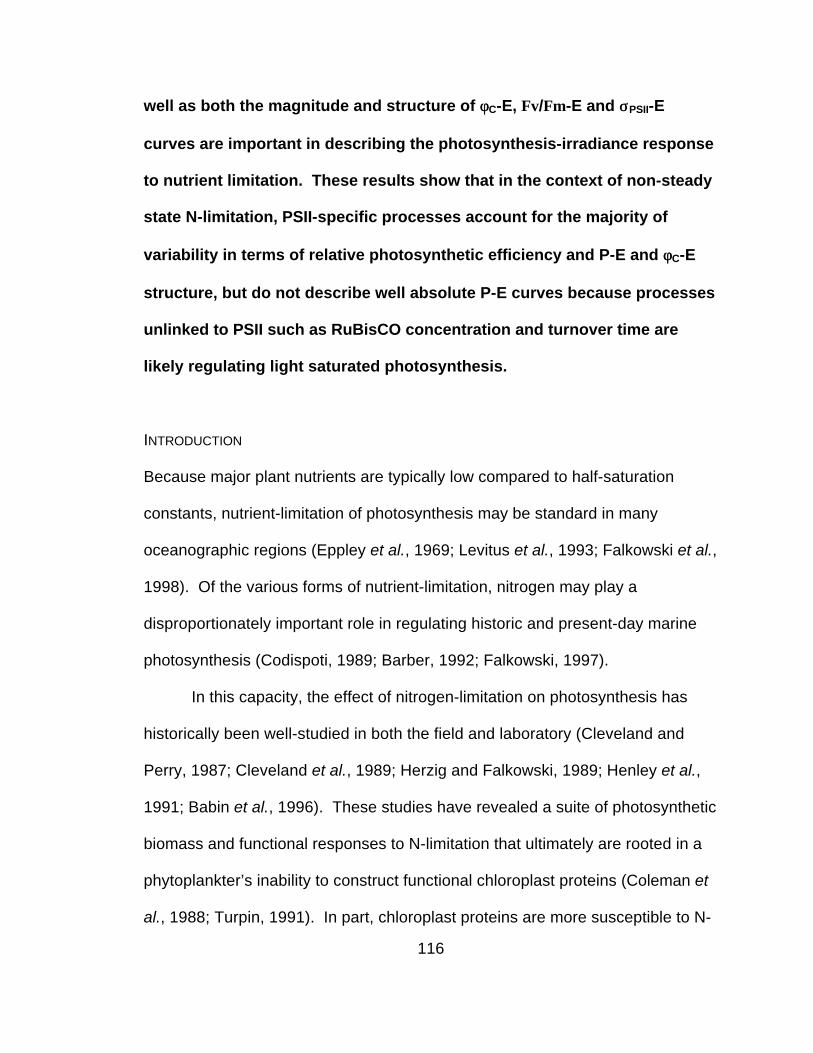
116
well as both the magnitude and structure of φφC-E, Fv/Fm-E and σσPSII-E
curves are important in describing the photosynthesis-irradiance response
to nutrient limitation. These results show that in the context of non-steady
state N-limitation, PSII-specific processes account for the majority of
variability in terms of relative photosynthetic efficiency and P-E and φφC-E
structure, but do not describe well absolute P-E curves because processes
unlinked to PSII such as RuBisCO concentration and turnover time are
likely regulating light saturated photosynthesis.
INTRODUCTION
Because major plant nutrients are typically low compared to half-saturation
constants, nutrient-limitation of photosynthesis may be standard in many
oceanographic regions (Eppley et al., 1969; Levitus et al., 1993; Falkowski et al.,
1998). Of the various forms of nutrient-limitation, nitrogen may play a
disproportionately important role in regulating historic and present-day marine
photosynthesis (Codispoti, 1989; Barber, 1992; Falkowski, 1997).
In this capacity, the effect of nitrogen-limitation on photosynthesis has
historically been well-studied in both the field and laboratory (Cleveland and
Perry, 1987; Cleveland et al., 1989; Herzig and Falkowski, 1989; Henley et al.,
1991; Babin et al., 1996). These studies have revealed a suite of photosynthetic
biomass and functional responses to N-limitation that ultimately are rooted in a
phytoplankter’s inability to construct functional chloroplast proteins (Coleman et
al., 1988; Turpin, 1991). In part, chloroplast proteins are more susceptible to N-
117
limitation because they turn over rapidly in response to the particularly large
swings in redox potential (Crofts and Wraight, 1983). However, both proteins
with normally high levels of turnover such as reaction center associated proteins
D1, D2 and CP43 as well as slower turnover, non-reaction center proteins such
as ribulose-1,5-bisphosphate carboxylase/oxygenase (RuBisCO) are sensitive to
N-stress (Falkowski et al., 1989; Beardall et al., 1991; Aro et al., 1993; Garcia-
Ferris and Moreno, 1994; Vasilikiotis and Melis, 1994).
Because it alters the production of necessary proteins, N-limitation leads
to altered photosynthetic functionality. For example, reaction center proteins,
which are crucial to the efficient use of excitation energy, can become damaged
under N-limitation that in turn can lead to marked reductions in photosystem II
(PSII) photosynthetic conversion efficiencies. These decreases also lead to an
overall increase in the functional size of PSII antennae (Kolber et al., 1988;
Geider et al., 1998). Similarly, N-limitation can lead to significant reductions in
both the concentration and activity of RuBisCO (Beardall et al., 1991; Garcia-
Ferris and Moreno, 1994). Other chloroplast and mitochondrial proteins, which
affect the photosynthesis process, are also specifically influenced by N-limitation
and lead to reduced functionality (La Roche et al., 1993).
In addition to these direct effects on excitation energy processing, other
components and processes of photosynthesis are affected by N-limitation. For
example, pigment concentrations are dramatically altered under N-limitation
including chlorosis as well as the relative increase in non-photosynthetically
active pigment concentrations (Sosik and Mitchell, 1991; Collier and Grossman,
118
1992; Latasa and Berdalet, 1994). In turn, these changes in pigmentation can
affect absorption properties (Sosik and Mitchell, 1991; Geider et al., 1993).
Aggregate pigment indices also suggest that pigment-dependent processes such
as non-photochemical quenching of excitation energy may be altered under N-
limitation (Demmig-Adams and Adams, 1992; Verhoeven et al., 1997).
From studies of the effects of N-limitation on protein turnover and
expression, it is then not surprising that photosynthetic rates and efficiencies are
significantly reduced under N-limitation (Cleveland and Perry, 1987; Kolber et al.,
1988; Sosik and Mitchell, 1991; Geider et al., 1998). These reductions are
characterized by decreases in the magnitude and altered structure of
photosynthesis-irradiance response curves and specifically result in decreased
light-saturated photosynthesis (Pbmax) and quantum efficiencies. However, the
effect of nutrient-limitation in general and nitrogen-limitation in particular on the
mechanisms that determine photosynthesis-irradiance curves has been difficult
to unravel (Cullen et al., 1992).
In this study, my goal is to uncover the effect of N-limitation on the
quantum efficiency-irradiance (φC-E) relationship by focusing on PSII, to
analytically link previously documented changes in mechanistic properties such
as photochemical conversion efficiencies (Fv/Fm(0)) and PSII functional cross
sectional area (σPSII(0)) to observed changes in photosynthesis-irradiance (P-E)
and quantum efficiency-irradiance response curves.
My working hypothesis is that impaired reaction center protein turnover
will lead to decreased Fv/Fm(0), and because of partial photosynthetic unit (PSU)

119
connectivity, associated increases in σPSII(0). In addition, because they are
indicative of the flux of excitation energy through PSII, Fv/Fm-E and σPSII-E
curves will be linked to the general structure of P-E and φC-E curves. However,
N-limitation alterations to RuBisCO and other non-PSII proteins, which alter the
photosynthetic electron transport chain downstream of PSII, could result in some
disparities between PSII predicted and measured P-E.
For this study, I use standard photophysiological measures such as flash
yields, carbon uptake, spectral absorption and pigment concentrations in
combination with a newly developed active fluorescence induction technique
(Chapter III). This technique measures several mechanistic properties of PSII
over a light gradient, providing an analytical connection to P-E response curves.
These findings demonstrate that N-limitation can affect both the magnitude and
structure of P-E, φC-E, Fv/Fm-E and σPSII-E relationships and that the
fluorescence-based (PSII) measures of the mechanistic parameters of
photosynthesis describe well the analytic processes affecting the overall relative
P-E and absolute φC-E response. However, in the context of N-limitation, these
PSII descriptions do not adequately describe absolute P-E because non-PSII
specific processes such as RuBisCO concentration and turnover time appear to
be regulating Pbmax.
METHODS
Culture conditions
120
Replicate Skeletonema costatum (SKEL) cultures (Exp#1 and Exp #2) were
grown in batch culture in 5 l glass containers at 19oC in air bubbled, modified f/2
media (N/20 and 1Si, with major plant nutrient atom ratios of N:P:Si 2.4:1:5.8)
(Guillard and Ryther, 1962). Assuming balanced Redfield growth, (N:P:Si
16:1:10.4-15.0), nitrogen is predicted to limit growth first (Redfield, 1958;
Brzezinski, 1985). Nominal nitrogen limitation was relieved by addition of f/2
concentrations of nitrogen stock solution (0.88 mM N, final concentration).
Continuous light (~100 µmol quanta m-2 sec-1) was supplied by cool white
fluorescent bulbs. Cultures were started and remained optically thin throughout
the duration of the experiment. Replicate experiments were created by adding a
known volume and cell density of culture to a known volume of fresh media.
However, due to slight errors in estimating the volumes and cell densities, there
remain minor "timing" discrepancies between the replicates.
Absorption, Pigments, Growth Rates, Cell Density
Spectral absorption measurements were made at 2 nm resolution with a 1 sec
integration time on samples in solution using an HP 8452 diode array
spectrophotometer with Labsphere (RSA-HP-84) integrating sphere. Absorption
at 750 nm was assumed to be non-cellular and was subtracted from the
absorption curve. Absorption coefficients were calculated following Kirk (1994).
Chlorophyll a and b and carotenoids were determined on 90% acetone extracts
following Parsons et al. (1984), except without MgCO3 addition, using the
trichromatic equations of Jeffrey and Humphrey (1975). Intrinsic growth rates
121
were calculated from bulk fluorescence measurements. Cell concentrations were
estimated using a hemacytometer.
Photosystem Quantification
Emerson-Arnold numbers (Chl a/O2) were measured using a Hansatech oxygen
electrode and a Stroboslave (Type1539A) tunable frequency, saturating strobe
light following Dubinsky et al. (1986). PSII/Chl a was calculated as four times the
initial slope of oxygen evolution rate versus flash frequency, normalized to
chlorophyll concentration.
Photosynthesis vs Irradiance (P-E), Turnover Rates
Carbon-based photosynthesis-irradiance measurements were made using
custom-built temperature-regulated photosynthetrons. Irradiance, which was
supplied by a 250 W ENH projector bulb (Gray Supply), was spectrally modified
and attenuated using a combination of hot and cold mirrors (Optical Coating
Laboratory) and stage screening (Cinemills). Irradiance intensity (PAR) was
measured using a Biospherical Instruments (QSL-100) 4π scalar irradiance
meter. Incubations of 1 ml samples inoculated with ~7.4 kBq H14CO3 were
terminated after 10 mins using 100 µl 37% formaldehyde and 200 µl HCl and
allowed to degas overnight. Carbon uptake rates were quantified using standard
techniques (Barber et al., 1996). Photosynthetic parameters of the Platt et al.
(1980) model (α*, Ps, β) were optimized to fit data using a custom written, non-
linear least-squares Levenberg-Marquardt technique (Frenette et al., 1993).
122
Optimization of model parameters to P-E data was performed using PAR as the
independent variable. Secondary parameters (Pbmax and Ek) were calculated
following Zimmerman et al. (1987). Maximum quantum yield (φC,max) was
calculated from model predicted α* as the mol C mol quanta-1 absorbed using
absorption coefficients that were spectrally weighted to incident measurement
irradiance (Chapter II). Maximum quantum yield (φC,max') calculated using the
[ ]EC −φmax method (Chapter II) yielded similar patterns, but ~50% reduced
values (compare Figures V-7 and -8). Photosynthetic unit turnover rate constant
(sec-1), 1/τPSU, was calculated as:
n
P b
PSU
max0269.01=
τ (V-1)
where Pbmax is light-saturated photosynthesis (mg C mg Chl a-1 hr-1), n is the
concentration of PSII (mol O2 mol Chl a-1) and 0.0269 converts the units from
hours to seconds and grams to moles and carbon to oxygen using a constant
photosynthetic quotient of 1.3 (Laws, 1991). Patterns of 1/τPSU, calculated using
σPSII(0) and Ek following Dubinsky et al. (1986) that are referred to as 1/τPSU',
yielded similar results.
Modulated Fluorescence
Modulated fluorescence measurements were performed with a previously-
described custom-built fast repetition rate type fluorometer with computer-

123
controlled background irradiance gradient (BIG-FRRf) (Chapter III; Kolber et al.,
1998). The background light is produced by super-bright blue LEDs and has a
maximum output wavelength of ~550 nm (Chapter III). For this study, the
excitation protocol was run for 350 µsec at high intensity with a 100% duty cycle
followed by the decay protocol that was run for 7.5 msec at low intensity with a
1% duty cycle. The pre-illumination background irradiance duration was 500
msec. Samples were dark adapted for >15 mins for each background irradiance
setting. Data were analyzed using custom-written software based in MATLAB
5.3v11 following Kolber et al. (1998) to determine Fo, Fm, σPSII and p where Fo is
initial fluorescence, Fm is the maximal fluorescence, σPSII is the functional cross-
sectional area, p is a connectivity parameter.
For each background irradiance there is generated a suite of
fluorescence-derived parameters. These parameters are referred to with the
subscript indicating the background irradiance intensity. For example, Fv/Fm(0) is
photosystem II photochemical conversion efficiency in the dark and σPSII(521) is
the PSII functional cross sectional area at 521 µmol quanta m-2 sec-1.
RESULTS / DISCUSSION
Photosynthetic Biomass
S. costatum growth curves are exponential for approximately 1.5 days, at which
point growth rates decrease significantly and populations become stationary
(Figure V-1). Nitrogen addition at ~5.5 days re-initiated population growth. The
reversal of stationary to exponential growth phase with the addition of nitrogen

124
supports nitrogen-limited growth, as predicted from growth media atom ratios.
That the ratio of fluorescence to chlorophyll, which can be used as a crude index
of physiological status, increased nearly two-fold from N-replete to -limited
conditions and returned to pre-limitation values after N-addition also suggests a
N-limited culture.
N-limitation caused cellular chlorophyll a to decrease nearly four-fold, but
the levels of chlorophyll c relative to chlorophyll a remained fairly constant
(Figure V-2). As fluorescence to chlorophyll a increased and cellular chlorophyll
a decreased, relative carotenoid concentrations increased approximately two-
fold. These decreases in photosynthetically active pigments along with relative
increases in the non-photosynthetically active protective pigments (NPP) are
consistent with previous investigations into the effect of nitrogen limitation on
photosynthetic biomass (Geider et al., 1993; Latasa and Berdalet, 1994). They
suggest that under N-limitation, S. costatum becomes chlorotic, but maintains
NPP content to avoid photodamage (Henley et al., 1991; Verhoeven et al., 1997).
Differences in pigmentation under N-limitation lead to some significant
changes in absorption properties (Figure V-3). The cellular absorption cross
section (σcell) decreased significantly under nitrogen limitation. However,
chlorophyll a-specific absorption cross section (σChla) displayed a more complex
behavior. For both replicate experiments, σChla initially increased and then
decreased. Although the general pattern for the two experiments is similar, the
timing of the pattern is not. These differences in timing, which are also apparent
125
for other photophysiological parameters (σPSU, α*, Pbmax, etc.), may be the result
of slight differences in the initial conditions of the “replicates.”
Timing aside, initial increases in σChla following the onset of N-limitation
are consistent with a relative increase in NPP and subsequent decreases in
absorption are generally consistent with the likely decreases in the relative
concentrations of photosynthetic accessory pigments not measured here (ex.
fucoxanthin). Despite the minor changes in σChla that are linked to the pigment
complementation, the overall magnitude of change is quite low when compared
to dramatic shifts in cellular chlorophyll a concentrations. Thus, the combination
of photosynthetically active accessory pigment degradation and maintenance of
NPP with decreasing chlorophyll a concentration leads to a relatively constant
σChla.
Similar to σcell patterns, functional photosynthetic cross sections (σPSU)
decrease precipitously under N-limitation (Figure V-3). These decreases are
consistent with reduced chlorophyll concentrations and the relative increase in
protective carotenoids. The decreases in σPSU are also likely significantly
affected by the dramatic decreases in PSU turnover time (1/τPSU) (see below).
In addition to changes in aggregate pigment and absorption properties
under N-limitation, there are also changes in PSII concentrations (Figure V-4).
Cellular concentrations of functional PSII decrease significantly under N-limitation
from N-replete levels of ~1.0 amol PSII cell-1 to ~0.1 amol PSII cell-1 under
extreme N-limitation. Emerson and Arnold (E&A) number trends are less
conclusive suggesting a decrease in one replicate, but no general trend in the
126
second replicate. Nevertheless, it is clear that individual S. costatum cells have
reduced active PSII levels under N-limitation (see below).
Photophysiology
Similarly to photosynthetic biomass properties, photophysiology as interpreted
from P-E curve analysis was significantly compromised under N-limitation (Figure
V-5). The maximum light utilization coefficient (α*) decreased from ~0.04 mg C
mg Chl a-1 hr-1 (µmol quanta m-2 sec-1)-1 to nearly zero at maximum N-limitation.
This decrease was paralleled by similar decreases in the light-saturated
photosynthetic rate (Pbmax) from ~2.0 mg C mg Chl a-1 hr-1 to near zero. Despite
these dramatic decreases in α* and Pbmax, the general structure of the P-E
curves remained remarkably constant from N-replete to severely N-limited, with
the light saturation level (Ek) resting at ~50 µmol quanta m-2 sec-1 throughout the
experiment (but see below).
Although Ek remained relatively constant, N-limitation induced more subtle
changes in P-E architecture. These changes are not readily observed when
using absolute P-E curves, but are apparent when examining relative P-E
structure (Figure V-6). Using this type of analysis, N-limited, relative P-E curves
are shifted to lower irradiances relative to N-replete curves. This property implies
that relative to N-replete, N-limited functional cross sections are elevated and
that it takes less light to saturate photosynthesis under N-limited conditions. A
corollary suggested by this observation is that under N-replete conditions, S.
costatum is able to utilize higher irradiance intensities compared to N-limited
127
conditions. Despite these properties, it is important to note that under N-replete
conditions, more photosynthate is produced per photon because of the increased
magnitude of the P-E curve. The Ek value, which is calculated as Pbmax / α*
(Talling, 1966), does not adequately document this change in photophysiology
because it is not a sensitive measure of the structure of the P-E curve. The
calculation of Ek implicitly assumes P-E structure to be bi-linear and disregards
convexity (Blackman, 1905; Henley, 1995). These changes in the magnitude
and relative structure of P-E are supported by additional photosystem biomass
and physiological characterizations (see below).
As implied from P-E curves and absorption properties, φC,max decreases
significantly under N-limitation (Figure V-7). Values of φC,max are near maximal
(~0.125 mol C mol quanta-1) under N-replete conditions and decrease to near
zero as nitrogen becomes more limiting. These decreases are consistent with
previous findings of N-sensitive φC,max (Cleveland and Perry, 1987; Babin et al.,
1996). Decreases in φC,max are almost exclusively due to reductions in α* and are
largely independent of absorption (σChla) properties (Figures V-3 and -5).
Estimates of photosystem turnover (1/τPSU) derived from oxygen flash
yields and light saturated photosynthesis values also decreased significantly
under nitrogen limitation (~80 to ~20 sec-1). This decrease in turnover is almost
entirely driven by decreases in Pbmax (Equation V-1); even in experiment #1
when E&A was somewhat reduced under N-limitation, turnover time decreases
because of dramatic reductions in Pbmax. Nevertheless, these estimates of
128
1/τPSU should be interpreted with caution because they were calculated using a
constant photosynthetic quotient (PQ) of 1.3 (mol O2 mol C-1). However, a ~6-
fold reduction in growth rate due to N-limitation lead to only a minor (<~20%)
increase in PQ (Bidigare et al., 1989; Genty et al., 1989; Geider et al., 1998)
suggesting that the dramatic reductions in turnover measured here are probably
not driven exclusively by oxygen evolution / carbon uptake ratios. Independently
measured 1/τPSU (1/τPSU'), which are not dependent on PQ, show similar trends.
Similarly to P-E analyses, φC-E structure is significantly affected by N-
limitation (Figure V-8). Contrary to P-E curves, the magnitude of the φC-E curve
decreases only slightly under moderate N-limitation. However, under severe N-
limitation, the magnitude of the φC-E curve decreases in a similar manner to P-E
curves. This delayed onset of decrease in φC,max relative to photosynthetic rates
could be driven by changes in pigmentation or turnover rates. However, the
structure and magnitude of chlorophyll a-specific absorption spectra are
remarkably constant from N-replete to N-limited cells (data not shown),
suggesting that changes in the fate of absorbed light and not absorption (σChla)
are driving φC-E. In addition, Fv/Fm-E, which are absorption (σChla) independent,
are also consistent with φC-E suggesting that changes in turnover times are
mediating the drops in P-E magnitude and do not affect the magnitude of φC-E or
Fv/Fm-E (see below).
While the magnitude of the φC-E curve remains high under moderate N-
limitation, the structure of the curve is significantly different under N-limitation

129
with the φC,max occurring at a lower irradiance (Figure V-8). Similar to P-E curves,
this reduction in the irradiance at which φC,max occurs in effect shifts the relative
φC-E curve to lower irradiances. Both moderately and severely N-limited φC-E
curves are shifted to lower irradiances. For S. costatum grown at ~100 µmol
quanta m-2 sec-1, this shift results in a dramatic reduction in realized quantum
efficiency. For example, φC at 100 µmol quanta m-2 sec-1 (the growth irradiance)
is reduced ~50% for moderately N-limited relative to N-replete, despite only
minor (~10%) reductions in φC,max. Thus, although φC,max is at first not affected by
N-limitation, the shift in irradiance structure significantly reduces the operational
quantum efficiency and in part leads to reduced P-E magnitudes. Similar to P-E
and Fv/Fm-E , this shift is due to changes in cross section (see below).
Fluorescence-derived Measurements
N-replete estimates of Fo-, Fm-, Fv/Fm- and σPSII-E (Figure V-9a) were generally
consistent with previous observations using other phytoplankton taxa under
nutrient-replete conditions (Chapter III). N-limited estimates of these parameters
were also consistent with previous fluorescence parameter versus irradiance
patterns, but here the level of N-limitation significantly affected curve magnitudes
(Figure V-9b,c).
Similar to previous studies, Fv/Fm(0) and σPSII(0) were greatly affected by N-
limitation (Figure V-10) (Kolber et al., 1988; Geider et al., 1993). Like φC,max,
Fv/Fm(0) started to decrease approximately one day after growth rates began to
130
decline. Fv/Fm(0) decreased about 3-4 fold to ~0.15 after five days of N-limitation,
but quickly recovered (1-2 days) to pre-limitation values after the addition of
nitrate. Commensurate with decreases in Fv/Fm(0) were increases in σPSII(0).
From N-replete to severely N-limited conditions, σPSII(0) increased from ~0.02 to
0.05 (a.u.). These increases also quickly recovered upon addition of nitrate.
Values of σPSII(0) were inversely correlated with functional PSII
concentrations (r2=0.70). Because photosynthetic units are partially energetically
connected and in-between independent and connected-units antennae
arrangements, decreases in functional PSII concentrations can lead to increases
in the functional size of PSII (Trissl et al., 1993; LaVergne and Trissl, 1995; Trissl
and LaVergne, 1995).
Clearly N-limitation affects the magnitude of Fv/Fm(0) and σPSII(0).
However, responses of dark measured parameters may not be typical of Fv/Fm-E
or σPSII-E responses. To gauge the possible differential response to N-limitation
along a Fv/Fm-E or σPSII-E curve, I selected a background irradiance of 108 µmol
quanta m-2 sec-1 as a representative middle irradiance value that is close to the
growth irradiance to measure the effects of differential N-limitation on Fv/Fm-E
and σPSII-E. Similar to dark values, Fv/Fm(108) and σPSII(108) were also dramatically
affected by N-limitation (Figure V-10) with Fv/Fm(108) decreasing and σPSII(108)
increasing upon N-limitation. However, although these parameters had the same
general patterns with respect to N-limitation when measured in the dark or in the
presence of light (Figure V-10), N-limitation had relatively less influence on
131
σPSII(108) when compared to σPSII(0); σPSII(0) increased ~150% while σPSII(108)
increased only ~50% under N-limitation. Meanwhile, the relative reduction in
Fv/Fm(108) with N-limitation was nearly identical to that of Fv/Fm(0).
To examine these differential reductions in more detail, I compared the
irradiance structure of Fv/Fm and σPSII for three different levels of N-limitation
(Figure V-11-12). Fv/Fm-E curves are very similar in generalized structure and
relative magnitude to φC-E curves. Moderately N-limited Fv/Fm-E curves are
somewhat reduced in magnitude compared to N-replete curves, while severely
N-limited Fv/Fm-E curves are dramatically reduced in magnitude. However,
similar to normalized φC-E curves, moderate and severe N-limitation leads to an
overall shift of the normalized Fv/Fm(max) plateau from higher to lower irradiances
(Figure V-11). This shift is indicative of changes in photosynthetic cross sections
(see below).
Using the integrated area under the Fv/Fm-E curve as a measure of
summed potential photosynthetic capacity, I calculated the relative influence of
(1) the changes in the magnitude of the curves and (2) the shift from high to low
irradiances under N-limitation. The integrated area (0-500 µmol quanta m-2 sec-
1) for N-replete Fv/Fm-E was 75% and 167% greater than for moderately (2.9
days) or severely (4.9 days) N-limited Fv/Fm-E, respectively. Of this increase,
87% and 47% was due to the shift of N-replete Fv/Fm-E over moderately or
severely-limited Fv/Fm-E, respectively. Although crude, this type of analysis
highlights the importance of the irradiance shift in determining the light response
curve of photosynthetic conversion efficiency.
132
N-replete and -limited σPSII-E curves also differ in magnitude and structure
(Figure V-12) with increases in the magnitude of the σPSII-E curves even under
moderate N-limitation. This increase in magnitude is present throughout the
σPSII-E curve. Thus, unlike Fv/Fm-E and φC-E curves, changes in magnitude
dominate the overall shape of the curve.
Although the magnitude component of the curve dominates, there remain
some notable differences between the relative structures. Specifically, at middle
irradiances σPSII decreases more under N-limitation than for N-replete (Figure V-
12). As previously described, decreases in σPSII at moderate irradiance
intensities are likely a result of non-photochemical quenching (NPQ), thus this
data suggest that N-limitation induced elevated NPQ (Chapter III). To the degree
that NPQ-regulation may be a critical component in the regulation of
photosynthetic light-harvesting, especially under non-favorable nutrient regimes
(Niyogi, 1999; Demmig-Adams and Adams, 2000; Li et al., 2000), increases in
NPQ under N-limitation are consistent with S. costatum that have with reduced
photosynthetic yield (Bungard et al., 1997; Verhoeven et al., 1997). This
increase in relative NPQ capacity is also supported by the increase in the
carotenoid to chlorophyll a pigment ratio under N-limitation (Figure V-2).
Integration
It is clear from this and previous studies that N-limitation significantly affects
photosynthetic biomass, rates and efficiency. To step beyond simply
documenting changes, an emergent question is: Can changes in the analytic

133
components of photosynthesis be related to the total photosynthetic response?
Or for modeling purposes, can the measured mechanistic properties of PSII such
as Fv/Fm and σPSII be used to predict observed photosynthetic rates (P-E) and
efficiency (φC-E) in the context of N-limitation? Nominally this task can be broken
into three major descriptions: α*, Pbmax and the structure or convexity of the P-E
relationship (Frenette et al., 1993; Henley, 1995).
The maximum light utilization coefficient (α*) is composed of two terms
including chlorophyll a-specific absorption (σChla) and quantum efficiency (φC,max) :
max,*
CChlaφσα = (V-2)
From this relationship, one can examine the differential effect of absorption and
efficiency on α*. Because of the dramatic changes in α* (Figure V-5) with only
minor changes associated with σChla (Figure V-3), a priori variability in α* in the
context of N-limitation should be dominated by changes in quantum efficiency.
Indeed, greater than 98% of the change in α* is due to changes in φC,max (Figure
V-13).
Numerous processes including non-photosynthetic pigment content,
reaction center functionality, or RuBisCO concentrations and activity can
potentially influence quantum efficiency (Bidigare et al., 1989; Genty et al., 1989;
Geider et al., 1998). In turn, each of these processes can be influenced by
nitrogen nutrition and therefore has the potential to affect the realized quantum
efficiency (Herzig and Falkowski, 1989; Beardall et al., 1991; Latasa and
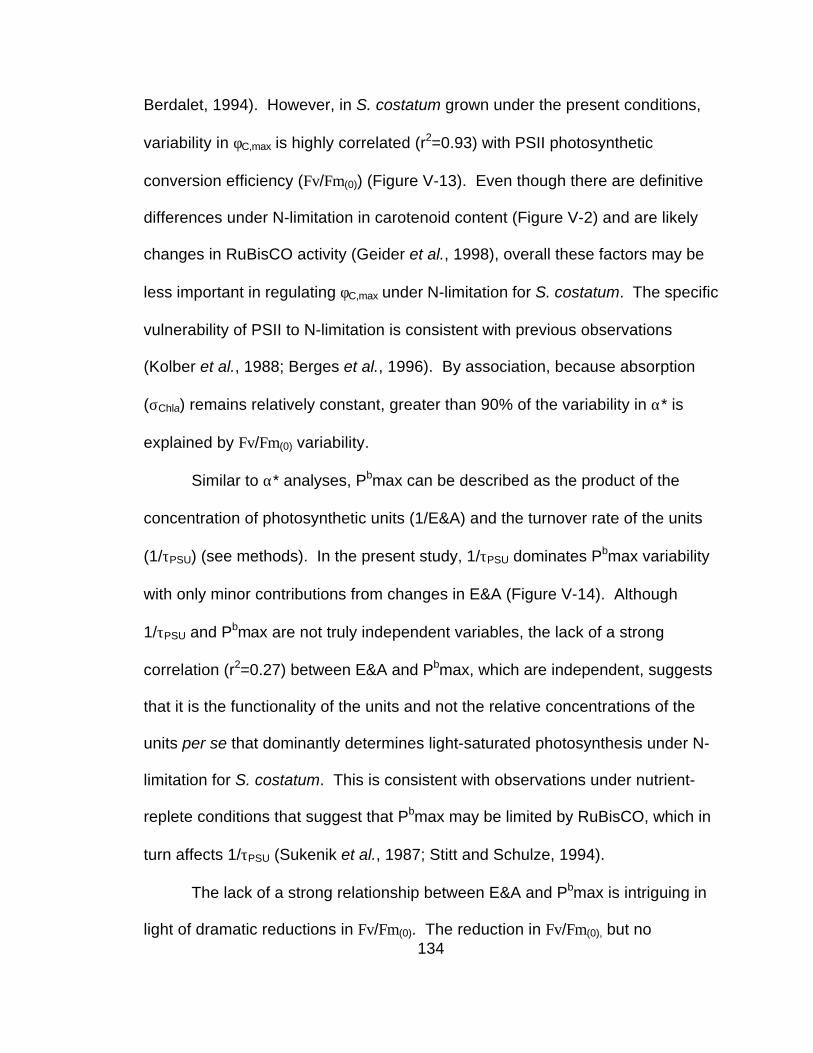
134
Berdalet, 1994). However, in S. costatum grown under the present conditions,
variability in φC,max is highly correlated (r2=0.93) with PSII photosynthetic
conversion efficiency (Fv/Fm(0)) (Figure V-13). Even though there are definitive
differences under N-limitation in carotenoid content (Figure V-2) and are likely
changes in RuBisCO activity (Geider et al., 1998), overall these factors may be
less important in regulating φC,max under N-limitation for S. costatum. The specific
vulnerability of PSII to N-limitation is consistent with previous observations
(Kolber et al., 1988; Berges et al., 1996). By association, because absorption
(σChla) remains relatively constant, greater than 90% of the variability in α* is
explained by Fv/Fm(0) variability.
Similar to α* analyses, Pbmax can be described as the product of the
concentration of photosynthetic units (1/E&A) and the turnover rate of the units
(1/τPSU) (see methods). In the present study, 1/τPSU dominates Pbmax variability
with only minor contributions from changes in E&A (Figure V-14). Although
1/τPSU and Pbmax are not truly independent variables, the lack of a strong
correlation (r2=0.27) between E&A and Pbmax, which are independent, suggests
that it is the functionality of the units and not the relative concentrations of the
units per se that dominantly determines light-saturated photosynthesis under N-
limitation for S. costatum. This is consistent with observations under nutrient-
replete conditions that suggest that Pbmax may be limited by RuBisCO, which in
turn affects 1/τPSU (Sukenik et al., 1987; Stitt and Schulze, 1994).
The lack of a strong relationship between E&A and Pbmax is intriguing in
light of dramatic reductions in Fv/Fm(0). The reduction in Fv/Fm(0), but no
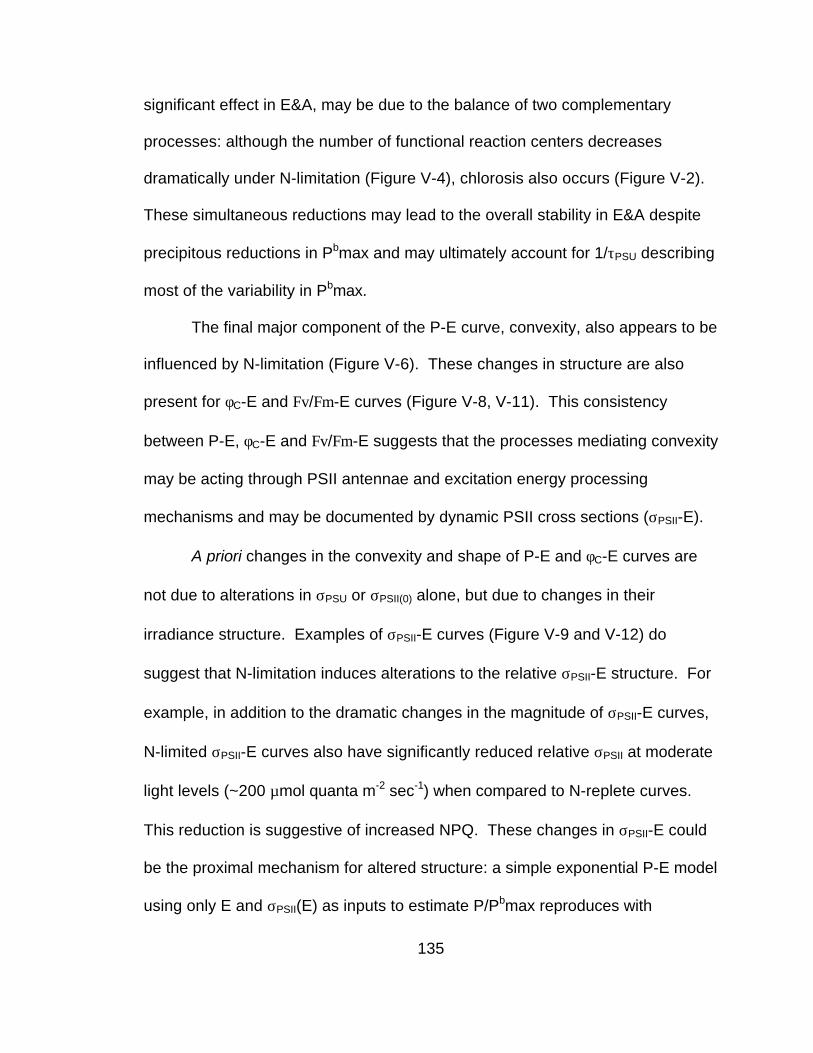
135
significant effect in E&A, may be due to the balance of two complementary
processes: although the number of functional reaction centers decreases
dramatically under N-limitation (Figure V-4), chlorosis also occurs (Figure V-2).
These simultaneous reductions may lead to the overall stability in E&A despite
precipitous reductions in Pbmax and may ultimately account for 1/τPSU describing
most of the variability in Pbmax.
The final major component of the P-E curve, convexity, also appears to be
influenced by N-limitation (Figure V-6). These changes in structure are also
present for φC-E and Fv/Fm-E curves (Figure V-8, V-11). This consistency
between P-E, φC-E and Fv/Fm-E suggests that the processes mediating convexity
may be acting through PSII antennae and excitation energy processing
mechanisms and may be documented by dynamic PSII cross sections (σPSII-E).
A priori changes in the convexity and shape of P-E and φC-E curves are
not due to alterations in σPSU or σPSII(0) alone, but due to changes in their
irradiance structure. Examples of σPSII-E curves (Figure V-9 and V-12) do
suggest that N-limitation induces alterations to the relative σPSII-E structure. For
example, in addition to the dramatic changes in the magnitude of σPSII-E curves,
N-limited σPSII-E curves also have significantly reduced relative σPSII at moderate
light levels (~200 µmol quanta m-2 sec-1) when compared to N-replete curves.
This reduction is suggestive of increased NPQ. These changes in σPSII-E could
be the proximal mechanism for altered structure: a simple exponential P-E model
using only E and σPSII(E) as inputs to estimate P/Pbmax reproduces with

136
considerable fidelity the differences between N-replete and N-limited relative P-E
curves (data not shown). These results also imply that PSII-specific processes
are largely responsible for changes in the shape of the relative P-E curve under
N-limitation.
Related to α*, Pbmax and convexity is the N-limitation induced lateral shift
in P-E, φC-E and Fv/Fm-E curves and associated alterations to σPSII-E curves.
From the above data and previous studies, in the context of N-limitation there are
two major processes acting to modify the shape and magnitude of the P-E
relationship including (1) reductions in efficiency from both reductions in
functional reaction centers and turnover time and (2) increases in σPSII(0).
However, only turnover time and σPSII(0) are potentially responsible for the lateral
shift; reaction center functionality does not directly affect the shape of P-E
curves. When P-E curves are normalized, which removes the contribution of
turnover time to curve variability, there is still a lateral shift in P-E curves. This
suggests that the shifts in normalized P-E curves and Fv/Fm-E and φC-E curves
from high to low light under N-limitation is a result of changes to cross section.
Indeed, σPSII(0) increases significantly from N-replete to N-limited conditions.
Taken together, comparisons between α*, Pbmax and convexity and PSII
analytic components implies that N-limitation affects PSII and that variability in
PSII-specific processes like Fv/Fm and σPSII describe well the efficiency and
relative structure of P-E curves as a whole. Direct comparisons between Fv/Fm
and φC over a wide-range of background light levels support this for

137
photosynthetic efficiency (Figure V-15). However, it is important to note that this
relationship does partially breakdown at low efficiency values associated with
high irradiance levels (positive Fv/Fm(x) intercept in Figure V-15). This may be
due to non-linear electron throughput of PSII from cyclic electron flow around
PSII (Falkowski et al., 1986; Prasil et al., 1996) or other processes (Whitmarsh et
al., 1994). Nevertheless, in spite of slight deviations, the overall Fv/Fm(x)-φC(x)
relationship is strong.
Consistent with strong Fv/Fm - φC correlations, fluorescence-derived
photosynthetic rates are also strongly correlated with measured rates when using
a known Pbmax (Figure V-16). Further, fluorescence-derived maximum
photosynthetic rates have similar patterns to observed Pbmax (Figure V-17).
However, the uncoupling of these two measurements at the initiation of and
recovery from N-limitation suggests that this correlation may be due to the
simultaneous reduction in PSII electron transport and turnover time and not due
to Pbmax limitation by PSII electron transport per se (Genty and Harbinson,
1996). The uncoupling of maximum PSII and photosynthetic rates may also be
indicative of small changes in the convexity of the P-E curve.
Fluorescence measures of photosynthetic rates and efficiency are focused
on variability in the function and functional structure of PSII. Several components
downstream of PSII in the photosynthetic electron transport chain, notably
RuBisCO concentrations and turnover, are severely influenced by N-limitation.
Thus, while PSII measures of φC-E and P-E structure are robust because PSII
regulates their structure under N-replete and -limited conditions, the relationship

138
between fluorescence-measured parameters and σPSU, 1/τPSU and Pbmax
(absolute P-E structure) are not robust because they are not solely regulated by
PSII-specific processes.
CONCLUSIONS
N-limitation induces dramatic changes in the photosynthetic biomass and
physiology of Skeletonema costatum. Reductions in maximal quantum efficiency
(φC,max) are largely driven by reductions in photosystem II conversion efficiency
(Fv/Fm(0)). Reductions in Fv/Fm(0) also lead to increases in PSII cross sectional
area (σPSII(0)) because of the partial interconnectedness of photosynthetic units.
Further, both Fv/Fm-E and φC-E efficiency curves, which are shifted to lower
irradiances under N-limitation, are consistent with altered σPSII(0) and σPSII-E
curves. This suggests that photosynthetic efficiency is dominated by PSII-
specific processes. Relative P-E curves (and associated α*) are also consistent
with σPSII-E. However, unlike σPSII(0) and inconsistent with φC-E, Fv/Fm-E and
relative P-E, photosynthetic unit cross sections (σPSU) are reduced under N-
limitation. Values of σPSU deviate from the other parameters because they are
significantly affected by decreased photosynthetic unit turnover rates (1/τPSU).
These reductions in 1/τPSU are likely due to previously described changes in
RuBisCO content and function under N-limitation and are not robustly quantified
by PSII measurements. Combined, these results support a general regulatory
role of PSII in photosynthetic efficiency under N-limitation. In the context of non-

139
steady state N-limitation, PSII-specific processes describe well φC-E and relative
P-E curves, but do not describe well absolute P-E curves because processes not
linked to PSII such as RuBisCO concentration and turnover appear to be
regulating Pbmax.
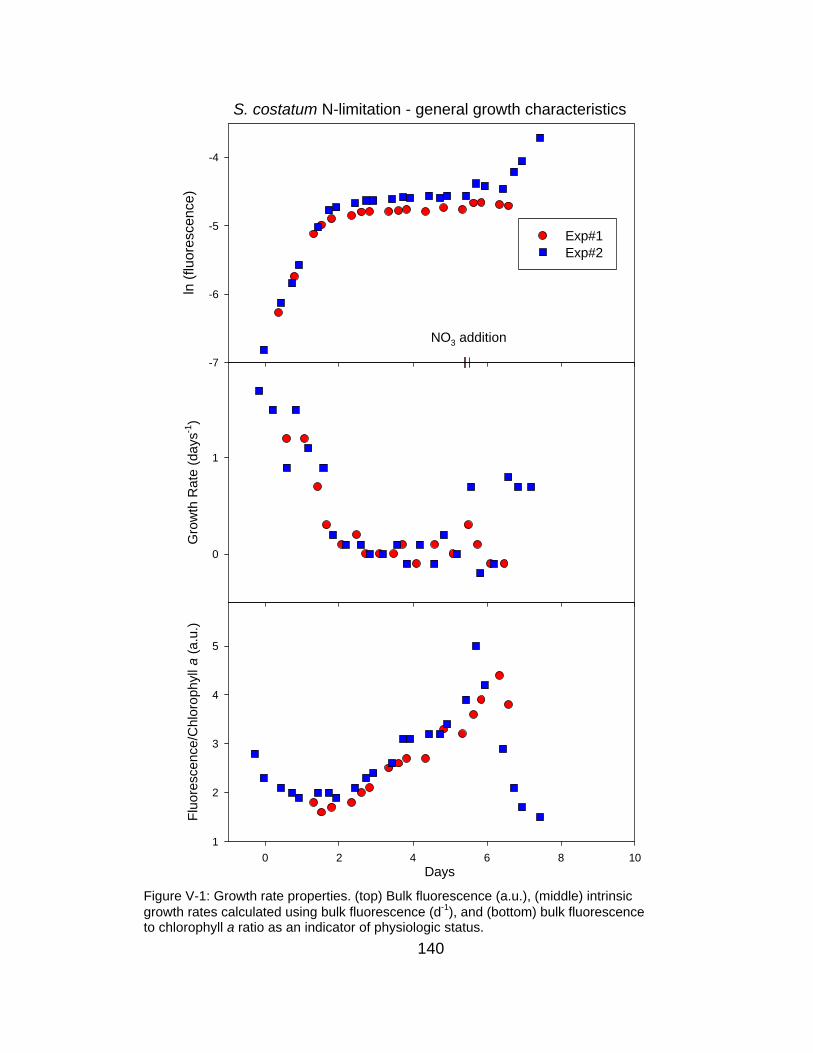
140
ln (
fluor
esce
nce)
-7
-6
-5
-4
Exp#1 Exp#2
Gro
wth
Rat
e (d
ays-1
)
0
1
Days0 2 4 6 8 10
Flu
ores
cenc
e/C
hlor
ophy
ll a
(a.u
.)
1
2
3
4
5
S. costatum N-limitation - general growth characteristics
NO3 addition
Figure V-1: Growth rate properties. (top) Bulk fluorescence (a.u.), (middle) intrinsicgrowth rates calculated using bulk fluorescence (d-1), and (bottom) bulk fluorescenceto chlorophyll a ratio as an indicator of physiologic status.

141
S. costatum N-limitation - Pigments
NO3 addition
g C
hlor
ophy
ll a
/ cel
l
0
1e-13
2e-13
3e-13
4e-13
Exp#1Exp#2
Chl
orop
hyll
c/a
(g/g
)
0.10
0.12
0.14
0.16
0.18
0.20
Days0 2 4 6 8 10
Car
oten
oids
/ C
hlor
ophy
ll a
(g/g
)
0.3
0.4
0.5
0.6
0.7
Figure V-2: Pigmentation properties. (top) Cellular chlorophyll a concentration (g cell-1),(middle) relative chlorophyll c concentrations (g Chl c g Chl a-1) and (bottom) relativecarotenoid concentrations (g Car. g Chl a-1).

142
σ Chl
a (m
2 mg
Chl
a-1
)
0.008
0.010
0.012
0.014
0.016
Exp#1Exp#2
σ cell (
m2 c
ell-1
)
0
1e-12
2e-12
3e-12
4e-12
S. costatum N-limitation - Absorption Cross Sections
NO3 addition
Figure V-3: Absorption properties. (top) Cellular absorption cross-section (m2 cell-1),(middle) chlorophyll a specific absorption cross section (m2 mg Chl a-1) and (bottom)photosynthetic unit cross section (m2 quanta-1).
Days0 2 4 6 8 10
σ PS
U (
m2 µ
mol
qua
nta-1
)
0.0
0.5
1.0
1.5
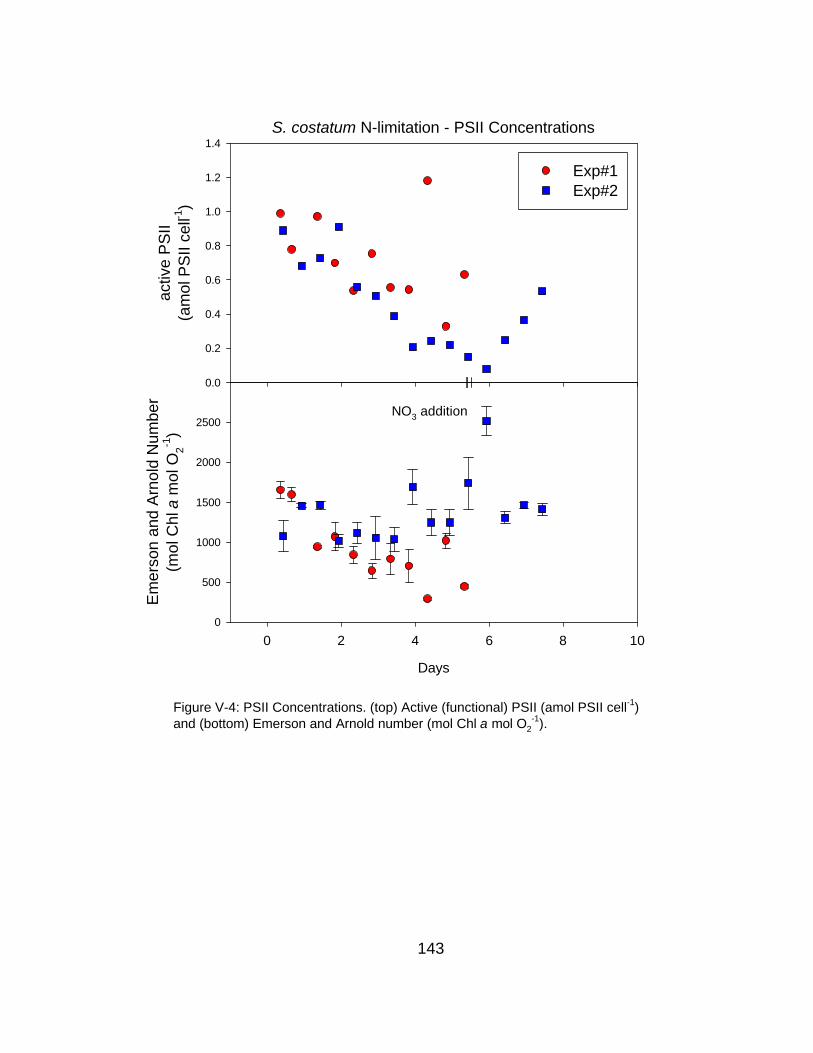
143
Days
0 2 4 6 8 10
Em
erso
n an
d A
rnol
d N
umbe
r(m
ol C
hl a
mol
O2-1
)
0
500
1000
1500
2000
2500
Exp#1Exp#2
S. costatum N-limitation - PSII Concentrations
NO3 addition
activ
e P
SII
(am
ol P
SII
cell-1
)
0.0
0.2
0.4
0.6
0.8
1.0
1.2
1.4
Figure V-4: PSII Concentrations. (top) Active (functional) PSII (amol PSII cell-1)and (bottom) Emerson and Arnold number (mol Chl a mol O2
-1).
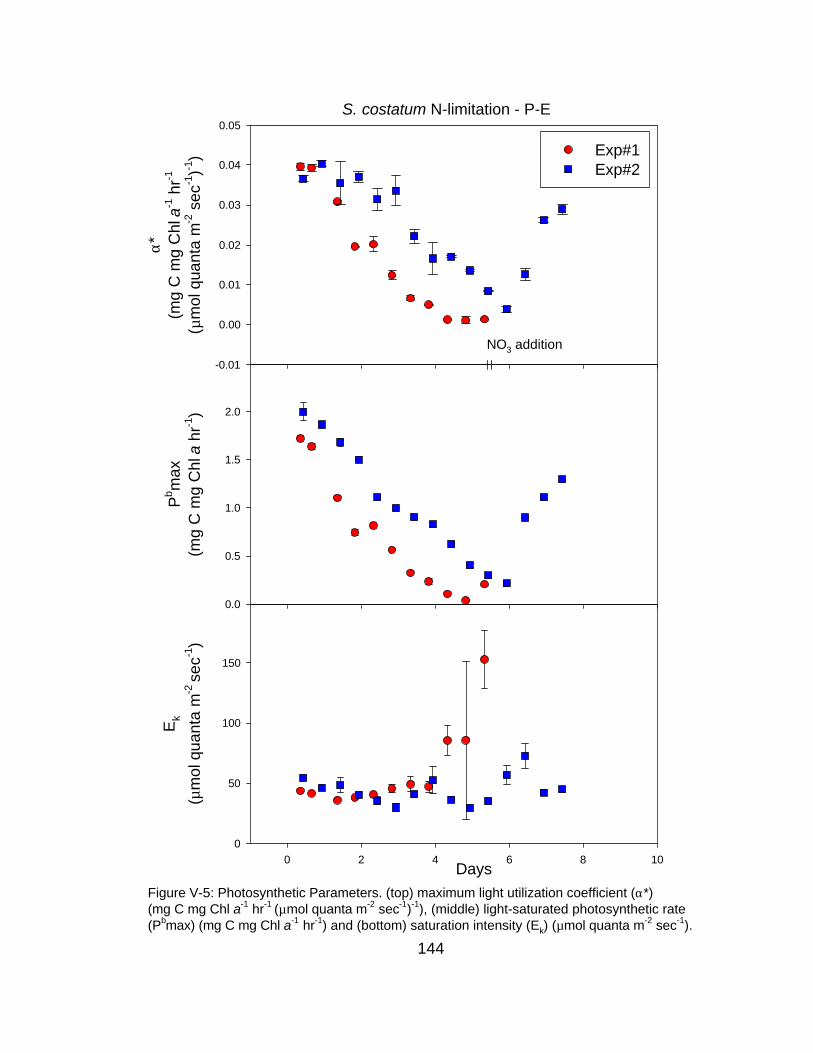
144
α*
(mg
C m
g C
hl a
-1 h
r-1
(µm
ol q
uant
a m
-2 s
ec-1
)-1)
-0.01
0.00
0.01
0.02
0.03
0.04
0.05
Exp#1Exp#2
Pb m
ax(m
g C
mg
Chl
a h
r-1)
0.0
0.5
1.0
1.5
2.0
Days0 2 4 6 8 10
Ek
(µm
ol q
uant
a m
-2 se
c-1)
0
50
100
150
S. costatum N-limitation - P-E
NO3 addition
Figure V-5: Photosynthetic Parameters. (top) maximum light utilization coefficient (α*)(mg C mg Chl a-1 hr-1 (µmol quanta m-2 sec-1)-1), (middle) light-saturated photosynthetic rate(Pbmax) (mg C mg Chl a-1 hr-1) and (bottom) saturation intensity (Ek) (µmol quanta m-2 sec-1).
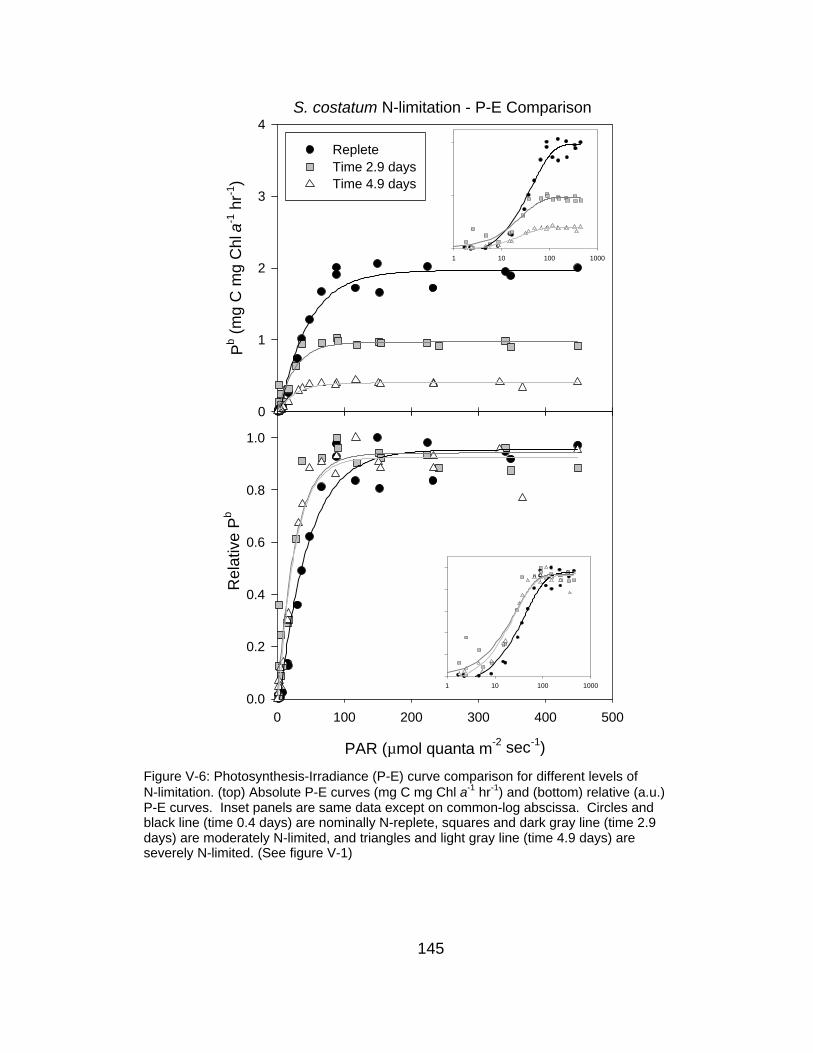
145
S. costatum N-limitation - P-E Comparison
Pb (
mg
C m
g C
hl a
-1 h
r-1)
0
1
2
3
4
RepleteTime 2.9 daysTime 4.9 days
PAR (µmol quanta m-2 sec-1)
0 100 200 300 400 500
Rel
ativ
e P
b
0.0
0.2
0.4
0.6
0.8
1.0
1 10 100 1000
1 10 100 1000
Figure V-6: Photosynthesis-Irradiance (P-E) curve comparison for different levels ofN-limitation. (top) Absolute P-E curves (mg C mg Chl a-1 hr-1) and (bottom) relative (a.u.)P-E curves. Inset panels are same data except on common-log abscissa. Circles andblack line (time 0.4 days) are nominally N-replete, squares and dark gray line (time 2.9days) are moderately N-limited, and triangles and light gray line (time 4.9 days) areseverely N-limited. (See figure V-1)
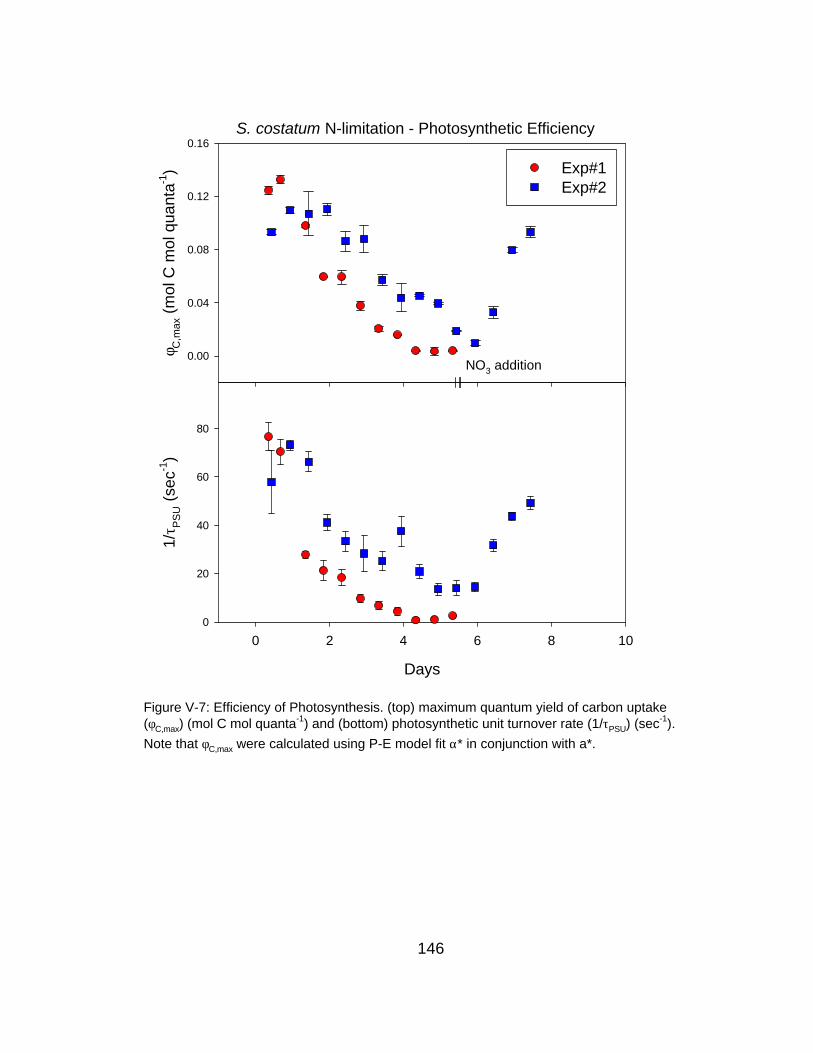
146
φ C,m
ax (
mol
C m
ol q
uant
a-1)
0.00
0.04
0.08
0.12
0.16
Exp#1Exp#2
Days
0 2 4 6 8 10
1/τ P
SU (
sec-1
)
0
20
40
60
80
S. costatum N-limitation - Photosynthetic Efficiency
NO3 addition
Figure V-7: Efficiency of Photosynthesis. (top) maximum quantum yield of carbon uptake(φC,max) (mol C mol quanta-1) and (bottom) photosynthetic unit turnover rate (1/τPSU) (sec-1).
Note that φC,max were calculated using P-E model fit α* in conjunction with a*.
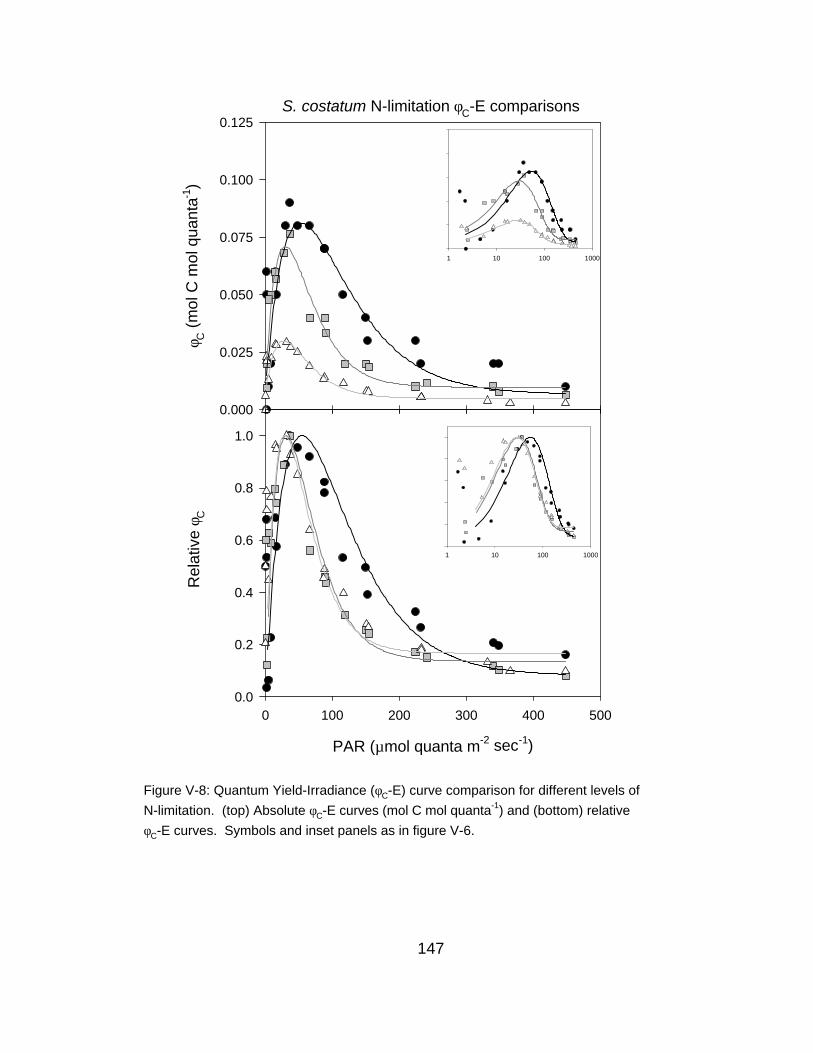
147
S. costatum N-limitation φC-E comparisons
φ C (
mol
C m
ol q
uant
a-1)
0.000
0.025
0.050
0.075
0.100
0.125
PAR (µmol quanta m-2 sec-1)
0 100 200 300 400 500
Rel
ativ
e φ C
0.0
0.2
0.4
0.6
0.8
1.0
1 10 100 1000
1 10 100 1000
Figure V-8: Quantum Yield-Irradiance (φC-E) curve comparison for different levels of
N-limitation. (top) Absolute φC-E curves (mol C mol quanta-1) and (bottom) relative
φC-E curves. Symbols and inset panels as in figure V-6.
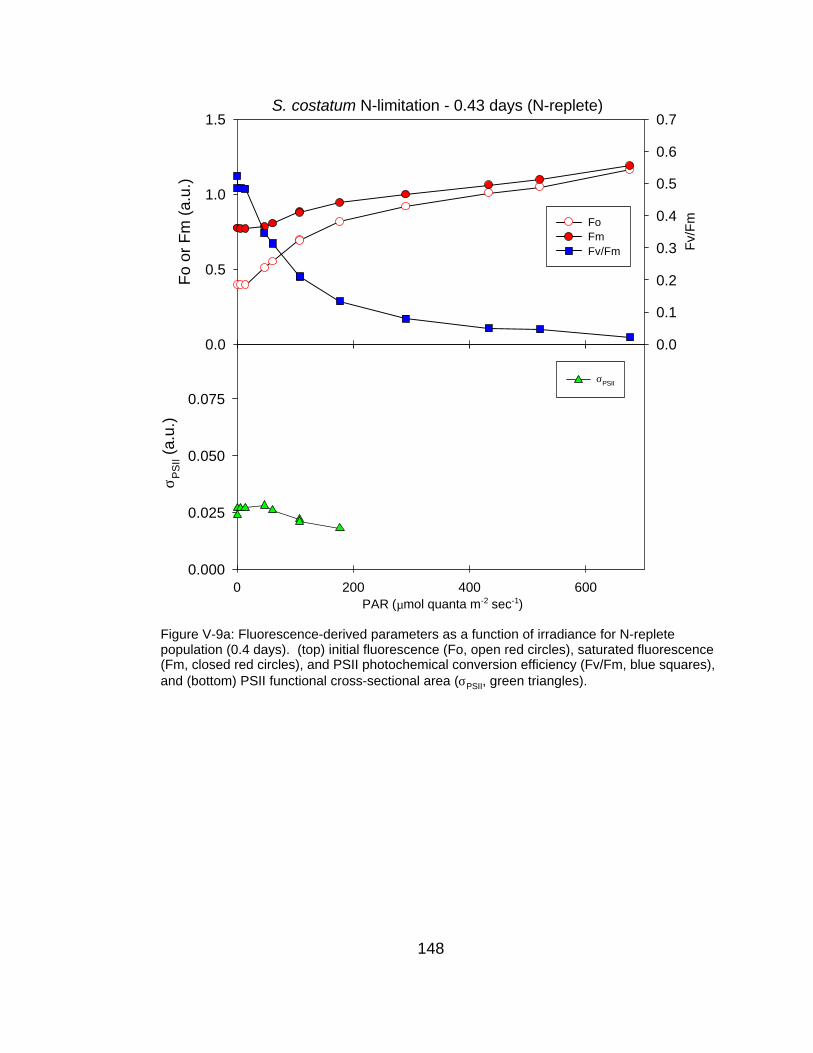
148
S. costatum N-limitation - 0.43 days (N-replete)
Fo
or F
m (
a.u.
)
0.0
0.5
1.0
1.5
Fv/
Fm
0.0
0.1
0.2
0.3
0.4
0.5
0.6
0.7
FoFmFv/Fm
PAR (µmol quanta m-2 sec-1)0 200 400 600
σ PS
II (a
.u.)
0.000
0.025
0.050
0.075
σPSII
Figure V-9a: Fluorescence-derived parameters as a function of irradiance for N-repletepopulation (0.4 days). (top) initial fluorescence (Fo, open red circles), saturated fluorescence(Fm, closed red circles), and PSII photochemical conversion efficiency (Fv/Fm, blue squares),and (bottom) PSII functional cross-sectional area (σPSII, green triangles).
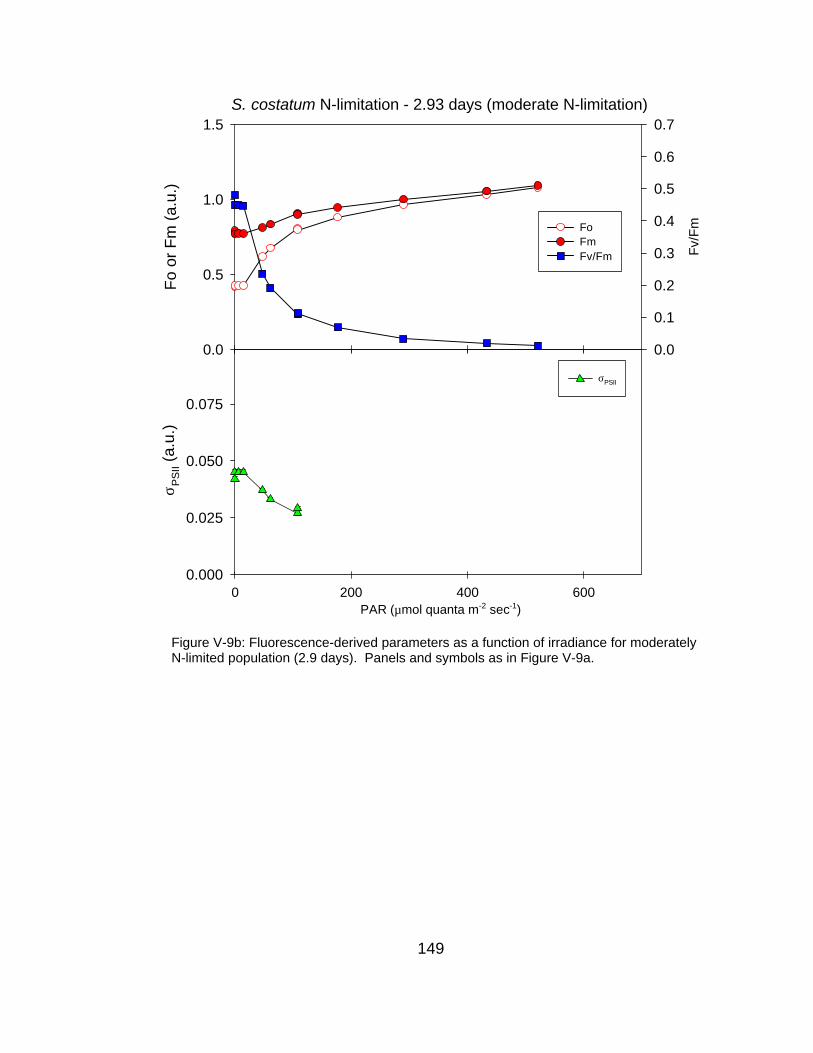
149
S. costatum N-limitation - 2.93 days (moderate N-limitation)
Fo
or F
m (
a.u.
)
0.0
0.5
1.0
1.5
Fv/
Fm
0.0
0.1
0.2
0.3
0.4
0.5
0.6
0.7
FoFmFv/Fm
PAR (µmol quanta m-2 sec-1)0 200 400 600
σ PS
II (a
.u.)
0.000
0.025
0.050
0.075
σPSII
Figure V-9b: Fluorescence-derived parameters as a function of irradiance for moderatelyN-limited population (2.9 days). Panels and symbols as in Figure V-9a.
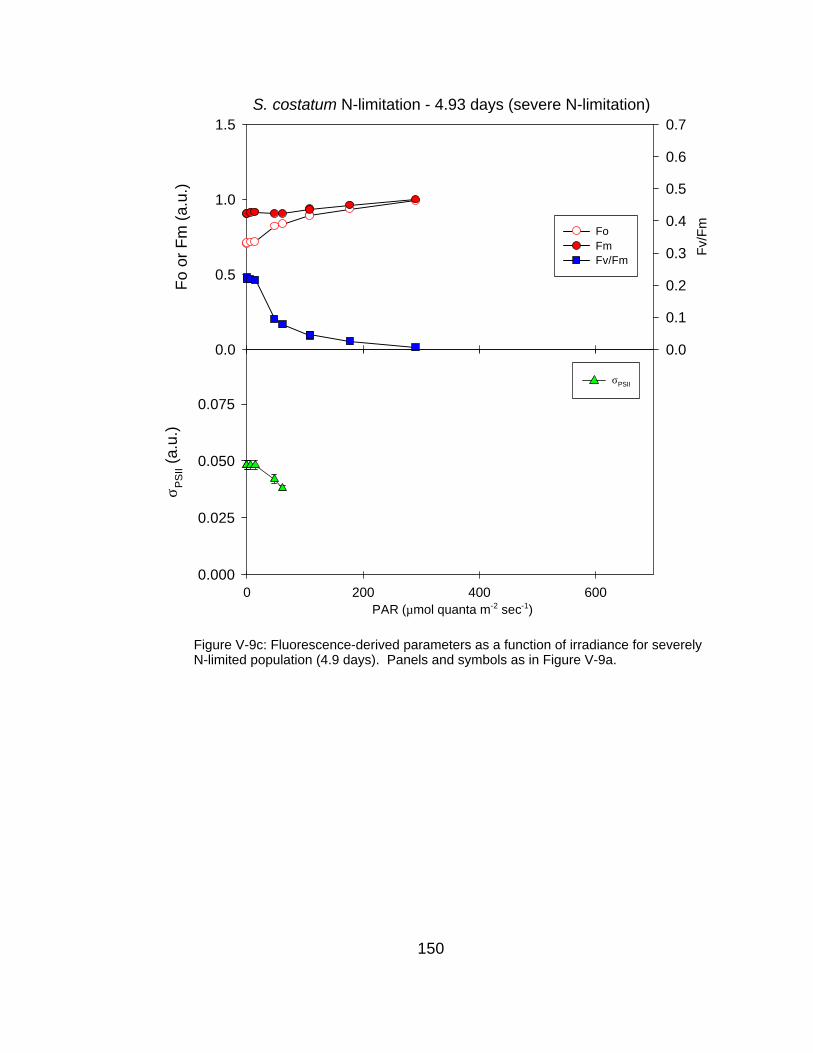
150
S. costatum N-limitation - 4.93 days (severe N-limitation)
Fo
or F
m (
a.u.
)
0.0
0.5
1.0
1.5
Fv/
Fm
0.0
0.1
0.2
0.3
0.4
0.5
0.6
0.7
FoFmFv/Fm
PAR (µmol quanta m-2 sec-1)0 200 400 600
σ PS
II (a
.u.)
0.000
0.025
0.050
0.075
σPSII
Figure V-9c: Fluorescence-derived parameters as a function of irradiance for severelyN-limited population (4.9 days). Panels and symbols as in Figure V-9a.
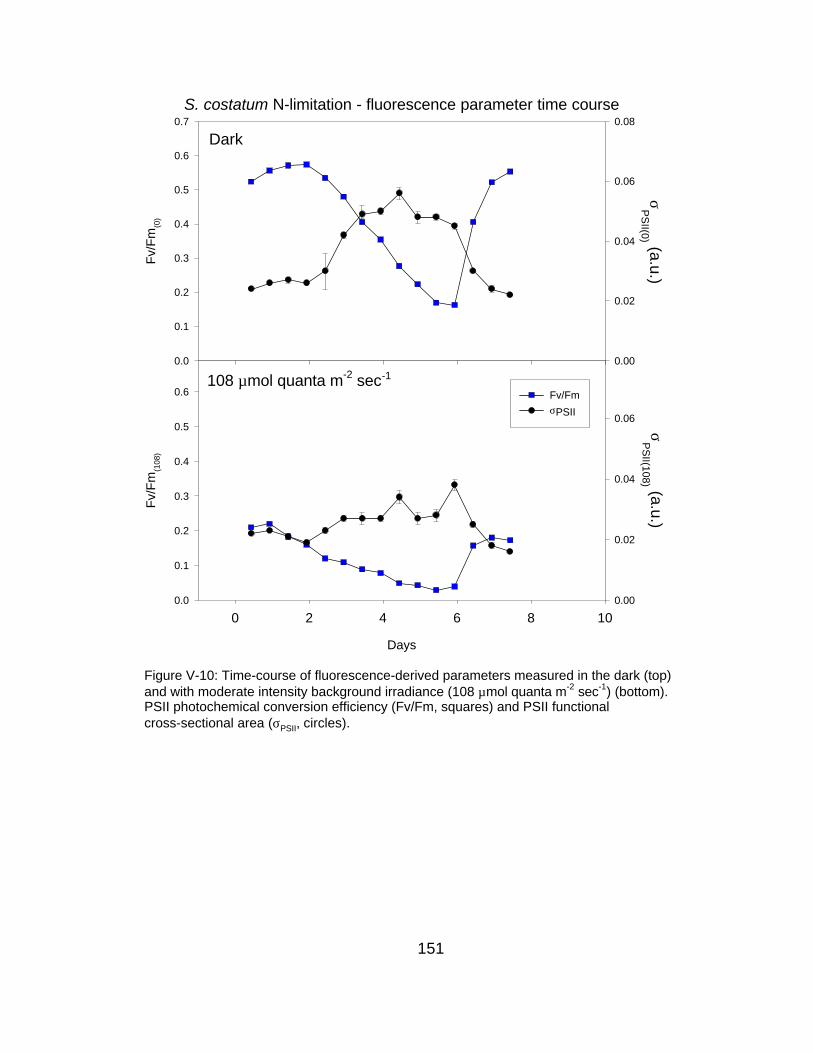
151
S. costatum N-limitation - fluorescence parameter time course
Fv/
Fm
(0)
0.0
0.1
0.2
0.3
0.4
0.5
0.6
0.7
σP
SII(0) (a.u.)
0.00
0.02
0.04
0.06
0.08
Fv/FmσPSII
Figure V-10: Time-course of fluorescence-derived parameters measured in the dark (top)and with moderate intensity background irradiance (108 µmol quanta m-2 sec-1) (bottom).PSII photochemical conversion efficiency (Fv/Fm, squares) and PSII functionalcross-sectional area (σPSII, circles).
Days
0 2 4 6 8 10
Fv/
Fm
(108
)
0.0
0.1
0.2
0.3
0.4
0.5
0.6
σP
SII(108) (a.u.)
0.00
0.02
0.04
0.06
Dark
108 µmol quanta m-2 sec-1
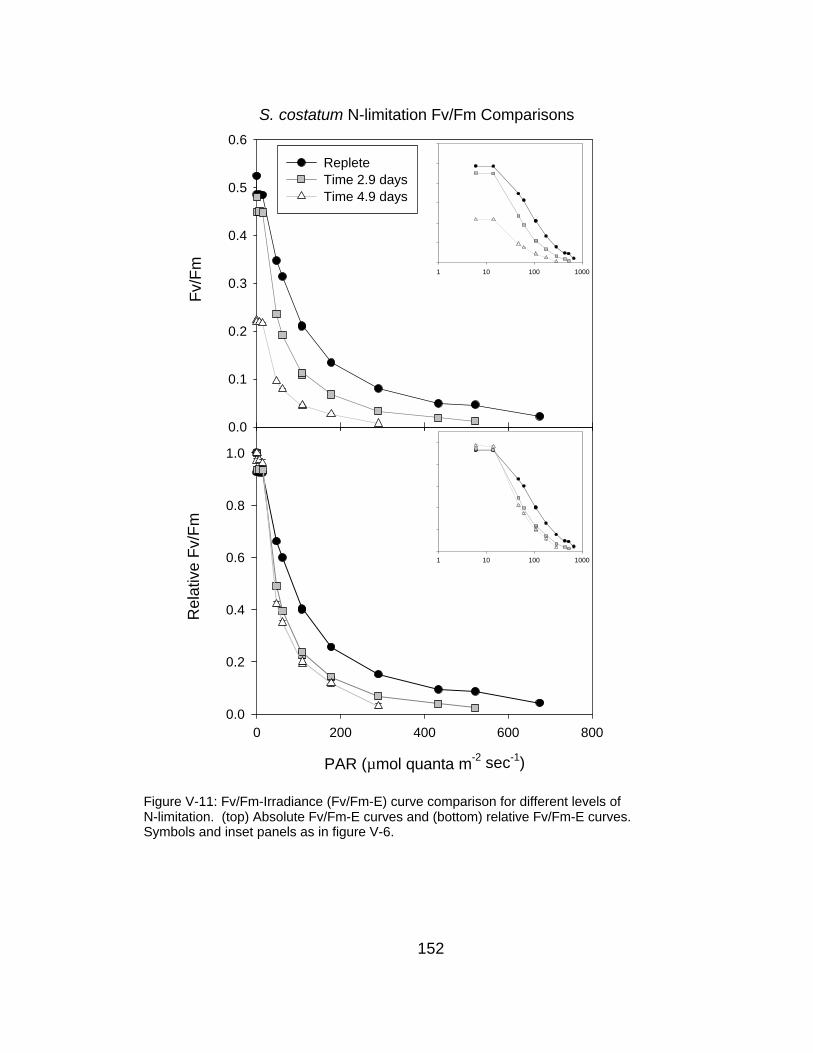
152
S. costatum N-limitation Fv/Fm Comparisons
Fv/
Fm
0.0
0.1
0.2
0.3
0.4
0.5
0.6
RepleteTime 2.9 daysTime 4.9 days
PAR (µmol quanta m-2 sec-1)
0 200 400 600 800
Rel
ativ
e F
v/F
m
0.0
0.2
0.4
0.6
0.8
1.0
1 10 100 1000
1 10 100 1000
Figure V-11: Fv/Fm-Irradiance (Fv/Fm-E) curve comparison for different levels ofN-limitation. (top) Absolute Fv/Fm-E curves and (bottom) relative Fv/Fm-E curves.Symbols and inset panels as in figure V-6.
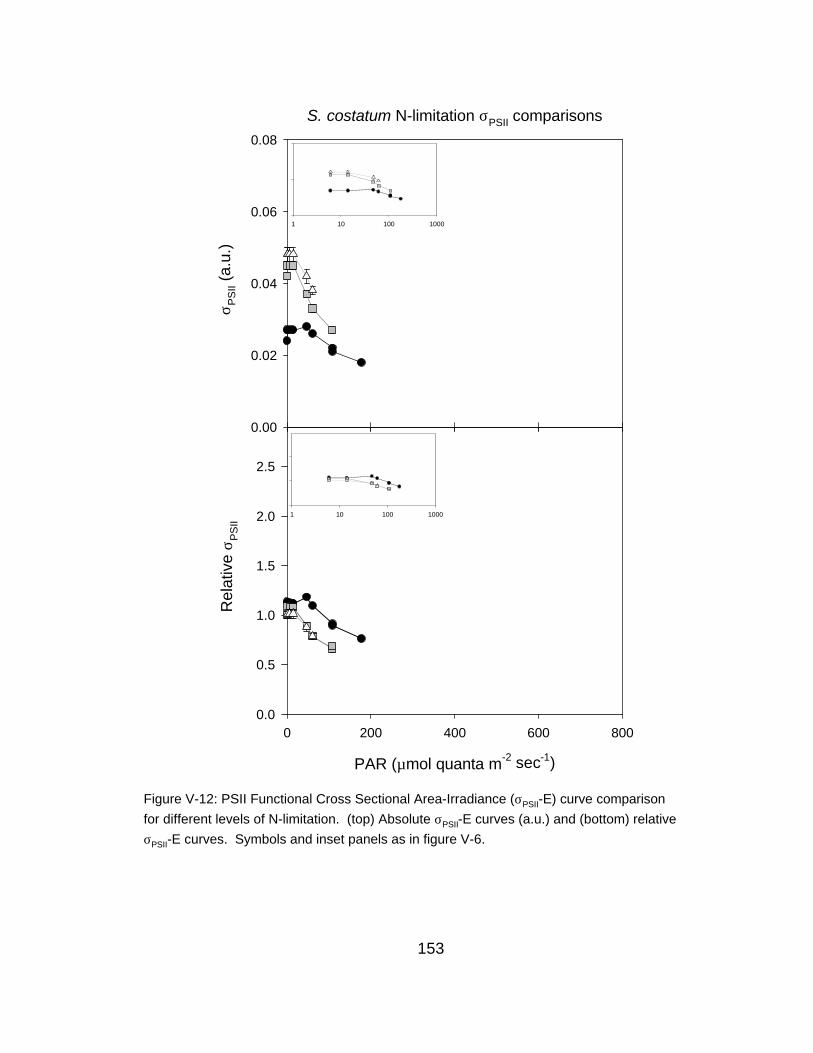
153
S. costatum N-limitation σPSII comparisons
σ PS
II (a
.u.)
0.00
0.02
0.04
0.06
0.08
PAR (µmol quanta m-2 sec-1)
0 200 400 600 800
Rel
ativ
e σ P
SII
0.0
0.5
1.0
1.5
2.0
2.5
1 10 100 1000
1 10 100 1000
Figure V-12: PSII Functional Cross Sectional Area-Irradiance (σPSII-E) curve comparison
for different levels of N-limitation. (top) Absolute σPSII-E curves (a.u.) and (bottom) relative
σPSII-E curves. Symbols and inset panels as in figure V-6.
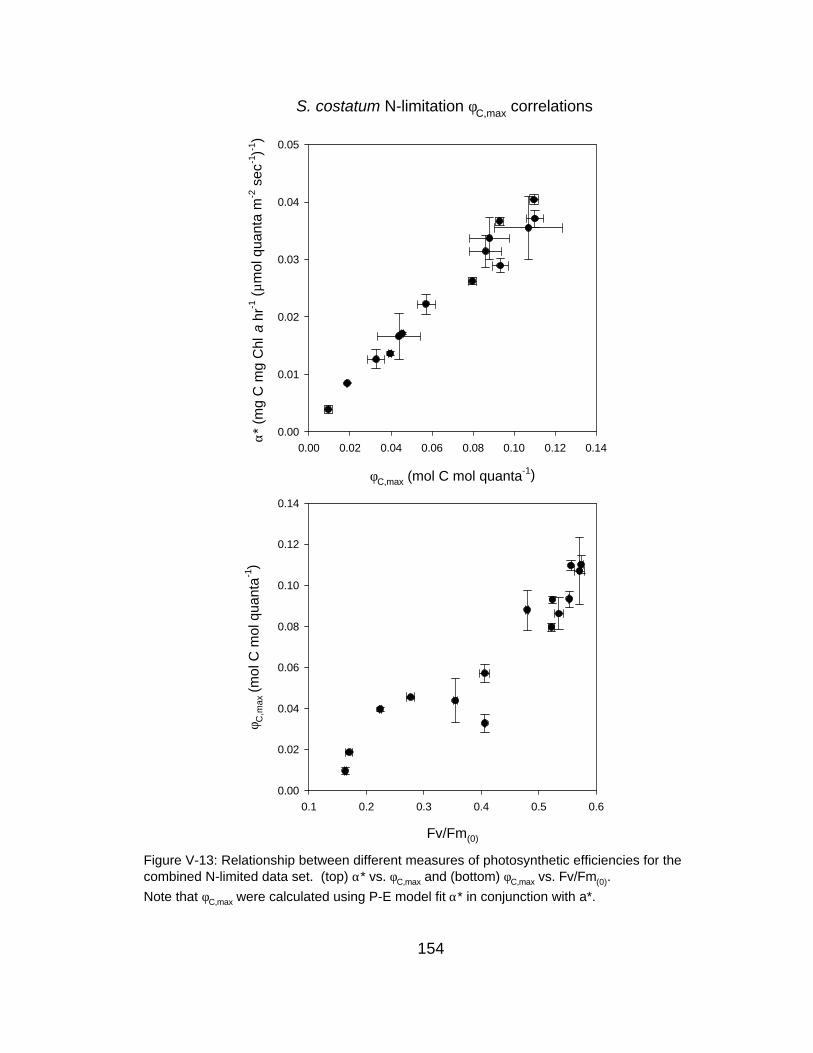
154
φC,max (mol C mol quanta-1)
0.00 0.02 0.04 0.06 0.08 0.10 0.12 0.14
α*
(mg
C m
g C
hl a
hr-1
(µ m
ol q
uant
a m
-2 s
ec-1
)-1)
0.00
0.01
0.02
0.03
0.04
0.05
S. costatum N-limitation φC,max correlations
Fv/Fm(0)
0.1 0.2 0.3 0.4 0.5 0.6
φ C,m
ax (
mol
C m
ol q
uant
a-1
)
0.00
0.02
0.04
0.06
0.08
0.10
0.12
0.14
Figure V-13: Relationship between different measures of photosynthetic efficiencies for thecombined N-limited data set. (top) α* vs. φC,max and (bottom) φC,max vs. Fv/Fm(0).
Note that φC,max were calculated using P-E model fit α* in conjunction with a*.
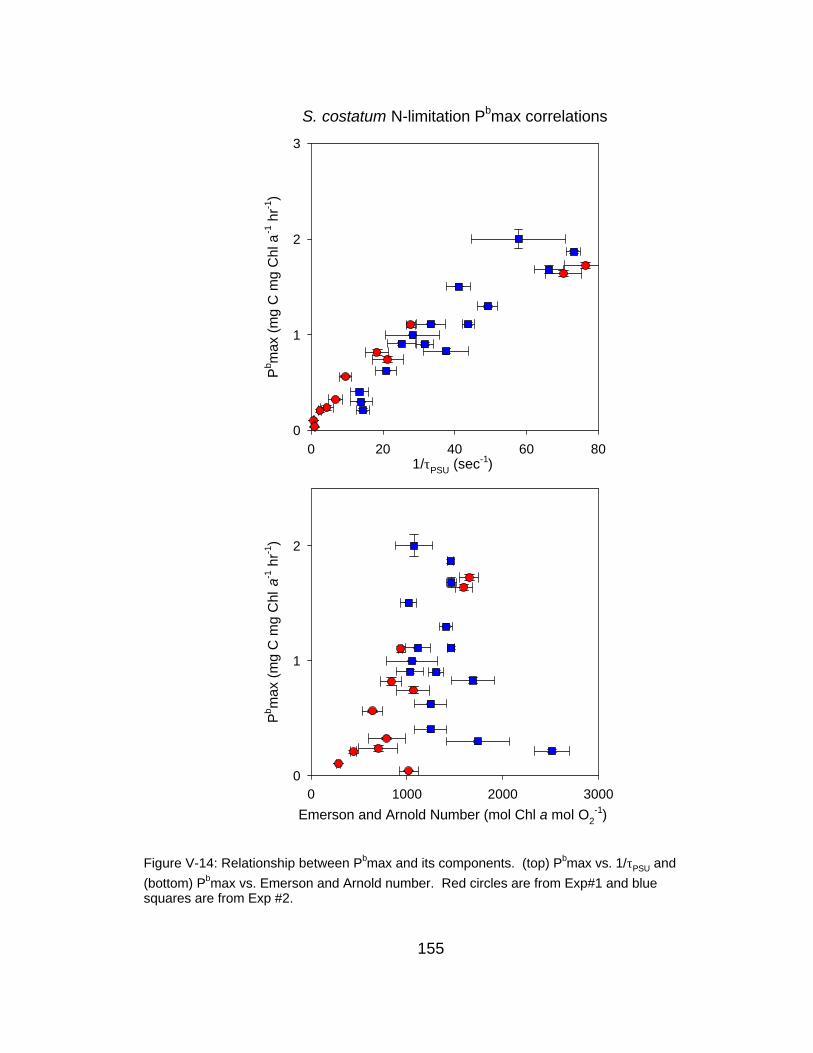
155
S. costatum N-limitation Pbmax correlations
Emerson and Arnold Number (mol Chl a mol O2-1)
0 1000 2000 3000
Pb m
ax (
mg
C m
g C
hl a
-1 h
r-1)
0
1
2
1/τPSU (sec-1)0 20 40 60 80
Pb m
ax (
mg
C m
g C
hl a
-1 h
r-1)
0
1
2
3
Figure V-14: Relationship between Pbmax and its components. (top) Pbmax vs. 1/τPSU and
(bottom) Pbmax vs. Emerson and Arnold number. Red circles are from Exp#1 and bluesquares are from Exp #2.
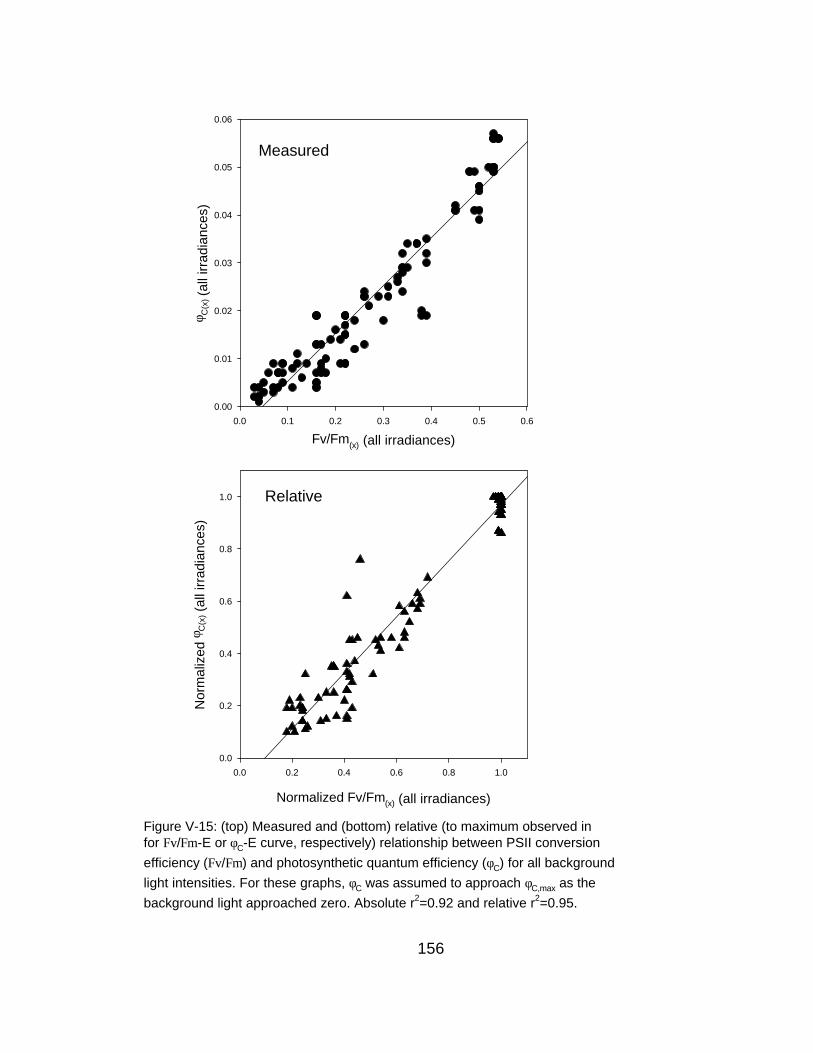
156
Measured
Fv/Fm(x) (all irradiances)
0.0 0.1 0.2 0.3 0.4 0.5 0.6
φ C(x
) (al
l irr
adia
nces
)
0.00
0.01
0.02
0.03
0.04
0.05
0.06
Relative
Normalized Fv/Fm(x) (all irradiances)
0.0 0.2 0.4 0.6 0.8 1.0
Nor
mal
ized
φC
(x) (
all i
rrad
ianc
es)
0.0
0.2
0.4
0.6
0.8
1.0
Figure V-15: (top) Measured and (bottom) relative (to maximum observed infor Fv/Fm-E or φC-E curve, respectively) relationship between PSII conversion
efficiency (Fv/Fm) and photosynthetic quantum efficiency (φC) for all background
light intensities. For these graphs, φC was assumed to approach φC,max as the
background light approached zero. Absolute r2=0.92 and relative r2=0.95.
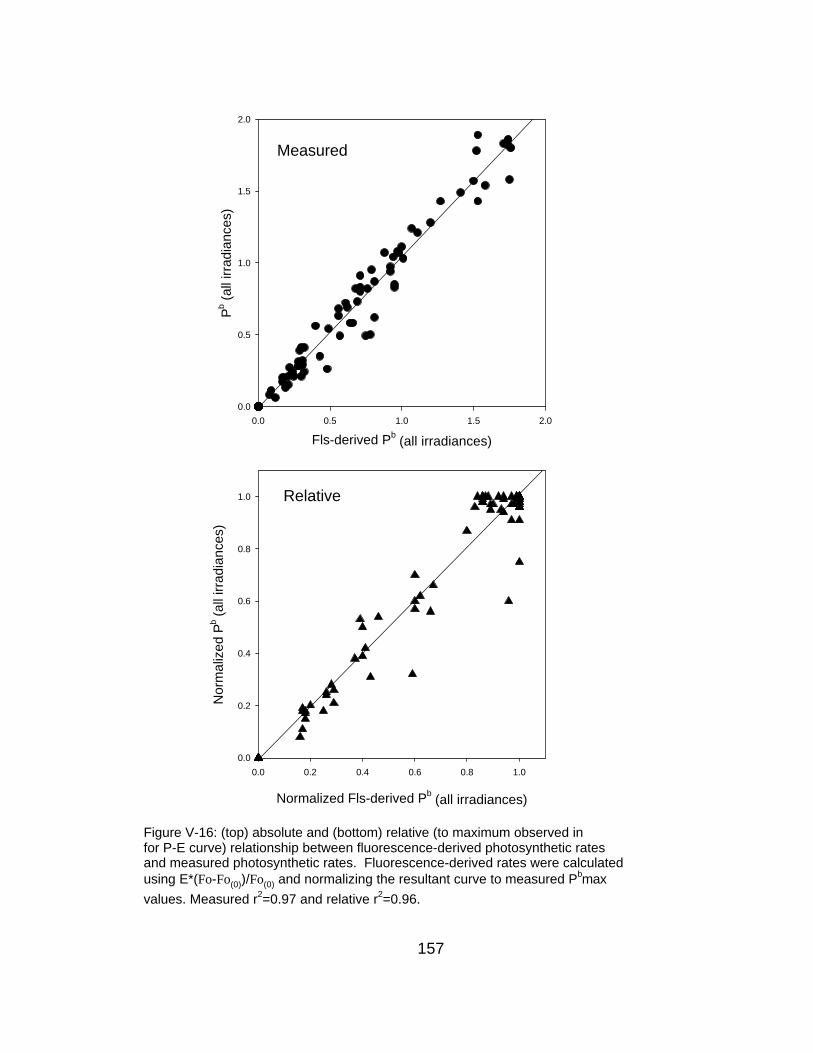
157
Measured
Fls-derived Pb (all irradiances)
0.0 0.5 1.0 1.5 2.0
Pb (
all i
rrad
ianc
es)
0.0
0.5
1.0
1.5
2.0
Relative
Normalized Fls-derived Pb (all irradiances)
0.0 0.2 0.4 0.6 0.8 1.0
Nor
mal
ized
Pb (
all i
rrad
ianc
es)
0.0
0.2
0.4
0.6
0.8
1.0
Figure V-16: (top) absolute and (bottom) relative (to maximum observed infor P-E curve) relationship between fluorescence-derived photosynthetic ratesand measured photosynthetic rates. Fluorescence-derived rates were calculatedusing E*(Fo-Fo(0))/Fo(0) and normalizing the resultant curve to measured Pbmax
values. Measured r2=0.97 and relative r2=0.96.

158
Days
0 2 4 6 8
Pb m
ax (
mg
C m
g C
hl a
-1 h
r-1)
0
1
2
3
Relative F
luorescence-derived Maxim
um R
atePbmaxFls
Figure V-17: Time course comparison between maximum measured photosynthetic rateand maximum fluorescence-derived rate. Fluorescence rates calculated as Figure V-16.Both rates are correlated at r2=0.69.

159
Chapter VI
Conclusions
160
INTRODUCTION
Excitation energy from light absorption by marine phytoplankton has three fates
including non-radiative dissipation (heat), photochemistry and fluorescence. The
distribution of excitation energy to each of these processes can be modeled
using one of several models of exciton flow including the bipartite model, tripartite
model and the reversible radical pair model, among others (Butler and Kitajima,
1975; Butler and Strasser, 1977; Schatz et al., 1988; LaVergne and Trissl, 1995;
Lazar, 1999). Using these types of relationships, it can be demonstrated that the
ability of the PSII reaction center to send electrons through the primary quinone
regulates both fluorescence and photochemistry, and since these pathways are
mutually exclusive, photochemical and fluorescence yields are approximately
inversely related to each other (Duysens and Sweers, 1963; Malkin and Kok,
1966; Bonaventura and Myers, 1969; Butler, 1972).
Taking advantage of this property, several equations have been
formulated that use parameters derived from fluorescence induction curves
measured in the presence and absence of light to formalize this fluorescence -
photochemistry relationship (Weis and Berry, 1987; Genty et al., 1989; Seaton
and Walker, 1990; Falkowski and Kolber, 1993). Each of these equations has
demonstrated a great deal of homology with observations (Seaton and Walker,
1992). From the success of the equations in combination with the fact that room
temperature fluorescence is almost exclusively associated with photosystem II
(Geacintov and Breton, 1987) variability in photochemistry has largely been
ascribed to PSII-dependent processes (Fasham and Platt, 1983; Geider and
161
Osborne, 1992; Falkowski and Raven, 1997). The dependence of photosynthetic
rates and efficiency on PSII processes may be heightened in the context of
marine photosynthesis since typical sources of variability such as N-limitation,
Fe-limitation and photoinhibition / photodamage may differentially impact PSII
(Aro et al., 1993; Geider et al., 1993; Vassiliev et al., 1995).
Nevertheless, direct assignment of PSII-specific processes to marine
photosynthetic rate and efficiency variability is limited (Falkowski and Kolber,
1993; Babin et al., 1996; Boyd et al., 1997) and there is evidence that PSII-
specific processes may not be regulating photosynthetic rates and efficiency at
higher light levels (Sukenik et al., 1987; Behrenfeld et al., 1998). In particular,
there is little evidence relating photosynthetic rate and efficiency in the presence
of background light to PSII-specific processes. To aid in closing this gap, in this
dissertation I have specifically examined the role PSII, as measured by
fluorescence induction (σPSII, Fv/Fm), has in regulating P-E and φC-E curves in the
context of marine environmental variability.
SOURCES OF VARIABILITY
In the open ocean there are many sources of variability that can potentially
influence phytoplankton photosynthetic rates and efficiency. In this dissertation I
have selected four physiological conditions as representative of some of the
major processes affecting marine photophysiology. These conditions include:
low light (Chapter II), xanthophyll cycling (Chapter III), photoacclimation (Chapter
IV) and nitrogen limitation (Chapter V). These conditions do not exhaustively
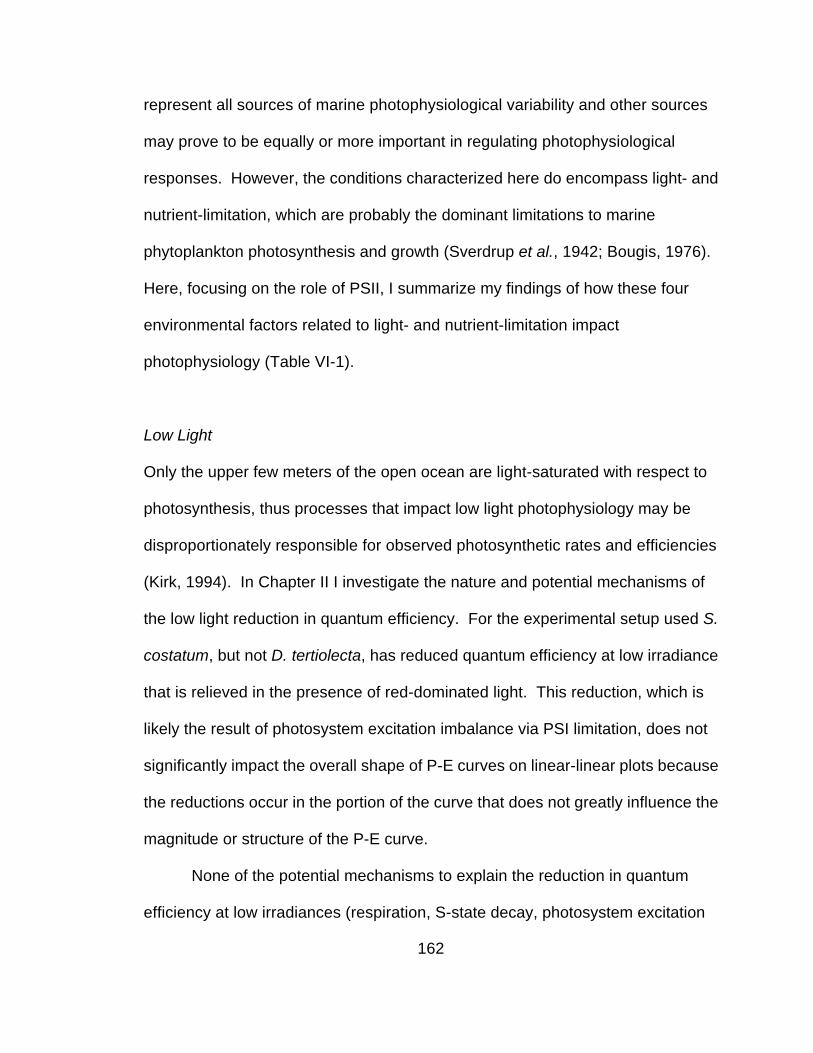
162
represent all sources of marine photophysiological variability and other sources
may prove to be equally or more important in regulating photophysiological
responses. However, the conditions characterized here do encompass light- and
nutrient-limitation, which are probably the dominant limitations to marine
phytoplankton photosynthesis and growth (Sverdrup et al., 1942; Bougis, 1976).
Here, focusing on the role of PSII, I summarize my findings of how these four
environmental factors related to light- and nutrient-limitation impact
photophysiology (Table VI-1).
Low Light
Only the upper few meters of the open ocean are light-saturated with respect to
photosynthesis, thus processes that impact low light photophysiology may be
disproportionately responsible for observed photosynthetic rates and efficiencies
(Kirk, 1994). In Chapter II I investigate the nature and potential mechanisms of
the low light reduction in quantum efficiency. For the experimental setup used S.
costatum, but not D. tertiolecta, has reduced quantum efficiency at low irradiance
that is relieved in the presence of red-dominated light. This reduction, which is
likely the result of photosystem excitation imbalance via PSI limitation, does not
significantly impact the overall shape of P-E curves on linear-linear plots because
the reductions occur in the portion of the curve that does not greatly influence the
magnitude or structure of the P-E curve.
None of the potential mechanisms to explain the reduction in quantum
efficiency at low irradiances (respiration, S-state decay, photosystem excitation

163
imbalance), including the most probable: photosystem excitation imbalance, is a
PSII-limitation process that is quantified by standard fluorescence induction
techniques. Measures of Fv/Fm-E are always maximal at low background
irradiances and subsequently decrease at higher background irradiances
(Falkowski et al., 1986; Chapter III, IV, V). Thus, when quantum efficiency is
significantly reduced at low background irradiances such as for S. costatum,
fluorescence-based measures that show maximum PSII efficiency at low
irradiances do not adequately represent irradiance structure of photosynthetic
efficiency. However, when there is not a significant reduction in quantum
efficiency at low irradiance such as observed with D. tertiolecta, Fv/Fm-E
relationships do adequately represent the curve structure (Chapter II). A priori,
there is no way to distinguish between these two cases using standard
fluorescence induction techniques.
Xanthophyll Cycling
There are significant changes in the photosynthetic biomass and physiology
between WT and xanthophyll mutants of C. reinhardtii (npq1 and npq2), many of
which are related to alterations in PSII-specific processes. Loss of violaxanthin
de-epoxidase (npq1) results in a reduced non-photochemical quenching (NPQ)
capacity due to loss of non-photosynthetically active antenna traps. Conversely,
loss of zeaxanthin epoxidase (npq2) results in an increase in non-
photosynthetically active antenna traps (Chapter III). These modifications lead to
measurable changes in photosynthetic unit and PSII cross sections. Neglecting
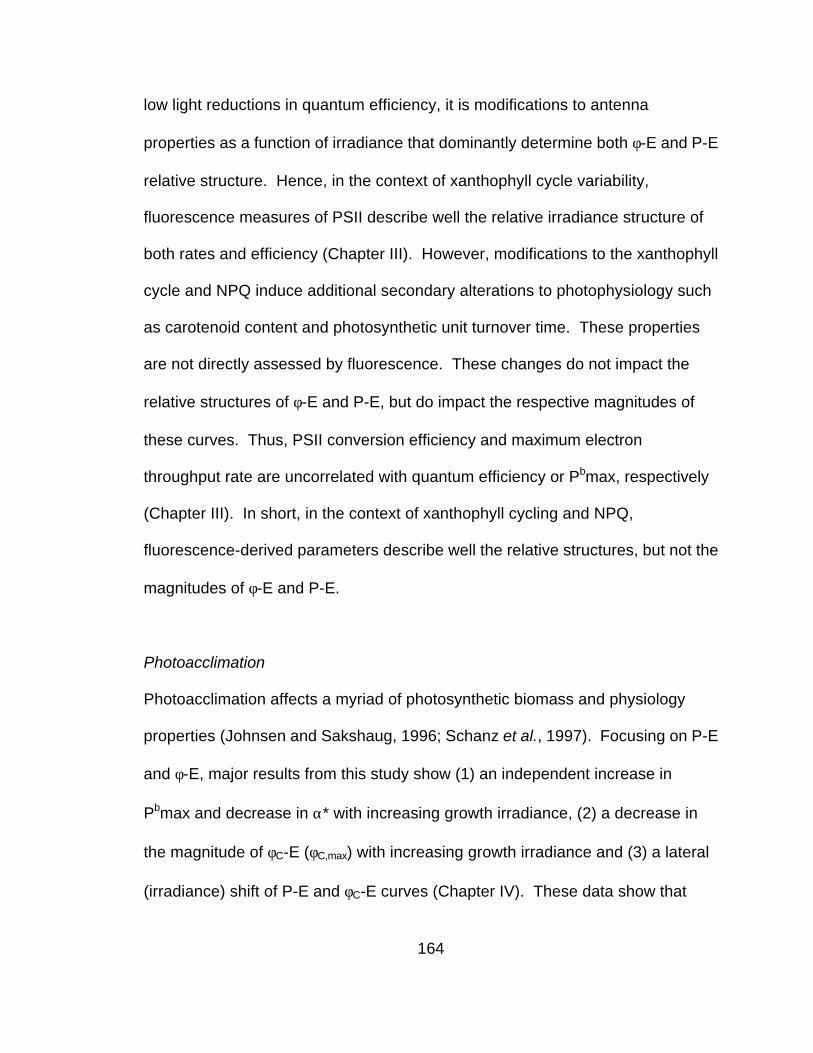
164
low light reductions in quantum efficiency, it is modifications to antenna
properties as a function of irradiance that dominantly determine both φ-E and P-E
relative structure. Hence, in the context of xanthophyll cycle variability,
fluorescence measures of PSII describe well the relative irradiance structure of
both rates and efficiency (Chapter III). However, modifications to the xanthophyll
cycle and NPQ induce additional secondary alterations to photophysiology such
as carotenoid content and photosynthetic unit turnover time. These properties
are not directly assessed by fluorescence. These changes do not impact the
relative structures of φ-E and P-E, but do impact the respective magnitudes of
these curves. Thus, PSII conversion efficiency and maximum electron
throughput rate are uncorrelated with quantum efficiency or Pbmax, respectively
(Chapter III). In short, in the context of xanthophyll cycling and NPQ,
fluorescence-derived parameters describe well the relative structures, but not the
magnitudes of φ-E and P-E.
Photoacclimation
Photoacclimation affects a myriad of photosynthetic biomass and physiology
properties (Johnsen and Sakshaug, 1996; Schanz et al., 1997). Focusing on P-E
and φ-E, major results from this study show (1) an independent increase in
Pbmax and decrease in α* with increasing growth irradiance, (2) a decrease in
the magnitude of φC-E (φC,max) with increasing growth irradiance and (3) a lateral
(irradiance) shift of P-E and φC-E curves (Chapter IV). These data show that
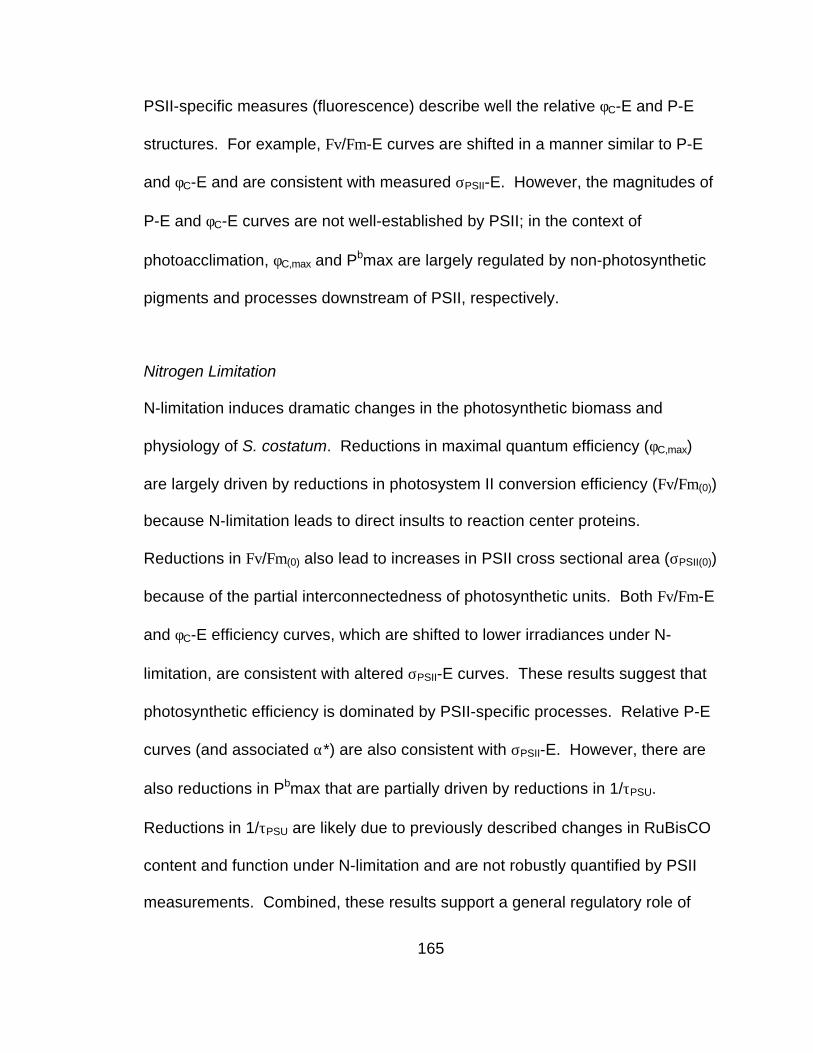
165
PSII-specific measures (fluorescence) describe well the relative φC-E and P-E
structures. For example, Fv/Fm-E curves are shifted in a manner similar to P-E
and φC-E and are consistent with measured σPSII-E. However, the magnitudes of
P-E and φC-E curves are not well-established by PSII; in the context of
photoacclimation, φC,max and Pbmax are largely regulated by non-photosynthetic
pigments and processes downstream of PSII, respectively.
Nitrogen Limitation
N-limitation induces dramatic changes in the photosynthetic biomass and
physiology of S. costatum. Reductions in maximal quantum efficiency (φC,max)
are largely driven by reductions in photosystem II conversion efficiency (Fv/Fm(0))
because N-limitation leads to direct insults to reaction center proteins.
Reductions in Fv/Fm(0) also lead to increases in PSII cross sectional area (σPSII(0))
because of the partial interconnectedness of photosynthetic units. Both Fv/Fm-E
and φC-E efficiency curves, which are shifted to lower irradiances under N-
limitation, are consistent with altered σPSII-E curves. These results suggest that
photosynthetic efficiency is dominated by PSII-specific processes. Relative P-E
curves (and associated α*) are also consistent with σPSII-E. However, there are
also reductions in Pbmax that are partially driven by reductions in 1/τPSU.
Reductions in 1/τPSU are likely due to previously described changes in RuBisCO
content and function under N-limitation and are not robustly quantified by PSII
measurements. Combined, these results support a general regulatory role of

166
PSII in photosynthetic efficiency under N-limitation. In the context of non-steady
state N-limitation, PSII specific processes describe well φC-E and relative P-E
curves, but do not describe well absolute P-E curves because processes not
linked to PSII such as RuBisCO concentration and turnover appear to be
regulating Pbmax (Chapter V).
CONCLUSIONS
These results demonstrate that under a variety of environmental situations
characteristic of natural oceanic variability, photosystem II describes well the
relative structure of photosynthesis-irradiance and quantum efficiency-irradiance
curves except at very low irradiance (Table VI-1). However, other processes not
associated with photosystem II (or quantified by fluorescence) and unique to
each environmental situation can significantly impact the magnitude of maximal
photosynthetic rates and efficiency. In addition, other environmental conditions
not examined here that do significantly affect photophysiology such as
phosphorus-limitation may not severely influence PSII, thus leading to poor PSII-
photophysiology relationships (Geider et al., 1993). Combined these results
demonstrate the utility of photosystem II properties as a function of background
irradiance in describing the irradiance structure of photosynthetic rates and
efficiency, but also point to some of the limitations of fluorescence techniques.
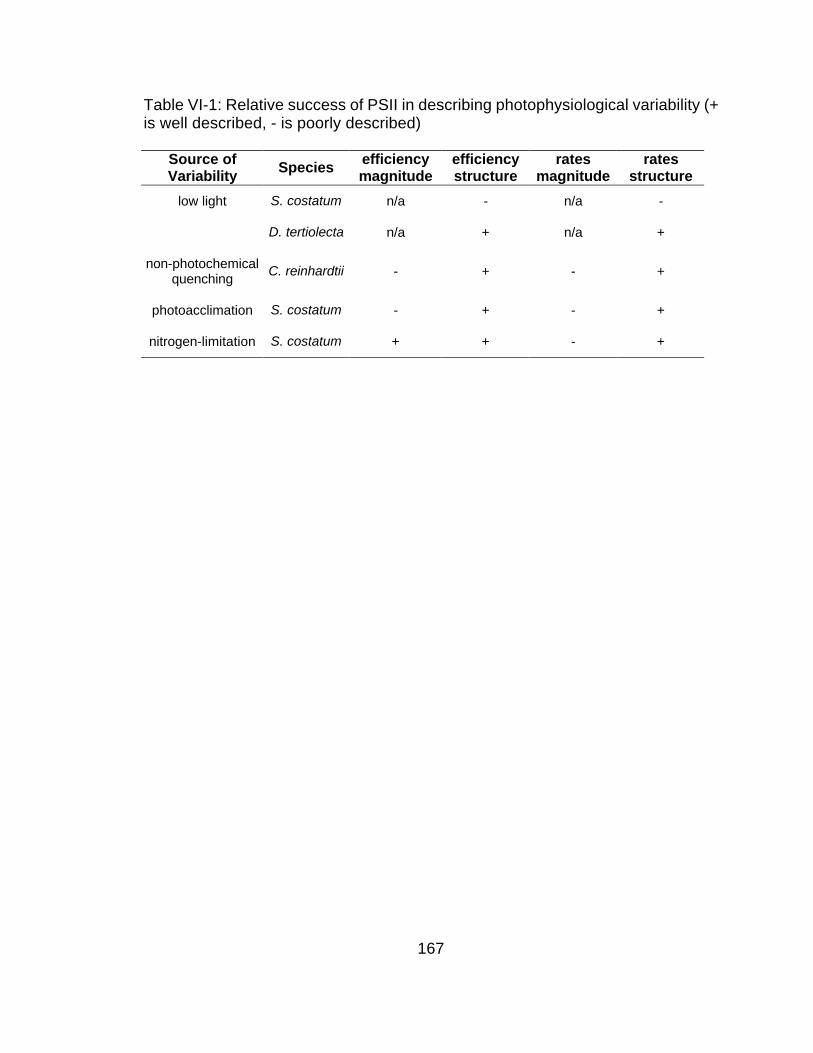
167
Table VI-1: Relative success of PSII in describing photophysiological variability (+ is well described, - is poorly described)
Source of Variability Species efficiency
magnitude efficiency structure
rates magnitude
rates structure
low light S. costatum n/a - n/a -
D. tertiolecta n/a + n/a +
non-photochemical quenching
C. reinhardtii - + - +
photoacclimation S. costatum - + - +
nitrogen-limitation S. costatum + + - +

168
Appendix 1: Definition of Symbols and Abbreviations
Symbol Typical Units Property
*ia m2 mg Chl a-1
mean chlorophyll a-specific absorption coefficient normalized to incident
irradiance spectra (see equation II-3)
1/τPSU sec-1 photosynthetic unit turnover time
A unitless fraction of open reaction centers (ex.
Akp)
E&A mol Chl a mol O2-1 Emerson and Arnold number
Ef µmol quanta m-2 flash intensity
Ek µmol quanta m-2
sec-1 Talling Constant, or photosynthesis
saturation intensity (Pbmax/α*)
Fm, φFm a.u. saturated or maximal fluorescence yield
Fo, φFo a.u. initial fluorescence yield
Fv, φFv a.u. Fm-Fo, variable fluorescence
Fv/Fm, φFv/Fm unitless PSII photosynthetic conversion
efficiency
kd sec-1 rate constant of non-radiative decay
kf sec-1 rate constant of fluorescence
kp sec-1 rate constant of photochemistry
kt sec-1 rate constant of excitation transfer to
PSI
MT sec-1 multiple turnover
n mol O2 mol Chl a-1 photosynthetic unit concentration
NPP nonphotosynthetic protective pigments
NPQ nonphotochemical quenching
npq1 nonphotochemical quenching mutant 1
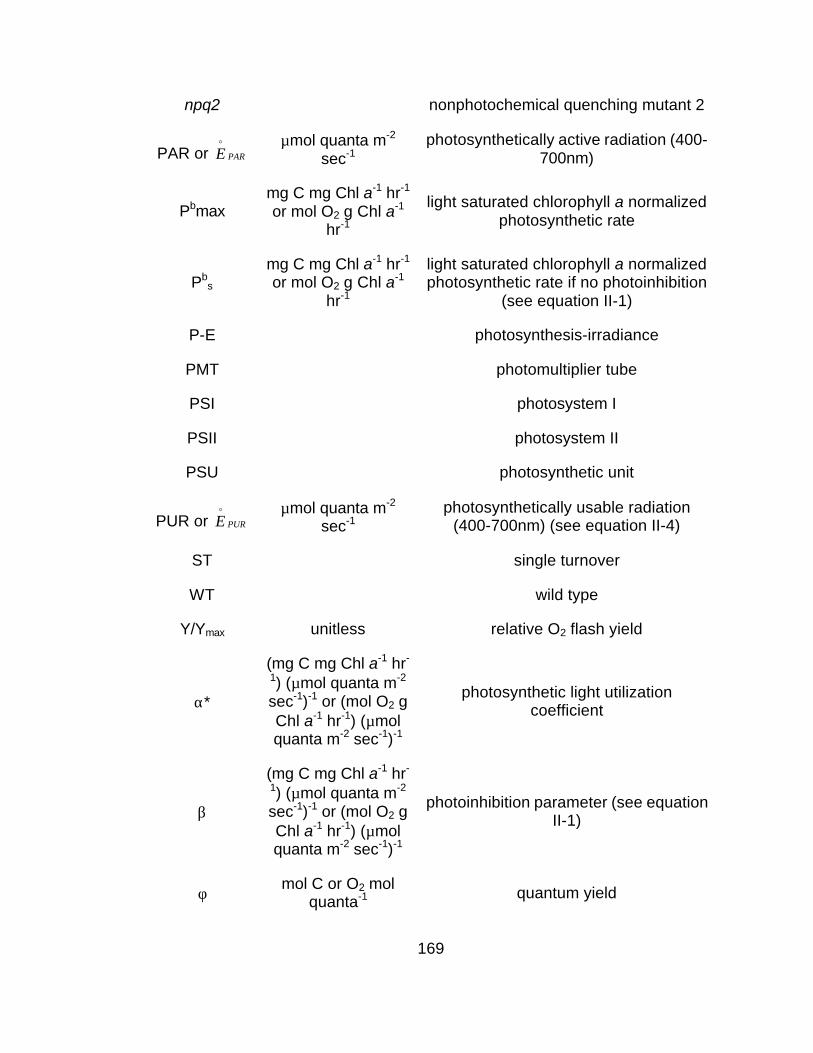
169
npq2 nonphotochemical quenching mutant 2
PAR or PAREo
µmol quanta m-2
sec-1 photosynthetically active radiation (400-
700nm)
Pbmax mg C mg Chl a-1 hr-1 or mol O2 g Chl a-1
hr-1
light saturated chlorophyll a normalized photosynthetic rate
Pbs
mg C mg Chl a-1 hr-1 or mol O2 g Chl a-1
hr-1
light saturated chlorophyll a normalized photosynthetic rate if no photoinhibition
(see equation II-1)
P-E photosynthesis-irradiance
PMT photomultiplier tube
PSI photosystem I
PSII photosystem II
PSU photosynthetic unit
PUR or PUREo
µmol quanta m-2
sec-1 photosynthetically usable radiation
(400-700nm) (see equation II-4)
ST single turnover
WT wild type
Y/Ymax unitless relative O2 flash yield
α*
(mg C mg Chl a-1 hr-
1) (µmol quanta m-2 sec-1)-1 or (mol O2 g Chl a-1 hr-1) (µmol quanta m-2 sec-1)-1
photosynthetic light utilization coefficient
β
(mg C mg Chl a-1 hr-
1) (µmol quanta m-2 sec-1)-1 or (mol O2 g Chl a-1 hr-1) (µmol quanta m-2 sec-1)-1
photoinhibition parameter (see equation II-1)
φ mol C or O2 mol
quanta-1 quantum yield
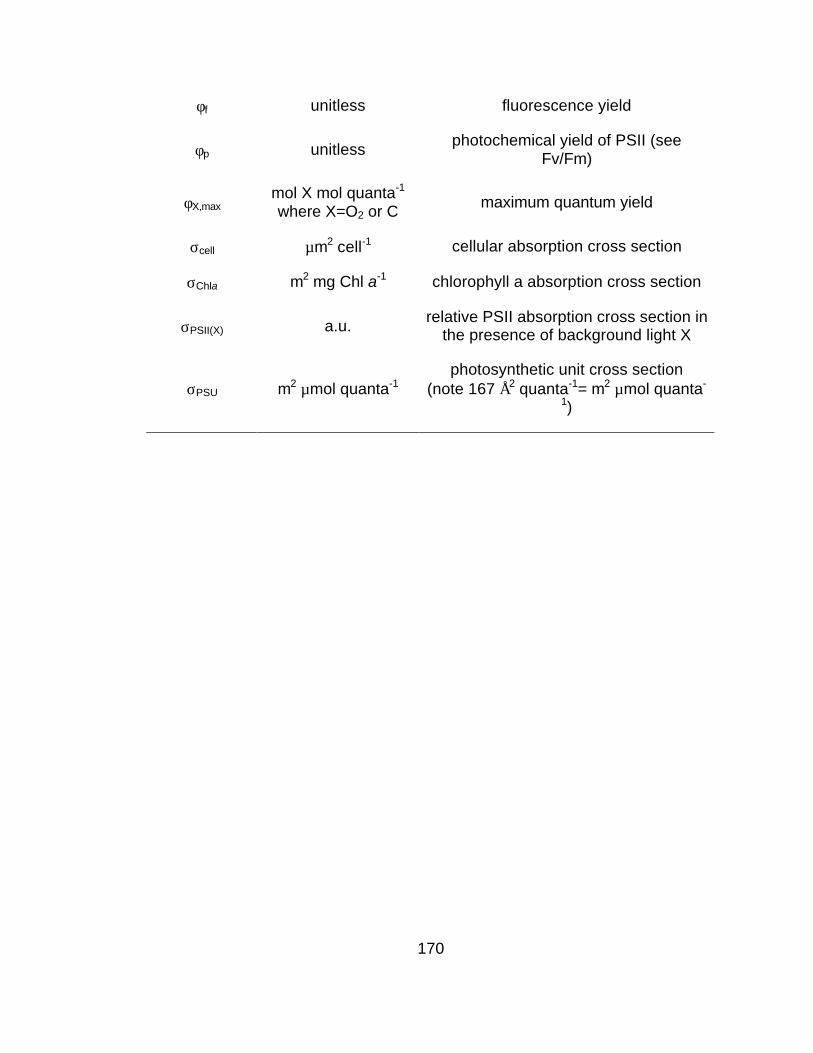
170
φf unitless fluorescence yield
φp unitless photochemical yield of PSII (see
Fv/Fm)
φX,max mol X mol quanta-1 where X=O2 or C
maximum quantum yield
σcell µm2 cell-1 cellular absorption cross section
σChla m2 mg Chl a-1 chlorophyll a absorption cross section
σPSII(X) a.u. relative PSII absorption cross section in
the presence of background light X
σPSU m2 µmol quanta-1 photosynthetic unit cross section
(note 167 Å2 quanta-1= m2 µmol quanta-
1)

171
References

172
Anderson, J. M., Park, Y. I., Soon, W. S., 1998. Unifying model for the photoinactivation of photosystem II in vivo under steady-state photosynthesis. Photosynthesis Research 56, 1-13.
Antoine, D., Andre, J.-M., Morel, A., 1996. Oceanic Primary Production 2. Estimation at global scale from satellite (coastal zone color scanner) chlorophyll. Global Biogeochemical Cycles 10, 57-69.
Aro, E.-M., Virgin, I., Andersson, B., 1993. Photoinhibition of photosystem II. Inactivation, protein damage, and turnover. Biochimica et Biophysica Acta 1143, 113-34.
Babin, M., Morel, A., Claustre, H., Bricaud, A., Kolber, Z., Falkowski, P. G., 1996. Nitrogen-and irradiance-dependent variations of the maximum quantum yield of carbon fixation in eutrophic, mesotrophic and oligotrophic marine systems. Deep Sea Research I 43, 1241-72.
Balch, W. M., Evans, R., Brown, J., Feldman, G., McClain, C., Esaias, W., 1992. The remote sensing of ocean primary productivity: Use of new data compilation to test satellite models. Journal of Geophysical Research 97, 2279-93.
Barber, J., Andersson, B., 1992. Too much of a good thing: Light can be bad for photosynthesis. Trends In Biochemical Sciences 17, 61-6.
Barber, R. T., 1992. Geologic and Climatic Time Scales of Nutrient Variability. In: Falkowski, P.G.and Woodhead, A.D. (Eds.) Primary Production and Biogeochemical Cycles in the Sea, Plenum Press, New York, pp. 89-105.
Barber, R. T., Sanderson, M. P., Lindley, S. T., Chai, F., Newton, J., Trees, C. C., Foley, D. G., Chavez, F. P., 1996. Primary productivity and its regulation in the equatorial Pacific during and following the 1991-1992 El Nino. Deep-Sea Research II 43, 933-69.
Beardall, J., Roberts, S., Millhouse, J., 1991. Effects of nitrogen limitation and uptake of inorganic carbon and specific activity of ribulose-1,5-bisphosphate carboxylase/oxygenase in green microalgae. Canadian Journal of Botany 69, 1146-50.
Behrenfeld, M. J., Falkowski, P. G., 1997. Photosynthetic rates derived from satellite-based chlorophyll concentration. Limnology and Oceanography 42, 1-20.
Behrenfeld, M. J., Prasil, O., Kolber, Z. S., Babin, M., Falkowski, P. G., 1998. Compensatory changes in Photosystem II electron turnover rates protect photosynthesis from photoinhibition. Photosynthesis Research. 58, 259-68.
173
Berens, S. J., Scheele, J., Butler, W. L., Magde, D., 1985. Kinetic modeling of time-resolved fluorescence in spinach chloroplasts. Photochemistry and Photobiology 42, 59-68.
Berges, J. A., Charlebois, D. O., Mauzerall, D. C., Falkowski, P. G., 1996. Differential effects of nitrogen limitation on photosynthetic efficiency of photosystems I and II in microalgae. Plant Physiology 110, 689-96.
Bidigare, R. R., Schofield, O., Prezelin, B. B., 1989. Influence of zeaxanthin on quantum yield of photosynthesis of Synechococcus clone WH7803 (DC2). Marine Ecology Progress Series 56, 177-88.
Blackman, F. F., 1905. Optima and limiting factors. Annals of Botany 14, 281-95.
Bonaventura, C., Myers, J., 1969. Fluorescence and oxygen evolution from Chlorella pyrenoidoa. Biochimica et Biophysica Acta 189, 366-83.
Bougis, P., 1976. Marine plankton ecology, American Elsevier Pub. Co., New York, pp. 355.
Boyd, P. W., Aiken, J., Kolber, Z., 1997. Comparison of radiocarbon and fluorescence based (pump and probe) measurements of phytoplankton photosynthetic characteristics in the Northeast Atlantic Ocean. Marine Ecology Progress Series 149, 215-26.
Brzezinski, M. A., 1985. The Si:C:N ratio of marine diatoms: Interspecific variability and the effect of some environmental variables. Journal of Phycology 21, 347-57.
Bungard, R. A., McNeil, D., Morton, J. D., 1997. Effects of nitrogen on the photosynthetic apparatus of Clematis vitalba grown at several irradiances. Australian Journal of Plant Physiology 24, 205-14.
Butcher, R., 1959. An introductory account of the smaller algae of British coastal waters. Great Britain Ministry of Agriculture, Fisheries and Food IV, 1-83.
Butler, W., Strasser, R. J., 1977. Tripartite model for the photochemical apparatus of green plant photosynthesis. PNAS 74, 3382-5.
Butler, W. L., 1972. On the Primary Nature of Fluorescence yield changes associated with photosynthesis. PNAS 69, 3420-2.
Butler, W. L., 1978. Energy Distribution in the photochemical apparatus of photosynthesis. Annual Review of Plant Physiology 29, 345-78.
Butler, W. L., Kitajima, M., 1975. Fluorescence quenching in photosystem II of chloroplasts. Biochimica et Biophysica Acta 376, 116-25.

174
Caron, L., Mortain, B. A., Jupin, H., 1988. Effect of photoperiod on photosynthetic characteristics of two marine diatoms. Journal Of Experimental Marine Biology And Ecology 123, 211-26.
Casper-Lindley, C., Bjorkman, O., 1998. Fluorescence Quenching in Four Unicellular Algae With Different Light-Harvesting and Xanthophyll-Cycle Pigments. Photosynthesis Research 56, 277-89.
Cleve, P., 1873. Examination of diatoms found on the surface of the Sea of Java. Bihang till Kongliga Scenska Vetenshaps-Akademiens Handlingar 1, 1-13.
Cleveland, J. S., Perry, M. J., 1987. Quantum yield, relative specific absorption and fluorescence in nitrogen-limited Chaetoceros gracilis. Marine Biology 94, 489-98.
Cleveland, J. S., Perry, M. J., Kiefer, D. A., Talbot, M. C., 1989. Maximal quantum yield of photosynthesis in the Northwest Sargasso Sea. Journal of Marine Research 47, 869-86.
Codispoti, L. A., 1989. Phosphorus vs. nitrogen limitation of new and export production. In: Berger, W.H., Smetacek, V.S. and Wefer, G. (Eds.) Productivity Of The Ocean: Present And Past, Wiley-Interscience Publ., Chichester (Uk), pp. 377-94.
Coleman, L. W., Rosen, B. H., Schwartzbach, S. D., 1988. Preferential loss of chloroplast proteins in nitrogen deficient Euglena. Plant and Cell Physiology 29, 1007-14.
Collier, J. L., Grossman, A. R., 1992. Chlorosis induced by nutrient deprivation in Synechococcus sp. strain PCC 7942: Not all bleaching is the same. Journal Of Bacteriology 174, 4718-26.
Cosper, E., 1982. Effects of variations in light intensity on the efficiency of growth of Skeletonema costatum (Bacillariophyceae) in a cyclostat. Journal of Phycology 18, 360-8.
Crofts, A. R., Wraight, C. A., 1983. The electrochemical domain of photosynthesis. Biochimica et Biophysica Acta 726, 149-85.
Cullen, J. J., 1990. On models of growth and photosynthesis in phytoplankton. Deep-Sea Research Part A 37, 667-83.
Cullen, J. J., Yang, X., MacIntyre, H. L., 1992. Nutrient limitation and marine photosynthesis. In: Falkowski, P.G.and Woodhead, A.D. (Eds.) Primary productivity and biogeochemical cycles in the sea, Plenum Press, New York, pp. 69-88.
175
Dai, S. D., Schwendtmayer, C., Schurmann, P., Ramaswamy, S., Eklund, H., 2000. Redox signaling in chloroplasts: Cleavage of disulfides by an iron-sulfur cluster. Science 287, 655-8.
Danon, A., Mayfield, S. P., 1994. Light-regulated translation of chloroplast messenger RNAs through redox potential. Science 266, 1717-9.
Dau, H., 1994. Molecular mechanisms and quantitative models of variable photosystem II fluorescence. Photochemistry and Photobiology 60, 1-23.
Demmig, B., WInter, K., Kruger, A., Czygan, F.-C., 1987. Photoinhibition and zeaxanthin formation in intact leaves. A possible role of the xanthophyll cycle in the dissipation of excess light energy. Plant Physiology 84, 218-24.
Demmig-Adams, B., 1990. Carotenoids and photoprotection in plants: a role for the xanthophyll zeaxanthin. Biochimica Biophysica Acta 1020, 1-24.
Demmig-Adams, B., Adams, W., 2000. Harvesting sunlight safely. Nature 403, 371-4.
Demmig-Adams, B., Adams, W. W., 1992. Photoprotection and other responses of plants to high light stress. Annual Review of Plant Physiology and Molecular Biology 43, 599-626.
Demmig-Adams, B., Adams, W. W., III, 1996. Xanthophyll cycle and light stress in nature: Uniform response to excess direct sunlight among higher plant species. Planta 198, 460-70.
Dickey, T. D., 1991. The emergence of concurrent high-resolution physical and bio-optical measurements in the upper ocean and their applications. Review of Geophysics 29, 383-413.
Diner, B., Mauzerall, D., 1973. Feedback controlling oxygen production in a cross-reaction between two photosystems in photosynthesis. Biochimica et Biophysica Acta 305, 329-52.
Dubinsky, Z., Falkowski, P. G., Wyman, K., 1986. Light harvesting and utilization by phytoplankton. Plant and Cell Physiology 27, 1335-50.
Dubinsky, Z., Stambler, N., 1992. Photoacclimation in phytoplankton: Effects on optical and photosynthetic properties. Israel Journal of Botany 41.
Durnford, D. G., Falkowski, P. G., 1997. Chloroplast redox regulation of nuclear gene transcription during photoacclimation. Photosynthesis Research 53, 229-41.
176
Duysens, L. N. M., Sweers, H. E., 1963. Mechanism of two photochemical reactions in algae as studied by means of fluorescence. In: Physiologists, J.S.o.P. (Ed.) Studies on Microalgae and Photosynthetic Bacteria, The University of Tokyo Press, Tokyo, pp. 353-72.
Emerson, R., Lewis, C. M., 1943. The dependence of the quantum yield of Chlorella photosynthesis on the wavelength of light. American Journal of Botany 30, 165-78.
Eppley, R. W., 1972. Temperature and phytoplankton growth in the sea. Fisheries Bulletin 70, 1063-85.
Eppley, R. W., Rogers, J. N., McCarthy, J. J., 1969. Half-saturation constants for uptake of nitrate and ammonium by marine phytoplankton. Limnology and Oceanography 14, 912-20.
Escoubas, J. M., Lomas, M., LaRoche, J., Falkowski, P. G., 1995. Light intensity regulation of cab gene transcription is signaled by the redox state of the plastoquinone pool. PNAS 92, 10237-41.
Falkowski, P., Kiefer, D. A., 1985. Chlorophyll a fluorescence in phytoplankton: relationship to photosynthesis and biomass. Journal of Plankton Research 7, 715-31.
Falkowski, P., Owens, T., Ley, A., Mauzerall, D., 1981. Effects of growth irradiance levels on the ratio of reaction centers in two species of marine phytoplankton. Plant Physiology 68, 969-73.
Falkowski, P., Raven, J., 1997. Aquatic Photosynthesis, Blackwell, New York, pp. 375.
Falkowski, P. G., 1994. The role of phytoplankton photosynthesis in global biogeochemical cycles. Photosynthesis Research 39, 235-58.
Falkowski, P. G., 1997. Evolution of the nitrogen cycle and its influence on the biological sequestration of CO-2 in the ocean. Nature 387, 272-5.
Falkowski, P. G., Barber, R. T., Smetacek, V., 1998. Biogeochemical controls and feedbacks on ocean primary production. Science 281, 200-6.
Falkowski, P. G., Fujita, Y., Ley, A., Mauzerall, D., 1986. Evidence for cyclic electron flow around photosystem II in Chlororella pyrenoidosa. Plant Physiology 81, 310-2.
Falkowski, P. G., Kolber, Z., 1993. Estimation of phytoplankton photosynthesis by active fluorescence. ICES Marine Sciences Symposium 197, 92-103.

177
Falkowski, P. G., Kolber, Z., Mauzerall, D., 1994. A comment on the call to throw away your fluorescence induction apparatus. Biophysical Journal 66, 923-8.
Falkowski, P. G., Owens, T. G., 1978. Effects of light intensity on photosynthesis and dark respiration in six species of marine phytoplankton. Marine Biology 45, 289-95.
Falkowski, P. G., Owens, T. G., 1980. Light-Shade adaptation: two strategies in marine phytoplankton. Plant Physiology 66, 592-5.
Falkowski, P. G., Sukenik, A., Herzig, R., 1989. Nitrogen limitation in Isochrysis galbana (Haptophyceae). 2. Relative abundance of chloroplast proteins. Journal of Phycology 25, 471-8.
Falkowski, P. G., Wyman, K., Ley, A. C., Mauzerall, D. C., 1986. Relationship of steady-state photosynthesis to fluorescence in eukaryotic algae. Biochimica et Biophysica Acta 849, 183-92.
Fasham, M. J. R., Platt, T., 1983. Photosynthetic response of phytoplankton to light: A physiological model. Proceedings of the Royal Society of London B Biological Sciences 219, 355-70.
Field, C. B., Behrenfeld, M. J., Randerson, J. T., Falkowski, P., 1998. Primary production of the biosphere: Integrating terrestrial and oceanic components. Science 281, 237-40.
Fisher, T., Minnaard, J., Dubinsky, Z., 1996. Photoacclimation in the marine alga Nannochloropsis sp. (Eustigmatophyte): A kinetic study. Journal of Plankton Research 18, 1797-818.
Forbush, B., Kok, B., McGloin, M., 1971. Cooperation of charges in photosynthetic O2 evolution - II. Damping of flash yield oscillation, deactivation. Photochemistry and Photobiology 14, 307-21.
Frenette, J. J., Demers, S., Legendre, L., Dodson, J., 1993. Lack of agreement among models for estimating the photosynthetic parameters. Limnology and Oceanography 38, 679-87.
Gallagher, J. C., Wood, A. M., Alberte, R. S., 1984. Ecotypic differentiation in the marine diatom Skeletonema costatum: Influence of light intensity on the photosynthetic apparatus. Marine Biology 82, 121-34.
Garcia-Ferris, C., Moreno, J., 1994. Oxidative modification and breakdown of ribulose-1,5-bisphosphate carboxylase/oxygenase induced in Euglena gracilis by nitrogen starvation. Planta 193, 208-15.
178
Garczarek, L., Van, D. S. G. W. M., Thomas, J. C., Partensky, F., 1998. Isolation and characterization of Photosystem I from two strains of the marine oxychlorobacterium Prochlorococcus. Photosynthesis Research 56, 131-41.
Geacintov, N., Breton, J., 1987. Energy transfer and fluorescence mechanisms in photosynthetic membranes. CRC Critical Reviews in Plant Science 5, 1-44.
Geider, R. J., 1992. Respiration: Taxation without representation? In: Falkowski, P.G.and Woodhead, A.D. (Eds.) Primary Productivity and Biogeochemical Cycles in the Sea, Plenum Press, New York, pp. 333-60.
Geider, R. J., La Roche, J., Greene, R. M., Olaizola, M., 1993. Response of the photosynthetic apparatus of Phaeodactylum tricornutum (Bacillariophyceae) to nitrate, phosphate, or iron starvation. Journal of Phycology 29, 755-66.
Geider, R. J., Macintyre, H. L., Graziano, L. M., McKay, R. M. L., 1998. Responses of the photosynthetic apparatus of Dunaliella tertiolecta (Chlorophyceae) to nitrogen and phosphorus limitation. European Journal of Phycology 33, 315-32.
Geider, R. J., Osborne, B. A., 1992. Algal Photosynthesis: The measurement of Algal Gas Exchange Current Phycology 2, Chapman and Hall, New York, pp. 256.
Genty, B., Briantais, J. M., Baker, N. R., 1989. The relationship between the quantum yield of photosynthetic electron transport and quenching of chlorophyll fluorescence. Biochimica et Biophysica Acta 990, 87-92.
Genty, B., Harbinson, J., 1996. Regulation of light utilization for photosynthetic electron transport. In: Baker, N. (Ed.) Photosynthesis and the Environment, vol. 5. Kluwer Academic Publishers, Boston, pp. 67-99.
Goericke, R., Repeta, D. J., 1992. The pigments of Prochlorococcus marinus : The presence of divinyl chlorophyll a and b in a marine procaryote. Limnology and Oceanography 37, 425-33.
Greville, R., 1866. Descriptions of new and rare diatoms. Transactions of the Microscopical Society of London New Series (Series 19) 14, 77-86.
Guillard, R. R. L., Ryther, J. H., 1962. Studies of Marine Planktonic Diatoms I. Cyclotella Nana Hustedt, and Detonula Confervacea (Cleve) Gran. Canadian Journal of Microbiology 8, 229-39.

179
Harding, L. W., Prezelin, B. R., Sweeney, B. M., Cox, J. L., 1981. Diel Oscillations in the photosynthesis-irradiance relationship of a planktonic marine diatom. Journal of Phycology 17, 389-94.
Havaux, M., Niyogi, K. K., 1999. The violaxanthin cycle protects plants from photooxidative damage by more than one mechanism. Proceedings of the National Academy of Sciences of the United States of America 96, 8762-7.
Healy, F., Myers, J., 1971. The Kok effect in Chlamydomonas reinhardi. Plant Physiology 47, 373-9.
Henley, W. J., 1995. On the measurement and interpretation of photosynthetic light-response curves in algae in the context of photoinhibition and diel changes. Journal of Phycology 31.
Henley, W. J., Levavasseur, G., Franklin, L. A., Osmond, C. B., Ramus, J., 1991. Photoacclimation and photoinhibition in Ulva rotundata as influenced by nitrogen availability. Planta 184, 235-43.
Herzig, R., Dubinsky, Z., 1992. Photoacclimation, photosynthesis, and growth in phytoplankton. Israel Journal of Botany 41, 199-211.
Herzig, R., Falkowski, P. G., 1989. Nitrogen limitation in Isochrysis galbana (Haptophyceae). 1. Photosynthetic energy conversion and growth efficiencies. Journal of Phycology 25, 462-71.
Hiyama, T., Ke, B., 1972. Difference spectra and extinction coefficients of P700. Biochimica et Biophysica Acta 267, 160-71.
Hodges, M., Barber, J., 1983. Photosynthetic adaptation of pea plants grown at different light intensities: State 1-State 2 transitions and associated chlorophyll fluorescence changes. Planta 157, 166-73.
Jassby, A. D., Platt, T., 1976. Mathematical formulation of the relationship between photosynthesis and light for phytoplankton. Limnology and Oceanography 21, 540-7.
Jeffrey, S. W., Humphrey, G. F., 1975. New spectrophotometric equations for determining chlorophylls a, b, c1 and c2 in higher plants, algae and natural phytoplankton. Biochem. Physiol. Pflanzen 167, 191-4.
Jeffrey, S. W., Mantoura, R. F. C., Wright, S. W. (Eds.), 1997. Phytoplankton pigments in oceanography, vol 10. UNESCO, France.
Jerlov, N. G., 1976. Marine Optics, Elsevier, New York, pp. 231.

180
Johnsen, G., Sakshaug, E., 1996. Light harvesting in bloom-forming marine phytoplankton: Species-specificity and photoacclimation. Scientia Marina 60, 47-56.
Johnson, Z., Howd, P., 2000. Marine Photosynthetic Performance Forcing and Periodicity for the Bermuda Atlantic Time Series, 1989-1995. Deep Sea Research I 47, 1485-512.
Johnson, Z., Landry, M. L., Bidigare, R. R., Brown, S. L., Campbell, L., Gunderson, J., Marra, J., Trees, C., 1999. Energetics and growth kinetics of a deep Prochlorococcus spp. population in the Arabian Sea. Deep-Sea Research Part II 46, 1719-43.
Kaplan, A., Reinhold, L., 1999. CO2 concentrating mechanisms in photosynthetic microorganisms. Annual Review of Plant Physiology & Plant Molecular Biology 50, 539-70.
Karl, D. M., 1999. A sea of change: Biogeochemical variability in the North Pacific Subtropical Gyre. Ecosystems. 2, 181-214.
Kautsy, H., Hirsch, A., 1931. Neue Theorie zur Kohlensaureassimilation. Naturwissen 19, 90-7.
Kiefer, D. A., Reynolds, R. A., 1992. Advances in understanding phytoplankton fluorescence and photosynthesis. In: Falkowski, P.and Woodhead, A. (Eds.) Primary Productivity and Biogeochemical Cycles in the Sea, Plenum Press, New York, pp. 155-74.
Kirk, J. T. O., 1994. Light and Photosynthesis in Aquatic Ecosystems, Cambridge University Press, NY, pp. 509.
Kitajima, M., Butler, W. L., 1975. Quenching of chlorophyll fluorescence and primary photochemistry in chloroplasts by dibromothymoquinone. Biochimica et Biophysica Acta 376, 105-15.
Kok, B., 1948. A critical consideration of the quantum yield of Chlorella photosynthesis. Enzymologia 13, 1-56.
Kok, B., 1949. On the interrelation of respiration and photosynthesis in green plant cells. Biochimica et Biophysica Acta 3, 245-58.
Kok, B., 1956. Photosynthesis in flashing light. Biochimica et Biophysica Acta 21, 245-58.
Kok, B., Forbush, B., McGloin, M., 1970. Cooperation of charges in photosynthetic oxygen evolution. I. A linear four step mechanism. Photochemistry and Photobiology 11, 453-75.

181
Kolber, Z., Zehr, J., Falkowski, P., 1988. Effects of Growth Irradiance and Nitrogen Limitation on Photosynthetic Energy Conversion in Photosystem II. Plant Physiology 88, 923-9.
Kolber, Z. S., Falkowski, P. G., 1992. Fast repetition rate (FRR) fluorometer for making in situ measurements of primary productivity. Ocean 92 Conference, Newport, Rhode Island.
Kolber, Z. S., Prasil, O., Falkowski, P. G., 1998. Measurements of Variable Chlorophyll Fluorescence Using Fast Repetition Rate Techniques - Defining Methodology and Experimental Protocols. Biochimica et Biophysica Acta 1367, 88-106.
Kroon, B., Prezelin, B. B., Schofield, O., 1993. Chromatic regulation of quantum yields for photosystem II charge separation, oxygen evolution, and carbon fixation in Heterocapsa pygmaea (Pyrrophyta). Journal of Phycology 29, 453-62.
La Roche, J., Geider, R. J., Graziano, L. M., Murray, H., Lewis, K., 1993. Induction of specific proteins in eukaryotic algae grown under iron-, phosphorus-, or nitrogen-deficient conditions. Journal of Phycology 29, 767-77.
Laroche, J., Mortain, B. A., Falkowski, P. G., 1991. Light intensity-induced changes in cab messenger RNA and light harvesting complex II apoprotein levels in the unicellular chlorophyte Dunaliella tertiolecta. Plant Physiology 97, 147-53.
Latasa, M., Berdalet, E., 1994. Effect of nitrogen or phosphorus starvation on pigment composition of cultured Heterocapsa sp. Journal of Plankton Research 16, 83-94.
LaVergne, J., Trissl, H. W., 1995. Theory of fluorescence induction in photosystem II: Derivation of analytical expressions in a model including exciton-radical-pair equilibrium and restricted energy transfer between photosynthetic units. Biophysical Journal 68, 2474-92.
Laws, E. A., 1991. Photosynthetic quotients, new production and net community production in the open ocean. Deep-Sea Research 38A, 143-67.
Lazar, D., 1999. Chlorophyll a fluorescence induction. Biochimica et Biophysica Acta 1412, 1-28.
Leverenz, J. W., Falk, S., Pilstrom, C. M., Samuelsson, G., 1990. The effects of photoinhibition on the photosynthetic light-response curve of green plant cells (Chlamydomonas reinhardtii). Planta 182, 161-8.
182
Levings III, C. S., Siedow, J. N., 1995. Regulation of redox poise in chloroplasts. Science 268, 69-70.
Levitus, S., Conkright, M. E., Reid, J. L., Najjar, R. G., Mantyla, A., 1993. Distribution of nitrate, phosphate and silicate in the world oceans. Progress in Oceanography 31, 245-73.
Ley, A. C., Mauzerall, D. C., 1982. Absolute absorption cross-sections for photosystem II and the minimum quantum requirement for photosynthesis in Chlorella vulgaris. Biochimica et Biophysica Acta 680, 95-106.
Ley, A. C., Mauzerall, D. C., 1986. The extent of energy transfer among photosystem II reaction centers in Chlorella vulgaris. Biochimica et Biophysica Acta 850, 234-48.
Li, X. P., Bjorkman, O., Shih, C., Grossman, A. R., Rosenquist, M., Jansson, S., Niyogi, K. K., 2000. A pigment-binding protein essential for regulation of photosynthetic light harvesting. Nature 403, 391-5.
Lindley, S. T., Barber, R. T., 1998. Phytoplankton Response to Natural and Experimental Iron Addition. Deep-Sea Research Part II 45, 1135-50.
Lindley, S. T., Bidigare, R. R., Barber, R. T., 1995. Phytoplankton photosynthesis parameters along 140 degrees W in the equatorial Pacific. Deep Sea Research II 42, 441-63.
Lohr, M., Wilhelm, C., 1999. Algae displaying the diadinoxanthin cycle also possess the violaxanthin cycle. Proceedings of the National Academy of Sciences of the United States of America. 96, 8784-9.
Long, S. P., Humphries, S., Falkowski, P. G., 1994. Photoinhibition of photosynthesis in nature. Annual Review of Plant Physiology and Molecular Biology 45, 633-62.
Magnuson, J., 1990. Long-term ecological research and the invisible present. BioScience 40, 495-501.
Malkin, S., Kok, B., 1966. Fluorescence induction studies in isolated chloroplasts I. number of components involved in the reaction and quantum yields. Biochimica et Biophysica Acta 126, 413-32.
Markager, S., 1998. Dark uptake of inorganic 14C in oligotrophic oceanic waters. Journal of Plankton Research 20, 1813-36.
Marra, 1980. Vertical Mixing and Primary Production. In: Falkowski, P.G. (Ed.) Primary Productivity in the Sea, Plenum Press, New York, pp. 121-37.
183
Marra, J., Trees, C. C., Bidigare, R. R., Barber, R. T., 2000. Pigment absorption and quantum yields in the Arabian Sea. Deep-Sea Research II 47, 1279-300.
Marsho, T. V., Kok, B., 1971. Detection and isolation of P700. Methods in Enzymology 13, 515-22.
Martin, J. H., 1990. Glacial-Interglacial CO2 Change: the iron hypothesis. Paleooceanography 5, 1-13.
Mauzerall, D., 1972. Light-induced fluorescence changes in Chlorella, and the primary photoreactions for the production of oxygen. d 69, 1358-62.
Mauzerall, D., Greenbaum, N., 1989. The absolute size of a photosynthetic unit. Biochimica Biophysica Acta 974, 119-40.
Melis, A., 1984. Light regulation of photosynthetic membrane structure, organization and function. Journal of Cellular Biochemistry 24, 271-86.
Melis, A., Anderson, J. M., 1983. Structural and functional organization of the photosystems in spinach (Spinacia oleracea) chloroplasts: Antenna size, relative electron-transport capacity and chlorophyll composition. Biochimica et Biophysica Acta 724, 473-84.
Melis, A., Brown, J. S., 1980. Stoichiometry of system I and system II reaction centers and of plastoquinone in different photosynthetic membranes. Proceedings of the National Academy of Sciences of the United States of America 77, 4712-6.
Melis, A., Mullineaux, C. W., Allen, J. F., 1989. Acclimation of the photosynthetic apparatus to photosystem I or photosystem II light: Evidence from quantum yield measurements and fluorescence spectroscopy of cyanobacterial cells. Zeitschrift Fuer Naturforschung Section C Biosciences 44, 109-18.
Moisan, T. A., Olaizola, M., Mitchell, B. G., 1998. Xanthophyll cycling in Phaeocystis antarctica: changes in cellular fluorescence. Marine Ecology Progress Series 169, 113-21.
Morel, A., 1988. Optical Modeling of the Upper Ocean in Relation to Its Biogenous Matter Content (Case I Waters). Journal of Geophysical Research 93, 10749-68.
Morel, A., 1991. Light and marine photosynthesis: a spectral model with geochemical and climatological implications. Progress in Oceanography 26, 263-306.
184
Murakami, A., Fujita, Y., Nemson Jeff, A., Melis, A., 1997. Chromatic regulation in Chlamydomonas reinhardtii: Time course of photosystem stoichiometry adjustment following a shift in growth light quality. Plant and Cell Physiology 38, 188-93.
Myers, J., Graham, J.-R., 1971. The photosynthetic unit in Chlorella measured by repetitive short flashes. Plant Physiology 48, 282-6.
Neale, P. J., 1987. Algal photoinhibition and photosynthesis in the aquatic environment. In: Kyle, D.J., Osmond, C.B.and C.J., A. (Eds.) Photoinhibition, Elsevier Science Publishers, pp. 39-65.
Niyogi, K. K., 1999. Photoprotection revisited: Genetic and molecular approaches. Annual Review of Plant Physiology & Plant Molecular Biology. 50, 333-59.
Niyogi, K. K., Bjorkman, O., Grossman, A. R., 1997. Chlamydomonas xanthophyll cycle mutants identified by video imaging of chlorophyll fluorescence quenching. Plant Cell 9, 1369-80.
Niyogi, K. K., Bjorkman, O., Grossman, A. R., 1997. The roles of specific xanthophylls in photoprotection. PNAS 94, 14162-7.
Olson, R. J., Chisholm, S. W., Zettler, E. R., Altabet, M. A., Dusenberry, J. A., 1990. Spatial and temporal distributions of prochlorophyte picoplankton in the North Atlantic Ocean. Deep Sea Research Part A 37, 1033-51.
Papageorgiou, G., 1975. Chlorophyll fluorescence: an intrinsic probe of photosynthesis. In: Govindjee, D. (Ed.) Bioenergetics of Photosynthesis, Academic Press, London, pp. 319-71.
Parsons, T. R., Maita, Y., Lalli, C. M., 1984. A manual of chemical and biological methods for seawater analysis, Permagon Press, Elmsford, NY, pp. 173.
Perry, M. J., Talbot, M. C., Alberte, R. S., 1981. Photoadaptation in marine phytoplankton: response of the photosynthetic unit. Marine Biology 62, 91-101.
Platt, T., Gallegos, C. L., Harrison, W. G., 1980. Photoinhibition of photosynthesis in natural assemblages of marine phytoplankton. Journal of Marine Research 38, 687-701.
Platt, T., Harrison, W. G., Horne, E. P. W., Irwin, B., 1987. Carbon fixation and oxygen evolution by phytoplankton in the Canadian high arctic. Polar Biology 8, 103-14.
185
Poskuta, J. W., 1992. Relationships between photosynthesis and respiration in plants. Wiadomosci Botaniczne 36, 47-52.
Post, A. F., Dubinsky, Z., Wyman, K., Falkowski, P. G., 1984. Kinetics of light-intensity adaptation in a marine planktonic diatom. Marine Biology 83, 231-8.
Powell, T. M., Steele, J. H., 1995. Ecological time series, Chapman & Hall, New York, NY, pp. xvi, 491.
Prasil, O., Kolber, Z., Berry, J. A., Falkowski, P. G., 1996. Cyclic electron flow around photosystem II in vivo. Photosynthesis Research 48, 395-410.
Raven, J. A., Beardall, J., 1981. Respiration and photorespiration. Canadian Bulletin Fisheries Aquatic Sciences 210, 55-82.
Redfield, A. C., 1958. The biological control of chemical factors in the environment. American Scientist 46, 205-11.
Sakshaug, E., Bricaud, A., Dandonneau, Y., Falkowski, P. G., Kiefer, D. A., Legendre, L., Morel, A., Parslow, J., Takahashi, M., 1997. Parameters of photosynthesis: definitions, theory and interpretation of results. Journal of Plankton Research 19, 1637-70.
Sarmiento, J., LeQuere, C., 1996. Oceanic Carbon Dioxide Uptake in a Model of Century-Scale Global Warming. Science 274, 1346-50.
Sarmiento, J. L., Bender, M., 1994. Carbon biogeochemistry and climate change. Photosynthesis Research 39, 209-34.
Schanz, F., Senn, P., Dubinsky, Z., 1997. Light absorption by phytoplankton and the vertical light attenuation: ecological and physiological significance, UCL Press, London, pp. .
Schatz, G. H., Brock, H., Holzwarth, A. R., 1988. Kinetic and energetic model for the primary processes in photosystem II. Biophysical Journal 54, 397-406.
Schreiber, U., Krieger, A., 1996. Two fundamentally different types of variable chlorophyll fluorescence in vivo. FEBS Letters 397, 131-5.
Schreiber, U., Neubauer, C., Klughammer, C., 1989. Devices and methods for room temperature fluorescence analysis. Phil. Trans. R. Soc. Lond. B323, 241-51.
Schreiber, U., Schliwa, U., Bilger, W., 1986. Continuous recording of photochemical and non-photochemical chlorophyll fluorescence
186
quenching with a new type of modulation fluorometer. Photosynthesis Research 10, 51-62.
Sciandra, A., Gostan, J., Collos, Y., Descolas, G. C., Leboulanger, C., Martin, J. V., Denis, M., Lefevre, D., Copin, M. C., Avril, B., 1997. Growth-compensating phenomena in continuous cultures of Dunaliella tertiolecta limited simultaneously by light and nitrate. Limnology and Oceanography 42, 1325-39.
Seaton, G. C., Walker, D. A., 1992. Validating chlorophyll fluorescence measures of efficiency: observations on fluorimetric estimation of photosynthetic rate. Proc. R. Soc. Lond. B 249, 41-7.
Seaton, G. G., Walker, D. A., 1990. Chlorophyll fluorescence as a measure of photosynthetic carbon assimilation. Proc. R. Soc. Lond. B 242, 29-35.
Shapira, M., Lers, A., Heifetz, P. B., Irihimovitz, V., Osmond, C. B., Gilham, N. W., Boynton, J. E., 1997. Differential regulation of chloroplast gene expression in Chlamydomonas reinhardtii during photoacclimation: Light stress transiently suppresses synthesis of the Rubisco LSU protein while enhancing synthesis of the PS II D1 protein. Plant Molecular Biology 33, 1001-11.
Smith, E. L., 1936. Photosynthesis in relation to light and carbon dioxide. d 22, 504-11.
Sosik, H. M., Mitchell, B. G., 1991. Absorption, fluorescence, and quantum yield for growth in nitrogen-limited Dunaliella tertiolecta. Limnology and Oceanography 36, 910-21.
Sosik, H. M., Mitchell, B. G., 1994. Effects of temperature on growth, light absorption, and quantum yield in Dunaliella tertiolecta (Chlorophyceae). Journal of Phycology 30, 833-40.
Steemann Nielsen, E., 1952. The Use of Radio-active Carbon (C14) for Measuring Organic Production in the Sea. J. Cons. perm. int. Explor. Mer. 18, 117-40.
Stitt, M., Schulze, D., 1994. Does Rubisco control the rate of photosynthesis and plant growth? An exercise in molecular ecophysiology. Plant Cell and Environment 17, 465-87.
Sueoka, N., 1960. Mitotic replication of deoxyribonucleic acid in Chlamydomonas reinhardi. Proceedings of the National Academy of Sciences of the United States of America 46, 83-91.
187
Sukenik, A., Bennett, J., Falkowski, P., 1987. Light-saturated photosynthesis: Limitation by electron transport or carbon fixation? Biochimica et Biophysica Acta 891, 205-15.
Sverdrup, H. U., Johnson, M. W., Fleming, R. H., 1942. The oceans, their physics, chemistry, and general biology, Prentice-Hall inc., New York, pp. 1087.
Sverdup, H. U., 1953. On Conditions for the Vernal Blooming of Phytoplankton. Journal du Conseil 18, 287-95.
Talling, J. F., 1966. Photosynthetic behavior in stratified and unstratified lake populations of a planktonic diatom. Journal of Ecology 54, 99-127.
Thornber, J., Alberte, R., Hunter, F., Shiozawa, J., Kan, K., 1977. The organization of chlorophyll in the plant photosynthetic unit. Brookhaven Symposium in Biology 28.
Trissl, H. W., LaVergne, J., 1995. Fluorescence induction from photosystem II: Analytical equations for the yields of photochemistry and fluorescence derived from analysis of a model including exciton-radical pair equilibrium and restricted energy transfer between photosynthetic units. Australian Journal of Plant Physiology 22, 183-93.
Trissl, H.-W., Gao, Y., Wulf, K., 1993. Theoretical fluorescence induction curves derived from coupled differential equations describing the primary photochemistry of photosystem II by an exciton-radical pair equilibrium. Biophysical Journal 64, 974-88.
Turpin, D. H., 1991. Effects of inorganic N availability on algal photosynthesis and carbon metabolism. Journal of Phycology 27, 14-20.
Vanderstaay, G. W. M., Moonvanderstaay, S. Y., Garczarek, L., Partensky, F., 1998. Characterization of the Photosystem I Subunits PsaI and PsaL From Two Strains of the Marine Oxyphototrophic Prokaryote Prochlorococcus. Photosynthesis Research 57, 183-91.
Vasilikiotis, C., Melis, A., 1994. Photosystem II reaction center damage and repair cycle: Chloroplast acclimation strategy to irradiance stress. Proceedings of the National Academy of Sciences of the United States of America 91, 7222-6.
Vassiliev, I. R., Kolber, Z., Wyman, K. D., Mauzerall, D., Shukla, V. K., Falkowski, P. G., 1995. Effects of iron limitation on photosystem II composition and light utilization in Dunaliella tertiolecta. Plant Physiology 109, 963-72.
188
Verhoeven, A. S., Demmig Adams, B., Adams, W. W., III, 1997. Enhanced employment of the xanthophyll cycle and thermal energy dissipation in spinach exposed to high light and N stress. Plant Physiology 113, 817-24.
Weis, E., Berry, J., 1987. Quantum efficiency of photosystem II in relation to 'energy'-dependent quenching of chlorophyll fluorescence. Biochimica et Biophysica Acta 894, 198-208.
Whitmarsh, J., Samson, G., Poulson, M., 1994. Photoprotection in photosystem II - the role of cytochrome b559. In: Baker, N.R. and Bowyer, J.R. (Eds.) Photoinhibition of Photosynthesis: from molecular mechanisms to the field, BIOS Scientific Publishers Limited, Oxford, UK, pp. 75-93.
Williams, P. B., Lefevre, D., 1996. Algal 14C and total carbon metabolisms. 1. Models to account for the physiological processes of respiration and recycling. Journal of Plankton Research 18, 1941-59.
Yoder, J. A., McClain, C. R., Feldman, G. C., 1993. Annual cycles of phytoplankton chlorophyll concentrations in the global ocean: A satellite view. Global Biogeochemical Cycles 7, 181-93.
Zimmerman, R. C., SooHoo, J. B., Kremer, J. N., D'Argenio, D. Z., 1987. Evaluation of variance approximation techniques for non-linear photosynthesis - irradiance models. Marine Biology 95, 209-15.
189
BIOGRAPHY Zackary Ian Johnson Born 20 April 1972, Iowa City, Iowa, USA Education: Massachusetts Institute of Technology, Cambridge, MA (1990-1994), B.S. Duke University, Durham, NC (1994-2000), Ph.D. (Botany) Professional positions:
Laboratory Assistant, WHOI, Woods Hole, MA (1993) Laboratory Assistant, MIT, Cambridge, MA (1991-94)
Visiting Scientist, Brookhaven National Laboratories, Upton, NY (1997) Teaching Assistant / Laboratory Instructor / Seminar Leader (Biological
Oceanography, Chemical Ecology, Marine Ecology, Marine Ecosystems, Invertebrate Zoology, Oceans and Climate Change), Duke University Marine Laboratory, Beaufort, NC (1995-2000)
Selected Major Research Vessel Experience:
Phytoplankton Population / Optical Properties, R/V Endeavor (1992) Mesoscale Iron Addition / Limitation (IRONEX2), R/V Melville (1995) JGOFS Arabian Sea #6/7, R/V Thomas G. Thompson (1995) Zonal Biogeochemical Fluxes of Western Pacific, R/V Thompson (1996)
Selected Publications: Barber, R. T., Marra, J., Bidigare, R. R., Codispoti, L. A., Halpern, D., Johnson,
Z., Latasa, M., Goericke, R., Smith, S., (in press). Primary productivity and its regulation in the Arabian Sea during 1995. Deep-Sea Research II .
Johnson Z and P Howd (2000) Marine Photosynthetic Performance Forcing and
Periodicity for the Bermuda Atlantic Time Series, 1989-1995, Deep Sea Research I 47(8), 1485-1512
Johnson Z, ML Landry, RR Bidigare, SL Brown, L Campbell, J Gunderson, J
Marra, C Trees (1999) Energetics and growth kinetics of a deep Prochlorococcus spp. population in the Arabian Sea, Deep-Sea Research II 46, 1719-1943
Barber, R. T., Borden, L., Johnson, Z., Marra, J., Knudson, C., Trees, C., (1997)
Ground truthing modeled kpar and on deck primary productivity incubations with in situ incubations. Ocean Optics XIII SPIE 2963, 834-389.
Johnson Z (1997) Modeled inherent scattering properties of small light-limited
phytoplankton: implications for deep phytoplankton size class distributions. Ocean Optics XIII SPIE 2963, 862-7.