Embed Size (px)
Citation preview


i
COPYRIGHT PAGE
2018 International Conference on Smart Green Technology in Electrical and Information Systems (ICSGTEIS)
Copyright and Reprint Permission: Abstracting is permitted with credit to the source. Libraries are permitted to photocopy beyond the limit of U.S. copyright law for private use of patrons those articles in this volume that carry a code at the bottom of the first page, provided the per-copy fee indicated in the code is paid through Copyright Clearance Center, 222 Rosewood Drive, Danvers, MA 01923.
For Reprint or republication permission, email to IEEE Copyrights Manager at [email protected].
All rights reserved. Copyright ©2018 by IEEE.

ii
WELCOME MESSAGE
As the General Chair of the 2018 International Conference on Smart Green Technology in Electrical and Information Systems (ICSGTEIS), it is my great pleasure to welcome you to the conference held in Kuta Bali of Indonesia. The ICSGTEIS 2018 conference aims to provide a forum for international researchers, experts, and students to share, exchange ideas, innovation, and experience of the research in the field of Smart-Green Technology. The conference provides an opportunity to strengthen collaboration and networking among participants while enjoying a religious atmosphere and traditional culture of Bali.
The ICSGTEIS covers a number of topics organized into tracks such as Energy and Power Engineering, Electronic Devices and Systems, Multimedia Telecommunications, and Software Engineering and Information Systems. All accepted papers are selected through a peer review process. The committee has received 110 submissions, and 43 papers are selected for presentation. In addition to the technical sessions, the conference program also includes plenary lectures and social event.
I would like to take this opportunity to thank the keynote speakers: Professor Jean-Marie BONNIN from Institut Mines Télécom France, Dr Tania Urmee from School of Engineering and Information Technology Murdoch University, Perth, Australia, and Associate Professor Wei-Chung Teng from Department of Computer Science and Information Engineering, National Taiwan University of Science and Technology, Taiwan for sharing their latest research in their respected fields within electrical and information systems.
I would also like to express my appreciation to Professor AAR Sudewi as Rector Udayana University, Professor NG Antara as Vice Rector Udayana University for Academic Affairs, Professor NPG Suardana as Dean Faculty of Engineering, Dr IBG Manuaba as Head of Department of Electrical Engineering, Dr Linawati as Head of Postgraduate Program in Electrical Engineering, Faculty of Engineering, Udayana University who have supported the ICSGTEIS conference this year. I also would like to thank Professor FY Zulkifli as Chair of IEEE Indonesia Section for their continuous support to the conference. Many thanks also go to the Technical Program Committee and the Organizing Committee, Center for Community Based Renewable Energy (CORE) Udayana University, Udayana Center for Learning Innovation in Asia Pacific (UCLEAP), and IEEE Student Branch Udayana University. Last but not least, thanks to all Presenters and Authors who have chosen ICSGTEIS 2018 to publish their research findings which without their participation this conference would not be possible.
I wish you all to have a great time and a successful conference while sampling the hospitality of Bali.
Dr I Nyoman Satya Kumara, MIEEE General Chair of ICSGTEIS 2018

iii
INTERNATIONAL ADVISORY BOARD
M. Ashari (Indonesia) H. Orton (Canada)
Suwarno (Indonesia) B. T. Phung (Australia)
T. Usagawa (Japan) F. Y. Zulkifli (Indonesia)

iv
ORGANIZING COMMITTEE
General Chair:I N. S. Kumara
Co-Chair:W. G. Ariastina K. O. Saputra
General Secretary:N. M. A. E. D. Wirastuti
Co-Secretary:G. Sukadarmika
Treasury:I. N. Setiawan W. Sukerayasa
Program:Y. Divayana
I. B. G. Manuaba
Conference Management System:D. M. Wiharta D. C. Khrisne
Publications / Proceeding:N. P. Sastra
I M. A. Suyadnya

v
TECHNICAL PROGRAM COMMITTEE Chair:
I. A. D. Giriantari
Co-Chair:LinawatiL. Jasa
I. P. A. Bayupati (Indonesia) T. Basaruddin (Indonesia) T. R. Blackburn (Australia) D. Churchill (Hongkong) A. Dharma (Indonesia)
Z. Dewei (USA) M. Esa (Malaysia)
N. Gunantara (Indonesia) D. Gunawan (Indonesia) C. Y. Hui (Singapore)
G. Hendrantoro (Indonesia) R. S. Hartati (Indonesia) T. Hashimoto (Japan)
R. M. Ijtihadie (Indonesia) Y. S. Iwaran (Indonesia) B. Kosasih (Australia) K. Kunio (Japan)
R. Lumanto (Indonesia) I. Liem (Indonesia) E. Mutlugun (Turkey)
I. W. Mustika (Indonesia) H. Outhred (Australia) A. Priyadi (Indonesia)
I. K. E. Purnama (Indonesia) I. K. G. D. Putra (Indonesia) M. H. Purnomo (Indonesia) O. Penangsang (Indonesia) M. Retnanestri (Australia)
Y. Sasaki (Japan) E. Sari (Australia)
I. N. W. Satiawan (Indonesia) M. Sudarma (Indonesia) Y. K. Suprapto (Indonesia) S. Soegijoko (Indonesia) S. Y. Shin (South Korea) A. M. Tjoa (Austria) M. M. Tentzeris (USA)

vi
Taufik (USA) K. Umeno (Japan)
I. W. Widhiada (Indonesia) I. M. A. S. Wijaya (Indonesia)
Y. Xuyong (China)
vii
TABLE OF CONTENTS Copyright Page ................................................................................................................................................... i
Welcome Message .............................................................................................................................................. ii
International Advisory Board .............................................................................................................................. iii
Organizing Committee ....................................................................................................................................... iv
Technical Program Committee ............................................................................................................................ v
Table of Contents ............................................................................................................................................. vii
ANFIS-based Controller Application to Regulate Firing Angle of Inverter in Average Value Model-High Voltage Direct Current Transmission System ............................................................................ 1 I. M. Ginarsa, A.B. Muljono, I.M.A. Nrartha, I.P. Ardana
Smart Energy Meter for Electric Vehicle Based On Bluetooth And GSM Technology ............................... 7 I.M.A. Nrartha, A. B. Muljono, I M. Ginarsa, S. M. Al Sasongko, I.B.F. Citarsa
Sustainable energy for all: Impacts of Sustainable Development Goals implementation on household sector energy demand in Indonesia ...................................................................................... 13 Wayan G. Santika, Tania Urmee, Md. Anissuzaman, GM Shafiullah, Parisa A. Bahri
Auto-reclose Performance Evaluation on 500kV Transmission Line with Four Circuits on One Tower .................................................................................................................................................. 19 Aristo Adi Kusuma, Putu Agus Aditya Pramana, Kevin Gausultan H. M., Buyung Sofiarto Munir
Monitoring of Frequency Response in Java-Bali System during Loss of Generation Event .................. 24 Hariadi Aji, Adi Purwanto, Eko Yudo Pramono
An Assessment of Incentives Combination for Solar Energy Technologies – A Case Study for Chile ................................................................................................................................................. 29 Yeliz Simsek, Carlos Mata-Torres, Tania Urmee, Parisa Arabzadeh Bahri, Rodrigo Escobar
The Optical Band Gap based on K-M Function on Layer of LiTaO3 with Variation Treatment of Annealing Temperature .............................................................................................................................. 35 Nani Djohan, Richie Estrada, Nina Sevani, Hendradi Hardhienata, Irzaman
Feature Learning Using Convolutional Neural Network for Cardiac Arrest Detection .............................. 39 Minh Tuan Nguyen, Kim Kiseon
Design of Self-Tuning Regulator for Brushless DC Motor Speed Control ................................................. 43 Wahyudi, Mega Rosaliana, Sumardi, Budi Setiyono
Optimization of the Wideband Code Division Multiple Access Network at the BTS of Sempidi Area ..... 48 I Made Indra Wiguna, Gede Sukadarmika, Dewa Made Wiharta
Monitoring Systems for Counting People using Raspberry Pi 3 ................................................................ 57 K.Rantelobo, M. A. Indraswara, N. P. Sastra, D. M. Wiharta, H. F. J. Lami, H. Z. Kotta
Contact Strategy for VDTN Data Collection in Smart Cities ........................................................................ 61 Ngurah Indra ER, Kamal Deep SINGH, Jean-Marie BONNIN
viii
Simple carrier-based Space Vector PWM schemes of dual-inverter fed three-phase open-end winding motor drives with equal DC-link voltage ....................................................................... 65 I K. Wiryajati, I. A. D. Giriantari, I N. Satya Kumara, Lie Jasa
A Study of Optimal Power Flow Interconnection Celukan Bawang Power Plant in 150 kV Bali Electricity System .................................................................................................................................... 71 I Nyoman Aldy Munawan, Rukmi Sari Hartati, I Wayan Sukerayasa
The Evaluation of Ceramic Insulator Performance around Thermal Power Plant in Indonesia ............... 77 Brian Bramantyo S.D.A. Harsono, Buyung Sofiarto Munir, Nur Widi Priambodo, Handrea Bernando Tambunan
Investigation of Fault Event that Affected by The Current Transformer Position ..................................... 82 Putu Agus Aditya Pramana, Aristo Adi Kusuma, Buyung Sofiarto Munir, Arionmaro Asi Simaremare
A Study Of Corn Cob (Zea Mays) Utilization As Alternative Fuel For Biomass Power Plant In Sumbawa Island .......................................................................................................................................... 86 Ahmad Jaya, Rukmi Sari Hartati, I Nyoman Satya Kumara
Intermittent Renewable Energy Source (IRES) Penetration Level into Bangka Power System .............. 91 Handrea Bernando Tambunan, Kevin Gausultan H. Mangunkusumo, Brian Bramantyo S.D.A. Harsono, Arionmaro Asi Simaremare, Nur Widi Priambodo, Buyung Sofiarto Munir
Supervised Deep Learning Based for Traffic Flow Prediction .................................................................... 95 Hendrik Tampubolon, Pao-Ann Hsiung
Development of SMS Sending Software for Balinese Script Text on Android Platform ......................... 101 Ida Bagus Kade Dwi Suta Negara, NMAE Dewi Wirastuti, Nyoman Pramaita
Analysis and Implementation of K-means clustering algorithm for motorized-vehicles taxation strategy (case study: Bali Regional Revenue Department) ..................................................................... 104 Novandika Dwipayana, Gede Rasben Dantes, Gede Indrawan
Performance Evaluation of Caching Solution from Three Layers Perspective for Storage Performance in Vmware-based Virtualization Environment .................................................................... 108 Marcel
Developing Balinese Culture-Based Serious Game Model: I Rajapala as a Hunter ............................... 114 I Nyoman Putu Suwindra, I Ketut Gede Darma Putra, I Made Sudarma, Nyoman Putra Sastra
E-KUBU: Smart Home Automation System for Housing Energy Management ........................................ 120 Gusti Ayu Mayani Kristina Dewi, NMAED Wirastuti, A.A. Istri Ngurah Eka Karyawati, I Ketut Gede Suhartana, I Wayan Santiyasa, I Komang Ari Mogi, I Gede Arta Wibawa, Ida Bagus Gede Dwidasmara, Nyoman Dita Pahang Putra
A Study of Conversion of Sardine Flour Used Cooking Oil into Biodiesel Using Microfiltration and Transesterification Techniques ................................................................................... 126 Rukmi Sari Hartati, Atmiral Ernes, I Nyoman Suprapta Winaya, Poppy Diana Sari
Robot for Cleaning Solar PV Module to Support Rooftop PV Development ............................................ 132 I.P.G. Riawan, I.N.S. Kumara, C.G.I. Partha, I Nyoman Setiawan, D.A.S. Santiari

ix
Comparison of Battery Reliability for Offshore Remote Telemetry Unit .................................................. 138 Bachtiar Rifai, N.M.A.E.D. Wirastuti
Performance Evaluation of 25 KW Community Microhydro in Seloliman Village East Java .................. 144 Haksari Laksmi Bestari, I Nyoman Satya Kumara, Wayan Gede Ariastina
Comparison of PV Rooftop Energy Production at Denpasar City Office Building .................................. 150 I Putu Eddy Saskara, I Nyoman Satya Kumara, I Wayan Sukerayasa
Optimal PMU Placement In Bali 150 KV Network ........................................................................................ 157 I G P Ari Suyasa, Rukmi Sari Hartati, Dewa Made Wiharta
Virtual Backup Server Optimization on Data Centers using Neural Network .......................................... 162 Muhammad Riza Hilmi, Made Sudarma, Linawati
Development of Learning Vector Quantization Neural Network for Forecasting Fluctuations in Commodity Prices .................................................................................................................................... 168 I Putu Oka Wisnawa, Agus Dharma, Made Sudarma
Prediction of Sales Transaction Using Adaboost, Random Forest and Linear Regression in Retail Company ........................................................................................................................................ 174 Y. I. T. Widyanto, G.R. Dantes, I. N. Sukajaya
Geographic Information System for Balinese Handicraft Export Distribution using K-Medoid and Elbow Method ....................................................................................................................................... 179 DA Indah Cahya Dewi, IA Dwi Giriantari, M Sudarma
Opinion Mining on Twitter Social Media to Classify Racism Using Combination of POS Tagging, Naive Bayes Classifier, and K-Nearest Neighbor ....................................................................................... 185 M. Azman Maricar, I Nyoman Satya Kumara, Made Sudarma
Instrumentation Checking Information System for Sanglah Geophysical Station .................................. 191 Ida Bagus Putu Teguh Brahmantika , I Gusti Komang Diafari Djuni , Duman Care Khrisne
Performance Evaluation of Roof Top Smart Microgrid at Udayana University ...................................... 196 Ida A.D. Giriantari, Intan A. Medina, I W. Sukerayasa, Rina Irawati
New Turbine Design Model NEST-LIE ........................................................................................................ 200 Lie Jasa, I Putu Ardana, Ratna Ika Putri
Implementation of Grid-connected PV Plant in Remote Location in Sumbawa Island of Indonesia: Lesson Learned .......................................................................................................................... 203 INS Kumara, T Urmee, Y Divayana, IN Setiawan, AAGA Pawitra, A Jaya
Evaluation of Integrated University Management Information System Using COBIT 5 Domain DSS ... 210 Ayu Indah Saridewi, Dewa Made Wiharta, Nyoman Putra Sastra
Nonformal Test-Based Gamification Model to Improve Student Motivation ............................................ 215 Adi Panca Saputra Iskandar, Made Sudarma, Komang Oka Saputra
Indonesian Herbs and Spices Recognition using Smaller VGGNet-like Network ................................... 221 D. C. Khrisne, I M. A. Suyadnya
978-1-5386-6022-5/18/$31.00 ©2018 IEEE
Design of Self-Tuning Regulator for Brushless DC Motor Speed Control
Wahyudi Electrical Engineering Diponegoro University Semarang, Indonesia
Budi Setiyono Electrical Engineering Diponegoro University Semarang, Indonesia [email protected]
Mega Rosaliana Electrical Engineering Diponegoro University Semarang, Indonesia
Sumardi Electrical Engineering Diponegoro University Semarang, Indonesia
Abstract—Brushless DC (BLDC) motor is one type of dc electric motor that has various advantages such as higher of efficiency, torque under lows peed range, and power density, and lower maintenance because this motor does not use the brush in the commutation process. BLDC drive involves a complex process, so it takes the right control method to control its speed. This paper proposed Self-Tuning Regulator (STR) of Proportional Derivative (PD) controller where the parameters are adapted using fuzzy-logic. STR PD controller also can follow fixed reference faster than PD controller. It can follow speed reference change up and overcome the interference from the outside of a momentary disturbance, and STR PD controller technique had better performance than the PD controller, mainly when the motor was working at speed reference change down, it can minimize of undershoot that caused by PD controller.
Keywords—BLDC; PD; STR PD; fuzzy; speed
I. INTRODUCTION There are mainly two types dc electric motors used in
industry. The first one is the brushed dc motor where the flux is produced by the current through the field coil of the stationary pole structure. The second type is the brushless dc motor where the permanent magnet provides the necessary air gap flux instead of the wire-wound field poles. BLDC motor is conventionally defined as a permanent magnet synchronous motor with a trapezoidal Back EMF waveform shape. BLDC motors do not use brushes for commutation [1]. The BLDC motors exhibit better performance in terms of higher efficiency, higher torque under low speed range, higher power density, lower maintenance [2][3]. In practice, the design of the BLDC drive involves a complex process such as modeling, control scheme selection, simulation and parameters tuning etc.[1]. The speed of BLDC motor can be controlled by varying flux/pole, armature resistance and applied voltage [4].
Conventional PID controller algorithm is simple, stable, easy adjustment and high reliability. Normally, PID controller is an optimum choice for controlling the speed as the BLDC motor [5]. However, it has an uncertainty problem due to load as well as in set speed variations of BLDC motor. Self-Tuning Regulator (STR) is a popular approach. This regulator can be derived in a simple way which has a strong intuitive appeal [6].
This paper proposed STR PD controller where its parameters are adapted using fuzzy logic. Parameter of Kp and Kd can be adjusted real time. Fuzzy logic utilizes error
and error rate as input of system and uses Sugeno method in decision-making process. The are two set fuzzy rule for tuning Kp and Kd, by using this set of rules, the controller can be adapted to any change of parameter.
This experiment also compares the performance of the PD controller with the STR PD controller. System response analysis is done through observation of transient response parameters such as rise time, peak time, settling time, error of steady state, and overshoot or undershoot.
II. METHODOLOGY
A. Diagram Block Design
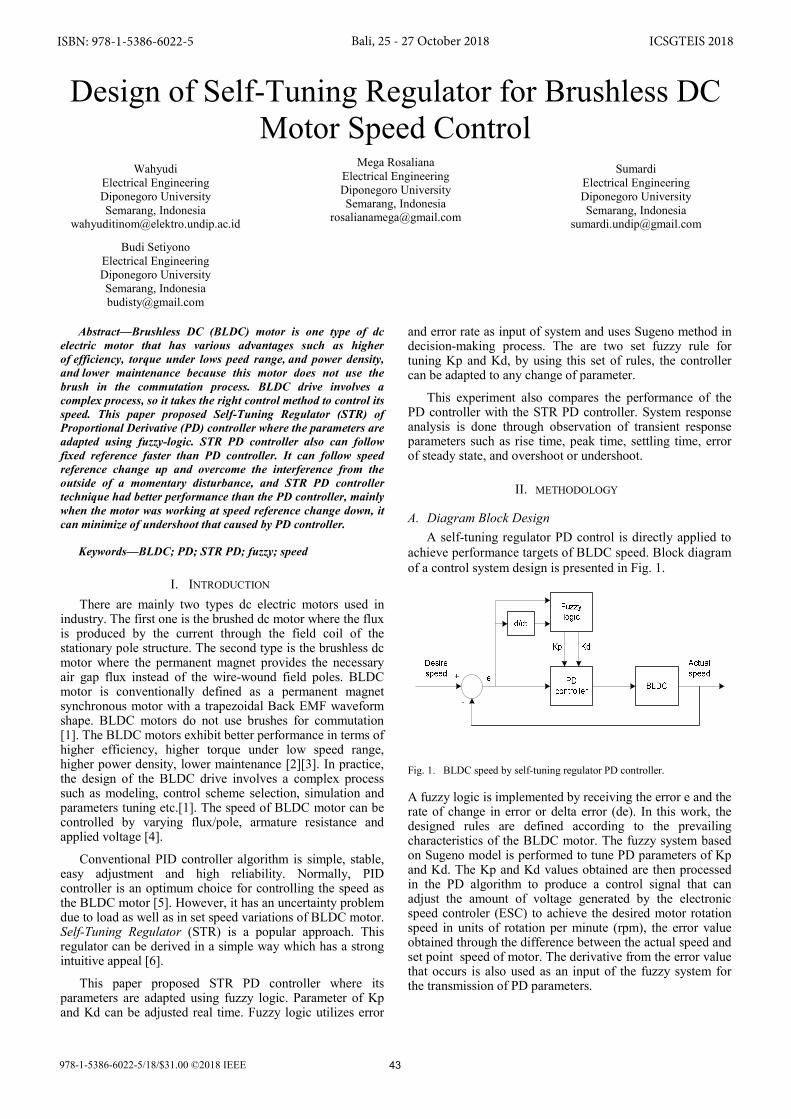
A self-tuning regulator PD control is directly applied to achieve performance targets of BLDC speed. Block diagram of a control system design is presented in Fig. 1.
Fig. 1. BLDC speed by self-tuning regulator PD controller.
A fuzzy logic is implemented by receiving the error e and the rate of change in error or delta error (de). In this work, the designed rules are defined according to the prevailing characteristics of the BLDC motor. The fuzzy system based on Sugeno model is performed to tune PD parameters of Kp and Kd. The Kp and Kd values obtained are then processed in the PD algorithm to produce a control signal that can adjust the amount of voltage generated by the electronic speed controler (ESC) to achieve the desired motor rotation speed in units of rotation per minute (rpm), the error value obtained through the difference between the actual speed and set point speed of motor. The derivative from the error value that occurs is also used as an input of the fuzzy system for the transmission of PD parameters.
ISBN: 978-1-5386-6022-5 Bali, 25 - 27 October 2018 ICSGTEIS 2018
43
B. Design of Hardware Components
The assembly of hardware components from the BLDC speed control is made by picture as shown in Fig. 2.
Fig. 2. Hardware component design.
An input speed data in units of rpm will be sent to the microcontroller from the interface program on the computer through serial communication.This micro controller is an 8 bit AVR microcontroller that has high capability and low power consumption, has a memory capacity of 16 Kbyte, 512 bytes EEPROM, 32 I / O channels, 32 registers, internal and external interruption units, and USART port for serial communication.
The microcontroller will process the input data to determine the output signal in the form as a control signal (PD) to further determine the amount of PWM in the ESC.ESC is a component that acts as a motor rotation controller BLDC. The size of an ESC is calculated in units of Ampere (A), where size is related to BLDC motor requirements. ESC will convert PWM into three-phase sinusoidal wave, which then rotate BLDC motor. The magnitude of PWM signals entering the ESC affects the amplitude and frequency of the sinusoidal wave that will enter the motor.
The rotary encoder sensor produces a pulse when the motor rotates,which is then fed back to the microcontroller. Microcontroller then performs its function as enumerator and converts the enumeration result into a speed scale that is rpm.The rotary encoder sensor is one of the hall speed sensors. This sensor is mounted with a disk encoder that gives 0 or 1 outputs according to the speed of the BLDC motor.The read speed the rotary motor of BLDC requires an additional filter to read sensor data. The designed filter is a low-pass filter typefor noise removal due to the location of the sensor next to the motor.
C. Controller Design
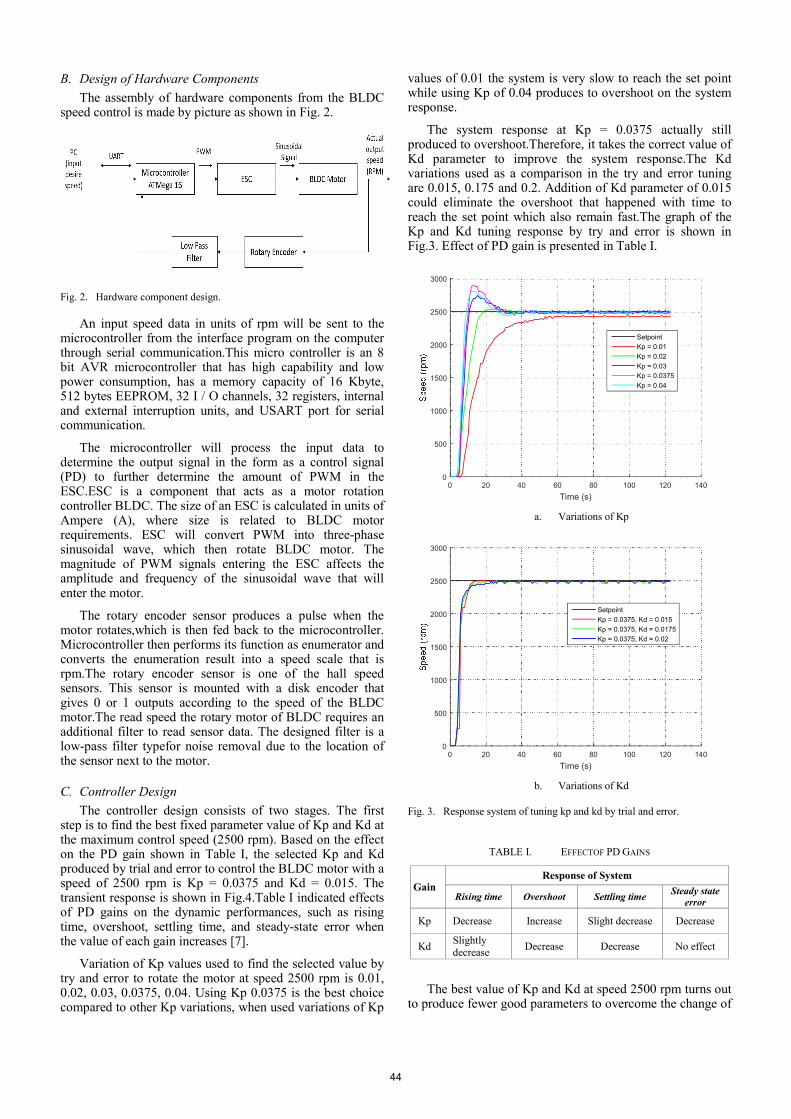
The controller design consists of two stages. The first step is to find the best fixed parameter value of Kp and Kd at the maximum control speed (2500 rpm). Based on the effect on the PD gain shown in Table I, the selected Kp and Kd produced by trial and error to control the BLDC motor with a speed of 2500 rpm is Kp = 0.0375 and Kd = 0.015. The transient response is shown in Fig.4.Table I indicated effects of PD gains on the dynamic performances, such as rising time, overshoot, settling time, and steady-state error when the value of each gain increases [7].
Variation of Kp values used to find the selected value by try and error to rotate the motor at speed 2500 rpm is 0.01, 0.02, 0.03, 0.0375, 0.04. Using Kp 0.0375 is the best choice compared to other Kp variations, when used variations of Kp
values of 0.01 the system is very slow to reach the set point while using Kp of 0.04 produces to overshoot on the system response.
The system response at Kp = 0.0375 actually still produced to overshoot.Therefore, it takes the correct value of Kd parameter to improve the system response.The Kd variations used as a comparison in the try and error tuning are 0.015, 0.175 and 0.2. Addition of Kd parameter of 0.015 could eliminate the overshoot that happened with time to reach the set point which also remain fast.The graph of the Kp and Kd tuning response by try and error is shown in Fig.3. Effect of PD gain is presented in Table I.
Time (s)0 20 40 60 80 100 120 140
0
500
1000
1500
2000
2500
3000
SetpointKp = 0.01Kp = 0.02Kp = 0.03Kp = 0.0375Kp = 0.04
a. Variations of Kp
Time (s)0 20 40 60 80 100 120 140
0
500
1000
1500
2000
2500
3000
SetpointKp = 0.0375, Kd = 0.015Kp = 0.0375, Kd = 0.0175Kp = 0.0375, Kd = 0.02
b. Variations of Kd
Fig. 3. Response system of tuning kp and kd by trial and error.
TABLE I. EFFECTOF PD GAINS
Gain Response of System
Rising time Overshoot Settling time Steady state error
Kp Decrease Increase Slight decrease Decrease
Kd Slightly decrease Decrease Decrease No effect
The best value of Kp and Kd at speed 2500 rpm turns out to produce fewer good parameters to overcome the change of
44
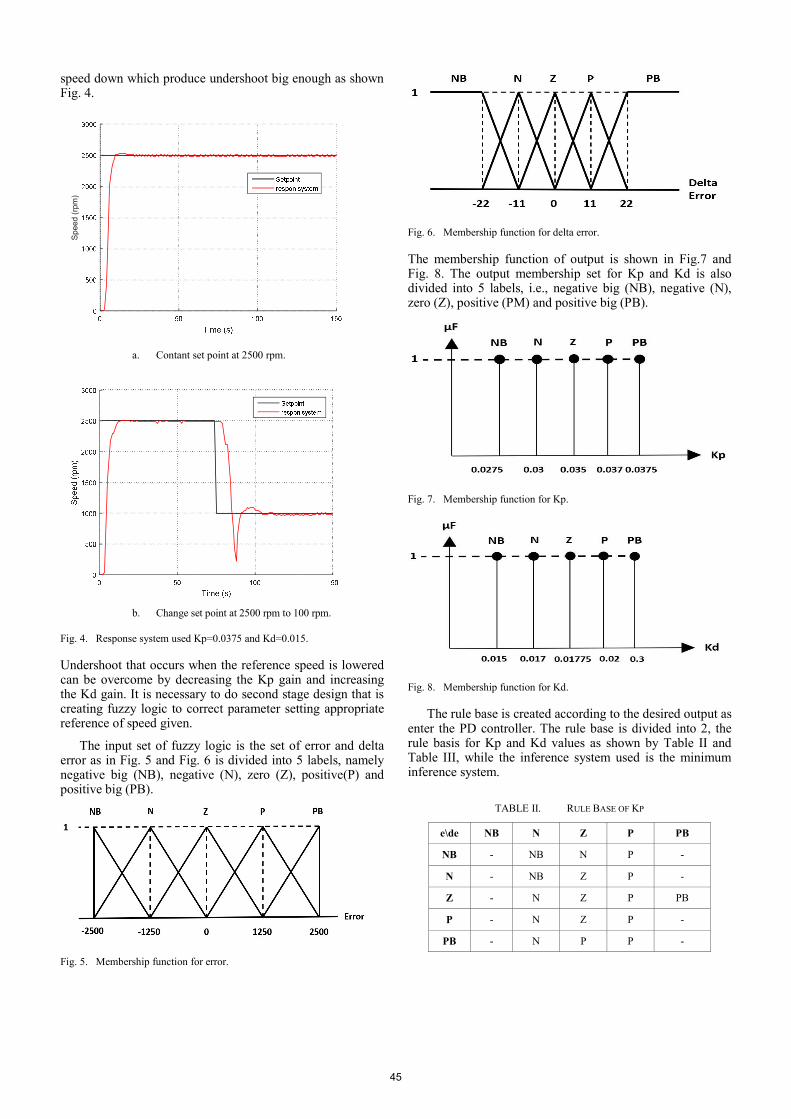
speed down which produce undershoot big enough as shown Fig. 4.
Spee
d (rp
m)
a. Contant set point at 2500 rpm.
b. Change set point at 2500 rpm to 100 rpm.
Fig. 4. Response system used Kp=0.0375 and Kd=0.015.
Undershoot that occurs when the reference speed is lowered can be overcome by decreasing the Kp gain and increasing the Kd gain. It is necessary to do second stage design that is creating fuzzy logic to correct parameter setting appropriate reference of speed given.
The input set of fuzzy logic is the set of error and delta error as in Fig. 5 and Fig. 6 is divided into 5 labels, namely negative big (NB), negative (N), zero (Z), positive(P) and positive big (PB).
Fig. 5. Membership function for error.
Fig. 6. Membership function for delta error.
The membership function of output is shown in Fig.7 and Fig. 8. The output membership set for Kp and Kd is also divided into 5 labels, i.e., negative big (NB), negative (N), zero (Z), positive (PM) and positive big (PB).
Fig. 7. Membership function for Kp.
Fig. 8. Membership function for Kd.
The rule base is created according to the desired output as enter the PD controller. The rule base is divided into 2, the rule basis for Kp and Kd values as shown by Table II and Table III, while the inference system used is the minimum inference system.
TABLE II. RULE BASE OF KP
e\de NB N Z P PB
NB - NB N P -
N - NB Z P -
Z - N Z P PB
P - N Z P -
PB - N P P -
45
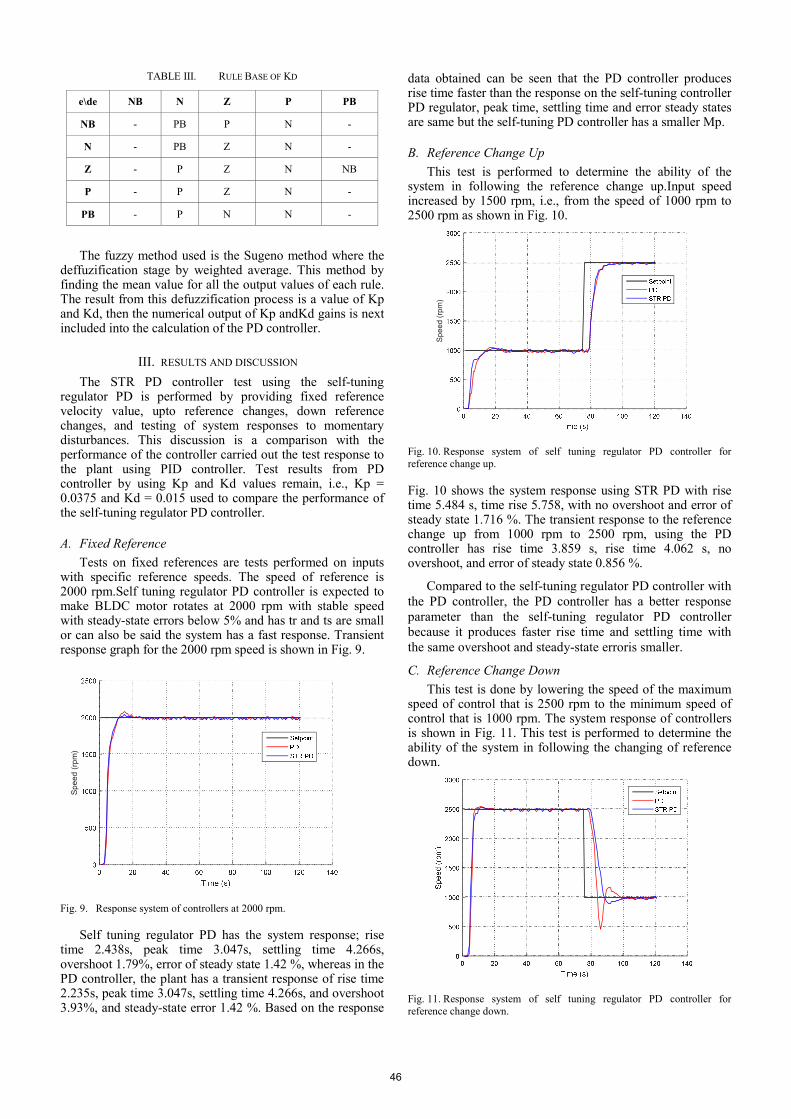
TABLE III. RULE BASE OF KD
e\de NB N Z P PB
NB - PB P N -
N - PB Z N -
Z - P Z N NB
P - P Z N -
PB - P N N -
The fuzzy method used is the Sugeno method where the deffuzification stage by weighted average. This method by finding the mean value for all the output values of each rule. The result from this defuzzification process is a value of Kp and Kd, then the numerical output of Kp andKd gains is next included into the calculation of the PD controller.
III. RESULTS AND DISCUSSION
The STR PD controller test using the self-tuning regulator PD is performed by providing fixed reference velocity value, upto reference changes, down reference changes, and testing of system responses to momentary disturbances. This discussion is a comparison with the performance of the controller carried out the test response to the plant using PID controller. Test results from PD controller by using Kp and Kd values remain, i.e., Kp = 0.0375 and Kd = 0.015 used to compare the performance of the self-tuning regulator PD controller.
A. Fixed Reference
Tests on fixed references are tests performed on inputs with specific reference speeds. The speed of reference is 2000 rpm.Self tuning regulator PD controller is expected to make BLDC motor rotates at 2000 rpm with stable speed with steady-state errors below 5% and has tr and ts are small or can also be said the system has a fast response. Transient response graph for the 2000 rpm speed is shown in Fig. 9.
Spee
d (rp
m)
Fig. 9. Response system of controllers at 2000 rpm.
Self tuning regulator PD has the system response; rise time 2.438s, peak time 3.047s, settling time 4.266s, overshoot 1.79%, error of steady state 1.42 %, whereas in the PD controller, the plant has a transient response of rise time 2.235s, peak time 3.047s, settling time 4.266s, and overshoot 3.93%, and steady-state error 1.42 %. Based on the response
data obtained can be seen that the PD controller produces rise time faster than the response on the self-tuning controller PD regulator, peak time, settling time and error steady states are same but the self-tuning PD controller has a smaller Mp.
B. Reference Change Up
This test is performed to determine the ability of the system in following the reference change up.Input speed increased by 1500 rpm, i.e., from the speed of 1000 rpm to 2500 rpm as shown in Fig. 10.
Spee
d (rp
m)
Fig. 10. Response system of self tuning regulator PD controller for reference change up.
Fig. 10 shows the system response using STR PD with rise time 5.484 s, time rise 5.758, with no overshoot and error of steady state 1.716 %. The transient response to the reference change up from 1000 rpm to 2500 rpm, using the PD controller has rise time 3.859 s, rise time 4.062 s, no overshoot, and error of steady state 0.856 %.
Compared to the self-tuning regulator PD controller with the PD controller, the PD controller has a better response parameter than the self-tuning regulator PD controller because it produces faster rise time and settling time with the same overshoot and steady-state erroris smaller.
C. Reference Change Down
This test is done by lowering the speed of the maximum speed of control that is 2500 rpm to the minimum speed of control that is 1000 rpm. The system response of controllers is shown in Fig. 11. This test is performed to determine the ability of the system in following the changing of reference down.
Fig. 11. Response system of self tuning regulator PD controller for reference change down.
46
Response system of self-tuning like as Fig.12 shows that system has rise time 3.047 s, settling time 5.891 s, no overshoot, undershoot 9.9 % and error of steady state 4.28 % when reference change down from maximum speed 2500 rpm go to minimum speed 1000 rpm. The value of transient response parameters from the use of PD controller that is rise time 2.069 s, settling time 4.875 s, undershoot 55 % and overshoot 15.72 %, error of steady state 2.14 %.
In both the reference, testing is changed down it is using the STR PD controller and the PD controller. The system response result of the self-tuning regulator PD controller can minimize to undershoot in the PD controller from 55% to 9.9% even with the slower rise time and settling time.
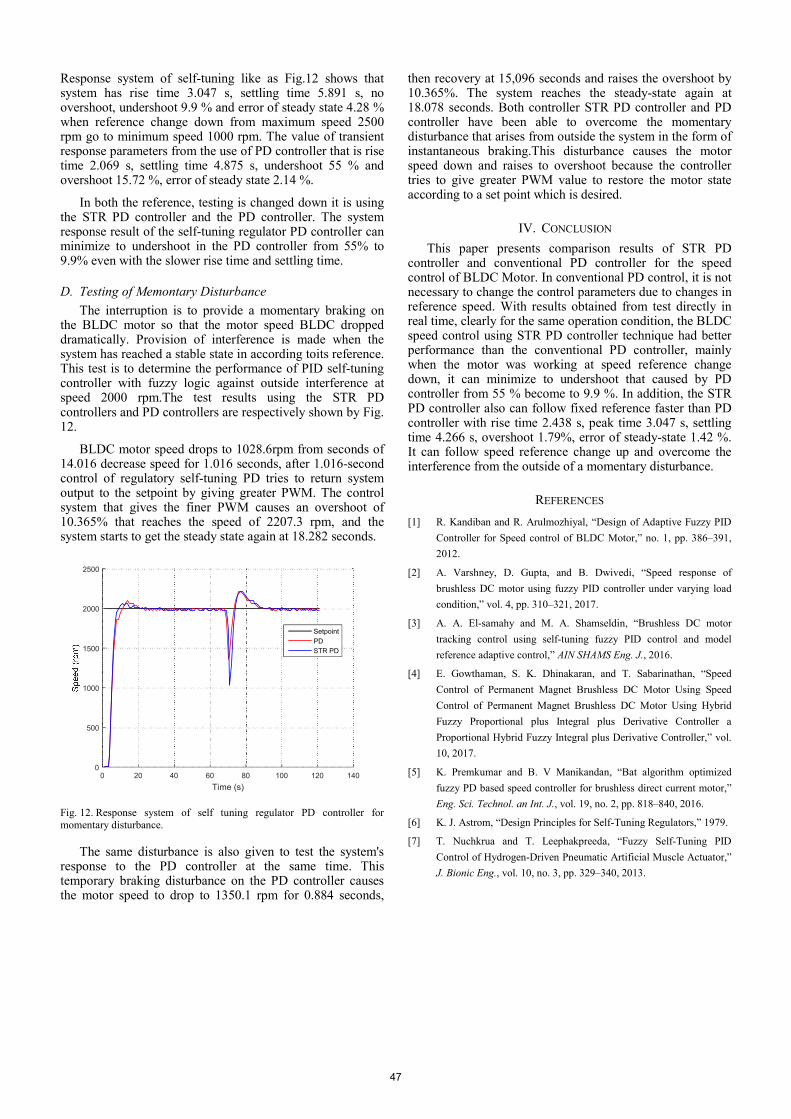
D. Testing of Memontary Disturbance
The interruption is to provide a momentary braking on the BLDC motor so that the motor speed BLDC dropped dramatically. Provision of interference is made when the system has reached a stable state in according toits reference. This test is to determine the performance of PID self-tuning controller with fuzzy logic against outside interference at speed 2000 rpm.The test results using the STR PD controllers and PD controllers are respectively shown by Fig. 12.
BLDC motor speed drops to 1028.6rpm from seconds of 14.016 decrease speed for 1.016 seconds, after 1.016-second control of regulatory self-tuning PD tries to return system output to the setpoint by giving greater PWM. The control system that gives the finer PWM causes an overshoot of 10.365% that reaches the speed of 2207.3 rpm, and the system starts to get the steady state again at 18.282 seconds.
Time (s)0 20 40 60 80 100 120 140
0
500
1000
1500
2000
2500
SetpointPDSTR PD
Fig. 12. Response system of self tuning regulator PD controller for momentary disturbance.
The same disturbance is also given to test the system's response to the PD controller at the same time. This temporary braking disturbance on the PD controller causes the motor speed to drop to 1350.1 rpm for 0.884 seconds,
then recovery at 15,096 seconds and raises the overshoot by 10.365%. The system reaches the steady-state again at 18.078 seconds. Both controller STR PD controller and PD controller have been able to overcome the momentary disturbance that arises from outside the system in the form of instantaneous braking.This disturbance causes the motor speed down and raises to overshoot because the controller tries to give greater PWM value to restore the motor state according to a set point which is desired.
IV. CONCLUSION
This paper presents comparison results of STR PD controller and conventional PD controller for the speed control of BLDC Motor. In conventional PD control, it is not necessary to change the control parameters due to changes in reference speed. With results obtained from test directly in real time, clearly for the same operation condition, the BLDC speed control using STR PD controller technique had better performance than the conventional PD controller, mainly when the motor was working at speed reference change down, it can minimize to undershoot that caused by PD controller from 55 % become to 9.9 %. In addition, the STR PD controller also can follow fixed reference faster than PD controller with rise time 2.438 s, peak time 3.047 s, settling time 4.266 s, overshoot 1.79%, error of steady-state 1.42 %. It can follow speed reference change up and overcome the interference from the outside of a momentary disturbance.
REFERENCES [1] R. Kandiban and R. Arulmozhiyal, “Design of Adaptive Fuzzy PID
Controller for Speed control of BLDC Motor,” no. 1, pp. 386–391, 2012.
[2] A. Varshney, D. Gupta, and B. Dwivedi, “Speed response of brushless DC motor using fuzzy PID controller under varying load condition,” vol. 4, pp. 310–321, 2017.
[3] A. A. El-samahy and M. A. Shamseldin, “Brushless DC motor tracking control using self-tuning fuzzy PID control and model reference adaptive control,” AIN SHAMS Eng. J., 2016.
[4] E. Gowthaman, S. K. Dhinakaran, and T. Sabarinathan, “Speed Control of Permanent Magnet Brushless DC Motor Using Speed Control of Permanent Magnet Brushless DC Motor Using Hybrid Fuzzy Proportional plus Integral plus Derivative Controller a Proportional Hybrid Fuzzy Integral plus Derivative Controller,” vol. 10, 2017.
[5] K. Premkumar and B. V Manikandan, “Bat algorithm optimized fuzzy PD based speed controller for brushless direct current motor,” Eng. Sci. Technol. an Int. J., vol. 19, no. 2, pp. 818–840, 2016.
[6] K. J. Astrom, “Design Principles for Self-Tuning Regulators,” 1979.
[7] T. Nuchkrua and T. Leephakpreeda, “Fuzzy Self-Tuning PID Control of Hydrogen-Driven Pneumatic Artificial Muscle Actuator,” J. Bionic Eng., vol. 10, no. 3, pp. 329–340, 2013.
47


SEMINAR INTERNASIONAL ICSGTEIS 2018
NEGARA ASAL PENULIS :
1. Indonesia 2. Australia 3. Chile 4. South Korea 5. France 6. Taiwan
ISBN: 978-1-5386-6022-5 Bali 25 - 27 October 2018 ICSGTEIS 2018
The present study is a part of the first author’s Ph.D. project, which is financed under the Indonesian Lecturers Scholarship (BUDI-LPDP), a collaborative program between the Ministry of Research, Technology and Higher Education and the Ministry of Finance of Indonesia.
Sustainable energy for all: Impacts of Sustainable Development Goals implementation on household
sector energy demand in Indonesia Wayan G. Santika
School of Engineering and Information Technology
Murdoch University Perth, Australia
Mechanical Engineering Department Bali State Polytechnic
Bali, Indonesia [email protected]
Tania Urmee School of Engineering and Information
Technology Murdoch University
Perth, Australia
GM Shafiullah School of Engineering and Information
Technology Murdoch University
Perth, Australia
Md. Anissuzaman School of Engineering and Information
Technology Murdoch University
Perth, Australia
Parisa A. Bahri School of Engineering and Information
Technology Murdoch University
Perth, Australia
Abstract—The present study investigates the impacts of the implementation of the energy goal of SDGs (SDG 7) to national development plans on household sector energy demand of Indonesia. Three scenarios were developed: reference, current policy, and SDGs scenarios, which were simulated using the Long-range Energy Alternatives Planning system (LEAP). Results show that providing clean energy access for all Indonesian (Target 7.1 of SDG 7) will increase energy demand by 67 million GJ, by 2030. However, implementation of efficiency measures (Target 7.3) will cancel out this increase. This study also reveals and discusses other interesting findings.
Keywords—Indonesia, energy demand, SDGs, Sustainable Development Goals, energy access, energy intensity, energy efficiency, household sector, LEAP, energy projection, energy planning.
I. INTRODUCTION In September 2015, the United Nations member countries
adopted the Sustainable Development Goals (SDGs) as the global agenda to end poverty, save the earth, and provide peace and prosperity for all, by 2030. There are 17 goals and 196 targets under the SDGs, many of which are supposed to be prioritized and incorporated into countries’ local and national agendas and plans. Most of the goals and targets are interlinked with energy [1, 2] which indicates that the SDGs implementation will give impacts to energy supply and demand. It implies that mainstreaming the SDGs into national plans will also require revisiting national energy plans. Consequently, energy forecasting and outlook will need to be re-examined to consider the SDGs implementation. For example, the current Indonesia energy outlook modeled by the Agency for Assessment and Application of Technology (BPPT) of Indonesia [3] considers only the current policy, economic and demographic variables in its forecasting. Those variables do not necessarily represent the SDGs. Similarly, the SDGs are also absent in the Indonesian National Energy Council’s (DEN) latest national energy outlook [4].
The objective of the present study is to find out if the implementation of the SDGs will give impacts to energy demand. Due to space constraints, the present study limits its
discussion only on the effects of SDG 7 (about affordable and clean energy) on the household sector energy demand in Indonesia. The research question addressed by this study is: What is the impact of SDG 7 on the household sector energy demand of Indonesia?
SDG 7 accommodates three targets directly related to energy: Target 7.1 – ensure universal access to modern energy, Target 7.2 – increase the share of renewable energy, and Target 7.3 – double the energy efficiency improvement rate. All targets should be achieved by 2030. Targets 7.1 and 7.3 will increase and reduce energy requirement, respectively, and Target 7.2 will change the proportion of fuel shares in the national energy mix.
We choose the household sector in Indonesia because the household sector is strongly related to SDG 7 and the Indonesian household sector consumes a significant amount of energy. For example, the state electricity company (PLN) total electricity sales in 2015 is 202.846 TWh, of which 43.7% is consumed by the household sector [5]. Furthermore, 32.7% (or 2286776.178 TJ) of the total final energy consumption (TFEC) is consumed by the household sector in 2015 [6]. Figure 1 shows the shares of electricity sales and final energy consumption in Indonesia.
Fig. 1. The shares of electricity sales (above) and final energy consumption (below) in Indonesia. Data sources: [5, 6].
978-1-5386-6022-5/18/$31.00 ©2018 IEEE 13
978-1-5386-6022-5/18/$31.00 ©2018 IEEE
An Assessment of Incentives Combination for Solar Energy Technologies – A Case Study for Chile
Yeliz Simsek Department of Mechanical and
Metallurgical Engineering Pontificia Universidad Católica de
Chile Santiago, Chile [email protected]
School of Engineering and Information Technology
Murdoch University Perth, Australia
Carlos Mata-Torres Department of Mechanical and
Metallurgical Engineering Pontificia Universidad Católica de
Chile Santiago, Chile [email protected]
Parisa Arabzadeh Bahri School of Engineering and Information
Technology Murdoch University
Perth, Australia [email protected]
Tania Urmee School of Engineering and Information
Technology Murdoch University
Perth, Australia [email protected]
Rodrigo Escobar Department of Mechanical and
Metallurgical Engineering Pontificia Universidad Católica de
Chile Santiago, Chile
Abstract—When solar energy technologies are compared to the conventional energy production alternatives, they may require incentives and financial support due to their relatively high investment costs and low bidding offers in electricity markets. Tax and cash incentives are able to diminish the gap between the levelized cost of electricity and the power purchasing agreements in most of the projects. The purpose of this paper is to research the effect of combining a number of tax and cash incentives under different financial structures and to find the best combinations of support mechanisms by considering maximum reduction of levelized cost of electricity and minimum government cost, applied to Chile as a case study.
Keywords—CSP, Renewable Energy Incentives, LCOE Reduction, Solar Energy Policy, Chile
I. INTRODUCTION High energy demand growth, uncertain fuel prices, and
the rising concern about climate change are pushing countries to make efforts for the promotion and adoption of sustainable and green electricity in the last decades.
In parallel to developments worldwide, Chile has also set renewable energy targets which are “at least 70% of the electricity in Chile to be generated from renewable energy sources by 2050 [1], [2]” by trusting its significant renewable energy potential. In recent years, due to the high solar potential of northern Chile with the approximate annual average of Direct Normal Irradiation (DNI) of 10 kWh/m2 per day [3], solar energy projects have gained importance in this region. It is apparent that concentrated solar power (CSP) projects with thermal storage and photovoltaic (PV) technology could have substantial contribution to reach national electricity target by producing continuous, sustainable, and clean energy in Chile. However, for CSP projects, it is hard to enter the electricity market in Chile without any support mechanisms due to reducing installation costs of other technologies and low bidding offers. In the latest electricity bidding process in Chile, the companies which offered less than approximately US$55 per MWh won this auction, and the minimum offer was given as US$29.2 per MWh by a PV company [4]. The levelized cost of electricity (LCOE) price for CSP projects was between US$100-120 per MWh until 2017. However, these prices are
lower at about US$60-70 per MWh for the CSP projects in Australia and Dubai planned for 2020 and 2022, respectively [5].
In order to promote solar energy technologies in Chile, some incentives should be considered by the government. Simsek et al [4] showed that investment tax credit (ITC), and production tax credit (PTC) as tax incentives and production-based incentives (PBI) as cash incentives reduced LCOE better than investment-based incentives (IBI) in CSP projects in Chile when they were considered individually. However, in low bidding offer situations, solar energy technologies may require the combination of the incentives instead of individual applications.
The aim of this research was to investigate the effect of combining several tax and cash incentives under different financial structures and to find the best combinations of support mechanisms by considering the maximum levelized cost of electricity reduction and minimum government cost. Due to its essential solar potential and low bidding offers, Chile was considered as a case study.
This paper provides an analysis of the behaviour of combining tax and cash incentives under different financial schemes to help with promotion of solar electricity in Chile. In this analysis, both LCOE reduction and the most economical support mechanism for a government which is minimum government cost are considered. The article is organized as follows: Section 2 describes the proposed methodology including the general assumptions, incentives, financial parameters and equations considered in the research. Section 3 includes LCOE and government cost analyses and the results. Finally, Section 4 concludes the paper.
II. METHODOLOGY
In this section, the methodology followed in the research is explained.
Two different types of solar power plants, CSP (with thermal storage) and PV (with battery storage), with the net capacity of 100 MW and 12 hours of storage were considered in the research. Solar data measurement of Crucero, located in Northern Chile was chosen due to its high solar radiation, which is roughly 3500kWh/m2/year of
ISBN: 978-1-5386-6022-5 Bali, 25 - 27 October 2018 ICSGTEIS 2018
29
Feature Learning Using Convolutional Neural Network for Cardiac Arrest Detection
Minh Tuan Nguyen School of Electrical Engineering and Computer Science
Gwangju Institute of Science and Technology Gwangju, South Korea
Kim Kiseon School of Electrical Engineering and Computer Science
Gwangju Institute of Science and Technology Gwangju, South Korea
Abstract—Arrhythmias including ventricular fibrillation and ventricular tachycardia, which are known as shockable rhythms, are the mainly cause of sudden cardiac arrests (SCA). In this paper, we propose a feature learning scheme applied for detection of SCA on electrocardiogram signal with the modified variational mode decomposition technique. The subsequent SAA consists of a convolutional neural network as a feature extractor (CNNE) and a support vector machine classifier. The features extracted by selected CNNE are then validated using 5-folds CV procedure on the evaluation data, and enable the accuracy of 99.02 %, sensitivity of 95.21 %, and specificity of 99.31 %.
Keywords—Sudden cardiac arrest (SCA), Machine learning (ML), Deep learning (DL), Convolutional Neural Network (CNN).
I. INTRODUCTION Sudden cardiac arrest (SCA) is heart ailment and
automated external defibrillator (AED) helps to recover the normal sinus rhythms of the heart from the cardiac electrical activity [1]. The shock advice algorithms (SAA) applied for the AED in the literature to detect the SCA have counted on conventional feature extraction (FE) schemes. The input features are widely extracted from the stand-alone electrocardiogram (ECG) [1], [2], alternative signals [3], [4] based on clinical expertise. Subsequently, the performance of the classification models is significantly dependent on the quality of the extracted input feature space and the final feature combinations. This is accomplished by adopting the feature selection (FS) algorithms to eliminate the irrelevant features from the input feature space and improve the learning process of the ML classifiers [5], [6].
Deep learning, especially convolutional neural network (CNN), has been widespread applied for biomedical signal processing and application design problems due to its strong feature learning capabilities, no requirement of expertise-based FE and FS algorithms [7]. Indeed, the first research adopting deep learning technique for SCA detection is proposed in [7] in which the SAA is designed as the eleven-layer deep CNN. However, the detection performance of this SAA does not meet the American Heart Association recommendations for the AED. In general, previous works only pay attention to a specific CNN structure using the stand-alone ECG signal, which leads possibly to omit other effective structures of the CNN. Moreover, the learned features extracted by the CNN as a feature extractor have not been investigated for the input of the ML classifiers with respect to improvement of SCA detection performance.
In this paper, a novel FE and SAA is proposed for detection of SCA, which uses the feature set extracted by the CNN extractor (CNNE) as the input of the SVM classifier. Here, the modified (MVMD) technique is used to reconstruct SH and NSH signals, which have most of power of SH and NSH components inside the bandwidths below and above 10 Hz, respectively, from preprocessed ECG signal [6], [8]. Three above signals are then arranged as the input channels of the CNN.
II. DATA, CNN, AND SVM
A. Data
We used public databases namely the Creighton University Ventricular Tachyarrhythmia Database (CUDB) and the MIT-BIH Malignant Ventricular Arrhythmia Database (VFDB) similarly in [6]: The annotations are VF, VT, and non-VF in CUDB. Ventricular flutter, VF, and VT are annotated for SH rhythms and others for NSH rhythms in VFDB database. Moreover, artifacts, noise, asystole, transition rhythm, low peak-to-peak amplitude under 200 µV of VF and intermediate rhythms of slow VT for which rate under 150 beats per min are also eliminated from the database. Indeed, the defibrillation archives no benefit for these rhythms, which are neither SH nor NSH rhythms [5]. Removal of these rhythms makes the requirements of algorithm performance appropriate [6] and ensures that the algorithm can identify correct rhythms. Table 1 shows the number of 5s-segments and records used for training and evaluation data.
The databases are preprocessed with five-order moving average filtering to make them smooth. Then, bandpass filter with cutoff frequencies of 1 Hz and 30 Hz is applied to eliminate the base line wander and high frequency.
B. CNN [10]
The CNN consists of different layers, which are input, convolutional, rectified linear unit, max-pooling layer, fully connected layers, and output layer.
Input layer (Inp): The preprocessed ECG segment, SH and NSH signals are arranged as three input channels, which are fed into the CNN.
Convolutional layer (Conv): The Conv layer plays a role of feature detection at different positions in the input signals. The primary element of this layer is the filter, which is a line-shaped object that scans over the input signal to produce an activation map.
ISBN: 978-1-5386-6022-5 Bali, 25 - 27 October 2018 ICSGTEIS 2018
978-1-5386-6022-5/18/$31.00 ©2018 IEEE 39
ISBN: 978-1-5386-6022-5 Bali, 25 - 27 October 2018 ICSGTEIS 2018
978-1-5386-6022-5/18/$31.00 ©2018 IEEE
Contact Strategy for VDTN
Data Collection in Smart Cities
Ngurah Indra ER
IRISA/ IMT-Atlantique, Rennes-France
& Udayana University, Bali-Indonesia
Kamal Deep SINGH
Laboratoire Hubert Curien
Universite Jean Monnet Saint-Etienne – France
Jean-Marie BONNIN
IRISA/ IMT-Atlantique
Rennes – France
Abstract—The number of connected devices will increase
exponentially in the coming years, emitting a massive amount of
data to the networks. A vehicle-based data collection
architecture for smart cities will enable the offloading of some
data for delay-tolerant applications. However, our previous
work showed the diversity in data pick-up pattern by vehicles
based on location in the city. Build on those findings this paper
introduces a preliminary study on a contact strategy for wireless
sensors data collection utilizing Vehicular Delay Tolerant
Networks (VDTN) in smart cities. The strategy formulates
relation between mutual communications range, vehicle's speed,
and periodic discovery time by the sensor. We then propose
sensor's buffer occupancy value as a measure for the adaptation
of its communications discovery period, with the purpose of
reducing energy consumption.
Keywords— Contact Strategy, Data Collection, Smart Cities,
DC4LED, Hierarchical VDTN Routing
I. INTRODUCTION
It is forecasted that more than 30 billion connected
devices will be installed worldwide by the year 2020,
and it will be more than doubled that number in the
year 2025 [1]. Most of those devices will provide data
for smart cities and its citizen. Consequently, a large
amount of data need to be collected and to be delivered to
each destination and then processed by corresponding
applications. One such application is delay-tolerant
applications, where it can be feed by data which does
not need to arrive instantly, i.e., communication latency in
order of minutes or even hours is adequate. Some
examples of such applications are the environmental
monitoring, smart metering [2], photos reporting of road
degradation, etc.
On the other hand, the era of connected-vehicles is
starting to become a reality. Vehicles will have the
capability to exchange information between them, as well
as with their surrounding environment, with vehicle- to-
everything (V2X) communications technology. They can
also have the connectivity to the internet by utilizing current
and future radio access networks. Decision makers around
the world will soon make such capabilities compulsory
for vehicles [3], which further elevates the possibility for
vehicles to play an integral part in smart cities ecosystems.
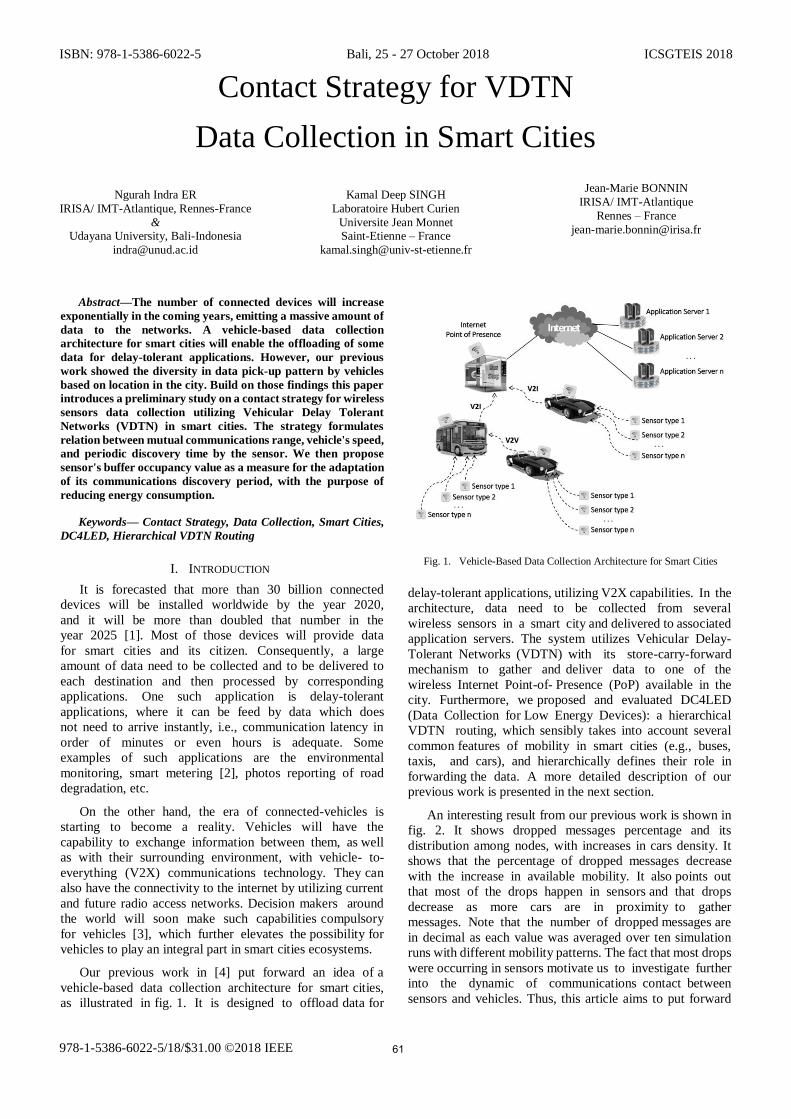
Our previous work in [4] put forward an idea of a
vehicle-based data collection architecture for smart cities,
as illustrated in fig. 1. It is designed to offload data for
delay-tolerant applications, utilizing V2X capabilities. In the
architecture, data need to be collected from several
wireless sensors in a smart city and delivered to associated
application servers. The system utilizes Vehicular Delay-
Tolerant Networks (VDTN) with its store-carry-forward
mechanism to gather and deliver data to one of the
wireless Internet Point-of- Presence (PoP) available in the
city. Furthermore, we proposed and evaluated DC4LED
(Data Collection for Low Energy Devices): a hierarchical
VDTN routing, which sensibly takes into account several
common features of mobility in smart cities (e.g., buses,
taxis, and cars), and hierarchically defines their role in
forwarding the data. A more detailed description of our
previous work is presented in the next section.
An interesting result from our previous work is shown in
fig. 2. It shows dropped messages percentage and its
distribution among nodes, with increases in cars density. It
shows that the percentage of dropped messages decrease
with the increase in available mobility. It also points out
that most of the drops happen in sensors and that drops
decrease as more cars are in proximity to gather
messages. Note that the number of dropped messages are
in decimal as each value was averaged over ten simulation
runs with different mobility patterns. The fact that most drops
were occurring in sensors motivate us to investigate further
into the dynamic of communications contact between
sensors and vehicles. Thus, this article aims to put forward
Fig. 1. Vehicle-Based Data Collection Architecture for Smart Cities
61
ISBN: 978-1-5386-6022-5 Bali, 25 - 27 October 2018 ICSGTEIS 2018
978-1-5386-6022-5/18/$31.00 ©2018 IEEE
Supervised Deep Learning Based for Traffic Flow Prediction
Hendrik Tampubolon Department of Information Systems Krida Wacana Christian University
Jakarta, Indonesia [email protected]
Pao-Ann Hsiung Department of Computer Science and
Information Engineering National Chung Cheng University
Chiayi, Taiwan [email protected]
Abstract— In metropolitan areas, common traffic issues include traffic congestion, traffic accidents, air pollution, and energy consumption occur. To resolve this issues, Intelligent Transportation Systems (ITS) have been evolved by many researchers. One of the important sub-systems in the development of ITS is a Traffic Management System (TMS) which attempts to reduce a traffic congestion. In fact, TMS itself relies on the estimation of traffic flow, therefore providing such an accurate traffic flow prediction is needed. For this reason, we aim to provide an accurate traffic flow prediction to facilitate this system. In this works, a Supervised Deep Learning Based Traffic Flow Prediction (SDLTFP) was proposed which is a type of fully-connected deep neural network (FC-DNN). Timely prediction is also a major issue in guaranteeing reliable traffic flow prediction. However, training a deep network could be time-consuming, and overfitting is might be happening, especially when feeding small data into the deep architecture. The network is learned perfectly during the training, but in testing with the new data, it could fail to generalize the model. We adopt the Batch Normalization (BN) and Dropout techniques to help the network training. SGD and momentum are carried out to update the weight. We then take advantage of open data as historical traffic data which are then used to predict future traffic flow with the proposed method and model above. Experiments show that the Mean Absolute Percentage Error (MAPE) for our traffic flow prediction is within 5 % using sample data and between 15% to 20% using out of the sample data. Training a deep network faster with BN and Dropout reduces the overfitting.
Keywords— Deep Learning, Traffic Flow Prediction, Dropout, Batch Normalization, Intelligent Transportation Systems
I. INTRODUCTION In the metropolitan areas, common traffic issues include
traffic congestion, traffic accident, energy consumption occurs. One of the reason is due to the use of road demand is increasing as the number of vehicles is also continued increasing [1]. One of the solutions is the development of Intelligent Transportation Systems (ITS) application which estimates the traffic stream. As such, traffic flow prediction is a strong need. Therefore, providing an accurate and timely predictive model is a serious concern. On the other hand, open data allow us to exploit the traffic information
without having our own vehicle detector or sensor in the road such as Data Taipei [2].
Many researchers have been developing the model for traffic flow prediction in the past years. For example, a time series based approaches such ARIMA was applied [3][4][5], SVR based approaches such in the work of [6][7][8] [9] that perform well for the short-term predictive model, Backpropagation Neural Network (BPNN) [6] and also Neural Network(NN) approaches were also implemented [10]. However, the traditional NN is still shallow. As traffic flow is affected by many complex factors such as event, weather, accident, and etc. Thus, the deep network architecture may be needed. Deep Learning (DL) is now possible after Hinton proposed a breakthrough fast learning for the deep network [11][12]. There are some DL approaches have been used for traffic flow prediction, for instance, Stacked Autoencoders (SAEs) was proposed to learn the features of the traffic flow that consider the correlation between spatial and temporal data as in [13]. A greedy layerwise technique that learns one layer at a time is performed for learning representation of features. In [14] DBN and Stacked Restricted Boltzmann Machines (RBMs) were used at the bottom layer that learns features with limited prior knowledge. The multitask regression layer at the top, subsequently, a grouping method that applies a simple k-means based on weight sharing in order to make multitask learning (MTL) more effective. J. Lemieux and Y. Ma [15] also study DL approach to predict specific driver speed profile. Stacked Autoencoders (SAEs) were implemented. The features of freeway road are learned and then used as the input to Neural Network(NN), which can learn a particular driver's behavior. the work can predict the velocity accurately at each point of the drive route. Huang et. Al [16] proposed Deep Process Neural Network (DPNN) for temporal DL for traffic flow prediction in the highway system. All of above works mentioned do pre-training unsupervised then followed by supervised learning to tune the model. The pre-training step is less important nowadays, for instance, Nicholas G. Polson [17] proposed Feed Forward Neural Network(FFNN) with advance Dropout regularization technique, Vector Auto-Regressive(VAR) for predictor selection and Rectifier linear unit (Relu) activation function to capture nonlinear spatio-temporal effect in both recurrent and non-recurrent traffic congestion. In a deep
95

ISBN: 978-1-5386-6022-5 Bali, 25 - 27 October 2018 ICSGTEIS 2018
978-1-5386-6022-5/18/$31.00 ©2018 IEEE
Implementation of Grid-connected PV Plant in
Remote Location in Sumbawa Island of Indonesia:
Lesson Learned
INS Kumara
Department of Electrical Engineering
Faculty of Engineering Udayana University
Bali, Indonesia
IN Setiawan
Department of Electrical Engineering
Faculty of Engineering
Udayana University Bali, Indonesia
T Urmee
School of Engineering and Information
Technology Murdoch University
Perth, Australia
AAGA Pawitra Department of Electrical Engineering
Faculty of Engineering
Udayana University
Bali, Indonesia
Y Divayana
Department of Electrical Engineering
Faculty of Engineering Udayana University
Bali, Indonesia
A Jaya Department of Electrical Engineering
Faculty of Engineering
Universitas Teknologi Sumbawa
Sumbawa, Indonesia
Abstract—The National Energy Policy (NEP) set 23%
renewable energy target in the generation mix by 2025, where
solar PV has identified as one of the feasible resources. There
are many solar programs implemented in Indonesia. A large-
scale grid-connected solar PV (1 MW) project in Indonesia is
analyzed in this study. The power plant is installed on Sumbawa
island. The project is analyzed to investigate the performance of
PV systems in a tropical climate. The performances were
analyzed on project development, plants technical specification,
energy production and performance index, and its current
status. Data is collected through site visit and observations,
documents review, and discussion with relevant stakeholders.
PVSyst is used to simulate the potential of annual energy
production and performance. Our audit found that the main
components of the power plant are certified from reputable
international organizations including Indonesian national
standards. The simulation showed the power plant could
generate 1,195 MWh annual energy with an average of 8%
monthly variation which leads to an average performance index
of 68.9%. Since the commissioning tests, the plant has not been
operated. Consequently, no energy has been injected into the
grid nor supplied to local load. Currently, the power plant is an
inoperable condition due to non-technical problems. The
problems are discussed, and a recommendation is presented in
this paper.
Keywords— renewable energy, grid-connected, solar PV,
photovoltaics, energy production, performance index, project
development
I. INTRODUCTION
The government of Indonesia has stated in the National Energy Policy (NEP) that it sets to reach 23% renewable energy in the national energy mix by 2025 [1]. The renewable energy consists of energy sourced from geothermal, biomass, hydropower, solar, wind, and ocean resource. The potential of renewable resource of the country is abundant. However, the current progress of renewable energy has reached only 12%. Therefore, lots of works need to be done to achieve the target.
Solar PV has identified as one of the components of the renewable energy portfolio of Indonesia. The country has the abundance potential of solar electricity generation. It
westimated that the country has 208 GW electric power available from the solar energy conversion technology.
Sumbawa 1 MW solar PV plant was developed as one of the first pilot projects of large-scale grid-connected plant in Indonesia. The commercial operation date (COD) of the plant was in early 2013. However, since the commissioning in early February 2013, the power plant has not been connected to the utility distribution network nor connected to any local loads. However, there is little information available with regards to this project. Meanwhile, the government has planned to develop more large-scale PV plants in the future. Therefore, it is critical that lesson learned can be drawn for this project to prevent the occurrence of a similar project. This background has motivated our research to help the community or stakeholder in understanding the status of the project. The research comprises review on the development of the project including the relevant policy and regulation related to grid-connected PV development of the country. The paper also reviews the technical information of the power plant, its energy potential through simulation, and factors which affect its energy production, including the status of local electrical distribution network where the PV plant would inject its power.
The objective of this paper is to obtain the potential of energy generated by the Sumbawa 1 MW PV plant to get insight into its performance. It also reviews the development of the project and then draws lesson learned in developing government-financed large-scale grid-connected PV plant in the context of Indonesia. The paper is organized as follows. Section II discusses the material and methods of the research, section III contains results and discussion, and finally, section IV discusses the conclusion and followed by references.
II. METHODOLOGY
The methodology of the research is shown in the following flowchart as shown in Fig. 1. It mainly comprises literature reviews, computer simulation, and analysis. At the end, recommendation is presented should the power plant is revitalized.
203
![IMT Toronto 5 juin 2013 [Lecture seule]Denis LAPERT Directeur Télécom ParisTech Yves POILANE Directeur Télécom SudParis Christophe DIGNE Directeur Eurecom Directeur Télécom Lille1](https://img.pdfslide.net/doc/110x75/5f0e23dc7e708231d43dcdaf/imt-toronto-5-juin-2013-lecture-seule-denis-lapert-directeur-tlcom-paristech.jpg)