Embed Size (px)
Citation preview

Copyright is owned by the Author of the thesis. Permission is given for a copy to be downloaded by an individual for the purpose of research and private study only. The thesis may not be reproduced elsewhere without the permission of the Author.
1
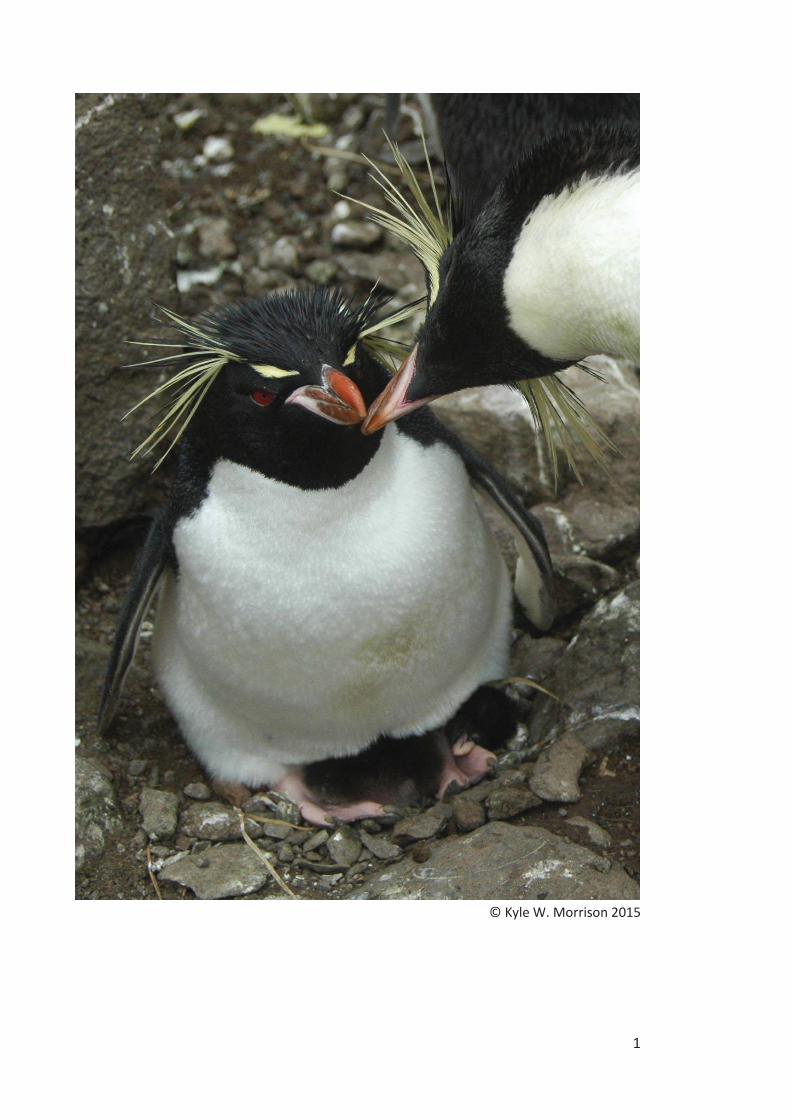
© Kyle W. Morrison 2015
2
Factors affecting the population dynamics of Eastern Rockhopper Penguins
(Eudyptes chrysocome filholi) on Campbell Island, New Zealand
A thesis presented
in partial fulfilment of the requirements
for the degree of
Doctor of Philosophy in Ecology
Massey University
Palmerston North, New Zealand
Kyle William Morrison
2015

3
Copyright is owned by the Author of the thesis. Permission is given for a copy to be
downloaded by an individual for the purpose of research and private study only. The thesis
may not be reproduced elsewhere without the permission of the Author.
4
ABSTRACT
The population dynamics of seabirds may be influenced by ‘top-down’ predation effects, or
from the ‘bottom-up’ by environmental limitations on food availability. Southern Rockhopper
Penguin (Eudyptes chrysocome) populations have declined hugely at multiple sites across their
circumpolar, sub-Antarctic range in recent decades, resulting in an extinction risk of
‘Vulnerable’. They are a small-bodied penguin, adapted to exploit seasonally abundant, pelagic
prey by being migratory and having prolonged fasting periods onshore and foraging offshore
during breeding. Mysteriously, like other Eudyptes penguins they lay an extremely dimorphic
two-egg clutch in which the first-laid egg is smaller and less successful, and rarely fledge two
chicks.
The world’s largest population (c. 620,000 pairs) of the Eastern sub-species (E. c. filholi)
of Rockhopper Penguin formerly bred at Campbell Island, New Zealand. Prior to the current
work, the only previous intensive research at this site in the mid-1980s revealed the
population had declined by a startling 94% since the early 1940s as local sea-surface
temperatures (SSTs) increased. It was hypothesized that climate change had reduced the
availability of the penguins’ preferred zooplankton prey, so that the Campbell population’s
decline was caused by its unusual reliance on a fish-based diet which resulted in low body
masses and demographic rates. I examined this hypothesis of bottom-up population regulation
by estimating the population growth rate from 1984–2012 and assessing links between SST,
diet quality, chick-provisioning rates, chick and adult body masses, egg masses, reproductive
success, and first-year and adult survival rates. Additionally, I considered whether top-down
predation effects were causing the recent, unusually rapid population decline in a relatively
small, fragmented colony. I assessed the population growth rate using digital imagery analysis
of current and historic colony photographs, dietary trophic level using stable isotope analysis
of blood samples, and chick-provisioning and adult survival rates using an automated gateway
to record the colony-sea transit times of individual transponder-tagged penguins breeding at
closely monitored nest sites.
I estimated the total Campbell Island population size to be 33,239 breeding pairs in
2012, a 21.8% decrease from an adjusted estimate of 42,528 pairs in 1984. However, the
recent decline occurred before 1996 with most colonies stable or growing thereafter under
cooler SSTs and more abundant prey. My results supported the previous assertion that the
overall population size declined during periods of warm SST and that a zooplankton-based diet
was a higher quality diet, resulting in heavier adults and chicks. However, the primary
5
determinant of chick growth was how often they were fed, and the rigid division of labour
between parents during early-chick rearing reduced potential chick-provisioning rates,
especially from males in a poor-food year. The ongoing, localized decline of my study
population was caused by high rates of predation on adults by sea lions, as well as on eggs by
skuas. I did not find support for overlap between migration and egg-formation underlying egg-
size dimorphism.
This study emphasizes the constraints that a species’ genotype and ecological context
place on the degree of behavioural plasticity it exhibits when faced with environmental
variability. My results highlight the vulnerability of Eastern Rockhopper Penguins, and likely
other Eudyptes penguins, to the more variable and warmer environment and less predictable
food supply in a future under climate change.
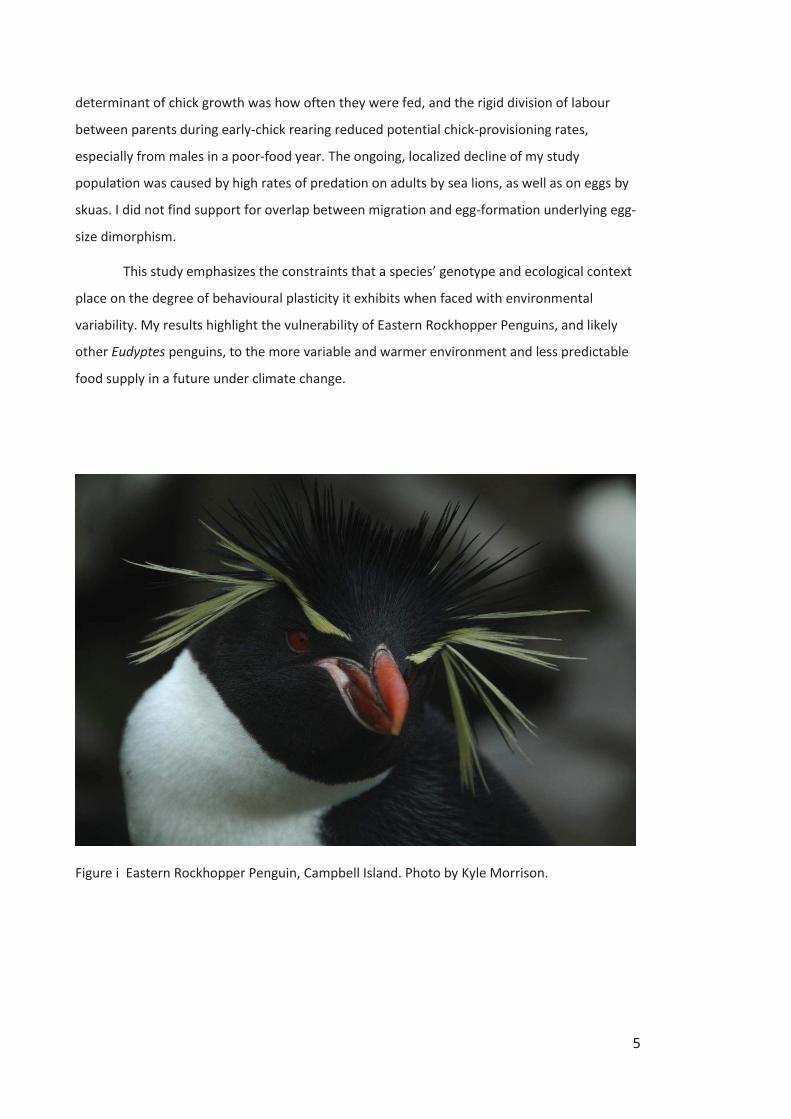
Figure i Eastern Rockhopper Penguin, Campbell Island. Photo by Kyle Morrison.

6
DEDICATION
For Sarah, my island girl who is now my wife, now my son’s mother, always my foundation
when I’m far out at sea
Figure ii Sarah Jamieson and Finnigan Morrison at 6 months old. Photo by Kyle Morrison.
7
ACKNOWLEDGEMENTS
I am grateful to my supervisory committee, Phil Battley, Doug Armstrong, and David
Thompson, for their many essential contributions to my work. I thank you for having faith in
my abilities, as demonstrated in the independence I had in choosing my research questions
and designing this study. I could say more, but I know I have already asked them to read a lot
of words in the past 4.5 years.
Thank you to the anonymous reviewers of my published research chapters and my
Massey University thesis examiner John Cockrem, New Zealand examiner Matt Rayner, and
international examiner Norman Ratcliffe for the many improvements you suggested.
I am very grateful for receipt of doctoral scholarships from Massey University,
Education New Zealand, and the Natural Sciences and Engineering Research Council of Canada.
Additional grant funding for equipment and stable isotope analysis was kindly provided by the
J.S. Watson Conservation Trust of the Royal Forest and Bird Protection Society of New Zealand,
the Hutton Fund of The Royal Society of New Zealand, and the Penguin Fund of Japan.
Paul Sagar gave generously of his time and knowledge in introducing me to Campbell
Island, and later to his career-long passion, The Snares. You are a role model to me of the fit,
field-working, publishing, back-yard mist-netting, family man I aspire to be.
My faithful field assistants, my brother Neil Morrison, Ray Buchheit, and Rob Dunn,
were better help to me than I could ever have hoped for. You each gave up a big chunk of time
out of your lives and much sweat to hang out with me and the birds and seals of Penguin Bay.
Thank you for going along with what I thought best, even when you must have known better.
Thank you to the albatross-interested folks I shared adventures on Campbell Island
with and many good times back at Beeman Base, including Dave Evans, Amanda Ophof, Caitlin
Kroeger, Lisa Sztukowski, and Rachel Orben. Thanks ‘gam’ for never failing to humour me by
looking at a few more penguin photos and for not fussing too much about the food in my
beard.
I owe a depth of gratitude to Henk Haazen, skipper of RV ‘Tiama’ for safe transport to
Campbell Island and The Snares over five expeditions. Thank you Henk for being up to the
challenge of fitting in as many heavy yellow fish bins as we could throw at you. Frequent first
mate Andy Whittacker was a good friend to someone like myself with weak sea-legs. Thank
you Andy for cheerfully and adeptly assisting with penguin tracking-tag deployment in April
2013.
8
I am very grateful to the assistance with accessing unpublished information, logistics,
and permitting provided by past and current staff of the Department of Conservation (DOC),
especially Graeme Taylor, Stu Cockburn, Peter Moore, Phil Moors, Duncan Cunningham, Pete
McClelland, and Jo Hiscock. Thank you Jo for assisting me with fieldwork in my first season. Stu
Cockburn kindly provided me with dataloggers and antennae for the automated gateway I
used to record the movements of transponder-tagged penguins, without which Chapters 4 and
5 would not have been possible. Graeme Taylor assisted me with accessing DOC’s National
Archives and trained me in transponder-tagging Little Penguins. My enjoyment of the
spectacular biodiveristy of Campbell Island would have been much diminished without the
heroic efforts of DOC staff in eradicating all introduced mammals, especially rats.
I had an excellent role model for what a PhD on Rockhopper Penguins could deliver
from Nina Dehnhard, whose high quality research on Southern Rockhopper Penguins on New
Island, Falkland Islands, is frequently cited in this thesis. Thank you Nina for exchanging so
many Rockhopper-related e-mails with me.
A fellow Simon Fraser University alumnus, Will Stein, had me interested in Eudyptes
penguins before I even left Canada. Thank you Will for our many discussions over the evolution
of egg-size dimorphism which helped shape my approach not only to Chapter 6, but elsewhere
where I use inter-species comparisons to infer ecological constraints and selective forces.
I would like to acknowledge the foundational Eudyptes penguin research of the late
John Warham (1919–2010). His detailed studies of the breeding biology of all five of the
Eudyptes penguins of the New Zealand region are still among the best available to the present
day. In this thesis I cite his results and ideas extensively, 40–50 years after their publication. I
am sorry I never met John, but feel a connection to him when I observe the penguin
behaviours he described and illustrated so accurately, and through his supervision at the
University of Canterbury of my co-author Paul Sagar.
Thank you for all the laughs my good friends, fellow PhD students, office mates, and
football/badminton/hunting/spearfishing buddies at Massey and NIWA: Juan Carlos Garcia
Ramirez, Pablo Escobar, Tim Burrell, and Stefan Jendersie.
My brother Neil, and parents Ken and Betty have shown a huge deal of enthusiasm for
my penguin research from back home in Canada. Thank you for all of the love and support you
have sent me whether I was in Palmerston North, Wellington, or the Penguin Bay Hilton hut.
Sarah Jamieson and I came to New Zealand for her post-doctoral position at Massey
University on North Island Brown Kiwi, but have stayed longer than initially intended because
9
of my penguin PhD. I owe Sarah an ocean of gratitude for her assistance reviewing my work,
formatting this thesis, and for supporting me during our long separations during my field work.
Sarah and I have married and had a beautiful brown-eyed boy of our own since coming to New
Zealand. Not surprisingly, finishing a PhD thesis while living away from family and raising a first
child with six teeth before six months old has been a huge challenge that I would not have
succeeded in without Sarah’s self-less love and understanding. Thank you my wonderful wife
and motivational son Finnigan! Finn, as you read this sentence picture your head asleep
against my chest as I type it, because that was the peculiar and blessed reality of 15-December
2014.
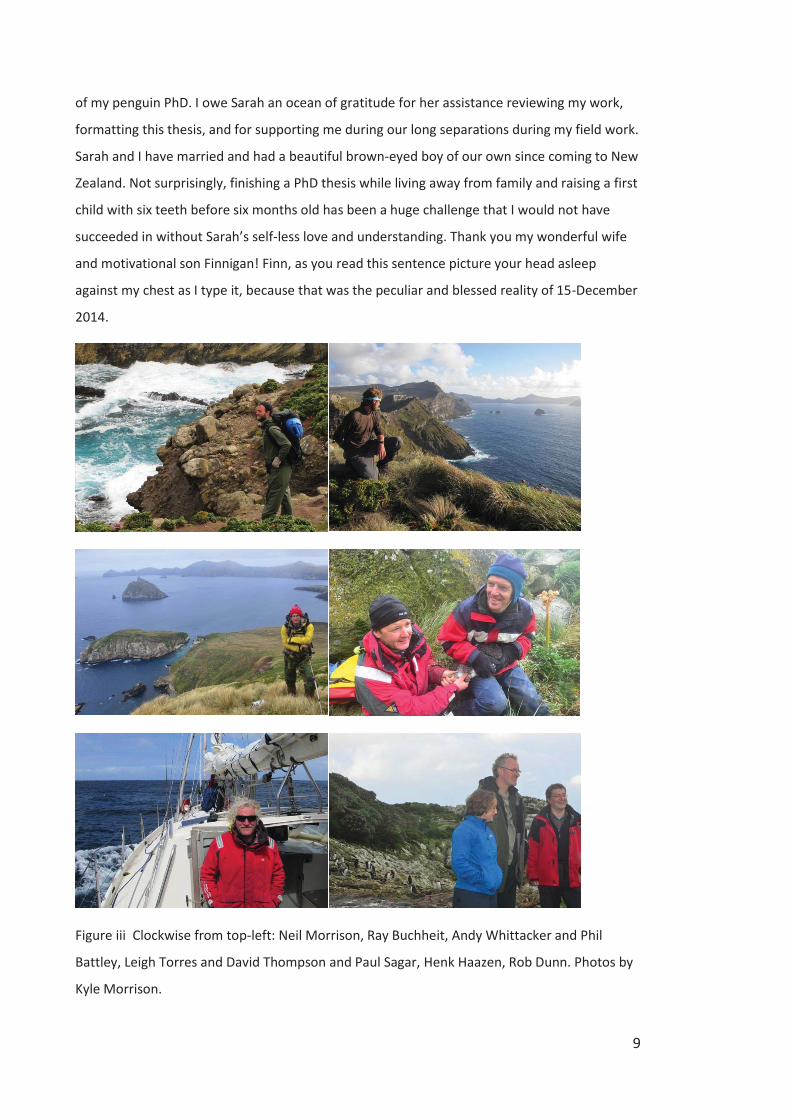
Figure iii Clockwise from top-left: Neil Morrison, Ray Buchheit, Andy Whittacker and Phil
Battley, Leigh Torres and David Thompson and Paul Sagar, Henk Haazen, Rob Dunn. Photos by
Kyle Morrison.
10
TABLE OF CONTENTS
ABSTRACT ............................................................................................................................. 4
DEDICATION .......................................................................................................................... 6
ACKNOWLEDGEMENTS ............................................................................................................ 7
CO-AUTHORS ....................................................................................................................... 12
CHAPTER 1 GENERAL INTRODUCTION ....................................................................................... 14
SEABIRD ECOLOGY ............................................................................................................ 15 SEABIRD POPULATION DYNAMICS ......................................................................................... 16 HUMAN-INDUCED CHANGE IN MARINE ECOSYSTEMS ................................................................ 16 BEHAVIOURAL PLASTICITY, CONSTRAINTS, AND CANALIZATION ................................................... 18 PENGUINS ....................................................................................................................... 18 EUDYPTES PENGUINS ......................................................................................................... 19 STUDY SPECIES ................................................................................................................. 21 STUDY SITE ...................................................................................................................... 23 AIMS OF THIS THESIS ......................................................................................................... 24 RESEARCH CHAPTERS ......................................................................................................... 25
CHAPTER 2 POPULATION DYNAMICS OF EASTERN ROCKHOPPER PENGUINS ON CAMPBELL ISLAND IN
RELATION TO SEA SURFACE TEMPERATURE 1942–2012: CURRENT WARMING HIATUS PAUSES A LONG-TERM DECLINE ...................................................................................................................... 27
ABSTRACT ....................................................................................................................... 28 INTRODUCTION ................................................................................................................ 28 MATERIALS AND METHODS ................................................................................................ 30 RESULTS ......................................................................................................................... 39 DISCUSSION .................................................................................................................... 45
CHAPTER 3 HIGHER TROPHIC LEVEL PREY DO NOT REPRESENT A HIGHER QUALITY DIET IN A THREATENED
SEABIRD: IMPLICATIONS FOR RELATING POPULATION DYNAMICS TO DIET SHIFTS INFERRED FROM STABLE
ISOTOPES ............................................................................................................................ 55
ABSTRACT ....................................................................................................................... 56 INTRODUCTION ................................................................................................................ 56 MATERIALS AND METHODS ................................................................................................ 60 RESULTS ......................................................................................................................... 64 DISCUSSION .................................................................................................................... 69
CHAPTER 4 CANALIZED PARENTAL ROLES CONSTRAIN THE ABILITY OF EASTERN ROCKHOPPER PENGUINS TO
COPE WITH NUTRITIONAL STRESS.............................................................................................. 77
ABSTRACT ....................................................................................................................... 78 INTRODUCTION ................................................................................................................ 78 MATERIALS AND METHODS ................................................................................................ 82
11
RESULTS ......................................................................................................................... 85 DISCUSSION .................................................................................................................... 95 ACKNOWLEDGEMENTS .................................................................................................... 102
CHAPTER 5 NEW ZEALAND SEA LION AND BROWN SKUA PREDATION IS CAUSING THE CONTINUED DECLINE
OF AN EASTERN ROCKHOPPER PENGUIN COLONY ON CAMPBELL ISLAND ........................................ 103
INTRODUCTION .............................................................................................................. 104 MATERIALS AND METHODS .............................................................................................. 107 RESULTS ....................................................................................................................... 119 DISCUSSION .................................................................................................................. 135 ACKNOWLEDGEMENTS .................................................................................................... 142
CHAPTER 6 A CARRY-OVER EFFECT OF MIGRATION DOES NOT UNDERLIE WITHIN-INDIVIDUAL VARIATION IN
EXTREME EGG-SIZE DIMORPHISM IN EASTERN ROCKHOPPER PENGUINS ......................................... 145
ABSTRACT ..................................................................................................................... 146 INTRODUCTION .............................................................................................................. 146 MATERIALS AND METHODS .............................................................................................. 148 RESULTS ....................................................................................................................... 150 DISCUSSION .................................................................................................................. 161 ACKNOWLEDGEMENTS .................................................................................................... 165
CHAPTER 7 GENERAL DISCUSSION ......................................................................................... 167
KEY FINDINGS ................................................................................................................ 168 BOTTOM-UP CONTROL OF POPULATION DYNAMICS ................................................................ 169 TOP-DOWN CONTROL OF POPULATION DYNAMICS ................................................................. 171 CONSTRAINTS ON BEHAVIOURAL PLASTICITY ......................................................................... 173 SHIFTING BASELINES: PERCEPTIONS OF ECOSYSTEM HEALTH AND FUNCTION ................................ 175 IMPLICATIONS FOR CONSERVATION MANAGEMENT ................................................................ 176 FUTURE DIRECTIONS ........................................................................................................ 177
REFERENCES ...................................................................................................................... 179
12
CO-AUTHORS
I wrote all parts of this thesis, designed and led all data collection, and performed all analyses.
However, I have recognized the essential contributions of eight collaborators by their inclusion
as co-authors in specific research chapters.
Phil F. Battley (Massey University, Ecology Group)
As my primary supervisor, Phil helped me shape my research questions and methods,
supported my scholarship, grant, and Animal Ethics applications, provided financial support for
field equipment and for myself in my final months of writing, and reviewed all parts of this
thesis. Furthermore Phil joined me on a very enjoyable tag-deployment trip to Campbell and
The Snares Islands in April 2013. Phil is a co-author on Chapters 2, 4, and 5.
Doug P. Armstrong (Massey University, Ecology Group)
As my secondary academic supervisor, Doug made important contributions to my study design
and interpretation of results, including making quick and helpful comments on research
chapters. Doug gave much statistical advice on Chapter 5 on which he is a co-author.
David R. Thompson (National Institute of Water & Atmospheric Research (NIWA))
As my third PhD supervisor, David helped shape my research questions and study design.
David is the principal investigator of NIWA’s ‘Conservation of New Zealand’s iconic marine
megafauna’ project, which funded almost all aspects of my costly three seasons of fieldwork
on remote Campbell Island. David was primarily responsible for organizing the complex
logistics around ensuring our field team left Bluff Harbour with all of the permits, food, and
gear we needed. David arranged for me to have a desk at NIWA’s Wellington office for the
final third of my PhD. David is a co-author on Chapters 2-5.
Paul M. Sagar (NIWA)
Paul introduced our team to Campbell Island in my first season, and got us off the ground in
the second year as well. Paul reviewed Chapter 2 on which he is a co-author.
Sarah J. Bury (NIWA)
Sarah supervised the stable isotope analysis of blood samples for Chapter 3, which she also
revised and is a co-author.

13
Sarah E. Jamieson (formerly of the Museum of New Zealand Te Papa Tongarewa and Massey
University, Ecology Group)
Sarah supported me in innumerable ways during my fieldwork and writing. Sarah reviewed all
research chapters and provided statistical advice on Chapter 5 on which she is a co-author.
Neil C. Morrison
My brother Neil generously agreed to be my volunteer field assistant in my first season. Neil’s
hard work was instrumental in the successful start to my fieldwork. All of my assistants made
essential contributions to collecting the data I used in all research chapters, but are recognized
by co-authorship in Chapter 4.
Raymond M. Buchheit (Department of Ecology, Montana State University)
My Aleutian-island friend Ray took a 100% pay cut to join me at the opposite end of the Pacific
in my second season of fieldwork. Ray makes me laugh, a lot. Ray is a co-author on Chapter 4.
Rob Dunn
Rob built upon his MSc seabird experience by assisting me in my third field season. There was
no pack too heavy or sea lion to fierce to intimidate Rob. Rob is a co-author on Chapter 4.
14
Chapter 1
GENERAL INTRODUCTION
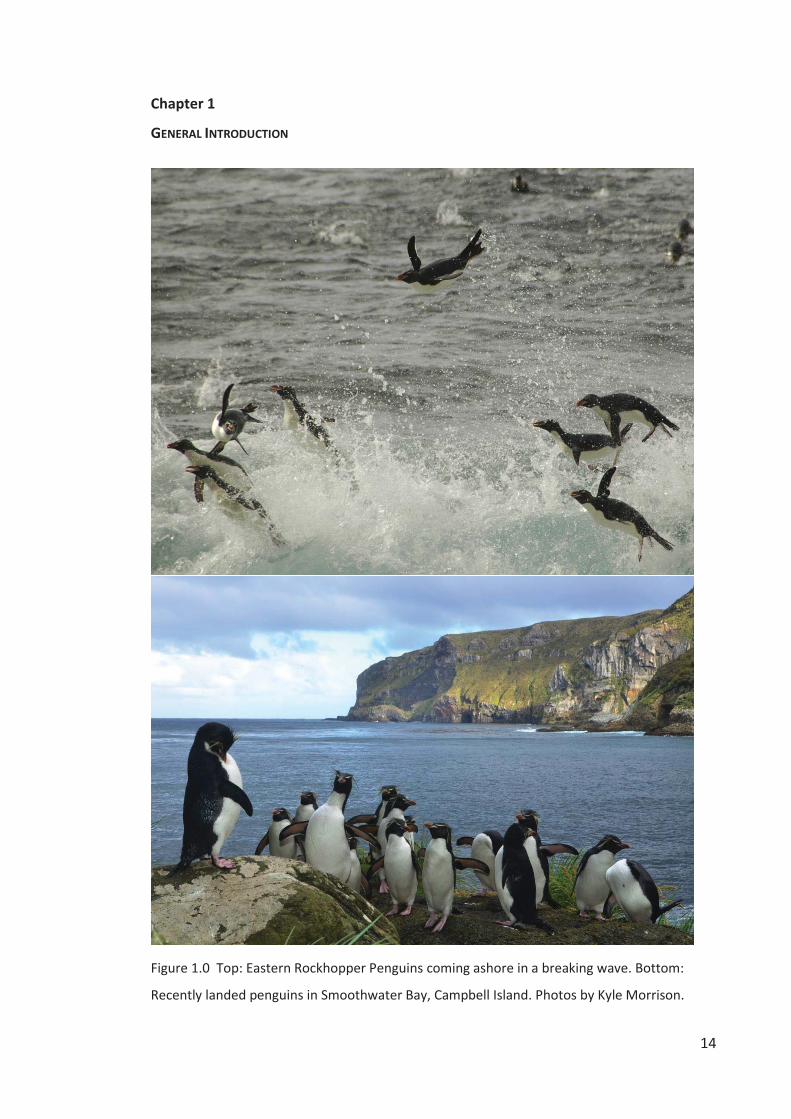
Figure 1.0 Top: Eastern Rockhopper Penguins coming ashore in a breaking wave. Bottom:
Recently landed penguins in Smoothwater Bay, Campbell Island. Photos by Kyle Morrison.
15
SEABIRD ECOLOGY
The Earth is primarily covered in salt water, and seabirds have evolved a diversity of forms and
strategies to exploit marine prey over most of that vast area to meet their own energy
demands and those of their offspring. For example, terns and storm petrels are adapted to
surface feeding, while the larger auks and penguins routinely dive to 100 m depth and beyond
(Gaston 2004). Most marine productivity originates with phytoplankton which provide food for
zooplankton, cephalopods, and fish; these in turn feed fish, seabirds, and marine mammals,
notwithstanding the predator-prey relationships amongst these taxa. Phytoplankton and
zooplankton productivity is determined by sunlight, nutrients, and sea temperature. The
duration and intensity of solar radiation varies predictably by latitude and through each year,
but currents, stratification, terrestrial inputs, and bathymetry create dynamic levels of
nutrients and sea temperature that can vary greatly through space and time (Hunt et al. 2001).
Consequently, phytoplankton, zooplankton, and therefore fish and cephalopod productivity
and distributions may be predictable at certain times and locations, but are often sparsely or
patchily distributed and intermittent or highly seasonal (Mackas et al. 2001; Murphy et al.
2001).
The marine prey of seabirds are patchily distributed and abundances vary through
time. Seabirds’ shared challenges of locating and obtaining prey have been fundamental to the
evolution of a similar breeding ecology and slow life history strategy across most seabird taxa
(Williams 1995; Gaston 2004). Colonial breeding facilitates information transfer between
individuals on foraging locations. High breeding site fidelity allows familiarization with
neighbouring pairs and foraging locations and synchronized breeding. High mate fidelity may
increase breeding success through better synchronization of foraging trips and prevent delays
in laying or missing breeding seasons. A late age at first breeding allows development of the
foraging proficiency and body condition required to successfully rear offspring. A small clutch
size and low annual fecundity represent conservative investments in eggs and chick-
provisioning by parents reluctant to risk their own survival and future breeding attempts for
the uncertain outcome of breeding in any given year. A high adult survival rate allows for
multiple breeding attempts over an individual’s lifetime, most of which will occur under
inadequate foraging conditions, causing egg or chick failure or the mortality of those offspring
which do fledge before they recruit into the breeding population years later.
16
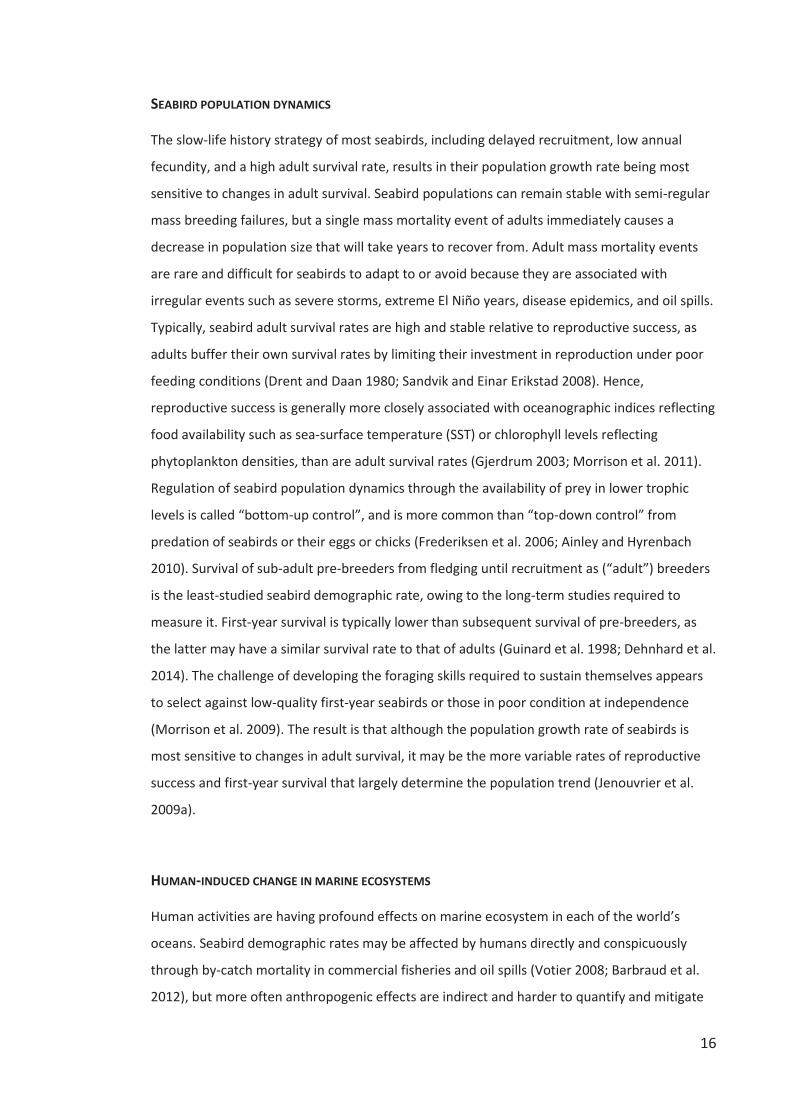
SEABIRD POPULATION DYNAMICS
The slow-life history strategy of most seabirds, including delayed recruitment, low annual
fecundity, and a high adult survival rate, results in their population growth rate being most
sensitive to changes in adult survival. Seabird populations can remain stable with semi-regular
mass breeding failures, but a single mass mortality event of adults immediately causes a
decrease in population size that will take years to recover from. Adult mass mortality events
are rare and difficult for seabirds to adapt to or avoid because they are associated with
irregular events such as severe storms, extreme El Niño years, disease epidemics, and oil spills.
Typically, seabird adult survival rates are high and stable relative to reproductive success, as
adults buffer their own survival rates by limiting their investment in reproduction under poor
feeding conditions (Drent and Daan 1980; Sandvik and Einar Erikstad 2008). Hence,
reproductive success is generally more closely associated with oceanographic indices reflecting
food availability such as sea-surface temperature (SST) or chlorophyll levels reflecting
phytoplankton densities, than are adult survival rates (Gjerdrum 2003; Morrison et al. 2011).
Regulation of seabird population dynamics through the availability of prey in lower trophic
levels is called “bottom-up control”, and is more common than “top-down control” from
predation of seabirds or their eggs or chicks (Frederiksen et al. 2006; Ainley and Hyrenbach
2010). Survival of sub-adult pre-breeders from fledging until recruitment as (“adult”) breeders
is the least-studied seabird demographic rate, owing to the long-term studies required to
measure it. First-year survival is typically lower than subsequent survival of pre-breeders, as
the latter may have a similar survival rate to that of adults (Guinard et al. 1998; Dehnhard et al.
2014). The challenge of developing the foraging skills required to sustain themselves appears
to select against low-quality first-year seabirds or those in poor condition at independence
(Morrison et al. 2009). The result is that although the population growth rate of seabirds is
most sensitive to changes in adult survival, it may be the more variable rates of reproductive
success and first-year survival that largely determine the population trend (Jenouvrier et al.
2009a).
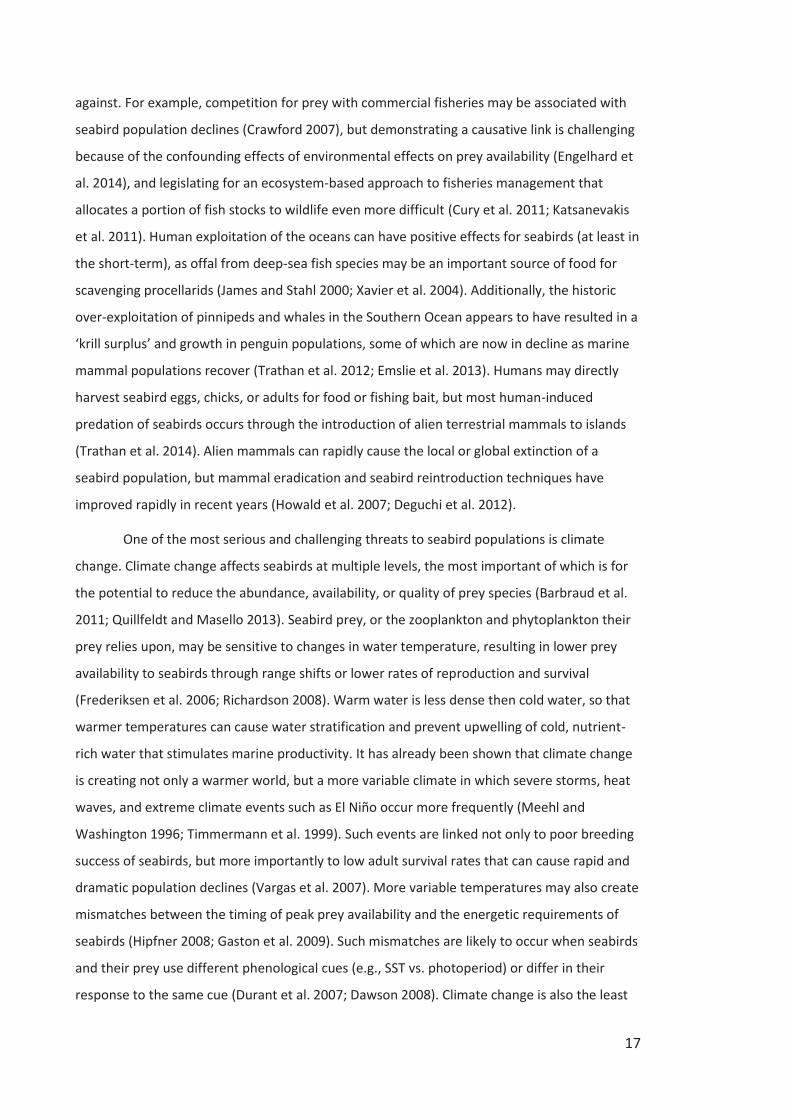
HUMAN-INDUCED CHANGE IN MARINE ECOSYSTEMS
Human activities are having profound effects on marine ecosystem in each of the world’s
oceans. Seabird demographic rates may be affected by humans directly and conspicuously
through by-catch mortality in commercial fisheries and oil spills (Votier 2008; Barbraud et al.
2012), but more often anthropogenic effects are indirect and harder to quantify and mitigate
17
against. For example, competition for prey with commercial fisheries may be associated with
seabird population declines (Crawford 2007), but demonstrating a causative link is challenging
because of the confounding effects of environmental effects on prey availability (Engelhard et
al. 2014), and legislating for an ecosystem-based approach to fisheries management that
allocates a portion of fish stocks to wildlife even more difficult (Cury et al. 2011; Katsanevakis
et al. 2011). Human exploitation of the oceans can have positive effects for seabirds (at least in
the short-term), as offal from deep-sea fish species may be an important source of food for
scavenging procellarids (James and Stahl 2000; Xavier et al. 2004). Additionally, the historic
over-exploitation of pinnipeds and whales in the Southern Ocean appears to have resulted in a
‘krill surplus’ and growth in penguin populations, some of which are now in decline as marine
mammal populations recover (Trathan et al. 2012; Emslie et al. 2013). Humans may directly
harvest seabird eggs, chicks, or adults for food or fishing bait, but most human-induced
predation of seabirds occurs through the introduction of alien terrestrial mammals to islands
(Trathan et al. 2014). Alien mammals can rapidly cause the local or global extinction of a
seabird population, but mammal eradication and seabird reintroduction techniques have
improved rapidly in recent years (Howald et al. 2007; Deguchi et al. 2012).
One of the most serious and challenging threats to seabird populations is climate
change. Climate change affects seabirds at multiple levels, the most important of which is for
the potential to reduce the abundance, availability, or quality of prey species (Barbraud et al.
2011; Quillfeldt and Masello 2013). Seabird prey, or the zooplankton and phytoplankton their
prey relies upon, may be sensitive to changes in water temperature, resulting in lower prey
availability to seabirds through range shifts or lower rates of reproduction and survival
(Frederiksen et al. 2006; Richardson 2008). Warm water is less dense then cold water, so that
warmer temperatures can cause water stratification and prevent upwelling of cold, nutrient-
rich water that stimulates marine productivity. It has already been shown that climate change
is creating not only a warmer world, but a more variable climate in which severe storms, heat
waves, and extreme climate events such as El Niño occur more frequently (Meehl and
Washington 1996; Timmermann et al. 1999). Such events are linked not only to poor breeding
success of seabirds, but more importantly to low adult survival rates that can cause rapid and
dramatic population declines (Vargas et al. 2007). More variable temperatures may also create
mismatches between the timing of peak prey availability and the energetic requirements of
seabirds (Hipfner 2008; Gaston et al. 2009). Such mismatches are likely to occur when seabirds
and their prey use different phenological cues (e.g., SST vs. photoperiod) or differ in their
response to the same cue (Durant et al. 2007; Dawson 2008). Climate change is also the least
18
tangible and manageable threat to seabirds, given humanity’s reliance on fossil fuels and
projections that global temperatures will continue to rise for centuries even if greenhouse gas
pollution was stopped today (Meehl 2006). Furthermore, most of our seabird knowledge has
been accumulated over the past 75 years, during a very narrow range of the past and future
climate conditions, so that we have a limited understanding of the resilience and adaptability
of seabirds to climate change and what conservation management actions might help buffer
seabird populations against climate change.
BEHAVIOURAL PLASTICITY, CONSTRAINTS, AND CANALIZATION
The ability of seabirds to adapt to natural and human-induced changes in the marine
environment is largely determined by their degree of behavioural plasticity. Behavioural
plasticity is the expression of different behaviours under various environmental conditions
(Nussey et al. 2007). Certain seabirds behaviours are very plastic, such as chick-provisioning
rates, whereas others might be canalized and invariable regardless of environmental change,
like the fixed one-egg clutch size of procellarids (Gaston 2004; Saraux et al. 2011). The degree
of behavioural plasticity a seabird is able to express is determined in part by its genotype
(there is no evidence that a two-egg clutch genotype exists within the Procellariidae), and in
part by ecological constraints (a mutant two-egg clutch genotype is unlikely to be successful
because procellarid parents struggle to provision one chick, let alone two). Given that
individuals will vary genetically, physiologically and in the environmental conditions they
encounter, constraints on behavioural plasticity will also vary between individuals, populations
and species (Nussey et al. 2007; Gremillet and Charmantier 2010). This may limit the ability of
individuals and species to respond to current threats such as climate change.
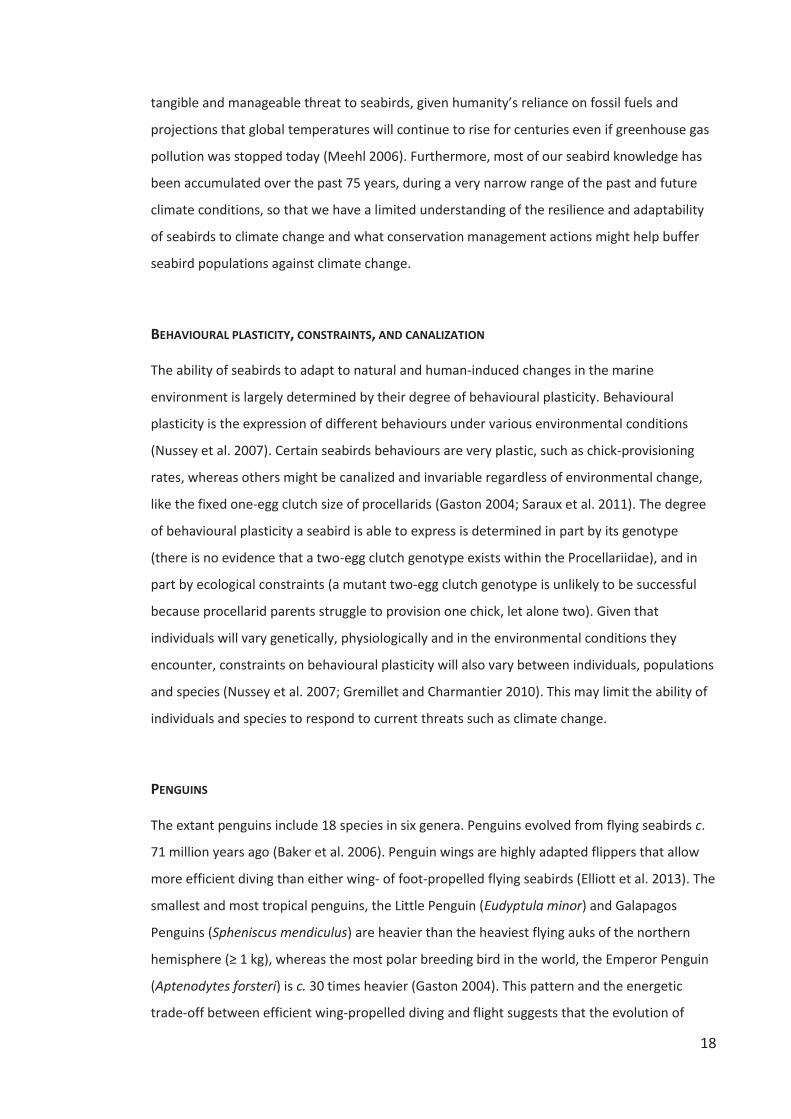
PENGUINS
The extant penguins include 18 species in six genera. Penguins evolved from flying seabirds c.
71 million years ago (Baker et al. 2006). Penguin wings are highly adapted flippers that allow
more efficient diving than either wing- of foot-propelled flying seabirds (Elliott et al. 2013). The
smallest and most tropical penguins, the Little Penguin (Eudyptula minor) and Galapagos
Penguins (Spheniscus mendiculus) are heavier than the heaviest flying auks of the northern
hemisphere (≥ 1 kg), whereas the most polar breeding bird in the world, the Emperor Penguin
(Aptenodytes forsteri) is c. 30 times heavier (Gaston 2004). This pattern and the energetic
trade-off between efficient wing-propelled diving and flight suggests that the evolution of
19
flightlessness allowed penguins to become larger and occupy otherwise inhospitable regions.
Larger animals lose less heat through their lower surface-area to volume ratio, allowing a
slower metabolism and lesser energy requirements than smaller animals would have in
environments where the ambient temperature is below body temperature. Thus, a large body
size also facilitates the unique penguin trait of a rapid and complete moult (Williams 1995).
Such a moult jeopardizes penguin’s water-proofing and thus occurs on land, thereby requiring
substantial body reserves and relatively low metabolic rate to survive a multi-week fast and to
fuel feather growth. Some penguin species also have prolonged periods of fasting during the
breeding season, over one or more stages of courtship, incubation, and chick-rearing.
Like most other seabirds, penguins generally have a slow life-history strategy, but as in
other animals, the larger-bodied penguin species tend to have a later-age at first-breeding,
lower-fecundity, and higher adult-survival rates than the smaller-bodied species. For example,
the Aptenodytes penguins (Emperor and King Penguins) are the largest, the only genus that
lays a one-egg clutch, and have among the latest age at first breeding and highest adult
survival rates (Williams 1995; Davis and Renner 2003). In contrast, Little and Galapagos
Penguins lay a two-egg clutch like all other penguins, but may produce two broods in a single
year, and breed for the first time as early as 1-year old while surviving at a lower rate as adults.
Variation in penguin life history strategies is also linked to whether the species is sedentary
and exploits nearshore prey or migrates away from breeding colonies over-winter and is an
off-shore forager. For example, sedentary Yellow-eyed (Megadyptes antipodes) and Gentoo
Penguins (Pygoscelis papua) are larger-bodied, but breed at a younger age and have higher
fecundity than sympatric and migratory Eudyptes penguins (Croxall and Davis 1999; Davis and
Renner 2003). Migration and foraging strategies also interact with breeding ecology, as
migratory species tend to arrive at breeding sites with large body reserves and make extended
fasts during a shorter breeding season. They do so by exploiting seasonally abundant prey over
a larger foraging area, supporting larger breeding population sizes and enabling them to
recover from fasts and raise chicks in a shorter time than sedentary, nearshore foragers.
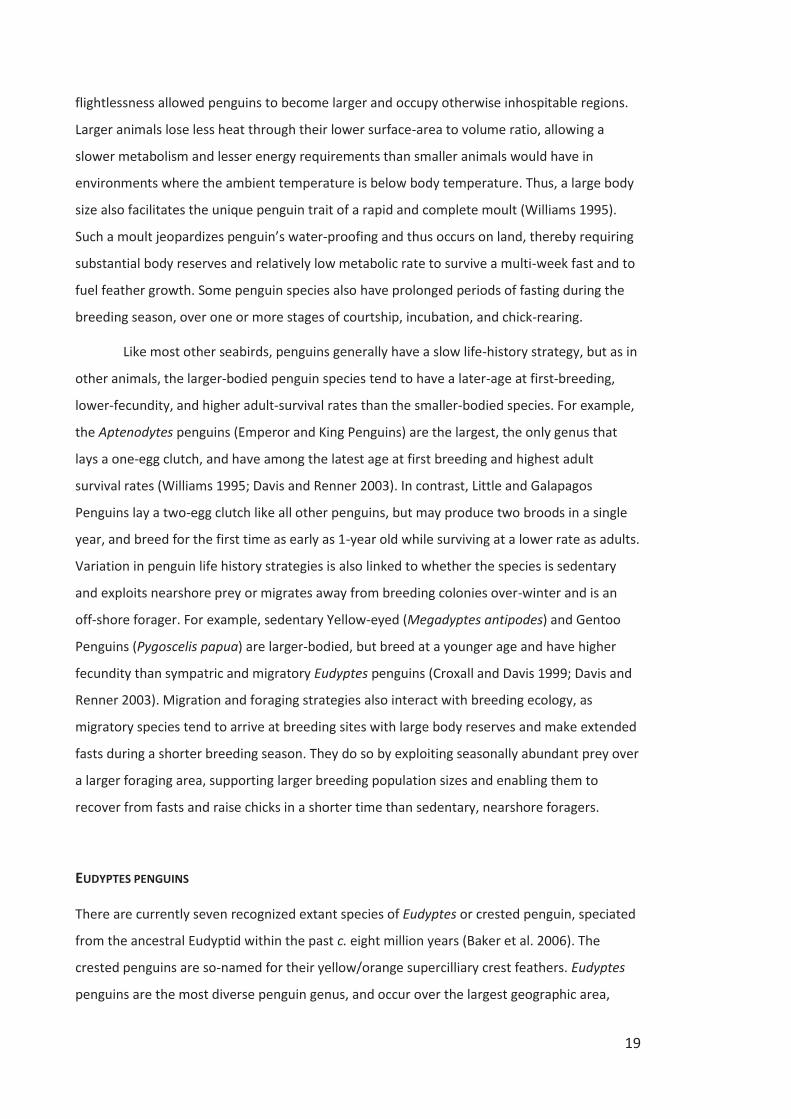
EUDYPTES PENGUINS
There are currently seven recognized extant species of Eudyptes or crested penguin, speciated
from the ancestral Eudyptid within the past c. eight million years (Baker et al. 2006). The
crested penguins are so-named for their yellow/orange supercilliary crest feathers. Eudyptes
penguins are the most diverse penguin genus, and occur over the largest geographic area,
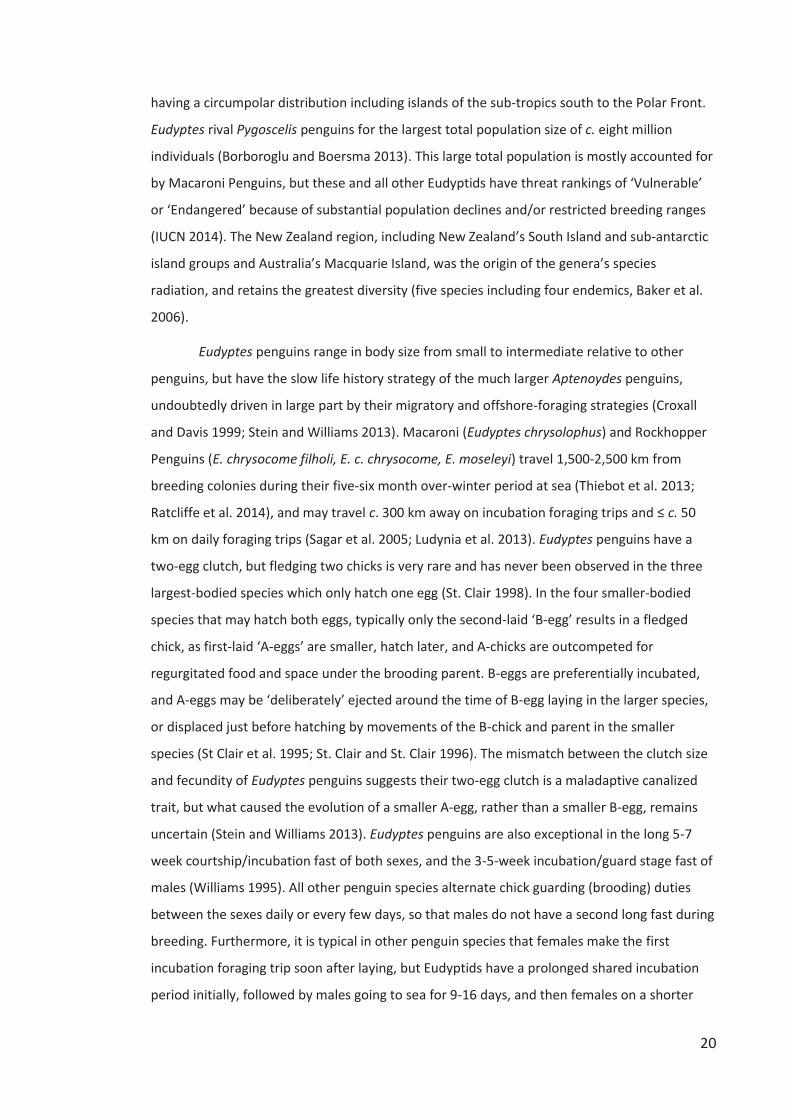
20
having a circumpolar distribution including islands of the sub-tropics south to the Polar Front.
Eudyptes rival Pygoscelis penguins for the largest total population size of c. eight million
individuals (Borboroglu and Boersma 2013). This large total population is mostly accounted for
by Macaroni Penguins, but these and all other Eudyptids have threat rankings of ‘Vulnerable’
or ‘Endangered’ because of substantial population declines and/or restricted breeding ranges
(IUCN 2014). The New Zealand region, including New Zealand’s South Island and sub-antarctic
island groups and Australia’s Macquarie Island, was the origin of the genera’s species
radiation, and retains the greatest diversity (five species including four endemics, Baker et al.
2006).
Eudyptes penguins range in body size from small to intermediate relative to other
penguins, but have the slow life history strategy of the much larger Aptenoydes penguins,
undoubtedly driven in large part by their migratory and offshore-foraging strategies (Croxall
and Davis 1999; Stein and Williams 2013). Macaroni (Eudyptes chrysolophus) and Rockhopper
Penguins (E. chrysocome filholi, E. c. chrysocome, E. moseleyi) travel 1,500-2,500 km from
breeding colonies during their five-six month over-winter period at sea (Thiebot et al. 2013;
Ratcliffe et al. 2014), and may travel c. 300 km away on incubation foraging trips and ≤ c. 50
km on daily foraging trips (Sagar et al. 2005; Ludynia et al. 2013). Eudyptes penguins have a
two-egg clutch, but fledging two chicks is very rare and has never been observed in the three
largest-bodied species which only hatch one egg (St. Clair 1998). In the four smaller-bodied
species that may hatch both eggs, typically only the second-laid ‘B-egg’ results in a fledged
chick, as first-laid ‘A-eggs’ are smaller, hatch later, and A-chicks are outcompeted for
regurgitated food and space under the brooding parent. B-eggs are preferentially incubated,
and A-eggs may be ‘deliberately’ ejected around the time of B-egg laying in the larger species,
or displaced just before hatching by movements of the B-chick and parent in the smaller
species (St Clair et al. 1995; St. Clair and St. Clair 1996). The mismatch between the clutch size
and fecundity of Eudyptes penguins suggests their two-egg clutch is a maladaptive canalized
trait, but what caused the evolution of a smaller A-egg, rather than a smaller B-egg, remains
uncertain (Stein and Williams 2013). Eudyptes penguins are also exceptional in the long 5-7
week courtship/incubation fast of both sexes, and the 3-5-week incubation/guard stage fast of
males (Williams 1995). All other penguin species alternate chick guarding (brooding) duties
between the sexes daily or every few days, so that males do not have a second long fast during
breeding. Furthermore, it is typical in other penguin species that females make the first
incubation foraging trip soon after laying, but Eudyptids have a prolonged shared incubation
period initially, followed by males going to sea for 9-16 days, and then females on a shorter
21
trip before hatching. Observations of unusual male-first incubation trips in Adélie (Pygoscelis
adeliae) and Chinstrap (P. antarctica) Penguins suggests this occurs when males have spent
considerably more time ashore than females before laying, so that males have depleted their
body reserves to a greater degree than females (Ainley et al. 1983; Trivelpiece and Trivelpiece
1990). This observation, that the degree of protandry determines incubation-shift order, is
supported by the male-first pattern in Fiordland Penguins (E. pachyrhynchus) described below.
Most species of Eudyptes penguins breed on the surface in dense colonies, often on
rocky slopes above the shoreline. However, two New Zealand endemic species behave
differently. Snares Penguins (E. robustus) often breed on flat ground under tree cover, and
Fiordland Penguins nest in isolation or in small/loose colonies under forest and in small caves
(Warham 1975). The migration and foraging ecology of Fiordland Penguins is unknown, but
they are suspected of foraging in more nearshore waters than other Eudyptids (Warham
1974b). A unique foraging ecology, closer to that of a nearshore foraging penguin species, is
suggested by Fiordland penguins being distinct among Eudyptids in having less synchronous
laying, the least dimorphic eggs, and the highest rate of rearing both chicks from a nest (St.
Clair 1992). Also uniquely, males and females in a pair appear to occupy nest sites at a similar
date instead of males arriving before females by c. 1 week, and have a longer period before
laying than in other Eudyptids (Grau 1982). The sexes similar pre-laying fast durations likely
leads to females making the first incubation foraging trip and males the second before
hatching, thereby reducing the second long fast of males to just the guard period. The large
breeding aggregations and predictable transits between sea and shore of other Eudyptids
attract avian and pinniped predators that may decrease penguin demographic rates.
STUDY SPECIES
Eastern Rockhopper Penguins (Eudyptes chrysocome filholi) are given full species status (E.
filholi) and have a ‘Nationally Critical’ threat status in New Zealand (Robertson et al. 2013), but
are classified as a sub-species of the ‘Vulnerable’ Southern Rockhopper Penguins (E. c.
chrysocome) by the International Union of the Conservation of Nature (IUCN; BirdLife
International 2012). Eastern Rockhopper Penguins breed at sub-Antarctic islands of the Indian
Ocean and in the New Zealand Region, the latter including small remnants of historically large
populations at Antipodes Island and the Auckland Islands (< 3,000 pairs each), and larger
populations at Campbell Island and Macquarie Island (> 30,000 pairs each, Chapter 2 and
references therein). Southern Rockhopper Penguins breed on islands of Southern South
22
America along the coasts of Chile and Argentina, and at the Falkland Islands. Only recently
were Northern Rockhopper Penguins recognized as a separate species from Southern/Eastern
Rockhopper Penguins, but their distinctness is more readily apparent, including an earlier
timing of breeding in warm, sub-temperate waters, exceptionally long crest feathers, and
different vocalizations (Jouventin et al. 2006; de Dinechin et al. 2009). Southern and Eastern
Rockhopper Penguins are very similar in their breeding ecology and morphology, the most
obvious difference being the white/pink skin around the base of the bill of Eastern Rockhopper
Penguins and white/pink colouration on the lower mandible in the New Zealand region,
whereas the “black-faced” Southern (and Northern) Rockhopper Penguin has black skin around
the bill and solid orange/brown lower and upper mandible (Morrison 2013; Pütz et al. 2013).
Rockhopper Penguins have evolved a body size and breeding pattern that places them
at the boundary of success and failure and relies upon predictably abundant food around
breeding colonies. They are the third-smallest penguin species after Little and Galapagos
Penguins (Borboroglu and Boersma 2013). The small body size of Little Penguins increases
their vulnerability and that of their nests to avian predators, so that they breed in isolation or
in loose colonies in burrows or dense vegetation and are the only penguin species that transits
between sea and shore only at night. Therefore, if Rockhopper Penguins were any smaller
their colonial surface nests and diurnal colony transits would likely cause high predation rates
that would challenge population persistence. At their present body size they are still more
vulnerable to predation than larger penguin species. Female Rockhopper Penguins may lose c.
40% of their arrival body mass over their courtship/incubation fast of > 6 weeks duration
(Chapters 3 and 5). The pre-fasting body composition of Rockhopper Penguins (26% lipid) and
proportion of mass loss during breeding fasts are similar to those of Emperor Penguins, the
largest penguin species whose greater size results in a slower metabolic rate and lessened risk
of starvation (Cherel et al. 1993; Robin et al. 1998). Perhaps more remarkably, female
Rockhopper Penguins make this large investment in reproduction (including clutch production)
without up-to-date knowledge on the current season’s local food availability. Females initiate
egg formation on migration 1-2 weeks before arriving to breed (Chapter 6), resulting in highly
repeatable lay dates and little behavioural plasticity within populations for matching their
timing of reproduction to changes in peak food availability (Dehnhard et al. 2015).
Additionally, feeding conditions at females’ arrival > 6 weeks previously may not closely reflect
those on their incubation foraging trip when they must regain some of their lost reserves
before exclusively provisioning their chick(s) for ≥ 3 weeks. In contrast to their relatively fixed
breeding schedule, Rockhopper Penguins may have a generalist diet, including various species
23
of zooplankton, cephalopods, and fish (Cooper et al. 1990). However, in a given year at a
particular site, one or two species of zooplankton may dominant the diet fed to chicks
(Tremblay and Cherel 2003).
All three Rockhopper Penguin taxa have experienced dramatic population declines,
primarily in the second-half of the 20th century, some of which may be ongoing (BirdLife
International 2010). Reduced food availability and/or quality because of climate change is
suspected as an important cause of the declines, given their broad geographic area and largely
simultaneous timing in conjunction with major oceanographic changes (Cunningham and
Moors 1994, Guinard et al. 1998; Pütz et al. 2006). A retrospective study of Rockhopper
Penguin diet through stable isotope analysis of feathers suggested no change in diet quality,
but marine productivity decreased at some sites as SST warmed (Hilton et al. 2006).
Alternative, but non-exclusive hypotheses include disease epidemics, mass mortality during
blooms of toxic algae, and competition for prey with, and predation by pinniped populations
recovering following historic exploitation (BirdLife International 2010).
STUDY SITE
Campbell Island New Zealand (52° 32ʹ 12ʺ S, 169° 2ʹ 10ʺ E) is New Zealand’s southern-most
sub-Antarctic island group. It is part of New Zealand’s sub-Antarctic World Heritage Area, is an
ecological preserve, and in 2014 had a restricted-use marine protected area created around a
portion of its circumference out to 12 nautical miles (Peat et al. 2006). The island was perhaps
first discovered by a sealing ship in 1810, as prior Polynesian visitation has yet to be confirmed.
Sealers introduced Norway rats (Rattus norvegicus) which affected the ecosystem heavily until
their eradication in 2001. Sheep and cattle farming was tried early in the 20th century, but
abandoned, the last feral stock to be eliminated were sheep on the western peninsula in 1989.
WWII coast watchers lived year-round on the island in the 1940s and provided important
observations and photographs of the much larger southern elephant seal (Mirounga leonina),
Campbell (Thalassarche impavida) and Grey-headed (T. chrysostoma) Albatross, and Eastern
Rockhopper Penguin populations of that time (Bailey and Sorensen 1962). A small population
of Erect-crested Penguins (E. sclateri) formerly bred at Campbell Island, but appear to have
been extirpated during the Eastern Rockhopper Penguin population decline. Currently, the
only other penguin species breeding on the island, Yellow-eyed Penguin, breeds at isolated
nests in the Dracophyllum scrub forest around much of the island, but form a comparably
small population, estimated to be 1,034 individuals in 1992 and of unknown recent trend
24
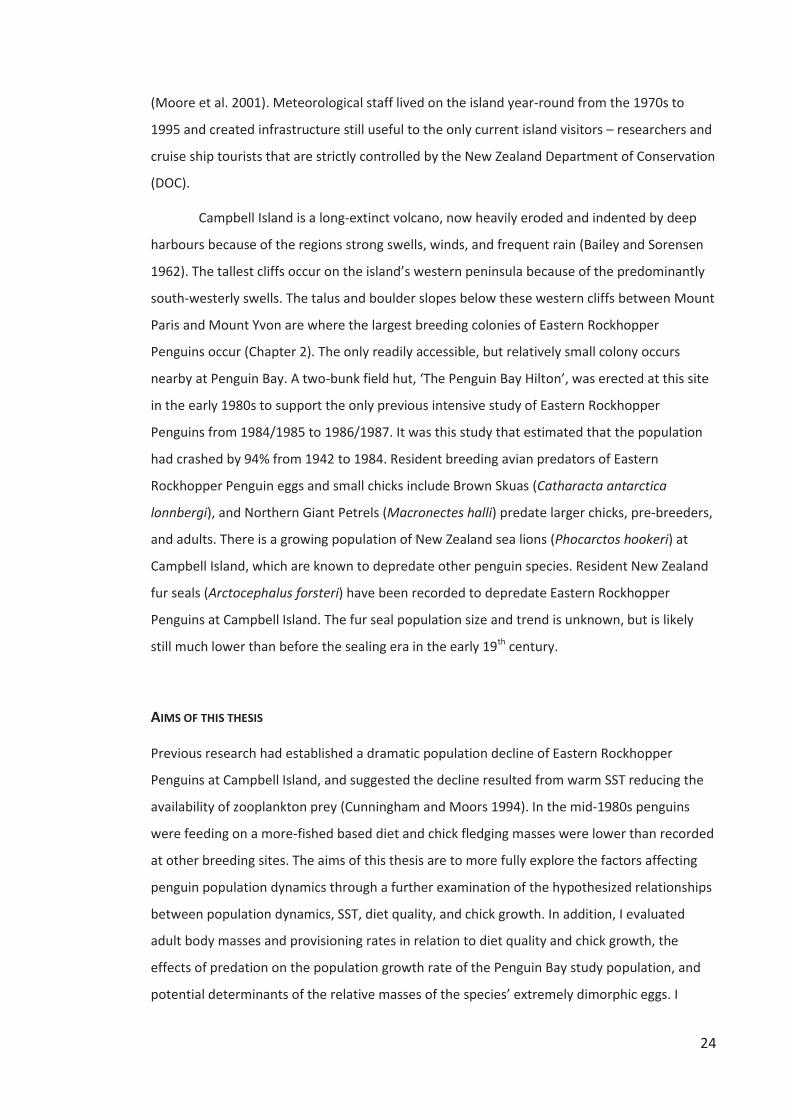
(Moore et al. 2001). Meteorological staff lived on the island year-round from the 1970s to
1995 and created infrastructure still useful to the only current island visitors – researchers and
cruise ship tourists that are strictly controlled by the New Zealand Department of Conservation
(DOC).
Campbell Island is a long-extinct volcano, now heavily eroded and indented by deep
harbours because of the regions strong swells, winds, and frequent rain (Bailey and Sorensen
1962). The tallest cliffs occur on the island’s western peninsula because of the predominantly
south-westerly swells. The talus and boulder slopes below these western cliffs between Mount
Paris and Mount Yvon are where the largest breeding colonies of Eastern Rockhopper
Penguins occur (Chapter 2). The only readily accessible, but relatively small colony occurs
nearby at Penguin Bay. A two-bunk field hut, ‘The Penguin Bay Hilton’, was erected at this site
in the early 1980s to support the only previous intensive study of Eastern Rockhopper
Penguins from 1984/1985 to 1986/1987. It was this study that estimated that the population
had crashed by 94% from 1942 to 1984. Resident breeding avian predators of Eastern
Rockhopper Penguin eggs and small chicks include Brown Skuas (Catharacta antarctica
lonnbergi), and Northern Giant Petrels (Macronectes halli) predate larger chicks, pre-breeders,
and adults. There is a growing population of New Zealand sea lions (Phocarctos hookeri) at
Campbell Island, which are known to depredate other penguin species. Resident New Zealand
fur seals (Arctocephalus forsteri) have been recorded to depredate Eastern Rockhopper
Penguins at Campbell Island. The fur seal population size and trend is unknown, but is likely
still much lower than before the sealing era in the early 19th century.
AIMS OF THIS THESIS
Previous research had established a dramatic population decline of Eastern Rockhopper
Penguins at Campbell Island, and suggested the decline resulted from warm SST reducing the
availability of zooplankton prey (Cunningham and Moors 1994). In the mid-1980s penguins
were feeding on a more-fished based diet and chick fledging masses were lower than recorded
at other breeding sites. The aims of this thesis are to more fully explore the factors affecting
penguin population dynamics through a further examination of the hypothesized relationships
between population dynamics, SST, diet quality, and chick growth. In addition, I evaluated
adult body masses and provisioning rates in relation to diet quality and chick growth, the
effects of predation on the population growth rate of the Penguin Bay study population, and
potential determinants of the relative masses of the species’ extremely dimorphic eggs. I
25
employed a variety of recent technological advances to facilitate data collection and analysis,
while decreasing the risk of detrimental research effects to the penguins. Such technologies
included digital photography and analysis of colony size, stable isotope analysis of penguin
blood samples, individually marking penguins with passive integrated transponder (PIT) tags,
and the use of an automated gateway to record PIT tag codes to determine survival and
provisioning rates.
RESEARCH CHAPTERS
My three field research seasons on Campbell Island, 2010–2011, 2011–2012, and 2012–2013,
occurred between mid-October and mid-January, and so considered the penguin’s courtship,
incubation, and the first-half of the chick-rearing period. My opportunity to spend time in
Penguin Bay in the 2010–2011 season was limited, so it acted as a pilot year that set up more
intensive research during the following two seasons.
This thesis is written in the style of five stand-alone scientific journal articles, two of
which (Chapters 2 and 3), have been published in Polar Biology, and Marine Biology,
respectively. In the five research chapters I considered the following focal questions, by
chapter number:
2. What were the 1984–1996 and 1996–2012 population growth rates of Eastern Rockhopper
Penguins on Campbell Island and were they associated with patterns of SST?
3. Was a higher-trophic level, more fish-based diet, a higher quality diet for Eastern
Rockhopper Penguin adults and chicks, in that individuals with a higher trophic level diet had a
greater body mass than those feeding at a lower trophic level?
4. Does the canalized division of labour strategy of Eastern Rockhopper Penguins during early
chick-rearing reduce their potential provisioning rates relative to a strategy of shared parental
roles?
5. Is the localized decline of the Eastern Rockhopper Penguin population in Penguin Bay being
caused by predation?
6. Does a carry-over effect of migration underlie individual variation in extreme egg-size
dimorphism in Eastern Rockhopper Penguins?
26
27
Chapter 2
POPULATION DYNAMICS OF EASTERN ROCKHOPPER PENGUINS ON CAMPBELL ISLAND IN RELATION TO
SEA SURFACE TEMPERATURE 1942–2012: CURRENT WARMING HIATUS PAUSES A LONG-TERM DECLINE
Morrison KW, Battley PF, Sagar PM, Thompson DR (2015) Polar Biology 38 (2):163-177.
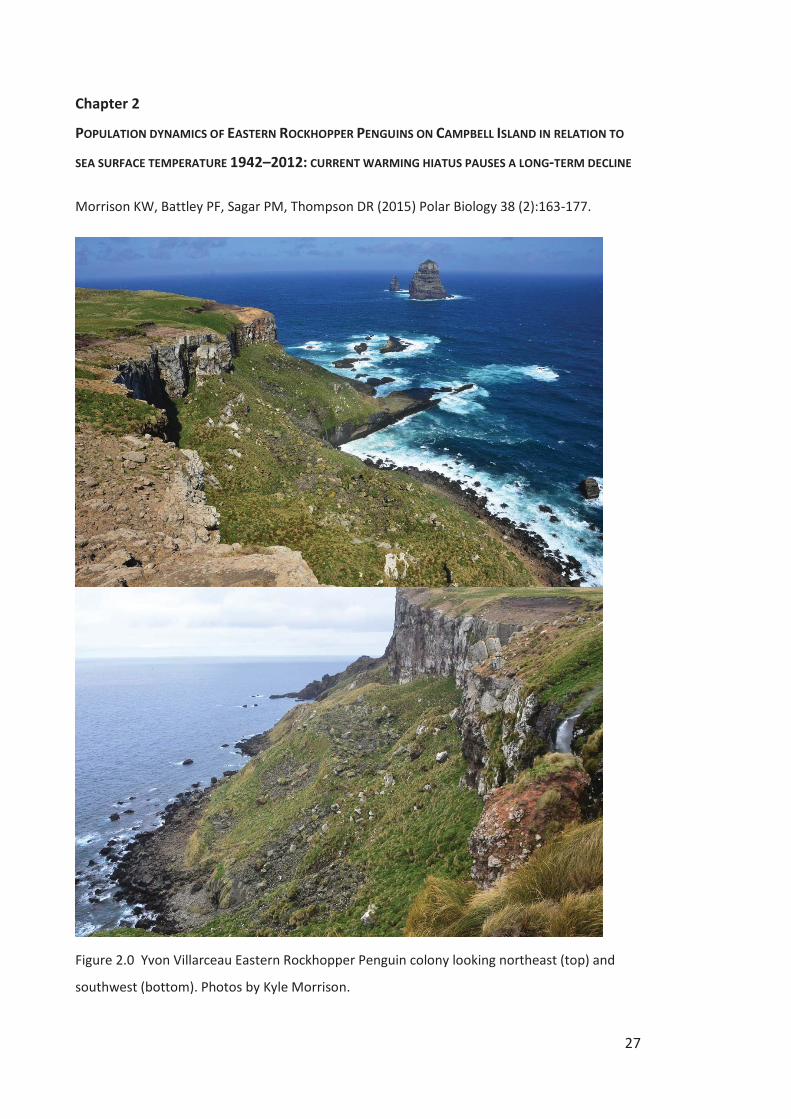
Figure 2.0 Yvon Villarceau Eastern Rockhopper Penguin colony looking northeast (top) and
southwest (bottom). Photos by Kyle Morrison.
28
ABSTRACT
Major population changes of marine mega-fauna are ongoing as global warming and other
anthropogenic drivers affect prey availability. The historical stronghold of the Eastern
Rockhopper Penguin (Eudyptes chrysocome filholi) was New Zealand’s sub-Antarctic Campbell
Island, but the population declined by 94% between 1942 and 1984. The apparent mechanism
of collapse was warm ocean temperatures causing an inadequate food supply. Eudyptes
penguin population declines are ongoing at some breeding sites, highlighting the need to
investigate the population trend on Campbell Island since 1984. We estimated the Eastern
Rockhopper Penguin breeding population size through physical and photo-counts of birds and
nests in 2012, and changes in colony area relative to 1984 and 1996 photos. We estimated the
2012 population size at 33,239 breeding pairs, a 21.8% decrease from an (adjusted) estimate
of 42,528 pairs in 1984. Although substantial, the recent 1984–2012 decline occurred at a
much slower rate (λ = 0.991) than the 1942–1984 decline (λ = 0.940). Despite great variation in
trends between colonies ostensibly linked to differences in predation rates, the recent decline
occurred primarily between 1984 and 1996, and thereafter the overall population grew. A 100-
yr time series of extended reconstructed sea surface temperatures (ERSST) confirmed that the
population declined during warm periods and increased during cool periods, but that the initial
decline began before increases in regional ERSST. Population growth after 1996 appears
related to the current global warming hiatus, lower ERSST, and increased abundance of a key
prey species. We predict a continuation of the long-term population decline after warming
resumes.
INTRODUCTION
Global warming, fisheries, habitat degradation, and historical and contemporary over-
exploitation are altering predator-prey dynamics and species’ distributions, causing rapid
population changes in many marine mega-fauna (Hucke-Gaete et al. 2004; Rolland et al. 2008;
Trivelpiece et al. 2011; Hazen et al. 2012). Most penguin populations have declined in recent
decades, with 11 of 18 species designated by BirdLife International as being threatened with
extinction (Vulnerable or Endangered), four as Near Threatened, and three as Least Concern
(BirdLife International 2014). Although considerable attention has been given to the future of
the two strictly Antarctic-breeding penguin species, Adélie Penguins (Pygoscelis adeliae), and
Emperor Penguins (Aptenodytes forsteri), in a warming world (Barbraud and Weimerskirch
29
2001; Croxall et al. 2002; Jenouvrier et al. 2009b), those of greatest immediate concern are the
less studied species of lower latitudes, some of which have been declining rapidly for decades.
For example, all seven crested penguins of the genus Eudyptes are ranked as Vulnerable or
Endangered (BirdLife International 2014).
Rockhopper Penguins have a circumpolar distribution, breeding on 25–30 island
groups of the southern regions of the Atlantic, Indian, and Pacific Oceans. Northern
Rockhopper Penguins (Eudyptes moseleyi) were recently recognized by BirdLife International
as a separate species from Southern Rockhopper Penguins (sometimes called Western
Rockhopper Penguins, E. chrysocome chrysocome), and some researchers support full species
status for Eastern Rockhopper Penguins (E. c. filholi; Banks et al. 2006; de Dinechin et al. 2009).
In the past 37 years the global populations of Southern/Eastern and Northern Rockhopper
Penguins have declined by 34 and 57%, respectively (BirdLife International 2010), resulting in
IUCN Red List rankings of ‘Vulnerable' and ‘Endangered’ (BirdLife International 2014; but see
Robson et al. 2011; Baylis et al. 2013). At many Rockhopper Penguin breeding sites the
population record extends back only 30 years (BirdLife International 2010), but where the
record extends back further to the mid-20th century, declines of c. 90% representing millions of
birds have been documented (Cunningham and Moors 1994; Pütz et al. 2003; Cuthbert et al.
2009). Suggested causes of Rockhopper Penguin population declines vary from lower food
availability related to warmer (Cunningham and Moors 1994) or cooler (Guinard et al. 1998;
Pütz et al. 2006) sea surface temperatures (SSTs), oiling and negative fisheries effects
(Bingham 2002; Pütz et al. 2006), direct mortality from humans and introduced pests (Cuthbert
et al. 2009), and predation by or competition with growing pinniped populations (Cuthbert et
al. 2009). The widespread and largely simultaneous declines of Rockhopper Penguin
populations throughout their range might signal a single shared cause. A longitudinal study of
stable isotope signatures of Rockhopper Penguin feathers at seven breeding sites supported an
overall decline in marine productivity through the 20th Century, and suggested Rockhopper
Penguins had a lower-quality diet in years of warm SST (Hilton et al. 2006, but see Morrison et
al. 2014 – hereafter 'Chapter 3').
Campbell Island (52° 32ʹ 24ʺ S, 169° 8ʹ 42ʺ E), New Zealand’s southernmost sub-
Antarctic territory, formerly held the world’s largest breeding colony of Eastern Rockhopper
Penguins (‘Rockhopper(s)’), but a dramatic decline between 1942 and 1984 reduced the
population by an estimated 94% (Moors 1986; Cunningham and Moors 1994). Researchers
typically represent penguin population size as the number of breeding pairs, equal to the
number of nests actually counted during the incubation period or estimated by nest
30
density*colony area (Trathan 2004; Cuthbert et al. 2009; Baylis et al. 2013). Cunningham and
Moors (1994) measured nest density in a photo of one historical colony and by sub-sampling in
two contemporary colonies, and estimated or measured colony areas to derive estimates of
814,550 breeding pairs on Campbell Island in 1942 and 51,550 pairs in 1985. The authors
suggested that the decline was linked to warming SSTs that may have reduced availability of
preferred prey around Campbell Island, leading to reduced reproductive success and survival.
Prior to our study the current size of the Rockhopper Penguin population on Campbell Island
was unknown, but the rate of decline at some other colonies may have accelerated in recent
years (BirdLife International 2014).
The steep, rocky, and generally inaccessible Rockhopper Penguin colonies on Campbell
Island make traditional methods of physically measuring colony areas and nest densities
extremely difficult at most sites. However, recent technological advances in photographic and
digital image analysis allowed our development of alternative methods based on counting
penguins in high resolution digital photo mosaics (‘photo-counts’) in 2012, and comparing
change in relative colony area in oblique photos taken from standardized locations
(‘photopoints’) in 1984, 1996, and 2012. Throughout our study we refer to Cunningham and
Moors (1994) population estimate in 1985 as the 1984 estimate to coincide with the
photopoint photos we used that were taken in 1984.
The primary objectives of the current study were to estimate the size of the
Rockhopper breeding population on Campbell Island in 2012 and rates of population change
from 1984–1996 and 1996–2012. Secondarily, we related population dynamics from 1942–
2012 to a 100-yr time series of SST. Thirdly, we surveyed the current occupation status of 20 of
23 former colony sites and summarized historical information on colony occupancy.
Additionally, we examined inter-colony differences in rates of population change, revised the
1942 and 1984 population estimates by suggesting alternative, colony-specific nest densities,
and suggested methods to use for future population estimates.
MATERIALS AND METHODS
Study species
Southern/Eastern Rockhopper Penguins are among the world’s smallest penguin species, being
45–55 cm in length, and weighing 2.2–4.3 kg (Marchant and Higgins 1990). The sexes are
reliably separated by bill measurements (Warham 1972; Hull 1996), with larger-billed males
31
readily distinguishable in breeding pairs. Rockhopper Penguins are highly gregarious and often
form large breeding colonies. They are socially monogamous and appear to form long-lasting
pair bonds, renewed annually by high nest site fidelity and visual and vocal recognition
(Warham 1975). The nest site is a lined scrape on rock terraces, on scree slopes, among
boulders, and occasionally among tussock or in caves, sometimes 400 m from shore on
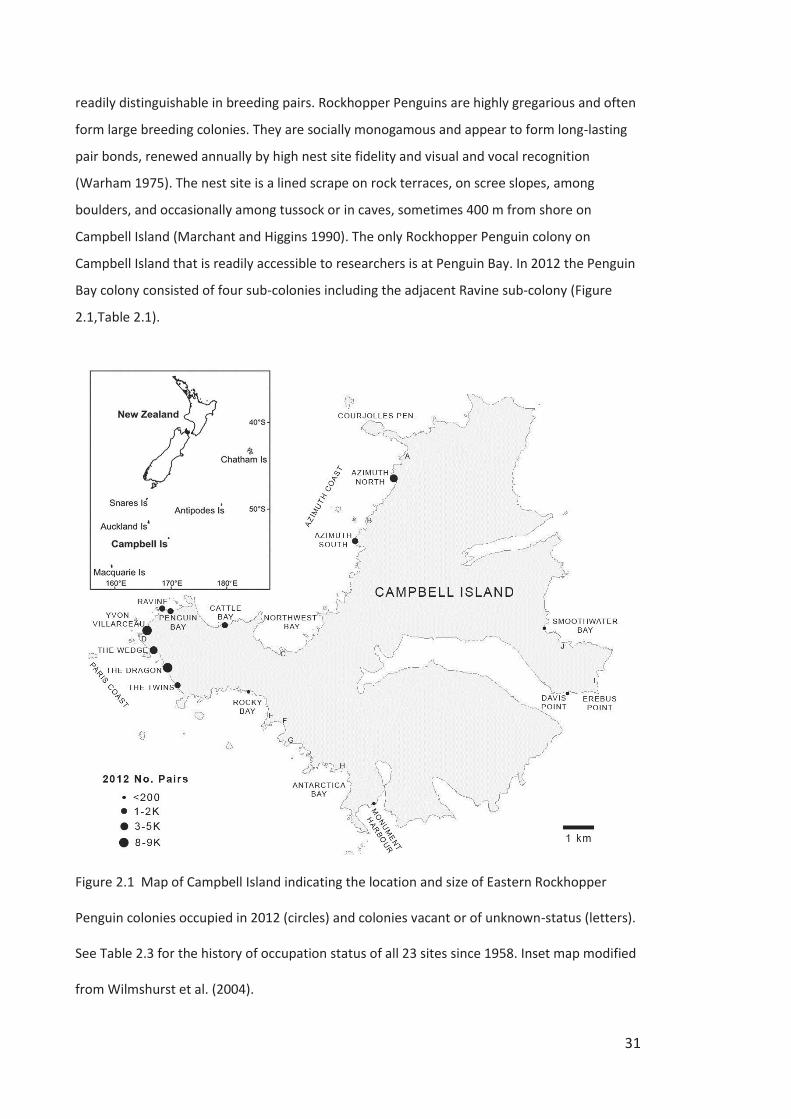
Campbell Island (Marchant and Higgins 1990). The only Rockhopper Penguin colony on
Campbell Island that is readily accessible to researchers is at Penguin Bay. In 2012 the Penguin
Bay colony consisted of four sub-colonies including the adjacent Ravine sub-colony (Figure
2.1,Table 2.1).
Figure 2.1 Map of Campbell Island indicating the location and size of Eastern Rockhopper
Penguin colonies occupied in 2012 (circles) and colonies vacant or of unknown-status (letters).
See Table 2.3 for the history of occupation status of all 23 sites since 1958. Inset map modified
from Wilmshurst et al. (2004).
32
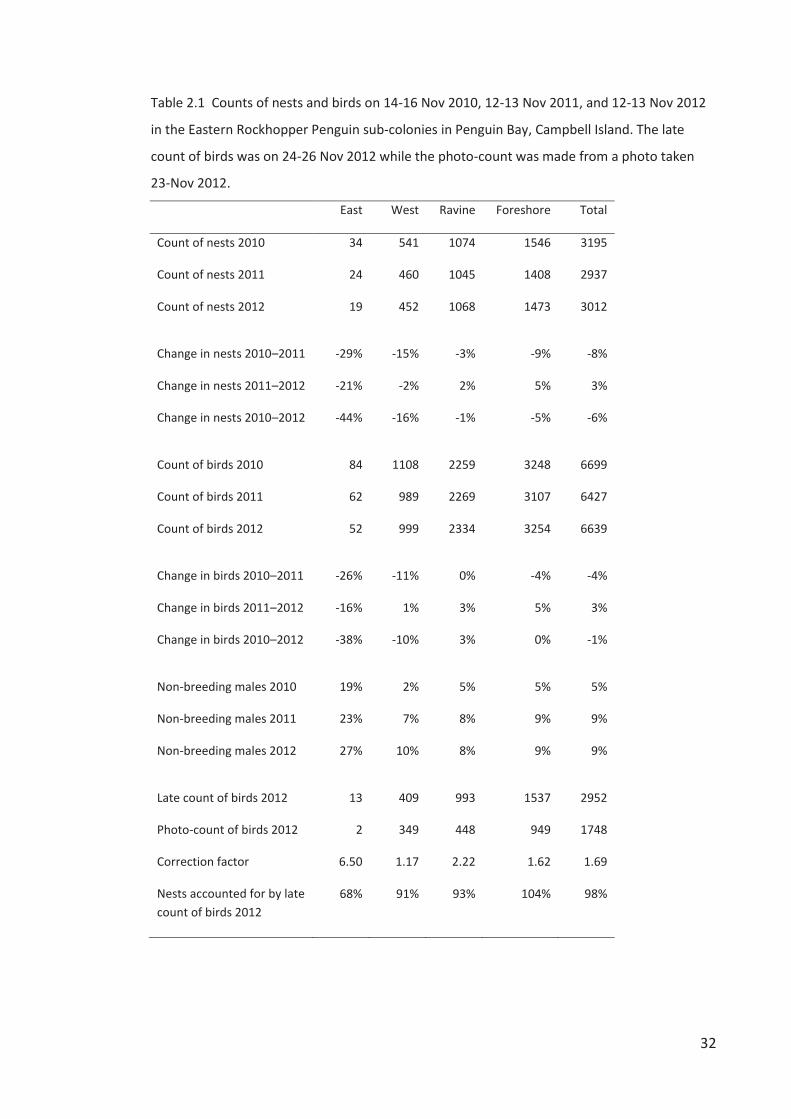
Table 2.1 Counts of nests and birds on 14-16 Nov 2010, 12-13 Nov 2011, and 12-13 Nov 2012
in the Eastern Rockhopper Penguin sub-colonies in Penguin Bay, Campbell Island. The late
count of birds was on 24-26 Nov 2012 while the photo-count was made from a photo taken
23-Nov 2012.
East West Ravine Foreshore Total
Count of nests 2010 34 541 1074 1546 3195
Count of nests 2011 24 460 1045 1408 2937
Count of nests 2012 19 452 1068 1473 3012
Change in nests 2010–2011 -29% -15% -3% -9% -8%
Change in nests 2011–2012 -21% -2% 2% 5% 3%
Change in nests 2010–2012 -44% -16% -1% -5% -6%
Count of birds 2010 84 1108 2259 3248 6699
Count of birds 2011 62 989 2269 3107 6427
Count of birds 2012 52 999 2334 3254 6639
Change in birds 2010–2011 -26% -11% 0% -4% -4%
Change in birds 2011–2012 -16% 1% 3% 5% 3%
Change in birds 2010–2012 -38% -10% 3% 0% -1%
Non-breeding males 2010 19% 2% 5% 5% 5%
Non-breeding males 2011 23% 7% 8% 9% 9%
Non-breeding males 2012 27% 10% 8% 9% 9%
Late count of birds 2012 13 409 993 1537 2952
Photo-count of birds 2012 2 349 448 949 1748
Correction factor 6.50 1.17 2.22 1.62 1.69
Nests accounted for by late count of birds 2012
68% 91% 93% 104% 98%
33
The spring-summer breeding period is divided into four stages – (1) arrival and
courtship, (2) incubation, (3) guard, and (4) crèche stages – followed in the austral autumn by
the pre-moult exodus and moult. After arriving from over-wintering areas to breed, both sexes
remain ashore and fast at their nest site until after egg-laying. Males typically arrive on
Campbell Island in the second week of October, females a week later (Chapter 3). Single males
that have been unable to attract a mate usually continue to guard a nest site at least until
breeding males depart (K.W.M. pers. obs.). In contrast, females that arrive in October rarely
went unpaired at our Penguin Bay count sites on Campbell Island, suggesting a male-biased
breeding population. Females lay a two-egg clutch in the first two weeks of November, about
two weeks after their arrival. Very few of the birds paired in October fail to produce eggs.
Males depart synchronously over a few days about a week after clutch completion on a c. 2-
week long incubation foraging trip, leaving the female to take the first solo incubation shift.
Pairs that lose both eggs early in incubation will continue to guard their nest site at least until
males depart on their incubation foraging trip, but often both remain longer (K.W.M. pers.
obs.). Returned males take over incubation duties and females go to sea for about a week,
returning near hatching in the second week of December (Chapter 3). Rockhopper Penguin
surveys beyond the mid-incubation period are a poor representation of the breeding
population size because of the departure of failed breeders and arrival of sub-adults. The
October to February breeding seasons will be referred to throughout our study using the year
in which they began.
Colony occupation status
We visited or viewed from above 20 of 23 historically occupied Rockhopper Penguin colonies
on Campbell Island during the 2010–2012 breeding seasons to determine their occupancy
status (Figure 2.1). The 23 sites were identified from four sources in the literature extending
back to a 1958 survey (Westerskov 1960; Department of Lands and Survey 1980; Moors 1986;
Cunningham and Moors 1994). The three historical colonies that we did not visit or view from
above were viewed from a boat with binoculars. All colonies apparently vacant 2010–2012
were viewed multiple times without observing breeding Rockhopper Penguins, except for the
bays below and east of Mt. Dumas, and Antarctica Bay, which were viewed only once in 2011,
when no penguins were seen.
34
Population estimation
Our estimation of the Rockhopper Penguin breeding population size and trends on Campbell
Island consists of four parts: 1) Penguin Bay counts – census counts of the Penguin Bay sub-
colonies in three consecutive years to measure inter-annual variation and allow ground
truthing of photo-counts; 2) Photo-counts – counting all penguins visible in oblique photos in
2012; 3) Adjusted nest numbers – adjusting the 1942 and 1984 population estimates based on
colony-specific nest densities; 4) Relative area comparison in photos – comparing the change
in relative colony area in photos taken from standardized photopoints in 1984, 1996, and
2012.
Penguin Bay counts
Penguin Bay contains the only Rockhopper Penguin colony on Campbell Island readily
accessible to researchers (Figure 2.1). In 1984, Cunningham and Moors (1994) established
photopoints overlooking Penguin Bay and the seven other largest colonies so that photos
could be used to assess future population change. The Penguin Bay colony currently consists of
four sub-colonies, including the Ravine. Census counts were made using tally counters in mid-
November 2010, 2011, and 2012 (for dates see Table 2.1) in all Penguin Bay sub-colonies early
in the incubation period when both pair members were attending nests. Nests were counted if
containing eggs, or empty but attended by both pair members. Empty nests guarded by
unpaired males were not counted as nests. Total birds were also counted. Counts were
conducted only once because of time constraints and to limit disturbance.
To ensure the accuracy of counts we used a grid system composed of two yellow ropes
marked with alternating red and black tags at 2.5 m intervals. The ropes were aligned in
parallel at one end of the colony, 2.5 m apart, with tags of the same colour opposite each
other. Counters remained at either end of the ropes at the edge of the colony and counted
nests and birds in each of the grid squares formed by the ropes and coloured tags. Counters
counted the grid squares closest to them, stopping at an agreed upon grid boundary towards
the middle of the colony. Counters counted only their own squares, repeating counts until they
were confident of the totals. After a row of squares was counted the outermost rope was lifted
from either end and placed parallel to the remaining rope a further 2.5 m into the colony to
create another row of squares. Only occasionally did counters have to enter the edge of the
colonies to see behind large boulders, except at the larger Foreshore colony, which was too
large to count from the edges, and so was divided down the middle with each half being
35
counted separately by having one of the counters counting from the midline.
Years in which a large proportion of the population skip breeding can lead to
underestimates of breeding population size (Croxall and Rothery 1995; Baylis et al. 2013).
Annual counts in Penguin Bay over three years were used to assess whether we were likely to
have selected a year of “normal” breeding effort to make an island-wide population estimate.
Photo-counts were made from photos taken 23–26 (“late”) November 2012 in the first
half of the female-only incubation period, soon after all breeding males and most non-
breeding males had gone to sea (Chapter 3). Each bird counted was assumed to represent one
breeding pair. Photo-counts in mid-November when all breeding birds were ashore would
remove the potential negative bias of the departure of failed breeders. However, mid-
November photo-counts are impractical because birds overlap and obscure one another. In
contrast, counting non-breeding penguins that remain in late-November is a potential positive
bias to the estimated number of breeding pairs. It is clear that photo-counts will
underestimate the actual number of nests present because an unknown proportion of nests
are hidden behind or beneath rocks and boulders. Additionally, this proportion will differ
between colonies based on boulder size and number, colony topography, and photo angle and
distance. We ground-truthed our late-November photo-counts by repeating census counts of
total birds in the four Penguin Bay sub-colonies 24–26 November 2012. The late-November
counts allowed the calculation of photo-count correction factors to account for birds not
visible in the photographs. Additionally, we calculated what % of nests counted in 12–13 (mid-)
November were accounted for by the late-November count of birds when we expected only
one bird (incubating female) per nest. These percentages demonstrated whether the
departure of failed breeders or retention of non-breeding males strongly influenced the
assumption that late-November counts of birds were an appropriate proxy for the original
mid-November number of nests.
The percentage of non-breeding males in mid-November (1), is given by:
((b1 – 2*n1)/ b1)*100 (1)
where b1 is the mid-November count of birds and n1 is the mid-November count of nests.
The photo-count correction factor (2) equals:
b2/bp (2)
where b2 is the late-November count of birds and bp is the photo-count of birds.
36
The % of nests counted in mid-November accounted for by the late-November count of birds
(3) equals:
(b2/n1)*100 (3)
Photo-counts
Photo-counts were made on “mosaic” images merged automatically in Adobe Photoshop CS6
(Adobe Systems Inc.). Images were composed of 2–35 photographs taken at focal lengths of
42–200 mm with a Nikon D7000 DSLR camera and 18–200 mm Nikon lens. Photographs were
taken 23–26 November 2012 either at the cliff-edge photopoints established by Cunningham
and Moors (1994) or at adjacent viewpoints offering a complementary or more vertical
viewing angle. Photo-counts were made on separate images for different discrete sections of a
colony as colony topography required. We used the “Count” tool of Adobe Photoshop CS6 to
mark each penguin in the image with a consecutive number and to provide a running total.
Photopoint photos taken in previous years were of inadequate quality to make comparable
photo-counts. Photo-counts or physical counts during incubation were not possible for four
small colonies amongst large boulders: Rocky Bay, Monument Harbour, Davis Point, and
Smoothwater Bay (Figure 2.1). Our estimates of 100 or 200 pairs in each are based upon chick-
rearing counts at Rocky Bay and Smoothwater Bay, and the limited penguin activity observed
at Monument Harbour and Davis Point.
Adjusted nest numbers
In generating population estimates for 1942 and 1984 Cunningham and Moors (1994) applied
a nest density of 2.0 nests/m2 across all colonies regardless of inter-colony variation in
topography and nest substrate. The authors’ ability to estimate density in 1942 was obviously
limited, but the now extinct “Mystery” colony in the historical photo they used was one free of
the vegetation and huge boulders that appear to limit nest density at some other colonies. As
in the “Mystery” colony, large boulders and vegetation occur only at the peripheries of the
Penguin Bay and Cattle Bay colonies where Cunningham and Moors measured a nest density
of c. 2.0 nests/m2 in the mid-1980s (Figure 2.1). We adjusted the nest numbers for 1942 and
1984 estimated by Cunningham and Moors based on our impression that a nest density of 1.5
nests/m2 was more likely for the Yvon Villarceau, Paris Coast, and Rocky Bay colonies than the
estimate of 2.0 nests/m2 the authors applied across all colonies (Figure 2.1). Historical photos

37
from the 1940s show that a large proportion of colony area in these locations was recently
colonized and still vegetated and/or amongst huge boulders, reducing the area available for
nests. Similarly, remnant colonies in these areas in 1984 were amongst much larger boulders
than in Penguin Bay and Cattle Bay.
Changes in the estimated number of pairs between years are presented in two forms. The %
change in number of breeding pairs (4) is:
((p2-p1)/p1)*100 (4)
where p1 is the number of pairs in the earlier year (y1) and p2 is the number of pairs in the later
year (y2). The annual (exponential) population growth rate (λ) is based on the equation (5):
p2 = p1* λt (5)
where t = y2-y1.
Relative area comparison in photos
The inaccessibility and complex topography of the colonies and oblique angles of the
photopoint photographs prevented our measurement of the actual geometric areas of the
colonies. Instead, we measured the visible “area” of a colony in a photopoint photo relative to
the “area” of the same colony photographed from the same photopoint in a different year. We
calculated the % change in “relative area” between photopoint photos from 1984, 1996, and
2012 by first outlining the colony perimeter using the “Polygonal Lasso” tool in Adobe
Photoshop CS6 (see Figure 2.2). Relative area was measured in arbitrary units defined by
setting a custom measurement scale equal to the distance between specific points on two
stationary boulders spaced as far apart as possible in the photograph. The “Measurement”
function in Photoshop produced the “area” of the outlined colony. To account for
measurement error associated with lens distortion, the precise position of the photographer,
and differences in the exact placement of scale markers on the image, we set the
measurement scale between two different boulders and re-measured the “area” a total of six
times in each photograph. The process was repeated for each photograph of the time series
from a given photopoint using the same boulders as scale markers. We calculated the %
change in relative area between years as the average of the % change in relative area of the six
measures.
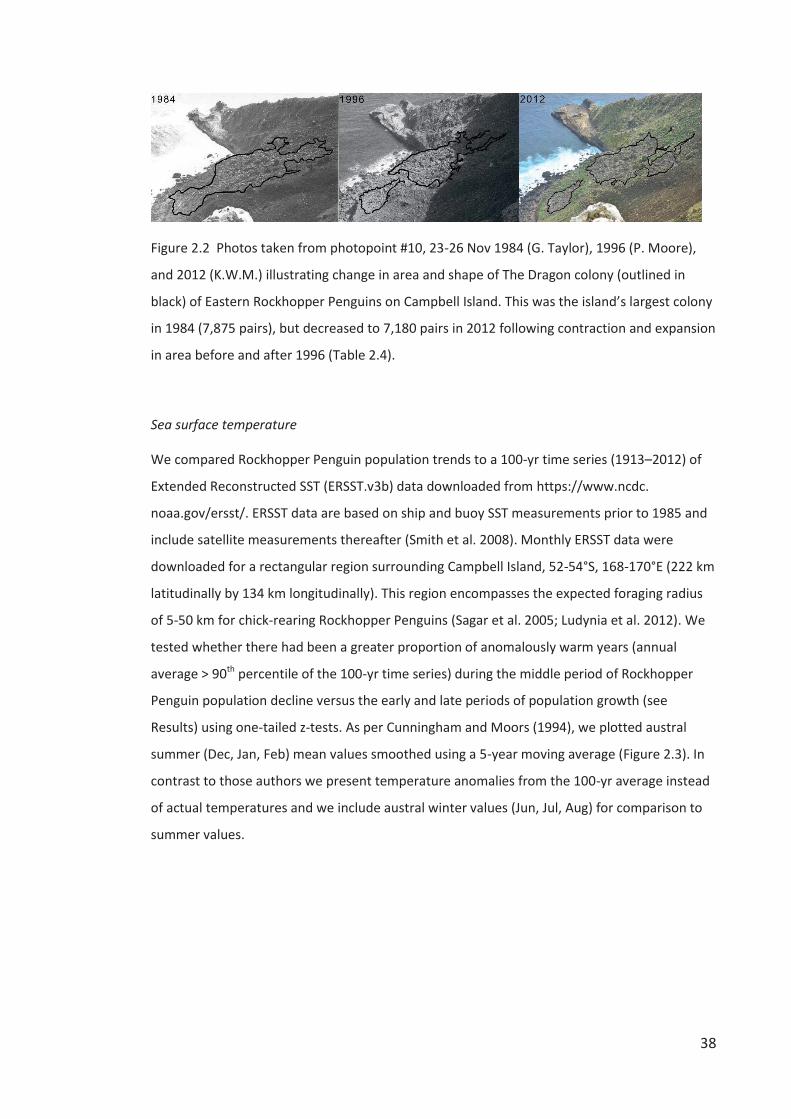
38
Figure 2.2 Photos taken from photopoint #10, 23-26 Nov 1984 (G. Taylor), 1996 (P. Moore),
and 2012 (K.W.M.) illustrating change in area and shape of The Dragon colony (outlined in
black) of Eastern Rockhopper Penguins on Campbell Island. This was the island’s largest colony
in 1984 (7,875 pairs), but decreased to 7,180 pairs in 2012 following contraction and expansion
in area before and after 1996 (Table 2.4).
Sea surface temperature
We compared Rockhopper Penguin population trends to a 100-yr time series (1913–2012) of
Extended Reconstructed SST (ERSST.v3b) data downloaded from https://www.ncdc.
noaa.gov/ersst/. ERSST data are based on ship and buoy SST measurements prior to 1985 and
include satellite measurements thereafter (Smith et al. 2008). Monthly ERSST data were
downloaded for a rectangular region surrounding Campbell Island, 52-54°S, 168-170°E (222 km
latitudinally by 134 km longitudinally). This region encompasses the expected foraging radius
of 5-50 km for chick-rearing Rockhopper Penguins (Sagar et al. 2005; Ludynia et al. 2012). We
tested whether there had been a greater proportion of anomalously warm years (annual
average > 90th percentile of the 100-yr time series) during the middle period of Rockhopper
Penguin population decline versus the early and late periods of population growth (see
Results) using one-tailed z-tests. As per Cunningham and Moors (1994), we plotted austral
summer (Dec, Jan, Feb) mean values smoothed using a 5-year moving average (Figure 2.3). In
contrast to those authors we present temperature anomalies from the 100-yr average instead
of actual temperatures and we include austral winter values (Jun, Jul, Aug) for comparison to
summer values.
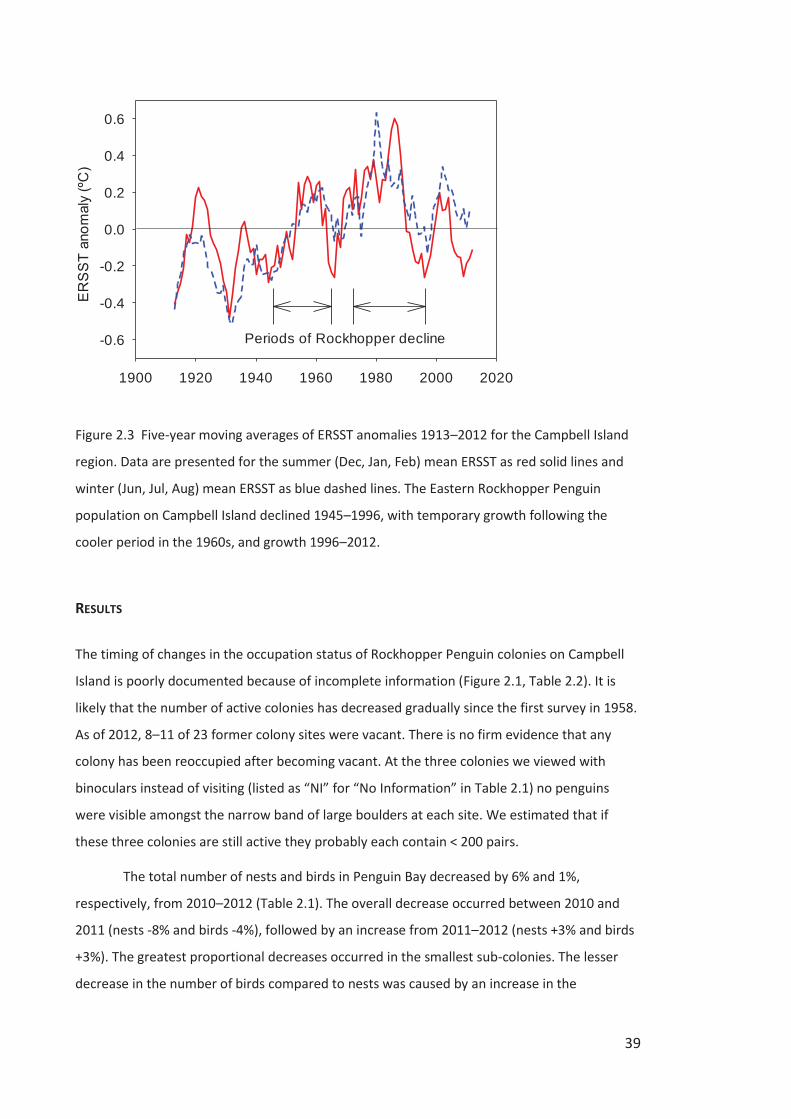
39
1900 1920 1940 1960 1980 2000 2020
ER
SS
T an
omal
y (º
C)
-0.6
-0.4
-0.2
0.0
0.2
0.4
0.6
Periods of Rockhopper decline
Figure 2.3 Five-year moving averages of ERSST anomalies 1913–2012 for the Campbell Island
region. Data are presented for the summer (Dec, Jan, Feb) mean ERSST as red solid lines and
winter (Jun, Jul, Aug) mean ERSST as blue dashed lines. The Eastern Rockhopper Penguin
population on Campbell Island declined 1945–1996, with temporary growth following the
cooler period in the 1960s, and growth 1996–2012.
RESULTS
The timing of changes in the occupation status of Rockhopper Penguin colonies on Campbell
Island is poorly documented because of incomplete information (Figure 2.1, Table 2.2). It is
likely that the number of active colonies has decreased gradually since the first survey in 1958.
As of 2012, 8–11 of 23 former colony sites were vacant. There is no firm evidence that any
colony has been reoccupied after becoming vacant. At the three colonies we viewed with
binoculars instead of visiting (listed as “NI” for “No Information” in Table 2.1) no penguins
were visible amongst the narrow band of large boulders at each site. We estimated that if
these three colonies are still active they probably each contain < 200 pairs.
The total number of nests and birds in Penguin Bay decreased by 6% and 1%,
respectively, from 2010–2012 (Table 2.1). The overall decrease occurred between 2010 and
2011 (nests -8% and birds -4%), followed by an increase from 2011–2012 (nests +3% and birds
+3%). The greatest proportional decreases occurred in the smallest sub-colonies. The lesser
decrease in the number of birds compared to nests was caused by an increase in the
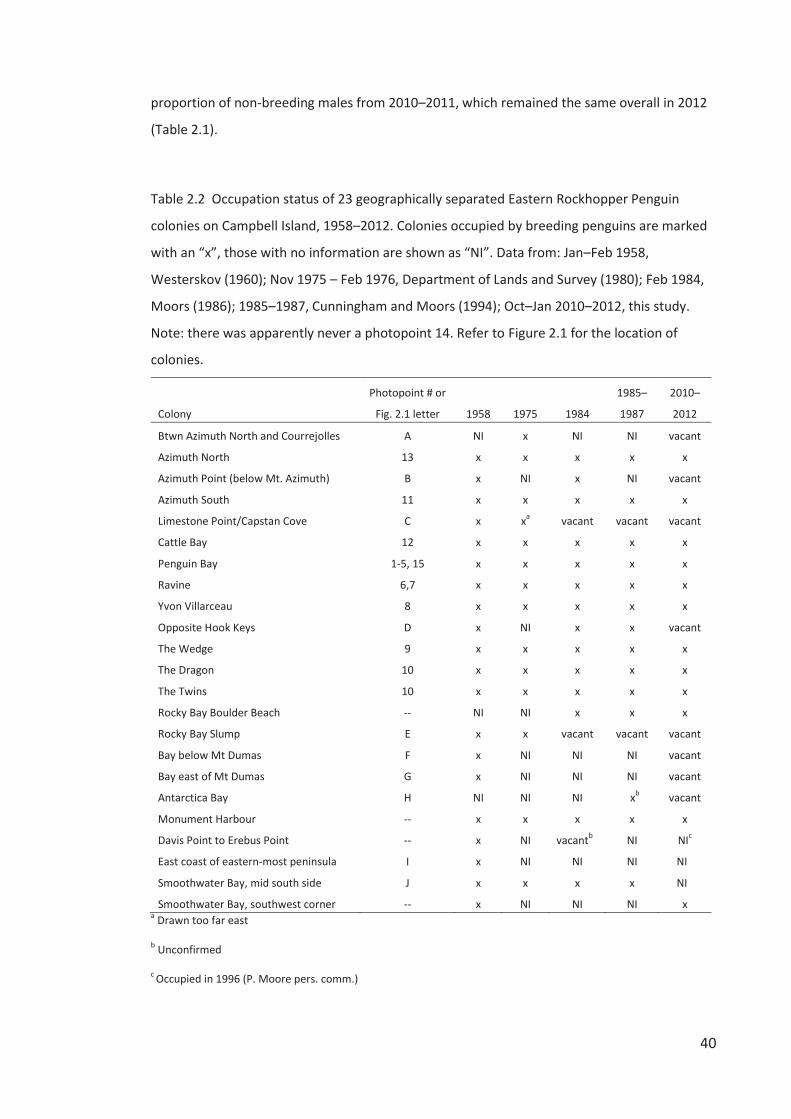
40
proportion of non-breeding males from 2010–2011, which remained the same overall in 2012
(Table 2.1).
Table 2.2 Occupation status of 23 geographically separated Eastern Rockhopper Penguin
colonies on Campbell Island, 1958–2012. Colonies occupied by breeding penguins are marked
with an “x”, those with no information are shown as “NI”. Data from: Jan–Feb 1958,
Westerskov (1960); Nov 1975 – Feb 1976, Department of Lands and Survey (1980); Feb 1984,
Moors (1986); 1985–1987, Cunningham and Moors (1994); Oct–Jan 2010–2012, this study.
Note: there was apparently never a photopoint 14. Refer to Figure 2.1 for the location of
colonies.
Colony
Photopoint # or
Fig. 2.1 letter 1958 1975 1984
1985–
1987
2010–
2012
Btwn Azimuth North and Courrejolles A NI x NI NI vacant
Azimuth North 13 x x x x x
Azimuth Point (below Mt. Azimuth) B x NI x NI vacant
Azimuth South 11 x x x x x
Limestone Point/Capstan Cove C x xa vacant vacant vacant
Cattle Bay 12 x x x x x
Penguin Bay 1-5, 15 x x x x x
Ravine 6,7 x x x x x
Yvon Villarceau 8 x x x x x
Opposite Hook Keys D x NI x x vacant
The Wedge 9 x x x x x
The Dragon 10 x x x x x
The Twins 10 x x x x x
Rocky Bay Boulder Beach -- NI NI x x x
Rocky Bay Slump E x x vacant vacant vacant
Bay below Mt Dumas F x NI NI NI vacant
Bay east of Mt Dumas G x NI NI NI vacant
Antarctica Bay H NI NI NI xb vacant
Monument Harbour -- x x x x x
Davis Point to Erebus Point -- x NI vacantb NI NIc
East coast of eastern-most peninsula I x NI NI NI NI
Smoothwater Bay, mid south side J x x x x NI
Smoothwater Bay, southwest corner -- x NI NI NI x a Drawn too far east
b Unconfirmed
c Occupied in 1996 (P. Moore pers. comm.)
41
For the photo-count method of population estimation we chose to apply the photo-
count correction factors from either the West or Foreshore sub-colonies in Penguin Bay (Table
2.1), or the average of these (1.40) to the photo-counts of the other colonies (Table 2.3) with
choice of factor based upon viewing angle and distance from the photopoint to the colony. The
larger correction factors for the East and Ravine sub-colonies were not used because most
birds were hidden by boulders in the exceptionally small East sub-colony and the visibility of
birds in the Ravine sub-colony was poor because this colony is unique in being above its
photopoint. The % difference between the mid-November count of nests and the late-
November count of birds decreased with increasing sub-colony size, from birds accounting for
68% of nests in the smallest sub-colony to birds (over-) representing 104% of the nests
counted in the largest sub-colony (Table 2.1). This trend occurred because of the greater nest
failure rate of smaller sub-colonies and subsequent departure of breeding birds, combined
with the greater retention rate of failed and non-breeders at larger colonies (K.W.M. unpub.
data). We concluded that late-November bird counts were a suitable proxy for the mid-
November number of breeding pairs because bird counts were only 2.0% lower than nest
counts overall (Table 2.1). All of the colonies for which photo-counts were conducted were of
similar or much larger size than the largest Penguin Bay sub-colony (Table 2.1 andTable 2.4), so
if these colonies retained a similar or greater proportion of failed breeders or non-breeders
our assumption that the late-November photo-counts of birds represent the original numbers
of nests may cause a positive bias in perceived nest numbers.
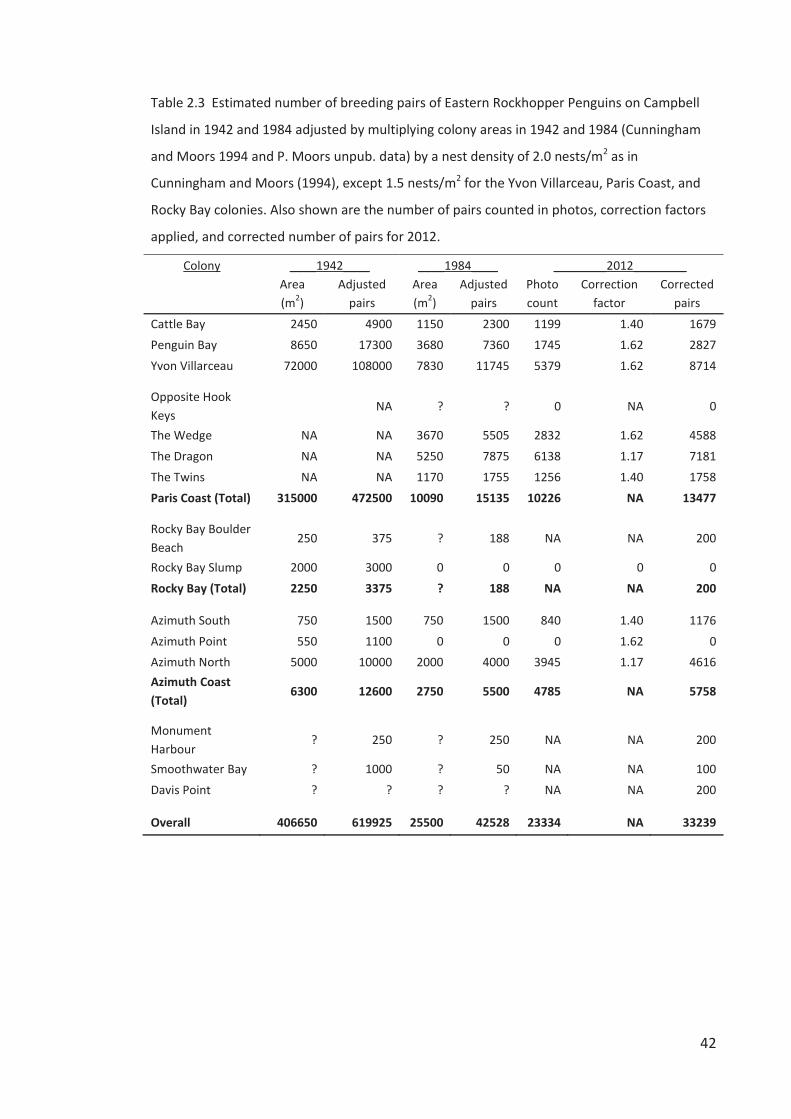
42
Table 2.3 Estimated number of breeding pairs of Eastern Rockhopper Penguins on Campbell
Island in 1942 and 1984 adjusted by multiplying colony areas in 1942 and 1984 (Cunningham
and Moors 1994 and P. Moors unpub. data) by a nest density of 2.0 nests/m2 as in
Cunningham and Moors (1994), except 1.5 nests/m2 for the Yvon Villarceau, Paris Coast, and
Rocky Bay colonies. Also shown are the number of pairs counted in photos, correction factors
applied, and corrected number of pairs for 2012.
Colony ____1942____ ____1984____ ________2012________
Area (m2)
Adjusted pairs
Area (m2)
Adjusted pairs
Photo count
Correction factor
Corrected pairs
Cattle Bay 2450 4900 1150 2300 1199 1.40 1679 Penguin Bay 8650 17300 3680 7360 1745 1.62 2827 Yvon Villarceau 72000 108000 7830 11745 5379 1.62 8714
Opposite Hook Keys
NA ? ? 0 NA 0
The Wedge NA NA 3670 5505 2832 1.62 4588 The Dragon NA NA 5250 7875 6138 1.17 7181 The Twins NA NA 1170 1755 1256 1.40 1758 Paris Coast (Total) 315000 472500 10090 15135 10226 NA 13477
Rocky Bay Boulder Beach
250 375 ? 188 NA NA 200
Rocky Bay Slump 2000 3000 0 0 0 0 0 Rocky Bay (Total) 2250 3375 ? 188 NA NA 200
Azimuth South 750 1500 750 1500 840 1.40 1176 Azimuth Point 550 1100 0 0 0 1.62 0 Azimuth North 5000 10000 2000 4000 3945 1.17 4616 Azimuth Coast (Total)
6300 12600 2750 5500 4785 NA 5758
Monument Harbour
? 250 ? 250 NA NA 200
Smoothwater Bay ? 1000 ? 50 NA NA 100 Davis Point ? ? ? ? NA NA 200
Overall 406650 619925 25500 42528 23334 NA 33239
43
Corrected 2012 photo-counts indicate that the number of breeding pairs of Rockhopper
Penguins on Campbell Island may have declined by as much as 35.2% from 1984–2012, if one
considers 1984 population estimates unadjusted for lower nest densities compared to
corrected photo-counts (Table 2.4). All colonies except for Azimuth North and Smoothwater
Bay were estimated to have declined by > 20% from 1984 (unadjusted pairs) to 2012 (Table
2.4). Our adjustment for lower nest densities from 2.0 to 1.5 nests/m2 for the Yvon Villarceau,
Paris Coast, and Rocky Bay colonies resulted in decreases in total population estimates from
those of Cunningham and Moors (1994): from 814,550 to 619,925 (-23.9%) breeding pairs in
1942, and from 51,300 to 42,528 (-17.1%) breeding pairs in 1984. Using 1942 and 1984
population estimates adjusted for a lower nest density and the 2012 corrected photo-count
estimate resulted in estimated declines from 1984–2012 of 21.8% (42,528 to 33,239 breeding
pairs) and an overall decline from 1942–2012 of 94.6% (619,925 to 33,239 breeding pairs). In
contrast, the change in relative area method suggested that colony area was similar between
1984 and 2012, declining just 0.7% (Table 2.4). However, within this period the overall change
in relative area was -22.6% from 1984–1996, followed by an increase of 28.3% from 1996–
2012. The relative area method produced a similar estimate of change for Penguin Bay and The
Wedge compared to the photo-count vs. adjusted nests method, but a lesser decline for Yvon
Villarceau and Azimuth South, greater for The Dragon, and exaggerated positive changes for
Cattle Bay, The Twins, and Azimuth North. The intermediate estimate of an overall decline of
21.8% from 1984–2012 from the photo-count method corresponds to an annual rate of
change (λ) of 0.991, a much slower rate of decline than from 1942 to 1984 (λ = 0.940; Table
2.4).
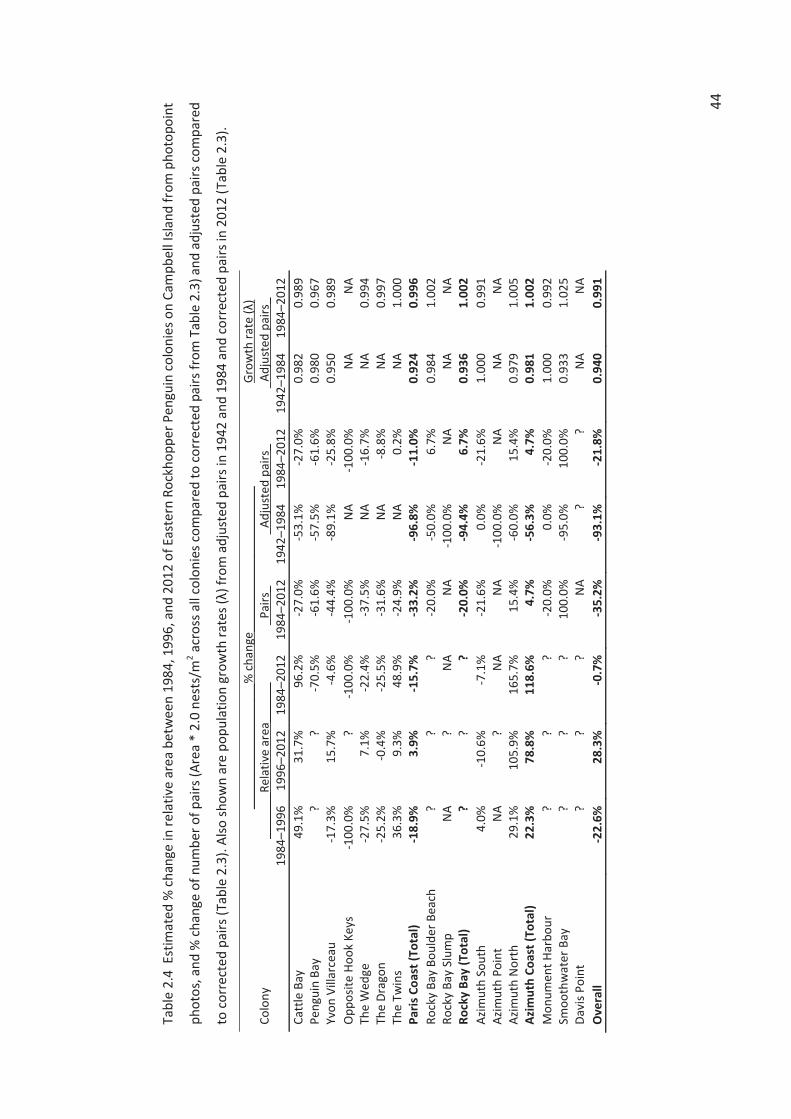
44
Tabl
e 2.
4 E
stim
ated
% c
hang
e in
rela
tive
area
bet
wee
n 19
84, 1
996,
and
201
2 of
Eas
tern
Roc
khop
per P
engu
in c
olon
ies o
n Ca
mpb
ell I
sland
from
pho
topo
int
phot
os, a
nd %
cha
nge
of n
umbe
r of p
airs
(Are
a *
2.0
nest
s/m
2 acr
oss a
ll co
loni
es c
ompa
red
to c
orre
cted
pai
rs fr
om T
able
2.3
) and
adj
uste
d pa
irs c
ompa
red
to c
orre
cted
pai
rs (T
able
2.3
). Al
so sh
own
are
popu
latio
n gr
owth
rate
s (λ)
from
adj
uste
d pa
irs in
194
2 an
d 19
84 a
nd c
orre
cted
pai
rs in
201
2 (T
able
2.3
).
____
____
____
____
___%
cha
nge_
____
____
____
____
____
_
Grow
th ra
te (λ
) Co
lony
__
____
_Rel
ativ
e ar
ea__
____
_Pai
rs_
_
Adju
sted
pai
rs_
_Ad
just
ed p
airs
_
1984
–199
6 19
96–2
012
1984
–201
2 19
84–2
012
1942
–198
4 19
84–2
012
1942
–198
4 19
84–2
012
Catt
le B
ay
49.1
%
31.7
%
96.2
%
-27.
0%
-53.
1%
-27.
0%
0.98
2 0.
989
Peng
uin
Bay
? ?
-70.
5%
-61.
6%
-57.
5%
-61.
6%
0.98
0 0.
967
Yvon
Vill
arce
au
-17.
3%
15.7
%
-4.6
%
-44.
4%
-89.
1%
-25.
8%
0.95
0 0.
989
Opp
osite
Hoo
k Ke
ys
-100
.0%
?
-100
.0%
-1
00.0
%
NA
-100
.0%
N
A N
A Th
e W
edge
-2
7.5%
7.
1%
-22.
4%
-37.
5%
NA
-16.
7%
NA
0.99
4 Th
e Dr
agon
-2
5.2%
-0
.4%
-2
5.5%
-3
1.6%
N
A -8
.8%
N
A 0.
997
The
Twin
s 36
.3%
9.
3%
48.9
%
-24.
9%
NA
0.2%
N
A 1.
000
Paris
Coa
st (T
otal
) -1
8.9%
3.
9%
-15.
7%
-33.
2%
-96.
8%
-11.
0%
0.92
4 0.
996
Rock
y Ba
y Bo
ulde
r Bea
ch
? ?
? -2
0.0%
-5
0.0%
6.
7%
0.98
4 1.
002
Rock
y Ba
y Sl
ump
NA
? N
A N
A -1
00.0
%
NA
NA
NA
Rock
y Ba
y (T
otal
) ?
? ?
-20.
0%
-94.
4%
6.7%
0.
936
1.00
2 Az
imut
h So
uth
4.0%
-1
0.6%
-7
.1%
-2
1.6%
0.
0%
-21.
6%
1.00
0 0.
991
Azim
uth
Poin
t N
A ?
NA
NA
-100
.0%
N
A N
A N
A Az
imut
h N
orth
29
.1%
10
5.9%
16
5.7%
15
.4%
-6
0.0%
15
.4%
0.
979
1.00
5 Az
imut
h Co
ast (
Tota
l) 22
.3%
78
.8%
11
8.6%
4.
7%
-56.
3%
4.7%
0.
981
1.00
2 M
onum
ent H
arbo
ur
? ?
? -2
0.0%
0.
0%
-20.
0%
1.00
0 0.
992
Smoo
thw
ater
Bay
?
? ?
100.
0%
-95.
0%
100.
0%
0.93
3 1.
025
Davi
s Poi
nt
? ?
? N
A ?
? N
A N
A O
vera
ll -2
2.6%
28
.3%
-0
.7%
-3
5.2%
-9
3.1%
-2
1.8%
0.
940
0.99
1
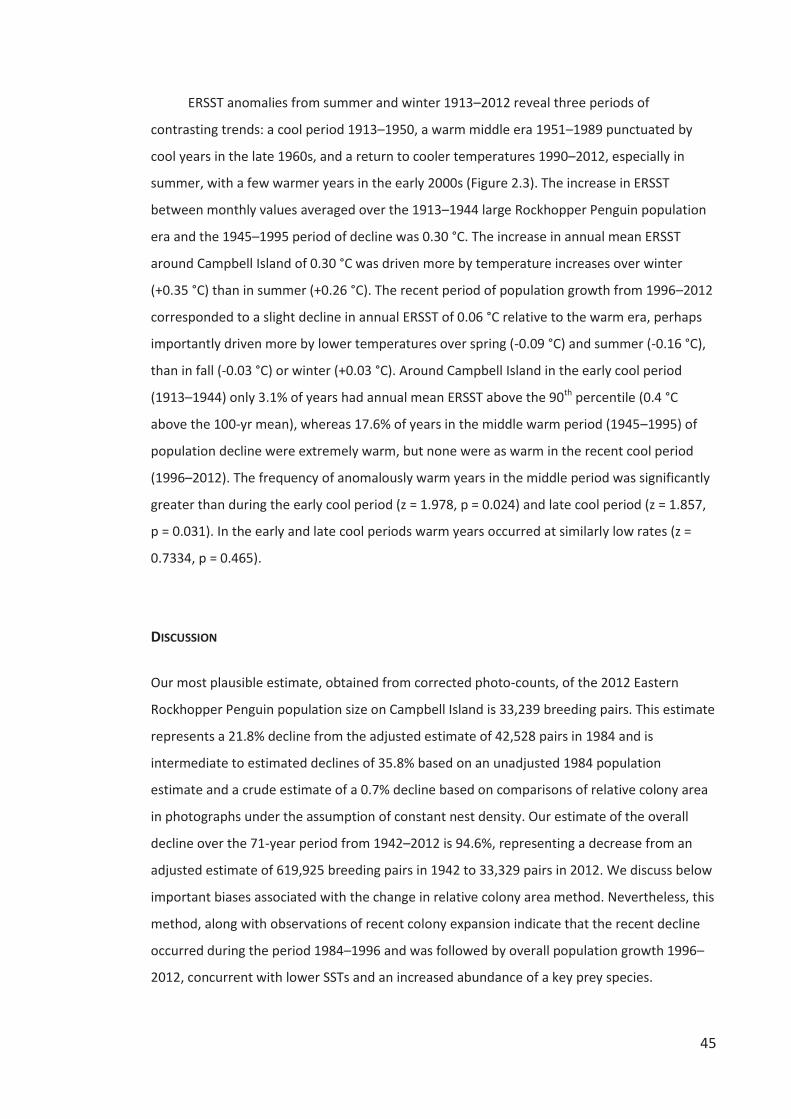
45
ERSST anomalies from summer and winter 1913–2012 reveal three periods of
contrasting trends: a cool period 1913–1950, a warm middle era 1951–1989 punctuated by
cool years in the late 1960s, and a return to cooler temperatures 1990–2012, especially in
summer, with a few warmer years in the early 2000s (Figure 2.3). The increase in ERSST
between monthly values averaged over the 1913–1944 large Rockhopper Penguin population
era and the 1945–1995 period of decline was 0.30 °C. The increase in annual mean ERSST
around Campbell Island of 0.30 °C was driven more by temperature increases over winter
(+0.35 °C) than in summer (+0.26 °C). The recent period of population growth from 1996–2012
corresponded to a slight decline in annual ERSST of 0.06 °C relative to the warm era, perhaps
importantly driven more by lower temperatures over spring (-0.09 °C) and summer (-0.16 °C),
than in fall (-0.03 °C) or winter (+0.03 °C). Around Campbell Island in the early cool period
(1913–1944) only 3.1% of years had annual mean ERSST above the 90th percentile (0.4 °C
above the 100-yr mean), whereas 17.6% of years in the middle warm period (1945–1995) of
population decline were extremely warm, but none were as warm in the recent cool period
(1996–2012). The frequency of anomalously warm years in the middle period was significantly
greater than during the early cool period (z = 1.978, p = 0.024) and late cool period (z = 1.857,
p = 0.031). In the early and late cool periods warm years occurred at similarly low rates (z =
0.7334, p = 0.465).
DISCUSSION
Our most plausible estimate, obtained from corrected photo-counts, of the 2012 Eastern
Rockhopper Penguin population size on Campbell Island is 33,239 breeding pairs. This estimate
represents a 21.8% decline from the adjusted estimate of 42,528 pairs in 1984 and is
intermediate to estimated declines of 35.8% based on an unadjusted 1984 population
estimate and a crude estimate of a 0.7% decline based on comparisons of relative colony area
in photographs under the assumption of constant nest density. Our estimate of the overall
decline over the 71-year period from 1942–2012 is 94.6%, representing a decrease from an
adjusted estimate of 619,925 breeding pairs in 1942 to 33,329 pairs in 2012. We discuss below
important biases associated with the change in relative colony area method. Nevertheless, this
method, along with observations of recent colony expansion indicate that the recent decline
occurred during the period 1984–1996 and was followed by overall population growth 1996–
2012, concurrent with lower SSTs and an increased abundance of a key prey species.
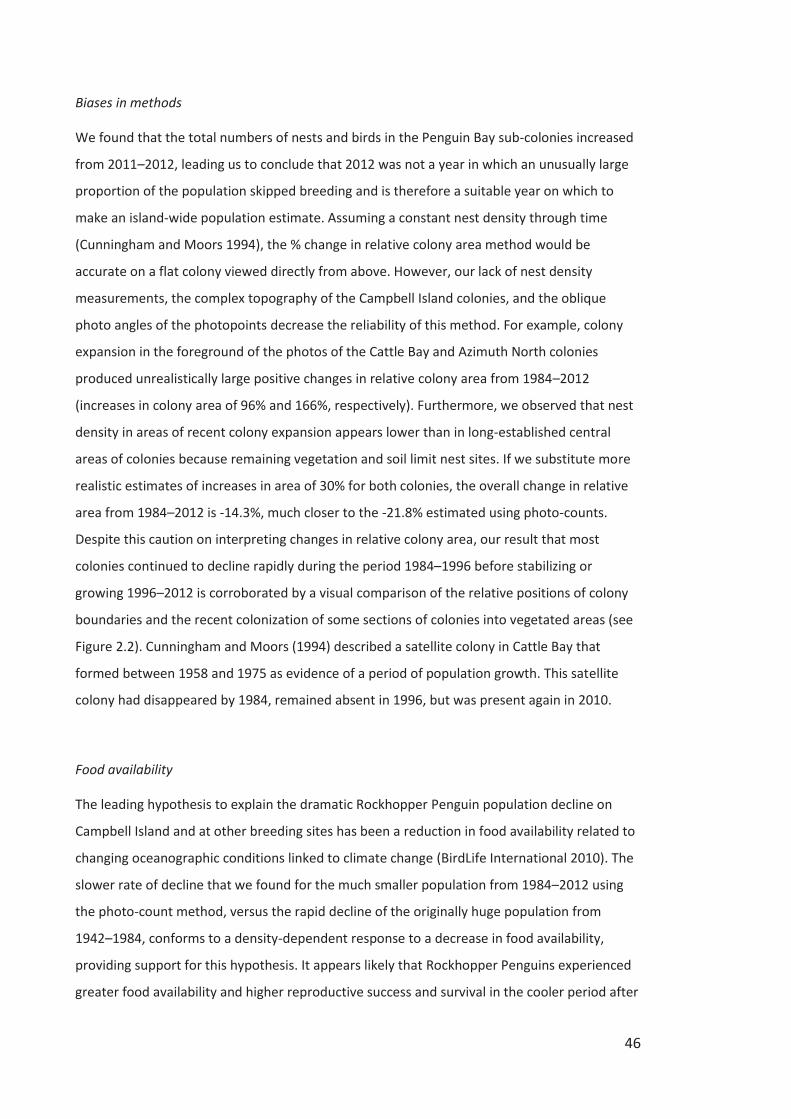
46
Biases in methods
We found that the total numbers of nests and birds in the Penguin Bay sub-colonies increased
from 2011–2012, leading us to conclude that 2012 was not a year in which an unusually large
proportion of the population skipped breeding and is therefore a suitable year on which to
make an island-wide population estimate. Assuming a constant nest density through time
(Cunningham and Moors 1994), the % change in relative colony area method would be
accurate on a flat colony viewed directly from above. However, our lack of nest density
measurements, the complex topography of the Campbell Island colonies, and the oblique
photo angles of the photopoints decrease the reliability of this method. For example, colony
expansion in the foreground of the photos of the Cattle Bay and Azimuth North colonies
produced unrealistically large positive changes in relative colony area from 1984–2012
(increases in colony area of 96% and 166%, respectively). Furthermore, we observed that nest
density in areas of recent colony expansion appears lower than in long-established central
areas of colonies because remaining vegetation and soil limit nest sites. If we substitute more
realistic estimates of increases in area of 30% for both colonies, the overall change in relative
area from 1984–2012 is -14.3%, much closer to the -21.8% estimated using photo-counts.
Despite this caution on interpreting changes in relative colony area, our result that most
colonies continued to decline rapidly during the period 1984–1996 before stabilizing or
growing 1996–2012 is corroborated by a visual comparison of the relative positions of colony
boundaries and the recent colonization of some sections of colonies into vegetated areas (see
Figure 2.2). Cunningham and Moors (1994) described a satellite colony in Cattle Bay that
formed between 1958 and 1975 as evidence of a period of population growth. This satellite
colony had disappeared by 1984, remained absent in 1996, but was present again in 2010.
Food availability
The leading hypothesis to explain the dramatic Rockhopper Penguin population decline on
Campbell Island and at other breeding sites has been a reduction in food availability related to
changing oceanographic conditions linked to climate change (BirdLife International 2010). The
slower rate of decline that we found for the much smaller population from 1984–2012 using
the photo-count method, versus the rapid decline of the originally huge population from
1942–1984, conforms to a density-dependent response to a decrease in food availability,
providing support for this hypothesis. It appears likely that Rockhopper Penguins experienced
greater food availability and higher reproductive success and survival in the cooler period after
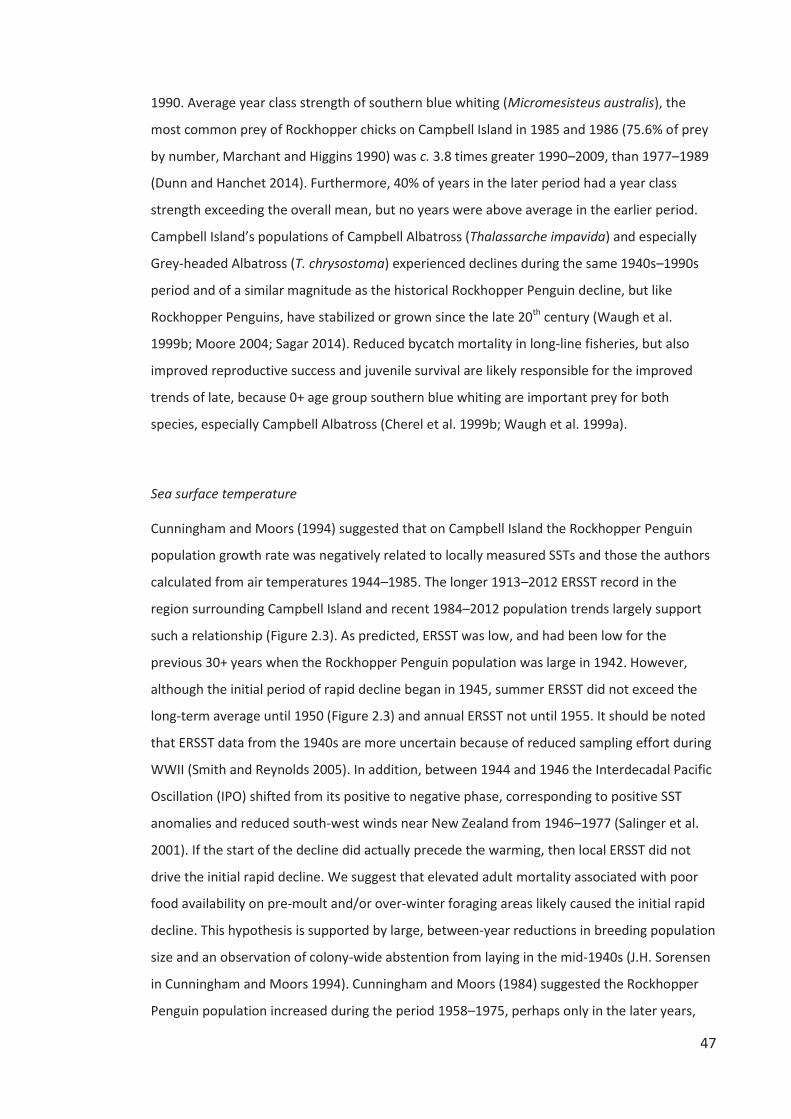
47
1990. Average year class strength of southern blue whiting (Micromesisteus australis), the
most common prey of Rockhopper chicks on Campbell Island in 1985 and 1986 (75.6% of prey
by number, Marchant and Higgins 1990) was c. 3.8 times greater 1990–2009, than 1977–1989
(Dunn and Hanchet 2014). Furthermore, 40% of years in the later period had a year class
strength exceeding the overall mean, but no years were above average in the earlier period.
Campbell Island’s populations of Campbell Albatross (Thalassarche impavida) and especially
Grey-headed Albatross (T. chrysostoma) experienced declines during the same 1940s–1990s
period and of a similar magnitude as the historical Rockhopper Penguin decline, but like
Rockhopper Penguins, have stabilized or grown since the late 20th century (Waugh et al.
1999b; Moore 2004; Sagar 2014). Reduced bycatch mortality in long-line fisheries, but also
improved reproductive success and juvenile survival are likely responsible for the improved
trends of late, because 0+ age group southern blue whiting are important prey for both
species, especially Campbell Albatross (Cherel et al. 1999b; Waugh et al. 1999a).
Sea surface temperature
Cunningham and Moors (1994) suggested that on Campbell Island the Rockhopper Penguin
population growth rate was negatively related to locally measured SSTs and those the authors
calculated from air temperatures 1944–1985. The longer 1913–2012 ERSST record in the
region surrounding Campbell Island and recent 1984–2012 population trends largely support
such a relationship (Figure 2.3). As predicted, ERSST was low, and had been low for the
previous 30+ years when the Rockhopper Penguin population was large in 1942. However,
although the initial period of rapid decline began in 1945, summer ERSST did not exceed the
long-term average until 1950 (Figure 2.3) and annual ERSST not until 1955. It should be noted
that ERSST data from the 1940s are more uncertain because of reduced sampling effort during
WWII (Smith and Reynolds 2005). In addition, between 1944 and 1946 the Interdecadal Pacific
Oscillation (IPO) shifted from its positive to negative phase, corresponding to positive SST
anomalies and reduced south-west winds near New Zealand from 1946–1977 (Salinger et al.
2001). If the start of the decline did actually precede the warming, then local ERSST did not
drive the initial rapid decline. We suggest that elevated adult mortality associated with poor
food availability on pre-moult and/or over-winter foraging areas likely caused the initial rapid
decline. This hypothesis is supported by large, between-year reductions in breeding population
size and an observation of colony-wide abstention from laying in the mid-1940s (J.H. Sorensen
in Cunningham and Moors 1994). Cunningham and Moors (1984) suggested the Rockhopper
Penguin population increased during the period 1958–1975, perhaps only in the later years,
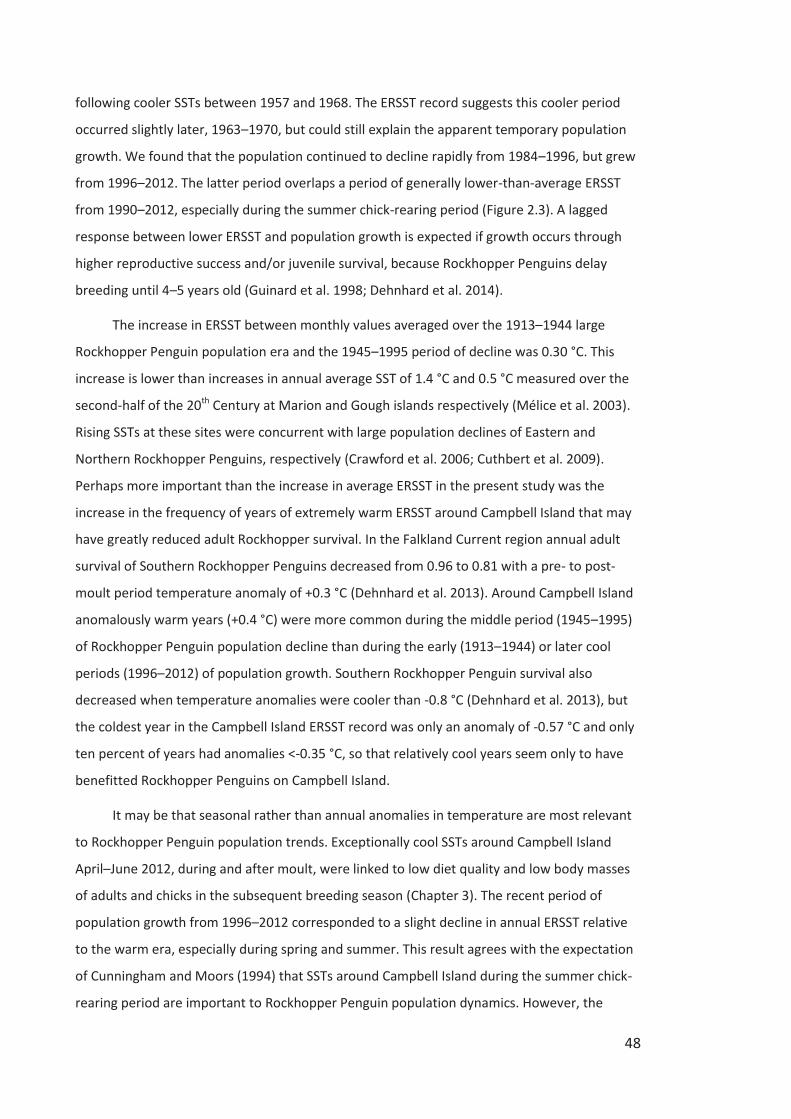
48
following cooler SSTs between 1957 and 1968. The ERSST record suggests this cooler period
occurred slightly later, 1963–1970, but could still explain the apparent temporary population
growth. We found that the population continued to decline rapidly from 1984–1996, but grew
from 1996–2012. The latter period overlaps a period of generally lower-than-average ERSST
from 1990–2012, especially during the summer chick-rearing period (Figure 2.3). A lagged
response between lower ERSST and population growth is expected if growth occurs through
higher reproductive success and/or juvenile survival, because Rockhopper Penguins delay
breeding until 4–5 years old (Guinard et al. 1998; Dehnhard et al. 2014).
The increase in ERSST between monthly values averaged over the 1913–1944 large
Rockhopper Penguin population era and the 1945–1995 period of decline was 0.30 °C. This
increase is lower than increases in annual average SST of 1.4 °C and 0.5 °C measured over the
second-half of the 20th Century at Marion and Gough islands respectively (Mélice et al. 2003).
Rising SSTs at these sites were concurrent with large population declines of Eastern and
Northern Rockhopper Penguins, respectively (Crawford et al. 2006; Cuthbert et al. 2009).
Perhaps more important than the increase in average ERSST in the present study was the
increase in the frequency of years of extremely warm ERSST around Campbell Island that may
have greatly reduced adult Rockhopper survival. In the Falkland Current region annual adult
survival of Southern Rockhopper Penguins decreased from 0.96 to 0.81 with a pre- to post-
moult period temperature anomaly of +0.3 °C (Dehnhard et al. 2013). Around Campbell Island
anomalously warm years (+0.4 °C) were more common during the middle period (1945–1995)
of Rockhopper Penguin population decline than during the early (1913–1944) or later cool
periods (1996–2012) of population growth. Southern Rockhopper Penguin survival also
decreased when temperature anomalies were cooler than -0.8 °C (Dehnhard et al. 2013), but
the coldest year in the Campbell Island ERSST record was only an anomaly of -0.57 °C and only
ten percent of years had anomalies <-0.35 °C, so that relatively cool years seem only to have
benefitted Rockhopper Penguins on Campbell Island.
It may be that seasonal rather than annual anomalies in temperature are most relevant
to Rockhopper Penguin population trends. Exceptionally cool SSTs around Campbell Island
April–June 2012, during and after moult, were linked to low diet quality and low body masses
of adults and chicks in the subsequent breeding season (Chapter 3). The recent period of
population growth from 1996–2012 corresponded to a slight decline in annual ERSST relative
to the warm era, especially during spring and summer. This result agrees with the expectation
of Cunningham and Moors (1994) that SSTs around Campbell Island during the summer chick-
rearing period are important to Rockhopper Penguin population dynamics. However, the
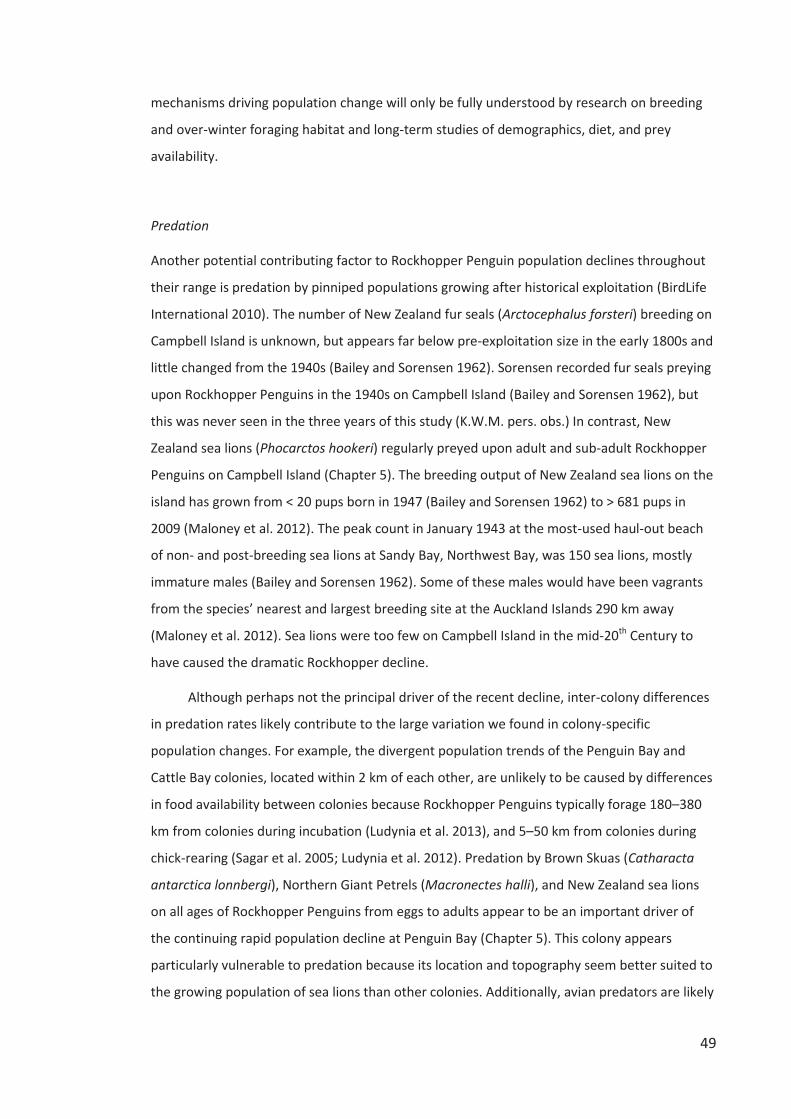
49
mechanisms driving population change will only be fully understood by research on breeding
and over-winter foraging habitat and long-term studies of demographics, diet, and prey
availability.
Predation
Another potential contributing factor to Rockhopper Penguin population declines throughout
their range is predation by pinniped populations growing after historical exploitation (BirdLife
International 2010). The number of New Zealand fur seals (Arctocephalus forsteri) breeding on
Campbell Island is unknown, but appears far below pre-exploitation size in the early 1800s and
little changed from the 1940s (Bailey and Sorensen 1962). Sorensen recorded fur seals preying
upon Rockhopper Penguins in the 1940s on Campbell Island (Bailey and Sorensen 1962), but
this was never seen in the three years of this study (K.W.M. pers. obs.) In contrast, New
Zealand sea lions (Phocarctos hookeri) regularly preyed upon adult and sub-adult Rockhopper
Penguins on Campbell Island (Chapter 5). The breeding output of New Zealand sea lions on the
island has grown from < 20 pups born in 1947 (Bailey and Sorensen 1962) to > 681 pups in
2009 (Maloney et al. 2012). The peak count in January 1943 at the most-used haul-out beach
of non- and post-breeding sea lions at Sandy Bay, Northwest Bay, was 150 sea lions, mostly
immature males (Bailey and Sorensen 1962). Some of these males would have been vagrants
from the species’ nearest and largest breeding site at the Auckland Islands 290 km away
(Maloney et al. 2012). Sea lions were too few on Campbell Island in the mid-20th Century to
have caused the dramatic Rockhopper decline.
Although perhaps not the principal driver of the recent decline, inter-colony differences
in predation rates likely contribute to the large variation we found in colony-specific
population changes. For example, the divergent population trends of the Penguin Bay and
Cattle Bay colonies, located within 2 km of each other, are unlikely to be caused by differences
in food availability between colonies because Rockhopper Penguins typically forage 180–380
km from colonies during incubation (Ludynia et al. 2013), and 5–50 km from colonies during
chick-rearing (Sagar et al. 2005; Ludynia et al. 2012). Predation by Brown Skuas (Catharacta
antarctica lonnbergi), Northern Giant Petrels (Macronectes halli), and New Zealand sea lions
on all ages of Rockhopper Penguins from eggs to adults appear to be an important driver of
the continuing rapid population decline at Penguin Bay (Chapter 5). This colony appears
particularly vulnerable to predation because its location and topography seem better suited to
the growing population of sea lions than other colonies. Additionally, avian predators are likely
50
more successful at Penguin Bay because its single large colony fragmented into four sub-
colonies as it declined whereas all other colonies split into two or remained singular (Jackson
et al. 2005). Inter-colony differences in topography and orientation may also influence the
magnitude of negative effects on breeding success from exposure to wind, sea spray, rain, and
mud, and safety from accidental injury and sea lion predation for penguins transiting through
boulders in heavy swells at the shoreline (Demongin et al. 2010, Crofts et al. 2011, K.W.M.
pers. obs.).
Two conservation management actions undertaken by New Zealand’s Department of
Conservation (DOC) may have contributed to the recent positive trend. In 1989 the last of the
feral sheep introduced in 1895 were shot (Williams and Robertson 1996), and sheep may have
disrupted Rockhopper colonies and reduced reproductive success. However, Moors (1986)
suggested disturbance by sheep was not a major cause of the Rockhopper Penguin decline, as
all colonies had declined regardless of accessibility to sheep. In 2001 Norway rats (Rattus
norvegicus) were eradicated from the entire island. Rats were apparently unable to eat intact
Rockhopper eggs (Taylor 1986), but hoarded large numbers of small chicks. It is unknown
whether rats scavenged or killed these chicks (Cunningham and Moors 1994), but rats were
known to attack Yellow-eyed Penguin (Megadyptes antipodes) chicks on Campbell Island
(Amey and Moore 1995).
Recommendations for future monitoring
We recommend that the Rockhopper Penguin photopoint series be repeated at 5-yr intervals.
Ideally the photopoints would be repeated in two consecutive years at each 5-yr interval in an
attempt to account for the possibility of mass abstention of breeding. The magnitude of
population change likely in a shorter time period for this species of delayed reproduction and
high adult survival (Dehnhard et al. 2013) is presumably too small to be detected given our
methods. Climatic oscillations such as the El Niño Southern Oscillation that may affect the
population also occur on a similar time scale (Timmermann et al. 1999). Every effort should be
made to take the full set of photos during the same late-November window during female-only
incubation at the exact GPS positions used in this study (Appendix 2.1). Ideally, multiple over-
lapping high-resolution images will be taken at sufficiently high focal lengths to allow for
photo-counting of individual penguins. Although photo-counting is more time-consuming than
the relative colony area method, we had greater confidence in photo-counting because of the
biases inherent in the latter method discussed above. Additionally, the complementary and
51
more vertical photo angles used for photo-counting in this study should be taken at the same
time whenever possible (Appendix 2.1). Full census counts of birds and nests in Penguin Bay
should be made in mid-November whenever possible and repeated in late-November during
photopoint survey years to establish photo-count correction factors. Our method would be
improved by establishing photo-count correction factors for additional colonies or sections of
colonies. Aerial photos, whether taken by helicopter (Trathan 2004), remote-controlled aircraft
(Watts et al. 2010), or kite (Fraser et al. 1999) would greatly improve count accuracy, and
along with a high-resolution digital elevation model (DEM) would allow for accurate mapping
of colony area. Advances in satellite technology may also prove an efficient and economic tool
for monitoring sub-Antarctic penguins (Lynch et al. 2012b).
Global perspective
Range-wide, the outlook for the Southern sub-species of Rockhopper Penguin is cautiously
optimistic. The world’s largest population at the Falkland Islands has increased since 1995
during a period of cool SSTs and high reproductive success and adult survival, including a 51%
population increase from 2005–2010 (Baylis et al. 2013; Dehnhard et al. 2013). Increases of
15% occurred at the largest Chilean populations at Isla Noir from 1980–2005 (Oehler et al.
2008) and Isla Diego Ramirez from 1981–2002 (Kirkwood et al. 2007). The Eastern sub-species
considered here is of greater concern with Indian Ocean populations in decline or of uncertain
status. At Marion Island the population declined by about 70% from 1994–2008, whereas the
Prince Edward Island population declined 15% from 2001–2008 (Crawford et al. 2009). Recent
trends at the important Kerguelen and Crozet islands are unknown. In the New Zealand region
the small breeding population of Eastern Rockhopper Penguins on the Antipodes Islands 740
km north-east of Campbell Island continued a long-term decline in recent years, decreasing by
15% 1995–2011 to just c. 2,900 pairs (from values in Hiscock and Chilvers 2014). The similarly
small Rockhopper Penguin population on the Auckland Islands 290 km northwest of Campbell
Island was estimated to have declined by 28–64% from 1972–1989 (Cooper 1992). The 2007
estimate on Macquarie Island of 32,000 to 43,000 pairs is much lower than past estimates
(BirdLife International 2010). The population total of the Southern subspecies (c. 900,000) now
likely outnumbers the Eastern (c. 400,000) by 2.25 to one (Baylis et al. 2013; Pütz et al. 2013).
The recent cooling of ERSST around Campbell Island was concurrent with a ‘warming
hiatus’ in global surface temperatures since 1998, related to an increase in sub-tropical Pacific
subsurface heat uptake and increased stratospheric loadings of reflective volcanic particulates
52
(England et al. 2014; Santer et al. 2014). These transient cooling influences are likely to be
overwhelmed within the next decade by warming caused by continually increasing
concentrations of atmospheric greenhouse gases (England et al. 2014). This suggests that the
brief respite from ocean warming that appears to have benefited Rockhopper Penguins on
Campbell Island in recent years will soon end, and their population decline may resume.
ACKNOWLEDGEMENTS
Our thanks to D. Armstrong and the three anonymous reviewers of this manuscript for
constructive comments. This work was supported by the New Zealand Ministry of Business,
Innovation, and Employment (contract C01X0905 to the National Institute for Water and
Atmospheric Research). K.W.M. is grateful to Massey University, the Natural Sciences and
Engineering Research Council of Canada, and Education New Zealand for financial support.
Thank you to P. Moors, D. Cunningham, P. Moore, G. Taylor, J. Roberts, and S. Jamieson for
photographs, unpublished data, and helpful discussions. We appreciate L. Chilvers for
providing the Campbell Island base map and J. Roberts the ERSST data. Thank you to the
Department of Conservation, Southland Conservancy for supporting our research on Campbell
Island, and to H. Haazen and the crew of RV ‘Tiama’ for safe transport. Our methods were
approved by the Massey University Animal Ethics Committee, Protocol No. 10/90. This
research would not have been possible without the penguin-counting efforts and cliff-edge
anchorage provided almost willingly from N. Morrison, R. Buchheit, and R. Dunn.
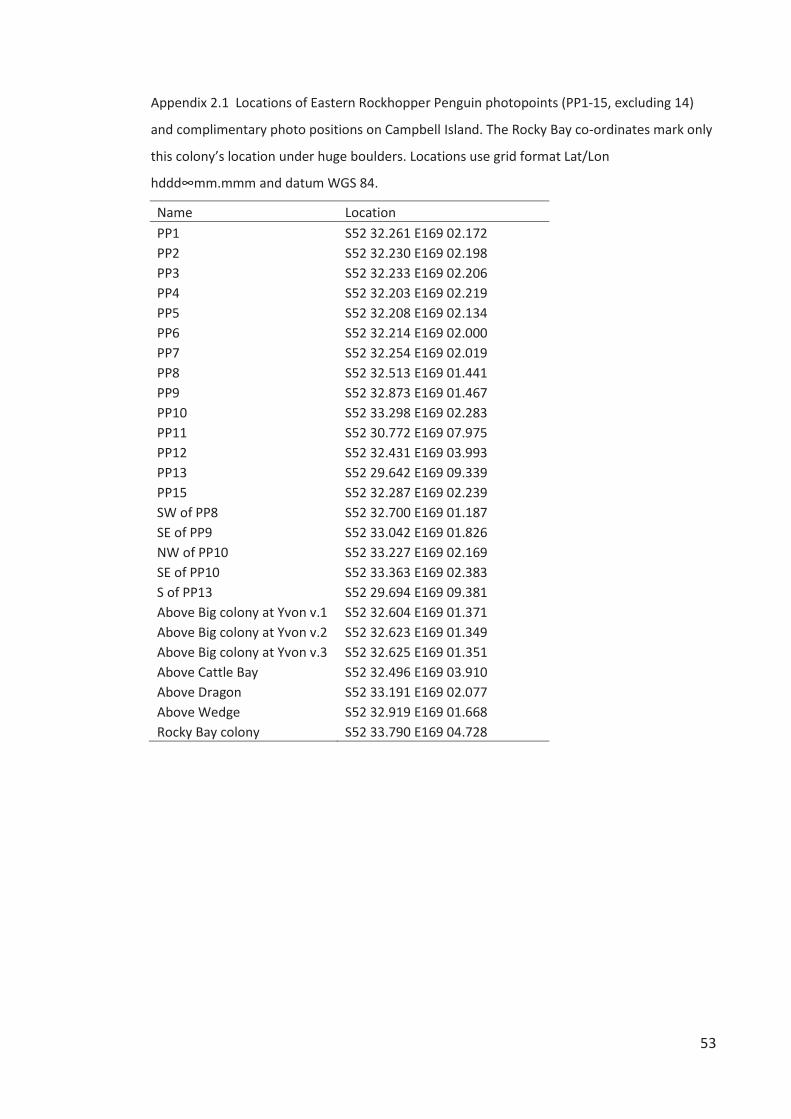
53
Appendix 2.1 Locations of Eastern Rockhopper Penguin photopoints (PP1-15, excluding 14)
and complimentary photo positions on Campbell Island. The Rocky Bay co-ordinates mark only
this colony’s location under huge boulders. Locations use grid format Lat/Lon
hddd∞mm.mmm and datum WGS 84.
Name Location PP1 S52 32.261 E169 02.172 PP2 S52 32.230 E169 02.198 PP3 S52 32.233 E169 02.206 PP4 S52 32.203 E169 02.219 PP5 S52 32.208 E169 02.134 PP6 S52 32.214 E169 02.000 PP7 S52 32.254 E169 02.019 PP8 S52 32.513 E169 01.441 PP9 S52 32.873 E169 01.467 PP10 S52 33.298 E169 02.283 PP11 S52 30.772 E169 07.975 PP12 S52 32.431 E169 03.993 PP13 S52 29.642 E169 09.339 PP15 S52 32.287 E169 02.239 SW of PP8 S52 32.700 E169 01.187 SE of PP9 S52 33.042 E169 01.826 NW of PP10 S52 33.227 E169 02.169 SE of PP10 S52 33.363 E169 02.383 S of PP13 S52 29.694 E169 09.381 Above Big colony at Yvon v.1 S52 32.604 E169 01.371 Above Big colony at Yvon v.2 S52 32.623 E169 01.349 Above Big colony at Yvon v.3 S52 32.625 E169 01.351 Above Cattle Bay S52 32.496 E169 03.910 Above Dragon S52 33.191 E169 02.077 Above Wedge S52 32.919 E169 01.668 Rocky Bay colony S52 33.790 E169 04.728
54
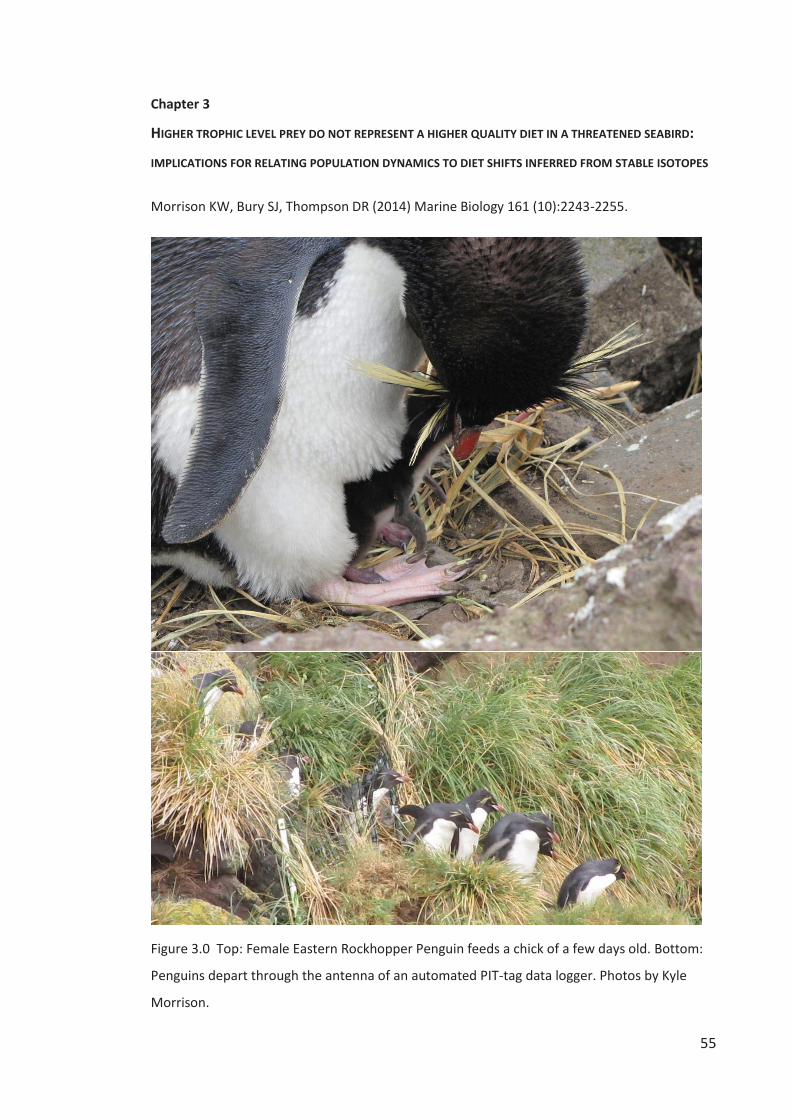
55
Chapter 3
HIGHER TROPHIC LEVEL PREY DO NOT REPRESENT A HIGHER QUALITY DIET IN A THREATENED SEABIRD:
IMPLICATIONS FOR RELATING POPULATION DYNAMICS TO DIET SHIFTS INFERRED FROM STABLE ISOTOPES
Morrison KW, Bury SJ, Thompson DR (2014) Marine Biology 161 (10):2243-2255.
Figure 3.0 Top: Female Eastern Rockhopper Penguin feeds a chick of a few days old. Bottom:
Penguins depart through the antenna of an automated PIT-tag data logger. Photos by Kyle
Morrison.
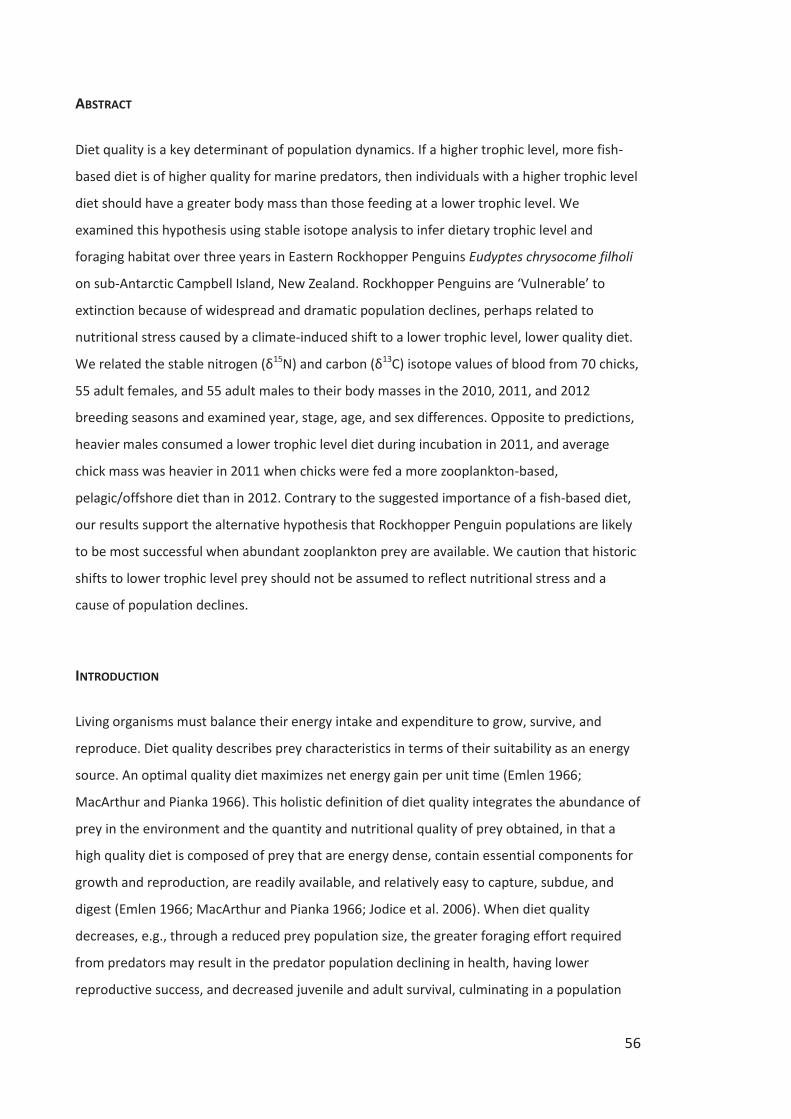
56
ABSTRACT
Diet quality is a key determinant of population dynamics. If a higher trophic level, more fish-
based diet is of higher quality for marine predators, then individuals with a higher trophic level
diet should have a greater body mass than those feeding at a lower trophic level. We
examined this hypothesis using stable isotope analysis to infer dietary trophic level and
foraging habitat over three years in Eastern Rockhopper Penguins Eudyptes chrysocome filholi
on sub-Antarctic Campbell Island, New Zealand. Rockhopper Penguins are ‘Vulnerable’ to
extinction because of widespread and dramatic population declines, perhaps related to
nutritional stress caused by a climate-induced shift to a lower trophic level, lower quality diet.
We related the stable nitrogen (δ15N) and carbon (δ13C) isotope values of blood from 70 chicks,
55 adult females, and 55 adult males to their body masses in the 2010, 2011, and 2012
breeding seasons and examined year, stage, age, and sex differences. Opposite to predictions,
heavier males consumed a lower trophic level diet during incubation in 2011, and average
chick mass was heavier in 2011 when chicks were fed a more zooplankton-based,
pelagic/offshore diet than in 2012. Contrary to the suggested importance of a fish-based diet,
our results support the alternative hypothesis that Rockhopper Penguin populations are likely
to be most successful when abundant zooplankton prey are available. We caution that historic
shifts to lower trophic level prey should not be assumed to reflect nutritional stress and a
cause of population declines.
INTRODUCTION
Living organisms must balance their energy intake and expenditure to grow, survive, and
reproduce. Diet quality describes prey characteristics in terms of their suitability as an energy
source. An optimal quality diet maximizes net energy gain per unit time (Emlen 1966;
MacArthur and Pianka 1966). This holistic definition of diet quality integrates the abundance of
prey in the environment and the quantity and nutritional quality of prey obtained, in that a
high quality diet is composed of prey that are energy dense, contain essential components for
growth and reproduction, are readily available, and relatively easy to capture, subdue, and
digest (Emlen 1966; MacArthur and Pianka 1966; Jodice et al. 2006). When diet quality
decreases, e.g., through a reduced prey population size, the greater foraging effort required
from predators may result in the predator population declining in health, having lower
reproductive success, and decreased juvenile and adult survival, culminating in a population
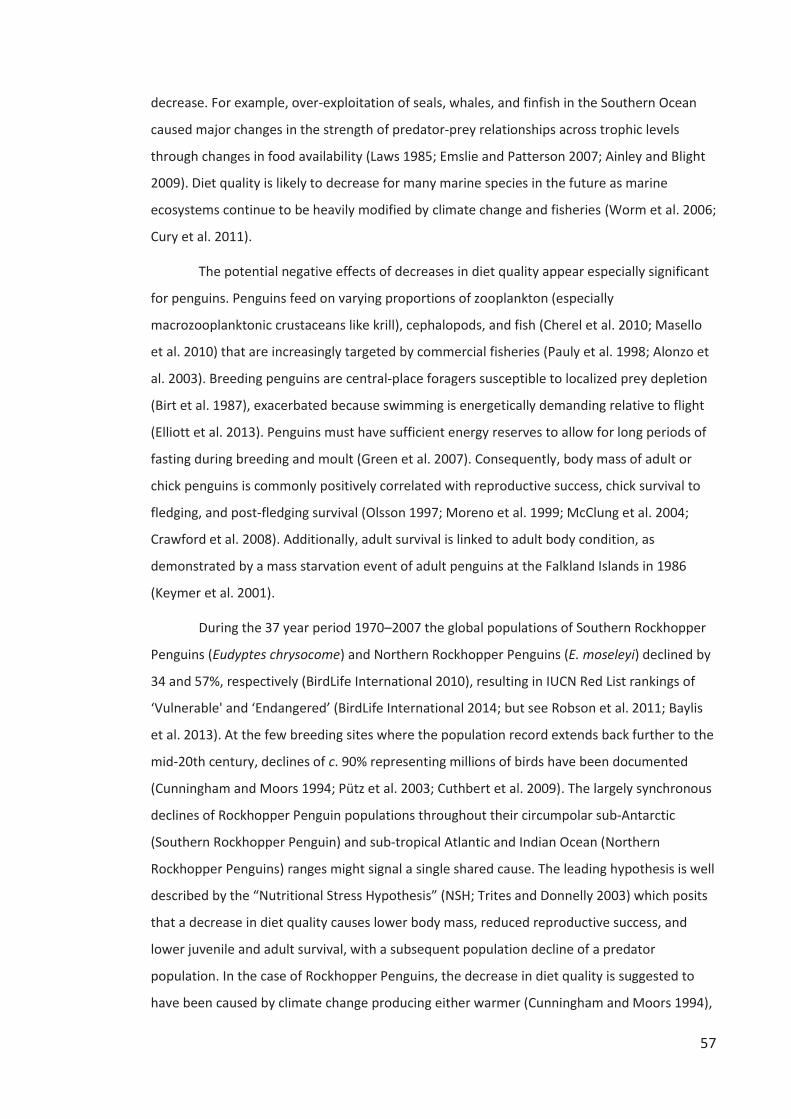
57
decrease. For example, over-exploitation of seals, whales, and finfish in the Southern Ocean
caused major changes in the strength of predator-prey relationships across trophic levels
through changes in food availability (Laws 1985; Emslie and Patterson 2007; Ainley and Blight
2009). Diet quality is likely to decrease for many marine species in the future as marine
ecosystems continue to be heavily modified by climate change and fisheries (Worm et al. 2006;
Cury et al. 2011).
The potential negative effects of decreases in diet quality appear especially significant
for penguins. Penguins feed on varying proportions of zooplankton (especially
macrozooplanktonic crustaceans like krill), cephalopods, and fish (Cherel et al. 2010; Masello
et al. 2010) that are increasingly targeted by commercial fisheries (Pauly et al. 1998; Alonzo et
al. 2003). Breeding penguins are central-place foragers susceptible to localized prey depletion
(Birt et al. 1987), exacerbated because swimming is energetically demanding relative to flight
(Elliott et al. 2013). Penguins must have sufficient energy reserves to allow for long periods of
fasting during breeding and moult (Green et al. 2007). Consequently, body mass of adult or
chick penguins is commonly positively correlated with reproductive success, chick survival to
fledging, and post-fledging survival (Olsson 1997; Moreno et al. 1999; McClung et al. 2004;
Crawford et al. 2008). Additionally, adult survival is linked to adult body condition, as
demonstrated by a mass starvation event of adult penguins at the Falkland Islands in 1986
(Keymer et al. 2001).
During the 37 year period 1970–2007 the global populations of Southern Rockhopper
Penguins (Eudyptes chrysocome) and Northern Rockhopper Penguins (E. moseleyi) declined by
34 and 57%, respectively (BirdLife International 2010), resulting in IUCN Red List rankings of
‘Vulnerable' and ‘Endangered’ (BirdLife International 2014; but see Robson et al. 2011; Baylis
et al. 2013). At the few breeding sites where the population record extends back further to the
mid-20th century, declines of c. 90% representing millions of birds have been documented
(Cunningham and Moors 1994; Pütz et al. 2003; Cuthbert et al. 2009). The largely synchronous
declines of Rockhopper Penguin populations throughout their circumpolar sub-Antarctic
(Southern Rockhopper Penguin) and sub-tropical Atlantic and Indian Ocean (Northern
Rockhopper Penguins) ranges might signal a single shared cause. The leading hypothesis is well
described by the “Nutritional Stress Hypothesis” (NSH; Trites and Donnelly 2003) which posits
that a decrease in diet quality causes lower body mass, reduced reproductive success, and
lower juvenile and adult survival, with a subsequent population decline of a predator
population. In the case of Rockhopper Penguins, the decrease in diet quality is suggested to
have been caused by climate change producing either warmer (Cunningham and Moors 1994),
58
cooler (Guinard et al. 1998; Pütz et al. 2006b), or sub-optimal (Dehnhard et al. 2013) sea-
surface temperatures (SST).
Evaluating support for the NSH as the cause of Rockhopper Penguin population
declines requires assessment of what constitutes a high quality diet for Rockhopper Penguins.
Fish generally have a higher lipid and energy density than zooplankton or cephalopods (Clarke
and Prince 1980; Cherel and Ridoux 1992; Meynier et al. 2008). Additionally, fish are more
rapidly digested by seabirds, including Southern Rockhopper Penguins (Jackson 1992), than are
crustaceans or cephalopods (Wilson et al. 1985; Jackson et al. 1987). The prediction follows
that penguins with a higher δ15N value – those feeding on a higher proportion of fish – should
be in better body condition. In support of fish being higher quality prey for penguins the body
condition of Magellanic Penguin (Spheniscus magellanicus) chicks has been shown to be
positively correlated with the proportion of fish in their diet, as inferred from higher δ15N
values (Forero et al. 2002). Following from this result, researchers considering the NSH for
Rockhopper Penguins (Hilton et al. 2006) and dietary effects on their breeding success (Booth
and McQuaid 2013) have assumed that a higher trophic level, more fish-based diet is of higher
quality. However, no study has tested this assumption in any penguin species other than
Magellanic Penguins by examining whether adults or chicks feeding on higher tropic level prey
are actually heavier at a given stage or age.
Stable isotope analysis (SIA) is increasingly used in studies of marine predators, where
nitrogen isotopes can evaluate dietary trophic levels and carbon isotopes can infer prey
habitats. The heavier nitrogen isotope (15N) is enriched at increasing trophic levels (Deniro and
Epstein 1981), so that fish and cephalopods have a higher 15N:14N ratio (i.e., higher δ15N value)
compared to zooplankton prey (Hobson et al. 1994). In contrast, 13C shows little enrichment
with increasing trophic level (Deniro and Epstein 1978), but carbon isotopes can provide useful
insights into dietary sources. Benthic and inshore plankton at the base of the food chain are
enriched in 13C relative to pelagic and offshore plankton (higher 13C:12C ratio, i.e., higher δ13C
value), allowing interpretation of predator foraging habitat (Hobson et al. 1994). Values of δ15N
and particularly δ13C are lower at higher latitudes (Jaeger et al. 2010), providing additional
insight into likely foraging areas. Stable isotope values of whole blood are useful for assessing
how the diet of individuals relates to their body condition because whole blood integrates
information on diet over the previous 3–4 weeks (Hobson and Clark 1992; Bearhop et al.
2002).
Campbell Island, in New Zealand’s sub-Antarctic, formerly held the world’s largest
population of the eastern sub-species of Southern Rockhopper Penguins (Eastern Rockhopper
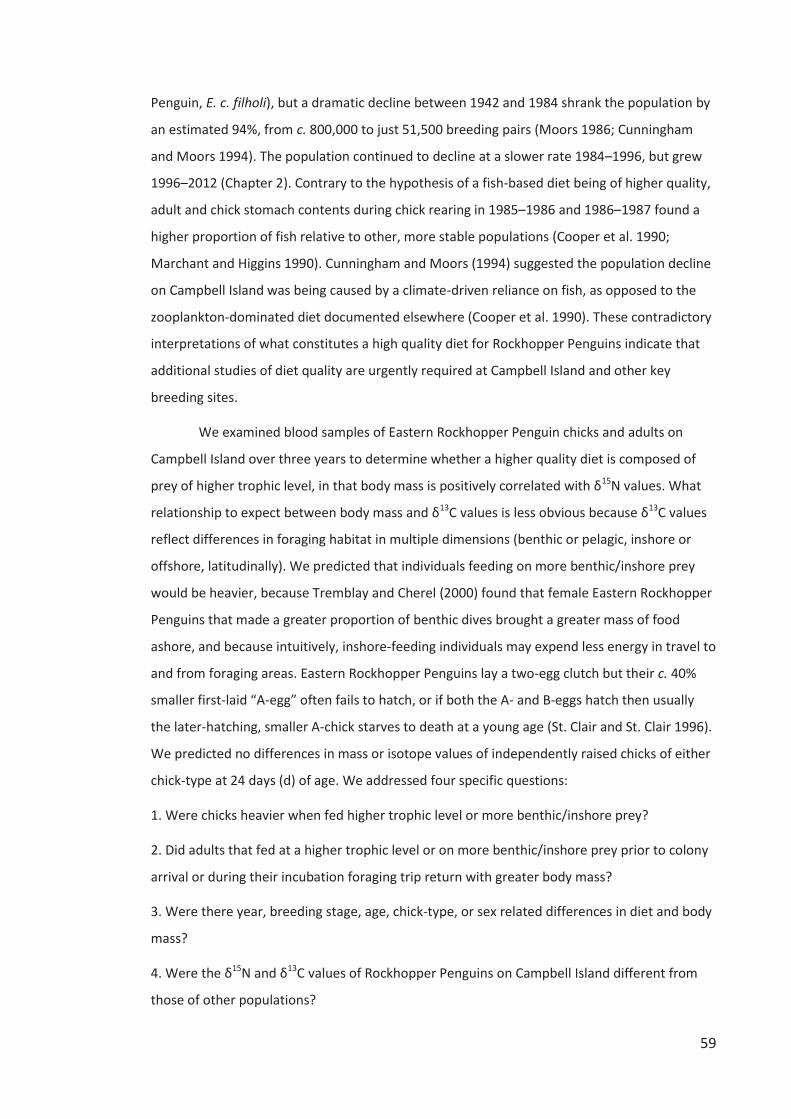
59
Penguin, E. c. filholi), but a dramatic decline between 1942 and 1984 shrank the population by
an estimated 94%, from c. 800,000 to just 51,500 breeding pairs (Moors 1986; Cunningham
and Moors 1994). The population continued to decline at a slower rate 1984–1996, but grew
1996–2012 (Chapter 2). Contrary to the hypothesis of a fish-based diet being of higher quality,
adult and chick stomach contents during chick rearing in 1985–1986 and 1986–1987 found a
higher proportion of fish relative to other, more stable populations (Cooper et al. 1990;
Marchant and Higgins 1990). Cunningham and Moors (1994) suggested the population decline
on Campbell Island was being caused by a climate-driven reliance on fish, as opposed to the
zooplankton-dominated diet documented elsewhere (Cooper et al. 1990). These contradictory
interpretations of what constitutes a high quality diet for Rockhopper Penguins indicate that
additional studies of diet quality are urgently required at Campbell Island and other key
breeding sites.
We examined blood samples of Eastern Rockhopper Penguin chicks and adults on
Campbell Island over three years to determine whether a higher quality diet is composed of
prey of higher trophic level, in that body mass is positively correlated with δ15N values. What
relationship to expect between body mass and δ13C values is less obvious because δ13C values
reflect differences in foraging habitat in multiple dimensions (benthic or pelagic, inshore or
offshore, latitudinally). We predicted that individuals feeding on more benthic/inshore prey
would be heavier, because Tremblay and Cherel (2000) found that female Eastern Rockhopper
Penguins that made a greater proportion of benthic dives brought a greater mass of food
ashore, and because intuitively, inshore-feeding individuals may expend less energy in travel to
and from foraging areas. Eastern Rockhopper Penguins lay a two-egg clutch but their c. 40%
smaller first-laid “A-egg” often fails to hatch, or if both the A- and B-eggs hatch then usually
the later-hatching, smaller A-chick starves to death at a young age (St. Clair and St. Clair 1996).
We predicted no differences in mass or isotope values of independently raised chicks of either
chick-type at 24 days (d) of age. We addressed four specific questions:
1. Were chicks heavier when fed higher trophic level or more benthic/inshore prey?
2. Did adults that fed at a higher trophic level or on more benthic/inshore prey prior to colony
arrival or during their incubation foraging trip return with greater body mass?
3. Were there year, breeding stage, age, chick-type, or sex related differences in diet and body
mass?
4. Were the δ15N and δ13C values of Rockhopper Penguins on Campbell Island different from
those of other populations?
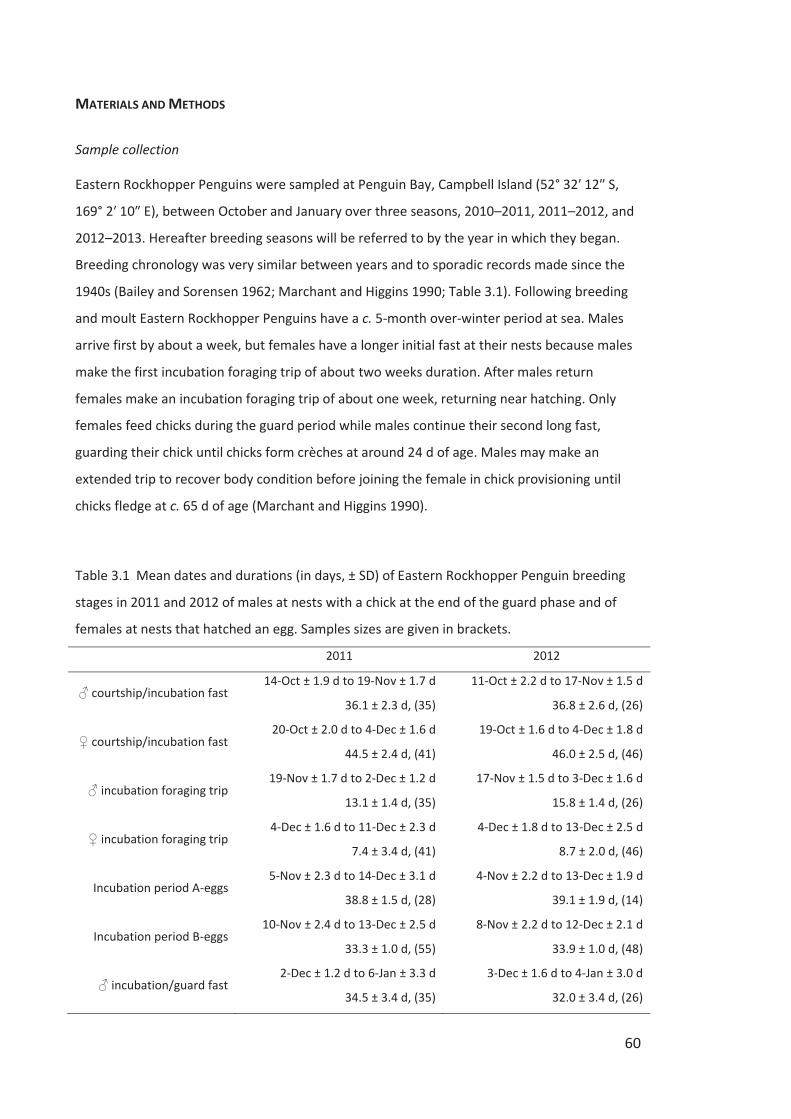
60
MATERIALS AND METHODS
Sample collection
Eastern Rockhopper Penguins were sampled at Penguin Bay, Campbell Island (52° 32ʹ 12ʺ S,
169° 2ʹ 10ʺ E), between October and January over three seasons, 2010–2011, 2011–2012, and
2012–2013. Hereafter breeding seasons will be referred to by the year in which they began.
Breeding chronology was very similar between years and to sporadic records made since the
1940s (Bailey and Sorensen 1962; Marchant and Higgins 1990; Table 3.1). Following breeding
and moult Eastern Rockhopper Penguins have a c. 5-month over-winter period at sea. Males
arrive first by about a week, but females have a longer initial fast at their nests because males
make the first incubation foraging trip of about two weeks duration. After males return
females make an incubation foraging trip of about one week, returning near hatching. Only
females feed chicks during the guard period while males continue their second long fast,
guarding their chick until chicks form crèches at around 24 d of age. Males may make an
extended trip to recover body condition before joining the female in chick provisioning until
chicks fledge at c. 65 d of age (Marchant and Higgins 1990).
Table 3.1 Mean dates and durations (in days, ± SD) of Eastern Rockhopper Penguin breeding
stages in 2011 and 2012 of males at nests with a chick at the end of the guard phase and of
females at nests that hatched an egg. Samples sizes are given in brackets.
2011 2012
♂ courtship/incubation fast 14-Oct ± 1.9 d to 19-Nov ± 1.7 d
36.1 ± 2.3 d, (35)
11-Oct ± 2.2 d to 17-Nov ± 1.5 d
36.8 ± 2.6 d, (26)
♀ courtship/incubation fast 20-Oct ± 2.0 d to 4-Dec ± 1.6 d
44.5 ± 2.4 d, (41)
19-Oct ± 1.6 d to 4-Dec ± 1.8 d
46.0 ± 2.5 d, (46)
♂ incubation foraging trip 19-Nov ± 1.7 d to 2-Dec ± 1.2 d
13.1 ± 1.4 d, (35)
17-Nov ± 1.5 d to 3-Dec ± 1.6 d
15.8 ± 1.4 d, (26)
♀ incubation foraging trip 4-Dec ± 1.6 d to 11-Dec ± 2.3 d
7.4 ± 3.4 d, (41)
4-Dec ± 1.8 d to 13-Dec ± 2.5 d
8.7 ± 2.0 d, (46)
Incubation period A-eggs 5-Nov ± 2.3 d to 14-Dec ± 3.1 d
38.8 ± 1.5 d, (28)
4-Nov ± 2.2 d to 13-Dec ± 1.9 d
39.1 ± 1.9 d, (14)
Incubation period B-eggs 10-Nov ± 2.4 d to 13-Dec ± 2.5 d
33.3 ± 1.0 d, (55)
8-Nov ± 2.2 d to 12-Dec ± 2.1 d
33.9 ± 1.0 d, (48)
♂ incubation/guard fast 2-Dec ± 1.2 d to 6-Jan ± 3.3 d
34.5 ± 3.4 d, (35)
3-Dec ± 1.6 d to 4-Jan ± 3.0 d
32.0 ± 3.4 d, (26)
61
In 2010 adults were sampled in late October, likely about one week after arrival for
females and two weeks for males because of our field team’s timing of arrival on the island
(Table 3.1, Table 3.2). In 2011 and 2012 we arrived before penguins returned and recorded the
date of arrival of adults previously implanted with a PIT tag (ISO FDX-B 11 × 2.1 mm glass-
encased transponder; Allflex Australia Pty). PIT tag codes, time, and date data were recorded
by hand at nest sites using an RS320 Stick Reader (Allflex Australia Pty), or automatically using
two radio frequency identification (RFID) data loggers and antennae set up along the penguin’s
travel pathway into the study colonies (S. Cockburn, Department of Conservation, Wellington).
In 2011 and 2012 adults were sampled within two days of their arrival and return from
incubation foraging trips. Mean sampling dates in 2011 and 2012 were similar to the breeding
chronology of a larger sample of PIT-tagged adults we monitored (Table 3.1, Table 3.2).
Different individuals were sampled at each stage and in each year. Adults were sexed based on
their breeding schedule and bill depth (Warham 1972). In 2011 and 2012 chicks were PIT-
tagged at 18 d and marked with blue water-soluble paint to enable their identification as they
gained mobility prior to crèching. Chicks were sampled at 20–30 d of age in 2010 when hatch
dates were uncertain, and at 24 d of age in 2011 and 2012 when hatch dates and chick-type
(A-chicks from first-laid A-eggs, or B-chicks from second-laid B-eggs) were known through daily
nest checks. We deliberately sampled chicks whose sibling egg had failed to hatch so that each
chick’s measurements reflected total parental investment in chick provisioning. Chicks typically
receive one feed per day in the evening from their mothers during the guard stage (Marchant
and Higgins 1990). We measured chicks in the afternoon while females were away foraging to
limit the effect of time-since-feeding on chick mass. We measured body mass at the time of
blood sampling using a 1 kg (±10 g), 2.5 kg (±20 g), or 5 kg (±50 g) spring scale. We examined
body mass rather than a body condition index, because indices not validated against measured
values of fat and protein may decrease predictability relative to using body mass alone
(Schamber et al. 2009).
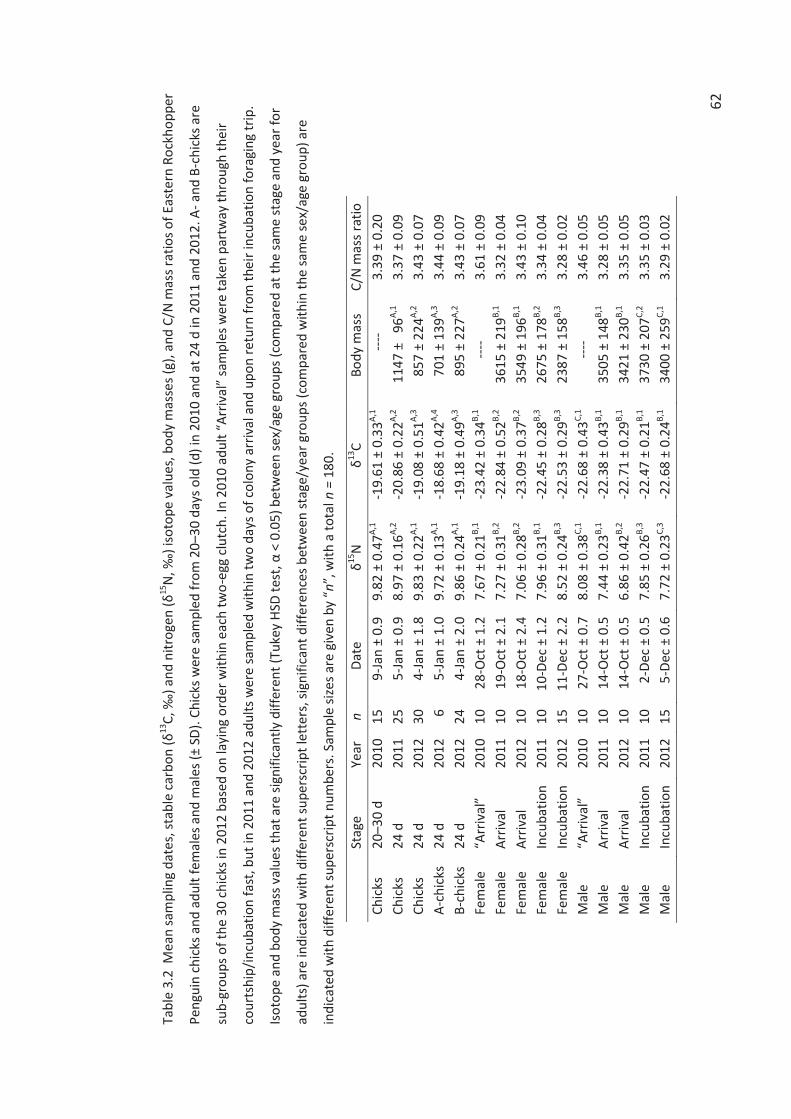
62
Tabl
e 3.
2 M
ean
sam
plin
g da
tes,
stab
le c
arbo
n (δ
13C,
‰) a
nd n
itrog
en (δ
15N
, ‰) i
soto
pe v
alue
s, bo
dy m
asse
s (g)
, and
C/N
mas
s rat
ios o
f Eas
tern
Roc
khop
per
Peng
uin
chic
ks a
nd a
dult
fem
ales
and
mal
es (±
SD)
. Chi
cks w
ere
sam
pled
from
20–
30 d
ays o
ld (d
) in
2010
and
at 2
4 d
in 2
011
and
2012
. A- a
nd B
-chi
cks a
re
sub-
grou
ps o
f the
30
chic
ks in
201
2 ba
sed
on la
ying
ord
er w
ithin
eac
h tw
o-eg
g cl
utch
. In
2010
adu
lt “A
rriv
al”
sam
ples
wer
e ta
ken
part
way
thro
ugh
thei
r
cour
tshi
p/in
cuba
tion
fast
, but
in 2
011
and
2012
adu
lts w
ere
sam
pled
with
in tw
o da
ys o
f col
ony
arriv
al a
nd u
pon
retu
rn fr
om th
eir i
ncub
atio
n fo
ragi
ng tr
ip.
Isot
ope
and
body
mas
s val
ues t
hat a
re si
gnifi
cant
ly d
iffer
ent (
Tuke
y HS
D te
st, α
< 0
.05)
bet
wee
n se
x/ag
e gr
oups
(com
pare
d at
the
sam
e st
age
and
year
for
adul
ts) a
re in
dica
ted
with
diff
eren
t sup
ersc
ript l
ette
rs, s
igni
fican
t diff
eren
ces b
etw
een
stag
e/ye
ar g
roup
s (co
mpa
red
with
in th
e sa
me
sex/
age
grou
p) a
re
indi
cate
d w
ith d
iffer
ent s
uper
scrip
t num
bers
. Sam
ple
sizes
are
giv
en b
y “n
”, w
ith a
tota
l n =
180
.
St
age
Year
n
Date
δ15
N
δ13
C
Body
mas
s C/
N m
ass r
atio
Ch
icks
20
–30
d 20
10
15
9-Ja
n ±
0.9
9.
82 ±
0.4
7A,1
-19.
61 ±
0.3
3A,1
-
---
3.39
± 0
.20
Chic
ks
24 d
20
11
25
5-Ja
n ±
0.9
8.97
± 0
.16A,
2 -2
0.86
± 0
.22A,
2 11
47 ±
96
A,1
3.37
± 0
.09
Chic
ks
24 d
20
12
30
4-Ja
n ±
1.8
9.83
± 0
.22A,
1 -1
9.08
± 0
.51A,
3 85
7 ±
224A,
2 3.
43 ±
0.0
7 A-
chic
ks
24 d
20
12
6 5-
Jan
± 1.
0 9.
72 ±
0.1
3A,1
-18.
68 ±
0.4
2A,4
701
± 13
9A,3
3.44
± 0
.09
B-ch
icks
24
d
2012
24
4-
Jan
± 2.
0 9.
86 ±
0.2
4A,1
-19.
18 ±
0.4
9A,3
895
± 2
27A,
2 3.
43 ±
0.0
7 Fe
mal
e “A
rriv
al”
2010
10
28
-Oct
± 1
.2
7.67
± 0
.21B,
1 -2
3.42
± 0
.34B,
1
----
3.
61 ±
0.0
9 Fe
mal
e Ar
rival
20
11
10
19-O
ct ±
2.1
7.
27 ±
0.3
1B,2
-22.
84 ±
0.5
2B,2
3615
± 2
19B,
1 3.
32 ±
0.0
4 Fe
mal
e Ar
rival
20
12
10
18-O
ct ±
2.4
7.
06 ±
0.2
8B,2
-23.
09 ±
0.3
7B,2
3549
± 1
96B,
1 3.
43 ±
0.1
0 Fe
mal
e In
cuba
tion
20
11
10
10-D
ec ±
1.2
7.
96 ±
0.3
1B,1
-22.
45 ±
0.2
8B,3
2675
± 1
78B,
2 3.
34 ±
0.0
4 Fe
mal
e In
cuba
tion
2012
15
11
-Dec
± 2
.2
8.52
± 0
.24B,
3 -2
2.53
± 0
.29B,
3 23
87 ±
158
B,3
3.28
± 0
.02
Mal
e “A
rriv
al”
2010
10
27
-Oct
± 0
.7
8.08
± 0
.38C,
1 -2
2.68
± 0
.43C,
1
----
3.
46 ±
0.0
5 M
ale
Arriv
al
2011
10
14
-Oct
± 0
.5
7.44
± 0
.23B,
1 -2
2.38
± 0
.43B,
1 35
05 ±
148
B,1
3.28
± 0
.05
Mal
e Ar
rival
20
12
10
14-O
ct ±
0.5
6.
86 ±
0.4
2B,2
-22.
71 ±
0.2
9B,1
3421
± 2
30B,
1 3.
35 ±
0.0
5 M
ale
Incu
batio
n
2011
10
2-
Dec
± 0.
5 7.
85 ±
0.2
6B,3
-22.
47 ±
0.2
1B,1
3730
± 2
07C,
2 3.
35 ±
0.0
3 M
ale
Incu
batio
n 20
12
15
5-De
c ±
0.6
7.72
± 0
.23C,
3 -2
2.68
± 0
.24B,
1 34
00 ±
259
C,1
3.29
± 0
.02
63
Stable isotope analysis
All individuals were sampled using a 25 gauge needle and 1.0 mL syringe to collect < 1.0 mL of
blood from the brachial vein. Samples were placed in 2.0 mL Eppendorf tubes and preserved
with 75% ethanol in 2010 and with 95% ethanol in 2011 and 2012 from the same batch in the
latter two years. Preservation of blood in ethanol may enrich δ13C values to a different degree
between batches of ethanol (Bugoni et al. 2008). This potential effect should be considered in
our comparisons of δ13C values from 2010 to those from 2011 and 2012. Samples from each
year were stored in ethanol for c. 2.5, 1.5, and 0.5 years prior to being simultaneously dried
and analysed. Storage in ethanol for periods of up to 12 weeks may increase sample δ13C
values (Kaehler and Pakhomov 2001), but any effect of longer term storage is unknown. Lipid
extraction was unnecessary because of the low lipid content of whole blood (Cherel et al.
2005a), as demonstrated by the low C/N mass ratios of our samples (Table 3.2). Whole blood
samples were dried for two days in an oven at 60 °C before being ground with a mortar and
pestle. An electronic balance was used to weigh out 0.7–0.8 mg of each sample into a tin boat.
SIA were conducted at the National Institute of Water and Atmospheric Research (NIWA)
stable isotope laboratory in Wellington, New Zealand, following Butler et al. (2014).
Additionally, δ15N and δ13C values were corrected against NIST standards (NIST 8573 USGS40 L-
glutamic acid, NIST 8548 IAEA-N2 ammonium sulphate, and NIST 8542 IAEA-CH-6 Sucrose)
using a three-point normalisation process. A laboratory standard DL-Leucine (DL-2-Amino-4-
methylpentanoic acid, C6H13NO2, Lot 127H1084, Sigma, Australia) was calibrated routinely
against a suite of international NIST standards. Repeat analysis of NIST and internal DL Leucine
laboratory standards during the batch analyses produced data accurate to within 0.19‰ for
δ15N and 0.36‰ for δ13C and a precision of better than 0.19‰ for δ15N and 0.31‰ for δ13C.
Statistical analysis
We used separate simple linear regression analyses for δ15N and δ13C values versus body mass
for chicks and adults at each stage in 2011 and 2012. For regressions between body mass and
isotope values, we pooled data within a sex for stages/years when data were not significantly
different. We did not include adult or chick body masses from 2010 in any analysis because
adults were measured partway through their courtship/incubation fast and chick age was
unknown. Chick δ15N and δ13C values, and body mass raw values had bimodal distributions, so
we used separate Kruskal-Wallis tests to evaluate whether chick δ15N and δ13C values, and
body masses differed between 2011 and 2012, followed by Dwass-Steel-Critchlow-Fligner tests
64
for all pairwise comparisons. In 2012 chick data was normally distributed and independent
variables had equal variances between A- and B-chicks, so we used Unpaired t tests to test for
differences between A- and B-chicks. Mann-Whitney U tests were used to compare chick and
adult δ15N and δ13C values. We used 2-way ANOVAs to compare δ15N and δ13C values at arrival
between the sexes and between all three years, followed by post-hoc Tukey's Honestly-
Significant-Difference (HSD) tests for pairwise comparisons. A 3-way MANOVA was used to
compare δ15N and δ13C values between the sexes at arrival and incubation return in 2011 and
2012, because δ15N and δ13C values were correlated (r2 = 0.158, n = 90, P < 0.001). We present
MANOVA results using F statistics derived from Wilk’s lambda. We again used post-hoc Tukey's
HSD tests for pairwise comparisons. Adult body masses were compared between the sexes,
years, and stages in 2011 and 2012 using Mann-Whitney U tests because of the bimodal
distribution of body mass. All means are presented ± SD. Statistical tests were performed using
Systat 13 (Systat Software Inc.) and Statistica 12 (StatSoft Inc.).
RESULTS
We collected blood samples for SIA from 70 chicks, 55 adult females, and 55 adult males over
the 2011, 2012, and 2013 breeding seasons (Table 3.2). Sample sizes of A-chicks versus B-
chicks were unknown in 2010, but were n = 1 A and n = 24 B in 2011 and n = 6 A and n = 24 B in
2012. Male and female mean arrival, laying, and incubation departure dates were similar
between years, being on average 0–3 days earlier in 2012 relative to 2011 (Table 3.1). The
incubation foraging trips of males and females were three and two days longer, respectively, in
2012 compared to 2011. Males’ incubation/guard period fast was three days shorter in 2012
than in 2011 (Table 3.1). In no sex/age group did mean δ13C values show a pattern of decrease
from 2010 to 2012, therefore mean δ13C values were not larger after longer storage time in
ethanol (Table 3.2).
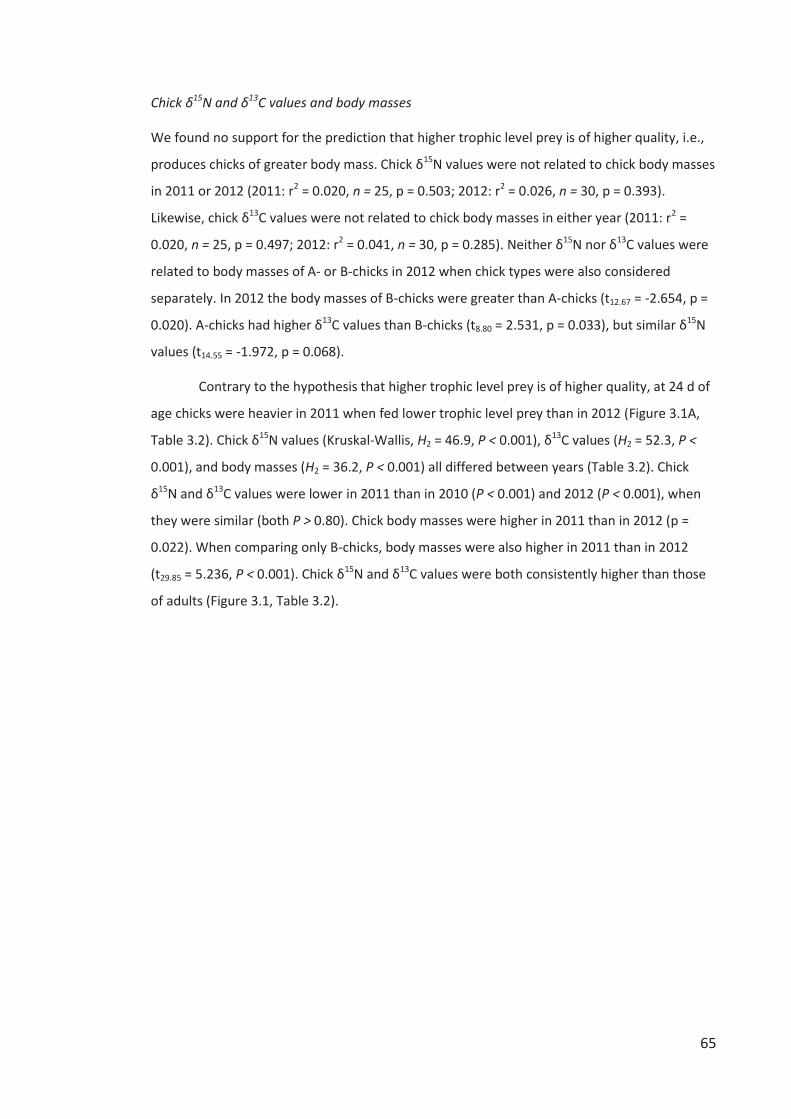
65
Chick δ15N and δ13C values and body masses
We found no support for the prediction that higher trophic level prey is of higher quality, i.e.,
produces chicks of greater body mass. Chick δ15N values were not related to chick body masses
in 2011 or 2012 (2011: r2 = 0.020, n = 25, p = 0.503; 2012: r2 = 0.026, n = 30, p = 0.393).
Likewise, chick δ13C values were not related to chick body masses in either year (2011: r2 =
0.020, n = 25, p = 0.497; 2012: r2 = 0.041, n = 30, p = 0.285). Neither δ15N nor δ13C values were
related to body masses of A- or B-chicks in 2012 when chick types were also considered
separately. In 2012 the body masses of B-chicks were greater than A-chicks (t12.67 = -2.654, p =
0.020). A-chicks had higher δ13C values than B-chicks (t8.80 = 2.531, p = 0.033), but similar δ15N
values (t14.55 = -1.972, p = 0.068).
Contrary to the hypothesis that higher trophic level prey is of higher quality, at 24 d of
age chicks were heavier in 2011 when fed lower trophic level prey than in 2012 (Figure 3.1A,
Table 3.2). Chick δ15N values (Kruskal-Wallis, H2 = 46.9, P < 0.001), δ13C values (H2 = 52.3, P <
0.001), and body masses (H2 = 36.2, P < 0.001) all differed between years (Table 3.2). Chick
δ15N and δ13C values were lower in 2011 than in 2010 (P < 0.001) and 2012 (P < 0.001), when
they were similar (both P > 0.80). Chick body masses were higher in 2011 than in 2012 (p =
0.022). When comparing only B-chicks, body masses were also higher in 2011 than in 2012
(t29.85 = 5.236, P < 0.001). Chick δ15N and δ13C values were both consistently higher than those
of adults (Figure 3.1, Table 3.2).
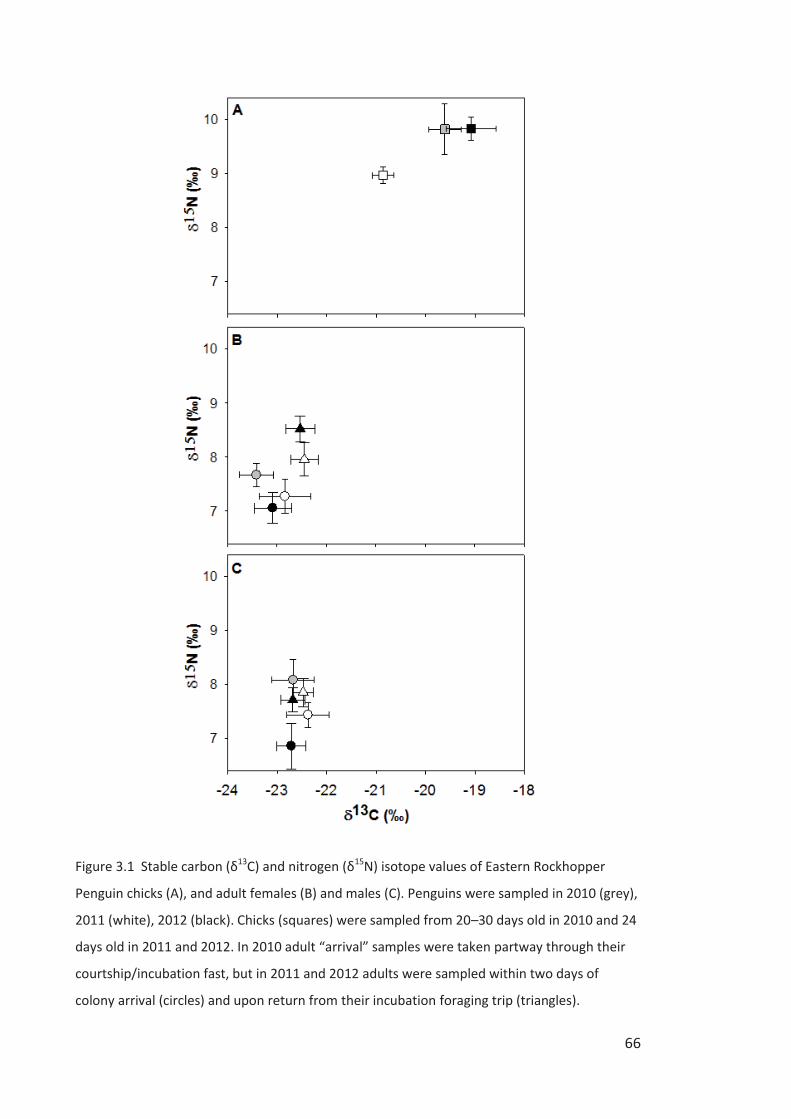
66
Figure 3.1 Stable carbon (δ13C) and nitrogen (δ15N) isotope values of Eastern Rockhopper
Penguin chicks (A), and adult females (B) and males (C). Penguins were sampled in 2010 (grey),
2011 (white), 2012 (black). Chicks (squares) were sampled from 20–30 days old in 2010 and 24
days old in 2011 and 2012. In 2010 adult “arrival” samples were taken partway through their
courtship/incubation fast, but in 2011 and 2012 adults were sampled within two days of
colony arrival (circles) and upon return from their incubation foraging trip (triangles).
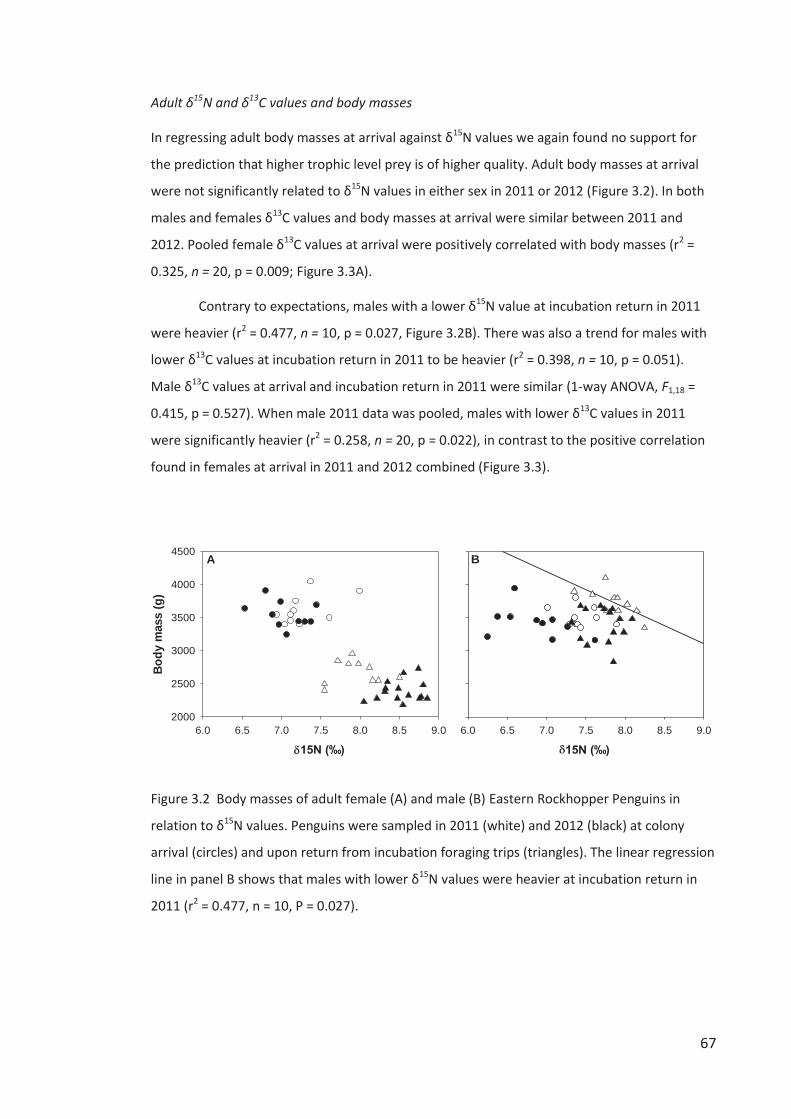
67
Adult δ15N and δ13C values and body masses
In regressing adult body masses at arrival against δ15N values we again found no support for
the prediction that higher trophic level prey is of higher quality. Adult body masses at arrival
were not significantly related to δ15N values in either sex in 2011 or 2012 (Figure 3.2). In both
males and females δ13C values and body masses at arrival were similar between 2011 and
2012. Pooled female δ13C values at arrival were positively correlated with body masses (r2 =
0.325, n = 20, p = 0.009; Figure 3.3A).
Contrary to expectations, males with a lower δ15N value at incubation return in 2011
were heavier (r2 = 0.477, n = 10, p = 0.027, Figure 3.2B). There was also a trend for males with
lower δ13C values at incubation return in 2011 to be heavier (r2 = 0.398, n = 10, p = 0.051).
Male δ13C values at arrival and incubation return in 2011 were similar (1-way ANOVA, F1,18 =
0.415, p = 0.527). When male 2011 data was pooled, males with lower δ13C values in 2011
were significantly heavier (r2 = 0.258, n = 20, p = 0.022), in contrast to the positive correlation
found in females at arrival in 2011 and 2012 combined (Figure 3.3).
15N (‰) 6.0 6.5 7.0 7.5 8.0 8.5 9.0
Body
mas
s (g
)
2000
2500
3000
3500
4000
4500
15N (‰) 6.0 6.5 7.0 7.5 8.0 8.5 9.0
BA
Figure 3.2 Body masses of adult female (A) and male (B) Eastern Rockhopper Penguins in
relation to δ15N values. Penguins were sampled in 2011 (white) and 2012 (black) at colony
arrival (circles) and upon return from incubation foraging trips (triangles). The linear regression
line in panel B shows that males with lower δ15N values were heavier at incubation return in
2011 (r2 = 0.477, n = 10, P = 0.027).
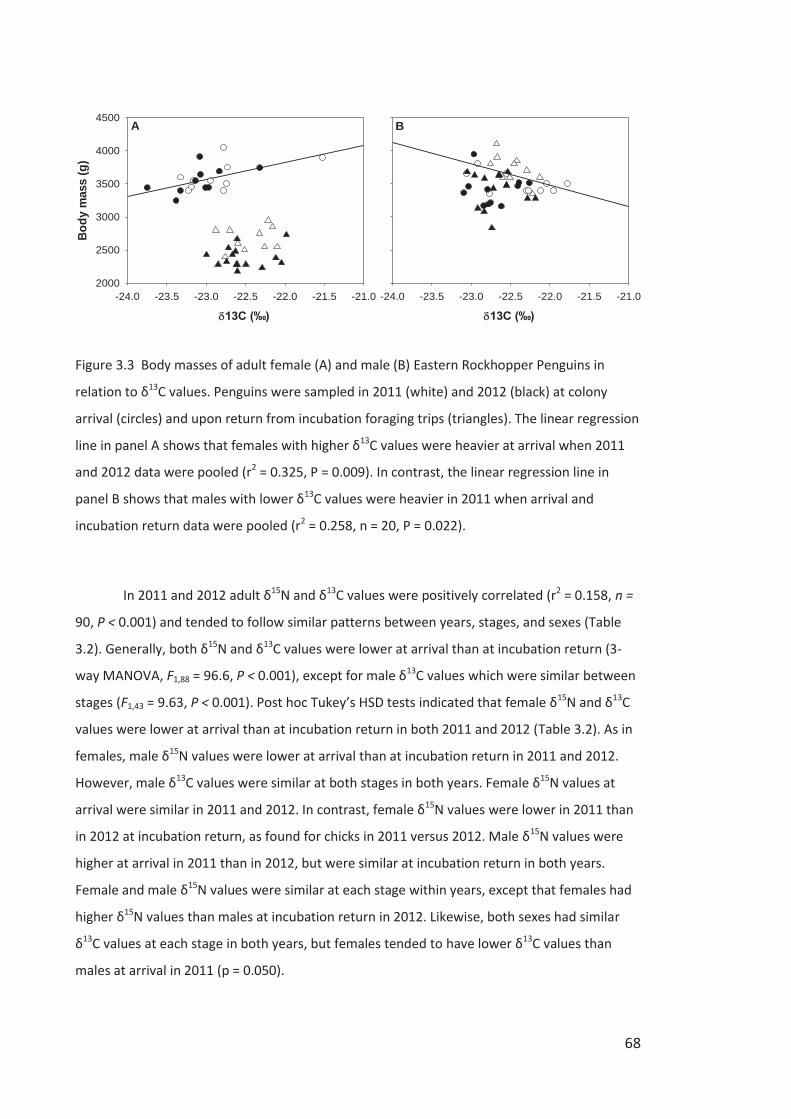
68
13C (‰) -24.0 -23.5 -23.0 -22.5 -22.0 -21.5 -21.0
Body
mas
s (g
)
2000
2500
3000
3500
4000
4500
13C (‰) -24.0 -23.5 -23.0 -22.5 -22.0 -21.5 -21.0
A B
Figure 3.3 Body masses of adult female (A) and male (B) Eastern Rockhopper Penguins in
relation to δ13C values. Penguins were sampled in 2011 (white) and 2012 (black) at colony
arrival (circles) and upon return from incubation foraging trips (triangles). The linear regression
line in panel A shows that females with higher δ13C values were heavier at arrival when 2011
and 2012 data were pooled (r2 = 0.325, P = 0.009). In contrast, the linear regression line in
panel B shows that males with lower δ13C values were heavier in 2011 when arrival and
incubation return data were pooled (r2 = 0.258, n = 20, P = 0.022).
In 2011 and 2012 adult δ15N and δ13C values were positively correlated (r2 = 0.158, n =
90, P < 0.001) and tended to follow similar patterns between years, stages, and sexes (Table
3.2). Generally, both δ15N and δ13C values were lower at arrival than at incubation return (3-
way MANOVA, F1,88 = 96.6, P < 0.001), except for male δ13C values which were similar between
stages (F1,43 = 9.63, P < 0.001). Post hoc Tukey’s HSD tests indicated that female δ15N and δ13C
values were lower at arrival than at incubation return in both 2011 and 2012 (Table 3.2). As in
females, male δ15N values were lower at arrival than at incubation return in 2011 and 2012.
However, male δ13C values were similar at both stages in both years. Female δ15N values at
arrival were similar in 2011 and 2012. In contrast, female δ15N values were lower in 2011 than
in 2012 at incubation return, as found for chicks in 2011 versus 2012. Male δ15N values were
higher at arrival in 2011 than in 2012, but were similar at incubation return in both years.
Female and male δ15N values were similar at each stage within years, except that females had
higher δ15N values than males at incubation return in 2012. Likewise, both sexes had similar
δ13C values at each stage in both years, but females tended to have lower δ13C values than
males at arrival in 2011 (p = 0.050).
69
Overall, adults were heavier in 2011 than 2012 (Table 3.2), heavier at arrival than at
incubation return, and males were heavier than females. Females were heavier at incubation
return in 2011 than in 2012. Likewise, males were heavier at incubation return in 2011 than in
2012. Females were heavier at arrival than at incubation return in both 2011 and 2012. In
contrast, males weighed less at arrival than at incubation return in 2011. Both sexes arrived at
a similar mass in 2011 and 2012, however females were lighter than males at incubation
return in both 2011 and 2012.
DISCUSSION
We found no support for the hypothesis that a high quality penguin diet contains a greater
proportion of upper trophic level prey than a low quality diet. Contrary to predictions, Eastern
Rockhopper Penguin (Eudyptes chrysocome filholi) chick and adult δ15N values were not
positively correlated with body masses in 2011 or 2012. Instead, we found the reverse
relationship: adult males were heavier in 2011 when their diet was biased towards lower
trophic level prey on their incubation foraging trip. Similarly, mean chick mass at 24 d of age
was significantly higher in 2011 when average chick δ15N values were lower than in 2012.
Other differences in diet and body mass between years, breeding stages, age, chick-type, and
sex are discussed below.
Chick δ15N and δ13C values
The lower δ15N values of chicks in 2011 indicate they were fed a greater proportion of lower
trophic level prey (zooplankton) than in 2010 and 2012 when chicks consumed a greater
proportion of higher trophic level prey (fish and cephalopods; Hobson et al. 1994). The lower
δ13C values of chicks in 2011 suggest their zooplankton prey came from more pelagic/offshore
waters than the fish and cephalopods sourced from more benthic/inshore waters in 2010 and
2012 (Hobson et al. 1994). Mean δ15N and δ13C values of chicks in 2011 were higher than in
2012 by 0.96‰ and 1.78‰ respectively, but both differences were likely underestimated
because of the high likelihood of δ13C, and especially δ15N depletion in the food-limited chicks
of 2012 (Williams et al. 2007; Sears et al. 2009). Adult δ13C and δ15N values at incubation
return showed little variation and had very similar means between the sexes in 2011 when
chick δ13C and δ15N values also contained little variation. In 2011 both males and females made
shorter incubation foraging trips but returned at heavier masses than in 2012. Females also
made chick-provisioning trips of shorter duration and provisioned chicks more frequently in
70
2011 compared to 2012 (Chapter 4). Consequently, chicks were heavier in 2011 than in 2012.
These results suggest foraging specialization on abundant pelagic zooplankton in 2011. In
contrast, in 2012 penguins broadened their diet and foraging habitat to include more fish
and/or cephalopods, but ended up returning at lower masses from longer trips and rearing
smaller chicks. Likewise, for Macaroni Penguins (Eudyptes chrysolophus) and Gentoo Penguins
(Pygoscelis papua) at South Georgia years of a fish-based, rather than krill-based diet are
associated with small meal masses, and low provisioning rates, fledging masses, and fledging
success (Croxall et al. 1999; Waluda et al. 2012).
In 2012 females on incubation foraging trips fed on a greater proportion of higher
trophic level prey than in 2011. Likewise, females fed chicks higher trophic level prey in 2012
versus 2011. This suggests prey selection by females for both self-feeding and chick-
provisioning is not fixed, but demonstrates behavioural plasticity that likely reflects inter-
annual differences in prey availability. Tremblay and Cherel (2003; 2005) suggested
Rockhopper Penguins exhibited much plasticity between individuals and populations with
respect to foraging behaviour and diet. Cunningham and Moors (1994) hypothesized that
warm SST around Campbell Island led to decreased Eastern Rockhopper Penguin diet quality
and lower chick fledging weights. In partial support of this hypothesis monthly SST values were
0.36 °C higher in 2012 than in 2011 when averaged over the three months prior to laying (Aug,
Sept, Oct), but were similar during incubation and the guard period (Nov, Dec, Jan) in a
rectangular region surrounding Campbell Island, 52–53 °S, 168.25–169.75 °E (111 km
latitudinally by 102 km longitudinally) that encompasses the expected foraging radius of < 50
km for chick-rearing Eastern Rockhopper Penguins (Sagar et al. 2005; MODIS-Aqua 4 micron
night 4 km data from http://gdata1.sci.gsfc. nasa.gov/daac-bin/G3/gui.cgi?instance_id
=ocean_month). In contrast, average SST in April–June during and after moult and prior to
breeding in 2012 was lower than in any other year 2002–2014 and was 1.85 °C lower than in
2011. The potential negative effects of warm pre-laying SST and exceptionally low over-winter
SST on subsequent Eastern Rockhopper Penguin diet quality suggests a quadratic relationship
between SST and diet quality. Similarly, Dehnhard et al. (2013) found a quadratic relationship
between adult survival of Southern Rockhopper Penguins in the southwest Atlantic and SST in
a three month period overlapping moult.
Décima et al. (2013) found that an inter-annual increase in SST of c. 3 °C was
associated with an increase of c. 2 ‰ in the baseline δ15N values of zooplankton in the
California Current Ecosystem. It is possible that SST being 0.36 °C higher in the three months
prior to laying in 2012 versus 2011 caused a slight increase in the isotopic baseline of the prey
71
base around Campbell Island. However, we suggest that the increase in chick δ15N values by
0.96‰ we observed between 2011 and 2012 was caused by a shift in diet to higher trophic
level prey rather than an increase in the isotopic baseline, given the modest temperature
increase and physical diet observations described later. Likewise, the increase in chick δ13C
values between 2011 and 2012 could be associated with an increase in isotopic baseline values
because of an increased rate of primary productivity (Hilton et al. 2006). Again our results
favour the default explanation of a shift to more benthic/inshore prey in 2012 rather than a
shift in isotopic baseline, because we would expect chick mass to have been greater instead of
much less in 2012 if primary productivity was higher in 2012 than 2011.
In 2012 when enough samples were collected from A-chicks to allow a novel dietary
comparison with B-chicks, we found that at 24 d of age A-chicks had both a lower body mass
and had been fed more benthic/inshore prey than B-chicks. The lower body mass of A-chicks
could be related to their lower hatching mass and egg hormone concentrations (Poisbleau et
al. 2008; 2009; 2011), but these differences were no longer apparent in 18 d old Southern
Rockhopper Penguins raised independently in assigned treatment groups (Poisbleau et al.
2008; Dehnhard et al. 2011a). Instead, the differences we found in both chick body mass and
diet suggest A-chicks were fed a lower quality diet by parents of lower quality or that had
decreased their reproductive investment after failing to hatch their larger, typically favoured
and more successful B-egg (St. Clair and St. Clair 1996).
Eastern Rockhopper Penguin chicks in the present study had higher δ15N values (8.97
±0.16‰ to 9.83 ±0.22‰) than those from the Crozet Islands (6.82 ±0.28; Cherel et al. 2007) or
Kerguelen Islands (8.16 ±0.3‰; Cherel et al. 2010). The higher values at Campbell Island likely
reflect a greater reliance on fish and cephalopods during chick-rearing than at the Indian
Ocean sites where the pelagic crustacean Euphausia vallentini is the dominant prey species
(>82% of the number of prey at both sites; Tremblay and Cherel 2003). For example, in 1985–
1986 Campbell Island chick diet samples were dominated by a single fish species, southern
blue whiting (Micromesisteus australis; 75.6% by number of prey; Marchant and Higgins 1990).
Adult δ15N values
Contrary to our prediction, males with lower δ15N values were heavier at incubation return in
2011, indicating that a more zooplankton-based diet was a higher quality diet. An alternative
interpretation is that males with lower body mass had higher δ15N values because of greater
δ15N enrichment from protein catabolism, which may have occurred during their
72
courtship/early-incubation period of fasting (Cherel et al. 2005b). Multiple lines of evidence
suggest the latter interpretation is less likely. There was no relationship between body mass
and δ15N values of females at incubation return, although females underwent a longer
courtship/incubation fast (Table 3.1), lost a greater proportion of their arrival body mass
(K.W.M. unpub. data), and had shorter incubation foraging trips than males (Table 3.1). There
were also trends for heavier males to have lower δ15N values at arrival in both 2011 and 2012
that can only be attributed to differences in diet quality (Figure 3.2). Additionally δ15N
enrichment in whole blood of King Penguins (Aptenodytes patagonicus) fasting for 25 and c. 40
days averaged only 0.30 and 0.17‰ (Cherel et al. 2005b). In the present study male δ15N
values at incubation return in 2011 had a range of 0.89‰, far too large to be accounted for
solely by individual variation in protein catabolism during fasting. That said, δ15N enrichment
from protein catabolism may have contributed to “arrival” δ15N values being highest in 2010
when adults were sampled after c. 1–2 weeks of fasting.
The δ15N values of both males and females were higher at incubation return than at
arrival. As our other results support a lower trophic level diet as being of higher quality, we
must ask why both sexes transitioned to a higher trophic level diet between their pre-breeding
and incubation periods and why chicks were fed a still more fish- and cephalopod-based diet?
We suggest this is because of changes in prey availability with proximity to the breeding colony
or else through time because of local depletion or seasonal trends, rather than a change of
deliberate choice. In contrast, adult Southern Rockhopper Penguin diet decreased in trophic
level between pre-breeding and breeding stages at the Falkland Islands in one year of study
(Dehnhard et al. 2011b), but was similar between stages in another two years (Ludynia et al.
2013). The δ15N values of adults at arrival and during chick-rearing, and those of chicks were all
similar in one year for Eastern Rockhopper Penguins at the Crozet Islands (Cherel et al. 2007).
Female and male δ15N values were similar at each stage within years, except that
females had higher δ15N values than males at incubation return in 2012. This finding contrasts
with that of Dehnhard et al. (2011b) who found that males consumed a higher trophic level
diet than females prior to arrival. The slightly larger body size and consequently greater
theoretical diving depth and duration of males common to a number of seabird species
(Burger 1991) is generally associated with consumption of more fish by male than female
seabirds (Bearhop et al. 2006). However, male and female Southern Rockhopper Penguins had
very similar dive characteristics on incubation trips on Staten Island (Pütz et al. 2006a).
It is noteworthy that the δ15N values of Eastern Rockhopper Penguins in the current
study are comparable, albeit slightly higher, than those from Crozet (Cherel et al. 2007) and
73
Kerguelen (Cherel et al. 2010) islands in the Indian Ocean (δ15N average values 6.8–9.8‰),
whereas at the Falklands Islands in the southwest Atlantic δ15N values range from 13.3‰ to
15.8‰ (Masello et al. 2010; Dehnhard et al. 2011b; Ludynia et al. 2013). The higher δ15N
values of Southern Rockhopper Penguins at the Falklands Islands reflect differences in baseline
δ15N values between regions, rather than penguins feeding at hugely different trophic levels
(Dehnhard et al. 2011b).
Adult δ13C values
Female δ13C values were lower at arrival than at incubation return in 2012, although male
arrival and incubation δ13C signatures were similar between stages in both years. Males’
consistent maintenance of similar δ13C values at arrival and incubation return may result if the
longer duration of male incubation foraging trips allows males to return to their further
offshore, higher latitude pre-breeding foraging area. However, females are constrained from
foraging further offshore on their shorter incubation foraging trips, as found for Southern
Rockhopper Penguins at the Falkland Islands (Ludynia et al. 2013).
At arrival females had lower δ13C values than males across years. Likewise, the pre-
breeding diet of females suggested a tendency towards a more pelagic/offshore or higher
latitude diet compared to male Southern Rockhopper Penguins at the Falkland Islands prior to
colony arrival (Ludynia et al. 2013). No sex differences were found between the over-winter
distribution or δ13C values at arrival of Eastern Rockhopper Penguins from Crozet and
Kerguelen islands and Northern Rockhopper Penguins at Amsterdam Island, although again
females had slightly lower δ13C values at arrival (Thiebot et al. 2012). Males have a shorter
over-winter period at sea (Thiebot et al. 2012) and earlier initiation of return migration than
females (Thiebot et al. 2013), differences that may be reflected in the tendency for females to
have lower pre-breeding δ13C values than males.
Females with higher δ13C values at arrival were heavier. Higher δ13C values might
reflect more time spent foraging at lower latitudes closer to Campbell Island in the weeks
preceding breeding which could decrease mass loss in the final days of females’ return
migration. Another nonexclusive explanation is that females that made more benthic dives
prior to breeding were more successful at obtaining prey, as found for chick-rearing females at
the Kerguelen Islands (Tremblay and Cherel 2000). Interestingly, the opposite pattern was
found in males being heavier with lower δ13C values in 2011 with pooled arrival and incubation
return data. Males that foraged at higher latitudes and further offshore may have encountered
74
greater prey availability in 2011. Additional years of study are required to confirm a consistent
sex-difference in the effect of foraging habitat as inferred from δ13C values on adult body mass.
Conclusions on diet quality
Why were Magellanic Penguin chicks fed a higher trophic level diet in better body condition
(Forero et al. 2002), but Eastern Rockhopper Penguin chicks with higher δ15N values were not
of greater body mass in the current study? The primary fish prey of Magellanic Penguins in the
Argentine study region of Forero et al. (2002) is Argentine anchovy (Engraulis anchoita) which
is an energy-rich pelagic species likely to have a much greater energy density than the largely
demersal fish species found in the diet of Eastern Rockhopper Penguins on Campbell Island
(Vlieg 1984; Heath and Randall 1985; Marchant and Higgins 1990). For example, Argentine
anchovy of unstated length have an energy density of 8.4 kJ g-1 wet mass (Drago et al. 2010),
whereas blue whiting (Micromesistius poutasou) of 80–120 mm length, of the same size class
and congeneric to the southern blue whiting common in the diet of Eastern Rockhopper
Penguins on Campbell Island (Marchant and Higgins 1990), has an energy density of just 4.2 kJ
g-1 wet mass (Velasco and Olaso 2000). Generally having only fish prey of relatively low energy
density available to Eastern Rockhopper Penguins at Campbell Island may be a function of the
low productivity of the surrounding marine environment compared to the high productivity
habitat of Magellanic Penguins (Bradford-Grieve et al. 2003; Boersma et al. 2009).
Furthermore, the smaller body size of Eastern Rockhopper Penguins relative to Magellanic
Penguins (bill length 21% shorter, Marchant and Higgins 1990; Yorio et al. 2001) may limit the
ability of Eastern Rockhopper Penguins to capture larger, reproductively mature fish which are
typically of higher energy density (Anthony et al. 2000). Additionally, the higher chick δ15N
values in 2012 relative to 2011 likely also reflect a higher proportion of low-lipid cephalopod
prey fed to chicks in 2012 (Cherel and Ridoux 1992; Meynier et al. 2008). Small cephalopod
beaks (n = 2 to > 50) were found in the stomach contents of five chicks killed by Brown Skuas
(Catharacta antarctica lonnbergi) in 2012, but no beaks were present in five skua-killed chicks
in 2011 (K.W.M. unpub. data). Furthermore, pieces of cephalopod regurgitated by adult
Eastern Rockhopper Penguins, but too large for chicks to swallow were commonly found
spilled around nests in 2012, but not in 2011 (K.W.M. pers obs).
In other marine predators the assumed positive relationship between δ15N values and
diet quality as measured by body mass or condition is no more certain. The nutritional
condition of striped dolphins (Stenella coeruleoalba) was unrelated to δ15N values (Gomez-
75
Campos et al. 2011). In Cassin’s Auklets (Ptychoramphus aleuticus) pre-breeding δ15N values
were not related to body condition of adult females measured 1–2 days after laying (Sorensen
et al. 2009). Instead, female Cassin’s Auklets with a less fish-based diet laid earlier and laid
larger eggs (Sorensen et al. 2009). In three Arctic-breeding seabirds, two showed a positive
effect of δ15N values on body mass, but only in one of two tissue types sampled (Moody et al.
2012). Similarly to our findings, Cruz et al. (2012) found that Blue-footed Booby (Sula nebouxii)
chicks with higher δ15N values had poorer body condition. Likewise, a higher trophic level diet
was associated with lower body condition in adult female Marbled Murrelets (Brachyramphus
marmoratus; Janssen et al. 2009), and a slower growth rate in South American sea lion (Otaria
flavescens) pups (Drago et al. 2010). The lack of a consistent positive relationship (and more
often a negative relationship) between δ15N values and diet quality challenges the conclusions
of retrospective isotopic studies of threatened seabirds which assume a positive relationship
exists (Hilton et al. 2006; Norris et al. 2007; Wiley et al. 2013). We suggest that population
declines of marine predators should not be attributed to a historic shift to a lower trophic
level, lower quality diet without first demonstrating that a lower trophic level diet is actually of
lower quality over multiple years in the species of interest. A shift to lower trophic level prey, if
accompanied by an increase in abundance or availability, can instead reflect an improvement
in diet quality, as demonstrated by population increases in Antarctic penguin species that
shifted from a fish-based diet to exploit the ‘krill surplus’ (Croxall et al. 1992; Emslie and
Patterson 2007).
Hilton et al. (2006) hypothesized that Rockhopper Penguins formerly had a more fish-
based diet, and that this higher quality diet supported the much larger populations that
existed prior to widespread population decreases in the 20th century (Cunningham and Moors
1994; Pütz et al. 2003; Cuthbert et al. 2009). However, Hilton et al. (2006) did not find a
consistent shift to lower trophic level prey in the isotopic signatures of Rockhopper Penguin
feathers dating back into the 19th century from seven breeding sites. They instead showed that
the primary productivity of the Southern Ocean had declined as SST increased. A similar study
in the southern Indian Ocean of seven penguin species also suggested a constant dietary
trophic level through the 20th century, but a decrease in primary productivity coincident with a
climate regime shift in the 1970s and penguin population declines in sub-Antarctic and sub-
tropical regions (Jaeger and Cherel 2011). These results agree with the current study in
identifying abundant, low trophic level zooplankton prey as the main component of a high
quality diet important to the maintenance of stable Rockhopper Penguin populations.
76
ACKNOWLEDGEMENTS
Our thanks to the two anonymous reviewers of this manuscript for constructive comments. P.
Battley, D. Armstrong, P. Sagar, and S. Jamieson provided helpful comments and discussion.
Thanks to J. Brown for conducting the SIA. Our methods were approved by the Massey
University Animal Ethics Committee, protocol no. 10/90. K.W.M. is grateful to Massey
University, the Natural Sciences and Engineering Research Council of Canada, and Education
New Zealand for financial support. This work was supported by the New Zealand Ministry of
Business, Innovation, and Employment (contract C01X0905 to the National Institute for Water
and Atmospheric Research). Additional research funding was generously provided by the J.S.
Watson Conservation Trust of the Royal Forest and Bird Protection Society of New Zealand, the
Hutton Fund of The Royal Society of New Zealand, and the Penguin Fund of Japan. We are
grateful to S. Cockburn at the New Zealand Department of Conservation, National Office for
providing RFID data loggers. Thank you to the Department of Conservation, Southland
Conservancy for supporting our research on Campbell Island, and to H. Haazen and the crew of
RV ‘Tiama’ for safe transport. This research would not have been possible without the skillful
penguin-wrangling of N. Morrison, R. Buchheit, and R. Dunn.
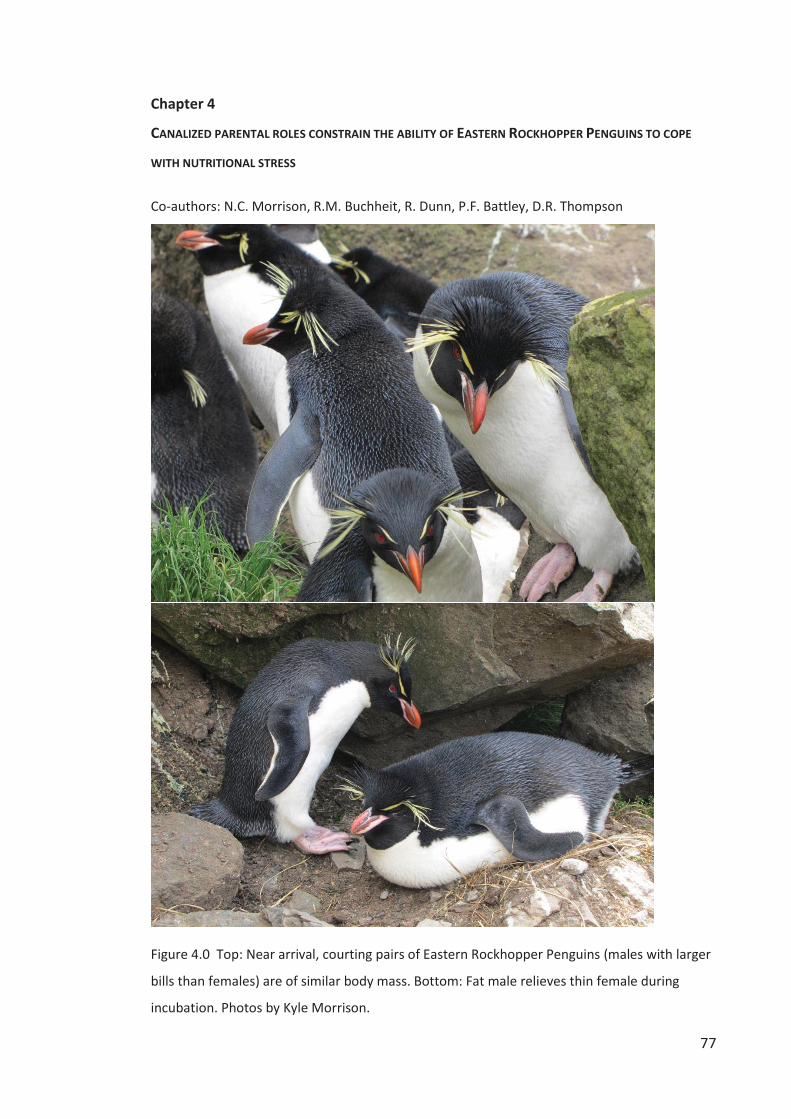
77
Chapter 4
CANALIZED PARENTAL ROLES CONSTRAIN THE ABILITY OF EASTERN ROCKHOPPER PENGUINS TO COPE
WITH NUTRITIONAL STRESS
Co-authors: N.C. Morrison, R.M. Buchheit, R. Dunn, P.F. Battley, D.R. Thompson
Figure 4.0 Top: Near arrival, courting pairs of Eastern Rockhopper Penguins (males with larger
bills than females) are of similar body mass. Bottom: Fat male relieves thin female during
incubation. Photos by Kyle Morrison.
78
ABSTRACT
Behavioural plasticity may allow organisms to respond adaptively to environmental variability
caused by climate change, facilitating population persistence. Sexes may divide parental roles,
and there may or may not be plasticity in this division. Poor food availability or quality can
induce nutritional stress that increases costs of parental care. However, the effect of
nutritional stress on sex-specific parental investment and offspring fitness have rarely been
investigated in species that divide parental roles. We examined chick-provisioning rates of
transponder-tagged female and male Eastern Rockhopper Penguins (Eudyptes chrysocome
filholi) using an automated gateway on Campbell Island, New Zealand in a year of good diet
quality and a poor year of nutritional stress. All seven species of Eudyptes penguins are unique
among penguins in exhibiting canalized parental roles during the first 3–4 weeks of chick-
rearing; males fast while guarding chicks provisioned exclusively by females. Each species is
also ‘Vulnerable’ or ‘Endangered’, generally because of long-term population declines linked to
climate-induced nutritional stress. We found that chick growth was strongly positively
correlated with total provisioning rate. Both sexes made longer foraging trips and provisioned
less often under nutritional stress, but males decreased their investment in chick-provisioning
much more than females by making extra-long self-feeding trips early in the crèche period. We
show that Eudyptes chicks would be fed more often if the sexes shared all chick-provisioning,
especially under nutritional stress. We conclude that the canalized division of labour strategy
of Eudyptes penguins may limit chick growth and survival to recruitment under nutritional
stress. Our identification of this previously unappreciated consequence of the breeding
ecology of Eudyptes penguins is important for predicting future population dynamics in a
changing marine environment.
INTRODUCTION
The consequences of ongoing climate change, including warmer temperatures, increased
climate variability, and more frequent extreme events, are challenging organisms the world
over to respond adaptively (Timmermann et al. 1999; Walther et al. 2002; Parmesan 2006).
The behavioural, physiological, and life-history responses that will maintain the fitness of
individuals and result in population persistence require phenotypic plasticity: the expression of
different phenotypes under varying environmental conditions (Stearns 1989; Nussey et al.
2007). Much recent research has considered plasticity of phenology in relation to climate
change, especially whether species are advancing their timing of breeding to match earlier
79
peaks in food availability (Edwards and Richardson 2004; Both et al. 2009; Dunn and Moller
2014). Less studied is behavioural plasticity in reproductive investment in response to adverse
environmental conditions, especially in species in which sex-specific parental roles may
constrain plasticity.
Division of labour (DOL) in parental care occurs in species in which one or more
parental task (e.g., feeding, brooding, or defence) is not equally shared between males and
females. DOL evolves when it results in synergistic (non-additive) fitness benefits of biparental
care to offspring, or when the fitness benefit of providing a particular care type is unequal
between the sexes (Barta et al. 2014). For example, male-biased sexual size dimorphism may
favour males specialising in offspring defence if males are more successful at defence than
females or stand more to gain through benefits such as nest site retention (Paredes and Insley
2010). Thus, DOL may represent a trade-off between offspring provisioning and defence. More
equitable parental care may result in higher chick growth than in a DOL scenario, but lower
chick survival (Ashbrook et al. 2008).
In long-lived top predators, much of the variation in reproductive success among years
is driven by prey availability or quality (Hedd et al. 2006; Tierney et al. 2009; Wolf et al. 2009).
In ‘poor’ food years, parents may be unable to obtain sufficient food energy to meet the needs
of their offspring and for their own self-maintenance, resulting in adults in poor body
condition, low offspring survival, or low juvenile survival of offspring in poor condition at
independence (Reilly and Cullen 1982; Horswill et al. 2014). Individuals obtaining inadequate
food to meet their energetic requirements for breeding and self-maintenance are experiencing
nutritional stress (Kitaysky et al. 2010; Franci et al. 2015). We did not measure individuals’
stress hormone levels to quantify nutritional stress in a physiological sense, but had previously
defined a year of nutritional stress as having lower reproductive success, and lower chick and
adult body masses (Chapter 3). Years of nutritional stress are further characterized by parents
buffering their own survival probability by increasing time spent self-feeding, shortening time
spent brood guarding, lowering provisioning rates, and delivering smaller meals (Trites and
Donnelly 2003; Busser et al. 2004). Life-history theory predicts that long-lived species should
be the most prudent parents – most reluctant to invest heavily in current reproduction
because of their potential to have a long, productive future (Drent and Daan 1980).
Nevertheless, seabirds that experience severe nutritional stress during breeding can have a
lower probability of surviving (Kitaysky et al. 2010). Therefore, nutritional stress can reduce
seabird population growth rates through both low reproductive success and low adult survival
(Kitaysky et al. 2007; 2010). Improving our poor understanding of the behavioural plasticity of
80
long-lived, prudent parents with sex-specific roles requires detailed investigations into
reproductive investment and output in years with and without nutritional stress.
Eudyptes penguins are excellent subjects to examine behavioural plasticity in response
to nutritional stress. They are relatively small-bodied, but long-lived and have an especially
slow life-history strategy relative to other 2-egg clutch penguin species, including a late age at
first breeding and low annual fecundity (Stein and Williams 2013), traits suggesting selection
for prudence in reproductive investment. Long generation times also slow microevolution,
hindering the ability of long-lived species to adapt to rapid environmental change (Visser 2008;
Forcada and Trathan 2009). Eudyptes penguins are unique among penguins in their canalized
DOL during the guard phase that occurs over the first third of the chick-rearing period: males
fast at nest sites while guarding chicks and females are solely responsible for chick-
provisioning and make near-daily foraging trips. These dichotomous parental care phenotypes
are called “canalized” because they do not vary with environmental conditions (Waddington
1942; Debat and David 2001). Opportunities for additional matings select for DOL in many
species. For example, in many shorebird species females abandon brood care to males not
long after hatching, often to seek a second mate (Jonsson and Alerstam 1990; Jamieson 2012).
In contrast, Eudyptes penguins lay synchronously, and do not relay or double-clutch, so that
any opportunity for additional parentage is restricted to males early in the incubation stage
(Warham 1975). Hypotheses surrounding the evolution of the unique DOL of Eudyptes
penguins, and investigations of its consequences for parental investment and reproductive
fitness are notably lacking, despite the remarkable demands these inflexible roles place on
each sex.
The breeding strategy of Eudyptes penguins is also exceptional in its extreme fasts,
notwithstanding the lengthy periods ashore of the much larger-bodied Aptenoydes penguins.
Typical courtship/incubation fasts of penguins outside of Eudyptes and Aptenoydes are one or
a few days, 20–35 days in Chinstrap (Pygoscelis antarctica) and Adélie (P. adeliae) penguins,
but 35–49 days in Eudyptes (Williams 1995; Croxall and Davis 1999; Hull et al. 2004; Chapter
3). Male Eudyptes penguins also make an incubation/guard fast of 23–35 days, whereas all
other penguin species avoid a long male guard stage fast by alternating brooding and chick-
provisioning duties between the sexes about daily or at 4–12 day intervals in Aptenoydes
penguins (Williams 1995; Descamps et al. 2002). Often male Eudyptes penguins do not begin
chick-provisioning at the start of the crèche stage, but make an extended multi-day trip to
regain body mass. Female Eudyptes penguins may also make long trips in the crèche stage,
apparently to recover mass lost while regularly provisioning chicks through the guard phase
81
(Tremblay and Cherel 2005). Hence, DOL appears to limit the provisioning rates Eudyptes
penguins provide chicks, particularly from males, hypothetically reducing potential
reproductive fitness.
Eudyptes penguins are the largest penguin genus by number of species, have the
largest geographic range, and may be the largest by number of individuals (BirdLife
International 2014). Eudyptes is also the only multi-species penguin genus in which all species
are threatened by extinction (IUCN threat statuses of ‘Vulnerable’ or ‘Endangered’; BirdLife
International 2014). The leading hypothesis explaining widespread dramatic population
declines in recent decades in most species of Eudyptes is a climate-induced reduction in prey
availability/quality causing nutritional stress and low demographic rates (Crawford et al. 2006;
BirdLife International 2010; Hiscock and Chilvers 2014; Morrison et al. 2015 – hereafter
'Chapter 2'; Trathan et al. 2014), although competition with pinnipeds and predation by
introduced mammals and growing pinniped populations may be important at some sites
(Trathan et al. 2012; Chapter 5; Mattern 2013b). Penguins require sufficient body reserves to
endure and recover from prolonged stages of fasting (Green et al. 2007). If penguins reach a
minimum threshold body condition they will reduce parental investment or abandon breeding
(Robin et al. 2001). Thus, nutritional stress is likely to lower reproductive success and the
subsequent survival of chicks fledging in poor condition (Dann et al. 2000; Horswill et al. 2014).
Investigating how the DOL of Eudyptes penguins is affected by nutritional stress may explain
the genus’ apparent susceptibility to environmental variability. Furthermore, a better
understanding of how Eudyptes’ breeding strategy interacts with prey abundance/availability
and demographic performance may improve predictability of future population trends in a
changing marine environment.
We examined the effects of nutritional stress on the chick-provisioning behaviour of
female and male Eastern Rockhopper Penguins and their chick’s growth in contrasting
breeding seasons of high (2011) and low (2012) diet quality (Chapter 3). In the year of low diet
quality both sexes made longer incubation foraging trips, but returned at lower masses, and a
higher trophic level diet resulted in chicks of lower body mass at the end of the guard phase
(Chapter 3), suggesting that in 2012 nutritional stress is likely to have altered parents’
reproductive investment. We addressed the following questions:
1) Were there inter-annual or sex-differences in the timing or duration of chick-provisioning
trips, or the proportion of individuals that made a long trip (≥ 4 nights at sea)?
2) Is female, male, or total provisioning frequency related to chick mass at 30–31 d old?
82
3) Are female provisioning rates correlated with arrival mass, arrival date, or their mate’s
provisioning rate? – i.e., do females compensate for males that make a long trip?
4) Under a hypothetical scenario without DOL, would chicks receive a greater total number of
feeds throughout chick-rearing?
MATERIALS AND METHODS
Study site
We studied Eastern Rockhopper Penguin adult provisioning rates and chick size in the East and
West sub-colonies in Penguin Bay, Campbell Island (52° 32ʹ 12ʺ S, 169° 2ʹ 10ʺ E) in two seasons,
2011–2012 and 2012–2013 (hereafter referred to by the year in which the seasons began).
Breeding chronology for 2011 and 2012 is reported in Chapter 3. The East sub-colony
contained 24 and 19 breeding pairs, whereas the West sub-colony consisted of 460 and 452
breeding pairs in 2011 and 2012, respectively (Chapter 2). The Eastern Rockhopper Penguin
population on Campbell Island was estimated at 33,239 breeding pairs in 2012, after
undergoing a dramatic decline of 94.6% since 1942. Periods of decline in the past 70 years
were associated with warmer mean sea-surface temperatures (SSTs) and an increased
frequency of anomalously warm years that are expected to have led to nutritional stress and
low demographic rates (Cunningham and Moors 1994; Chapter 2). While cooler and less
variable SSTs appear to have paused the overall decline since 1996, the Penguin Bay
population has continued to decline, apparently because of high pinniped and avian predation
rates (Chapters 2 and 5). We studied penguins within the East and West sub-colonies because
their reliable use of a narrow travel pathway of c. 200 m length from the sea was conducive to
recording transit times with an automated system.
Data collection
Adult foraging trip durations, provisioning rates, and chick sizes were measured from hatching
in the second and third weeks of December, until our departure from the island when chicks
were c. 36 d old in the third week of January in 2011 and 2012. Trip durations and provisioning
rates were only considered for adults with a chick alive at our departure. We documented
hatching success (nests that hatched an egg / nests that contained an egg), chick success
(chicks alive at our departure / nests that hatched an egg), and overall reproductive success
83
(chicks alive at our departure / nests that contained an egg) using daily nest checks using
binoculars or the naked eye, or at nests where visual checks were insufficient to confirm nest
contents, through c. weekly physical checks involving carefully lifting an incubating bird’s tail.
During courtship or incubation in 2010, 2011, and 2012 almost all adults breeding within study
plots with mapped nest site numbers were individually marked with PIT tags (ISO FDX-B 11 ×
2.1 mm glass-encased transponder; Allflex Australia Pty). Adults were sexed based on their
breeding schedule and bill depth (Warham 1972). PIT tag codes, date, and time (to the minute)
data were recorded by hand at nest sites using an RS320 Stick Reader (Allflex Australia Pty), or
automatically using radio frequency identification (RFID) data loggers and antennae set up
along the penguins’ travel pathway into the study colonies (S. Cockburn, Department of
Conservation, Wellington). In 2011 penguins’ direction of travel was determined by the order
they were recorded by two data loggers spaced apart by > 1 min travel time along the
pathway. In 2012 we again used two data loggers, but one was a dual logger that used two
antennae to independently record direction of travel. When direction of travel was not
recorded (a bird was logged by only one antenna), all morning records (00:00–12:00) were
assumed to be departures, and evening records (12:00–24:00) were assumed to be returns,
because morning returns were very rare.
We categorized trips as ‘day trips’, where a bird departed and returned on the same
day, and multi-day trips as ‘short trips’ of one to three nights at sea, or ‘long trips’ of ≥ 4 nights
at sea, after Tremblay and Cherel (2005). On the odd occasion where a penguin departed and
returned from two trips on the same day, these trips were considered as independent day
trips. We discounted intervals between departures and returns of < 1 h duration, as these
were unlikely to represent foraging trips. Short trips were only recorded when either the
departing or return direction of travel was known in order to reduce assignment of multi-day
trips to birds making day trips but being logged poorly. We did not subtract “travel time”
ashore before passing through an antennae from the length of provisioning trips, because
travel time appeared to vary greatly from c. 5 min to c. 2 h depending on the presence of
Northern Giant Petrels (Macronectes halli) waiting to ambush penguins along the pathway and
to scavenge penguins skilled by New Zealand sea lions (Phocarctos hookeri) just off-shore
(K.W.M. pers. obs., Chapter 5). Similarly, time at sea was sometimes extended by 1–2 h as rafts
of penguins were delayed from landing by sea lions hunting along the shoreline. Although we
lack the data to account for these delays, predation rates by sea lions were not higher in the
year of nutritional stress for penguins (Chapter 5), so that delays were unlikely to have
influenced our results.
84
To determine provisioning rates adults were recorded as having made a provisioning
trip on every date they were logged between their chick’s hatch date and up to and including
the day before their chick’s measurement date, while accounting for multiple trips in a day and
the departure date of trips lasting multiple days. Individual behaviour at the gateway or PIT-tag
orientation meant that some adults had low logging rates. Logging rate was the total number
of times a bird was recorded by an antennae (minus records beyond the expected two per
transit in 2011 and three per transit in 2012) divided by the bird’s number of trips. Nests in
which either parent had a logging rate < 2.1 logs/trip were excluded from analyses involving
provisioning rate. This was the minimum logging rate at which logs/trip was no longer
significantly positively related to trips/day within each sex and year, giving us confidence that a
low trips/day reflected a low provisioning rate rather than being an artefact of a low logging
rate.
The PIT-tag gateway recorded the date of colony arrival of PIT-tagged females in 2011
and 2012. In 2012 the arrival body mass of females was measured < 24 h after arrival. We
monitored the reproductive success of 116 and 125 nests where eggs were laid in 2011 and
2012, respectively. One or both parents were PIT-tagged at all nests. Nests were checked daily
in 2011 and 2012 to establish hatch dates. In both years chicks were PIT-tagged at 18 d and
marked with blue water-soluble paint to enable their identification as they gained mobility
prior to crèching around 24 d. Chick mass, bill length, and flipper length were measured at 30
or 31 d old in 2011 and 2012. We considered only solo-raised chicks by excluding nests with
two chicks beyond six day old. We measured chicks in the afternoon while adults were usually
away foraging to limit the effect of time-since-feeding on chick mass. We measured body mass
using a 1 kg (± 10 g), 2.5 kg (± 20 g), or 5.0 kg (± 50 g) spring scale, flipper length with a ruler (±
1 mm), and bill length with Vernier calipers (± 0.05 mm).
Data analysis
Transit times and trip durations are derived in 2011 from: 1284 day trips and 65 short trips by
69 females, seven long trips by 61 females, 312 day trips and 13 short trips by 60 males, and 37
long trips by 58 males; 2012: 371 day trips, and 189 short trips, and eight long trips by 41
females, 42 day trips and 10 short trips by 23 males, and 35 long trips by 40 males. Differences
in sample sizes between and within sex-year groups resulted from the exclusion of some
individuals with poor logging rates (< 2.1 logs/trip), and because some individuals were not
recorded making a short or day trip, but did make a long trip. Nests with chick size
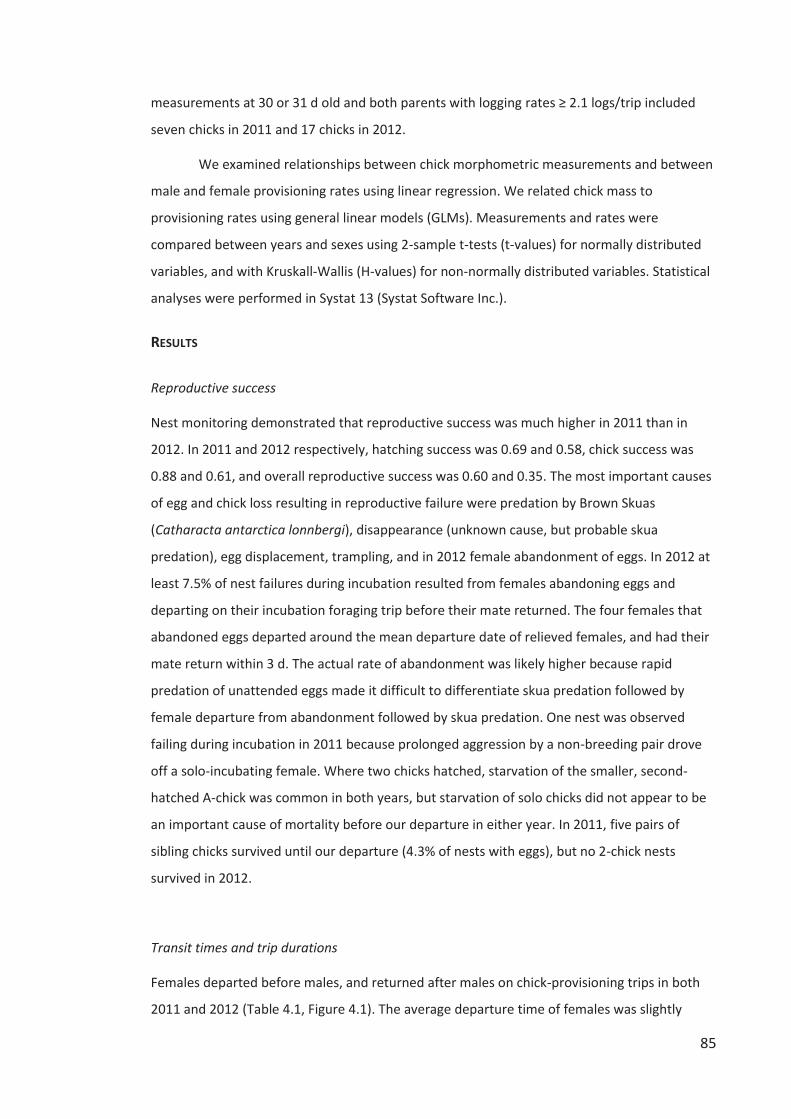
85
measurements at 30 or 31 d old and both parents with logging rates ≥ 2.1 logs/trip included
seven chicks in 2011 and 17 chicks in 2012.
We examined relationships between chick morphometric measurements and between
male and female provisioning rates using linear regression. We related chick mass to
provisioning rates using general linear models (GLMs). Measurements and rates were
compared between years and sexes using 2-sample t-tests (t-values) for normally distributed
variables, and with Kruskall-Wallis (H-values) for non-normally distributed variables. Statistical
analyses were performed in Systat 13 (Systat Software Inc.).
RESULTS
Reproductive success
Nest monitoring demonstrated that reproductive success was much higher in 2011 than in
2012. In 2011 and 2012 respectively, hatching success was 0.69 and 0.58, chick success was
0.88 and 0.61, and overall reproductive success was 0.60 and 0.35. The most important causes
of egg and chick loss resulting in reproductive failure were predation by Brown Skuas
(Catharacta antarctica lonnbergi), disappearance (unknown cause, but probable skua
predation), egg displacement, trampling, and in 2012 female abandonment of eggs. In 2012 at
least 7.5% of nest failures during incubation resulted from females abandoning eggs and
departing on their incubation foraging trip before their mate returned. The four females that
abandoned eggs departed around the mean departure date of relieved females, and had their
mate return within 3 d. The actual rate of abandonment was likely higher because rapid
predation of unattended eggs made it difficult to differentiate skua predation followed by
female departure from abandonment followed by skua predation. One nest was observed
failing during incubation in 2011 because prolonged aggression by a non-breeding pair drove
off a solo-incubating female. Where two chicks hatched, starvation of the smaller, second-
hatched A-chick was common in both years, but starvation of solo chicks did not appear to be
an important cause of mortality before our departure in either year. In 2011, five pairs of
sibling chicks survived until our departure (4.3% of nests with eggs), but no 2-chick nests
survived in 2012.
Transit times and trip durations
Females departed before males, and returned after males on chick-provisioning trips in both
2011 and 2012 (Table 4.1, Figure 4.1). The average departure time of females was slightly
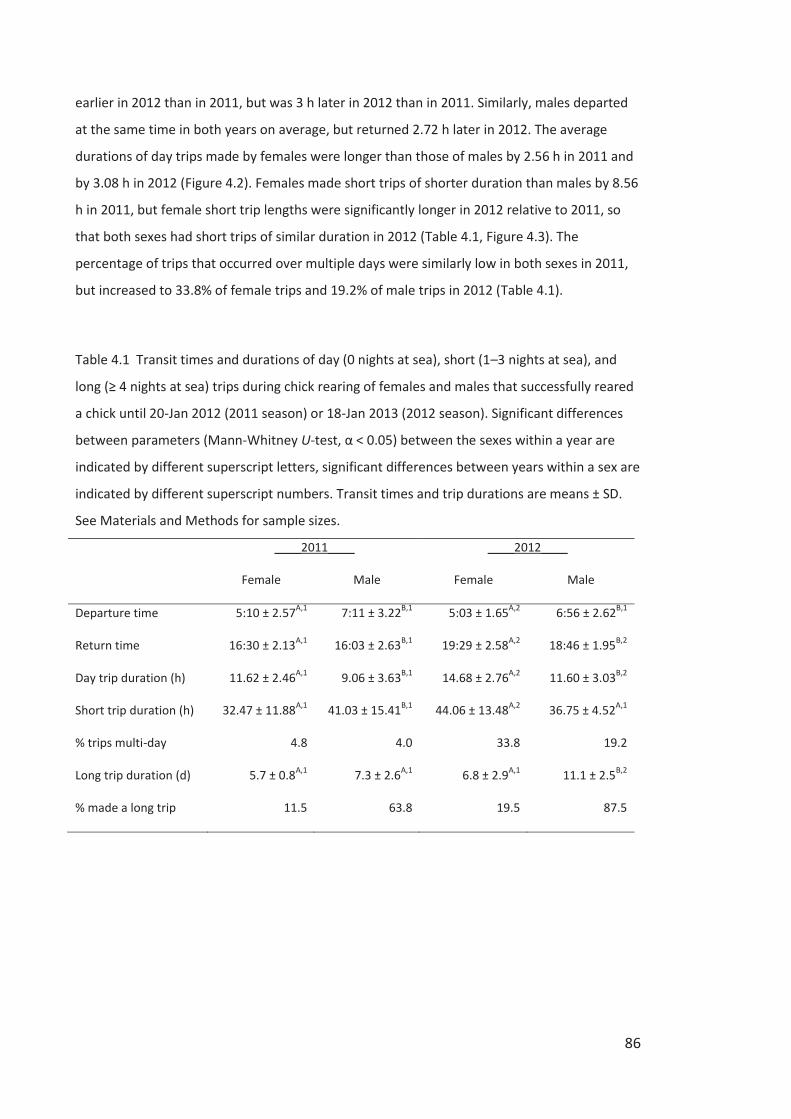
86
earlier in 2012 than in 2011, but was 3 h later in 2012 than in 2011. Similarly, males departed
at the same time in both years on average, but returned 2.72 h later in 2012. The average
durations of day trips made by females were longer than those of males by 2.56 h in 2011 and
by 3.08 h in 2012 (Figure 4.2). Females made short trips of shorter duration than males by 8.56
h in 2011, but female short trip lengths were significantly longer in 2012 relative to 2011, so
that both sexes had short trips of similar duration in 2012 (Table 4.1, Figure 4.3). The
percentage of trips that occurred over multiple days were similarly low in both sexes in 2011,
but increased to 33.8% of female trips and 19.2% of male trips in 2012 (Table 4.1).
Table 4.1 Transit times and durations of day (0 nights at sea), short (1–3 nights at sea), and
long (≥ 4 nights at sea) trips during chick rearing of females and males that successfully reared
a chick until 20-Jan 2012 (2011 season) or 18-Jan 2013 (2012 season). Significant differences
between parameters (Mann-Whitney U-test, α < 0.05) between the sexes within a year are
indicated by different superscript letters, significant differences between years within a sex are
indicated by different superscript numbers. Transit times and trip durations are means ± SD.
See Materials and Methods for sample sizes.
____2011____ ____2012____
Female Male Female Male
Departure time 5:10 ± 2.57A,1 7:11 ± 3.22B,1 5:03 ± 1.65A,2 6:56 ± 2.62B,1
Return time 16:30 ± 2.13A,1 16:03 ± 2.63B,1 19:29 ± 2.58A,2 18:46 ± 1.95B,2
Day trip duration (h) 11.62 ± 2.46A,1 9.06 ± 3.63B,1 14.68 ± 2.76A,2 11.60 ± 3.03B,2
Short trip duration (h) 32.47 ± 11.88A,1 41.03 ± 15.41B,1 44.06 ± 13.48A,2 36.75 ± 4.52A,1
% trips multi-day 4.8 4.0 33.8 19.2
Long trip duration (d) 5.7 ± 0.8A,1 7.3 ± 2.6A,1 6.8 ± 2.9A,1 11.1 ± 2.5B,2
% made a long trip 11.5 63.8 19.5 87.5
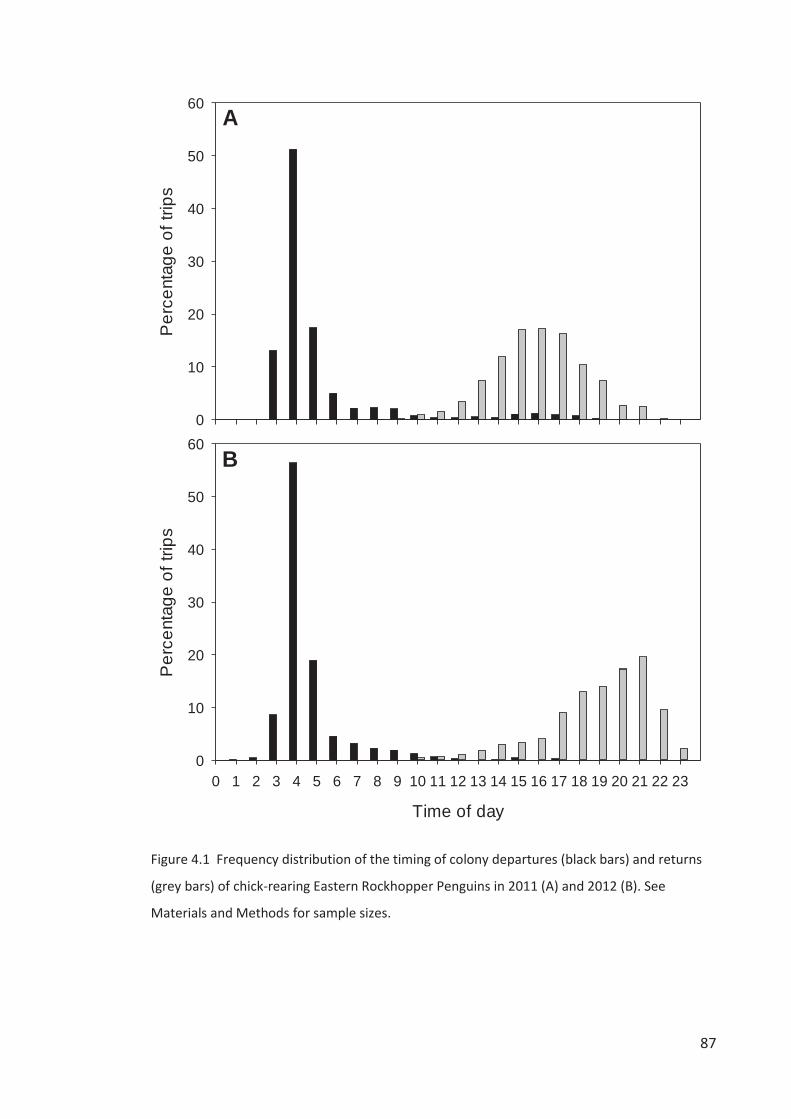
87
Per
cent
age
of tr
ips
0
10
20
30
40
50
60
Time of day
0 1 2 3 4 5 6 7 8 9 10 11 12 13 14 15 16 17 18 19 20 21 22 23
Per
cent
age
of tr
ips
0
10
20
30
40
50
60
A
B
Figure 4.1 Frequency distribution of the timing of colony departures (black bars) and returns
(grey bars) of chick-rearing Eastern Rockhopper Penguins in 2011 (A) and 2012 (B). See
Materials and Methods for sample sizes.
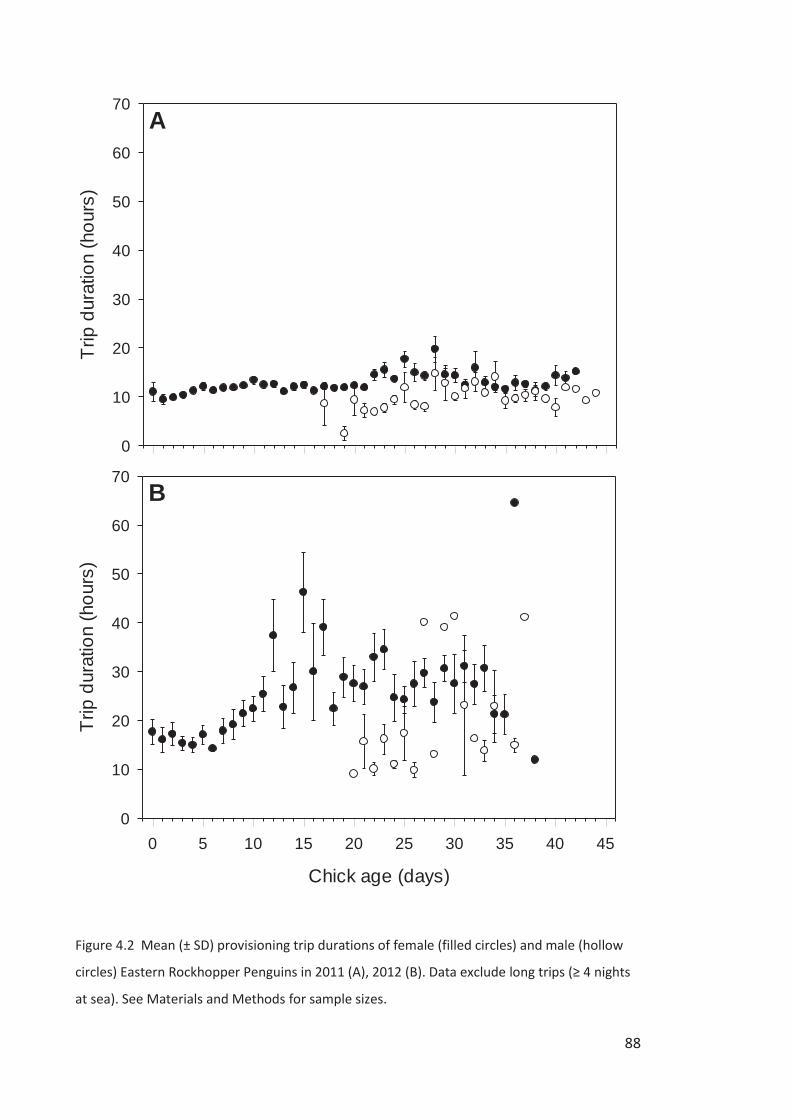
88
Chick age (days)
0 5 10 15 20 25 30 35 40 45
Trip
dur
atio
n (h
ours
)
0
10
20
30
40
50
60
70
Trip
dur
atio
n (h
ours
)
0
10
20
30
40
50
60
70A
B
Figure 4.2 Mean (± SD) provisioning trip durations of female (filled circles) and male (hollow
circles) Eastern Rockhopper Penguins in 2011 (A), 2012 (B). Data exclude long trips (≥ 4 nights
at sea). See Materials and Methods for sample sizes.
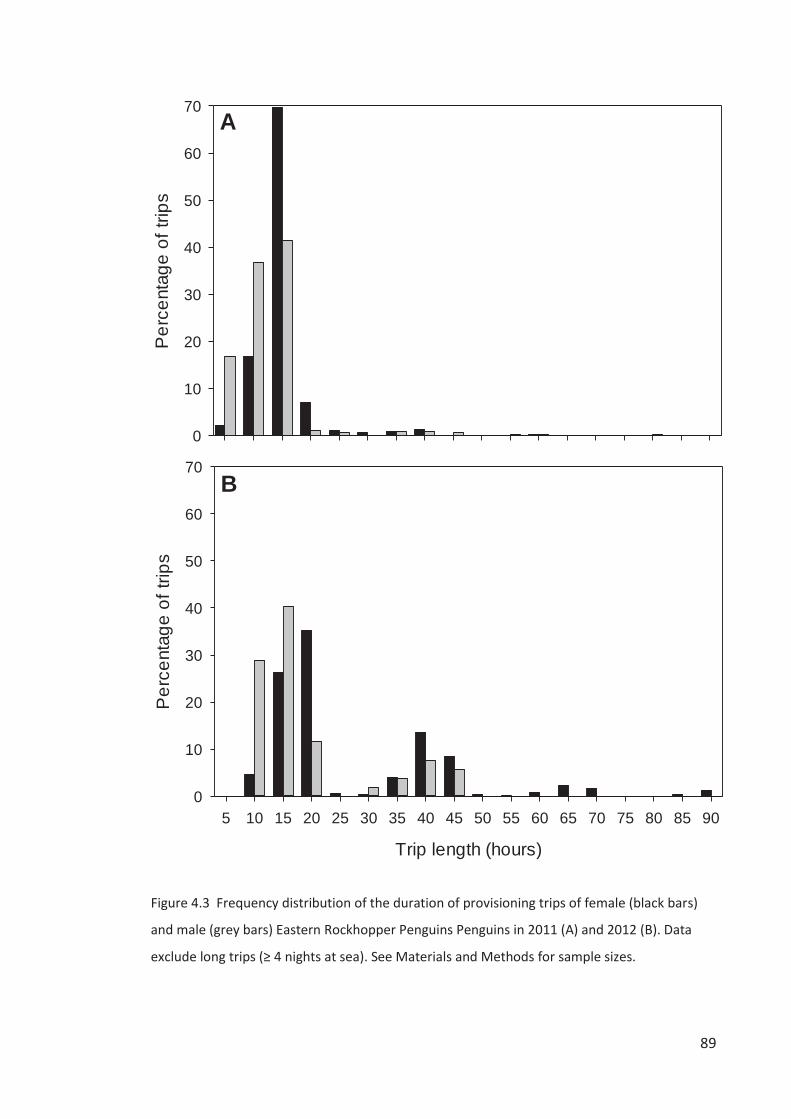
89
Per
cent
age
of tr
ips
0
10
20
30
40
50
60
70
Trip length (hours)
5 10 15 20 25 30 35 40 45 50 55 60 65 70 75 80 85 90
Per
cent
age
of tr
ips
0
10
20
30
40
50
60
70
A
B
Figure 4.3 Frequency distribution of the duration of provisioning trips of female (black bars)
and male (grey bars) Eastern Rockhopper Penguins Penguins in 2011 (A) and 2012 (B). Data
exclude long trips (≥ 4 nights at sea). See Materials and Methods for sample sizes.
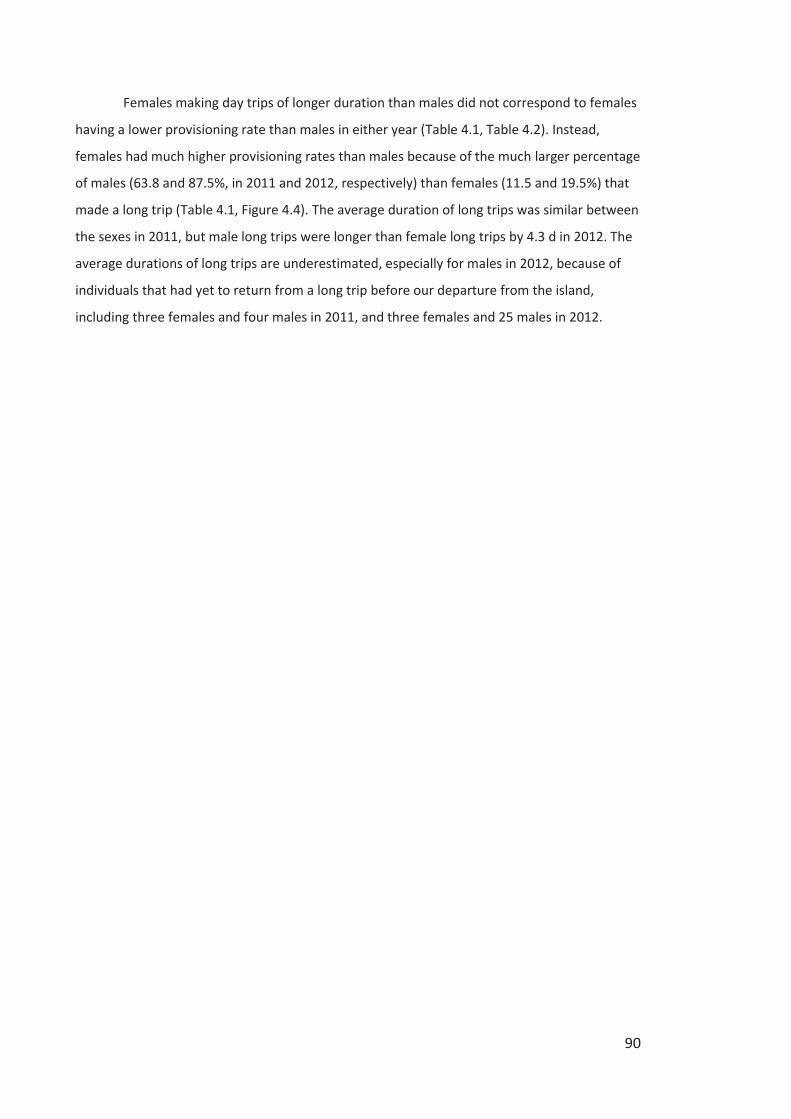
90
Females making day trips of longer duration than males did not correspond to females
having a lower provisioning rate than males in either year (Table 4.1, Table 4.2). Instead,
females had much higher provisioning rates than males because of the much larger percentage
of males (63.8 and 87.5%, in 2011 and 2012, respectively) than females (11.5 and 19.5%) that
made a long trip (Table 4.1, Figure 4.4). The average duration of long trips was similar between
the sexes in 2011, but male long trips were longer than female long trips by 4.3 d in 2012. The
average durations of long trips are underestimated, especially for males in 2012, because of
individuals that had yet to return from a long trip before our departure from the island,
including three females and four males in 2011, and three females and 25 males in 2012.
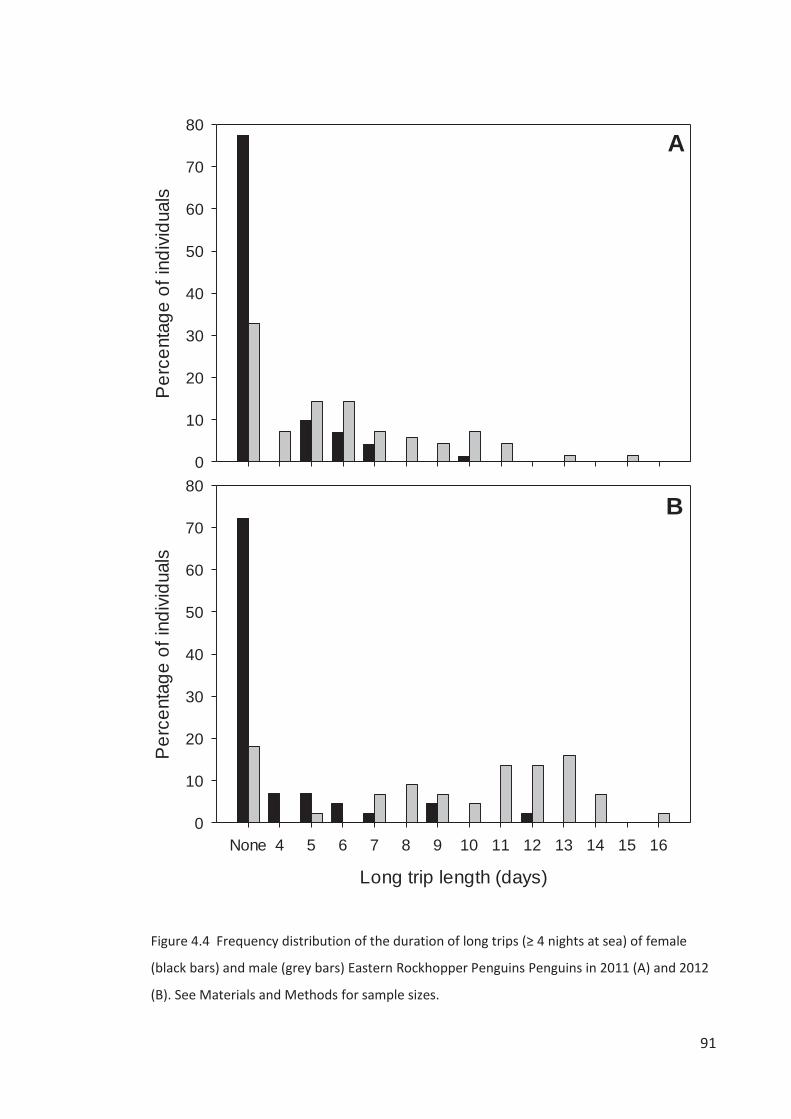
91
Per
cent
age
of in
divi
dual
s
0
10
20
30
40
50
60
70
80
Long trip length (days)
None 4 5 6 7 8 9 10 11 12 13 14 15 16
Per
cent
age
of in
divi
dual
s
0
10
20
30
40
50
60
70
80
A
B
Figure 4.4 Frequency distribution of the duration of long trips (≥ 4 nights at sea) of female
(black bars) and male (grey bars) Eastern Rockhopper Penguins Penguins in 2011 (A) and 2012
(B). See Materials and Methods for sample sizes.
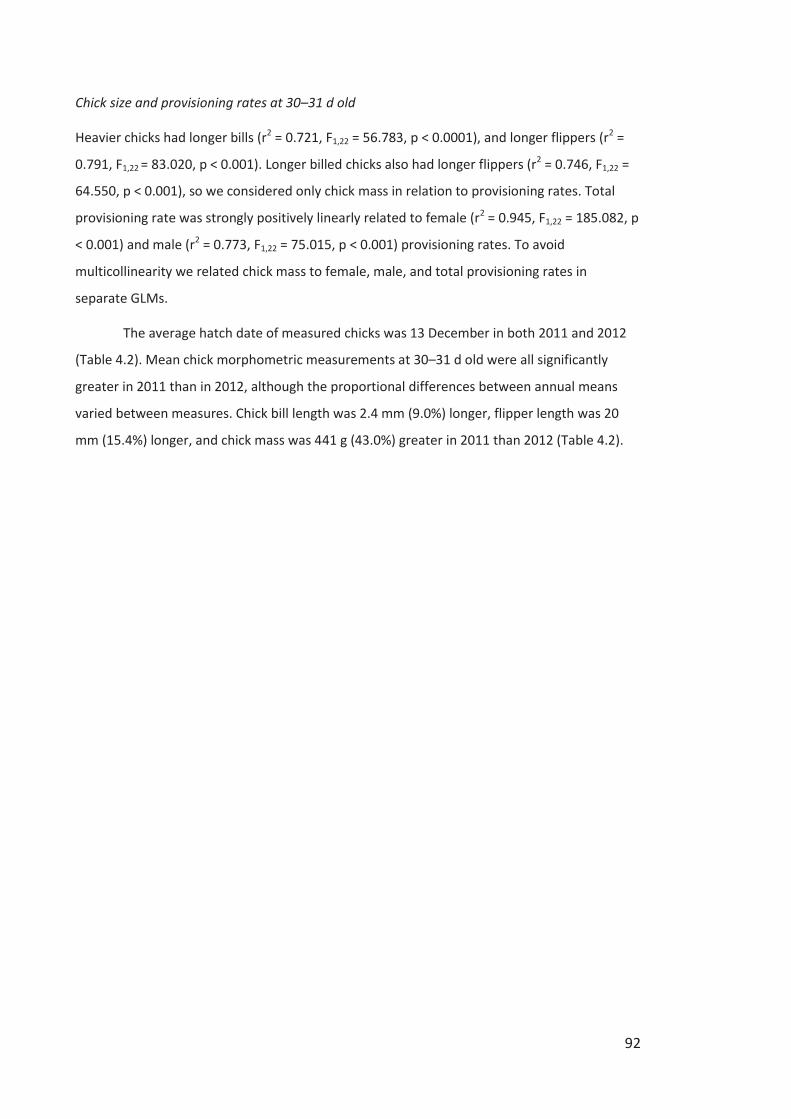
92
Chick size and provisioning rates at 30–31 d old
Heavier chicks had longer bills (r2 = 0.721, F1,22 = 56.783, p < 0.0001), and longer flippers (r2 =
0.791, F1,22 = 83.020, p < 0.001). Longer billed chicks also had longer flippers (r2 = 0.746, F1,22 =
64.550, p < 0.001), so we considered only chick mass in relation to provisioning rates. Total
provisioning rate was strongly positively linearly related to female (r2 = 0.945, F1,22 = 185.082, p
< 0.001) and male (r2 = 0.773, F1,22 = 75.015, p < 0.001) provisioning rates. To avoid
multicollinearity we related chick mass to female, male, and total provisioning rates in
separate GLMs.
The average hatch date of measured chicks was 13 December in both 2011 and 2012
(Table 4.2). Mean chick morphometric measurements at 30–31 d old were all significantly
greater in 2011 than in 2012, although the proportional differences between annual means
varied between measures. Chick bill length was 2.4 mm (9.0%) longer, flipper length was 20
mm (15.4%) longer, and chick mass was 441 g (43.0%) greater in 2011 than 2012 (Table 4.2).
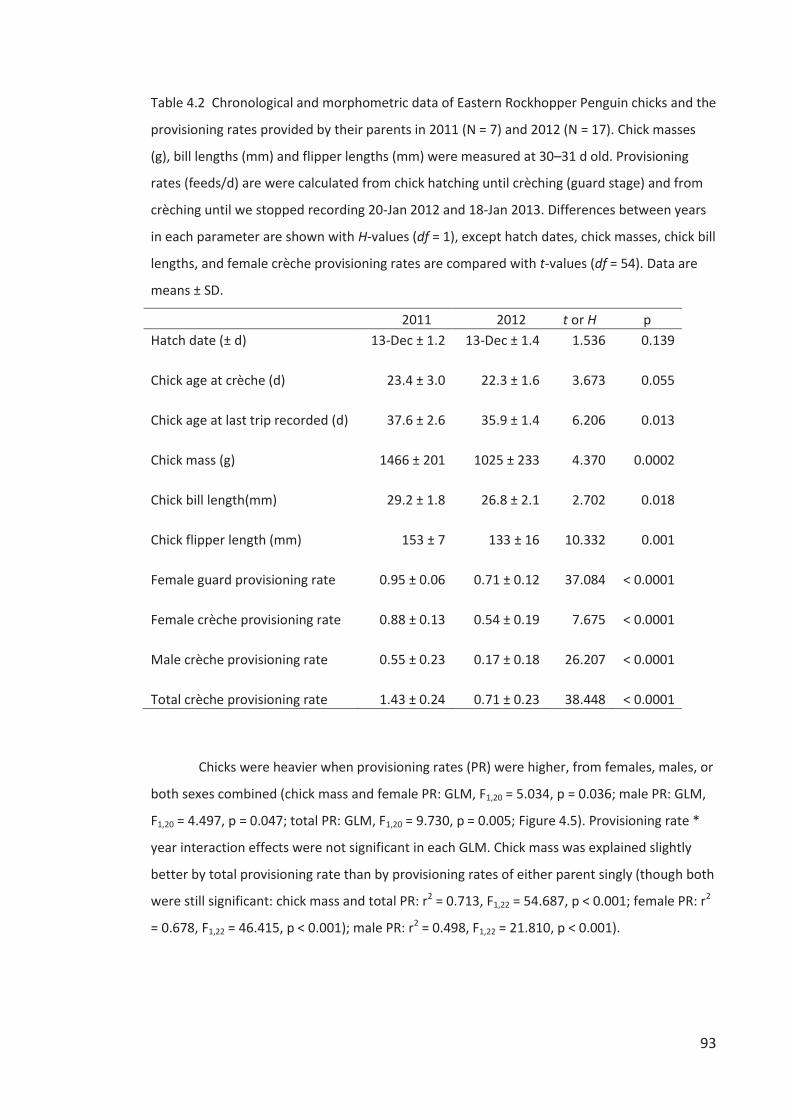
93
Table 4.2 Chronological and morphometric data of Eastern Rockhopper Penguin chicks and the
provisioning rates provided by their parents in 2011 (N = 7) and 2012 (N = 17). Chick masses
(g), bill lengths (mm) and flipper lengths (mm) were measured at 30–31 d old. Provisioning
rates (feeds/d) are were calculated from chick hatching until crèching (guard stage) and from
crèching until we stopped recording 20-Jan 2012 and 18-Jan 2013. Differences between years
in each parameter are shown with H-values (df = 1), except hatch dates, chick masses, chick bill
lengths, and female crèche provisioning rates are compared with t-values (df = 54). Data are
means ± SD.
2011 2012 t or H p Hatch date (± d) 13-Dec ± 1.2 13-Dec ± 1.4 1.536 0.139 Chick age at crèche (d) 23.4 ± 3.0 22.3 ± 1.6 3.673 0.055 Chick age at last trip recorded (d) 37.6 ± 2.6 35.9 ± 1.4 6.206 0.013 Chick mass (g) 1466 ± 201 1025 ± 233 4.370 0.0002 Chick bill length(mm) 29.2 ± 1.8 26.8 ± 2.1 2.702 0.018 Chick flipper length (mm) 153 ± 7 133 ± 16 10.332 0.001 Female guard provisioning rate 0.95 ± 0.06 0.71 ± 0.12 37.084 < 0.0001 Female crèche provisioning rate 0.88 ± 0.13 0.54 ± 0.19 7.675 < 0.0001 Male crèche provisioning rate 0.55 ± 0.23 0.17 ± 0.18 26.207 < 0.0001 Total crèche provisioning rate 1.43 ± 0.24 0.71 ± 0.23 38.448 < 0.0001
Chicks were heavier when provisioning rates (PR) were higher, from females, males, or
both sexes combined (chick mass and female PR: GLM, F1,20 = 5.034, p = 0.036; male PR: GLM,
F1,20 = 4.497, p = 0.047; total PR: GLM, F1,20 = 9.730, p = 0.005; Figure 4.5). Provisioning rate *
year interaction effects were not significant in each GLM. Chick mass was explained slightly
better by total provisioning rate than by provisioning rates of either parent singly (though both
were still significant: chick mass and total PR: r2 = 0.713, F1,22 = 54.687, p < 0.001; female PR: r2
= 0.678, F1,22 = 46.415, p < 0.001); male PR: r2 = 0.498, F1,22 = 21.810, p < 0.001).
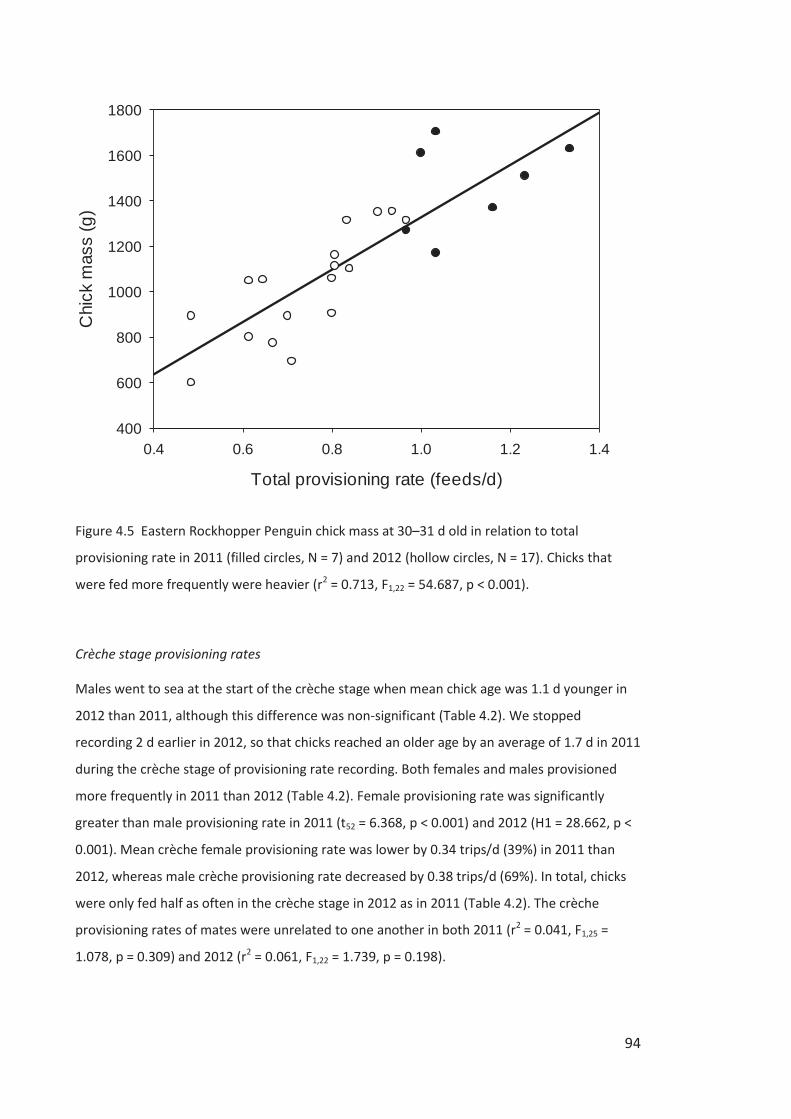
94
Figure 4.5 Eastern Rockhopper Penguin chick mass at 30–31 d old in relation to total
provisioning rate in 2011 (filled circles, N = 7) and 2012 (hollow circles, N = 17). Chicks that
were fed more frequently were heavier (r2 = 0.713, F1,22 = 54.687, p < 0.001).
Crèche stage provisioning rates
Males went to sea at the start of the crèche stage when mean chick age was 1.1 d younger in
2012 than 2011, although this difference was non-significant (Table 4.2). We stopped
recording 2 d earlier in 2012, so that chicks reached an older age by an average of 1.7 d in 2011
during the crèche stage of provisioning rate recording. Both females and males provisioned
more frequently in 2011 than 2012 (Table 4.2). Female provisioning rate was significantly
greater than male provisioning rate in 2011 (t52 = 6.368, p < 0.001) and 2012 (H1 = 28.662, p <
0.001). Mean crèche female provisioning rate was lower by 0.34 trips/d (39%) in 2011 than
2012, whereas male crèche provisioning rate decreased by 0.38 trips/d (69%). In total, chicks
were only fed half as often in the crèche stage in 2012 as in 2011 (Table 4.2). The crèche
provisioning rates of mates were unrelated to one another in both 2011 (r2 = 0.041, F1,25 =
1.078, p = 0.309) and 2012 (r2 = 0.061, F1,22 = 1.739, p = 0.198).
Total provisioning rate (feeds/d)
0.4 0.6 0.8 1.0 1.2 1.4
Chi
ck m
ass
(g)
400
600
800
1000
1200
1400
1600
1800

95
Correlates of female provisioning rate
In 2011 female arrival date was not correlated with provisioning rate during the guard phase
(r2 = 0.004, F1,27 = 0.094, p = 0.761). In contrast, in 2012 females that arrived at the colony at an
earlier date provisioned their chicks more frequently (r2 = 0.407, F1,12 = 8.220, p = 0.014).
Female arrival mass was not correlated with provisioning rate in 2012 (r2 = 0.001, F1,12 = 0.004,
p = 0.952).
DISCUSSION
The chick-provisioning behaviour of Eastern Rockhopper Penguins changed dramatically
between years of high diet quality and low diet quality. As predicted for a long-lived species,
both females and males exhibited a shift from offspring- to self-investment in the year of low
diet quality when their lower body masses, longer incubation and chick-provisioning trips, and
lower chick-provisioning rates suggest they were under nutritional stress (Chapter 3; this
study). The decrease in chick-provisioning rate was greater for males than females because in
the year of nutritional stress most males made an especially long self-feeding trip after their
incubation/guard stage fast. The total provisioning rate that chicks received to 30–31 d old
explained a large proportion (71%) of variation in chick body mass, demonstrating the
importance of investment by both sexes in chick-provisioning. We found that in the year of
nutritional stress females that were heavier at arrival did not provision their chicks more often,
but earlier-arriving females did deliver meals more frequently. We discuss below how the
provisioning behaviour documented in our study compares to that of other Eudyptes penguins,
possible evolutionary pressures leading to the genus’ unique division of labour (DOL) strategy,
and potential consequences for these species’ demographic rates and population dynamics in
an increasingly variable marine environment.
Day and short trip durations
A shift from offspring- to self-investment in years of good (2011) and poor (2012)
quality diet is evident in the trip lengths undertaken by females on Campbell Island. Their
foraging day trips during the guard phase in 2011 (11.62 ± 2.46 h) were similar to those of
chick-provisioning female Eastern Rockhopper Penguins at Kerguelen and Crozet Islands and
Northern Rockhopper Penguins (E. moseleyi) at Amsterdam Island (ranging from 11.2 ± 3.6 h to
13.59 ± 3.5 h; Cherel et al. 1999a; Tremblay and Cherel 2003; Tremblay and Cherel 2005) and
96
to the average duration of all trips by female PIT-tagged Southern Rockhopper Penguins (E. c.
chrysocome) over three years at the Falkland Islands (11.3 ± 0.6 h, 12.3 ± 0.8 h, 11.2 ± 0.8 h;
Ludynia et al. 2012). Over-night trips were also similarly infrequent at Kerguelen, Crozet and
Amsterdam Islands (≤ 11 % of all trips recorded) during the guard phase to at Campbell Island
in 2011 (4.8%). In contrast, females on Campbell Island in 2012 made longer day trips (14.68 ±
2.76 h), and more frequent multi-day trips (33.8%).
Long trip durations
A key consequence of DOL in Eudyptes penguins is that the long incubation/guard fast males
make tends to necessitate a long self-feeding trip early in the crèche period. A higher
proportion of males made a long trip (≥ 4 nights at sea) in the poor year (87.5%) than in the
good year (63.8%). Consequently male provisioning rates were lower in 2012 than in 2011
(0.17 ± 0.18 versus 0.55 ± 0.23 feeds/d). Moreover, the minimum duration of long trips of
males in 2012 were longer on average, by 3.8 d. It appears that males’ long incubation/guard
fast and associated extended recovery trips result in males provisioning chicks less often than
females during the crèche period (Barlow and Croxall 2002; this study). In addition, female
Eudyptes penguins lose mass during the guard stage when they are making near daily
provisioning trips (Tremblay and Cherel 2003), seemingly causing some females to require a
long recovery trip during the crèche stage and lowering their potential provisioning rate. As in
males, the proportion of females making a long trip was higher in the poor year (19.5% versus
11.5%). Females at Kerguelen and Crozet Islands displayed considerable inter-individual
variation by making 0–3 long trips of 5–29 d duration during chick-rearing (Tremblay and
Cherel 2005).
Among other populations of Eudyptes penguins the proportion of either sex making
one or more long trips likely also varies between years and sites, depending on food
availability. Male Southern Rockhopper Penguins at Staten Island tended to make a post-guard
trip averaging 8 ± 3 d in two years of study (Raya Rey et al. 2007). Male Eastern Rockhopper
and Macaroni Penguins (E. chrysolophus) at Marion Island were reported to make post-guard
trips of 10–15 d duration (Williams 1982), but these values may be over-estimates as they
relied upon nest checks rather than an automated system to record departure and return
times. At South Georgia few Macaroni Penguins of either sex made trips > 48 h; such trips
were performed by < 30% of males and females in three years of study (Barlow and Croxall
2002). There was no difference between the sexes in the number of trips > 48 h in duration.
97
However, one male Macaroni Penguin made no provisioning trips, two made a single trip, and
a fourth provisioned its chick only twice, demonstrating that females can successfully raise a
chick with little or no male contribution to chick-provisioning – at least in years and at sites of
sufficient food availability. The relatively abundant food supply near South Georgia, close to
the Antarctic Polar Front, is evident in the shorter chick-rearing period of Macaroni Penguins
breeding there (60 d versus 70 d at the Crozet Islands) and their short pre-moult foraging
period at sea (12–14 d) in comparison to 20–70 days for other populations of Macaroni
Penguins and other Eudyptids breeding at less productive, lower latitude sites (Williams and
Croxall 1991). In the other species of Eudyptes penguins the frequency of occurrence and
length of extended foraging trips has not been studied in detail, although, as in Rockhopper
Penguins, long post-guard trips and low provisioning rates by males early in the crèche period
seem typical (Warham 1974b; Mattern 2013a).
Provisioning rates
Increases in trip durations, particularly by males, resulted in lower provisioning rates in the
poor year. In the good year females fed chicks almost daily during the guard stage (0.95 ± 0.06
feeds per day), as found at Kerguelen and Crozet Islands (0.999 ± 0.14 and 0.99 ± 0.08 feeds
per day, respectively; Tremblay and Cherel 2005). We found that the female provisioning rate
remained high early in the crèche stage (0.88 ± 0.13 feeds per day, recorded from c. 23-37 d of
age), but may have decreased later, as at the Kerguelen and Crozet Islands (0.76 ± 0.21 and
0.41 ± 0.08 feeds per day, respectively, recorded from 30–60 d of age). The long foraging trip
durations of Southern Rockhopper Penguins at Staten Island corresponded to low provisioning
rates by females and males during crèche over two years (0.48 ± 0.05 to 0.57 ± 0.09) of low
breeding success (Raya Rey et al. 2007). In the present study female provisioning rates were
lower during the poor year (0.71 ± 0.12 feeds per day during guard, and 0.54 ± 0.19 feeds per
day during crèche). The decrease in provisioning rate between the good and poor years was
even greater for males, from 0.55 ± 0.23 to 0.17 ± 0.18 feeds per day. Females did not adjust
their provisioning rate with respect to that of their mate, as the crèche provisioning rates of
mates were unrelated in both years. Although Macaroni Penguin chicks received a smaller
number of total feeds in a year of low chick growth rates and asymptotic masses, males
provided a similar proportion of feeds as in two other years (Barlow and Croxall 2002).
Although we did not record provisioning rates through the entire chick rearing period, our
estimated total number of feeds were similar to those estimated from monitoring throughout
98
chick-rearing elsewhere (Barlow and Croxall 2002; Tremblay and Cherel 2005; Raya Rey et al.
2007).
Chick growth
Chicks that were fed less often weighed less at 30–31 d of age in both years of study. When
chicks were provisioned frequently in 2011 their average bill length, flipper length, and body
mass were very similar to those of 30 d old Southern Rockhopper Penguin chicks at New Island
during two years of high breeding success and population growth (Poisbleau et al. 2008;
Poisbleau et al. 2010; Dehnhard et al. 2014). However in 2012 when chicks received far fewer
feeds, especially from males, they were of smaller size, especially in flipper length and body
mass. We expect that a large proportion of chicks in 2012 subsequently starved to death
before fledging, or experienced high mortality rates as juveniles because of insufficient body
reserves at fledging (Reilly and Cullen 1982; Horswill et al. 2014).
Evolutionary ecology of parental division of labour
Our results suggest Eastern Rockhopper Penguin chicks are fed less often and grow more
slowly because of their parents’ fixed role division, especially under nutritional stress. We
estimated that by sharing chick brooding and foraging duties throughout chick rearing, as do
all other penguin species, Eudyptes penguins would hypothetically be able to deliver 17.2–
34.5% more total feeds to their chick (Table 4.3). The strong, positive relationship we found
between provisioning rate and chick mass suggests that a greater food intake would result in
larger chicks at fledging, with a greater likelihood of surviving to recruit into the population
(Reilly and Cullen 1982; Horswill et al. 2014). The ability to provision chicks at a higher rate
without DOL could also shorten the chick-rearing period or allow adults to maintain a higher a
body mass, presumably increasing adult survival and population growth rates. Eudyptes
penguins show sex differences in foraging behaviour and diet (Pütz et al. 2006; Ludynia et al.
2013; Chapter 3), so that if the sexes equitably shared chick-provisioning duties, then
competition for prey would be relaxed. A further negative consequence of DOL is the long
incubation foraging trips males make in preparation for their incubation/guard period fast. This
long trip of 15.8 ± 1.4 d duration at our study site in 2012 extended females’
courtship/incubation fast to a mean of 46.0 ± 2.5 d (Chapter 3), causing some nests to fail
through female abandonment of eggs. Female Royal Penguins (E. schlegeli) have also been
observed to abandon eggs (Carrick 1972).
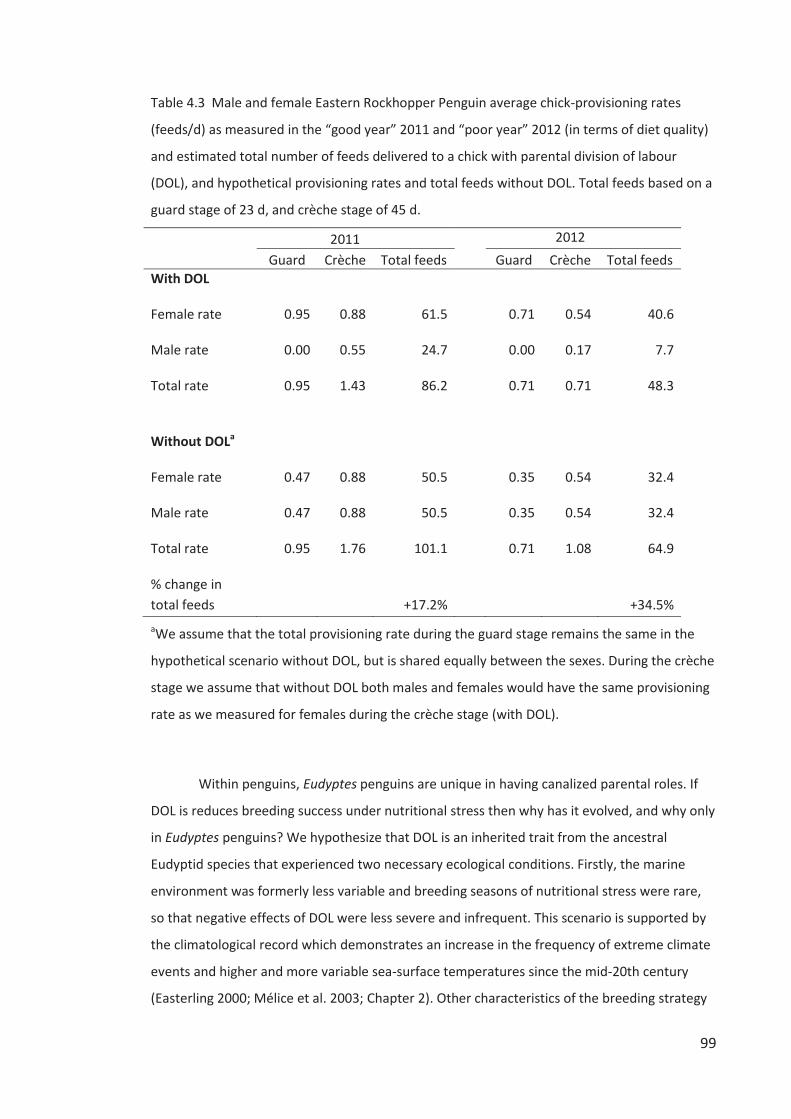
99
Table 4.3 Male and female Eastern Rockhopper Penguin average chick-provisioning rates
(feeds/d) as measured in the “good year” 2011 and “poor year” 2012 (in terms of diet quality)
and estimated total number of feeds delivered to a chick with parental division of labour
(DOL), and hypothetical provisioning rates and total feeds without DOL. Total feeds based on a
guard stage of 23 d, and crèche stage of 45 d.
2011 2012 Guard Crèche Total feeds Guard Crèche Total feeds
With DOL
Female rate 0.95 0.88 61.5 0.71 0.54 40.6
Male rate 0.00 0.55 24.7 0.00 0.17 7.7
Total rate 0.95 1.43 86.2 0.71 0.71 48.3
Without DOLa
Female rate 0.47 0.88 50.5 0.35 0.54 32.4
Male rate 0.47 0.88 50.5 0.35 0.54 32.4
Total rate 0.95 1.76 101.1 0.71 1.08 64.9
% change in total feeds +17.2%
+34.5%
aWe assume that the total provisioning rate during the guard stage remains the same in the
hypothetical scenario without DOL, but is shared equally between the sexes. During the crèche
stage we assume that without DOL both males and females would have the same provisioning
rate as we measured for females during the crèche stage (with DOL).
Within penguins, Eudyptes penguins are unique in having canalized parental roles. If
DOL is reduces breeding success under nutritional stress then why has it evolved, and why only
in Eudyptes penguins? We hypothesize that DOL is an inherited trait from the ancestral
Eudyptid species that experienced two necessary ecological conditions. Firstly, the marine
environment was formerly less variable and breeding seasons of nutritional stress were rare,
so that negative effects of DOL were less severe and infrequent. This scenario is supported by
the climatological record which demonstrates an increase in the frequency of extreme climate
events and higher and more variable sea-surface temperatures since the mid-20th century
(Easterling 2000; Mélice et al. 2003; Chapter 2). Other characteristics of the breeding strategy
100
of Eudyptes penguins also support a historically stable environment. These traits include a
relatively fixed, synchronous timing of breeding that is initiated on return migration to
colonies, apparently based on photoperiod rather than on the abundance or timing of prey
availability near colonies. The long courtship/incubation fasts of both sexes and the prolonged
incubation/guard fast of males can only have evolved under reliably high food availability near
breeding colonies to allow rapid recovery from mass loss. Eudyptes penguins lay a single 2-egg
clutch in which the second-laid egg receives preferential investment and is typically the only
egg to hatch or chick to survive if both eggs hatch (St. Clair and St. Clair 1996; St. Clair 1998).
Preferential investment in a single egg, including the systematic and perhaps deliberate loss of
the first-laid egg soon after laying in Macaroni, Royal, and Erect-crested (E. sclateri) Penguins,
along with the genus’ inability to lay additional eggs, further demonstrate the genus’ inability
to adapt reproductive output to environmental variation. In contrast, Galapagos Penguins
(Spheniscus mendiculus) are highly adapted to a variable marine environment, including
flexible timing of breeding, no long breeding fasts, the ability to relay and lay multiple clutches
within a year, and a brood reduction strategy in which two chicks are raised under favourable
conditions (Boersma et al. 1990). Other authors have ascribed the interspecific variation in
penguin breeding biology to the degree of seasonality in prey availability or inshore versus
offshore foraging (Boersma et al. 1990; Croxall and Davis 1999; Davis and Renner 2003), but
we emphasize here the importance of predictability in prey availability for the evolution of
DOL in Eudyptes penguins.
The second key ecological condition selecting for DOL in Eudyptes penguins is likely to
have been a male-biased capacity for nest defence from nest predators and conspecifics,
owing to males’ larger size and more aggressive nature. We hypothesize that male Eudyptes
penguins have a greater capacity for nest defence relative to their mate than in other penguin
genera because male-biased sexual size dimorphism tends to be larger in Eudyptes penguins
than in the Pygoscelis penguins that are the only other species that typically have fixed surface
nests in dense colonies (male Eudyptes bill length 11–13% and bill depth 15–20% larger than
females’ (range of species means), male Pygoscelis bill length 9% and bill depth 8–10% larger
than females’ (Williams 1995; Poisbleau et al. 2010; Borboroglu and Boersma 2013; Gorman et
al. 2014). The fitness consequences of insufficient nest defence may also be greatest in
Eudyptes penguins, owing to their surface nesting habit and smaller body size relative to their
avian nest predators (Chapter 5). Nest defence from conspecifics appears especially important
because of greater variation in nest-site quality within Eudyptid colonies than for other
penguins. Large variation in nest site quality of Eudyptes penguins is suggested by the complex
101
topography of many Eudyptid colonies, where nests are more successful if sheltered by rocks
than exposed (Chapter 5) and are more vulnerable to predation if located on the colony
periphery (Chapter 5 and references therein). The importance of obtaining a high quality nest
and competition to do so is also suggested by males arriving to claim nest sites before females
by about a week, and both sexes having a long pre-laying fast ashore (Chapter 3) and a late age
at first breeding (Stein and Williams 2013). Female Eudyptes penguins incubating without their
male partner present may be subject to prolonged periods of forceful biting and flipper-
slapping from female, but especially male conspecifics, including both non-breeders and other
breeders, sometimes resulting in egg loss (Warham 1963; Strange 1982; Davis and Renner
2003; K.W.M. pers. obs). Solo-incubating males always react aggressively to intrusions by
conspecifics, usually driving them off quickly, whereas solo-incubating females adopt a
submissive posture when attacked and do not fight back (Warham 1963). Likewise disruption
by conspecifics of chick-provisioning Rockhopper Penguins is targeted at females, but not
males (Warham 1963; Poisbleau et al. 2013b). Females whose mate leaves on its incubation
foraging trip earlier than other males receive the most abuse because of the abundance of off-
duty (not incubating) birds in the colony (K.W.M. pers. obs.). The risk of egg- (and perhaps nest
site- and mate-) loss for early-departing males has likely selected for the extended (7-10 d)
period of shared incubation following clutch completion where both sexes remain at the nest
site followed by highly synchronous male departure on their incubation foraging trip, seen only
in Eudyptes penguins (Davis and Renner 2003). We suggest that the greater vulnerability of
female Eudyptids to nest predators (Chapter 5), but perhaps more importantly to attacks from
conspecifics, would result in increased rates of chick loss if the sexes alternated brood care and
provisioning roles during the guard stage. As we hypothesize here for the evolution of DOL in
Eudyptes penguins, the male-biased chick brooding found in the Alcidae family of seabirds is
thought to have evolved because of a greater capacity for males, which are larger and more
aggressive than females, to better defend the chick and nest site from predators, congeners,
and conspecifics (Creelman and Storey 1991; Fraser et al. 2002; Paredes and Insley 2010;
Wojczulanis-Jakubas and Jakubas 2012).
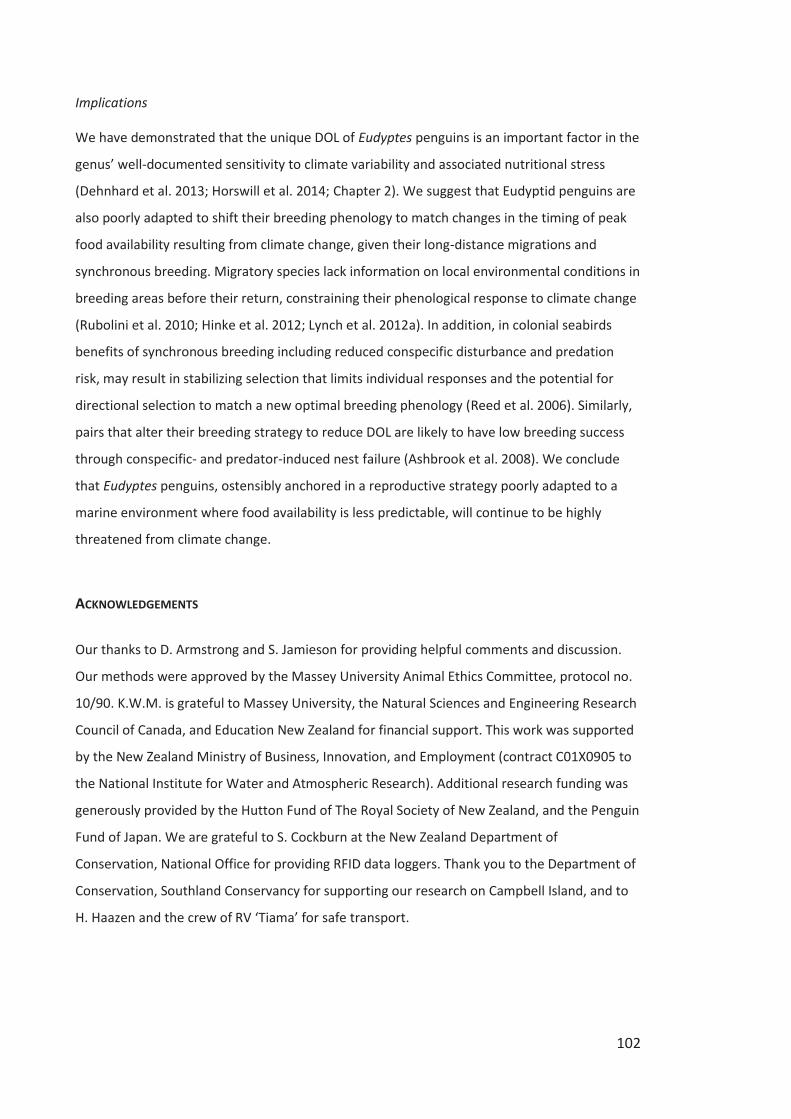
102
Implications
We have demonstrated that the unique DOL of Eudyptes penguins is an important factor in the
genus’ well-documented sensitivity to climate variability and associated nutritional stress
(Dehnhard et al. 2013; Horswill et al. 2014; Chapter 2). We suggest that Eudyptid penguins are
also poorly adapted to shift their breeding phenology to match changes in the timing of peak
food availability resulting from climate change, given their long-distance migrations and
synchronous breeding. Migratory species lack information on local environmental conditions in
breeding areas before their return, constraining their phenological response to climate change
(Rubolini et al. 2010; Hinke et al. 2012; Lynch et al. 2012a). In addition, in colonial seabirds
benefits of synchronous breeding including reduced conspecific disturbance and predation
risk, may result in stabilizing selection that limits individual responses and the potential for
directional selection to match a new optimal breeding phenology (Reed et al. 2006). Similarly,
pairs that alter their breeding strategy to reduce DOL are likely to have low breeding success
through conspecific- and predator-induced nest failure (Ashbrook et al. 2008). We conclude
that Eudyptes penguins, ostensibly anchored in a reproductive strategy poorly adapted to a
marine environment where food availability is less predictable, will continue to be highly
threatened from climate change.
ACKNOWLEDGEMENTS
Our thanks to D. Armstrong and S. Jamieson for providing helpful comments and discussion.
Our methods were approved by the Massey University Animal Ethics Committee, protocol no.
10/90. K.W.M. is grateful to Massey University, the Natural Sciences and Engineering Research
Council of Canada, and Education New Zealand for financial support. This work was supported
by the New Zealand Ministry of Business, Innovation, and Employment (contract C01X0905 to
the National Institute for Water and Atmospheric Research). Additional research funding was
generously provided by the Hutton Fund of The Royal Society of New Zealand, and the Penguin
Fund of Japan. We are grateful to S. Cockburn at the New Zealand Department of
Conservation, National Office for providing RFID data loggers. Thank you to the Department of
Conservation, Southland Conservancy for supporting our research on Campbell Island, and to
H. Haazen and the crew of RV ‘Tiama’ for safe transport.
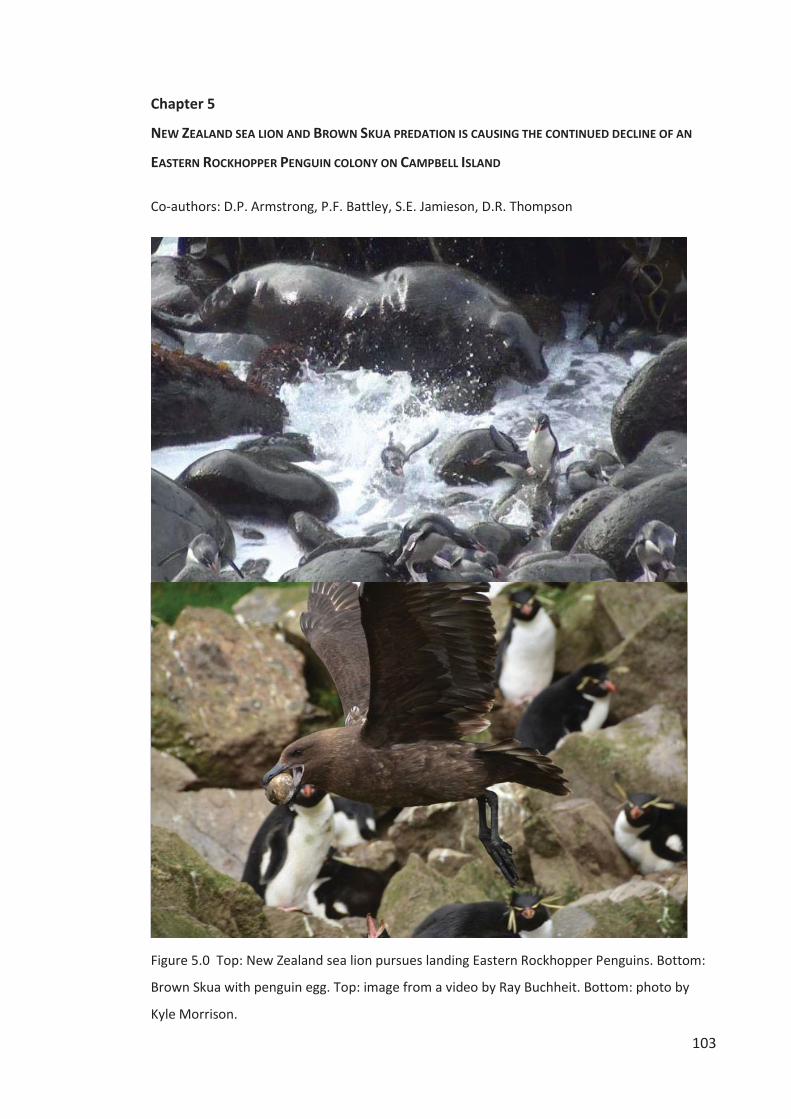
103
Chapter 5
NEW ZEALAND SEA LION AND BROWN SKUA PREDATION IS CAUSING THE CONTINUED DECLINE OF AN
EASTERN ROCKHOPPER PENGUIN COLONY ON CAMPBELL ISLAND
Co-authors: D.P. Armstrong, P.F. Battley, S.E. Jamieson, D.R. Thompson
Figure 5.0 Top: New Zealand sea lion pursues landing Eastern Rockhopper Penguins. Bottom:
Brown Skua with penguin egg. Top: image from a video by Ray Buchheit. Bottom: photo by
Kyle Morrison.
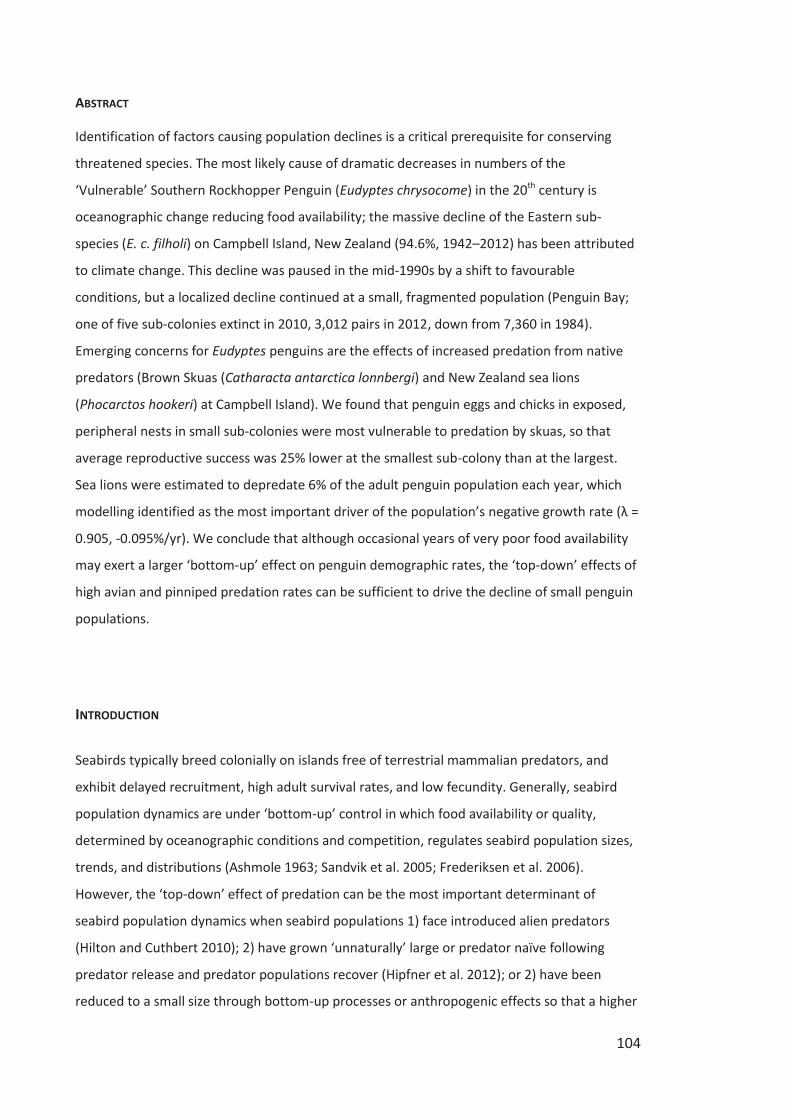
104
ABSTRACT
Identification of factors causing population declines is a critical prerequisite for conserving
threatened species. The most likely cause of dramatic decreases in numbers of the
‘Vulnerable’ Southern Rockhopper Penguin (Eudyptes chrysocome) in the 20th century is
oceanographic change reducing food availability; the massive decline of the Eastern sub-
species (E. c. filholi) on Campbell Island, New Zealand (94.6%, 1942–2012) has been attributed
to climate change. This decline was paused in the mid-1990s by a shift to favourable
conditions, but a localized decline continued at a small, fragmented population (Penguin Bay;
one of five sub-colonies extinct in 2010, 3,012 pairs in 2012, down from 7,360 in 1984).
Emerging concerns for Eudyptes penguins are the effects of increased predation from native
predators (Brown Skuas (Catharacta antarctica lonnbergi) and New Zealand sea lions
(Phocarctos hookeri) at Campbell Island). We found that penguin eggs and chicks in exposed,
peripheral nests in small sub-colonies were most vulnerable to predation by skuas, so that
average reproductive success was 25% lower at the smallest sub-colony than at the largest.
Sea lions were estimated to depredate 6% of the adult penguin population each year, which
modelling identified as the most important driver of the population’s negative growth rate (λ =
0.905, -0.095%/yr). We conclude that although occasional years of very poor food availability
may exert a larger ‘bottom-up’ effect on penguin demographic rates, the ‘top-down’ effects of
high avian and pinniped predation rates can be sufficient to drive the decline of small penguin
populations.
INTRODUCTION
Seabirds typically breed colonially on islands free of terrestrial mammalian predators, and
exhibit delayed recruitment, high adult survival rates, and low fecundity. Generally, seabird
population dynamics are under ‘bottom-up’ control in which food availability or quality,
determined by oceanographic conditions and competition, regulates seabird population sizes,
trends, and distributions (Ashmole 1963; Sandvik et al. 2005; Frederiksen et al. 2006).
However, the ‘top-down’ effect of predation can be the most important determinant of
seabird population dynamics when seabird populations 1) face introduced alien predators
(Hilton and Cuthbert 2010); 2) have grown ‘unnaturally’ large or predator naïve following
predator release and predator populations recover (Hipfner et al. 2012); or 2) have been
reduced to a small size through bottom-up processes or anthropogenic effects so that a higher
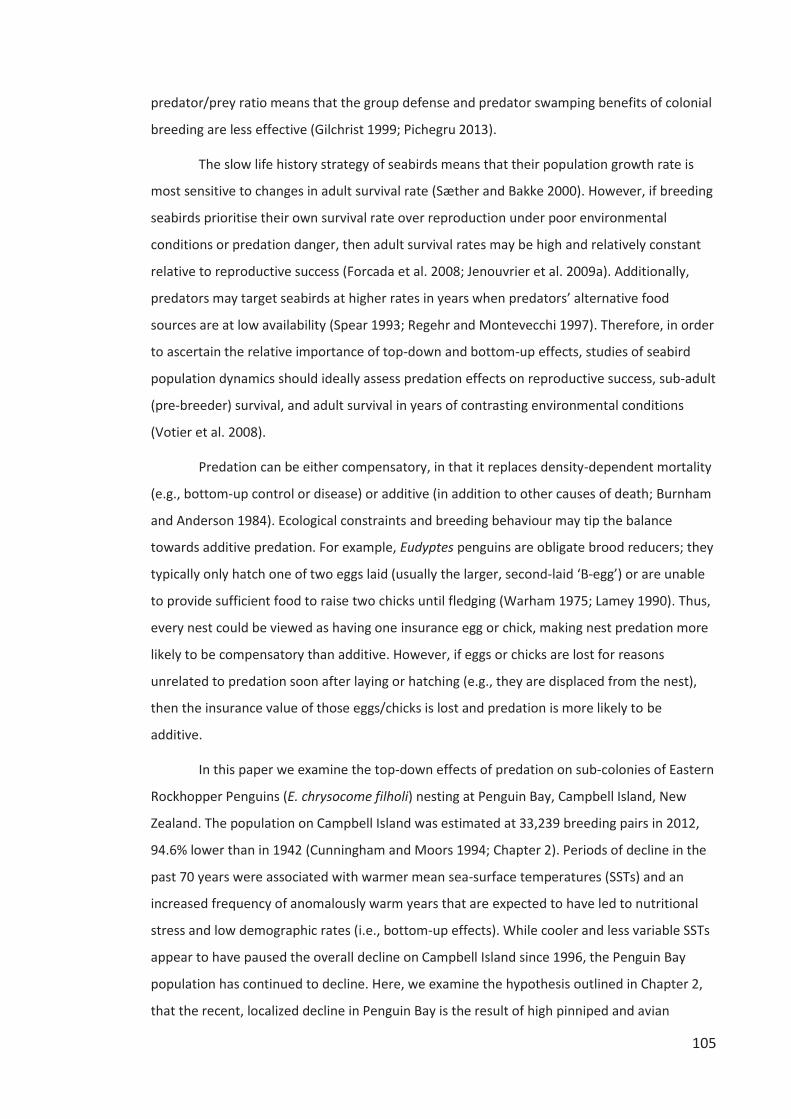
105
predator/prey ratio means that the group defense and predator swamping benefits of colonial
breeding are less effective (Gilchrist 1999; Pichegru 2013).
The slow life history strategy of seabirds means that their population growth rate is
most sensitive to changes in adult survival rate (Sæther and Bakke 2000). However, if breeding
seabirds prioritise their own survival rate over reproduction under poor environmental
conditions or predation danger, then adult survival rates may be high and relatively constant
relative to reproductive success (Forcada et al. 2008; Jenouvrier et al. 2009a). Additionally,
predators may target seabirds at higher rates in years when predators’ alternative food
sources are at low availability (Spear 1993; Regehr and Montevecchi 1997). Therefore, in order
to ascertain the relative importance of top-down and bottom-up effects, studies of seabird
population dynamics should ideally assess predation effects on reproductive success, sub-adult
(pre-breeder) survival, and adult survival in years of contrasting environmental conditions
(Votier et al. 2008).
Predation can be either compensatory, in that it replaces density-dependent mortality
(e.g., bottom-up control or disease) or additive (in addition to other causes of death; Burnham
and Anderson 1984). Ecological constraints and breeding behaviour may tip the balance
towards additive predation. For example, Eudyptes penguins are obligate brood reducers; they
typically only hatch one of two eggs laid (usually the larger, second-laid ‘B-egg’) or are unable
to provide sufficient food to raise two chicks until fledging (Warham 1975; Lamey 1990). Thus,
every nest could be viewed as having one insurance egg or chick, making nest predation more
likely to be compensatory than additive. However, if eggs or chicks are lost for reasons
unrelated to predation soon after laying or hatching (e.g., they are displaced from the nest),
then the insurance value of those eggs/chicks is lost and predation is more likely to be
additive.
In this paper we examine the top-down effects of predation on sub-colonies of Eastern
Rockhopper Penguins (E. chrysocome filholi) nesting at Penguin Bay, Campbell Island, New
Zealand. The population on Campbell Island was estimated at 33,239 breeding pairs in 2012,
94.6% lower than in 1942 (Cunningham and Moors 1994; Chapter 2). Periods of decline in the
past 70 years were associated with warmer mean sea-surface temperatures (SSTs) and an
increased frequency of anomalously warm years that are expected to have led to nutritional
stress and low demographic rates (i.e., bottom-up effects). While cooler and less variable SSTs
appear to have paused the overall decline on Campbell Island since 1996, the Penguin Bay
population has continued to decline. Here, we examine the hypothesis outlined in Chapter 2,
that the recent, localized decline in Penguin Bay is the result of high pinniped and avian
106
predation rates, i.e,. predation is additive rather than compensatory. Predator populations on
Campbell Island are currently high. Numbers of New Zealand sea lion Phocarctos hookeri are
larger than at any time since the end of the sealing era in the early 1900s (Maloney et al.
2012), while Northern Giant Petrels Macronectes halli are known to have increased in number
elsewhere as pinniped populations grew (Bonner and Hunter 1982; Hunter 1984; Wiltshire and
Scofield 2000; Patterson et al. 2008) so may be commoner than previously. Furthermore,
bottom-up processes have led to colony fragmentation and a dramatic reduction in the
penguin population size on Campbell Island (Chapter 2). Smaller and more fragmented
penguin colonies are known to be more vulnerable to predation of eggs and small chicks by
avian predators such as Brown Skuas (Catharacta antarctica lonnbergi), because a greater
proportion of nests are on the peripheries of colonies, where they are more readily
depredated (Jackson et al. 2005). Our 2010–2013 study period included seasons of starkly
different oceanographic conditions and penguin diet quality (Chapter 3), allowing an
assessment of the relative importance of top-down and bottom-up effects on demographic
rates.
Opportunistic observations suggest pinnipeds may be important predators of Eudyptes
penguins (Bailey and Sorensen 1962; Bonner and Hunter 1982; Strange 1982; Raya Rey et al.
2011), but no previous study has quantified the pinniped predation rate in relation to the size
or growth rate of a Eudyptes penguin population. In this study we assess the likely effects of
pinniped predation of adults, and skua predation on eggs and chicks of Rockhopper Penguins
at Penguin Bay, Campbell Island. We measured breeding success (egg and chick survival) in
relation to nest location and shelter, sub-colony size, lay date, laying synchrony, and stage of
the breeding season. We predicted that more synchronously-laid eggs at more sheltered or
interior nests sites in larger sub-colonies would have higher hatching success, as shown for
penguins elsewhere (Tenaza 1971; Emslie et al. 1995; St. Clair and St. Clair 1996). We expected
that earlier laid eggs would be more successful because higher quality or more experienced
seabirds tend to lay earlier (De Forest and Gaston 1996; Hipfner et al. 2010). We expected that
most breeding failure would occur during incubation rather than chick-rearing as a result of
high egg predation and displacement rates seen in Rockhopper Penguins elsewhere (St. Clair
and St. Clair 1996; Hull 2004). We also evaluated whether daily egg survival rates differed
between shared, female-only, and male-only incubation stages under the hypothesis that both
parents would provide the best nest defense and the more aggressive, heavier, and larger-
bodied males better defense than females (Chapter 4).
107
We estimated adult and first-year penguin survival rates, and predation rates of skuas
on eggs and New Zealand sea lions on adults. Using this information and values from the
literature we modelled the population growth rate in Penguin Bay and at a growing conspecific
population. We addressed our focal question, is predation the primary cause of the localized
population decline in Penguin Bay?, by evaluating whether a ‘predation-free’ population (with
demographic rates unaffected by predation), would have a stable or increasing population
growth rate.
MATERIALS AND METHODS
Study site
Eastern Rockhopper Penguins were studied in the East and West sub-colonies of Penguin Bay
(Figure 5.1), Campbell Island (52° 32ʹ 12ʺ S, 169° 2ʹ 10ʺ E) over the 2010–2011, 2011–2012 and
2012–2013 breeding seasons (hereafter we refer to these breeding seasons by the year in
which they began). Our research effort was limited in 2010, but we were present in Penguin
Bay almost continuously from early Oct to c. 20 Jan in 2011 and 2012. The birds’ reliable use of
a narrow travel pathway between the sea and the East and West sub-colonies made it possible
to record passive integrated transponder (PIT) tag codes with an automated system. Nests,
skua-eaten penguin eggshells, and chicks were counted at these and the nearby Foreshore and
Ravine sub-colonies in each year. First-year survival rates were estimated for two cohorts of
chicks from all four sub-colonies. Unless stated otherwise, all descriptions refer to Campbell
Island.
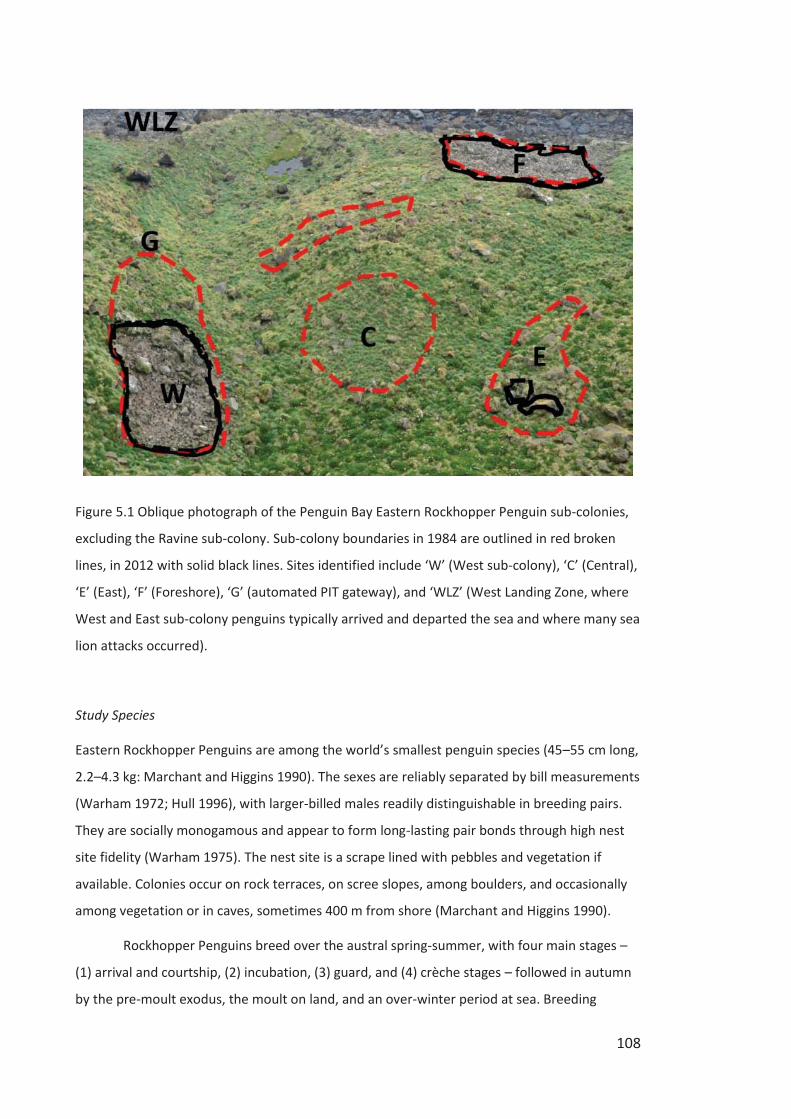
108
Figure 5.1 Oblique photograph of the Penguin Bay Eastern Rockhopper Penguin sub-colonies,
excluding the Ravine sub-colony. Sub-colony boundaries in 1984 are outlined in red broken
lines, in 2012 with solid black lines. Sites identified include ‘W’ (West sub-colony), ‘C’ (Central),
‘E’ (East), ‘F’ (Foreshore), ‘G’ (automated PIT gateway), and ‘WLZ’ (West Landing Zone, where
West and East sub-colony penguins typically arrived and departed the sea and where many sea
lion attacks occurred).
Study Species
Eastern Rockhopper Penguins are among the world’s smallest penguin species (45–55 cm long,
2.2–4.3 kg: Marchant and Higgins 1990). The sexes are reliably separated by bill measurements
(Warham 1972; Hull 1996), with larger-billed males readily distinguishable in breeding pairs.
They are socially monogamous and appear to form long-lasting pair bonds through high nest
site fidelity (Warham 1975). The nest site is a scrape lined with pebbles and vegetation if
available. Colonies occur on rock terraces, on scree slopes, among boulders, and occasionally
among vegetation or in caves, sometimes 400 m from shore (Marchant and Higgins 1990).
Rockhopper Penguins breed over the austral spring-summer, with four main stages –
(1) arrival and courtship, (2) incubation, (3) guard, and (4) crèche stages – followed in autumn
by the pre-moult exodus, the moult on land, and an over-winter period at sea. Breeding
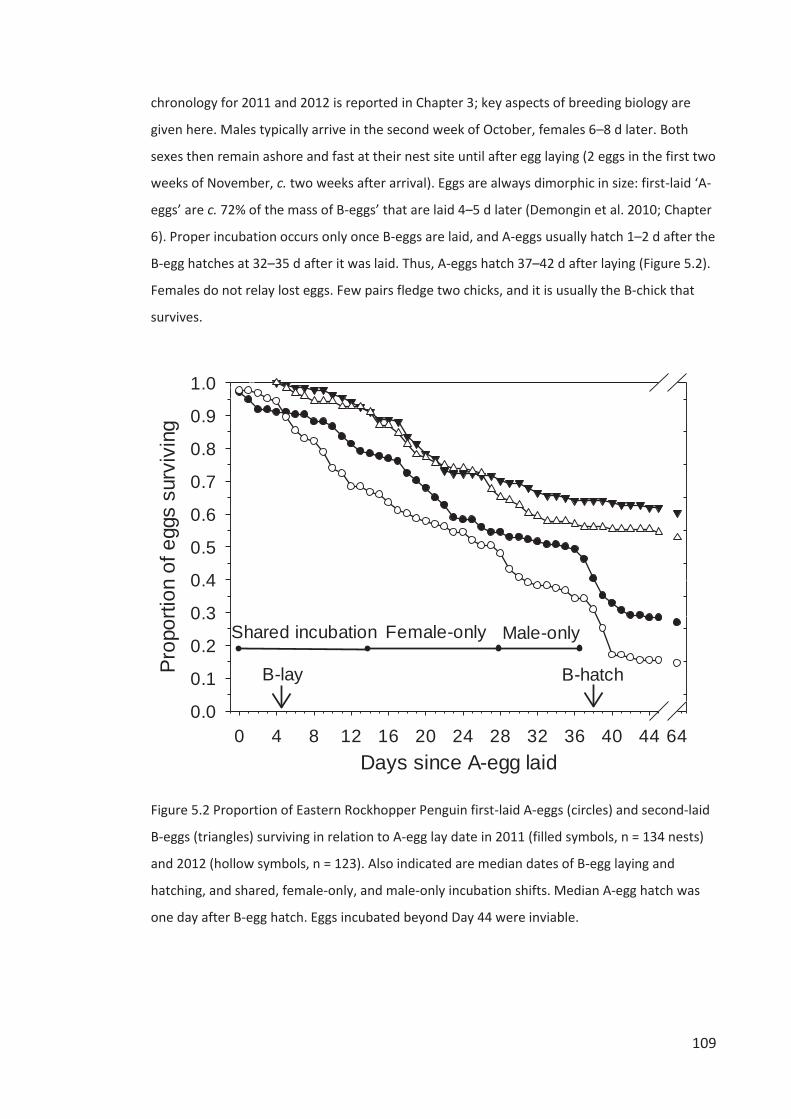
109
chronology for 2011 and 2012 is reported in Chapter 3; key aspects of breeding biology are
given here. Males typically arrive in the second week of October, females 6–8 d later. Both
sexes then remain ashore and fast at their nest site until after egg laying (2 eggs in the first two
weeks of November, c. two weeks after arrival). Eggs are always dimorphic in size: first-laid ‘A-
eggs’ are c. 72% of the mass of B-eggs’ that are laid 4–5 d later (Demongin et al. 2010; Chapter
6). Proper incubation occurs only once B-eggs are laid, and A-eggs usually hatch 1–2 d after the
B-egg hatches at 32–35 d after it was laid. Thus, A-eggs hatch 37–42 d after laying (Figure 5.2).
Females do not relay lost eggs. Few pairs fledge two chicks, and it is usually the B-chick that
survives.
Days since A-egg laid0 4 8 12 16 20 24 28 32 36 40 44 64
Prop
ortio
n of
egg
s su
rviv
ing
0.0
0.1
0.2
0.3
0.4
0.5
0.6
0.7
0.8
0.9
1.0
B-lay
Shared incubation Female-only Male-only
B-hatch
Figure 5.2 Proportion of Eastern Rockhopper Penguin first-laid A-eggs (circles) and second-laid
B-eggs (triangles) surviving in relation to A-egg lay date in 2011 (filled symbols, n = 134 nests)
and 2012 (hollow symbols, n = 123). Also indicated are median dates of B-egg laying and
hatching, and shared, female-only, and male-only incubation shifts. Median A-egg hatch was
one day after B-egg hatch. Eggs incubated beyond Day 44 were inviable.
110
Males depart fairly synchronously c. 9 d after clutch completion for a 13–16 d long
foraging trip, while females incubate. When males return, females go to sea for 7–9 d,
returning near hatching in the second week of December. During the guard period of c. 23 d,
females (only) provision their chick(s) approximately daily while males brood the chick(s;
Chapter 4). Chicks crèche then, at which point males may go back to sea for 7–11 d before
returning to join females in chick provisioning until chicks fledge at 65–70 d old (Marchant and
Higgins 1990; Chapter 4). Sub-adult penguins visit breeding colonies in late November and
December, and come ashore to moult in January. Chicks fledge in mid-February and adults
spend the next c. six weeks at sea during the pre-moult exodus to regain body condition prior
to moulting during a 3–4 week fast ashore in April. All individuals spend the following 5–5.5
months over-wintering at sea.
Brown Skuas (c. 64 cm long, 1.5–2.2 kg: Hemmings 2013) nested in pairs, often near
colonies of penguins or Campbell (Thalassarche impavida) and Grey-headed (T. chrysostoma)
Albatrosses (K.W.M. pers. obs.). In Penguin Bay they showed stable territory locations
between years, and likely had high mate and territory fidelity. The population was estimated at
c. 100 pairs in 1984–1986 (Higgins and Davies 1996). The Penguin Bay skua population
remained stable at c. six skua nests between 1984–1986 and 2010–2012 (G.A. Taylor pers.
comm., K.W.M. unpub. data).
A second avian predator was the Northern Giant Petrel (80-95 cm long, 3.8–5.0 kg:
Szabo 2013). Of an estimated 234 breeding pairs in 1996, 40 nests were within 3 km of
Penguin Bay (Wiltshire and Scofield 2000). In 1996 and 2006 there was a small colony between
Ramp Point and Penguin Bay (< 10 nests), but the closest colony (c. 5–10 nests) in 2010–2012
was above Cattle Bay (< 2 km from Penguin Bay, see Chapter 2 for locations). We observed at
least one white-morph Southern Giant Petrel (M. giganteus) in Penguin Bay, but this species
does not breed on Campbell Island. Up to 22 Giant Petrels were counted attending a sea lion
eating a penguin offshore from Penguin Bay.
New Zealand fur seals (Arctocephalus forsteri) were recorded killing Eastern
Rockhopper Penguins in the 1940s, but were not recorded doing so in 2010–2012. Their local
population trend is unknown, but they appear to have remained at low levels since the sealing
era (Bailey and Sorensen 1962). Up to 20 were seen ashore in Penguin Bay, and at least one
pup was born below the Foreshore penguin sub-colony. Larger numbers breed in Cattle Bay,
Rocky Bay, and southeast of Rocky Bay.
111
The population of New Zealand sea lions (Phocarctos hookeri) has grown rapidly, from
minimum estimates of 51 pups in 1987 to 681 in 2009 (Moore and Moffat 1990; Maloney et al.
2012). In Penguin Bay pup production increased from one pup born over 1984–1986 (G.A.
Taylor pers. comm.) to 6–7 pups/yr in 2010–2012. Up to 20 sub-adult and adult sea lions were
recorded ashore in weekly counts in Penguin Bay from 24 Dec to 18 Jan in 2011 and 2012,
including maximum counts of nine sub-adult males, seven bulls, and nine cows. Penguin Bay
appears to attract more sea lions than the larger penguin colonies further west where we saw
only zero to three individuals on six occasions 2010–2012.
Data collection
Nest and chick counts
Nest and chick counts at the Penguin Bay sub-colonies follow the methods reported in Chapter
1. Chicks/nest is used as a measure of (maximum) reproductive success from these two sets of
counts, as chicks were counted at c. 26–37 d old.
Nest fates and skua predation
Egg fates and chick survival to crèching were determined for 134 nests in 2011 and 123 in 2012
(all 2011 nests active in 2012 were included in that sample: N = 104). Monitored nests included
all nests within the small East sub-colony, and those within an irregularly-shaped plot
encompassing 23–24% of the nests in the neighbouring West sub-colony. The shape of the
West sub-colony plot was dictated by colony topography and visibility of nests from the colony
edge, but included central as well as peripheral nests. Nest contents were recorded at 1–3 d
intervals, but mostly daily, from the date the first egg was laid until chicks crèched at the end
of the guard phase. Using binoculars or the naked eye we recorded the presence or absence
and fate of A-and B-eggs and which parent(s) was attending the nest. Dates for laying,
hatching, or failure were recorded as the day the egg or chick’s status changed (if also
monitored on the previous day) or on the median date between then and the previous check if
not consecutive. Lay dates are expressed as days since the first egg of each type was laid in
either year: Day 1 = 31 Oct for A-eggs and 3 Nov for B-eggs. Laying synchrony is calculated as
the number of days between an egg’s lay date and the median lay date of that egg type in each
year. Nests were checked daily around hatching, and chicks were marked on their breasts with
a small spot of blue (B-chicks) or purple (A-chicks) water-soluble paint. If two chicks had
hatched at the same time, the larger was assumed to be the B-chick. If seven to 10 consecutive
112
nest checks could not confirm nest contents, the nest was physically examined. If eggs
disappeared, the area around the nest was inspected to classify whether the egg had been
ejected (egg outside the nest cup), trampled in the nest, buried in the nest, or was of unknown
fate. The fates of individual eggs at 69 monitored nests in 2011 and 89 nests in 2012 were
known with greater certainty because they were labelled with indelible black marker with a
unique code shortly after laying. Just prior to laying in 2011 and 2012 we classified the degree
to which a nest was sheltered: ‘cavity’ (sheltered on three of five sides by rock), ‘lee’ (in the lee
of a rock providing shelter on one or two sides), or ‘exposed’ (no nearby rocks large enough to
provide shelter). At the same time we recorded nest position as the number of nests between
each monitored nests and the colony’s edge. For example, a peripheral, outer-most nest
scored ‘0’, and an interior nest with four nests between itself and the colony’s edge scored ‘4’.
In 2011 and 2012 almost all penguins breeding at monitored nests were individually
marked with subcutaneous PIT tags. In order to assign egg failure dates obtained by nest
checks to either the shared, female-only, or male-only incubation shifts we obtained the dates
of incubation shift changes at each monitored nest from an automated gateway on the
penguin’s travel pathway between the sub-colonies and the sea that recorded PIT code, date,
and time (see Chapter 3). When we lacked transit data we used parental attendance data from
nest checks to obtain shift dates. If these too were uncertain we used the population-level
median dates obtained from the automated gateway.
Skuas removed penguin eggs from the sub-colonies and ate them in adjacent areas
specific to each colony. They tended to ingest the egg contents, leaving behind the shell. We
only observed 1, non-resident skua swallow eggs whole on a single day, and we rarely saw
eggshell fragments in skua faeces. In all years we collected eggshells found around the East,
West, and Foreshore sub-colonies at intervals of 6–17 d throughout the incubation period,
counted them, and measured their length and width where they were not too broken to do so.
In 2011 and 2012 we measured the length and width of A- and B-eggs on their lay date at 340
nests at the East, West, and Foreshore sub-colonies. We calculated egg volume (cm3) as length
* width2 * 0.512 (Stonehouse 1966). Separate discriminate analyses using cut-offs of ≤ 67.82
mm (length), ≤ 51.37 mm (width), and ≤ 99.74 cm3 (volume) for A-eggs determined that each
measurement correctly classified A- and B-eggs 92.9/92.4%, 95.3/93.5%, and 97.1/96.5% of
the time, respectively. We assigned egg-type to skua-eaten eggshells based on volume, or on
length or width if only one could be measured using those cut-offs. Eggshells that were too
broken to make either measure were classified as ‘Unknown’ type, except in 2010 where we
113
only collected and counted eggshells for which both length and width could be measured,
thereby under-recording the actual number of skua-eaten eggs.
First-year survival
First-year penguins were counted in and around each sub-colony at about weekly intervals
from their first appearance in early December until our departure from the island c. 20 Jan.
Penguins were regarded as being in their first year up until they had completed their first
moult in late January, so that first-year penguins were 13–14 months old. All first-years along
or just above the shoreline in the main part of Penguin Bay were counted in the Foreshore
group, whereas any in the Ravine, including the Ravine shoreline were counted in the Ravine
group. First-years were identified by their very short yellow crest feathers and mottled-grey
throats and were the first age-class to initiate moult in January (Strange 1982). Although a few
first-year birds had shed all of their old feathers before our departure, c. 20 Jan, it appeared as
though few had gone back to sea. We assume that all first-year penguins hatched from
Penguin Bay moulted in Penguin Bay, and that our maximum count represents all first-year
penguins ashore simultaneously. The latter assumption appears justified in that Rockhopper
Penguins appear to moult fairly synchronously by age class (moult takes c. four weeks and
most individuals in a given age class moult over five to six weeks, Strange 1982; Williams
1995). We calculated first-year survival rates 2010 to 2011 and 2011 to 2012 as the overall
maximum count of first-year penguins in Penguin Bay in the later year, divided by the overall
number of chicks counted mid-crèche in the earlier year.
Adult survival
We PIT-tagged adult penguins in Oct–Dec in all years, and scanned penguins from Oct–Jan via
an automated gateway on the penguin’s pathway into the East and West sub-colonies in 2011
and 2012, and a hand-held scanner (RS320 Stick Reader, Allflex Australia Pty) on other
occasions at their nest sites. Additional automated gateways were used for short periods in
2011 at the Foreshore sub-colony to confirm that ‘missing’ tagged individuals had not
emigrated there. In Apr 2013 our ‘recapture’ effort was limited to using the stick reader to find
45 tagged individuals on 14–15 Apr in the East and West sub-colonies for geo-location sensor
(GLS) tag deployment. Recapture effort for GLS retrieval in spring Oct 2013 was restricted to
stick-reading as many individuals as possible in the East and West sub-colonies over 23–25 Oct
and 9–10 Nov 2013. For survival analysis, recaptures were grouped into Oct–Jan (3 months:
114
early breeding), Jan–Apr (3 months: late breeding/pre-moult), and Apr–Oct (6 months:
overwinter) intervals.
Sea lion predation
Observations of New Zealand sea lions killing sub-adult and adult penguins along the shoreline
and offshore from Penguin Bay were recorded in 2011 and 2012. We used binoculars to
classify sea lion kills as “confirmed” if a sea lion was observed killing or eating what appeared
to be a penguin (black and white colour pattern, correct size and shape, a prolonged handling
time lasting multiple minutes that involved tearing off chunks of flesh through vigorous head-
shaking and the conspicuous attendance of many avian scavengers; this was often seen
immediately after a raft of penguins had returned to or, less often, departed from the
shoreline). “Unconfirmed” kills were either observations of a dead penguin on the water not
associated with a sea lion, or a sea lion eating an item at sea that may have been prey other
than a penguin (e.g., octopus or large fish). We recorded all sea lion kills observed
opportunistically while we were in Penguin Bay from the penguins’ arrival in mid-Oct to our
departure c. 20 Jan, and during sea lion-focussed ‘all-day’ predation watches through most of
the daylight period (05:00 to 21:00) when two observers alternated 4-h shifts. Many chick-
rearing penguins departed the colony at 04:00–05:00 when it was still too dark to see offshore,
but most had come ashore by 21:00 in both years (Chapter 4). We recorded the timing of the
predation observation, general location, and the age-class (sub-adult or adult) and sex of the
sea lion when possible.
Data analysis
Egg fates
We used an information-theoretic approach to model selection to evaluate factors that
influenced the fate (hatch or fail) of A- and B-eggs (separately). It was common that an A-egg
failed in the 1–2 d after its sibling B-egg hatched, so we conducted a third analysis to consider
A-egg survival until B-egg hatching. This enabled us to differentiate between factors affecting
A-eggs before and after B-egg hatching. To assess our expectations that eggs would be more
vulnerable to predation if laid in smaller sub-colonies, in less sheltered sites, on the periphery,
or out of synchrony, we considered six explanatory variables in these models: year, colony,
nest shelter, nest position, lay date, and laying synchrony. We used an all-subsets approach to
model comparison, plus a null model, but excluded interactions because all possible additive
115
combinations of variables were equally biologically plausible. The candidate model set
included 64 models.
Following the methods of Burnham and Anderson (2002), we calculated Akaike’s
information criterion for small sample sizes (AICc) for all models, along with associated
parameters. We began by comparing the AICc values of the global model (including all six
variables) with and without a random effect of nest ID in order to determine whether such an
effect was needed to account for correlated fates between eggs laid at the same nest site in
both years. In both the A- and B-egg analyses the global model without the random effect of
nest ID had a lower AICc value, so we did not consider nest ID further. We used parameter
estimates and their standard errors from the most parsimonious and global models to assess
the size of the effect and thus biological significance of each parameter. All analyses used a
binomial distribution and the logit link function and were conducted using the arm package in
R Studio (Gelman et al. 2012; R Core Team 2012).
Daily egg and chick survival rates
Daily A- and B- egg and chick survival rates (S) were calculated based on the number of eggs or
chicks alive at the start (N1) and end (N2) of an incubation shift or the guard phase of duration
in days (t), while assuming an exponential rate of decay, from the formula:
S = e(ln(N2-N1)/t) [1]
Where e is the base of the natural logarithm. We did not account for inviable eggs in daily egg
survival rates. This approach to estimating egg and chick survival rates is similar to that of nest
survival by Mayfield (1961; 1975), with the exception that all of our nests were followed from
their initiation (A-egg lay) date. Our method would be improved be incorporating measures of
uncertainty in failure dates (Stanley 2000).
Modelling adult survival and recapture probabilities
Standard methods were used to estimate adult monthly survival (ϕ) and recapture (p, PIT tag
recording) rates (Lebreton et al. 1992; Cooch and White 2014) using program MARK (White
and Burnham 1999). Rates were estimated for six intervals between seven capture/recapture
occasions from Oct 2010 to Oct 2013. A longer time period and recording throughout the
breeding season and during each moult period would have allowed a better assessment of
116
whether survival rates were lower during the breeding season than at other times (as expected
if sea lion predation is important). Given the limitations of our dataset the primary objective of
the analysis was to provide an adult survival estimate for population modelling. First, a global
model was defined that allowed survival and recapture rates to vary between intervals and to
differ between the sexes. Second, reduced parameter models were constructed and evaluated
to examine support for the hypotheses that survival differed between intervals and the sexes,
and that survival was higher during all other periods (the ‘background’ rate) than during the
late breeding/pre-moult period of the 2012 breeding season (Jan–Apr 2013) when low adult
body masses, poor reproductive success, and low provisioning rates, especially of males,
suggested penguins were nutritionally stressed (Chapters 3 and 4). To reduce the number of
models compared, we used the method of Lebreton et al. (1992) by first finding the best-
supported parameterization of recapture rate and then keeping it unchanged while find the
best-supported parameterization of survival rate.
Goodness-of-fit was evaluated with the median ĉ procedure (Cooch and White 2014),
and the estimated variance inflation factor ĉ was used to adjust standard errors and calculate
QAICc, Akaike’s information criterion adjusted for lack of fit and small sample bias (Burnham
and Anderson 2002). Models were ranked according to Δi, the difference in QAICc value from
that of the top-ranked (most parsimonious) model. Adjusting for ĉ did not change model
rankings. We also calculated QAICc weights (wi). We used the sin link function and second-part
variance estimation. Survival and recapture rates are from the best-supported models and are
reported ± 95% confidence intervals. The survival analysis included 483 individuals (245 males
and 238 females; totals ‘tagged’ in Appendices 5.1 and 5.2). Most individuals were recaptured
on at least one subsequent occasion (86% for both sexes). The effective sample size was 1705
(859 males and 846 females). See Appendices 5.1 and 5.2 for recapture matrices.
Sea lion predation rates
We estimated the proportion of the penguin breeding population in Penguin Bay killed by sea
lions during the chick-rearing period in 2011 and 2012 as:
(p*d) / (n*2) [2]
where p = the average daily predation rate (kills/d) from the all-day watches, d = the duration
of the chick-rearing period (from the first hatch date to the expected median fledging date 68
d after the median hatch), and n = the total number of nests in Penguin Bay (Table 5.1). We
used the first hatch date instead of the median hatch date (a difference of 7 d in 2011 and 6 d
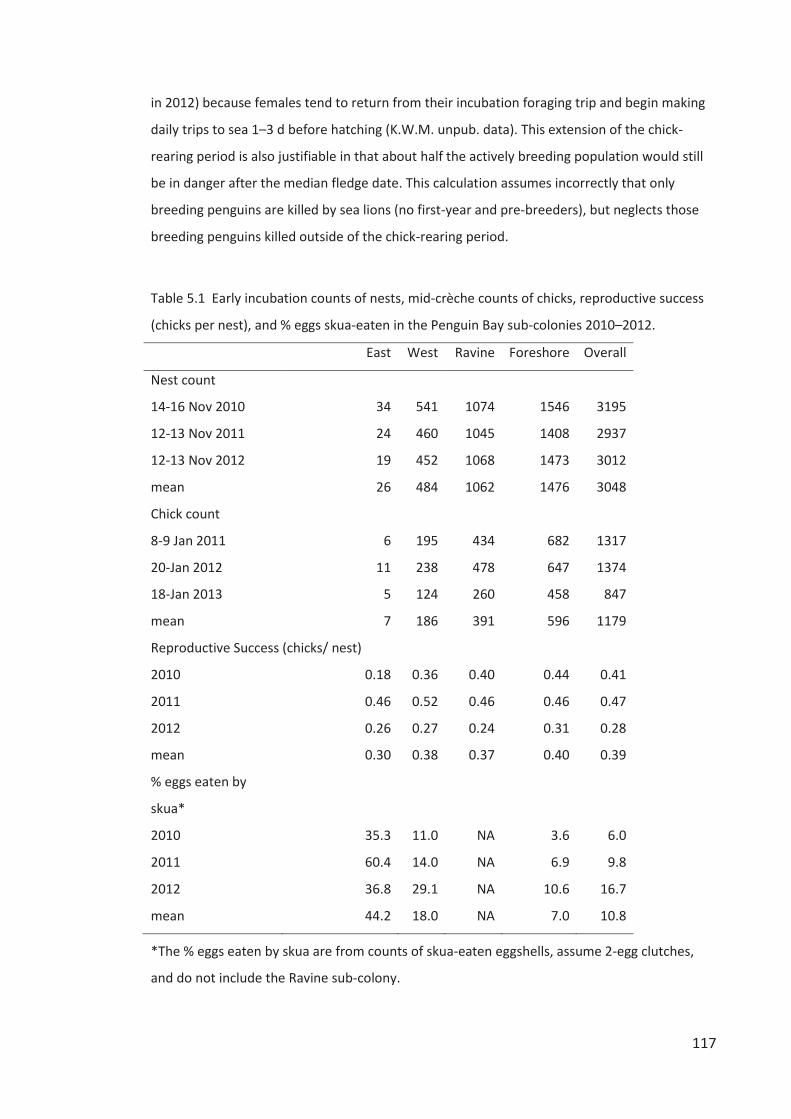
117
in 2012) because females tend to return from their incubation foraging trip and begin making
daily trips to sea 1–3 d before hatching (K.W.M. unpub. data). This extension of the chick-
rearing period is also justifiable in that about half the actively breeding population would still
be in danger after the median fledge date. This calculation assumes incorrectly that only
breeding penguins are killed by sea lions (no first-year and pre-breeders), but neglects those
breeding penguins killed outside of the chick-rearing period.
Table 5.1 Early incubation counts of nests, mid-crèche counts of chicks, reproductive success
(chicks per nest), and % eggs skua-eaten in the Penguin Bay sub-colonies 2010–2012.
East West Ravine Foreshore Overall
Nest count
14-16 Nov 2010 34 541 1074 1546 3195
12-13 Nov 2011 24 460 1045 1408 2937
12-13 Nov 2012 19 452 1068 1473 3012
mean 26 484 1062 1476 3048
Chick count
8-9 Jan 2011 6 195 434 682 1317
20-Jan 2012 11 238 478 647 1374
18-Jan 2013 5 124 260 458 847
mean 7 186 391 596 1179
Reproductive Success (chicks/ nest)
2010 0.18 0.36 0.40 0.44 0.41
2011 0.46 0.52 0.46 0.46 0.47
2012 0.26 0.27 0.24 0.31 0.28
mean 0.30 0.38 0.37 0.40 0.39
% eggs eaten by
skua*
2010 35.3 11.0 NA 3.6 6.0
2011 60.4 14.0 NA 6.9 9.8
2012 36.8 29.1 NA 10.6 16.7
mean 44.2 18.0 NA 7.0 10.8
*The % eggs eaten by skua are from counts of skua-eaten eggshells, assume 2-egg clutches,
and do not include the Ravine sub-colony.
118
Population model
We modelled the population growth rate in Penguin Bay using a Leslie matrix and the PopTools
add-in (Hood 2010) for Microsoft Excel (Microsoft Corporation). We assumed females began
breeding in their fifth year (i.e., they laid for the first time just before turning five years old
(Guinard et al. 1998; Dehnhard et al. 2014) and bred every year thereafter). The annual
fecundity rate (female chicks produced by each female breeder) we used was the average of
the 2010, 2011, and 2012 overall chicks/nest values (Table 5.1), divided by two under the
assumption of an equal sex ratio of chicks produced (0.387/2 = 0.1935). The first-year survival
rate we used was the average of the 2010 to 2011 and 2011 to 2012 first-year survival
estimates from the ‘First-year survival’ section below (0.505). We assumed that females
survived at a constant annual rate in their second-year and thereafter derived from the
monthly ‘background’ survival rate of 0.985 (annual survival = 0.98512 = 0.834). Elsewhere first-
year survival of Rockhopper Penguins is lower than survival of sub-adult and adults, which are
similar (Guinard et al. 1998; Dehnhard et al. 2014). For illustrative purposes we depict the
theoretical survival rates (adult and sub-adult survival rates set to be equal for ease of
interpretation) and reproductive success rates required for a stable population (λ = 1.0). For
comparison to the present study we also calculated the population growth rate using a Leslie
matrix of an increasing population of Southern Rockhopper Penguins on New Island, Falkland
Islands, using demographic data from the literature: reproductive success of 0.69 (2006;
Poisbleau et al. 2008), first-year survival of 0.81 (2006 and 2007 cohorts; Dehnhard et al.
2014), and a mean adult survival rate of 0.919 (2006–2010; Dehnhard et al. 2013)..
‘Predation-free’ population growth rate
We estimated a ‘predation-free’ population growth rate using estimates of reproductive
success and adult survival rates without the effects of predation we describe below. We have
assumed all sea lion mortality was of adult penguins, and so are unable to estimate a
‘predation-free’ first-year survival rate.
119
RESULTS
Egg fates
A-egg hatching success varied inter-annually and with nest shelter (Table 5.2). Hatching
success was higher in 2011 than 2012 (36 of 134 eggs, 26.9%, versus 18 of 123, 14.6%, Figure
5.2) and was higher in cavity nests (24 of 58, 41.4%) than in lee or exposed nests (lee, 20 of
128, 15.6%; exposed, 10 of 71, 14.1%, Figure 5.3). Other strongly supported models (Δi < 2.0)
additionally included effects of colony, nest position, lay date, or laying synchrony, but only
marginally increased the log-likelihood values over that of the most parsimonious model. In
the global model only year and nest shelter had estimates larger than their standard errors
(Table 5.3). Model rankings and relative support were very similar for the analysis considering
A-egg survival to B-egg hatching, despite a large proportion of A-egg failure occurring after B-
eggs hatched, as 55.4 and 45.0% of A-eggs alive at B-egg hatching failed post B-egg hatching in
2011 and 2012, respectively (Figure 5.2).
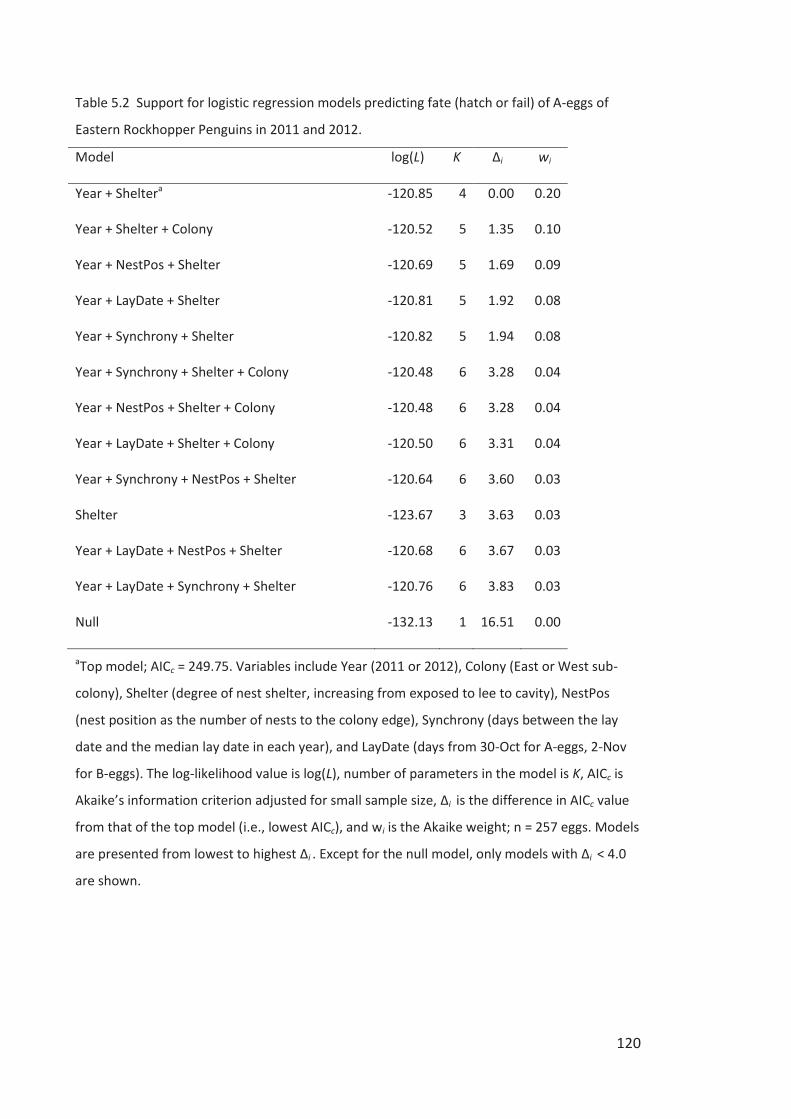
120
Table 5.2 Support for logistic regression models predicting fate (hatch or fail) of A-eggs of
Eastern Rockhopper Penguins in 2011 and 2012.
Model log(L) K Δi wi
Year + Sheltera -120.85 4 0.00 0.20
Year + Shelter + Colony -120.52 5 1.35 0.10
Year + NestPos + Shelter -120.69 5 1.69 0.09
Year + LayDate + Shelter -120.81 5 1.92 0.08
Year + Synchrony + Shelter -120.82 5 1.94 0.08
Year + Synchrony + Shelter + Colony -120.48 6 3.28 0.04
Year + NestPos + Shelter + Colony -120.48 6 3.28 0.04
Year + LayDate + Shelter + Colony -120.50 6 3.31 0.04
Year + Synchrony + NestPos + Shelter -120.64 6 3.60 0.03
Shelter -123.67 3 3.63 0.03
Year + LayDate + NestPos + Shelter -120.68 6 3.67 0.03
Year + LayDate + Synchrony + Shelter -120.76 6 3.83 0.03
Null -132.13 1 16.51 0.00
aTop model; AICc = 249.75. Variables include Year (2011 or 2012), Colony (East or West sub-
colony), Shelter (degree of nest shelter, increasing from exposed to lee to cavity), NestPos
(nest position as the number of nests to the colony edge), Synchrony (days between the lay
date and the median lay date in each year), and LayDate (days from 30-Oct for A-eggs, 2-Nov
for B-eggs). The log-likelihood value is log(L), number of parameters in the model is K, AICc is
Akaike’s information criterion adjusted for small sample size, Δi is the difference in AICc value
from that of the top model (i.e., lowest AICc), and wi is the Akaike weight; n = 257 eggs. Models
are presented from lowest to highest Δi . Except for the null model, only models with Δi < 4.0
are shown.
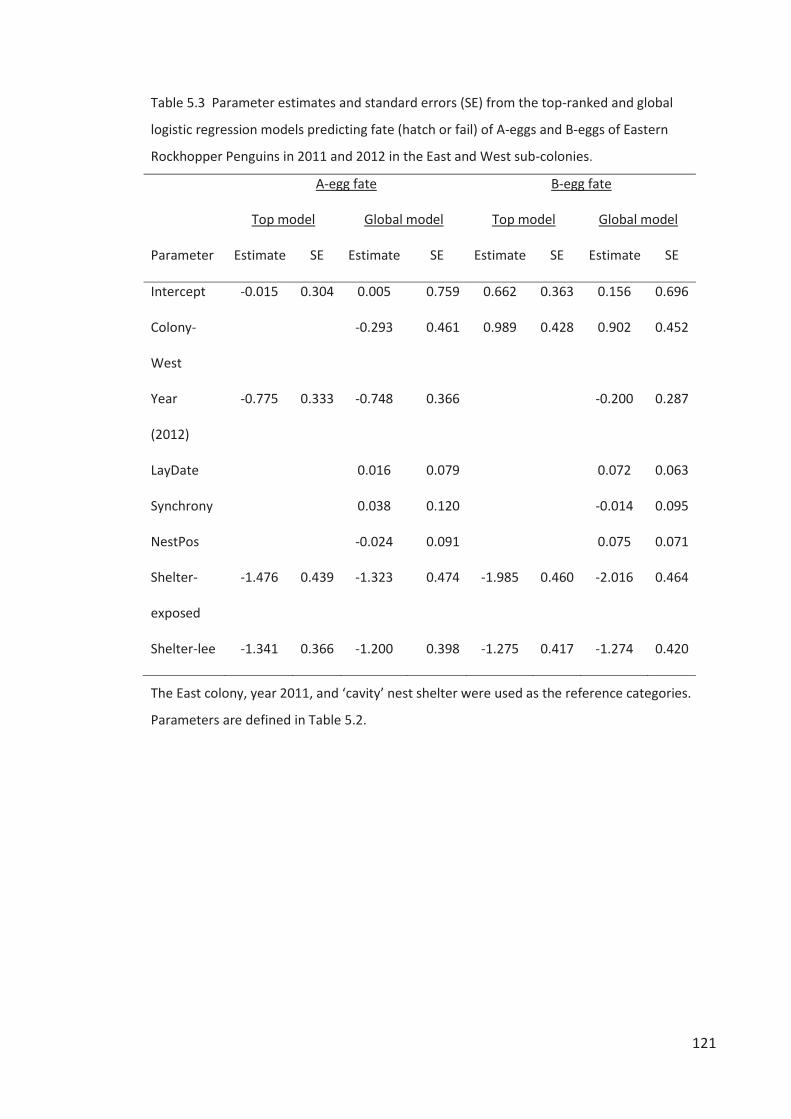
121
Table 5.3 Parameter estimates and standard errors (SE) from the top-ranked and global
logistic regression models predicting fate (hatch or fail) of A-eggs and B-eggs of Eastern
Rockhopper Penguins in 2011 and 2012 in the East and West sub-colonies.
A-egg fate B-egg fate
Top model Global model Top model Global model
Parameter Estimate SE Estimate SE Estimate SE Estimate SE
Intercept -0.015 0.304 0.005 0.759 0.662 0.363 0.156 0.696
Colony-
West
-0.293 0.461 0.989 0.428 0.902 0.452
Year
(2012)
-0.775 0.333 -0.748 0.366 -0.200 0.287
LayDate 0.016 0.079 0.072 0.063
Synchrony 0.038 0.120 -0.014 0.095
NestPos -0.024 0.091 0.075 0.071
Shelter-
exposed
-1.476 0.439 -1.323 0.474 -1.985 0.460 -2.016 0.464
Shelter-lee -1.341 0.366 -1.200 0.398 -1.275 0.417 -1.274 0.420
The East colony, year 2011, and ‘cavity’ nest shelter were used as the reference categories.
Parameters are defined in Table 5.2.
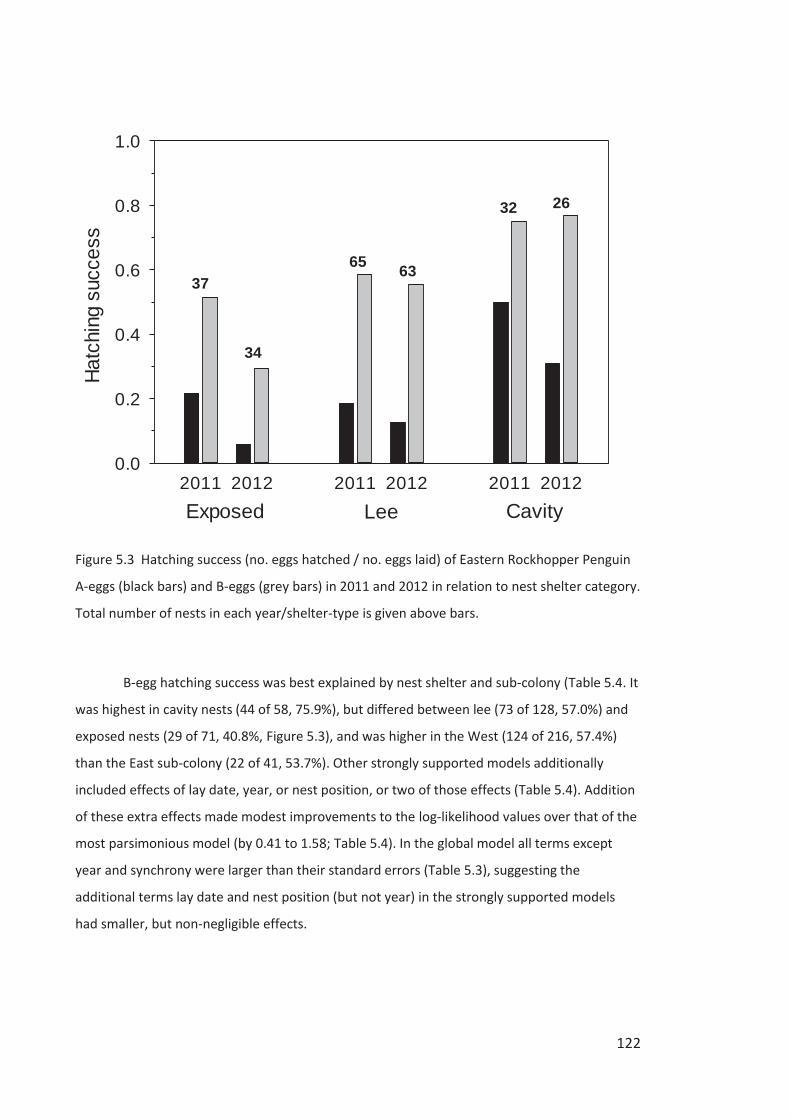
122
Lee2011 2012 2011 2012 2011 2012
Hatc
hing
suc
cess
0.0
0.2
0.4
0.6
0.8
1.0
Exposed Cavity
37
34
65 63
32 26
Figure 5.3 Hatching success (no. eggs hatched / no. eggs laid) of Eastern Rockhopper Penguin
A-eggs (black bars) and B-eggs (grey bars) in 2011 and 2012 in relation to nest shelter category.
Total number of nests in each year/shelter-type is given above bars.
B-egg hatching success was best explained by nest shelter and sub-colony (Table 5.4. It
was highest in cavity nests (44 of 58, 75.9%), but differed between lee (73 of 128, 57.0%) and
exposed nests (29 of 71, 40.8%, Figure 5.3), and was higher in the West (124 of 216, 57.4%)
than the East sub-colony (22 of 41, 53.7%). Other strongly supported models additionally
included effects of lay date, year, or nest position, or two of those effects (Table 5.4). Addition
of these extra effects made modest improvements to the log-likelihood values over that of the
most parsimonious model (by 0.41 to 1.58; Table 5.4). In the global model all terms except
year and synchrony were larger than their standard errors (Table 5.3), suggesting the
additional terms lay date and nest position (but not year) in the strongly supported models
had smaller, but non-negligible effects.
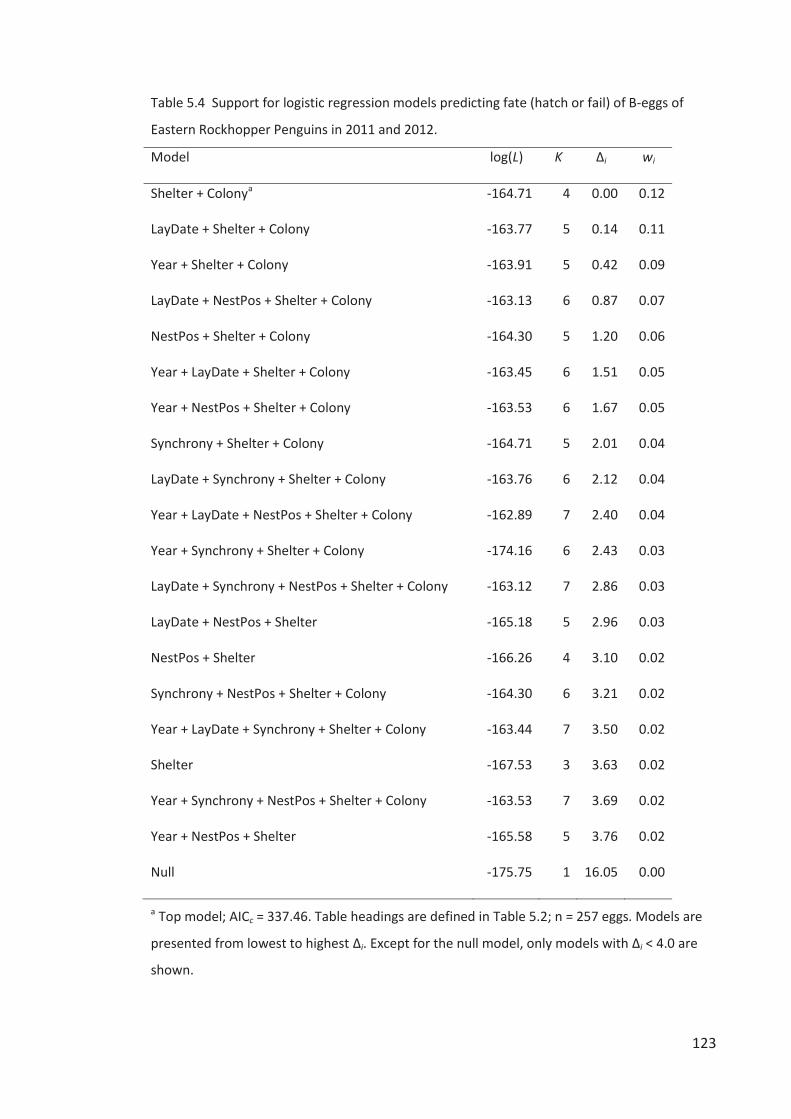
123
Table 5.4 Support for logistic regression models predicting fate (hatch or fail) of B-eggs of
Eastern Rockhopper Penguins in 2011 and 2012.
Model log(L) K Δi wi
Shelter + Colonya -164.71 4 0.00 0.12
LayDate + Shelter + Colony -163.77 5 0.14 0.11
Year + Shelter + Colony -163.91 5 0.42 0.09
LayDate + NestPos + Shelter + Colony -163.13 6 0.87 0.07
NestPos + Shelter + Colony -164.30 5 1.20 0.06
Year + LayDate + Shelter + Colony -163.45 6 1.51 0.05
Year + NestPos + Shelter + Colony -163.53 6 1.67 0.05
Synchrony + Shelter + Colony -164.71 5 2.01 0.04
LayDate + Synchrony + Shelter + Colony -163.76 6 2.12 0.04
Year + LayDate + NestPos + Shelter + Colony -162.89 7 2.40 0.04
Year + Synchrony + Shelter + Colony -174.16 6 2.43 0.03
LayDate + Synchrony + NestPos + Shelter + Colony -163.12 7 2.86 0.03
LayDate + NestPos + Shelter -165.18 5 2.96 0.03
NestPos + Shelter -166.26 4 3.10 0.02
Synchrony + NestPos + Shelter + Colony -164.30 6 3.21 0.02
Year + LayDate + Synchrony + Shelter + Colony -163.44 7 3.50 0.02
Shelter -167.53 3 3.63 0.02
Year + Synchrony + NestPos + Shelter + Colony -163.53 7 3.69 0.02
Year + NestPos + Shelter -165.58 5 3.76 0.02
Null -175.75 1 16.05 0.00
a Top model; AICc = 337.46. Table headings are defined in Table 5.2; n = 257 eggs. Models are
presented from lowest to highest Δi. Except for the null model, only models with Δi < 4.0 are
shown.
124
The mean lay date of B-eggs that hatched (7.56 ± 2.32 d) was only slightly later than
for those which failed (7.13 ± 2.41 d). As found for A-eggs, hatching success of B-eggs was
higher in 2011 (81 of 134, 60.4%) than in 2012 (65 of 123, 52.8%). Lay date and year are
confounded, because the average lay date of B-eggs was later in 2011 (8.25 ± 2.22 d) than in
2012 (6.42 ± 2.15 d). However, within both years, B-eggs that hatched had a slightly later lay
date (2011: 8.37 ± 2.15 d, 2012: 6.55 ± 2.14 d) than those which failed (2011: 8.06 ± 2.32 d,
2012: 6.28 ± 2.18 d). B-eggs that hatched came from more interior nests (mean nest position =
2.44 ± 2.14 nests to periphery) than those that failed (2.27 ± 2.01 nests to periphery).
However, nest position is confounded with nest shelter, because cavity nests tended to be on
the colony periphery (1.48 ± 1.83 nests to periphery) relative to lee nests (2.55 ± 2.09 nests to
periphery) and exposed nests (2.76 ± 2.09 nests to periphery). Thus, nest position is likely to
have a stronger effect on hatching success in a sample where cavity nests are more evenly
distributed between interior and peripheral nests. In summary, nest shelter and colony had
strong effects on B-egg hatching success, whereas lay date and nest position had lesser effects
(Table 5.3). The global model predicted that the hatching probability of B-eggs increased from
0.56 to 0.78 over the range of lay dates measured, and from 0.54 to 0.70 over the range of
nest positions measured. The greater increase in hatching success with lay date than nest
position suggests that lay date had a larger effect than nest position.
Daily egg and chick survival rates
As predicted based on nest defence ability from skua predation, overall daily egg survival rates
were highest during shared incubation, intermediate during male-only incubation, and lowest
during female-only incubation (Table 5.5, Figure 5.2). A-eggs had a very high failure rate after
B-eggs hatched. This post B-egg hatching period averaged only 1-day duration in both years,
but 55.4 and 45.0% of A-eggs alive at B-egg hatching failed post B-egg hatching in 2011 and
2012, respectively (Table 5.5, Figure 5.2).
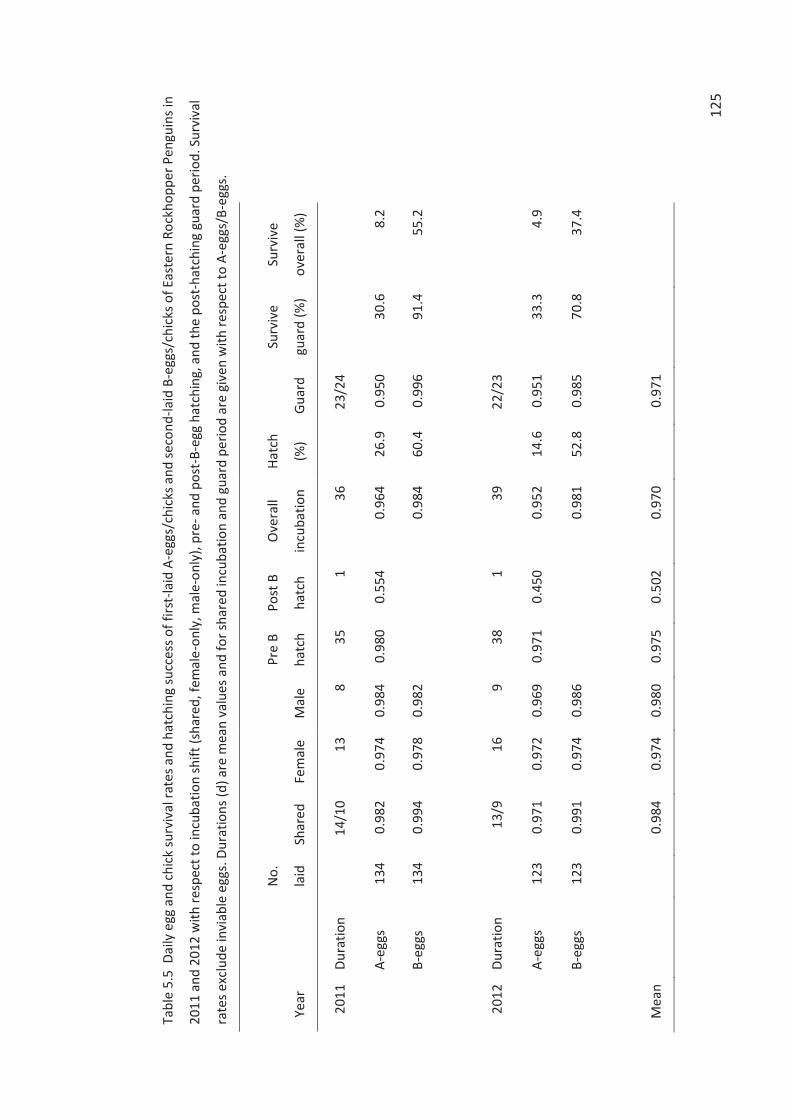
125
Tabl
e 5.
5 D
aily
egg
and
chi
ck su
rviv
al ra
tes a
nd h
atch
ing
succ
ess o
f firs
t-la
id A
-egg
s/ch
icks
and
seco
nd-la
id B
-egg
s/ch
icks
of E
aste
rn R
ockh
oppe
r Pen
guin
s in
2011
and
201
2 w
ith re
spec
t to
incu
batio
n sh
ift (s
hare
d, fe
mal
e-on
ly, m
ale-
only
), pr
e- a
nd p
ost-B
-egg
hat
chin
g, a
nd th
e po
st-h
atch
ing
guar
d pe
riod.
Sur
viva
l
rate
s exc
lude
invi
able
egg
s. D
urat
ions
(d) a
re m
ean
valu
es a
nd fo
r sha
red
incu
batio
n an
d gu
ard
perio
d ar
e gi
ven
with
resp
ect t
o A-
eggs
/B-e
ggs.
Year
No.
laid
Sh
ared
Fe
mal
e M
ale
Pre
B
hatc
h
Post
B
hatc
h
Ove
rall
incu
batio
n
Hatc
h
(%)
Guar
d
Surv
ive
guar
d (%
)
Surv
ive
over
all (
%)
2011
Du
ratio
n
14/1
0 13
8
35
1 36
23/2
4
A-
eggs
13
4 0.
982
0.97
4 0.
984
0.98
0 0.
554
0.96
4 26
.9
0.95
0 30
.6
8.2
B-
eggs
13
4 0.
994
0.97
8 0.
982
0.98
4 60
.4
0.99
6 91
.4
55.2
2012
Du
ratio
n
13
/9
16
9 38
1
39
22
/23
A-
eggs
12
3 0.
971
0.97
2 0.
969
0.97
1 0.
450
0.95
2 14
.6
0.95
1 33
.3
4.9
B-
eggs
12
3 0.
991
0.97
4 0.
986
0.98
1 52
.8
0.98
5 70
.8
37.4
Mea
n
0.
984
0.97
4 0.
980
0.97
5 0.
502
0.97
0
0.97
1
126
Daily chick survival rates during the guard period were similar to overall daily egg
survival rates for both A- and B-eggs in 2012; in 2011 A-chick survival was slightly lower and B-
chick survival slightly higher than their respective egg survival rates (Table 5.5). As incubation
lasted longer than the guard period, a higher proportion of A- and B-chicks survived the guard
period than eggs hatched in both years (even though daily survival rates were similar for eggs
and chicks in 2012). B-chicks survived considerably better in 2011 than 2012 (91.4 and 70.8%
respectively), but there was no difference between years for A-chicks (30.6 and 33.3%
surviving). The lack of a difference in survival rates for A-chicks reflects the higher frequency of
both chicks hatching in 2011 than 2012 (28 of 134, 20.9%, versus 11 of 123, 8.9%). When both
chicks hatched, the A-chick generally died (at 5.6 ± 2.1 d old), so mortality rates were similar,
despite 2011 being a better breeding season overall.
First-year survival
Our first-year survival estimates were 0.587 over 2010 to 2011 and 0.422 over 2011 to 2012
(Table 5.6), for an average of 0.505. At the sub-colony level first-year survival rates appear to
increase with increasing colony size, but we expect that this is an artefact of first-year
penguins choosing to moult along the shoreline and at larger sub-colonies (i.e., the Foreshore
sub-colony), rather than a true inter-colony difference in survival rates. Counts of first-year
penguins were high around the time of hatching in mid-Dec when they came ashore to
prospect, low late-Dec and early-Jan, and increased to a maximum in mid-to-late Jan as first-
year penguins came ashore to moult (Table 5.6). Our maximum counts of first-year penguins
were the last made each season, suggesting later counts may have been even higher.
However, later counts may miss birds that had completed their moult and gone to sea.
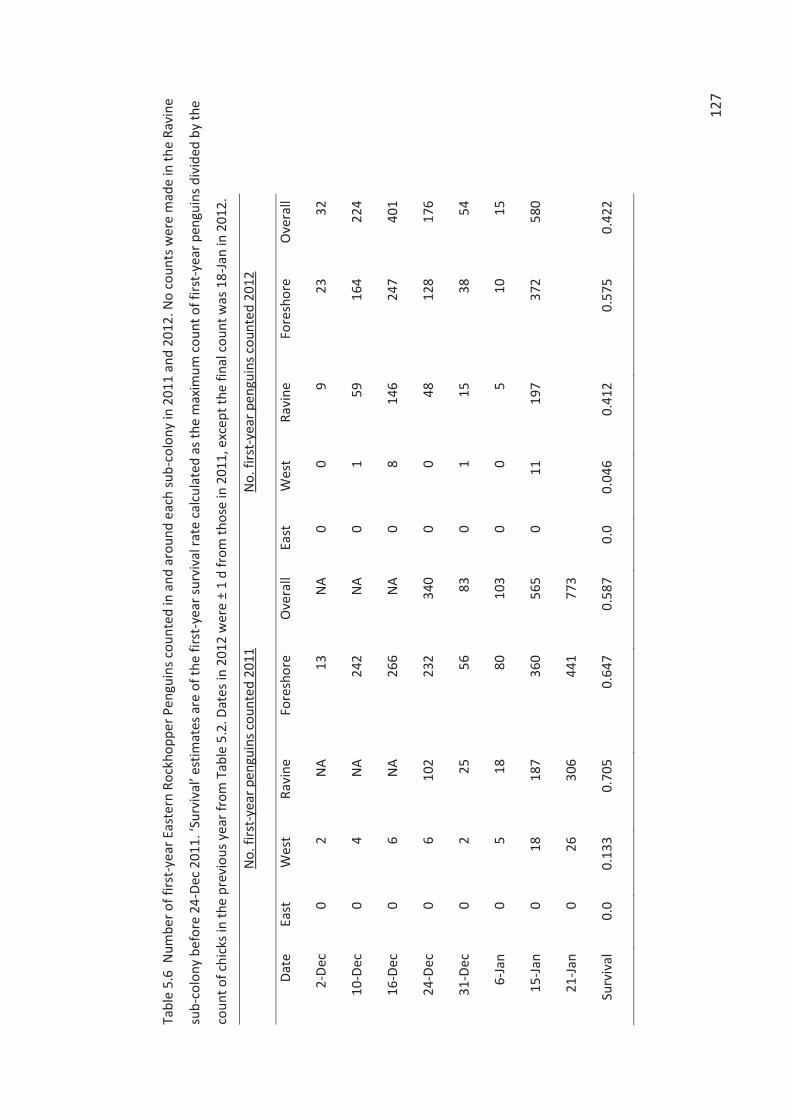
127
Tabl
e 5.
6 N
umbe
r of f
irst-y
ear E
aste
rn R
ockh
oppe
r Pen
guin
s cou
nted
in a
nd a
roun
d ea
ch su
b-co
lony
in 2
011
and
2012
. No
coun
ts w
ere
mad
e in
the
Ravi
ne
sub-
colo
ny b
efor
e 24
-Dec
201
1. ‘S
urvi
val’
estim
ates
are
of t
he fi
rst-
year
surv
ival
rate
cal
cula
ted
as th
e m
axim
um c
ount
of f
irst-
year
pen
guin
s div
ided
by
the
coun
t of c
hick
s in
the
prev
ious
yea
r fro
m T
able
5.2
. Dat
es in
201
2 w
ere
± 1
d fr
om th
ose
in 2
011,
exc
ept t
he fi
nal c
ount
was
18-
Jan
in 2
012.
N
o. fi
rst-y
ear p
engu
ins c
ount
ed 2
011
No.
firs
t-yea
r pen
guin
s cou
nted
201
2
Date
Ea
st
Wes
t Ra
vine
Fo
resh
ore
Ove
rall
East
W
est
Ravi
ne
Fore
shor
e O
vera
ll
2-De
c 0
2 N
A 13
N
A 0
0 9
23
32
10-D
ec
0 4
NA
242
NA
0 1
59
164
224
16-D
ec
0 6
NA
266
NA
0 8
146
247
401
24-D
ec
0 6
102
232
340
0 0
48
128
176
31-D
ec
0 2
25
56
83
0 1
15
38
54
6-Ja
n 0
5 18
80
10
3 0
0 5
10
15
15-Ja
n 0
18
187
360
565
0 11
19
7 37
2 58
0
21-Ja
n 0
26
306
441
773
Surv
ival
0.
0 0.
133
0.70
5 0.
647
0.58
7 0.
0 0.
046
0.41
2 0.
575
0.42
2
128
Adult survival and recapture rates
The global model of adult survival and recapture rates explained the data adequately (ĉ =
1.273). The most parsimonious model in the candidate set included a survival rate that differed
between the sexes during late breeding/pre-moult of the 2012 breeding season and differed
from all other years over which survival was constant and the same between the sexes (Table
5.7). This top model estimated that the monthly survival rate was 0.985 ± 0.002 in all intervals,
except lower in males during late breeding/pre-moult in 2012 (0.947 ± 0.038) and lower still
during the same period in females (0.882 ± 0.043, Table 5.8). Thus, over the late breeding/pre-
moult interval of the 2012 season, the mortality rate was higher from the background rate by
3.5 times for males and 7.9 times for females. The monthly background survival rate for both
sexes, and the male and female monthly survival estimates during late breeding/pre-moult
equate to annual survival estimates of 0.834, 0.520, and 0.222, respectively. The second-
ranked model had one fewer parameter (no sex effect on survival during late breeding/pre-
moult in 2012) and was also well supported (low Δi and similarly high proportion of the QAICc
weights). Estimates from the second-ranked model differed only in the sexes having the same
probability of monthly survival during late breeding/pre-moult in 2012 (0.920 ± 0.034,
mortality rate 5.3 times the background rate). No other model was as well supported (all Δi >
2; Burnham and Anderson 2002). Together the two top-ranked models that allowed survival to
differ during late breeding/pre-moult of the 2012 breeding season had 12 times the support of
the third-ranked model in which survival was constant through time.
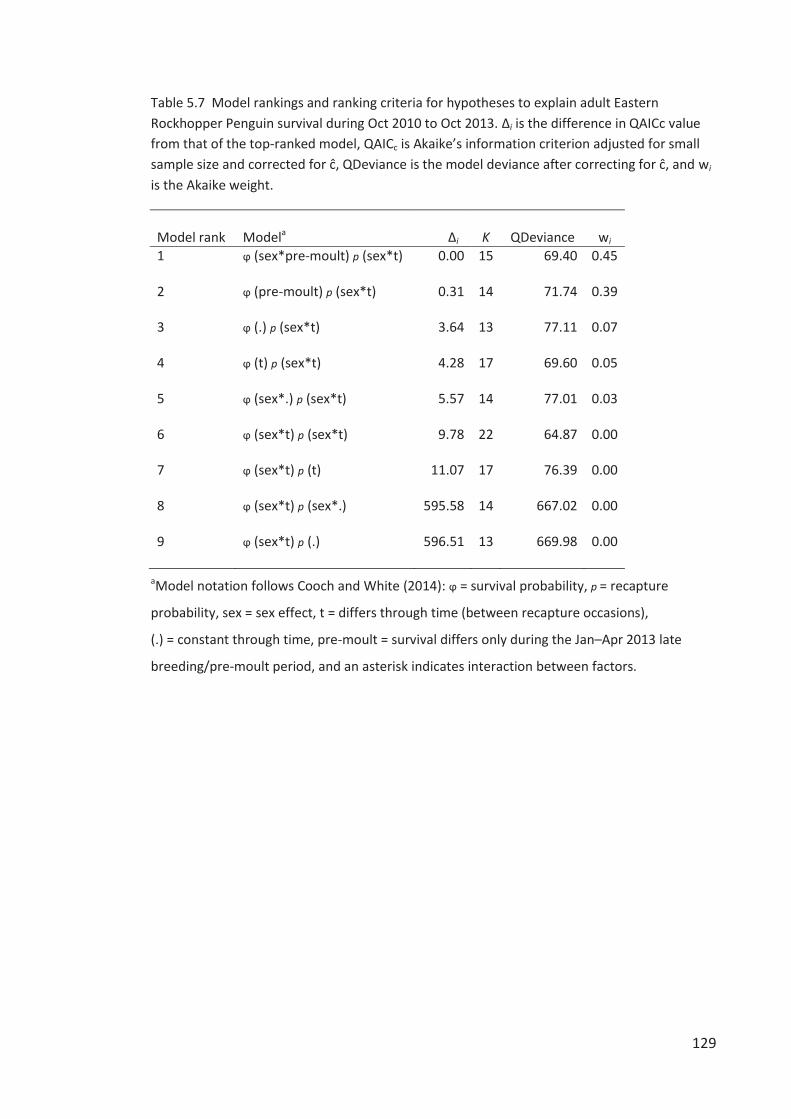
129
Table 5.7 Model rankings and ranking criteria for hypotheses to explain adult Eastern Rockhopper Penguin survival during Oct 2010 to Oct 2013. Δi is the difference in QAICc value from that of the top-ranked model, QAICc is Akaike’s information criterion adjusted for small sample size and corrected for ĉ, QDeviance is the model deviance after correcting for ĉ, and wi is the Akaike weight.
Model rank Modela Δi
K
QDeviance
wi
1 ϕ (sex*pre-moult) p (sex*t) 0.00 15 69.40 0.45
2 ϕ (pre-moult) p (sex*t) 0.31 14 71.74 0.39
3 ϕ (.) p (sex*t) 3.64 13 77.11 0.07
4 ϕ (t) p (sex*t) 4.28 17 69.60 0.05
5 ϕ (sex*.) p (sex*t) 5.57 14 77.01 0.03
6 ϕ (sex*t) p (sex*t) 9.78 22 64.87 0.00
7 ϕ (sex*t) p (t) 11.07 17 76.39 0.00
8 ϕ (sex*t) p (sex*.) 595.58 14 667.02 0.00
9 ϕ (sex*t) p (.) 596.51 13 669.98 0.00
aModel notation follows Cooch and White (2014): ϕ = survival probability, p = recapture
probability, sex = sex effect, t = differs through time (between recapture occasions),
(.) = constant through time, pre-moult = survival differs only during the Jan–Apr 2013 late
breeding/pre-moult period, and an asterisk indicates interaction between factors.
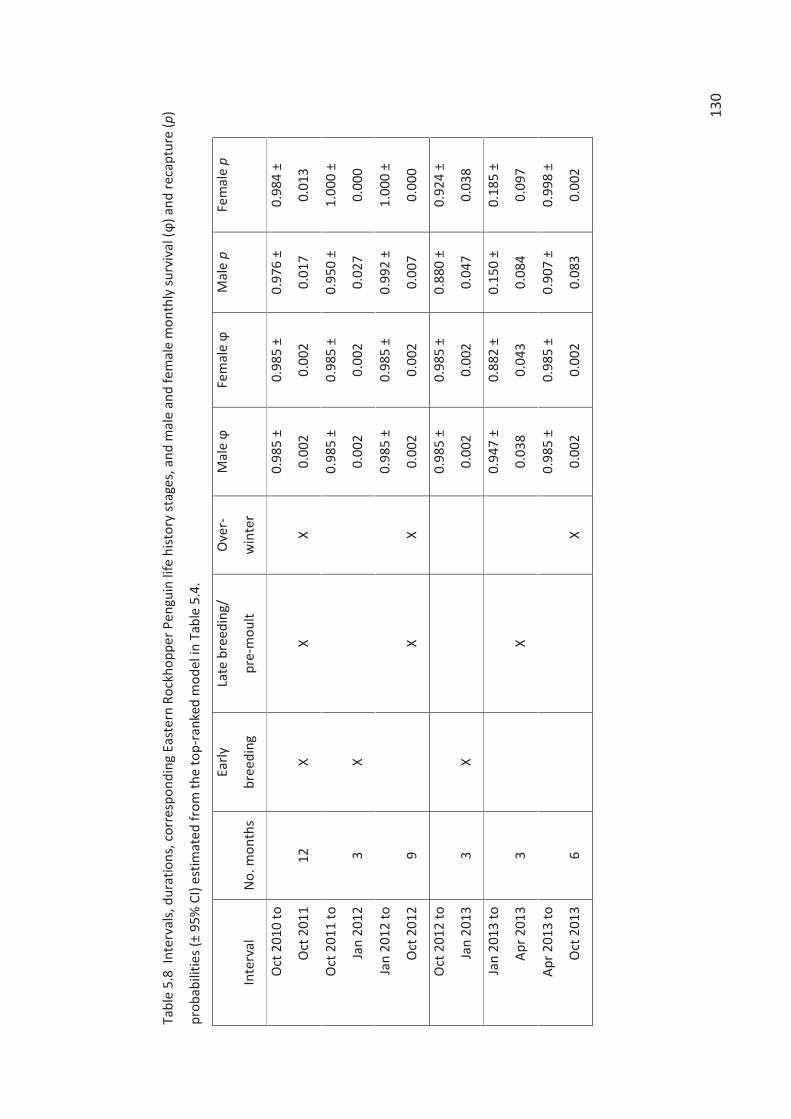
130
Tabl
e 5.
8 In
terv
als,
dur
atio
ns, c
orre
spon
ding
Eas
tern
Roc
khop
per P
engu
in li
fe h
istor
y st
ages
, and
mal
e an
d fe
mal
e m
onth
ly su
rviv
al (ϕ
) and
reca
ptur
e (p
)
prob
abili
ties (
± 95
% C
I) es
timat
ed fr
om th
e to
p-ra
nked
mod
el in
Tab
le 5
.4.
Inte
rval
N
o. m
onth
s
Early
bree
ding
Late
bre
edin
g/
pre-
mou
lt
Ove
r-
win
ter
Mal
e ϕ
Fe
mal
e ϕ
M
ale
p Fe
mal
e p
Oct
201
0 to
Oct
201
1 12
X
X X
0.98
5 ±
0.00
2
0.98
5 ±
0.00
2
0.97
6 ±
0.01
7
0.98
4 ±
0.01
3
Oct
201
1 to
Jan
2012
3
X
0.98
5 ±
0.00
2
0.98
5 ±
0.00
2
0.95
0 ±
0.02
7
1.00
0 ±
0.00
0
Jan
2012
to
Oct
201
2 9
X X
0.98
5 ±
0.00
2
0.98
5 ±
0.00
2
0.99
2 ±
0.00
7
1.00
0 ±
0.00
0
Oct
201
2 to
Jan
2013
3
X
0.98
5 ±
0.00
2
0.98
5 ±
0.00
2
0.88
0 ±
0.04
7
0.92
4 ±
0.03
8
Jan
2013
to
Apr 2
013
3 X
0.94
7 ±
0.03
8
0.88
2 ±
0.04
3
0.15
0 ±
0.08
4
0.18
5 ±
0.09
7
Apr 2
013
to
Oct
201
3 6
X
0.98
5 ±
0.00
2
0.98
5 ±
0.00
2
0.90
7 ±
0.08
3
0.99
8 ±
0.00
2
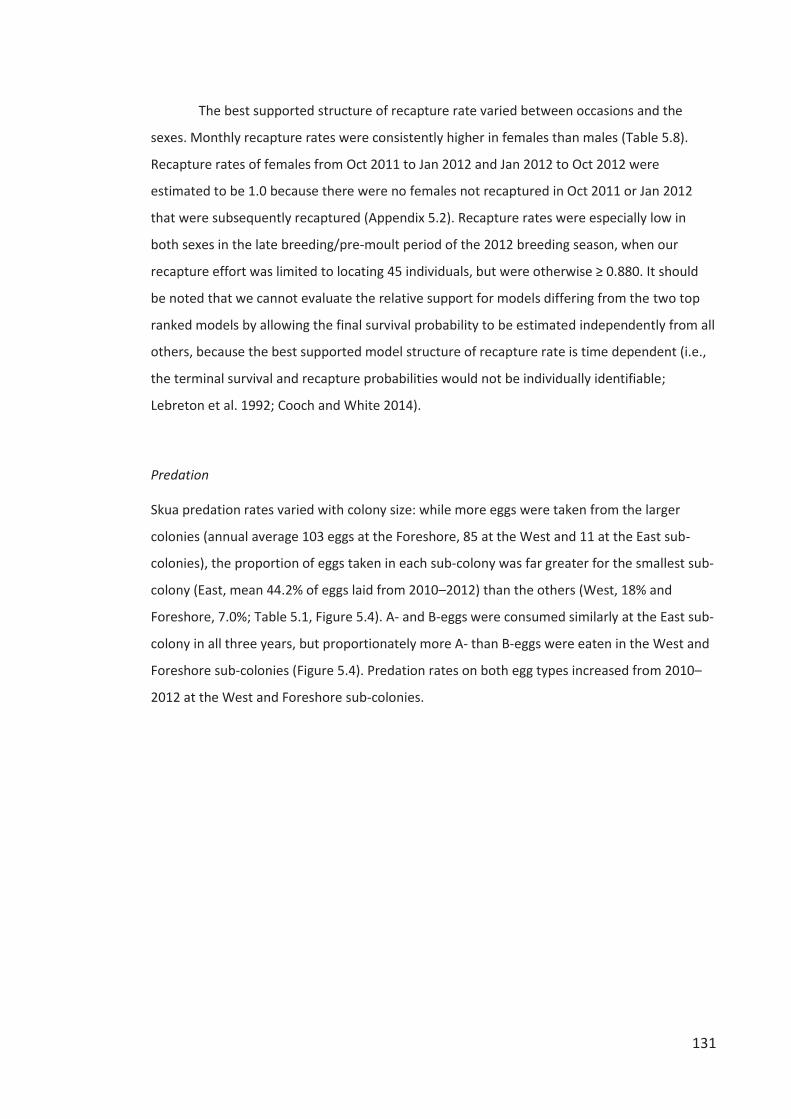
131
The best supported structure of recapture rate varied between occasions and the
sexes. Monthly recapture rates were consistently higher in females than males (Table 5.8).
Recapture rates of females from Oct 2011 to Jan 2012 and Jan 2012 to Oct 2012 were
estimated to be 1.0 because there were no females not recaptured in Oct 2011 or Jan 2012
that were subsequently recaptured (Appendix 5.2). Recapture rates were especially low in
both sexes in the late breeding/pre-moult period of the 2012 breeding season, when our
recapture effort was limited to locating 45 individuals, but were otherwise ≥ 0.880. It should
be noted that we cannot evaluate the relative support for models differing from the two top
ranked models by allowing the final survival probability to be estimated independently from all
others, because the best supported model structure of recapture rate is time dependent (i.e.,
the terminal survival and recapture probabilities would not be individually identifiable;
Lebreton et al. 1992; Cooch and White 2014).
Predation
Skua predation rates varied with colony size: while more eggs were taken from the larger
colonies (annual average 103 eggs at the Foreshore, 85 at the West and 11 at the East sub-
colonies), the proportion of eggs taken in each sub-colony was far greater for the smallest sub-
colony (East, mean 44.2% of eggs laid from 2010–2012) than the others (West, 18% and
Foreshore, 7.0%; Table 5.1, Figure 5.4). A- and B-eggs were consumed similarly at the East sub-
colony in all three years, but proportionately more A- than B-eggs were eaten in the West and
Foreshore sub-colonies (Figure 5.4). Predation rates on both egg types increased from 2010–
2012 at the West and Foreshore sub-colonies.
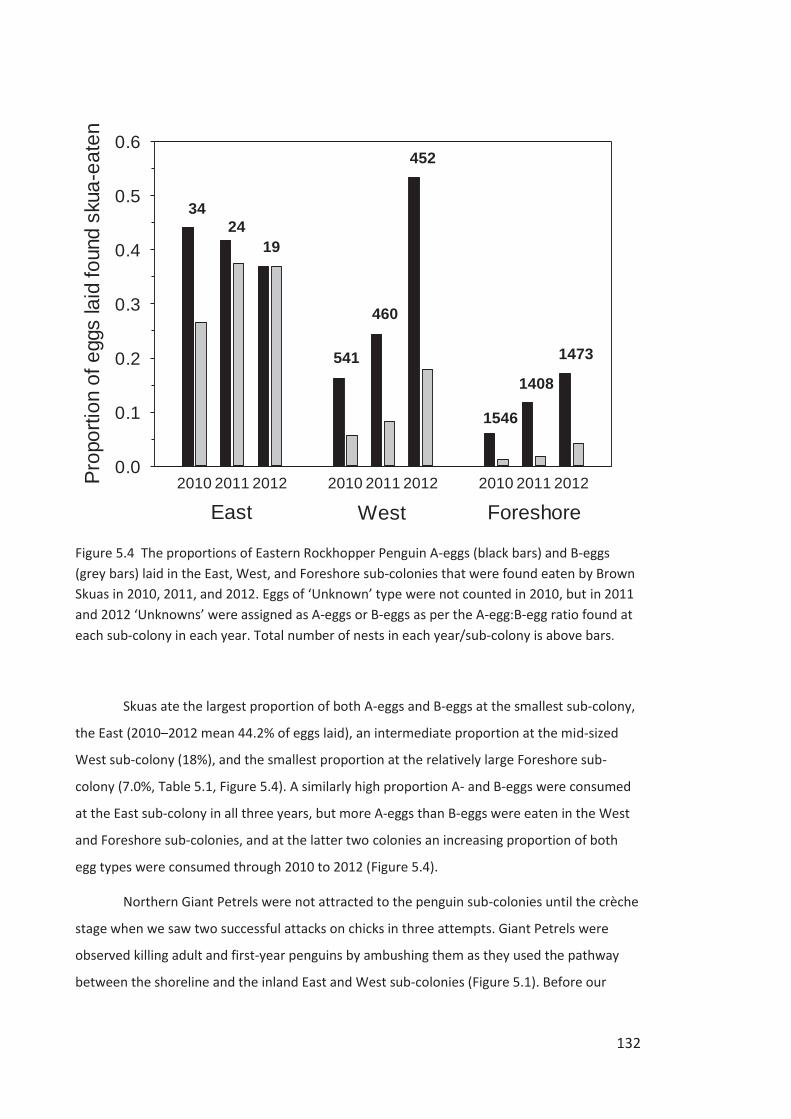
132
West2010 2011 2012 2010 2011 2012 2010 2011 2012Pr
opor
tion
of e
ggs
laid
foun
d sk
ua-e
aten
0.0
0.1
0.2
0.3
0.4
0.5
0.6
East Foreshore
2419
34
541
460
452
1546
1408
1473
Figure 5.4 The proportions of Eastern Rockhopper Penguin A-eggs (black bars) and B-eggs (grey bars) laid in the East, West, and Foreshore sub-colonies that were found eaten by Brown Skuas in 2010, 2011, and 2012. Eggs of ‘Unknown’ type were not counted in 2010, but in 2011 and 2012 ‘Unknowns’ were assigned as A-eggs or B-eggs as per the A-egg:B-egg ratio found at each sub-colony in each year. Total number of nests in each year/sub-colony is above bars.
Skuas ate the largest proportion of both A-eggs and B-eggs at the smallest sub-colony,
the East (2010–2012 mean 44.2% of eggs laid), an intermediate proportion at the mid-sized
West sub-colony (18%), and the smallest proportion at the relatively large Foreshore sub-
colony (7.0%, Table 5.1, Figure 5.4). A similarly high proportion A- and B-eggs were consumed
at the East sub-colony in all three years, but more A-eggs than B-eggs were eaten in the West
and Foreshore sub-colonies, and at the latter two colonies an increasing proportion of both
egg types were consumed through 2010 to 2012 (Figure 5.4).
Northern Giant Petrels were not attracted to the penguin sub-colonies until the crèche
stage when we saw two successful attacks on chicks in three attempts. Giant Petrels were
observed killing adult and first-year penguins by ambushing them as they used the pathway
between the shoreline and the inland East and West sub-colonies (Figure 5.1). Before our
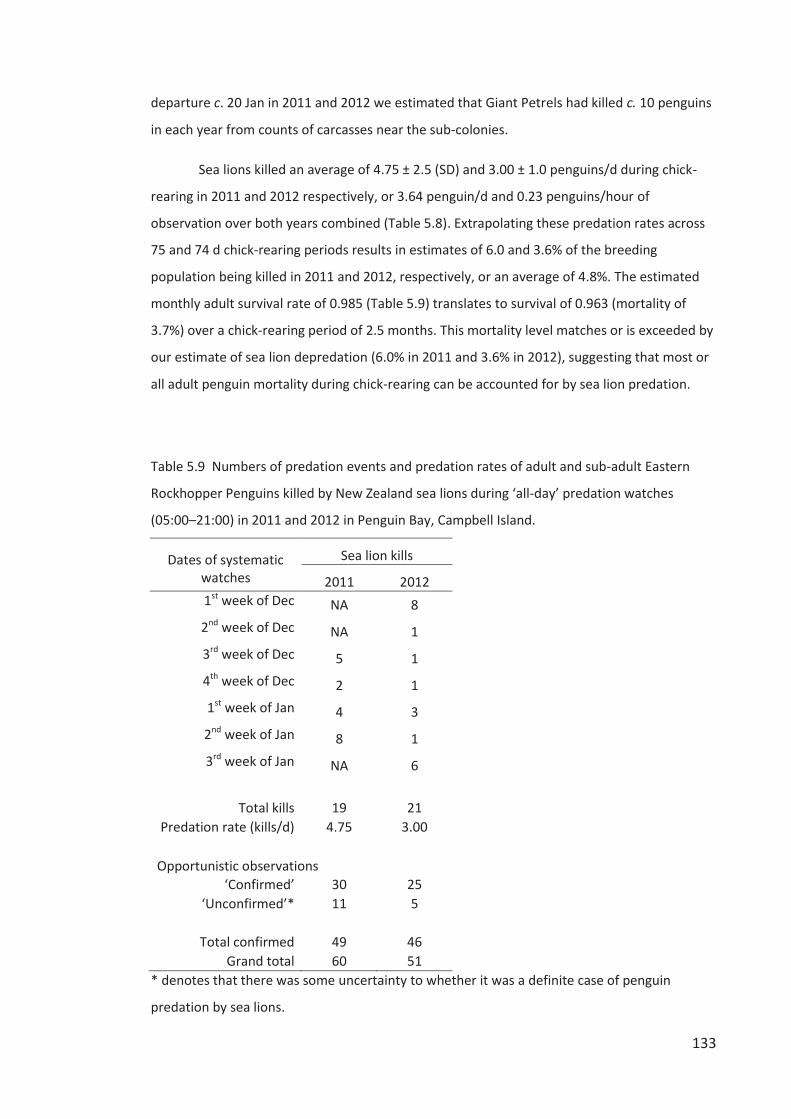
133
departure c. 20 Jan in 2011 and 2012 we estimated that Giant Petrels had killed c. 10 penguins
in each year from counts of carcasses near the sub-colonies.
Sea lions killed an average of 4.75 ± 2.5 (SD) and 3.00 ± 1.0 penguins/d during chick-
rearing in 2011 and 2012 respectively, or 3.64 penguin/d and 0.23 penguins/hour of
observation over both years combined (Table 5.8). Extrapolating these predation rates across
75 and 74 d chick-rearing periods results in estimates of 6.0 and 3.6% of the breeding
population being killed in 2011 and 2012, respectively, or an average of 4.8%. The estimated
monthly adult survival rate of 0.985 (Table 5.9) translates to survival of 0.963 (mortality of
3.7%) over a chick-rearing period of 2.5 months. This mortality level matches or is exceeded by
our estimate of sea lion depredation (6.0% in 2011 and 3.6% in 2012), suggesting that most or
all adult penguin mortality during chick-rearing can be accounted for by sea lion predation.
Table 5.9 Numbers of predation events and predation rates of adult and sub-adult Eastern
Rockhopper Penguins killed by New Zealand sea lions during ‘all-day’ predation watches
(05:00–21:00) in 2011 and 2012 in Penguin Bay, Campbell Island.
Dates of systematic watches
Sea lion kills
2011 2012 1st week of Dec NA 8 2nd week of Dec NA 1 3rd week of Dec 5 1 4th week of Dec 2 1 1st week of Jan 4 3 2nd week of Jan 8 1 3rd week of Jan NA 6
Total kills 19 21 Predation rate (kills/d) 4.75 3.00
Opportunistic observations
‘Confirmed’ 30 25 ‘Unconfirmed’* 11 5
Total confirmed 49 46
Grand total 60 51 * denotes that there was some uncertainty to whether it was a definite case of penguin
predation by sea lions.
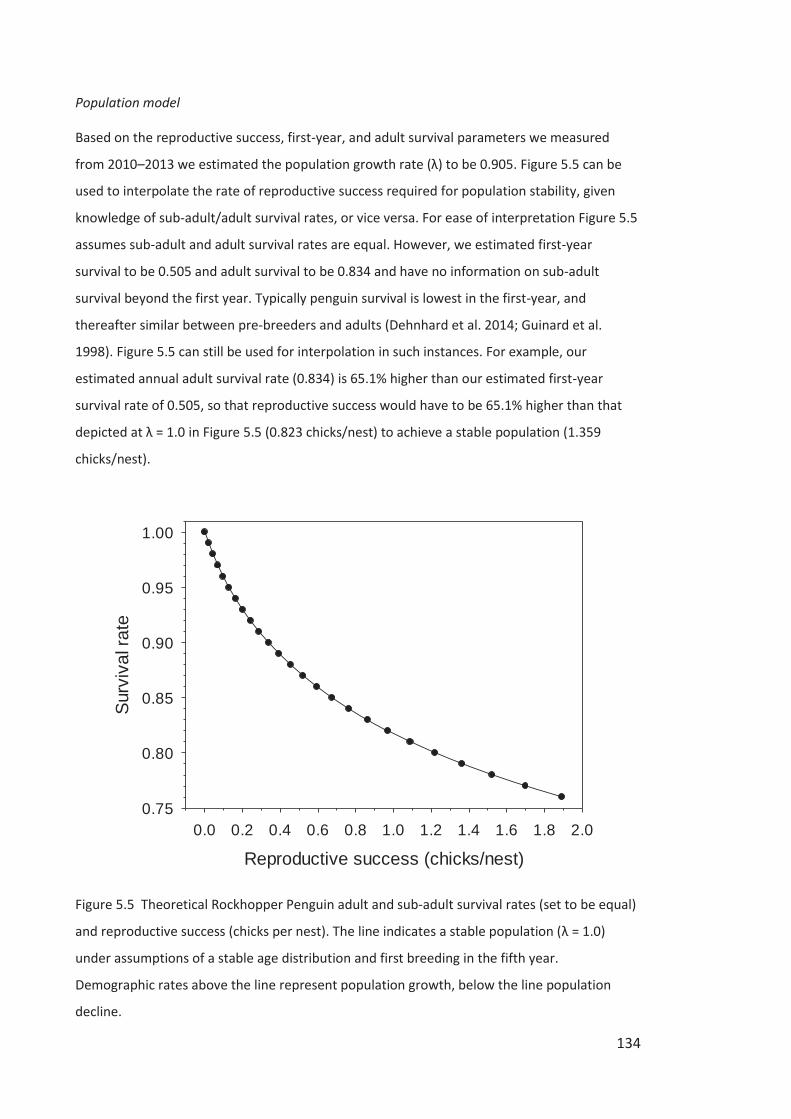
134
Population model
Based on the reproductive success, first-year, and adult survival parameters we measured
from 2010–2013 we estimated the population growth rate (λ) to be 0.905. Figure 5.5 can be
used to interpolate the rate of reproductive success required for population stability, given
knowledge of sub-adult/adult survival rates, or vice versa. For ease of interpretation Figure 5.5
assumes sub-adult and adult survival rates are equal. However, we estimated first-year
survival to be 0.505 and adult survival to be 0.834 and have no information on sub-adult
survival beyond the first year. Typically penguin survival is lowest in the first-year, and
thereafter similar between pre-breeders and adults (Dehnhard et al. 2014; Guinard et al.
1998). Figure 5.5 can still be used for interpolation in such instances. For example, our
estimated annual adult survival rate (0.834) is 65.1% higher than our estimated first-year
survival rate of 0.505, so that reproductive success would have to be 65.1% higher than that
depicted at λ = 1.0 in Figure 5.5 (0.823 chicks/nest) to achieve a stable population (1.359
chicks/nest).
Reproductive success (chicks/nest)0.0 0.2 0.4 0.6 0.8 1.0 1.2 1.4 1.6 1.8 2.0
Surv
ival
rate
0.75
0.80
0.85
0.90
0.95
1.00
Figure 5.5 Theoretical Rockhopper Penguin adult and sub-adult survival rates (set to be equal)
and reproductive success (chicks per nest). The line indicates a stable population (λ = 1.0)
under assumptions of a stable age distribution and first breeding in the fifth year.
Demographic rates above the line represent population growth, below the line population
decline.
135
We estimated the population growth rate of Southern Rockhopper Penguins at New
Island, Falkland Islands, to be λ = 1.07. We found the same rate from counts of breeding pairs
in 2006 (5,687) and 2012 (8,318) reported by Dehnhard et al. (2014). This perfect agreement is
likely partly coincidental, but can also be interpreted as validating the assumption of a Leslie
matrix of a stable age structure in this population, and that the demographic rates estimated
at New Island are accurate.
‘Predation-free’ population growth rate
Skua predation of eggs appeared to have a relatively minor effect on reproductive success at
the large Foreshore colony; we therefore assume that without predation by skuas, the overall
Penguin Bay reproductive success rate would be at least as high as the average reproductive
success rate at that sub-colony 2010–2012 (0.40 chicks/nest). If 2012 is excluded as an
anomalously poor year because of environmental conditions (Chapter 4), then the average
reproductive success at the Foreshore sub-colony is 0.45. The realized insurance value of A-
eggs was 11% and 15% in 2010 and 2011 (average 13%, K.W.M. unpub. data), so that the
average proportion of B-eggs laid found eaten in 2010 and 2011 at the Foreshore sub-colony
(1.5%) likely depressed reproductive success by 1.3% (= 1.5% - (1.5% * 13%)). The average of
4.8% of the breeding population that we estimated as being depredated by sea lions during
incubation and chick-rearing would cause failure of a similar proportion of nests, so that a
reasonable estimate of reproductive success without predation effects is 51.1% (= 45 + 1.3 +
4.8) of nests producing a chick. The relatively small amount of Giant Petrel predation we
observed is negligible. If, as suggested above, sea lion predation lowers the adult survival rate
by 6% annually, then the annual adult survival rate without sea lion predation is 0.894 (= 0.834
+ 0.06). At the first-year survival rate we measured (0.505), the ‘predation-free’ reproductive
success and adult survival rates result in a population growth rate much nearer stability (λ =
0.983) than we estimated with predation effects (λ = 0.905).
DISCUSSION
The rates of reproductive success, first-year survival, and adult survival we measured for the
declining population of Eastern Rockhopper Penguins in Penguin Bay, Campbell Island were all
low across three years of study. The ‘bottom-up’ effect of oceanographic conditions causing
poor food availability resulted in especially poor reproductive success in 2012, and reduced
136
adult survival rates in the subsequent late-breeding/pre-moult period. However, we also found
that ‘top-down’ effects of predation, especially by New Zealand sea lions and Brown Skuas,
contributed to low overall demographic rates so that predation is likely to be the primary
cause of the Penguin Bay population’s localized decline.
Skua predation
The amount of shelter around a nest was an important determinant of the fate of both A- and
B-eggs, suggesting that skua predation is in addition to the expected egg failure rate and
therefore reduces reproductive success (i.e., it is additive mortality). Hatching success was
highest in cavity nests where skuas were rarely observed attempting to depredate eggs or
chicks. Hatching success is also likely to vary for reasons unrelated to skua predation. More
exposed nests are vulnerable to conspecific disturbance that contributes to egg displacement
and trampling (St. Clair and St. Clair 1996). We observed that birds in cavity nests tended to
incubate facing the nest opening, whereas other birds rotate on their nests more frequently to
confront their neighbours and passing birds and as the wind direction changes. Changing
position on the nest can cause egg displacement (St Clair et al. 1995; St. Clair and St. Clair
1996), so a reduced need for changing position is another benefit that likely increases the
reproductive success of more sheltered nests. B-egg hatching success was also higher at more
interior nests. Hatching success is typically higher in the interior of a penguin colony than on
the periphery because avian predators have easier access to peripheral nests (Tenaza 1971;
Emslie et al. 1995; Liljesthrom et al. 2008). A tendency for more experienced and larger
individuals to breed at interior nests would also contribute to their higher success (Ainley et al.
1983; MÌnguez et al. 2001).
Differences in avian predation rates caused by differences in the availability of cavity
nests appear to have led to a counter-intuitive sequence of sub-colony extinction in Penguin
Bay. Cavity nests tended to be on the colony periphery, suggesting that cavity nests and their
associated large rocks may anchor colony boundaries that would otherwise have contracted. In
1984 the Central sub-colony was larger (999 pairs) than the East (753 pairs), but by 2010 the
Central sub-colony was extinct while the East sub-colony persisted at least through 2013
(Cunningham and Moors 1994; P. Moors unpub. data, Figure 5.1). If both sub-colonies were
subject to the same predation rates and zero or equal immigration/emigration rates, then the
East sub-colony should have gone extinct first. In 2012 the pairs hanging on in the East were
primarily in cavity nests (12 of 18 nests, 67%) and only cavity nests hatched eggs. We judged
137
that the former area of the Central sub-colony in 2009 contained only two cavity nests. In 2009
there were c. 50 pairs in the Central sub-colony, but none attempted to breed there in 2010.
We expect that repeated breeding failure caused by Brown Skuas, and predation of large
chicks and adults during moult by Northern Giant Petrels at this relatively flat, exposed sub-
colony caused its abrupt abandonment. Eudyptes penguins typically moult at their nest sites as
we observed in the predominantly cavity nests in the East sub-colony in April 2013. However,
the flat and exposed lower portion of the West sub-colony was empty of moulting adults. We
located some of them in the steeper interior of the colony, and expect they had retreated
there, as crèching chicks do, to escape avian predators.
Overall, skuas ate a higher proportion of the eggs laid at smaller sub-colonies. The
smallest sub-colony had the lowest overall reproductive success and the largest sub-colony the
highest success, whereas the two sub-colonies of intermediate size had similar success.
Smaller sub-colonies suffered higher predation rates not only because of their greater ratio of
peripheral to interior nests (Jackson et al. 2005), but because each sub-colony was the
territory of a pair of Brown Skuas nesting nearby. Therefore, smaller sub-colonies had a higher
ratio of predators per nest. The only exception was the Foreshore sub-colony, which may have
been too large to be effectively defended by one skua pair. Aggressive confrontations between
skuas over the Foreshore colony were common, and may have limited the effects of predation.
One might expect that a sub-colony as small as the East would become unprofitable for the
resident skua pair so that they would invest less effort in nest predation than would skuas at
larger sub-colonies (Type III function response). Although we observed the East skuas
attempting to ‘steal’ eggs from other sub-colonies, they also invested much time and effort in
depredating every nest possible within the East sub-colony, to the extent of confronting
incubating birds within well-defended cavity nests.
Although skua predation of eggs and young chicks lowers reproductive success,
environmental conditions affecting food availability can have a larger effect. In 2011 when
adult body condition and diet quality was high (Chapter 3), reproductive success was relatively
high across sub-colonies (0.46–0.52 chicks/nest), regardless of their size. In 2012 when body
condition and diet quality were poor, the largest Foreshore colony had only a slightly higher
reproductive success than the smaller sub-colonies (Foreshore 0.31 chick/nest, others sub-
colonies 0.24–0.27 chicks/nest). The greatest variation in reproductive success in relation to
sub-colony size occurred in 2010 (Foreshore 0.44 chicks/nest, East 0.18 chicks/nest). Chick
growth (K.W.M. unpub. data) and a comparison of overall reproductive success rates (2010
0.41 chicks/nest, 2011 0.47 chicks/nest, 2012 0.28 chicks/nest) suggest that food availability in
138
2010 was intermediate to 2011 and 2012. There were also more nests in the East and West
sub-colonies in 2010 than thereafter, and because exposed and peripheral nests were the ones
that became vacant (K.W.M. pers. obs.), the effect of predation in relation to colony size is
most evident in 2010. Although hatching success was lower in 2012 than 2011, in 2012 higher
B-chick mortality through predation and starvation during the guard phase had a greater effect
in driving down reproductive success.
Adult body condition is likely to act synergistically with skua scavenging and predation
rates, in that adult penguins in poorer condition appear to have lower nest defence and brood
care abilities. Daily egg survival rates were lowest during female-only incubation. Females lost
c. 40% of their arrival mass over their 6.5 week fast by the end of their incubation shift
(Chapter 3; K.W.M. unpub. data). Skuas boldly attacked these c. 2.1 kg females, and were even
seen to grab an incubating female by the back and pull it off its eggs, whereas solo-incubating
males, already larger-billed and more aggressive and weighing c. 3.5 kg after their incubation
foraging trip, were rarely overtly attacked (Chapters 3 and 4). In addition, a higher proportion
of pairs had their A-egg fail after B-egg hatching in 2012 than in 2011, and none maintained
two chicks through the guard phase in 2012. Successfully hatching an A-egg in the presence of
a B-chick typically requires careful attention and repeated retrieval of the A-egg after
displacement (St. Clair and St. Clair 1996; K.W.M. pers. obs.). The nutritionally-stressed
breeders in 2012 were apparently less willing or able to make the effort required to hatch both
eggs. The timing of egg failure in Rockhopper Penguins elsewhere has been shown to vary
between populations and inter-annually (St. Clair and St. Clair 1996). Peak periods of A-egg loss
occur either soon after laying, or as we found, after B-egg hatching (Gwynn 1953; Williams
1980; St. Clair and St. Clair 1996). At Macquarie Island a high proportion of the loss of both A-
and B-eggs of Eastern Rockhopper Penguins occurred during the middle of the incubation
period (Hull et al. 2004), in line with our result that daily egg survival rates may also be low
during female-only incubation.
Giant Petrel predation
Giant Petrels are not Eudyptes penguin egg predators, nor have they been described taking
brooded chicks during the guard period. We observed only two successful attacks by Giant
Petrels on chicks during the early crèche period, but expect petrel predation was more
important on older chicks and fledging chicks, as found for King Penguins (Aptenodytes
patagonicus; Descamps et al. 2005) and Snares Penguins (Warham 1974a). Giant Petrels killed
139
a small proportion of healthy breeding adults and pre-breeders by ambushing them on their
route into the inland East and West sub-colonies before c. 20 Jan. Northern Giant Petrels kill
adult Northern Rockhopper Penguins in the water near landing places (Ryan et al. 2008), but
we did not observe this hunting technique. It appears as though the opportunity to scavenge
penguins killed by sea lions attracts Giant Petrels to Penguin Bay and helps sustain the local
population, thereby facilitating increased rates of Giant Petrel predation on penguins.
Likewise, scavenging of Antarctic fur seal (A. gazella) kills of Macaroni Penguins (E.
chrysolophus) by Giant Petrels is believed to have contributed to a population increase of Giant
Petrels at Bird Island, South Georgia (Bonner and Hunter 1982).
Sea lion predation
New Zealand sea lions prey upon penguins everywhere they co-occur (Moore and Moffat
1992; Childerhouse et al. 2001; Lalas et al. 2007). Pinniped predation of penguins has been
reported as either a frequent behaviour of a few specialized individuals (Strange 1982; du Toit
et al. 2004; Lalas et al. 2007) or a rare, opportunistic behaviour of many individuals (Casaux et
al. 2004; Makhado et al. 2008). We observed that while one or two sea lions were likely
responsible for the majority of penguin kills, at least six different individuals were observed
making kills based on simultaneous events and sea lion age/sex classes, so that hunting
penguins was seemingly both a specialized and opportunistic behaviour.
Interestingly, we observed individual sea lions investing much time and energy in
swimming along the shoreline of Penguin Bay searching for penguins to attack in the water, or
after a short chase from the sea onto the shore (e.g., up to a few hours per day), but the same
sea lions ignored the opportunity to depredate the same penguins on land within breeding
colonies. Other pinnipeds similarly display the same paradoxical behaviour in depredating
seabirds in/near water, but not in breeding colonies, with only a few observations of ‘rogue’
individuals killing seabirds on nests (Crawford and Cooper 1996; Moore et al. 2008). Although
free of sea lion predation within colonies, we observed sea lions trampling to death eggs,
chicks, and one brooding adult penguin. Twice we saw penguins defending their nests bitten
and thrown by sub-adult males. Typically sea lions avoided traversing through penguin sub-
colonies, but on three occasions pregnant cows sought refuge from bulls within colonies
(including a stillbirth within the West sub-colony in 2010), and at other times sub-adult males
fled through colonies to avoid larger males. Such interactions with negative outcomes for
penguins are likely to increase if the sea lion population in Penguin Bay continues to grow.
140
Similarly, rapidly growing fur seal populations have displaced Eudyptes penguin colonies
elsewhere (Huyser 2001; Cuthbert et al. 2009).
We estimated that sea lions killed an average of 4.8% of the adult breeding population
during chick-rearing. Breeding penguins are also vulnerable to sea lion predation at their first
colony arrival, when departing and returning from their incubation foraging trip, and when
returning and departing for moult, so that we predict that the total mortality of the breeding
population caused by sea lion predation is likely similar to 6% each year. Some unknown
proportion of penguins killed by sea lions are first-year birds and other sub-adult pre-breeders,
although this proportion may be low if these birds only arrive and depart twice, for
prospecting and moulting periods ashore. However, first-year birds are likely depredated at
rates higher than their transit frequency would suggest, as they sometimes lingered naïvely in
the surf zone where most kills took place.
The predation rate we documented of 0.23 kills/h is an order of magnitude below that
calculated from observations of South American sea lions (Otaria flavescens) depredating
Southern Rockhopper Penguins (2.36 kills/h; Cursach et al. 2014) and Antarctic fur seals
depredating Macaroni Penguins (2.44 kills/h; Bonner and Hunter 1982). These estimates are
likely to be biased high because timing of observations was not randomized or systematic in
either study and occurred primarily in the afternoon and evening when penguins typically
return to land (Raya Rey et al. 2007; Chapter 4) and overlapping with our observed peak in kills
17:00–21:00 (K.W.M. unpub. data). Despite our relatively low kill rate, the effect of sea lion
predation on the penguin population we estimated as mortality of 6% of breeders per year is
the same or larger than estimates of the proportion of Adélie Penguin breeding populations
killed by leopard seals (Hydrurga leptonyx; Ainley et al. 2005 and references therein).
Population model
We estimated the Penguin Bay population growth rate (λ) to be 0.905 from 2010 to 2013. The
corresponding rate of decline of 0.095% per year is 2.9 times faster than the 1984–2012
estimate by Morrison et al. (Table 5.6, Chapter 2) of 0.033% per year (λ = 0.967). A faster
recent rate of decline may indicate that demographic rates were lower in recent years than
they had been previously, which would forecast a sharp drop in the breeding population size in
the next few years as the recently low reproductive success rate leads to a lagged effect in the
recruitment rate dropping further below that required to replace dying breeders. Demographic
rates in Penguin Bay were slightly higher in 1985 and 1986, when the annual adult return rate
141
was 87.2% and reproductive success was 47.4 and 50.5%, respectively (Marchant and Higgins
1990). Alternatively, changing demographic rates will results in an unstable age structure,
contradicting the stable-rates assumption of the Leslie matrix method and producing a
population growth rate that differs from that observed.
The low adult survival rate in Penguin Bay appears to be the most important
contributor to the population’s decline. Theoretically, adult survival rate is also the most
influential parameter affecting the population growth rate of long-lived species (Sæther and
Bakke 2000). We have illustrated how a small decrease in adult survival requires an increase of
reproductive success of larger magnitude to maintain a stable population. The reproductive
success rates of Southern Rockhopper Penguins in the Falkland Islands, averaging 0.74 over 15
years and ranging from 0.49 to 0.95 (Baylis et al. 2013) are exceptionally high for Eudyptes
penguins, but even a 0.74 chicks/nest reproductive success rate is too low to balance the low
0.834 adult survival rate we measured in Penguin Bay (Figure 5.5). In contrast, the average
reproductive success in Penguin Bay of 0.39 chicks/nest is sufficient for population stability
with a biologically plausible adult (and first-year) survival rate of 0.89. Demographic rates in
Penguin Bay were similar to those for a rapidly declining population of Northern Rockhopper
Penguins (E. moseleyi) at Amsterdam Island: reproductive success (0.38 chicks/nest), first-year
survival (0.39), adult survival (0.84; Guinard et al. 1998). Anomalously cold sea-surface
temperatures lowering prey availability and predation from a greatly expanded population of
sub-Antarctic fur seals (A. tropicalis) were implicated in the decline (Guinard et al. 1998).
‘Predation-free’ population growth rate
At the average first-year survival rate we measured (0.505) we estimated that ‘predation-free’
reproductive success and adult survival rates would result in a population growth rate of λ =
0.983, compared to λ = 0.905 with predation effects. Therefore, predation is sufficient to be
the primary driver of the localized population decline in Penguin Bay, even without accounting
for the effect of predation on first-year survival rates. A stable population (λ = 1.0) would
require an average first-year survival rate of 0.65, equivalent to that we measured from 2010
to 2011. A ‘predation-free’ first-year survival rate is likely to be ≥ 0.65 because sea lions and
Giant Petrels killed an unknown proportion of first-year penguins and predation danger may
cause emigration (reduced natal and/or breeding site fidelity) away from Penguin Bay,
lowering our estimate of first-year survival.
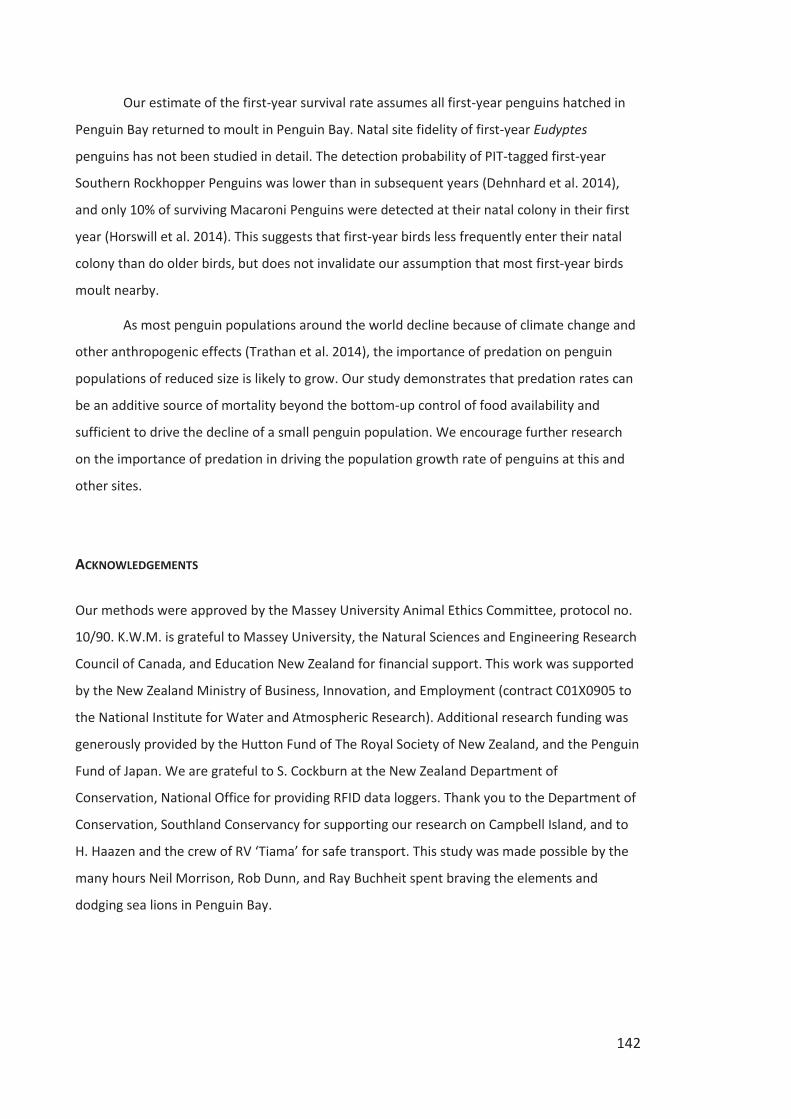
142
Our estimate of the first-year survival rate assumes all first-year penguins hatched in
Penguin Bay returned to moult in Penguin Bay. Natal site fidelity of first-year Eudyptes
penguins has not been studied in detail. The detection probability of PIT-tagged first-year
Southern Rockhopper Penguins was lower than in subsequent years (Dehnhard et al. 2014),
and only 10% of surviving Macaroni Penguins were detected at their natal colony in their first
year (Horswill et al. 2014). This suggests that first-year birds less frequently enter their natal
colony than do older birds, but does not invalidate our assumption that most first-year birds
moult nearby.
As most penguin populations around the world decline because of climate change and
other anthropogenic effects (Trathan et al. 2014), the importance of predation on penguin
populations of reduced size is likely to grow. Our study demonstrates that predation rates can
be an additive source of mortality beyond the bottom-up control of food availability and
sufficient to drive the decline of a small penguin population. We encourage further research
on the importance of predation in driving the population growth rate of penguins at this and
other sites.
ACKNOWLEDGEMENTS
Our methods were approved by the Massey University Animal Ethics Committee, protocol no.
10/90. K.W.M. is grateful to Massey University, the Natural Sciences and Engineering Research
Council of Canada, and Education New Zealand for financial support. This work was supported
by the New Zealand Ministry of Business, Innovation, and Employment (contract C01X0905 to
the National Institute for Water and Atmospheric Research). Additional research funding was
generously provided by the Hutton Fund of The Royal Society of New Zealand, and the Penguin
Fund of Japan. We are grateful to S. Cockburn at the New Zealand Department of
Conservation, National Office for providing RFID data loggers. Thank you to the Department of
Conservation, Southland Conservancy for supporting our research on Campbell Island, and to
H. Haazen and the crew of RV ‘Tiama’ for safe transport. This study was made possible by the
many hours Neil Morrison, Rob Dunn, and Ray Buchheit spent braving the elements and
dodging sea lions in Penguin Bay.
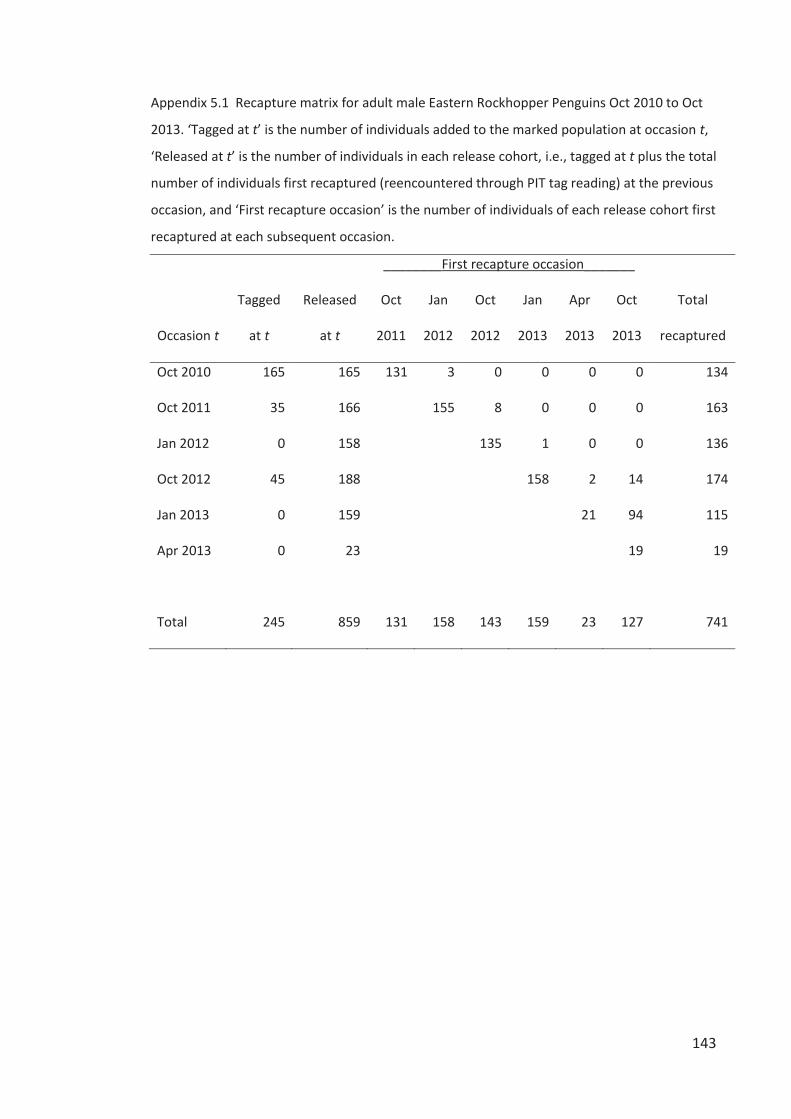
143
Appendix 5.1 Recapture matrix for adult male Eastern Rockhopper Penguins Oct 2010 to Oct
2013. ‘Tagged at t’ is the number of individuals added to the marked population at occasion t,
‘Released at t’ is the number of individuals in each release cohort, i.e., tagged at t plus the total
number of individuals first recaptured (reencountered through PIT tag reading) at the previous
occasion, and ‘First recapture occasion’ is the number of individuals of each release cohort first
recaptured at each subsequent occasion.
________First recapture occasion_______
Occasion t
Tagged
at t
Released
at t
Oct
2011
Jan
2012
Oct
2012
Jan
2013
Apr
2013
Oct
2013
Total
recaptured
Oct 2010 165 165 131 3 0 0 0 0 134
Oct 2011 35 166 155 8 0 0 0 163
Jan 2012 0 158 135 1 0 0 136
Oct 2012 45 188 158 2 14 174
Jan 2013 0 159 21 94 115
Apr 2013 0 23 19 19
Total 245 859 131 158 143 159 23 127 741
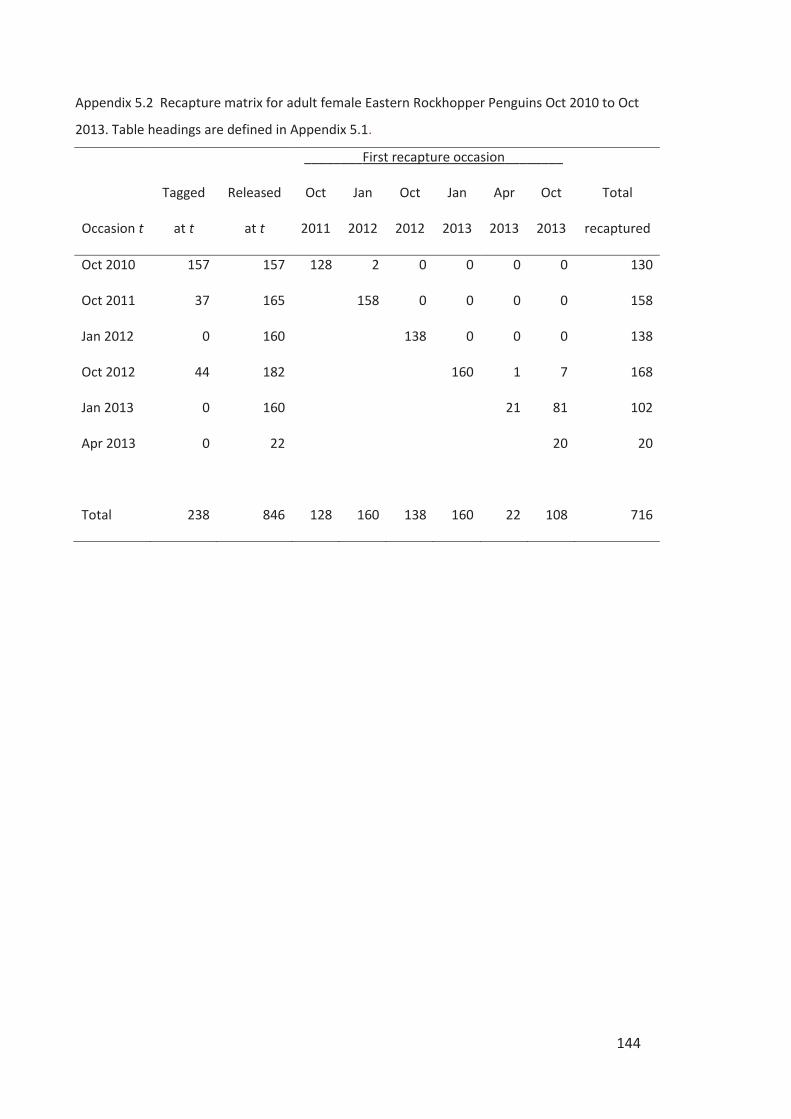
144
Appendix 5.2 Recapture matrix for adult female Eastern Rockhopper Penguins Oct 2010 to Oct
2013. Table headings are defined in Appendix 5.1.
________First recapture occasion________
Occasion t
Tagged
at t
Released
at t
Oct
2011
Jan
2012
Oct
2012
Jan
2013
Apr
2013
Oct
2013
Total
recaptured
Oct 2010 157 157 128 2 0 0 0 0 130
Oct 2011 37 165 158 0 0 0 0 158
Jan 2012 0 160 138 0 0 0 138
Oct 2012 44 182 160 1 7 168
Jan 2013 0 160 21 81 102
Apr 2013 0 22 20 20
Total 238 846 128 160 138 160 22 108 716
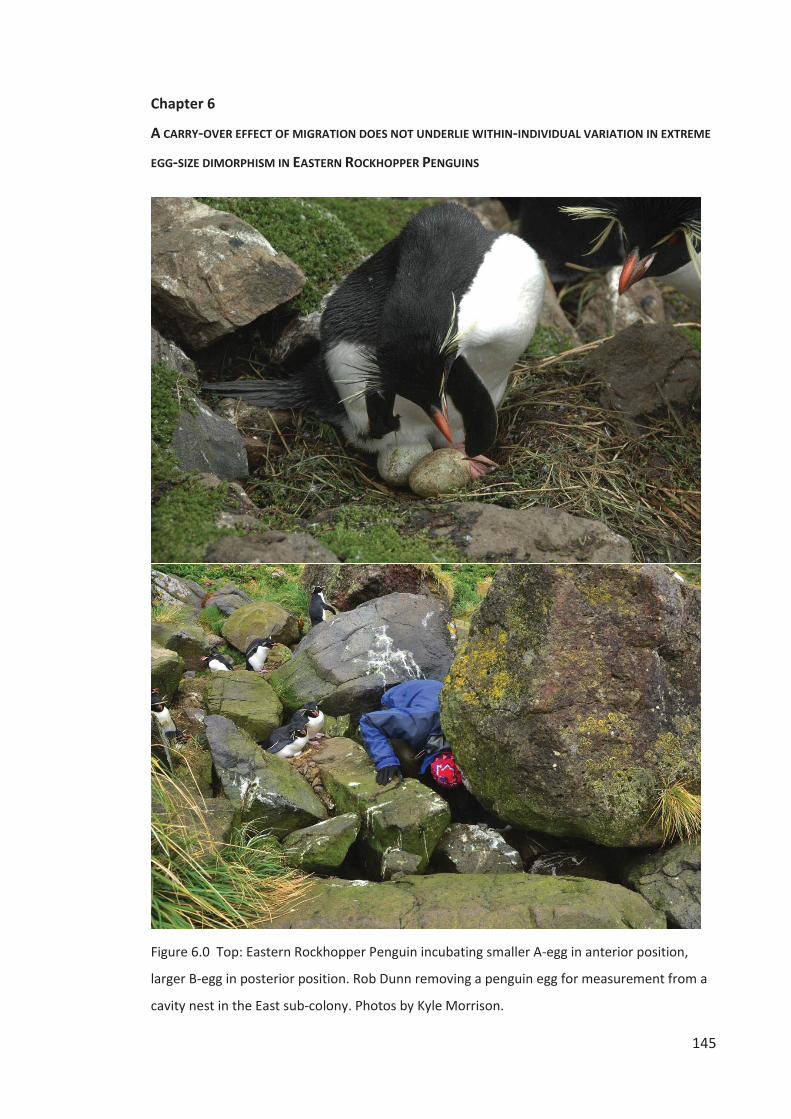
145
Chapter 6
A CARRY-OVER EFFECT OF MIGRATION DOES NOT UNDERLIE WITHIN-INDIVIDUAL VARIATION IN EXTREME
EGG-SIZE DIMORPHISM IN EASTERN ROCKHOPPER PENGUINS
Figure 6.0 Top: Eastern Rockhopper Penguin incubating smaller A-egg in anterior position,
larger B-egg in posterior position. Rob Dunn removing a penguin egg for measurement from a
cavity nest in the East sub-colony. Photos by Kyle Morrison.
146
ABSTRACT
Penguins of the genus Eudyptes are unique among birds in that their first-laid A-egg is 54-85%
the mass of their second-laid B-egg. Although the degree of intra-clutch egg-size dimorphism
varies greatly among the seven species of the genus, obligate brood reduction is typical of
each, with most fledged chicks resulting from the larger B-egg. Many authors have speculated
upon why Eudyptes penguins have evolved and maintained a highly dimorphic 2-egg clutch,
and why it is the first-laid egg that is so much smaller than the second, but only recently has a
testable, proximate mechanism been proposed. In Macaroni Penguins (E. chrysolophus),
females that apparently had greater overlap between egg-formation and migration lay more
dimorphic eggs, suggesting a physiological conflict may constrain growth of the earlier-
initiated A-egg. This migratory carry-over effect hypothesis (MCEH) has yet to be examined in
any other species or in more than one year. I tested the MCEH in Eastern Rockhopper Penguins
(E. chrysocome filholi) on Campbell Island, New Zealand, by recording the arrival and laying
dates, body sizes, and egg masses of transponder-tagged females over two years. Females that
presumably had less migration/egg-formation overlap laid less dimorphic clutches, as
predicted by the MCEH. However, repeated measures of individual females revealed that
changes in egg-size dimorphism between years were unrelated to changes in overlap. Egg
masses, and to a lesser extent egg-size dimorphism, were highly repeatable traits related to
body size and mass. These results and a detailed consideration of the MCEH suggest that egg-
size dimorphism in Eudyptes penguins is unlikely to be caused by a migratory carry-over effect.
INTRODUCTION
A key component of avian investment in reproduction is the resources females allocate to egg
production. Larger eggs and clutches may be produced by higher quality females or those in
better body condition, and result in greater reproductive fitness (Williams 1994; Hipfner and
Gaston 1999). Eggs laid at an early date may also have higher fitness, such as when high quality
or more experienced females breed earlier, or food availability declines during the breeding
season (Verhulst and Nilsson 2008). The allocation of investment within a clutch is also an
important means of facilitating brood reduction in order to match brood size to available
resources (Slagsvold et al. 1984; Lamey 1990). Despite their important fitness consequences,
females may be constrained from optimal egg investment and timing of breeding by effects
that carry-over between stages or because of their evolutionary history. For example, pre-
breeding diet quality may carry-over to influence resources available for egg production
147
(Sorensen et al. 2009). Furthermore, the variation in a trait expressed by individuals may be
limited by their genotype and phenotypic plasticity (Nussey et al. 2007; Reed et al. 2009).
There is no more anomalous pattern of investment in egg production than that which
occurs within the seven species of Eudyptes penguins, which lay two eggs more different in
size than in any other bird species (Slagsvold et al. 1984). In other species with less dimorphic
eggs, egg size, hatching, and fledging success typically decrease with laying order. In Eudyptes
penguins it is the first-laid “A-egg” that is much smaller, hatches later, and is far less successful
than the second-laid “B-egg”, although both eggs are equally viable when reared
independently (Williams 1990). Additionally, the degree of egg-size dimorphism (ESD) varies
greatly between species of Eudyptes penguins, with species’ mean A-egg masses being 54–85%
those of B-eggs (St. Clair 1992; Davis 2013). Within each species, inter-individual variation in
ESD varies over a similarly wide range (St. Clair 1993; Crossin et al. 2010; Crossin et al. 2012).
The key questions are 1) Why is it the first-laid A-egg that is smaller? 2) What causes the inter-
and intra-species variation in ESD? 3) Why is this pattern of investment unique to Eudyptes
penguins? 4) Why do Eudyptes penguins lay two eggs but typically only raise one chick?
Researchers have had a long-standing interest in the evolution and maintenance of
this bizarre reproductive pattern (Lack 1968; Johnson et al. 1987; Lamey 1990). More recent
hypotheses have continued the historic focus on ultimate causation (St. Clair 1998; Davis and
Renner 2003). Crossin et al. (2010) used a novel approach by examining the proximate cause of
ESD in Macaroni Penguins (Eudyptes chrysolophus), which have among the most dimorphic
eggs in the genus. In Fiordland Penguins (E. pachyrhynchus), the Eudtypid that lays the least
dimorphic eggs and the only species for which egg formation times have been studied, A- and
B-egg rapid yolk growth takes c. 16 days, followed by a c. 7 day ‘lag’ period before laying
during which albumen, membranes, and shell are formed and deposited, for a total egg
formation period of c. 23 days (Grau 1982, Grau 1984). Rapid yolk growth of A-eggs is initiated
c. 4 days before that of B-eggs, corresponding to the subsequent c. 4 day laying interval
between eggs. Eudyptes penguins over-winter at sea. After arriving from their return migration
breeders fast at their nest sites until after laying (the pre-laying interval). In six of the seven
species of Eudyptes (excluding Fiordland Penguin, Grau 1982), females’ pre-laying interval is
sufficiently short (< 23 d) to infer that rapid yolk growth begins during migration, setting up the
potential for a physiological conflict between migration and reproductive development that
could affect final egg sizes. Rapid yolk growth occurs through uptake of the yolk precursors
vitellogenin (VTG) and yolk-targeted very-low-density lipoprotein (VLDLy) from blood plasma,
which form the primary sources of yolk protein and lipid, respectively (Williams 2012). Under
148
the migratory carry-over effect hypothesis (MCEH) of Crossin et al. (2010), production of yolk
precursors is constrained by return migration, contributing to ESD by causing a slower rate of
yolk growth for A-eggs compared to later-developing B-eggs. A critical assumption of the
MCEH is that there is no-interindividual variation in yolk and albumen formation periods
among Eudyptes penguins, and that the mean durations reported by Grau (1982) for Fiordland
Penguins are representative of the entire genus. Crossin et al. (2010) found that female
Macaroni Penguins with a longer pre-laying interval ashore before laying their A-egg (and
therefore presumably reduced migration/yolk formation overlap) had higher VTG levels at
colony arrival and laid less dimorphic clutches. The authors concluded that the MCEH was
strongly supported and was likely to explain the occurrence of extreme ESD across the genus
(Crossin et al. 2010; Crossin et al. 2012). The MCEH was invoked in a subsequent phylogenetic
comparative analysis of ESD in Eudyptes that concluded their dimorphic two-egg clutch
became a canalized trait c. 7 million years ago, before the diversification of the extant species,
and is maladaptive given their slow life-history strategy (Stein and Williams 2013).
I extended analysis of the MCEH by evaluating it in a second species, the Eastern
Rockhopper Penguin (E. chrysocome filholi), which lays eggs of intermediate ESD relative to
other Eudyptes. Additionally, I considered effects on variation in ESD both between and within
individuals by using repeated measures of individual females in two years. Unlike Crossin et al.
(2010), I also considered effects of the structural size of females and their raw body mass at
arrival. I predicted that larger and heavier females would lay larger eggs and less dimorphic
clutches, as occurs in some other bird species (Slagsvold et al. 1984; Christians 2002).
Specifically, I:
1. Tested whether egg size and dimorphism were affected by females’ laying date, arrival
mass, pre-laying interval and body size (bill depth and flipper length).
2. Determined the individual repeatability between years in breeding chronology, egg masses,
and ESD.
3. Tested whether variation between years in pre-laying interval was related to ESD within
females.
MATERIALS AND METHODS
Data collection
149
The breeding chronology and egg masses of female Eastern Rockhopper Penguins were
measured in study plots in the East and West sub-colonies of Penguin Bay, Campbell Island,
New Zealand (52° 32ʹ 12ʺ S, 169° 2ʹ 10ʺ E) in October and November of 2011 and 2012. Data
included 50 females in 2011, and 62 in 2012 (total n = 112). Repeated measures were obtained
from 34 individuals, and data from only one year from 44 females. All study females were
individually marked with an 11 mm-long subcutaneous passive integrated transponder (PIT
tag: Allflex Australia Pty.) one or two years prior to their inclusion in the study. Female arrival
dates were recorded using an automated gateway on the penguin’s travel pathway into the
study sub-colonies that logged PIT tag code, date, and time (gateway developed by Stu
Cockburn, Department of Conservation, Wellington). Female identity at their nest site was
confirmed using an RS320 stick reader (Allflex Australia Pty.). In 2012 female arrival body mass
was measured with a 5 kg spring scale (± 50 g), bill depth with calipers (± 0.05 mm), and flipper
length with a ruler (± 1 mm) within one day of their logged arrival date. Bill depth and flipper
length of 2011 females were taken from measurements when they were tagged in 2010. The
date of first recording at a nest site was not always a reliable indicator of arrival date, as some
females occupied a nest within the study plots two or more days after their colony arrival was
logged by the automated gateway. Evidently, assuming that first nest occupancy equates to
colony arrival may bias chronological and arrival body mass data. For this reason only females
whose arrival date was logged by the gateway and (in 2012) whose body mass was measured
within one day of their logged arrival date were included in the study. Otherwise all females
breeding in the study plots for which both A- and B-egg masses were measured on their lay
dates were included.
Lay dates were determined by checking nest contents daily from arrival until females
completed their two-egg clutch. The duration of the pre-laying interval was the time between
a female’s arrival date and its A-egg lay date. The masses of first-laid A-eggs and second-laid B-
eggs were measured using a digital scale (± 0.1 g).
Data analysis
A:B egg mass ratio (intra-clutch egg-size dimorphism, ESD) was calculated as A-egg mass / B-
egg mass, so that less dimorphic clutches have a higher A:B egg mass ratio. Clutch mass equals
A-egg mass + B-egg mass. Means are presented ± SD unless otherwise noted. Arrival and lay
dates were standardized between years by analysing dates in days from the first such date in
each year.
150
An information-theoretic approach to model selection was used to evaluate factors
that influenced egg masses and ESD. Separate analyses were used to consider whether A-egg
lay date, pre-laying interval, bill depth, or flipper length had additive effects on A- and B-egg
masses using the same all-subsets model structure, plus a null model (16 models). The ESD
analysis was the same, except for including clutch mass (32 models). A-egg, B-egg, and clutch
masses were strongly positively correlated (A- and B-egg mass: R2 = 0.50, F1,110 = 108.073, p <
0.001, A-egg and clutch mass: R2 = 0.83, F1,110 = 520.293, p < 0.001, B-egg and clutch mass: R2 =
0.88, F1,110 = 781.896, p < 0.001), and A- and B-egg mass are confounded with ESD, so of these
potential factors only clutch mass was included in the ESD analysis. As a test of the MCEH the
primary interest was in the effect of pre-laying interval, but because pre-laying interval = A-egg
lay date – arrival date both lay date and arrival date could not be included as additional
factors. A-egg lay date was included because it was expected to more closely reflect a female’s
body condition and investment in reproduction than arrival date (Williams and Croxall 1991). A
random effect of female identity (PIT-tag code) was included in all models because a global
model including this effect was better supported than a model without in all three analyses.
Analyses were conducted using linear mixed-effect models with the arm package in R Studio
(Gelman et al. 2012; R Core Team 2012). Measures of the variance explained by fixed factors
were calculated as marginal R2 values (R2m), and by both the fixed factors and the random
factor of female identity as conditional R2 values (R2c), after Nakagawa and Schielzeth (2013)
using the MuMIn package in R Studio (Barton 2014). AICc, Δi, and wi values were calculated
manually, after Burnham and Anderson (2002). A post-hoc information theoretic analysis was
conducted using linear models to evaluate whether the addition of female arrival body mass
explained additional variance in A:B mass ratio in 2012.
The individual repeatability of all measures of breeding chronology and egg size was
assessed by calculating their intra-class correlation coefficients (R) using the method and rptR
package (in R Studio) of Nakagawa and Schielzeth (2010). As noted by Nakagawa and
Schielzeth (2013), R and R2 values are closely linked.
RESULTS
Females whose egg masses were measured arrived to breed 18–25 Oct in 2011 and 16– 22 Oct
in 2012. A-eggs were laid 2–9 Nov, 12–19 d after arrival in 2011, and 31 Oct to 8 Nov, 13–21 d
after arrival in 2012. The breeding chronology of the study females is a good representation of
a larger sample reported in Chapter 3. Mean female arrival and laying dates of study females
151
were slightly later in 2011 than 2012 (arrivals 21 Oct ± 1.7 d in 2011 and 18 Oct ± 1.4 d in
2012; laying 5 Nov ± 1.8 d in 2011 and 3 Nov ± 1.9 d in 2012). Mean pre-laying interval
duration was longer in 2011 (16.2 ± 1.8 d) than in 2012 (15.3 ± 1.5 d). Females that arrived
later laid later (r2 = 0.267, F1,110 = 39.984, p < 0.001), and had a shorter pre-laying interval (r2 =
0.125, F1,110 = 15.696, p < 0.001). Longer pre-laying intervals were associated with later lay
dates (r2 = 0.383, F1,110 = 68.216, p < 0.001). The interval between A- and B-egg lay dates was
nearly identical in 2011 (4.4 ± 0.6 d) and 2012 (4.5 ± 0.6 d). Overall, A-egg mass (83.2 ± 7.6 g)
was 28% smaller than B-egg mass (115.3 ± 9.1 g), equivalent to mean ESD of 0.72 ± 0.05.
However, the degree of ESD varied greatly between clutches, from A-eggs being close to half
the mass of B-eggs (0.58) to nearly the same mass (0.93).
A-egg mass
Females with deeper bills, longer pre-laying intervals, and later lay dates laid heavier A-eggs
(Table 6.1). The parameters bill depth and pre-laying interval were most strongly correlated
with A-egg mass (Figure 6.1, Figure 6.2), whereas lay date was less important. Flipper length
had a negligible relationship with A-egg mass, as its standard error was larger than its
parameter estimate (Table 6.2). Fixed factors in the top-ranked model explained only a small
proportion of the variance in A-egg mass (R2m = 0.12, Table 6.1). Individual females laid A-eggs
of similar mass between years (ID-only model R2c = 0.73, Table 6.1; R = 0.729 ± 0.073, Table
6.3). A post-hoc linear regression analysis revealed that arrival date was unrelated to A-egg
mass.
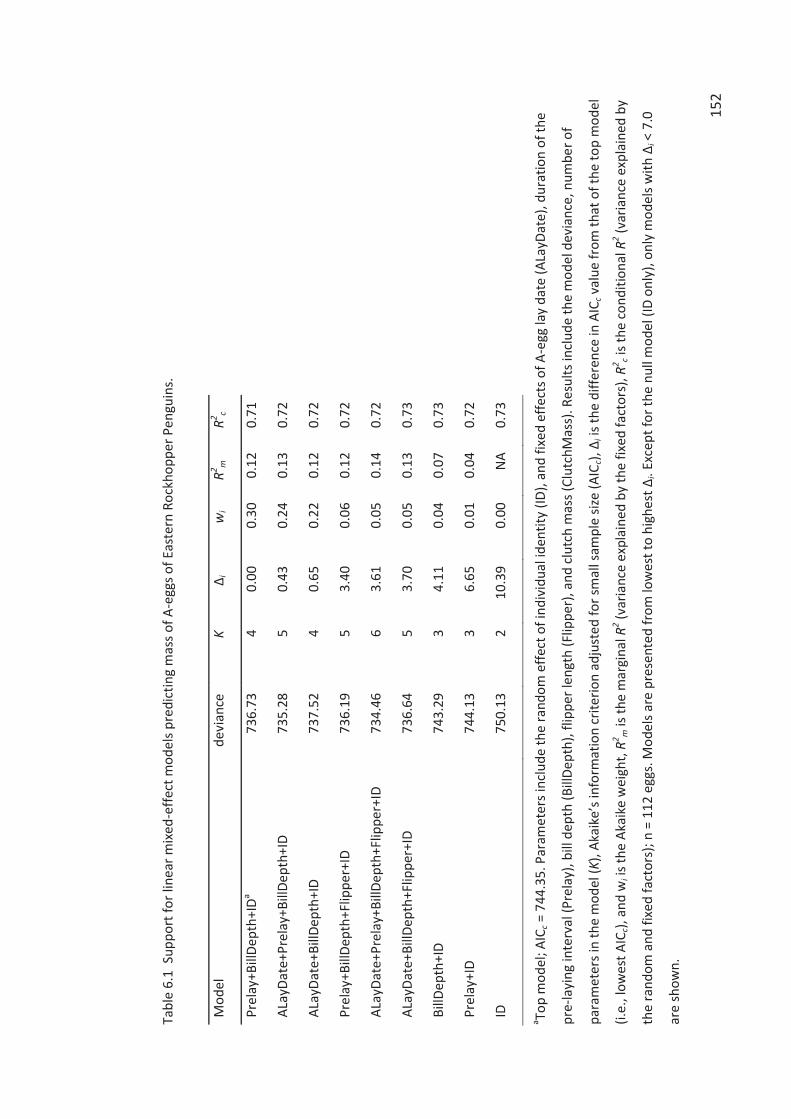
152
Tabl
e 6.
1 S
uppo
rt fo
r lin
ear m
ixed
-effe
ct m
odel
s pre
dict
ing
mas
s of A
-egg
s of E
aste
rn R
ockh
oppe
r Pen
guin
s.
Mod
el
dev
ianc
e
K
Δ i
w
i R2 m
R2 c
Prel
ay+B
illDe
pth+
IDa
736.
73
4 0.
00
0.30
0.
12
0.71
ALay
Date
+Pre
lay+
BillD
epth
+ID
735.
28
5 0.
43
0.24
0.
13
0.72
ALay
Date
+Bill
Dept
h+ID
73
7.52
4
0.65
0.
22
0.12
0.
72
Prel
ay+B
illDe
pth+
Flip
per+
ID
736.
19
5 3.
40
0.06
0.
12
0.72
ALay
Date
+Pre
lay+
BillD
epth
+Flip
per+
ID
734.
46
6 3.
61
0.05
0.
14
0.72
ALay
Date
+Bill
Dept
h+Fl
ippe
r+ID
73
6.64
5
3.70
0.
05
0.13
0.
73
BillD
epth
+ID
743.
29
3 4.
11
0.04
0.
07
0.73
Prel
ay+I
D 74
4.13
3
6.65
0.
01
0.04
0.
72
ID
750.
13
2 10
.39
0.00
N
A 0.
73
a Top
mod
el; A
ICc =
744
.35.
Par
amet
ers i
nclu
de th
e ra
ndom
effe
ct o
f ind
ivid
ual i
dent
ity (I
D), a
nd fi
xed
effe
cts o
f A-e
gg la
y da
te (A
LayD
ate)
, dur
atio
n of
the
pre-
layi
ng in
terv
al (P
rela
y), b
ill d
epth
(Bill
Dept
h), f
lippe
r len
gth
(Flip
per)
, and
clu
tch
mas
s (Cl
utch
Mas
s). R
esul
ts in
clud
e th
e m
odel
dev
ianc
e, n
umbe
r of
para
met
ers i
n th
e m
odel
(K),
Akai
ke’s
info
rmat
ion
crite
rion
adju
sted
for s
mal
l sam
ple
size
(AIC
c), Δ
i is th
e di
ffere
nce
in A
ICc v
alue
from
that
of t
he to
p m
odel
(i.e.
, low
est A
ICc),
and
wi is
the
Akai
ke w
eigh
t, R2 m
is th
e m
argi
nal R
2 (var
ianc
e ex
plai
ned
by th
e fix
ed fa
ctor
s), R
2 c is t
he c
ondi
tiona
l R2 (v
aria
nce
expl
aine
d by
the
rand
om a
nd fi
xed
fact
ors)
; n =
112
egg
s. M
odel
s are
pre
sent
ed fr
om lo
wes
t to
high
est Δ
i. Exc
ept f
or th
e nu
ll m
odel
(ID
only
), on
ly m
odel
s with
Δi <
7.0
are
show
n.
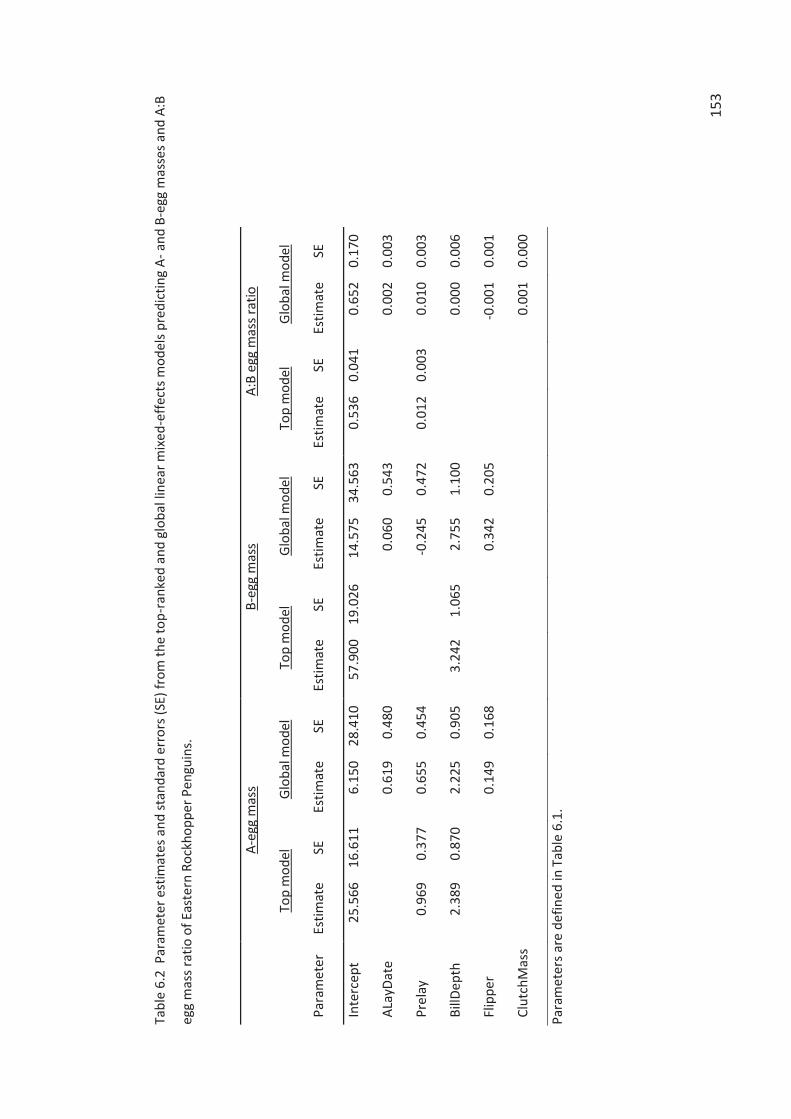
153
Tabl
e 6.
2 P
aram
eter
est
imat
es a
nd st
anda
rd e
rror
s (SE
) fro
m th
e to
p-ra
nked
and
glo
bal l
inea
r mix
ed-e
ffect
s mod
els p
redi
ctin
g A-
and
B-e
gg m
asse
s and
A:B
egg
mas
s rat
io o
f Eas
tern
Roc
khop
per P
engu
ins.
A-
egg
mas
s B-
egg
mas
s A:
B eg
g m
ass r
atio
To
p m
odel
Gl
obal
mod
el
Top
mod
el
Glob
al m
odel
To
p m
odel
Gl
obal
mod
el
Para
met
er
Estim
ate
SE
Estim
ate
SE
Estim
ate
SE
Estim
ate
SE
Estim
ate
SE
Estim
ate
SE
Inte
rcep
t 25
.566
16
.611
6.
150
28.4
10
57.9
00
19.0
26
14.5
75
34.5
63
0.53
6 0.
041
0.65
2 0.
170
ALay
Date
0.
619
0.48
0 0.
060
0.54
3 0.
002
0.00
3
Prel
ay
0.96
9 0.
377
0.65
5 0.
454
-0.2
45
0.47
2 0.
012
0.00
3 0.
010
0.00
3
BillD
epth
2.
389
0.87
0 2.
225
0.90
5 3.
242
1.06
5 2.
755
1.10
0 0.
000
0.00
6
Flip
per
0.14
9 0.
168
0.34
2 0.
205
-0.0
01
0.00
1
Clut
chM
ass
0.00
1 0.
000
Para
met
ers a
re d
efin
ed in
Tab
le 6
.1.
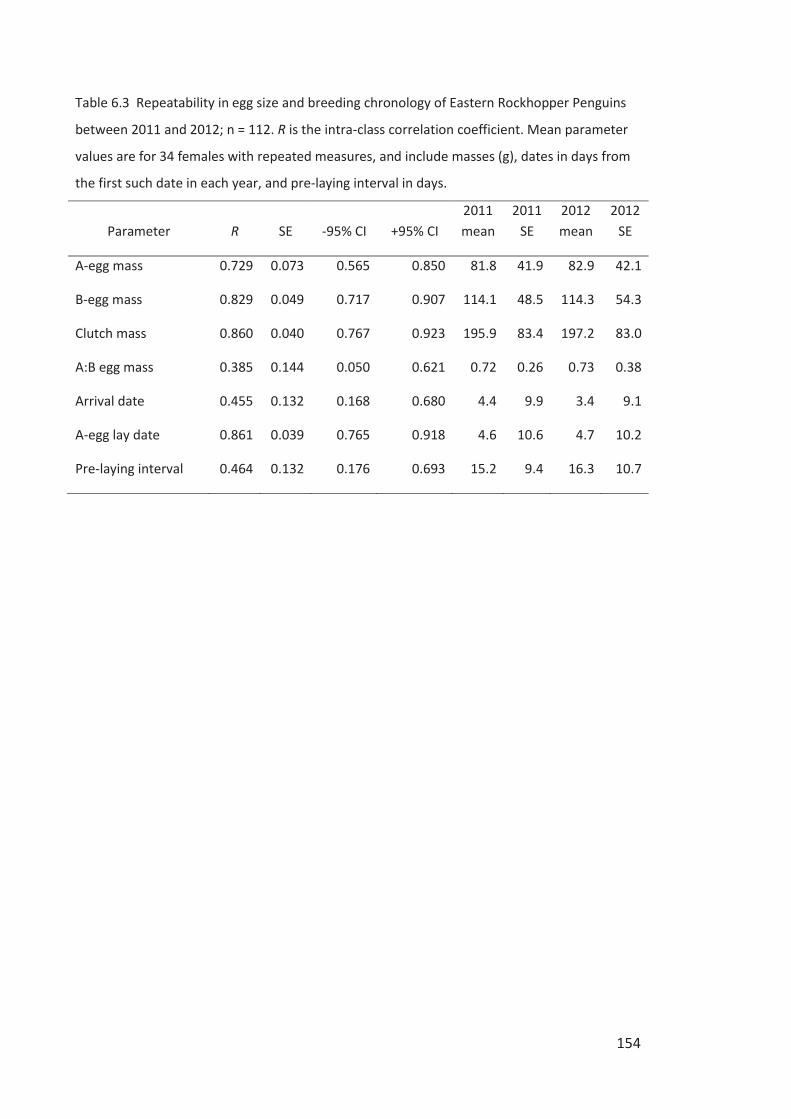
154
Table 6.3 Repeatability in egg size and breeding chronology of Eastern Rockhopper Penguins
between 2011 and 2012; n = 112. R is the intra-class correlation coefficient. Mean parameter
values are for 34 females with repeated measures, and include masses (g), dates in days from
the first such date in each year, and pre-laying interval in days.
Parameter R SE -95% CI +95% CI 2011 mean
2011 SE
2012 mean
2012 SE
A-egg mass 0.729 0.073 0.565 0.850 81.8 41.9 82.9 42.1
B-egg mass 0.829 0.049 0.717 0.907 114.1 48.5 114.3 54.3
Clutch mass 0.860 0.040 0.767 0.923 195.9 83.4 197.2 83.0
A:B egg mass 0.385 0.144 0.050 0.621 0.72 0.26 0.73 0.38
Arrival date 0.455 0.132 0.168 0.680 4.4 9.9 3.4 9.1
A-egg lay date 0.861 0.039 0.765 0.918 4.6 10.6 4.7 10.2
Pre-laying interval 0.464 0.132 0.176 0.693 15.2 9.4 16.3 10.7
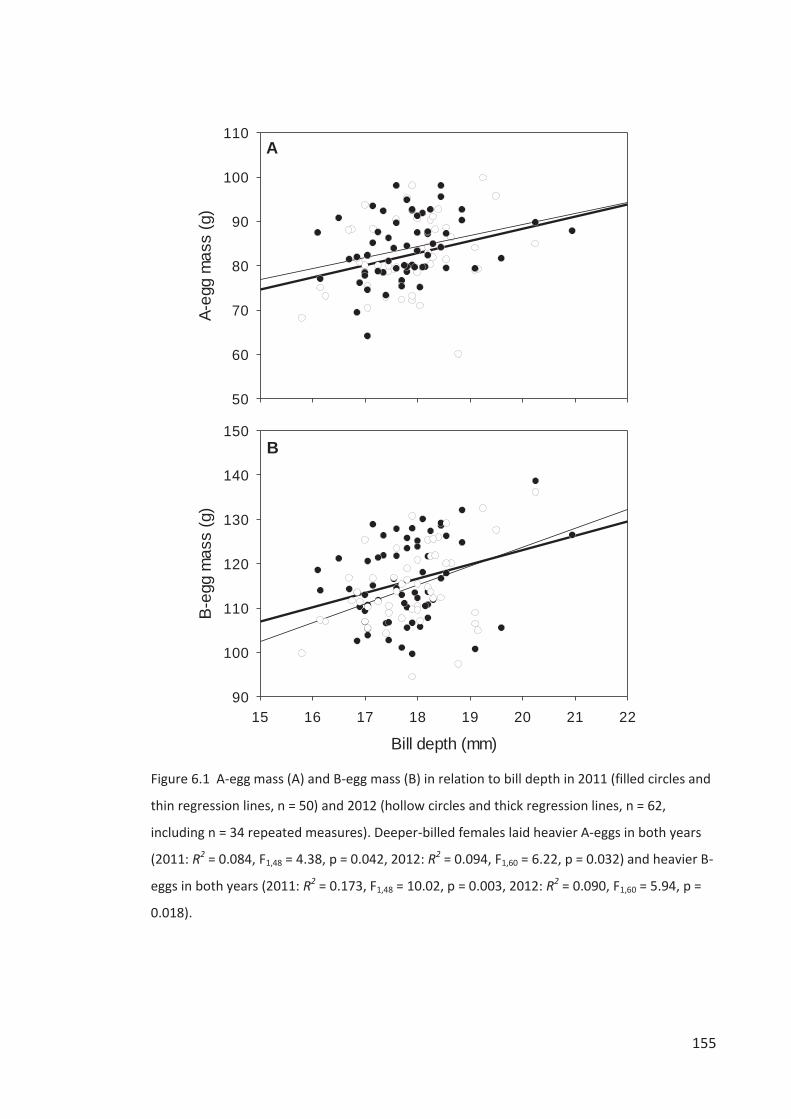
155
15 16 17 18 19 20 21 22
A-eg
g m
ass
(g)
50
60
70
80
90
100
110
Bill depth (mm)15 16 17 18 19 20 21 22
B-eg
g m
ass
(g)
90
100
110
120
130
140
150B
A
Figure 6.1 A-egg mass (A) and B-egg mass (B) in relation to bill depth in 2011 (filled circles and
thin regression lines, n = 50) and 2012 (hollow circles and thick regression lines, n = 62,
including n = 34 repeated measures). Deeper-billed females laid heavier A-eggs in both years
(2011: R2 = 0.084, F1,48 = 4.38, p = 0.042, 2012: R2 = 0.094, F1,60 = 6.22, p = 0.032) and heavier B-
eggs in both years (2011: R2 = 0.173, F1,48 = 10.02, p = 0.003, 2012: R2 = 0.090, F1,60 = 5.94, p =
0.018).
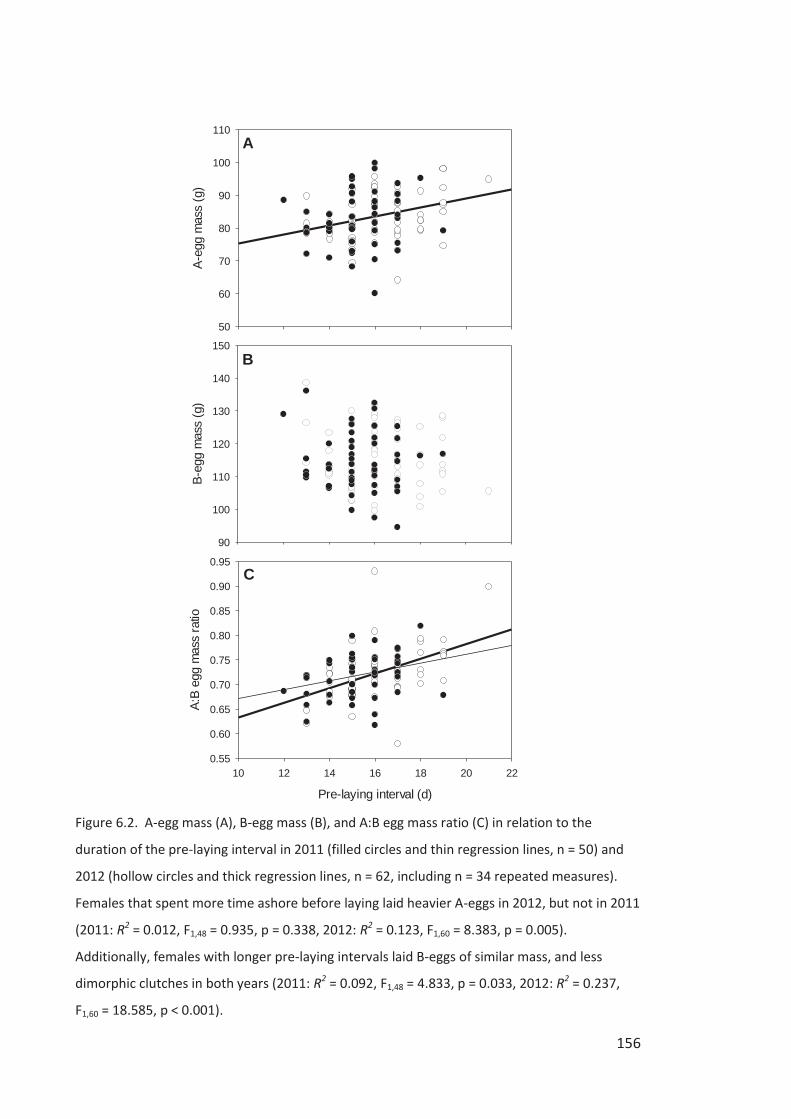
156
10 12 14 16 18 20 22
A-eg
g m
ass
(g)
50
60
70
80
90
100
110
Pre-laying interval (d)
10 12 14 16 18 20 22
A:B
egg
mas
s ra
tio
0.55
0.60
0.65
0.70
0.75
0.80
0.85
0.90
0.95 10 12 14 16 18 20 22
B-eg
g m
ass
(g)
90
100
110
120
130
140
150B
A
C
Figure 6.2. A-egg mass (A), B-egg mass (B), and A:B egg mass ratio (C) in relation to the
duration of the pre-laying interval in 2011 (filled circles and thin regression lines, n = 50) and
2012 (hollow circles and thick regression lines, n = 62, including n = 34 repeated measures).
Females that spent more time ashore before laying laid heavier A-eggs in 2012, but not in 2011
(2011: R2 = 0.012, F1,48 = 0.935, p = 0.338, 2012: R2 = 0.123, F1,60 = 8.383, p = 0.005).
Additionally, females with longer pre-laying intervals laid B-eggs of similar mass, and less
dimorphic clutches in both years (2011: R2 = 0.092, F1,48 = 4.833, p = 0.033, 2012: R2 = 0.237,
F1,60 = 18.585, p < 0.001).
157
B-egg mass
Females with deeper bills and longer flippers laid heavier B-eggs. Bill depth was factor most
strongly correlated with B-egg mass (Table 6.4), as found for A-egg mass (Figure 6.1). In
contrast to relationships with A-egg mass, flipper length was positively related to B-egg mass,
whereas pre-laying interval and lay date were unimportant (Table 6.2). Fixed factors explained
B-egg mass poorly (R2m = 0.09, Table 6.4). Individual females laid B-eggs of similar mass
between years, with an even higher repeatability than for A-eggs (ID-only model R2c = 0.83,
Table 6.4; R = 0.829 ± 0.049, Table 6.3). As found for A-egg mass, there was no relationship
between arrival date and B-egg mass.
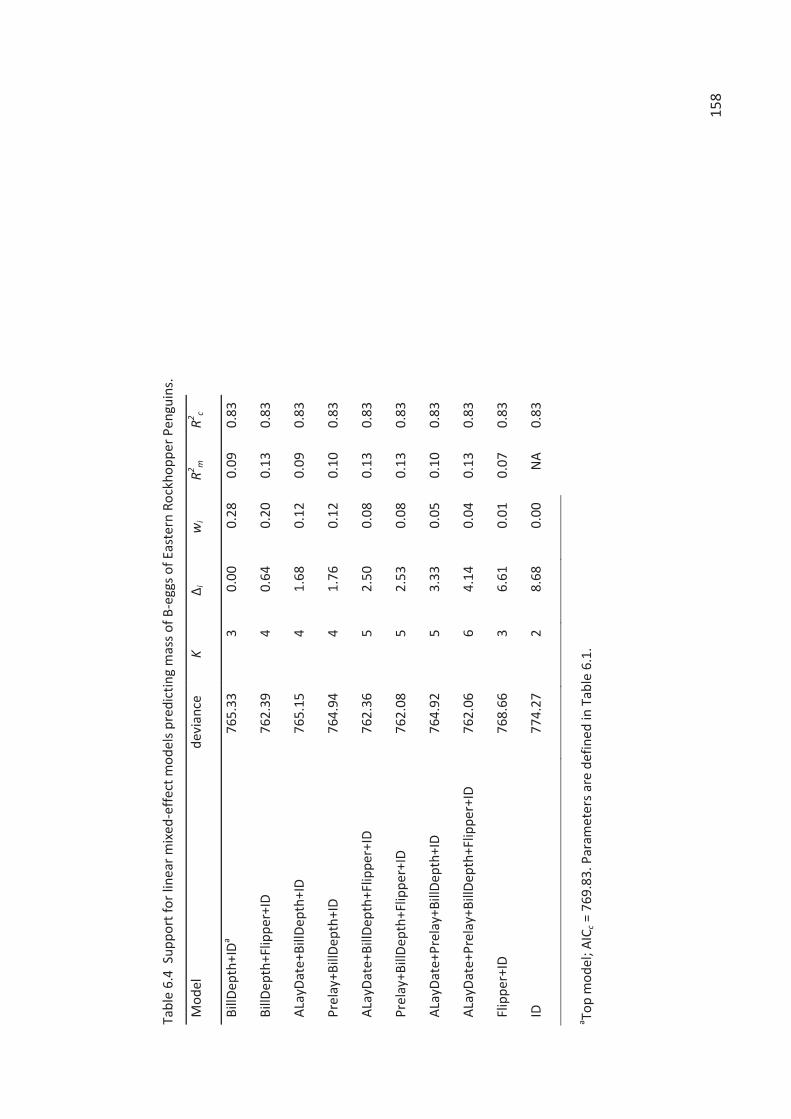
158
Tabl
e 6.
4 S
uppo
rt fo
r lin
ear m
ixed
-effe
ct m
odel
s pre
dict
ing
mas
s of B
-egg
s of E
aste
rn R
ockh
oppe
r Pen
guin
s.
Mod
el
devi
ance
K
Δ i
wi
R2 m
R2 c
BillD
epth
+IDa
765.
33
3 0.
00
0.28
0.
09
0.83
BillD
epth
+Flip
per+
ID
762.
39
4 0.
64
0.20
0.
13
0.83
ALay
Date
+Bill
Dept
h+ID
76
5.15
4
1.68
0.
12
0.09
0.
83
Prel
ay+B
illDe
pth+
ID
764.
94
4 1.
76
0.12
0.
10
0.83
ALay
Date
+Bill
Dept
h+Fl
ippe
r+ID
76
2.36
5
2.50
0.
08
0.13
0.
83
Prel
ay+B
illDe
pth+
Flip
per+
ID
762.
08
5 2.
53
0.08
0.
13
0.83
ALay
Date
+Pre
lay+
BillD
epth
+ID
764.
92
5 3.
33
0.05
0.
10
0.83
ALay
Date
+Pre
lay+
BillD
epth
+Flip
per+
ID
762.
06
6 4.
14
0.04
0.
13
0.83
Flip
per+
ID
768.
66
3 6.
61
0.01
0.
07
0.83
ID
774.
27
2 8.
68
0.00
N
A 0.
83
a Top
mod
el; A
ICc =
769
.83.
Par
amet
ers a
re d
efin
ed in
Tab
le 6
.1.
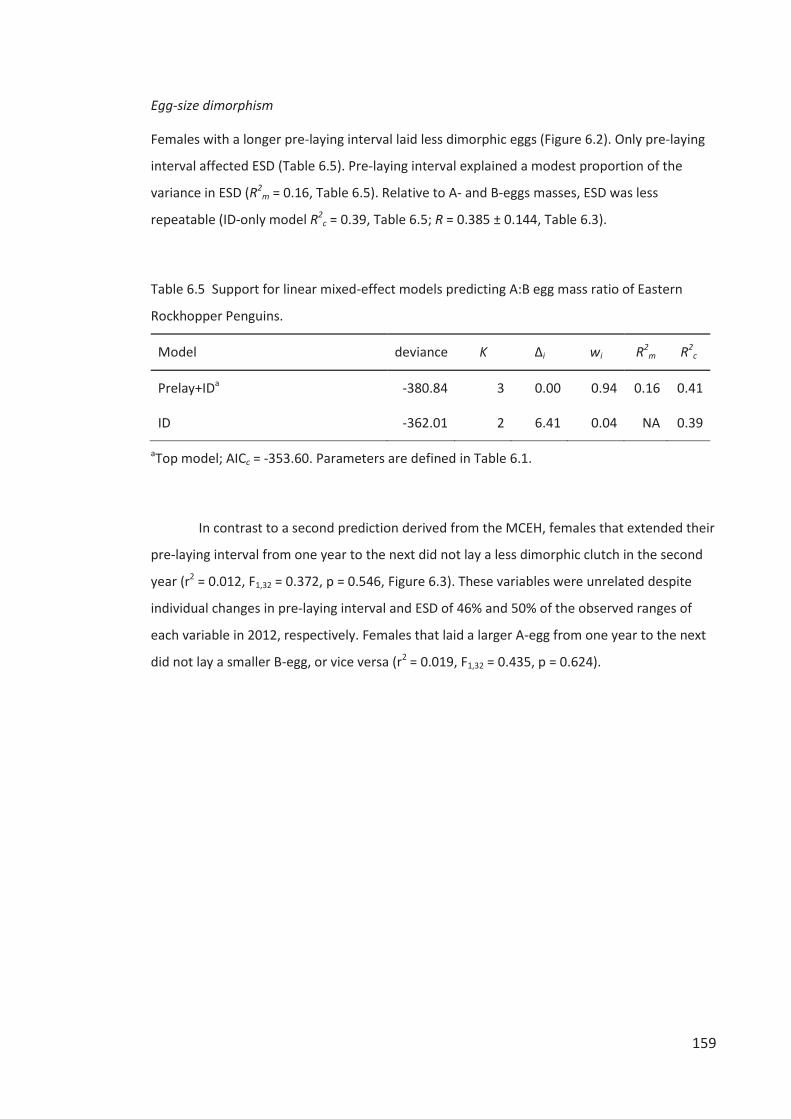
159
Egg-size dimorphism
Females with a longer pre-laying interval laid less dimorphic eggs (Figure 6.2). Only pre-laying
interval affected ESD (Table 6.5). Pre-laying interval explained a modest proportion of the
variance in ESD (R2m = 0.16, Table 6.5). Relative to A- and B-eggs masses, ESD was less
repeatable (ID-only model R2c = 0.39, Table 6.5; R = 0.385 ± 0.144, Table 6.3).
Table 6.5 Support for linear mixed-effect models predicting A:B egg mass ratio of Eastern
Rockhopper Penguins.
Model deviance K Δi wi R2m R2
c
Prelay+IDa -380.84 3 0.00 0.94 0.16 0.41
ID -362.01 2 6.41 0.04 NA 0.39
aTop model; AICc = -353.60. Parameters are defined in Table 6.1.
In contrast to a second prediction derived from the MCEH, females that extended their
pre-laying interval from one year to the next did not lay a less dimorphic clutch in the second
year (r2 = 0.012, F1,32 = 0.372, p = 0.546, Figure 6.3). These variables were unrelated despite
individual changes in pre-laying interval and ESD of 46% and 50% of the observed ranges of
each variable in 2012, respectively. Females that laid a larger A-egg from one year to the next
did not lay a smaller B-egg, or vice versa (r2 = 0.019, F1,32 = 0.435, p = 0.624).
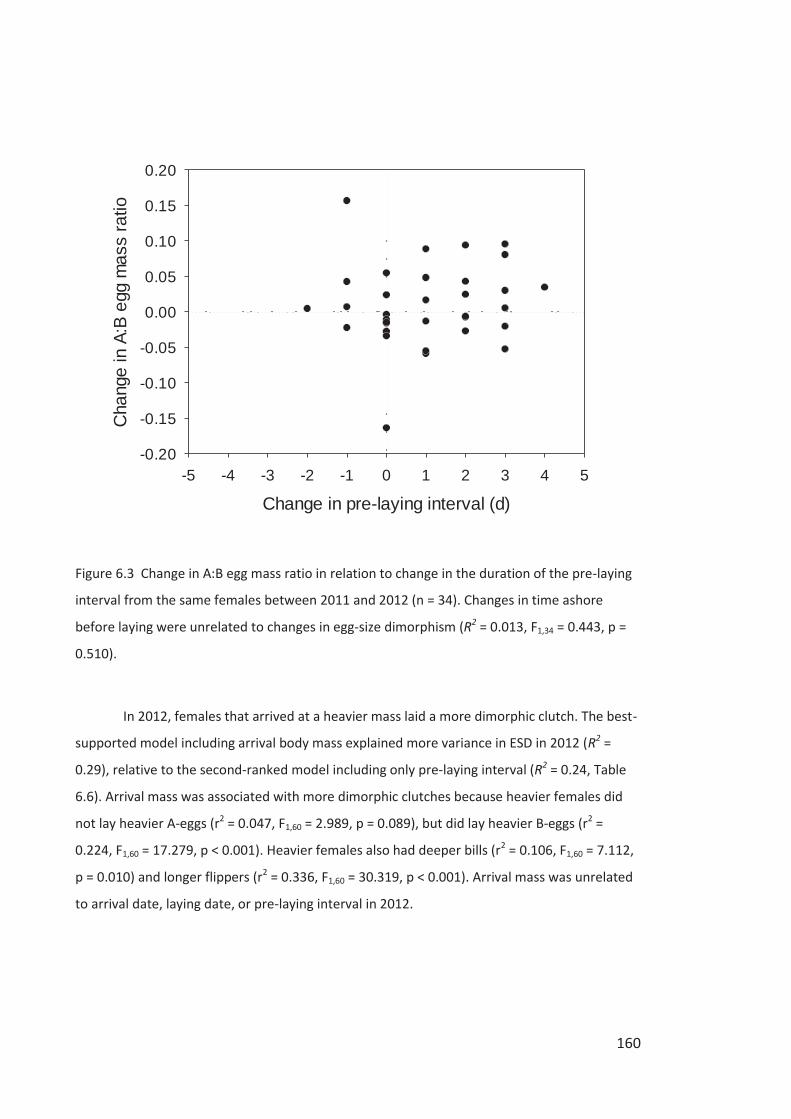
160
Change in pre-laying interval (d)-5 -4 -3 -2 -1 0 1 2 3 4 5
Cha
nge
in A
:B e
gg m
ass
ratio
-0.20
-0.15
-0.10
-0.05
0.00
0.05
0.10
0.15
0.20
Figure 6.3 Change in A:B egg mass ratio in relation to change in the duration of the pre-laying
interval from the same females between 2011 and 2012 (n = 34). Changes in time ashore
before laying were unrelated to changes in egg-size dimorphism (R2 = 0.013, F1,34 = 0.443, p =
0.510).
In 2012, females that arrived at a heavier mass laid a more dimorphic clutch. The best-
supported model including arrival body mass explained more variance in ESD in 2012 (R2 =
0.29), relative to the second-ranked model including only pre-laying interval (R2 = 0.24, Table
6.6). Arrival mass was associated with more dimorphic clutches because heavier females did
not lay heavier A-eggs (r2 = 0.047, F1,60 = 2.989, p = 0.089), but did lay heavier B-eggs (r2 =
0.224, F1,60 = 17.279, p < 0.001). Heavier females also had deeper bills (r2 = 0.106, F1,60 = 7.112,
p = 0.010) and longer flippers (r2 = 0.336, F1,60 = 30.319, p < 0.001). Arrival mass was unrelated
to arrival date, laying date, or pre-laying interval in 2012.
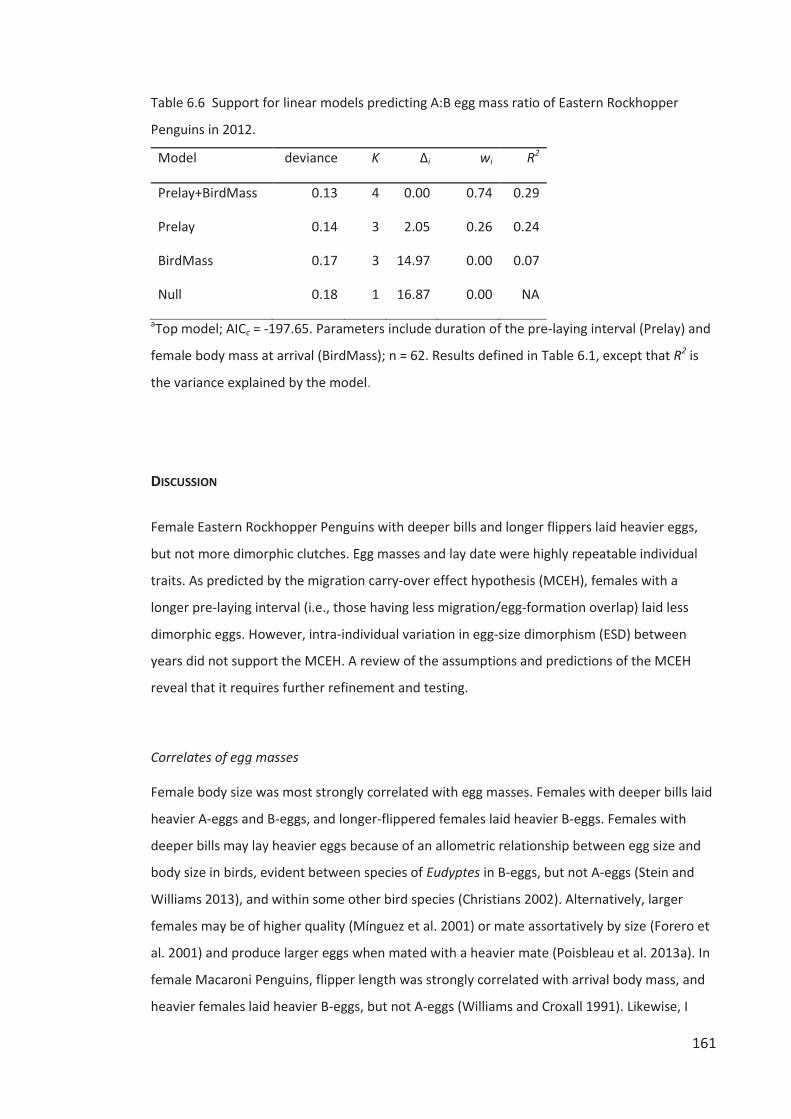
161
Table 6.6 Support for linear models predicting A:B egg mass ratio of Eastern Rockhopper
Penguins in 2012.
Model deviance K Δi wi R2
Prelay+BirdMass 0.13 4 0.00 0.74 0.29
Prelay 0.14 3 2.05 0.26 0.24
BirdMass 0.17 3 14.97 0.00 0.07
Null 0.18 1 16.87 0.00 NA
aTop model; AICc = -197.65. Parameters include duration of the pre-laying interval (Prelay) and
female body mass at arrival (BirdMass); n = 62. Results defined in Table 6.1, except that R2 is
the variance explained by the model.
DISCUSSION
Female Eastern Rockhopper Penguins with deeper bills and longer flippers laid heavier eggs,
but not more dimorphic clutches. Egg masses and lay date were highly repeatable individual
traits. As predicted by the migration carry-over effect hypothesis (MCEH), females with a
longer pre-laying interval (i.e., those having less migration/egg-formation overlap) laid less
dimorphic eggs. However, intra-individual variation in egg-size dimorphism (ESD) between
years did not support the MCEH. A review of the assumptions and predictions of the MCEH
reveal that it requires further refinement and testing.
Correlates of egg masses
Female body size was most strongly correlated with egg masses. Females with deeper bills laid
heavier A-eggs and B-eggs, and longer-flippered females laid heavier B-eggs. Females with
deeper bills may lay heavier eggs because of an allometric relationship between egg size and
body size in birds, evident between species of Eudyptes in B-eggs, but not A-eggs (Stein and
Williams 2013), and within some other bird species (Christians 2002). Alternatively, larger
females may be of higher quality (Mínguez et al. 2001) or mate assortatively by size (Forero et
al. 2001) and produce larger eggs when mated with a heavier mate (Poisbleau et al. 2013a). In
female Macaroni Penguins, flipper length was strongly correlated with arrival body mass, and
heavier females laid heavier B-eggs, but not A-eggs (Williams and Croxall 1991). Likewise, I
162
found that heavier female Eastern Rockhopper Penguins had longer flippers and laid heavier B-
eggs, but not A-eggs, so that heavier females laid more dimorphic clutches. This suggests that
females with the resources available to do so preferentially invest in the larger, more
successful B-egg. However, heavier clutches were not more dimorphic in the present study or
in Macaroni Penguins (Williams 1990; Crossin et al. 2010). Instead, A-egg and B-egg masses
were strongly positively correlated within a clutch. Females that laid at a later date laid heavier
A-eggs, in contrast to the pattern found in Macaroni Penguins in one of two years of study
(Williams and Croxall 1991). The relatively weak positive correlation between lay date and A-
egg mass I found is counter to the prediction that earlier-laying females would lay larger eggs,
and requires confirmation by additional study.
Correlates of egg-size dimorphism
In agreement with the main prediction of the MCEH, females with a longer pre-laying interval
(less migration/egg-formation overlap) laid less dimorphic eggs, although this factor alone
explained only 16% of the variation in ESD. The duration of the pre-laying interval explained a
similar c. 23% of the variation in ESD in Macaroni Penguins (from data in Figure 1A, Crossin et
al. 2010). No other factor considered in the present study, or by Crossin et al. (arrival date-
corrected body mass or clutch mass) had a detectable effect on ESD. In Southern Rockhopper
Penguins (Eudyptes chrysocome) at the Falkland Islands, females paired with a new mate or a
heavy mate laid less dimorphic clutches (Poisbleau et al. 2013a). Such females were apparently
responding to an increased probability of fledging two chicks and sought to reduce the size
disadvantage of the A-chick (Poisbleau et al. 2013a). A similar response to mate quality would
be maladaptive in Macaroni, Royal (E. schlegeli), or Erect-crested (E. sclateri) Penguins, which
typically lose their A-egg soon after it is laid and have never been observed to fledge two
chicks (St Clair et al. 1995).
Repeatability in egg masses and breeding chronology
If migration/egg-formation overlap had a causative, rather than correlative relationship with
ESD, then a change in overlap should be reflected in a change in ESD, but there was no
evidence of this in the current study. Furthermore, individual identity was a better predictor of
ESD than was pre-laying interval, because individual females tended to lay similarly dimorphic
clutches between years (repeatability of 0.39). Nevertheless, A-egg mass, and especially B-egg
mass and clutch mass were even more repeatable traits. Their repeatability values (R = 0.73,
163
0.83, and 0.86, respectively) exceed the average repeatability of egg size in birds of 0.68
reported in the review by Christians (2002), although calculation methods may vary. As shown
here, A-egg mass was less repeatable in Macaroni Penguins than was B-egg mass (Williams and
Croxall 1991). A relative constancy in egg investment and lay dates has also been shown in
Southern Rockhopper Penguins, in which indices of regional and local environmental variation
had little or no influence on egg masses, clutch mass, or ESD over seven years (Dehnhard et al.
2015). The infrequent and non-repeatable occurrence of dimorphic clutches in Magellanic
Penguins (Spheniscus magellanicus) is maladaptive and has been attributed to noise in the
system (Boersma and Rebstock 2009). Likewise, noise may account for much of the intra-
individual variation in ESD in Eudyptes penguins. Arrival dates and the duration of the pre-
laying interval were similarly repeatable to ESD (both 0.46), whereas A-egg lay date was as
highly repeatable as B-egg mass and clutch mass (0.86). The high individual repeatability of A-
egg lay date may be attributable to migratory penguins initiating egg formation at sea in
response to a photoperiod cue (Williams 1995), and an individual’s sensitivity to photoperiod
having a genetic component (Coppack et al. 2001; Visser et al. 2011).
Migratory carry-over effect hypothesis
The MCEH is based on the idea that there is a direct physiological conflict between migration
and reproductive development that constrains production of the yolk precursor vitellogenin
(VTG) at sea and therefore limits rates of yolk growth, especially for the earlier-initiated A-egg.
We are accustomed to thinking of avian migration as a period of great energetic stress where
birds must depart fat (and arrive thin, if at all) because of prolonged periods of flight relative to
feeding. However, the opposite is true for migratory penguins. While at sea during migration
Eudyptes penguins can feed and potentially fatten, whereas after arrival they fast while
completing egg formation and partway through incubation. At arrival female Eudyptes
penguins are heavier than at any other time in the following 4-month long breeding season,
and may go on to lose 40% of their body mass over a fast of > 40 days (Williams 1995; Chapter
3). Intuitively, one would expect that forming eggs while fasting during the pre-laying interval
ashore would be more physiologically challenging than forming eggs during migration,
reasoning opposite to that of the MCEH.
The MCEH hypothesizes that females with a longer pre-laying interval (less
migration/egg-formation overlap) are released from a migration-dependent physiological
constraint earlier in their yolk formation periods, allowing them to produce higher plasma VTG
164
levels and increase their yolk growth rates earlier relative to yolk completion than females that
lay sooner after arriving. Crossin et al. (2010) found that those females that would go on to
have longer pre-laying intervals had higher VTG levels at arrival, and interpreted this as strong
evidence supporting the MCEH. However, a relationship between VTG levels at arrival and the
duration of the pre-laying interval is not a logical prediction from the MCEH. VTG levels at
arrival reflect VTG levels obtained while migrating, when the MCEH proposes VTG production
is constrained for all females. Females that inexplicably had high VTG levels at arrival could not
have been able to produce them during migration because of their longer pre-laying interval,
because all females have experienced the same brief (< 24 hr) period ashore before being
sampled at arrival. A robust demonstration of a link between VTG levels, pre-laying interval,
and ESD would need to show that females with the longest pre-laying intervals reached their
individual maximal VTG levels sooner before laying, and laid less dimorphic clutches, than
females with greater migration/egg-formation overlap. As Crossin et al. (2010) demonstrated
that mean VTG levels increased between arrival and A-egg laying, individual maximal levels are
presumably attained during the pre-laying interval, some days after arrival.
Female Eudyptes penguins lay an A-egg that is smaller than their B-egg, so the rate of
egg formation and/or the duration of the egg formation period must differ between each egg.
However, the MCEH does not account for the possibility of intra-clutch variation in egg
formation times and assumes that the overall mean times reported by Grau (1982) in Fiordland
Penguins are the same for both A- and B-eggs of Macaroni Penguins. Data from Grau (1982)
demonstrated that for Fiordland penguins the average yolk formation period of A-eggs is
sufficiently shorter than that of B-eggs to explain the difference in average yolk mass. For A-
eggs, a 24.5 g yolk formed over 15.7 d gives a rate of yolk formation of 1.6 g/d. For B-eggs, a
28.0 g yolk formed over 17.3 d also results in a rate of yolk formation of 1.6 g/d. Therefore, the
assumption of a slower yolk formation rate for A-eggs, central to the MCEH, is unsupported in
the only Eudyptid in which formation times have been studied. Additionally, any intra-clutch
variation in the c. 7 day lag period between yolk completion and laying is especially relevant to
ESD, because albumen, membranes, and shell are formed and deposited during this time (Grau
1982; Grau 1984). Albumen accounts for 86% of the difference in the mean wet mass of egg
contents between A- and B-eggs in Macaroni Penguins (from Table 1 in Crossin et al. 2010), but
its deposition does not overlap with migration in Macaroni Penguins (Crossin et al. 2010) or in
Eastern Rockhopper Penguins in this study (all pre-laying intervals ≥ 7 d). This suggests that the
focus of the MCEH on yolk growth/migration overlap is too narrow. Clearly, the potential
effect of intra-clutch variation in albumen formation times and deposition rates on ESD is
165
large. The assumptions of the MCEH of equal formation times between eggs, between
individuals, and across the Eudyptes genus, requires validation.
The genus-wide trait of ESD presumably evolved only once in the ancestral Eudyptid.
ESD appears to be a canalized trait exhibited independently of a migratory carry-over effect, as
it is evident in the dimorphic eggs of Fiordland Penguins that do not appear to initiate egg
formation prior to arrival (Grau 1982) and the dimorphic eggs of captive Eudyptids that have
undergone no migration (Stein and Williams 2013). If a migratory carry-over effect was
important in the evolution of ESD, then how do other penguin species with a similar degree of
overlap avoid a carry-over effect and lay similar-sized eggs? As Crossin et al. (2010)
demonstrated for Macaroni Penguins, female Adélie (Pygoscelis adeliae), Chinstrap (P.
antarctica) and Magellanic Penguins may be migrating, on average, during the first half of their
A-egg formation period (Astheimer and Grau 1985; Boersma et al. 1990; Trivelpiece and
Trivelpiece 1990). In contrast to expectations from the MCEH, Adélie penguin A-eggs are
heavier, on average, than B-eggs (ESD = 1.07; Astheimer and Grau 1985) and typically A- and B-
eggs are of equal size in Magellanic (Boersma et al. 1990) and Chinstrap Penguins (de León et
al. 2001).
The novel approach of Crossin et al. (2010) in considering the proximate, physiological
cause of ESD in Macaroni Penguins represents a major innovation in methods applied to this
enigmatic trait of Eudyptes penguins, but requires further refinement and testing: (1) the
relationship between overlap and plasma VTG levels at arrival does not follow logically from
the MCEH as yet described, (2) the additional factors of body size that were correlated with
egg sizes and raw body mass that was related to ESD in the present study warrant further
consideration, (3) alternative hypotheses for variation in ESD such as intra-clutch variation in
egg formation times require investigation, and (4) further tests of the MCEH should again
utilize repeated measures, while assessing changes in the relative masses of yolk and albumen
may prove especially insightful.
ACKNOWLEDGEMENTS
P. Battley, D. Armstrong , D. Thompson, K. Gorman, M. Hipfner, S. Jamieson, E. Minot, M.
Potter, K. Salvante, W. Stein, and J. Waas provided discussion and comments that improved
the manuscript. Methods were approved by the Massey University Animal Ethics Committee,
protocol no. 10/90. I am grateful to Massey University, the Natural Sciences and Engineering
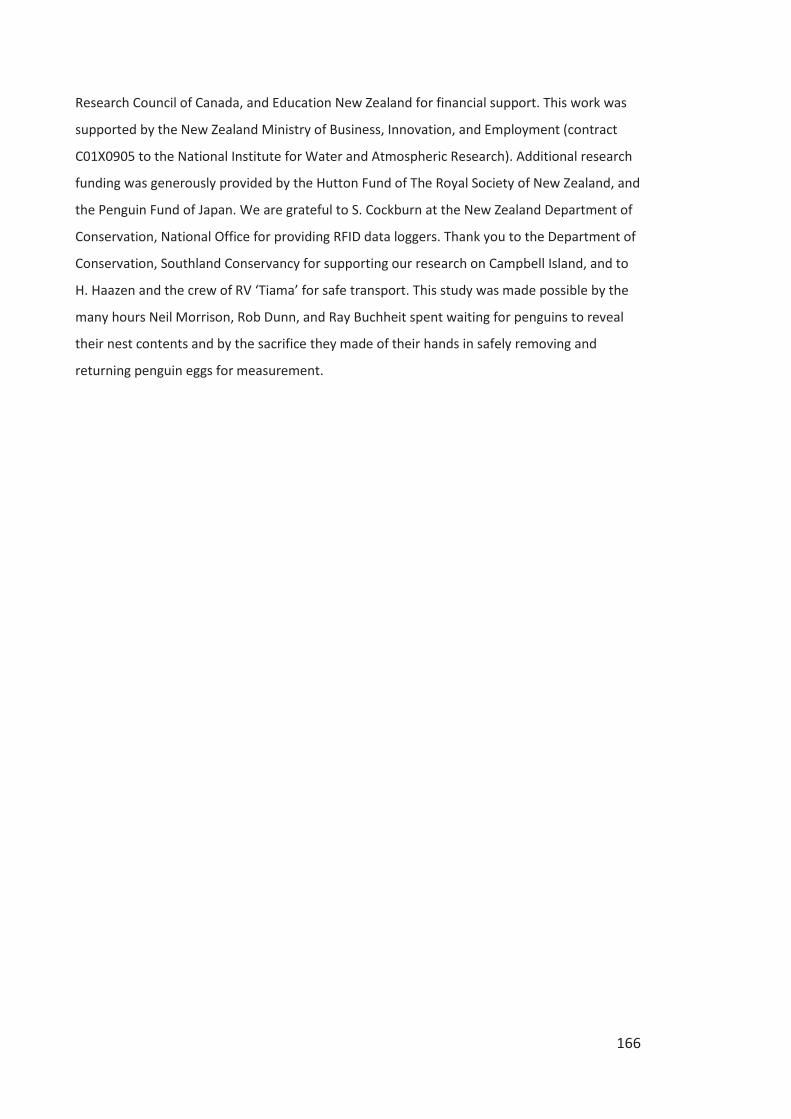
166
Research Council of Canada, and Education New Zealand for financial support. This work was
supported by the New Zealand Ministry of Business, Innovation, and Employment (contract
C01X0905 to the National Institute for Water and Atmospheric Research). Additional research
funding was generously provided by the Hutton Fund of The Royal Society of New Zealand, and
the Penguin Fund of Japan. We are grateful to S. Cockburn at the New Zealand Department of
Conservation, National Office for providing RFID data loggers. Thank you to the Department of
Conservation, Southland Conservancy for supporting our research on Campbell Island, and to
H. Haazen and the crew of RV ‘Tiama’ for safe transport. This study was made possible by the
many hours Neil Morrison, Rob Dunn, and Ray Buchheit spent waiting for penguins to reveal
their nest contents and by the sacrifice they made of their hands in safely removing and
returning penguin eggs for measurement.
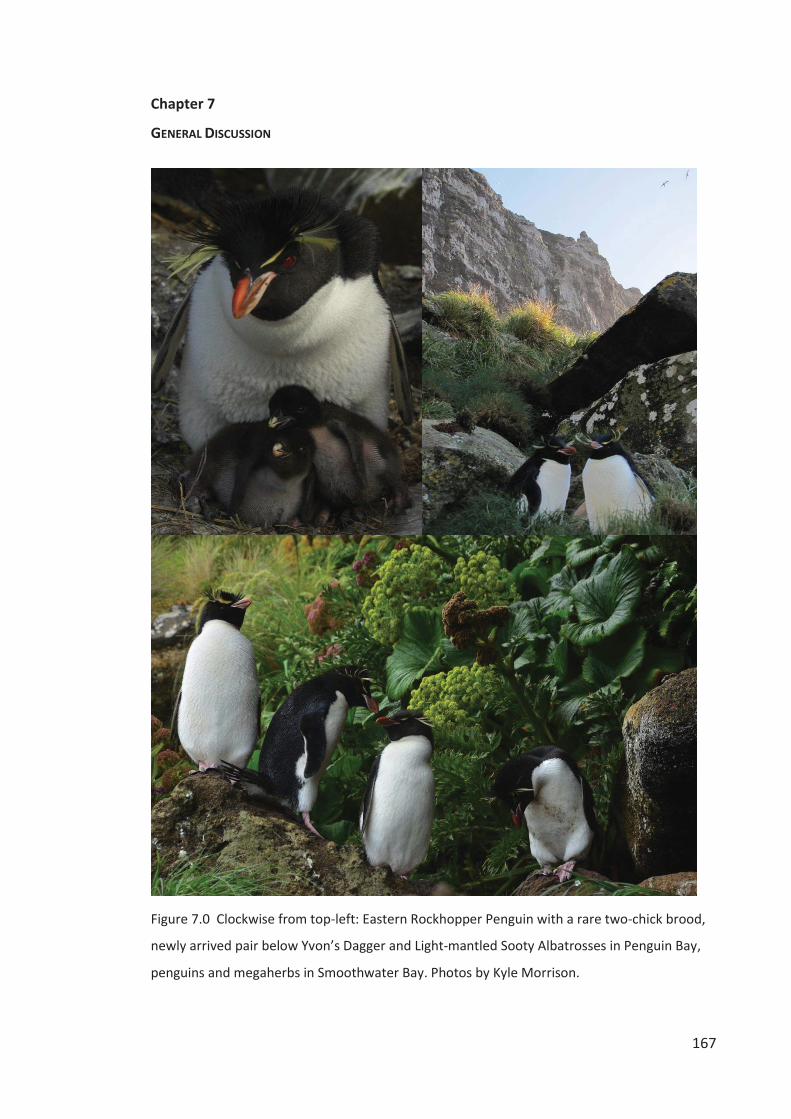
167
Chapter 7
GENERAL DISCUSSION
Figure 7.0 Clockwise from top-left: Eastern Rockhopper Penguin with a rare two-chick brood,
newly arrived pair below Yvon’s Dagger and Light-mantled Sooty Albatrosses in Penguin Bay,
penguins and megaherbs in Smoothwater Bay. Photos by Kyle Morrison.
168
KEY FINDINGS
The aims of this thesis were to investigate what factors were affecting the population
dynamics of Eastern Rockhopper Penguins on Campbell Island, including to determine the
relative importance of food availability and predation on reproductive success, first-year
survival, and adult survival. Fortuitously, a sharp difference in diet quality and associated
nutritional stress between the two intensive years of my study allowed for a comparison of the
relative importance of both top-down and bottom-up effects on demographic rates. Each of
the five research chapters examined different effects on penguin population parameters. The
later three chapters also considered constraints that restricted penguins’ responses to the
factors affecting their demographic rates.
Chapter 2 estimated the total Campbell Island Eastern Rockhopper Penguin population
size to be 33,239 breeding pairs in 2012, a 21.8% decrease from an adjusted estimate of
42,528 pairs in 1984. However, the recent decline occurred before 1996 with most colonies
being stable or growing thereafter. The recent decline represents just 0.7% of the 1942
population size and occurred at a much slower rate (λ = 0.991) than the 94% decline 1942–
1984 (λ = 0.940). Population growth after 1996 appears related to the current global warming
hiatus, lower sea surface temperatures (SSTs), and increased abundance of a key prey species.
This result supported the conclusion of previous research in the 1980s, that periods of penguin
population decline were associated with warm SST. In Chapter 2 differences in predation rates
were suggested to be the cause of contrasting population trends between neighboring
colonies, a hypothesis examined in Chapter 5.
Chapter 3 found that male penguins returned from their incubation foraging trip at a
heavier mass if they had consumed a lower-trophic level diet. On average, chicks were fed a
lower trophic level diet in 2011, when chicks were larger and heavier than in 2012. These
results and a review of other studies relating dietary trophic level to body mass or condition
contradicted the assumption typically made in retrospective studies of marine predator diet;
that historic declines in predator populations are caused by shifts to lower-trophic level diets
of lower quality. Instead, my results indicate that Eastern Rockhopper Penguins do better on a
lower trophic level diet. A similar inference was drawn in the 1980s when the rapidly declining
Campbell Island population’s diet was found to be more fish-based than at other, more stable
colonies.
Chapter 4 found that the canalized parental roles of Eastern Rockhopper Penguins
during early chick-rearing resulted in some females, but especially males, making a long self-
169
feeding trip in the crèche stage, lowering the number of feeds chicks received. As expected,
chicks were heavier when fed more often. On average, chicks received a lower rate of
provisioning in a year of nutritional stress, in part because a higher proportion of males made a
self-feeding trip, and because such trips were of longer duration in the poor year than in the
good year. It appears as though the canalized division of labour strategy of Eudyptes penguins
limits chick growth and survival to recruitment in years of nutritional stress, an important
finding if such years become more frequent under climate change. Eudyptes penguins are
likely constrained from evolving a strategy of shared brood guarding and provisioning
throughout chick-rearing by the vulnerability of chicks guarded by females to loss through
conspecific abuse and predation.
Chapter 5 determined that, as predicted, penguin nests in exposed, peripheral sites, in
small sub-colonies were most strongly affected by skua predation, especially of eggs. More
surprising was the high rate of New Zealand sea lion predation of adult penguins. Population
modelling suggested that the low adult survival rate was the most important factor causing the
localized decline in Penguin Bay. Analyses indicated that without skua and sea lion predation,
estimated demographic rates would result in a stable penguin population, supporting the
hypothesis of Chapter 2 that high predation rates were driving the continued localized decline
in Penguin Bay.
Chapter 6 tested the migratory carryover effect hypothesis (MCEH), which suggests
that migration/egg-formation overlap results in sub-maximal rates of yolk growth, especially
for the earlier-initiated A-egg, underlying the enigmatic trait of extreme intra-clutch egg-size
dimorphism in Eudyptes penguins. As predicted by the MCEH, female Eastern Rockhopper
Penguins presumed to have less migration/egg-formation overlap laid less dimorphic clutches,
but within-individual variation in egg-size dimorphism between years was unrelated to
changes in overlap. Egg masses, and to a lesser extent egg-size dimorphism, were highly
repeatable traits related to body size and mass. These results and further evaluation of the
MCEH suggest that migration-related conflicts are unlikely to be the underlying cause of egg-
size dimorphism in Eudyptes penguins.
BOTTOM-UP CONTROL OF POPULATION DYNAMICS
Bottom-up control of marine predator populations occurs when food availability regulates the
population growth rate. In Chapter 4 I demonstrated how in a year when adults were
nutritionally stressed they made longer self-feeding trips and lowered their chick-provisioning
170
rates. Adults buffering their own survival rate at the expense of the current year’s reproductive
success under poor environmental conditions is a key aspect of a slow-life history strategy, and
is evident in other species of long-lived seabirds and mammals (Drent and Daan 1980; Forcada
et al. 2008). I found that chicks that received fewer feeds were smaller at a given age, and
because penguin chicks that fledge at lower body masses have a lower probability of survival
to recruitment, the nutritional stress experienced by adults will carry through to negatively
affect the population growth rate. This strategy is likely to result in population growth or
stability when years of low food availability are relatively rare, but if factors such as climate
change result in extended periods of poor conditions or more frequent years which vary
outside of an optimal range, then repeatedly poor reproductive success and recruitment will
cause population declines. This is likely the mechanism driving the overlap between periods of
higher and more variable SST and declining numbers of Eastern Rockhopper Penguins on
Campbell Island described in Chapter 2. Similarly, at Marion Island a warming SST trend is
linked to adult Macaroni and Eastern Rockhopper Penguins arriving to breed at lower body
masses and to declines in their populations (Mélice et al. 2003; Crawford et al. 2006).
Presumably these adults have insufficient body reserves to endure the extended fasts required
of successful breeders and provision their chicks at the required rate to support their survival
to fledge and recruit. In the poor food year of 2012 I found that earlier-arriving females fed
their chick at a higher rate, but females that were heavier at arrival did not. The earlier arrival
of higher quality (but not necessarily heavier) females may explain that pattern. In Chapter 3 I
showed that arrival body masses were similar in the good year of 2011 and poor year of 2012,
so that poor conditions may have been localized to the vicinity of Campbell Island or
developed after arrival in 2012. I expect that female body mass at return from their incubation
foraging trip (and after their long courtship/incubation fast and major mass loss) and just prior
to their commencement of chick provisioning, is likely to be a better predictor of provisioning
rate than arrival body mass. I did not weigh a suitably large sample of females at their
incubation return to relate their mass to their subsequent provisioning rate.
In Chapter 3 I found that penguins were heavier when consuming a lower trophic level
diet, composed of more zooplankton than fish or cephalopods. This result was counter to the
assumption of some studies, that the higher energy density of fish prey results in their being a
higher quality diet (Hilton et al. 2006; Norris et al. 2007; Wiley et al. 2013). I assumed that
penguin body masses reflected diet quality, by which I meant the net gain in energy and
nutrients provided by prey. Such a holistic definition of diet quality was necessary because I
did not measure the quantity or energy density of prey delivered, as some studies do (Jodice et
171
al. 2006; Schrimpf et al. 2012). However, it is really net energy gain that matters to a seabird,
as prey of high energy density are not profitable if they are too fast or few and far between to
catch. I suggest the penguins in my study, and other marine predators in the literature I cite,
can achieve higher masses on a low trophic level diet because they target zooplankton when
they are super abundant and efficiently captured. At times when fish are as readily caught,
they are likely to be the higher quality diet, but those circumstances appear to be exceptional
for most marine predators. This insight has broad relevance to the increasing number of
studies of marine trophic relationships and diet which utilize stable isotopes (Hobson et al.
2004; Hobson 2011; Bond and Lavers 2014), as it emphasizes that assumptions about trophic
level and diet quality require verification in the system of study. I suggested in Chapter 2 that
the overall penguin population growth I found since 1996 was associated with cooler SSTs and
strong year classes of southern blue whiting (Micromesisteus australis, SBW), a fish species
common in chick diets during the mid-1980s (Marchant and Higgins 1990). SBW may have
been abundant enough at this time for them to represent a higher quality diet than one
composed of more zooplankton. Alternatively, strong year classes of SBW are likely to
represent strong production of zooplankton that both SBW and penguins feed upon (Willis et
al. 2007). Detailed studies of dive efficiency and prey capture rates in relation to energy
balances and the type and amount of prey captured will help to further understand the
relationship between trophic-level and diet quality (Green et al. 2002; Green et al. 2005).
TOP-DOWN CONTROL OF POPULATION DYNAMICS
Logistics and access restricted my study to the penguins in Penguin Bay, the colony which
declined fastest since 1984, a decline that has seemingly not slowed when others did since
1996 (Chapters 2, 5). This restriction was partly unfortunate, in that the demographic rates
recorded in Penguin Bay are unlikely to reflect those elsewhere, but also fortuitous in allowing
an investigation into the cause of the localized decline. I found that reproductive success, and
especially adult survival rates were being depressed below those required for a stable
population growth rate by Brown Skua and New Zealand sea lion predation, respectively. I
found that the poor food year of 2012 resulted in the lowest rates of reproductive success and
adult survival, but such bottom-up effects would occur in the growing, neighbouring colonies
as well. Hence, top-down control of the Penguin Bay population growth rate requires an
explanation of why predation rates were higher there than elsewhere. The results of Chapter 5
support the hypothesis put forth in Chapter 2, that colony topography increases the
predator/penguin ratios in Penguin Bay and facilitates higher predation success. Both A- and B-
172
eggs were more likely to hatch at sheltered nests, and the few nests that raised both chicks
beyond the guard stage tended to be at sheltered nests. The distribution of boulders that
provide the best nest shelter is irregular in Penguin Bay, and the fragmentation of the single
large colony in the main part of Penguin Bay into four sub-colonies and the subsequent
extinction of one of these appears related to the distribution of sheltered nests.
The number of sea lion pups produced in Penguin Bay has grown since the mid-1980s,
and sea lion numbers observed in Penguin Bay were higher than at other penguin colonies
(Chapter 5). This appears to be because of Penguin Bay’s proximity to the major haul-out site
in Sandy Bay, its greater shelter from the predominant southwesterly winds and swell, and
access to the uplands where a few cows choose to pup and socially immature males follow.
Leopard seals (Hydrurga leptonyx) have the largest proportional effect on Adélie Penguin
colonies of intermediate size (Ainley et al. 2005), as the territoriality of hunting seals restricts
the number hunting along a section of shoreline and the penguin transit rate is too low from
the smallest colonies to attract hunting seals. Likewise, the intermediate size of the Penguin
Bay penguin population relative to others on Campbell Island may contribute to the important
effect of predation on the population growth rate. This may suggest that the Penguin Bay
population will eventually decrease to a size at which sea lion predation is no longer
important. However, New Zealand sea lion predation has strong local effects on Yellow-eyed
Penguin populations, which are small and dispersed relative to other penguins (Moore and
Moffat 1992; Lalas et al. 2007). In the same way small sub-colonies of penguins would
presumably become unattractive to skuas, but I found that the territoriality of skuas meant
that predation by the resident pair of the smallest penguin sub-colony was proportionately
larger than elsewhere (Chapter 5). Furthermore, single large colonies cannot be readily
defended by a single breeding pair, so that disputes between competing pairs seems to lower
the proportional effect of skua predation on larger colonies.
Predation effects may be synergistic when two or more predator species target the
same prey, if the activities of one facilitate predation by another. For example, in attacking a
large colony of cliff-nesting Common Murres (Uria aalge), a Bald Eagle (Haliaeetus
leucocephalus) will kill at most one murre, but the whole colony may temporarily abandon its
eggs, causing many to fail through displacement and predation by Glaucous-winged Gulls
(Larus glaucescens; Hipfner et al. 2011). Interactions between the suite of penguin predators in
Penguin Bay appeared to be similarly synergistic. Brown Skuas and Northern Giant Petrels
scavenged the penguin kills of New Zealand sea lions, presumably boosting the avian
predators’ attendance, reproductive success, and predation rates on penguins (Chapter 5).
173
Giant Petrels sometimes stole penguin chicks killed by skuas, presumably causing skuas to kill
more chicks than they would have otherwise. When incubating or brooding penguins were
forced from their nests by sea lions traversing through breeding colonies, unattended eggs and
small chicks were vulnerable to skua predation. Giant Petrel predation attempts on sub-adult
and adult penguins appeared to be most successful when the petrel could isolate one victim
from the many targets presented by a large group of penguins moving along the pathway into
the inland sub-colonies. Penguins came ashore in larger rafts formed by the amalgamation of
smaller rafts that had been delayed from landing by sea lions hunting along the shoreline, so
that sea lion predation risk likely increased petrel predation success indirectly.
CONSTRAINTS ON BEHAVIOURAL PLASTICITY
Observations of Rockhopper Penguins suggest they have a difficult existence. They are small-
bodied, and appear to be pushing the boundaries of fasting and resisting predators in their
breeding ecology, raising the question of why selection has not favoured an easier route.
Firstly, why not be a bit larger, better able to defend yourself, and have a slower metabolic
rate? The answer may be that the bigger Eudyptid niche was already filled. Southern and
Eastern Rockhopper Penguins are the only Eudyptids that sometimes breed sympatrically with
another Eudyptid. Warham (1975) pointed out that in all such instances, the larger Eudyptid
breeds earlier by 2–4 weeks than the Rockhopper Penguin, and that niche partitioning by time,
depth, and size-class of prey may be important to their ability to coexist. Secondly, why not
have shorter incubation/pre-laying fasts by arriving closer to laying, make feeding trips
between arrival and laying as some other penguin species do, or have one sex depart
immediately after clutch completion? Additionally, why not eliminate the second long male
fast altogether by sharing chick guarding and provisioning duties between the sexes? It would
seem clear that shorter fasts would be beneficial by removing the risk of abandonment of eggs
I reported in Chapter 4 and would allow for increased parental investment in chick-rearing
through more frequent provisioning, producing bigger, more successful chicks. However, it
may be that Eudyptes penguins are constrained from making adjustments towards shorter
fasts by other factors that would negatively affect their fitness. I argued in Chapter 4 that nest
site quality likely varied more for Eudyptes penguins than for other genera, owing to their
small body size and the rocky slopes of many colonies. I demonstrated the importance of nest
quality in Chapter 5 in the finding that the degree of nest shelter strongly influenced hatching
success of both A- and B-eggs and the proportion of well-sheltered nests in a sub-colony
influenced its probability of persistence. Furthermore, I argued in Chapter 4 that the greater
174
sexual size dimorphism of Eudyptes penguins relative to other penguin genera appears to
disadvantage females in defending nests against conspecifics and predators. Such factors likely
explain why selection has favoured arriving early and staying days after clutch completion over
a shorter fast, as well as why only males guard chicks at the cost of a potentially higher
provisioning rate.
In contrast to their relatively fixed breeding schedule and dimorphic clutches of a fixed
two-egg clutch size (Chapter 6), Rockhopper Penguins appear to have considerable plasticity in
their diet and foraging behaviour. As shown in Chapters 3 and 4 and by Tremblay and Cherel
(2003; 2005), foraging behaviour and prey selection may vary greatly between years and
breeding locations, including multi-day provisioning trips versus two trips in a single day, and
different dive depths and rates. Plasticity in reproductive investment is apparent in my
recording one female in the good year of 2011 who was raising two chicks (of combined mass
c. 50% heavier than chicks being raised without a sibling) by commonly making two
provisioning trips in a single day, a rare behaviour for females rearing a single chick (K.W.M.
unpub. data). This suggests that when food is abundant and sufficiently near shore,
Rockhopper Penguin behaviour is plastic enough to increase their provisioning rate and chick
production. Near shore food availability was evident in 2011 by observations of rafts of
penguins continuing to make foraging dives within Penguin Bay < 500 m offshore, as Cape
Petrels (Daption capense) and Campbell Albatrosses fed amongst such rafts of penguins.
Evidently, Rockhopper Penguins can readily exploit favourable conditions, and have high
demographic rates resulting in rapid population growth, as described in Chapter 5 for Southern
Rockhopper Penguins on the Falklands Islands where the total population grew by 51% from
2005–2010 (Baylis et al. 2013).
A species’ genotype may also constrain its behavioural plasticity (Nussey et al. 2007). A
number of the unusual traits of Eudyptes penguins are shared by all species in the genus, such
as long fasts including male-only chick guarding and highly dimorphic two-egg clutches. The
most parsimonious explanation of genus-wide traits is that they evolved only once in the
ancestral species where they became a canalized trait and were inherited by each daughter
species, rather than having evolved multiple times independently. This is likely also true of
fasting and egg-size dimorphism in Eudyptes penguins, but inter-species comparisons also
demonstrate that differences in ecological context can cause micro-evolution that modifies
expression of these traits over time (Nussey et al. 2007). In terms of fasting duration, Macaroni
Penguins breeding at low latitudes such as South Georgia are able to exploit the abundant prey
of the Polar Front, but their southerly location shortens the time period of suitable
175
environmental conditions for breeding and moult (Williams and Croxall 1991). These
conditions likely selected for their relatively short pre-laying interval ashore, and allow for
shorter incubation foraging trips to regain mass and rapid chick growth so that chicks crèche at
a younger age than elsewhere, shortening the duration of the second male fast. Intra-clutch
egg-size dimorphism ranges from A-eggs being 54% the mass of B-eggs, on average, in Erect-
crested penguins, to A-eggs being 85% the mass of B-eggs in Fiordland Penguins (St. Clair 1992;
Davis 2013). The more similar-sized eggs of Fiordland Penguins likely reflect a foraging
environment that increases their propensity to fledge two chicks (McLean 2000; Mattern
2013). Alternatively, the migration carry-over effect hypothesis of egg-size dimorphism
(Chapter 6) argues that the relatively less dimorphic eggs of Fiordland Penguins occur because
they have little or no migration/egg-formation overlap, so that the growth of their A-egg yolk is
not constrained by a physiological conflict between migration and egg-formation (Crossin et al.
2010). This reasoning suggests that Erect-crested Penguins, which lay the most dimorphic eggs,
should have the greatest degree of overlap and shortest pre-laying interval ashore between
arrival and laying. However, the limited available information suggests that the pre-laying
interval of Erect-crested Penguins is c. 2 weeks in duration (Davis 2001), similar to the 15-16
days of Eastern Rockhopper Penguins reported in Chapter 5, and not shorter than the 10 days
of Macaroni Penguins (Crossin et al. 2010).
SHIFTING BASELINES: PERCEPTIONS OF ECOSYSTEM HEALTH AND FUNCTION
John Sorensen was a naturalist and coast-watcher of the 1940s whose photographs and note-
taking provide hard evidence of the huge Eastern Rockhopper Penguin population on Campbell
Island of that time (Bailey and Sorensen 1962; Cunningham and Moors 1994). Without such
historical information, I might have looked down at the Paris Coast in 2012 at some 13,500
pairs of penguins and concluded that was a lot of penguins which must be thriving in a
productive marine ecosystem. Of course, if John Sorensen were standing beside me he would
undoubtedly have been shocked and saddened by his perception that, relative to a 1940’s
baseline of 472,500 pairs, the penguins were nearly gone and their population crash must
mean the marine ecosystem was now ill-suited to their persistence. This is the problem of
shifting baselines in ecology; our perception of what is ‘normal’ and ‘healthy’ is limited by our
range of experience (Pinnegar and Engelhard 2008; Papworth et al. 2009). Of course,
Sorensen’s baseline may also be a misperception of the longer-term average population size,
as the 1940’s population may have been exceptionally large following the previous 30 years of
favourable, cool SST conditions outlined in Chapter 2, and because humans had removed most
176
of the region’s pinnipeds and whales in the 19th century, potentially reducing competition for
prey, and predation with respect to pinnipeds.
New Zealand’s Department of Conservation (DOC) defines its outcome as having,
“New Zealanders gain environmental, social and economic benefits from healthy functioning
ecosystems, recreation opportunities and living our history,” (www.doc.govt.nz). The problem
of shifting baselines means that it is hard to know whether the current penguin population size
is one of a ‘healthy functioning ecosystem’. If it is not, or we are concerned about its future
under threats such as climate change, then what can be done to maintain and restore the
population?
IMPLICATIONS FOR CONSERVATION MANAGEMENT
One potential conclusion from Chapter 5 would be that the sea lions responsible for killing
penguins could be removed to captivity or culled to preserve the penguin population. There is
a precedent for such action on Campbell Island, where a single sub-adult male New Zealand
sea lion was killed to stop its aberrant behaviour of killing nesting Southern Royal Albatrosses
(Diomedea epomophora; Moore et al. 2008). Similarly, it was suggested that a particular
female sea lion responsible for causing the decline of a localized population of Yellow-eyed
Penguins on the Otago Coast of the South Island, New Zealand, be removed to captivity (Lalas
et al. 2007). Such action in the case of Penguin Bay would be ill-advised and unlikely to be
effective, given the critically endangered status of sea lions, and my observation that
depredating penguins was not a behaviour restricted to one or two sea lions. Furthermore, the
Penguin Bay population is relatively small and insignificant to the island’s total population, the
dynamics of which over the past 70 years appear to have been under bottom-up control
through food availability, rather than the top-down control of predation (Chapter 2).
Action to control the rate and degree of climate change would be the most effective
means of ensuring the persistence of the Rockhopper Penguin population on Campbell Island.
Although I have provided evidence of the importance of SST, food availability, and nutritional
stress to penguin demographic rates and population dynamics in Chapters 2–5, a single
penguin population’s plight will obviously do very little to alter humanity’s use of fossil fuels.
However, penguins are charismatic creatures that do grab the public’s attention, so that
concern for Campbell Island’s Rockhopper Penguins may make a small contribution to the
growing public sentiment that serious action on climate change is necessary.
177
More realistic conservation management options for DOC to consider surround the
idea of maintaining the penguin population’s adaptive capacity to environmental change
(Canale and Henry 2010; Towns et al. 2012). In simple terms, we need to ensure that we don’t
make things any worse for them than they are already. For example, precautions on shipping
and oil drilling near penguin breeding locations, foraging areas, migration routes, and over-
wintering areas, would reduce the risk of mass mortality through large oil spills or chronic
pollution through small spills (Pütz et al. 2006). Such a reduction in population size may reduce
genetic diversity important to adapting to climate change (Urban et al. 2014), and a smaller
population would be more vulnerable to predation effects (Chapter 5). Marine Protected Areas
in important foraging and over-wintering areas could be created to restrict additional activities
such as commercial fishing and sea bed mining, which may further reduce the carrying capacity
of the marine environment for penguins. A fundamental obstacle in employing such
conservation management action is our poor understanding of Eudyptes penguin foraging
areas, diet, and over-winter distribution in the New Zealand region.
FUTURE DIRECTIONS
Tracking studies to establish penguin foraging areas in relation to diet, and shifts in areas and
diet between years, stages of breeding, and sex and age classes are among the highest
research priorities for Eudyptes penguins (Taylor 2000). Such information is a critical
prerequisite for the realistic conservation management actions suggested above. Studies that
will begin to provide such information are already underway for Eastern Rockhopper Penguins
on Campbell Island, Snares Penguins, and Fiordland Penguins, but not yet for the declining
Erect-crested Penguin, the world’s least-studied penguin species. Global positioning system
and geo-location sensor tracking technologies have led to an explosion in our knowledge of
seabird marine ecology. Likewise, diet analysis through next-generation sequencing of faecal
DNA may develop into an affordable, informative, low-disturbance technique to identify
seabird prey to the species level and to infer their relative proportions in the diet (Deagle et al.
2010; Jarman et al. 2013). Seabird diet and demography have the potential to provide
information to fisheries management. The relevance of such metrics from Eastern Rockhopper
Penguins, Grey-headed and Campbell Albatrosses at Campbell Island to assessing the year-
class strength in the commercially important fishery for southern blue whiting of the Campbell
Plateau warrants investigation (Cherel et al. 1999b).
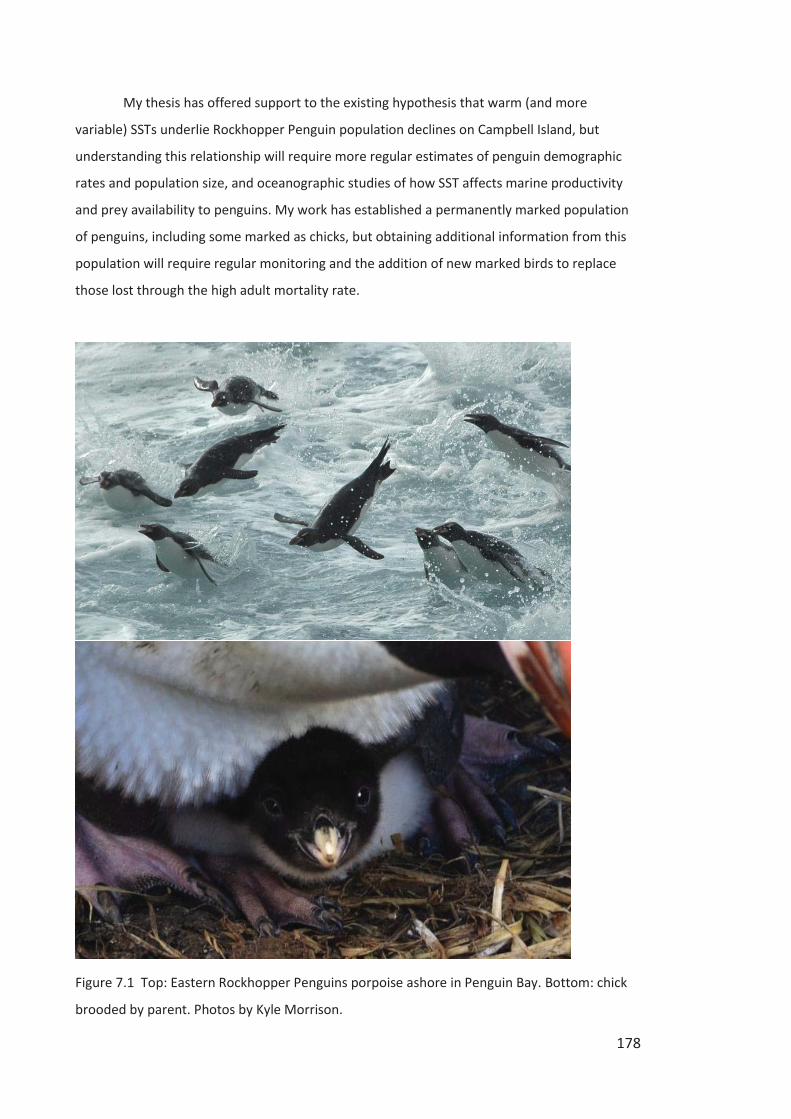
178
My thesis has offered support to the existing hypothesis that warm (and more
variable) SSTs underlie Rockhopper Penguin population declines on Campbell Island, but
understanding this relationship will require more regular estimates of penguin demographic
rates and population size, and oceanographic studies of how SST affects marine productivity
and prey availability to penguins. My work has established a permanently marked population
of penguins, including some marked as chicks, but obtaining additional information from this
population will require regular monitoring and the addition of new marked birds to replace
those lost through the high adult mortality rate.
Figure 7.1 Top: Eastern Rockhopper Penguins porpoise ashore in Penguin Bay. Bottom: chick
brooded by parent. Photos by Kyle Morrison.
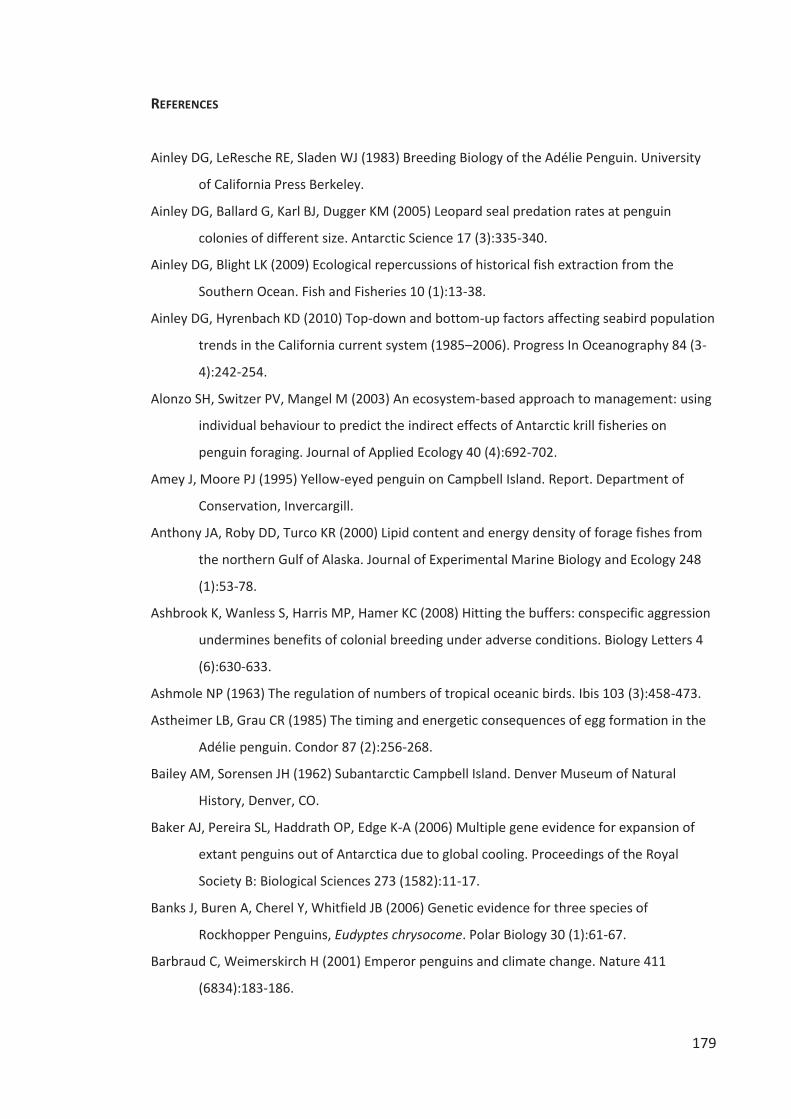
179
REFERENCES
Ainley DG, LeResche RE, Sladen WJ (1983) Breeding Biology of the Adélie Penguin. University
of California Press Berkeley.
Ainley DG, Ballard G, Karl BJ, Dugger KM (2005) Leopard seal predation rates at penguin
colonies of different size. Antarctic Science 17 (3):335-340.
Ainley DG, Blight LK (2009) Ecological repercussions of historical fish extraction from the
Southern Ocean. Fish and Fisheries 10 (1):13-38.
Ainley DG, Hyrenbach KD (2010) Top-down and bottom-up factors affecting seabird population
trends in the California current system (1985–2006). Progress In Oceanography 84 (3-
4):242-254.
Alonzo SH, Switzer PV, Mangel M (2003) An ecosystem-based approach to management: using
individual behaviour to predict the indirect effects of Antarctic krill fisheries on
penguin foraging. Journal of Applied Ecology 40 (4):692-702.
Amey J, Moore PJ (1995) Yellow-eyed penguin on Campbell Island. Report. Department of
Conservation, Invercargill.
Anthony JA, Roby DD, Turco KR (2000) Lipid content and energy density of forage fishes from
the northern Gulf of Alaska. Journal of Experimental Marine Biology and Ecology 248
(1):53-78.
Ashbrook K, Wanless S, Harris MP, Hamer KC (2008) Hitting the buffers: conspecific aggression
undermines benefits of colonial breeding under adverse conditions. Biology Letters 4
(6):630-633.
Ashmole NP (1963) The regulation of numbers of tropical oceanic birds. Ibis 103 (3):458-473.
Astheimer LB, Grau CR (1985) The timing and energetic consequences of egg formation in the
Adélie penguin. Condor 87 (2):256-268.
Bailey AM, Sorensen JH (1962) Subantarctic Campbell Island. Denver Museum of Natural
History, Denver, CO.
Baker AJ, Pereira SL, Haddrath OP, Edge K-A (2006) Multiple gene evidence for expansion of
extant penguins out of Antarctica due to global cooling. Proceedings of the Royal
Society B: Biological Sciences 273 (1582):11-17.
Banks J, Buren A, Cherel Y, Whitfield JB (2006) Genetic evidence for three species of
Rockhopper Penguins, Eudyptes chrysocome. Polar Biology 30 (1):61-67.
Barbraud C, Weimerskirch H (2001) Emperor penguins and climate change. Nature 411
(6834):183-186.
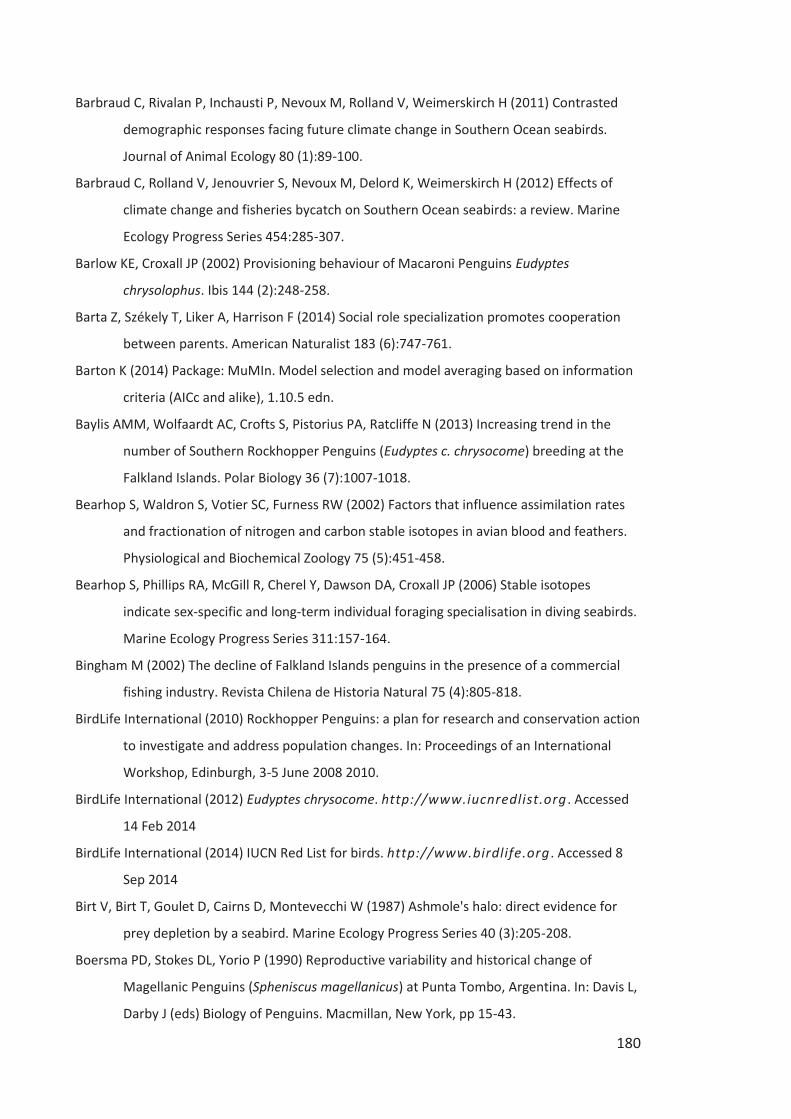
180
Barbraud C, Rivalan P, Inchausti P, Nevoux M, Rolland V, Weimerskirch H (2011) Contrasted
demographic responses facing future climate change in Southern Ocean seabirds.
Journal of Animal Ecology 80 (1):89-100.
Barbraud C, Rolland V, Jenouvrier S, Nevoux M, Delord K, Weimerskirch H (2012) Effects of
climate change and fisheries bycatch on Southern Ocean seabirds: a review. Marine
Ecology Progress Series 454:285-307.
Barlow KE, Croxall JP (2002) Provisioning behaviour of Macaroni Penguins Eudyptes
chrysolophus. Ibis 144 (2):248-258.
Barta Z, Székely T, Liker A, Harrison F (2014) Social role specialization promotes cooperation
between parents. American Naturalist 183 (6):747-761.
Barton K (2014) Package: MuMIn. Model selection and model averaging based on information
criteria (AICc and alike), 1.10.5 edn.
Baylis AMM, Wolfaardt AC, Crofts S, Pistorius PA, Ratcliffe N (2013) Increasing trend in the
number of Southern Rockhopper Penguins (Eudyptes c. chrysocome) breeding at the
Falkland Islands. Polar Biology 36 (7):1007-1018.
Bearhop S, Waldron S, Votier SC, Furness RW (2002) Factors that influence assimilation rates
and fractionation of nitrogen and carbon stable isotopes in avian blood and feathers.
Physiological and Biochemical Zoology 75 (5):451-458.
Bearhop S, Phillips RA, McGill R, Cherel Y, Dawson DA, Croxall JP (2006) Stable isotopes
indicate sex-specific and long-term individual foraging specialisation in diving seabirds.
Marine Ecology Progress Series 311:157-164.
Bingham M (2002) The decline of Falkland Islands penguins in the presence of a commercial
fishing industry. Revista Chilena de Historia Natural 75 (4):805-818.
BirdLife International (2010) Rockhopper Penguins: a plan for research and conservation action
to investigate and address population changes. In: Proceedings of an International
Workshop, Edinburgh, 3-5 June 2008 2010.
BirdLife International (2012) Eudyptes chrysocome. http://www.iucnredlist.org . Accessed
14 Feb 2014
BirdLife International (2014) IUCN Red List for birds. http://www.birdlife.org . Accessed 8
Sep 2014
Birt V, Birt T, Goulet D, Cairns D, Montevecchi W (1987) Ashmole's halo: direct evidence for
prey depletion by a seabird. Marine Ecology Progress Series 40 (3):205-208.
Boersma PD, Stokes DL, Yorio P (1990) Reproductive variability and historical change of
Magellanic Penguins (Spheniscus magellanicus) at Punta Tombo, Argentina. In: Davis L,
Darby J (eds) Biology of Penguins. Macmillan, New York, pp 15-43.
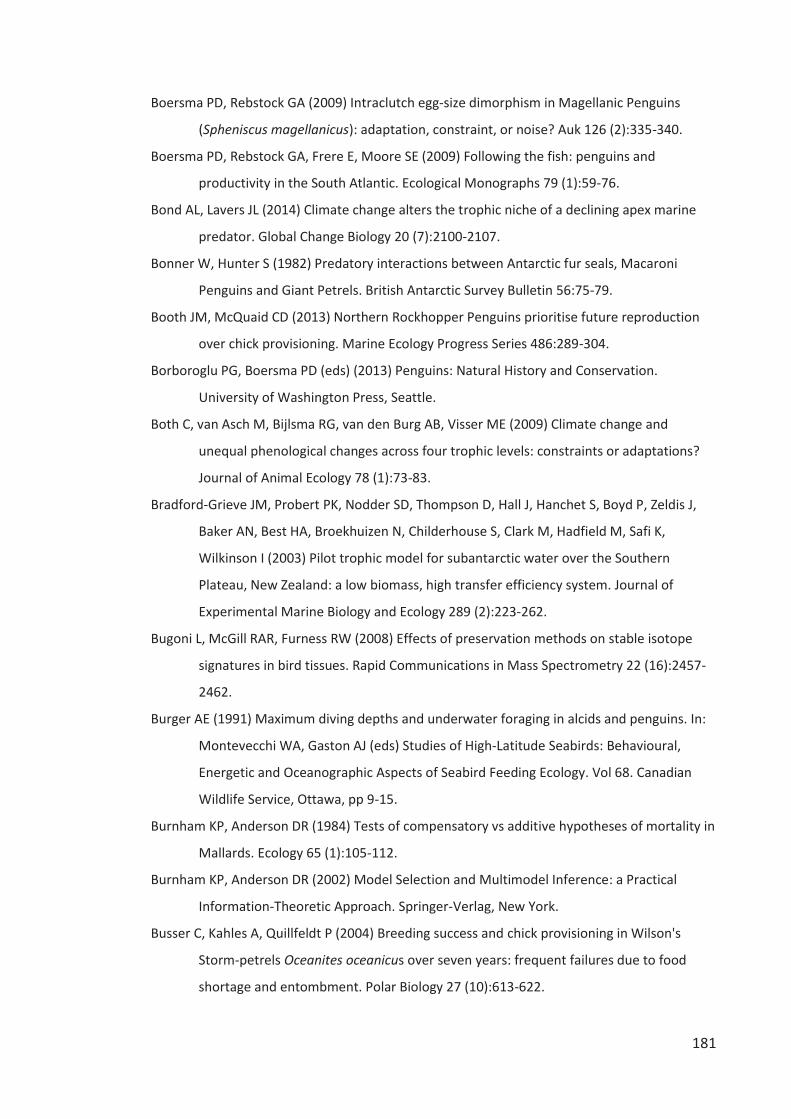
181
Boersma PD, Rebstock GA (2009) Intraclutch egg-size dimorphism in Magellanic Penguins
(Spheniscus magellanicus): adaptation, constraint, or noise? Auk 126 (2):335-340.
Boersma PD, Rebstock GA, Frere E, Moore SE (2009) Following the fish: penguins and
productivity in the South Atlantic. Ecological Monographs 79 (1):59-76.
Bond AL, Lavers JL (2014) Climate change alters the trophic niche of a declining apex marine
predator. Global Change Biology 20 (7):2100-2107.
Bonner W, Hunter S (1982) Predatory interactions between Antarctic fur seals, Macaroni
Penguins and Giant Petrels. British Antarctic Survey Bulletin 56:75-79.
Booth JM, McQuaid CD (2013) Northern Rockhopper Penguins prioritise future reproduction
over chick provisioning. Marine Ecology Progress Series 486:289-304.
Borboroglu PG, Boersma PD (eds) (2013) Penguins: Natural History and Conservation.
University of Washington Press, Seattle.
Both C, van Asch M, Bijlsma RG, van den Burg AB, Visser ME (2009) Climate change and
unequal phenological changes across four trophic levels: constraints or adaptations?
Journal of Animal Ecology 78 (1):73-83.
Bradford-Grieve JM, Probert PK, Nodder SD, Thompson D, Hall J, Hanchet S, Boyd P, Zeldis J,
Baker AN, Best HA, Broekhuizen N, Childerhouse S, Clark M, Hadfield M, Safi K,
Wilkinson I (2003) Pilot trophic model for subantarctic water over the Southern
Plateau, New Zealand: a low biomass, high transfer efficiency system. Journal of
Experimental Marine Biology and Ecology 289 (2):223-262.
Bugoni L, McGill RAR, Furness RW (2008) Effects of preservation methods on stable isotope
signatures in bird tissues. Rapid Communications in Mass Spectrometry 22 (16):2457-
2462.
Burger AE (1991) Maximum diving depths and underwater foraging in alcids and penguins. In:
Montevecchi WA, Gaston AJ (eds) Studies of High-Latitude Seabirds: Behavioural,
Energetic and Oceanographic Aspects of Seabird Feeding Ecology. Vol 68. Canadian
Wildlife Service, Ottawa, pp 9-15.
Burnham KP, Anderson DR (1984) Tests of compensatory vs additive hypotheses of mortality in
Mallards. Ecology 65 (1):105-112.
Burnham KP, Anderson DR (2002) Model Selection and Multimodel Inference: a Practical
Information-Theoretic Approach. Springer-Verlag, New York.
Busser C, Kahles A, Quillfeldt P (2004) Breeding success and chick provisioning in Wilson's
Storm-petrels Oceanites oceanicus over seven years: frequent failures due to food
shortage and entombment. Polar Biology 27 (10):613-622.
182
Butler DW, Fensham RJ, Murphy BP, Haberle SG, Bury SJ, Bowman D (2014) Aborigine-
managed forest, savanna and grassland: biome switching in montane eastern
Australia. Journal of Biogeography 41 (8):1492-1505.
Canale CI, Henry PY (2010) Adaptive phenotypic plasticity and resilience of vertebrates to
increasing climatic unpredictability. Climate Research 43 (1-2):135-147.
Carrick R (1972) Population ecology of the Australian Black-backed Magpie, Royal Penguin, and
Silver Gull. United States Department of Interior Wildlife Research Report 2:41-99.
Casaux R, Bellizia L, Baroni A (2004) The diet of the Antarctic fur seal Arctocephalus gazella at
Harmony Point, South Shetland Islands: evidence of opportunistic foraging on
penguins? Polar Biology 27 (2):59-65.
Cherel Y, Ridoux V (1992) Prey species and nutritive-value of food fed during summer to King
Penguin Aptenodytes patagonica chicks at Possession Island, Crozet archipelago. Ibis
134 (2):118-127.
Cherel Y, Charrassin JB, Handrich Y (1993) Comparison of body reserve buildup in prefasting
chicks and adults of King Penguins (Aptenodytes patagonicus). Physiological Zoology 66
(5):750-770.
Cherel Y, Tremblay Y, Guinard E, Georges JY (1999a) Diving behaviour of female Northern
Rockhopper Penguins, Eudyptes chrysocome moseleyi, during the brooding period at
Amsterdam Island (Southern Indian Ocean). Marine Biology 134 (2):375-385.
Cherel Y, Waugh S, Hanchet S (1999b) Albatross predation of juvenile southern blue whiting
(Micromesistius australis) on the Campbell Plateau. New Zealand Journal of Marine
and Freshwater Research 33 (3):437-441.
Cherel Y, Hobson KA, Bailleul FR, Groscolas R (2005a) Nutrition, physiology, and stable
isotopes: new information from fasting and molting penguins. Ecology 86 (11):2881-
2888.
Cherel Y, Hobson KA, Hassani S (2005b) Isotopic discrimination between food and blood and
feathers of captive penguins: implications for dietary studies in the wild. Physiological
and Biochemical Zoology 78 (1):106-115.
Cherel Y, Hobson KA, Guinet C, Vanpe C (2007) Stable isotopes document seasonal changes in
trophic niches and winter foraging individual specialization in diving predators from
the Southern Ocean. Journal of Animal Ecology 76 (4):826-836.
Cherel Y, Fontaine C, Richard P, Labat J-P (2010) Isotopic niches and trophic levels of
myctophid fishes and their predators in the Southern Ocean. Limnology and
Oceanography 55 (1):324-332.
183
Childerhouse S, Dix B, Gales N (2001) Diet of New Zealand sea lions (Phocarctos hookeri) at the
Auckland Islands. Wildlife Research 28 (3):291-298.
Christians JK (2002) Avian egg size: variation within species and inflexibility within individuals.
Biological Reviews 77 (1):1-26.
Clarke A, Prince PA (1980) Chemical composition and calorific value of food fed to mollymauk
chicks Diomedea melanophris and Diomedea chrysostoma at Bird Island, South
Georgia. Ibis 122 (4):488-494.
Cooch E, White G (2014) Program MARK: A Gentle Introduction.
Cooper J, Brown C, Gales R, Hindell M, Klages N, Moors P, Pemberton D, Ridoux V, Thompson
K, Van Heezik Y (1990) Diets and dietary segregation of crested penguins (Eudyptes).
In: Davis LS, Darby JT (eds) Penguin Biology. Academic Press, San Diego, CA, pp 131-
156.
Cooper J (1992) Rockhopper Penguins at the Auckland Islands. Notornis 39:66-67.
Coppack T, Pulido F, Berthold P (2001) Photoperiodic response to early hatching in a migratory
bird species. Oecologia 128 (2):181-186.
Crawford R, Cooper J (1996) Cape fur seal Arctocephalus pusillus catches Cape Gannet Morus
capensis ashore at Malgas Island. Marine Ornithology 24:53-54.
Crawford R, Dyer B, Cooper J, Underhill L, Unit AD (2006) Breeding numbers and success of
Eudyptes penguins at Marion Island, and the influence of mass and time of arrival of
adults. CCAMLR Science 13:175-190.
Crawford RJM (2007) Food, fishing and seabirds in the Benguela upwelling system. Journal of
Ornithology 148:S253-S260.
Crawford RJM, Makhado AB, Upfold L, Dyer BM (2008) Mass on arrival of Rockhopper Penguins
at Marion Island correlated with breeding success. African Journal of Marine Science
30 (1):185-188.
Crawford RJM, Whittington PA, Upfold L, Ryan PG, Petersen SL, Dyer BM, Cooper J (2009)
Recent trends in numbers of four species of penguins at the Prince Edward Islands.
African Journal of Marine Science 31 (3):419-426.
Creelman E, Storey AE (1991) Sex-differences in reproductive behaviour of Atlantic Puffins. The
Condor 93 (2):390-398.
Crofts S, Wolfaardt A, Baylis A (2011) Storm damage to colonial seabirds at BeauchÍne Island
and Steeple Jason Island during 13-14 December 2010. Report. Stanley.
Crossin GT, Trathan PN, Phillips RA, Dawson A, Le Bouard F, Williams TD (2010) A carryover
effect of migration underlies individual variation in reproductive readiness and
184
extreme egg size dimorphism in macaroni penguins. American Naturalist 176 (3):357-
366.
Crossin GT, Poisbleau M, Demongin L, Chastel O, Williams TD, Eens M, Quillfeldt P (2012)
Migratory constraints on yolk precursors limit yolk androgen deposition and underlie a
brood reduction strategy in Rockhopper Penguins. Biology Letters 8 (6): 1055-1058.
Croxall J, Rothery P (1995) Population change in gentoo penguins Pygoscelis papua at Bird
Island, South Georgia: potential roles of adult survival, recruitment and deferred
breeding. In: Dann P, Norman I, Reilly P (eds) The Penguins: Ecology and Management.
Surey Beatty and Sons, Australia, pp 26-38.
Croxall J, Davis L (1999) Penguins: paradoxes and patterns. Marine Ornithology 27 (1): 1-12.
Croxall J, Reid K, Prince P (1999) Diet, provisioning and productivity responses of marine
predators to differences in availability of Antarctic krill. Marine Ecology Progress Series
177:115-131.
Croxall JP, Callaghan T, Cervellati R, Walton DWH (1992) Southern ocean environmental
changes: effects on seabird, seal and whale populations. Philosophical Transactions of
the Royal Society of London Series B: Biological Sciences 338 (1285):319-328.
Croxall JP, Trathan PN, Murphy EJ (2002) Environmental change and Antarctic seabird
populations. Science 297 (5586):1510-1514.
Cruz LL, McGill RAR, Goodman SJ, Hamer KC (2012) Stable isotope ratios of a tropical marine
predator: confounding effects of nutritional status during growth. Marine Biology 159
(4):873-880.
Cunningham DM, Moors PJ (1994) The decline of Rockhopper Penguins Eudyptes chrysocome
at Campbell Island, Southern Ocean and the influence of rising sea temperatures. Emu
94:27-36.
Cursach JA, Suazo CG, Rau JR (2014) Predation of South American sea lion Otaria flavescens on
Southern Rockhopper Penguin Eudyptes c. chrysocome in Gonzalo Island, Diego
Ramirez, southernmost Chile. Revista De Biologia Marina Y Oceanografia 49 (2):373-
377.
Cury PM, Boyd IL, Bonhommeau S, Anker-Nilssen T, Crawford RJ, Furness RW, Mills JA, Murphy
EJ, Österblom H, Paleczny M (2011) Global seabird response to forage fish depletion—
one-third for the birds. Science 334 (6063):1703-1706.
Cuthbert R, Cooper J, Burle M-H, Glass CJ, Glass JP, Glass S, Glass T, Hilton GM, Sommer ES,
Wanless RM, Ryan PG (2009) Population trends and conservation status of the
Northern Rockhopper Penguin Eudyptes moseleyi at Tristan da Cunha and Gough
Island. Bird Conservation International 19 (01):109-120.
185
Dann P, Norman FI, Cullen JM, Neira FJ, Chiaradia A (2000) Mortality and breeding failure of
Little Penguins, Eudyptula minor, in Victoria, 1995-96, following a widespread
mortality of pilchard, Sardinops sagax. Marine and Freshwater Research 51 (4):355-
362.
Davis LS (2001) A superlative penguin. Natural History 110 (9):46-55.
Davis LS, Renner M (2003) Penguins. Yale University Press, London.
Davis LS (2013) Erect-crested Penguin. In: Borboroglu PG, Boersma PD (eds) Penguins: Natural
History and Conservation. University of Washington Press, Seattle, pp 145-151.
Dawson A (2008) Control of the annual cycle in birds: endocrine constraints and plasticity in
response to ecological variability. Philosophical Transactions of the Royal Society B:
Biological Sciences 363 (1497):1621-1633.
de Dinechin M, Ottvall R, Quillfeldt P, Jouventin P (2009) Speciation chronology of Rockhopper
Penguins inferred from molecular, geological and palaeoceanographic data. Journal of
Biogeography 36 (4):693-702.
De Forest LN, Gaston AJ (1996) The effect of age on timing of breeding and reproductive
success in the Thick-billed Murre. Ecology 77 (5):1501-1511.
de León A, Soave G, Ferretti V, Moreno J (2001) Factors that affect hatching asynchrony in the
Chinstrap Penguin (Pygoscelis antarctica). Polar Biology 24 (5):338-342.
Deagle BE, Chiaradia A, McInnes J, Jarman SN (2010) Pyrosequencing faecal DNA to determine
diet of Little Penguins: is what goes in what comes out? Conservation Genetics 11
(5):2039-2048.
Debat V, David P (2001) Mapping phenotypes: canalization, plasticity and developmental
stability. Trends in Ecology & Evolution 16 (10):555-561.
Decima M, Landry MR, Popp BN (2013) Environmental perturbation effects on baseline delta
δ15N values and zooplankton trophic flexibility in the southern California Current
Ecosystem. Limnology and Oceanography 58 (2):624-634.
Deguchi T, Jacobs J, Harada T, Perriman L, Watanabe Y, Sato F, Nakamura N, Ozaki K, Balogh G
(2012) Translocation and hand-rearing techniques for establishing a colony of
threatened albatross. Bird Conservation International 22 (1):66-81.
Dehnhard N, Poisbleau M, Demongin L, Chastel O, Noordwijk HJ, Quillfeldt P (2011a) Leucocyte
profiles and corticosterone in chicks of Southern Rockhopper Penguins. Journal of
Comparative Physiology B 181 (1):83-90.
Dehnhard N, Voigt CC, Poisbleau M, Demongin L, Quillfeldt P (2011b) Stable isotopes in
Southern Rockhopper Penguins: foraging areas and sexual differences in the non-
breeding period. Polar Biology 34 (11):1763-1773.
186
Dehnhard N, Poisbleau M, Demongin L, Ludynia K, Lecoq M, Masello JF, Quillfeldt P (2013)
Survival of Rockhopper Penguins in times of global climate change. Aquatic
Conservation: Marine and Freshwater Ecosystems 23 (5):777-789.
Dehnhard N, Poisbleau M, Demongin L, Ludynia K, Quillfeldt P (2014) High juvenile annual
survival probabilities in Southern Rockhopper Penguins Eudyptes chrysocome are
independent of individual fledging traits. Ibis 156 (3):548-560.
Dehnhard N, Eens M, Demongin L, Quillfeldt P, Suri D, Poisbleau M (2015) Limited individual
phenotypic plasticity in the timing of and investment into egg laying in southern
rockhopper penguins under climate change. Marine Ecology Progress Series 524: 269-
281.
Demongin L, Poisbleau M, Raya Rey A, Schiavini A, Quillfeldt P, Eens M, Strange IJ (2010)
Geographical variation in egg size dimorphism in Rockhopper Penguins. Polar Biology
33 (4):469-476.
Deniro MJ, Epstein S (1978) Influence of diet on distribution of carbon isotopes in animals.
Geochim Cosmochim Acta 42 (5):495-506.
Deniro MJ, Epstein S (1981) Influence of diet on the distribution of nitrogen isotopes in
animals. Geochim Cosmochim Acta 45 (3):341-351.
Department of Lands and Survey (1980) Preliminary reports of the Campbell Island Expedition
1975-76. Report. Department of Lands and Survey, Wellington.
Descamps S, Gauthier-Clerc M, Gendner J-P, Le Maho Y (2002) The annual breeding cycle of
unbanded king penguins Aptenodytes patagonicus on Possession Island (Crozet). Avian
Science 2 (2):87-98.
Descamps S, Gauthier-Clerc M, Le Bohec C, Gendner JP, Le Maho Y (2005) Impact of predation
on King Penguin Aptenodytes patagonicus in Crozet Archipelago. Polar Biology 28
(4):303-310.
Drago M, Cardona L, Aguilar A, Crespo EA, Ameghino S, Garcia N (2010) Diet of lactating South
American sea lions, as inferred from stable isotopes, influences pup growth. Marine
Mammal Science 26 (2):309-323.
Drent RH, Daan S (1980) The prudent parent: energetic adjustments in avian breeding. Ardea
68 (1-4):225-252.
du Toit M, Bartlett PA, Bester MN, Roux JR (2004) Seabird predation by individual seals at
Ichaboe Island, Namibia. South African Journal of Wildlife Research 34 (1):45-54.
Dunn A, Hanchet SM (2014) Southern blue whiting (Micromesistius australis) stock assessment
for the Campbell Island Rise for 2011. New Zealand Fisheries Assessment Report.
Ministry of Fisheries, Wellington.
187
Dunn PO, Moller AP (2014) Changes in breeding phenology and population size of birds.
Journal of Animal Ecology 83 (3):729-739.
Durant JM, Hjermann DO, Ottersen G, Stenseth NC (2007) Climate and the match or mismatch
between predator requirements and resource availability. Climate Research 33
(3):271-283.
Easterling DR (2000) Climate extremes: observations,modeling, and impacts. Science 289
(5487):2068-2074.
Edwards M, Richardson AJ (2004) Impact of climate change on marine pelagic phenology and
trophic mismatch. Nature 430 (7002):881-884.
Elliott KH, Ricklefs RE, Gaston AJ, Hatch SA, Speakman JR, Davoren GK (2013) High flight costs,
but low dive costs, in auks support the biomechanical hypothesis for flightlessness in
penguins. Proceedings of the National Academy of Sciences 110 (23):9380-9384.
Emlen JM (1966) Role of time and energy in food preference. American Naturalist 100
(916):611-617.
Emslie SD, Karnovsky N, Trivelpiece W (1995) Avian predation at penguin colonies on King-
George Island, Antarctica. Wilson Bulletin 107 (2):317-327.
Emslie SD, Patterson WP (2007) Abrupt recent shift in δ13C and δ15N values in Adélie Penguin
eggshell in Antarctica. Proceedings of the National Academy of Sciences 104
(28):11666-11669.
Emslie SD, Polito MJ, Patterson WP (2013) Stable isotope analysis of ancient and modern
gentoo penguin egg membrane and the krill surplus hypothesis in Antarctica. Antarctic
Science 25 (2):213-218.
Engelhard GH, Peck MA, Rindorf A, Smout S, van Deurs M, Raab K, Andersen KH, Garthe S,
Lauerburg RAM, Scott F, Brunel T, Aarts G, van Kooten T, Dickey-Collas M (2014)
Forage fish, their fisheries, and their predators: who drives whom? Ices Journal of
Marine Science 71 (1):90-104.
England MH, McGregor S, Spence P, Meehl GA, Timmermann A, Cai W, Gupta AS, McPhaden
MJ, Purich A, Santoso A (2014) Recent intensification of wind-driven circulation in the
Pacific and the ongoing warming hiatus. Nature Climate Change 4 (3):222-227.
Forcada J, Trathan PN, Murphy EJ (2008) Life history buffering in Antarctic mammals and birds
against changing patterns of climate and environmental variation. Global Change
Biology.
Forcada J, Trathan PN (2009) Penguin responses to climate change in the Southern Ocean.
Global Change Biology 15 (7):1618-1630.
188
Forero MG, Tella JL, Donázar JA, Blanco G, Bertellotti M, Ceballos O (2001) Phenotypic
assortative mating and within-pair sexual dimorphism and its influence on breeding
success and offspring quality in Magellanic Penguins. Canadian Journal of Zoology 79
(8):1414-1422.
Forero MG, Hobson KA, Bortolotti GR, Donázar JA, Bertellotti M, Blanco G (2002) Food
resource utilisation by Magellanic Penguin evaluated through stable isotope analysis:
segregation by sex and age and influence of offspring quality. Marine Ecology Progress
Series 234:289-299.
Franci CD, Vezina F, Gregoire F, Rail JF, Verreault J (2015) Nutritional stress in Northern
gannets during an unprecedented low reproductive success year: can extreme sea
surface temperature event and dietary change be the cause? Comparative
Biochemistry and Physiology Part A: Molecular & Integrative Physiology 181:1-8.
Fraser GS, Jones IL, Hunter FM (2002) Male-female differences in parental care in
monogamous Crested Auklets. Condor 104 (2):413-423.
Fraser WR, Carlson JC, Duley PA, Holm EJ, Patterson DL (1999) Using kite-based aerial
photography for conducting Adélie Penguin censuses in Antarctica. Waterbirds 22
(3):435-440.
Frederiksen M, Edwards M, Richardson AJ, Halliday NC, Wanless S (2006) From plankton to top
predators: bottom-up control of a marine food web across four trophic levels. Journal
of Animal Ecology 75 (6):1259-1268.
Gaston AJ (2004) Seabirds: A Natural History. T & A D Poyser Ltd, London.
Gaston AJ, Gilchrist HG, Mallory ML, Smith PA (2009) Changes in seasonal events, peak food
availability, and consequent breeding adjustment in a marine bird: a case of
progressive mismatching. The Condor 111 (1):111-119.
Gelman A, Su Y-S, Yajima M, Hill J, Pittau MG, Kerman J (2012) Package: arm. Data Analysis
Using Regression and Multilevel/Hierarchical Models, 1.5-08 edn.
Gilchrist HG (1999) Declining Thick-billed Murre Uria lomvia colonies experience higher gull
predation rates: an inter-colony comparison. Biological Conservation 87 (1):21-29.
Gjerdrum C (2003) Tufted Puffin reproduction reveals ocean climate variability. Proceedings of
the National Academy of Sciences 100 (16):9377-9382.
Gomez-Campos E, Borrell A, Aguilar A (2011) Nitrogen and carbon stable isotopes do not
reflect nutritional condition in the striped dolphin. Rapid Communications in Mass
Spectrometry 25 (9):1343-1347.
189
Gorman KB, Williams TD, Fraser WR (2014) Ecological sexual dimorphism and environmental
variability within a community of Antarctic penguins (Genus Pygoscelis). PLoS ONE 9
(3):e90081.
Grau CR (1982) Egg formation in Fiordland Crested Penguins (Eudyptes pachyrhynchus).
Condor 84 (2):172-177.
Grau CR (1984) Egg formation. In: Whittow GC, Rahn H (eds) Seabird Energetics. Plenum Press,
New York, pp 33-57.
Green JA, Butler PJ, Woakes AJ, Boyd I (2002) Energy requirements of female Macaroni
Penguins breeding at South Georgia. Functional Ecology 16 (5):671-681.
Green JA, Boyd IL, Woakes AJ, Warren NL, Butler PJ (2005) Behavioural flexibility during year-
round foraging in Macaroni Penguins. Marine Ecology Progress Series 296:183-196.
Green JA, Boyd IL, Woakes AJ, Green CJ, Butler PJ (2007) Feeding, fasting and foraging success
during chick rearing in Macaroni Penguins. Marine Ecology Progress Series 346:299-
312.
Gremillet D, Charmantier A (2010) Shifts in phenotypic plasticity constrain the value of
seabirds as ecological indicators of marine ecosystems. Ecological Applications 20
(6):1498-1503.
Guinard E, Weimerskirch H, Jouventin P (1998) Population changes and demography of the
Northern Rockhopper Penguin on Amsterdam and Saint Paul islands. Colonial
Waterbirds 21 (2):222-228.
Gwynn AM (1953) The egg-laying and incubation periods of Rockhopper, Macaroni and Gentoo
Penguins. ANARE reports. Series B, volume I, Zoology., vol no 16. Antarctic Division,
Department of External Affairs, Melbourne.
Hazen EL, Jorgensen S, Rykaczewski RR, Bograd SJ, Foley DG, Jonsen ID, Shaffer SA, Dunne JP,
Costa DP, Crowder LB (2012) Predicted habitat shifts of Pacific top predators in a
changing climate. Nature Climate Change 3 (3):234-238.
Heath RGM, Randall RM (1985) Growth of Jackass Penguin chicks (Spheniscus demersus) hand
reared on different diets. Journal of Zoology 205 (1):91-105.
Hedd A, F. BD, Ryder JL, Jones IL (2006) Effects of interdecadal climate variability on marine
trophic interactions: Rhinoceros Auklets and their fish prey. Marine Ecology Progress
Series 309:263-278.
Hemmings AD (2013) Subantarctic skua. In Miskelly, CM (ed.) New Zealand Birds Online.
http://www.nzbirdsonline.org.nz . Accessed 20 November 2014.
190
Higgins PJ, Davies SJJF (eds) (1996) Catharacta skua Great Skua (Subantarctic Skua), vol 3,
Snipe to Pigeons. Handbook of Australian, New Zealand and Antarctic Birds. Oxford
University Press, Melbourne.
Hilton GM, Thompson DR, Sagar PM, Cuthbert RJ, Cherel Y, Bury SJ (2006) A stable isotopic
investigation into the causes of decline in a sub-Antarctic predator, the Rockhopper
Penguin Eudyptes chrysocome. Global Change Biology 12 (4):611-625.
Hilton GM, Cuthbert RJ (2010) The catastrophic impact of invasive mammalian predators on
birds of the UK Overseas Territories: a review and synthesis. Ibis 152 (3):443-458.
Hinke JT, Polito MJ, Reiss CS, Trivelpiece SG, Trivelpiece WZ (2012) Flexible reproductive timing
can buffer reproductive success of Pygoscelis spp. penguins in the Antarctic Peninsula
region. Marine Ecology Progress Series 454:91-104.
Hipfner JM, Gaston AJ (1999) The relationship between egg size and posthatching
development in the Thick-billed Murre. Ecology 80 (4):1289-1297.
Hipfner JM (2008) Matches and mismatches: ocean climate, prey phenology and breeding
success in a zooplanktivorous seabird. Marine Ecology Progress Series 368:295-304.
Hipfner JM, McFarlane-Tranquilla LA, Addison B (2010) Experimental evidence that both timing
and parental quality affect breeding success in a zooplanktivorous seabird. Auk 127
(1):195-203.
Hipfner JM, Morrison KW, Darvill R (2011) Peregrine Falcons enable two species of colonial
seabirds to breed successfully by excluding other aerial predators. Waterbirds 34
(1):82-88.
Hipfner MJ, Blight LK, Lowe RW, Wilhelm SI, Robertson GJ, Barrett R, Anker-Nilssen T, Good TP
(2012) Unintended consequences: how the recovery of sea eagle Haliaeetus spp.
populations in the Northern Hemisphere is affecting seabirds. Marine Ornithology
40:39-52.
Hiscock JA, Chilvers BL (2014) Declining Eastern Rockhopper and Erect-crested Penguins on the
Antipodes Islands, New Zealand. New Zealand Journal of Ecology 38 (1):124-131.
Hobson KA, Clark RG (1992) Assessing avian diets using stable isotopes: 1. Turnover of 13C in
tissues. Condor 94 (1):181-188.
Hobson KA, Piatt JF, Pitocchelli J (1994) Using stable isotopes to determine seabird trophic
relationships. Journal of Animal Ecology 63 (4):786-798.
Hobson KA, Sinclair EH, York AE, Thomason JR, Merrick RE (2004) Retrospective isotopic
analyses of Steller sea lion tooth annuli and seabird feathers: A cross-taxa approach to
investigating regime and dietary shifts in the Gulf of Alaska. Marine Mammal Science
20 (3):621-638.
191
Hobson KA (2011) Isotopic ornithology: a perspective. Journal of Ornithology 152:49-66.
Hood GM (2010) PopTools version 3.2.5.
Horswill C, Matthiopoulos J, Green JA, Meredith MP, Forcada J, Peat H, Preston M, Trathan PN,
Ratcliffe N (2014) Survival in Macaroni Penguins and the relative importance of
different drivers: individual traits, predation pressure and environmental variability.
Journal of Animal Ecology 83 (5): 1057-1067.
Howald G, Donlan CJ, Galvan JP, Russell JC, Parkes J, Samaniego A, Wang YW, Veitch D,
Genovesi P, Pascal M, Saunders A, Tershy B (2007) Invasive rodent eradication on
islands. Conservation Biology 21 (5):1258-1268.
Hucke-Gaete R, Osman LP, Moreno CA, Torres D (2004) Examining natural population growth
from near extinction: the case of the Antarctic fur seal at the South Shetlands,
Antarctica. Polar Biology 27 (5):304-311.
Hull CL (1996) Morphometric indices for sexing adult Royal Eudyptes schlegeli and Rockhopper
E. chrysocome penguins at Macquarie Island. Marine Ornithology 24:23-27.
Hull CL, Hindell M, Mar K, Scofield P, Wilson J, Lea M-A (2004) The breeding biology and factors
affecting reproductive success in Rockhopper Penguins Eudyptes chrysocome at
Macquarie Island. Polar Biology 27 (11):711-720.
Hunt BPV, Pakhomov EA, McQuaid CD (2001) Short-term variation and long-term changes in
the oceanographic environment and zooplankton community in the vicinity of a sub-
Antarctic archipelago. Marine Biology 138 (2):369-381.
Hunter S (1984) Breeding biology and population dynamics of Giant Petrels Macronectes at
South Georgia (Aves, Procellariiformes). Journal of Zoology 203:441-460.
Huyser O (2001) Bouvetøya (Bouvet Island). In: Evans MI, Fishpool LDC (eds) Important Bird
Areas in Africa and associated islands: priority sites for conservation. vol BirdLife
Conservation Series 11. Pisces Publications and BirdLife International, Newbury and
Cambridge, pp 113-115.
IUCN (2014) IUCN Red List of Threatened Species. http://www.iucnredlist.org . Accessed 8-
Sep 2014
Jackson AL, Bearhop S, Thompson DR (2005) Shape can influence the rate of colony
fragmentation in ground nesting seabirds. Oikos 111 (3):473-478.
Jackson S, Duffy DC, Jenkins JFG (1987) Gastric digestion in marine vertebrate predators: in
vitro standards. Functional Ecology 1 (3):287-291.
Jackson S (1992) Do seabird gut sizes and mean retention times reflect adaptation to diet and
foraging method. Physiological Zoology 65 (3):674-697.
192
Jaeger A, Lecomte VJ, Weimerskirch H, Richard P, Cherel Y (2010) Seabird satellite tracking
validates the use of latitudinal isoscapes to depict predators' foraging areas in the
Southern Ocean. Rapid Communications in Mass Spectrometry 24 (23):3456-3460.
Jaeger A, Cherel Y (2011) Isotopic investigation of contemporary and historic changes in
penguin trophic niches and carrying capacity of the southern Indian Ocean. PloS ONE 6
(2):e16484.
James GD, Stahl JC (2000) Diet of southern Buller's Albatross (Diomedea bulleri bulleri) and the
importance of fishery discards during chick rearing. New Zealand Journal of Marine
and Freshwater Research 34 (3):435-454.
Jamieson SE (2012) Body mass dynamics during incubation and duration of parental care in
Pacific Dunlins Calidris alpina pacifica: a test of the differential parental capacity
hypothesis. Ibis 154 (4):838-845.
Janssen MH, Arcese P, Kyser TK, Bertram DF, McFarlane-Tranquilla L, Williams T, Norris D
(2009) Pre-breeding diet, condition, and timing of breeding in a threatened seabird,
the Marbled Murrelet Brachyramphus marmoratus. Marine Ornithology 37:33-40.
Jarman SN, McInnes JC, Faux C, Polanowski AM, Marthick J, Deagle BE, Southwell C, Emmerson
L (2013) Adélie Penguin population diet monitoring by analysis of food DNA in scats.
Plos One 8 (12).
Jenouvrier S, Barbraud C, Weimerskirch H, Caswell H (2009a) Limitation of population
recovery: a stochastic approach to the case of the Emperor Penguin. Oikos 118
(9):1292-1298.
Jenouvrier S, Caswell H, Barbraud C, Holland M, Str ve J, Weimerskirch H (2009b) Demographic
models and IPCC climate projections predict the decline of an Emperor Penguin
population. Proceedings of the National Academy of Sciences 106 (6):1844-1847.
Jodice PGR, Roby DD, Turco KR, Suryan RM, Irons DB, Piatt JF, Shultz MT, Roseneau DG, Kettle
AB, Anthony JA (2006) Assessing the nutritional stress hypothesis: relative influence of
diet quantity and quality on seabird productivity. Marine Ecology Progress Series
325:267-279.
Johnson K, Bednarz JC, Zack S (1987) Crested penguins: why are first eggs smaller? Oikos 49
(3):347-349.
Jonsson PE, Alerstam T (1990) The adaptive significance of parental role division and sexual
size dimorphism in breeding shorebirds. Biological Journal of the Linnean Society 41
(4):301-314.
193
Jouventin P, Cuthbert RJ, Ottvall R (2006) Genetic isolation and divergence in sexual traits:
evidence for the Northern Rockhopper Penguin Eudyptes moseleyi being a sibling
species. Molecular Ecology 15 (11):3413-3423.
Kaehler S, Pakhomov EA (2001) Effects of storage and preservation on the δ13C and δ15N
signatures of selected marine organisms. Marine Ecology Progress Series 219:299-304.
Katsanevakis S, Stelzenmüller V, South A, Sørensen TK, Jones PJ, Kerr S, Badalamenti F,
Anagnostou C, Breen P, Chust G (2011) Ecosystem-based marine spatial management:
review of concepts, policies, tools, and critical issues. Ocean and Coastal Management
54 (11):807-820.
Keymer I, Malcolm H, Hunt A, Horsley D (2001) Health evaluation of penguins
(Sphenisciformes) following mortality in the Falklands (South Atlantic). Diseases of
Aquatic Organisms 45 (3):159-169.
Kirkwood R, Lawton K, Moreno C, Valencia J, Schlatter R, Robertson G (2007) Estimates of
Southern Rockhopper and Macaroni Penguin numbers at the Ildefonso and Diego
Ramirez archipelagos, chile, using quadrat and distance-sampling techniques.
Waterbirds 30 (2):259-267.
Kitaysky AS, Piatt JF, Wingfield JC (2007) Stress hormones link food availability and population
processes in seabirds. Marine Ecology Progress Series 352:245-258.
Kitaysky AS, Piatt JF, Hatch SA, Kitaiskaia EV, Benowitz-Fredericks ZM, Shultz MT, Wingfield JC
(2010) Food availability and population processes: severity of nutritional stress during
reproduction predicts survival of long-lived seabirds. Functional Ecology 24 (3):625-
637.
Lack DL (1968) Ecological Adaptations for Breeding in Birds. Methuen, London.
Lalas C, Ratz H, McEwan K, McConkey SD (2007) Predation by New Zealand sea lions
(Phocarctos hookeri) as a threat to the viability of Yellow-eyed Penguins (Megadyptes
antipodes) at Otago Peninsula, New Zealand. Biological Conservation 135 (2):235-246.
Lamey TC (1990) Hatch asynchrony and brood reduction in penguins. In: Davis L, Darby J (eds)
Biology of Penguins. Macmillan, New York pp 399-416.
Laws RM (1985) The ecology of the Southern Ocean. American Scientist 73 (1):26-40.
Lebreton JD, Burnham KP, Clobert J, Anderson DR (1992) Modeling survival and testing
biological hypotheses using marked animals: a unified approach with case studies.
Ecological Monographs 62:67-118.
Liljesthrom M, Emslie SD, Frierson D, Schiavini A (2008) Avian predation at a Southern
Rockhopper Penguin colony on Staten Island, Argentina. Polar Biology 31 (4):465-474.
194
Ludynia K, Dehnhard N, Poisbleau M, Demongin L, Masello JF, Quillfeldt P (2012) Evaluating the
impact of handling and logger attachment on foraging parameters and physiology in
Southern Rockhopper Penguins. Plos One 7 (11).
Ludynia K, Dehnhard N, Poisbleau M, Demongin L, Masello JF, Voigt CC, Quillfeldt P (2013)
Sexual segregation in Rockhopper Penguins during incubation. Animal Behaviour 85
(1):255-267.
Lynch HJ, Fagan WF, Naveen R, Trivelpiece SG, Trivelpiece WZ (2012a) Differential
advancement of breeding phenology in response to climate may alter staggered
breeding among sympatric pygoscelid penguins. Marine Ecology-Progress Series 454
(2012):135-145
Lynch HJ, White R, Black AD, Naveen R (2012b) Detection, differentiation, and abundance
estimation of penguin species by high-resolution satellite imagery. Polar Biology 35
(6):963-968.
MacArthur RH, Pianka ER (1966) On optimal use of a patchy environment. American Naturalist
100 (916):603-609.
Mackas DL, Thomson RE, Galbraith M (2001) Changes in the zooplankton community of the
British Columbia continental margin, 1985-1999, and their covariation with
oceanographic conditions. Canadian Journal of Fisheries and Aquatic Sciences 58
(4):685-702.
Maloney A, Chilvers BL, Haley M, Muller CG, Roe W, Debski I (2009) Distribution, pup
production and mortality of New Zealand sea lion (Phocarctos hookeri) on Campbell
Island/Motu Ihupuku, 2008. New Zealand Journal of Ecology 33 (2):97-105.
Maloney A, Chilvers B, Muller C, Haley M (2012) Increasing pup production of New Zealand sea
lions at Campbell Island/Motu Ihupuku: can it continue? New Zealand Journal of
Zoology 39 (1):19-29.
Marchant S, Higgins PJ (1990a) Handbook of Australian, New Zealand and Antarctic Birds, vol
1A Ratites to Ducks. Oxford University Press, Melbourne.
Marchant S, Higgins PJ (eds) (1990b) Eudyptes chrysocome Rockhopper Penguin, vol 1, Ratites
to ducks; Part A, Ratites to petrels. Handbook of Australian, New Zealand and Antarctic
Birds. Oxford University Press, Melbourne.
Masello JF, Mundry R, Poisbleau M, Demongin L, Voigt CC, Wikelski M, Quillfeldt P (2010)
Diving seabirds share foraging space and time within and among species. Ecosphere 1
(6):article 19.
Mattern T (2013a) Fiordland Penguin. In: Borboroglu PG, Boersma PD (eds) Penguins: Natural
History and Conservation. University of Washington Press, Seattle, pp 153-167.
195
Mattern T (2013b) Snares Penguin. In: Borboroglu PG, Boersma PD (eds) Penguins: Natural
History and Conservation. University of Washington Press, Seattle, pp 168-183.
Mayfield H (1961) Nesting success calculated from exposure. The Wilson Bulletin 73 (3):255-
261.
Mayfield HF (1975) Suggestions for calculating nest success. Wilson Bulletin 87 (4):456-466.
McClung MR, Seddon PJ, Massaro M, Setiawan A (2004) Nature-based tourism impacts on
Yellow-eyed Penguins Megadyptes antipodes: does unregulated visitor access affect
fledging weight and juvenile survival? Biological Conservation 119 (2):279-285.
McLean IG (2000) Breeding success, brood reduction and the timing of breeding in the
Fiordland Crested Penguin (Eudyptes pachyrhynchus). Notornis 47 (1):55-58.
Meehl G (2006) Climate change projections for the twenty-first century and climate change
commitment in the CCSM3. Journal of Climate 19 (11):2597-2616.
Meehl GA, Washington WM (1996) El Niño-like climate change in a model with increased
atmospheric CO2 concentrations. Nature 382 (6586):56-60.
Mélice J, Lutjeharms J, Rouault M, Ansorge I (2003) Sea-surface temperatures at the sub-
Antarctic islands Marion and Gough during the past 50 years. South African Journal of
Science 99 (7-8):363-366.
Meynier L, Morel PCH, MacKenzie DDS, MacGibbon A, Chilvers BL, Duignan PJ (2008)
Proximate composition, energy content, and fatty acid composition of marine species
from Campbell Plateau, New Zealand. New Zealand Journal of Marine and Freshwater
Research 42 (4):425-437.
Mínguez E, Belliure J, Ferrer M (2001) Bill size in relation to position in the colony in the
Chinstrap Penguin. Waterbirds 24 (1):34-38.
Moody AT, Hobson KA, Gaston AJ (2012) High-arctic seabird trophic variation revealed through
long-term isotopic monitoring. Journal of Ornithology 153 (4):1067-1078.
Moore P, Moffat R (1992) Predation of Yellow-eyed Penguin by Hooker's sea lion. Notornis
39:68-69.
Moore PJ, Moffat RD (1990) Research and management projects on Campbell Island 1987-88.
Science and Research Internal Report Series 57. Wellington.
Moore PJ, Fletcher D, Amey J (2001) Population estimates of Yellow-eyed Penguins,
Megadyptes antipodes, on Campbell Island, 1987-98. Emu 101 (3):225-236.
Moore PJ (2004) Abundance and trends of mollymawks on Campbell Island. Science for
Conservation 242. Report. Wellington.
196
Moore PJ, Charteris M, Larsen EJ (2008) Notes on New Zealand mammals 8. Predation on
nesting Southern Royal Albatrosses Diomedea epomophora by a New Zealand sea lion
Phocarctos hookeri. New Zealand Journal of Zoology 35 (3):201-204.
Moors P (1986) Decline in numbers of Rockhopper Penguins at Campbell Island. Polar Record
23 (142):69-73.
Moreno J, Barbosa A, De Leon A, Fargallo JA (1999) Phenotypic selection on morphology at
independence in the Chinstrap Penguin Pygoscelis antarctica. Journal of Evolutionary
Biology 12 (3):507-513.
Morrison KW, Hipfner JM, Gjerdrum C, Green DJ (2009) Wing length and mass at fledging
predict juvenile survival and age at first return in Tufted Puffins. Condor 111 (3):433-
440.
Morrison KW, Hipfner JM, Blackburn GS, Green DJ (2011) Effects of extreme climate events on
adult survival of three Pacific auks. Auk 128 (4):707-715.
Morrison KW (2013) Eastern Rockhopper Penguin. In Miskelly, CM (ed.) New Zealand Birds
Online. http://www.nzbirdsonline.org.nz . Accessed 3 October 2013.
Morrison KW, Bury SJ, Thompson DR (2014) Higher trophic level prey does not represent a
higher quality diet in a threatened seabird: implications for relating population
dynamics to diet shifts inferred from stable isotopes. Marine Biology 161 (10):2243-
2255.
Morrison KW, Battley PF, Sagar PM, Thompson DR (2015) Population dynamics of Eastern
Rockhopper Penguins on Campbell Island in relation to sea surface temperature 1942–
2012: current warming hiatus pauses a long-term decline. Polar Biology 38 (2):163-
177.
Murphy RJ, Pinkerton MH, Richardson KM, Bradford-Grieve JM, Boyd PW (2001)
Phytoplankton distributions around New Zealand derived from SeaWiFS remotely-
sensed ocean colour data. New Zealand Journal of Marine and Freshwater Research 35
(2):343-362.
Nakagawa S, Schielzeth H (2010) Repeatability for Gaussian and non-Gaussian data: a practical
guide for biologists. Biological Reviews 85 (4):935-956.
Nakagawa S, Schielzeth H (2013) A general and simple method for obtaining R2 from
generalized linear mixed-effects models. Methods in Ecology and Evolution 4 (2):133-
142.
Norris DR, Arcese P, Preikshot D, Bertram DF, Kyser TK (2007) Diet reconstruction and historic
population dynamics in a threatened seabird. Journal of Applied Ecology 44 (4):875-
884.
197
Nussey DH, Wilson AJ, Brommer JE (2007) The evolutionary ecology of individual phenotypic
plasticity in wild populations. Journal of Evolutionary Biology 20 (3):831-844.
Oehler DA, Pelikan S, Fry WR, Weakley Jr L, Kusch A, Marin M (2008) Status of Crested Penguin
(Eudyptes spp.) populations on three islands in Southern Chile. Wilson Journal of
Ornithology 120 (3):575-581.
Olsson O (1997) Effects of food availability on fledging condition and post-fledging survival in
king penguin chicks. Polar Biology 18 (3):161-165.
Papworth SK, Rist J, Coad L, Milner-Gulland EJ (2009) Evidence for shifting baseline syndrome
in conservation. Conservation Letters 2 (2):93-100.
Paredes R, Insley SJ (2010) Sex-biased aggression and male-only care at sea in Brunnich's
Guillemots Uria lomvia and Razorbills Alca torda. Ibis 152 (1):48-62.
Parmesan C (2006) Ecological and evolutionary responses to recent climate change. In: Annual
Review of Ecology Evolution and Systematics, vol 37. Annual Review of Ecology
Evolution and Systematics. pp 637-669.
Patterson D, Woehler E, Croxall JP, Cooper J, Poncet S, Fraser W, Trathan P (2008) Breeding
distribution and population status of the northern Giant Petrel Macronectes halli and
the Southern Giant Petrel M. giganteus. Marine Ornithology 36 (2):115-124.
Pauly D, Christensen V, Dalsgaard J, Froese R, Torres F (1998) Fishing down marine food webs.
Science 279 (5352):860-863.
Peat N, Apse A, De Roy T, Westerskov K (2006) Subantarctic New Zealand: a rare heritage.
Department of Conservation.
Pichegru L (2013) Increasing breeding success of an endangered penguin: artificial nests or
culling predatory gulls? Bird Conservation International 23 (3):296-308.
Pinnegar JK, Engelhard GH (2008) The 'shifting baseline' phenomenon: a global perspective.
Reviews in Fish Biology and Fisheries 18 (1):1-16.
Poisbleau M, Demongin L, Strange IJ, Otley H, Quillfeldt P (2008) Aspects of the breeding
biology of the Southern Rockhopper Penguin Eudyptes c. chrysocome and new
consideration on the intrinsic capacity of the A-egg. Polar Biology 31 (8):925-932.
Poisbleau M, Demongin L, Trouve C, Quillfeldt P (2009) Maternal deposition of yolk
corticosterone in clutches of Southern Rockhopper Penguins (Eudyptes chrysocome
chrysocome). Hormones and Behavior 55 (4):500-506.
Poisbleau M, Demongin L, Noordwijk HJv, Strange IJ, Quillfeldt P (2010) Sexual dimorphism and
use of morphological measurements to sex adults, immatures and chicks of
Rockhopper Penguins. Ardea 98 (2):217-224.
198
Poisbleau M, Demongin L, Chastel O, Eens M, Quillfeldt P (2011) Yolk androgen deposition in
Rockhopper Penguins, a species with reversed hatching asynchrony. General and
Comparative Endocrinology 170 (3):622-628.
Poisbleau M, Dehnhard N, Demongin L, Parenteau C, Quillfeldt P, Eens M (2013a) Females
paired with new and heavy mates reduce intra-clutch differences in resource
allocation. PLOS ONE 8 (8):e72136.
Poisbleau M, Demongin L, Eens M, Quillfeldt P (2013b) Sex-biased disruptive behaviour in
breeding crested penguins. Polar Biology 36 (2):177-183.
Pütz K, Clausen AP, Huin N, Croxall JP (2003) Re-evaluation of historical Rockhopper Penguin
population data in the Falkland Islands. Waterbirds 26 (2):169-175.
Pütz K, Raya Rey A, Huin N, Schiavini A, Pütz A, Lüthi BH (2006a) Diving characteristics of
Southern Rockhopper Penguins (Eudyptes c. chrysocome) in the southwest Atlantic.
Marine Biology 149 (2):125-137.
Pütz K, Raya Rey A, Schiavini A, Clausen AP, Lüthi BH (2006b) Winter migration of Rockhopper
Penguins (Eudyptes c. chrysocome) breeding in the Southwest Atlantic: is utilisation of
different foraging areas reflected in opposing population trends? Polar Biology 29
(9):735-744.
Pütz K, Raya Rey A, Otley H (2013) Southern Rockhopper Penguin. In: Borboroglu PG, Boersma
PD (eds) Penguins: Natural History and Conservation. University of Washington Press,
Seattle, pp 113-129.
Quillfeldt P, Masello JF (2013) Impacts of climate variation and potential effects of climate
change on South American seabirds - a review. Marine Biology Research 9 (4):337-357.
R Core Team (2012) R: a language and environment for statistical computing. R Foundation for
Statistical Computing, Vienna, Austria.
Ratcliffe N, Crofts S, Brown R, Baylis AMM, Adlard S, Horswill C, Venables H, Taylor P, Trathan
PN, Staniland IJ (2014) Love thy neighbour or opposites attract? Patterns of spatial
segregation and association among crested penguin populations during winter. Journal
of Biogeography 41 (6):1183-1192.
Raya Rey A, Trathan P, Schiavini A (2007) Inter-annual variation in provisioning behaviour of
Southern Rockhopper Penguins Eudyptes chrysocome chrysocome at Staten Island,
Argentina. Ibis 149 (4):826-835.
Raya Rey A, Samaniego RS, Petracci PF (2011) New records of South American sea lion Otaria
flavescens predation on Southern Rockhopper Penguins Eudyptes chrysocome at
Staten Island, Argentina. Polar Biology:1-4.
199
Reed TE, Wanless S, Harris MP, Frederiksen M, Kruuk LEB, Cunningham EJA (2006) Responding
to environmental change: plastic responses vary little in a synchronous breeder.
Proceedings of the Royal Society B: Biological Sciences 273 (1602):2713.
Reed TE, Warzybok P, Wilson AJ, Bradley RW, Wanless S, Sydeman WJ (2009) Timing is
everything: flexible phenology and shifting selection in a colonial seabird. Journal of
Animal Ecology 78 (2):376-387.
Regehr HM, Montevecchi WA (1997) Interactive effects of food shortage and predation on
breeding failure of Black-legged Kittiwakes: indirect effects of fisheries activities and
implications for indicator species. Marine Ecology Progress Series 155:249-260.
Reilly P, Cullen J (1982) The Little Penguin Eudyptula minor in Victoria. III. Dispersal of chicks
and survival after banding. Emu 82 (3):137-142.
Richardson AJ (2008) In hot water: zooplankton and climate change. ICES Journal of Marine
Science 65 (3):279-295.
Robertson HA, Dowding JE, Elliott GP, Hitchmough RA, Miskelly CM, O’Donnell CJ, Powlesland
RG, Sagar PM, Scofield RP, Taylor GA (2013) Conservation status of New Zealand birds,
2012. New Zealand Threat Classification Series 4. Report. Department of Conservation,
Wellington, New Zealand.
Robin JP, Boucontet L, Chillet P, Groscolas R (1998) Behavioral changes in fasting emperor
penguins: evidence for a "refeeding signal" linked to a metabolic shift. American
Journal of Physiology-Regulatory Integrative and Comparative Physiology 274
(3):R746-R753.
Robin JP, Fayolle C, Decrock F, Thil MA, Cote SD, Bernard S, Groscolas R (2001) Restoration of
body mass in King Penguins after egg abandonment at a critical energy depletion
stage: early vs late breeders. Journal of Avian Biology 32 (4):303-310.
Robson B, Glass T, Glass N, Glass J, Green J, Repetto C, Rodgers G, Ronconi RA, Ryan PG, Swain
G (2011) Revised population estimate and trends for the Endangered Northern
Rockhopper Penguin Eudyptes moseleyi at Tristan da Cunha. Bird Conservation
International 21 (04):454-459.
Rolland V, Barbraud C, Weimerskirch H (2008) Combined effects of fisheries and climate on a
migratory long-lived marine predator. Journal of Applied Ecology 45 (1):4-13.
Rubolini D, Saino N, Moller AP (2010) Migratory behaviour constrains the phenological
response of birds to climate change. Climate Research 42 (1):45-55.
Ryan PG, Sommer E, Breytenbach E (2008) Giant petrels Macronectes hunting Northern
Rockhopper Penguins Eudyptes moseleyi at sea. Ardea 96 (1):129-134.
200
Sæther BE, Bakke Ø (2000) Avian life history variation and contribution of demographic traits
to the population growth rate. Ecology 81 (3):642-653.
Sagar P, Murdoch R, Sagar M, Thompson D (2005) Rockhopper Penguin (Eudyptes chrysocome
filholi) foraging at Antipodes Islands. Notornis 52 (2):75-80.
Sagar PM (2014) Population estimates and trends of Campbell and Grey-headed Albatrosses at
Campbell Island. Report. Research NIWA, Christchurch.
Salinger MJ, Renwick JA, Mullan AB (2001) Interdecadal Pacific Oscillation and South Pacific
climate. International Journal of Climatology 21 (14):1705-1721.
Sandvik H, Erikstad KE, Barrett RT, Yoccoz NG (2005) The effect of climate on adult survival in
five species of North Atlantic seabirds. Journal of Animal Ecology 74 (5):817-831.
Sandvik H, Einar Erikstad K (2008) Seabird life histories and climatic fluctuations: a
phylogenetic-comparative time series analysis of North Atlantic seabirds. Ecography 31
(1):73-83.
Santer BD, Bonfils C, Painter JF, Zelinka MD, Mears C, Solomon S, Schmidt GA, Fyfe JC, Cole
JNS, Nazarenko L, Taylor KE, Wentz FJ (2014) Volcanic contribution to decadal changes
in tropospheric temperature. Nature Geoscience 7 (3):185-189.
Saraux C, Robinson-Laverick SM, Le Maho Y, Ropert-Coudert Y, Chiaradia A (2011) Plasticity in
foraging strategies of inshore birds: how Little Penguins maintain body reserves while
feeding offspring. Ecology 92 (10):1909-1916.
Schamber JL, Esler D, Flint PL (2009) Evaluating the validity of using unverified indices of body
condition. Journal of Avian Biology 40 (1):49-56.
Schrimpf MB, Parrish JK, Pearson SF (2012) Trade-offs in prey quality and quantity revealed
through the behavioral compensation of breeding seabirds. Marine Ecology Progress
Series 460:247-259.
Sears J, Hatch SA, O'Brien DM (2009) Disentangling effects of growth and nutritional status on
seabird stable isotope ratios. Oecologia 159 (1):41-48.
Slagsvold T, Sandvik J, Rofstad G, Lorentsen O, Husby M (1984) On the adaptive value of
intraclutch egg-size variation in birds. Auk 101 (4):685-697.
Smith TM, Reynolds RW (2005) A global merged land-air-sea surface temperature
reconstruction based on historical observations (1880-1997). Journal of Climate 18
(12):2021-2036.
Smith TM, Reynolds RW, Peterson TC, Lawrimore J (2008) Improvements to NOAA's historical
merged land-ocean surface temperature analysis (1880-2006). Journal of Climate 21
(10):2283-2296.
201
Sorensen MC, Hipfner JM, Kyser TK, Norris DR (2009) Carry-over effects in a Pacific seabird:
stable isotope evidence that pre-breeding diet quality influences reproductive success.
Journal of Animal Ecology 78:460-467.
Spear LB (1993) Dynamics and effect of Western Gulls feeding in a colony of Guillemots and
Brandt's Cormorants. Journal of Animal Ecology 62 (3):399-414.
St. Clair CC (1992) Incubation behavior, brood patch formation and obligate brood reduction in
Fiordland Crested Penguins. Behavioral Ecology and Sociobiology 31 (6):409-416.
St. Clair CC, Waas JR, St. Clair RC, Boag PT (1995) Unfit mothers? Maternal infanticide in Royal
Penguins. Animal Behaviour 50 (5):1177-1185.
St. Clair CC, St. Clair RC (1996) Causes and consequences of egg loss in Rockhopper Penguins,
Eudyptes chrysocome. Oikos 77 (3):459-466.
St. Clair CC (1998) What is the function of first eggs in crested penguins? Auk 115 (2):478-482.
Stanley TR (2000) Modeling and estimation of stage-specific daily survival probabilities of
nests. Ecology 81 (7):2048-2053.
Stearns SC (1989) The evolutionary significance of phenotypic plasticity: phenotypic sources of
variation among organisms can be described by developmental switches and reaction
norms. Bioscience 39 (7):436-445.
Stein RW, Williams TD (2013) Extreme intraclutch egg-size dimorphism in Eudyptes penguins,
an evolutionary response to clutch-size maladaptation. American Naturalist 182
(2):260-270.
Stonehouse B (1966) Egg volumes from linear dimensions. Emu 65 (3):227-228.
Strange I (1982) Breeding ecology of the Rockhopper Penguin (Eudyptes crestatus) in the
Falkland Islands. Le Gerfaut 72:137-188.
Szabo MJ (2013) Northern giant petrel. In Miskelly, CM (ed.) New Zealand Birds Online.
http://www.nzbirdsonline.org.nz . Accessed 20 November 2014.
Taylor GA (1986) The ecology of Norway rats on Campbell Island. Report. Ecology Division
DSIR, Nelson.
Taylor GA (2000) Action plan for seabird conservation in New Zealand, Part A: threatened
seabirds. Report. Department of Conservation, Wellington.
Tenaza R (1971) Behavior and nesting success relative to nest location in Adélie Penguins
(Pygoscelis adeliae). Condor 73 (1):81-92.
Thiebot J-B, Cherel Y, Crawford RJ, Makhado AB, Trathan PN, Pinaud D, Bost C-A (2013a) A
space oddity: geographic and specific modulation of migration in Eudyptes penguins.
PloS one 8 (8):e71429.
202
Thiebot JB, Cherel Y, Trathan PN, Bost CA (2012) Coexistence of oceanic predators on wintering
areas explained by population-scale foraging segregation in space or time. Ecology 93
(1):122-130.
Thiebot JB, Authier M, Trathan PN, Bost CA (2013b) Gentlemen first? ‘Broken stick’ modelling
reveals sex-related homing decision date in migrating seabirds. Journal of Zoology 292
(1):25-30.
Tierney M, Emmerson L, Hindell M (2009) Temporal variation in Adélie Penguin diet at
Bechervaise Island, east Antarctica and its relationship to reproductive performance.
Marine Biology 156 (8):1633-1645.
Timmermann A, Oberhuber J, Bacher A, Esch M, Latif M, Roeckner E (1999) Increased El Niño
frequency in a climate model forced by future greenhouse warming. Nature 398:694-
697.
Towns DR, Bellingham PJ, Mulder CPH, Lyver PO (2012) A research strategy for biodiversity
conservation on New Zealand's offshore islands. New Zealand Journal of Ecology 36
(1):1-20.
Trathan PN (2004) Image analysis of color aerial photography to estimate penguin population
size. Wildlife Society Bulletin 32 (2):332-343.
Trathan PN, Ratcliffe N, Masden EA (2012) Ecological drivers of change at South Georgia: the
krill surplus, or climate variability. Ecography 35 (11):983-993.
Trathan PN, García Borboroglu P, Boersma D, Bost CA, Crawford RJ, Crossin GT, Cuthbert RJ,
Dann P, Davis LS, De la Puente S (2014) Pollution, habitat loss, fishing, and climate
change as critical threats to penguins. Conservation Biology 29 (1):31-41.
Tremblay Y, Cherel Y (2000) Benthic and pelagic dives: a new foraging behaviour in Rockhopper
Penguins. Marine Ecology Progress Series 204:257-267.
Tremblay Y, Cherel Y (2003) Geographic variation in the foraging behaviour, diet and chick
growth of Rockhopper Penguins. Marine Ecology Progress Series 251:279-297.
Tremblay Y, Cherel Y (2005) Spatial and temporal variation in the provisioning behaviour of
female Rockhopper Penguins Eudyptes chrysocome filholi. Journal of Avian Biology 36
(2):135-145.
Trites AW, Donnelly CP (2003) The decline of Steller sea lions Eumetopias jubatus in Alaska: a
review of the nutritional stress hypothesis. Mammal Review 33 (1):3-28.
Trivelpiece WZ, Trivelpiece SG (1990) Courtship period of Adélie, Gentoo, and Chinstrap
Penguins. In: Davis LS, Darby JT (eds) Penguin Biology. Academic Press, Inc, San Diego,
pp 113-127.
203
Trivelpiece WZ, Hinke JT, Miller AK, Reiss CS, Trivelpiece SG, Watters GM (2011) Variability in
krill biomass links harvesting and climate warming to penguin population changes in
Antarctica. Proceedings of the National Academy of Sciences 108 (18):7625-7628.
Urban MC, Richardson JL, Freidenfelds NA (2014) Plasticity and genetic adaptation mediate
amphibian and reptile responses to climate change. Evolutionary Applications 7 (1):88-
103.
Vargas F, Lacy R, Johnson P, Steinfurth A, Crawford R, Boersma DP, Macdonald D (2007)
Modelling the effect of El Niño on the persistence of small populations: the Galápagos
penguin as a case study. Biological Conservation 137 (1):138-148.
Velasco F, Olaso I (2000) Hake food consumption in the Southern Bay of Biscay estimated from
a gastric evacuation model. ICES CM:2000/Q2011.
Verhulst S, Nilsson JA (2008) The timing of birds' breeding seasons: a review of experiments
that manipulated timing of breeding. Philosophical Transactions of the Royal Society B:
Biological Sciences 363 (1490):399-410.
Visser ME (2008) Keeping up with a warming world; assessing the rate of adaptation to climate
change. Proceedings of the Royal Society B: Biological Sciences 275 (1635):649-659.
Visser ME, Schaper SV, Holleman LJM, Dawson A, Sharp P, Gienapp P, Caro SP (2011) Genetic
variation in cue sensitivity involved in avian timing of reproduction. Functional Ecology
25 (4):868-877.
Vlieg P (1984) Proximate analysis of ten commercial New Zealand fish species. New Zealand
Journal of Science 27 (1):99-104.
Votier S (2008) Recruitment and survival of immature seabirds in relation to oil spills and
climate variability. Journal of Animal Ecology 77 (5):974-983.
Votier SC, Heubeck M, Furness RW (2008) Using inter-colony variation in demographic
parameters to assess the impact of skua predation on seabird populations. Ibis 150:45-
53.
Waddington CH (1942) Canalization of development and the inheritance of acquired
characters. Nature 150:563-565.
Walther GR, Post E, Convey P, Menzel A, Parmesan C, Beebee TJC, Fromentin JM, Hoegh-
Guldberg O, Bairlein F (2002) Ecological responses to recent climate change. Nature
416 (6879):389-395.
Waluda CM, Hill SL, Peat HJ, Trathan PN (2012) Diet variability and reproductive performance
of Macaroni Penguins Eudyptes chrysolophus at Bird Island, South Georgia. Marine
Ecology Progress Series 466:261-274.
204
Warham J (1963) The Rockhopper Penguin Eudyptes chrysocome at Macquarie Island. Auk 80
(3):229-256.
Warham J (1972) Breeding seasons and sexual dimorphism in Rockhopper Penguins. Auk 89
(1):87-105.
Warham J (1974a) The breeding biology and behaviour of the Snares Crested Penguin. Journal
of the Royal Society of New Zealand 4:63-108.
Warham J (1974b) Fiordland Crested Penguin Eudyptes pachyrhynchus. Ibis 116 (1):1-27.
Warham J (1975) The Crested Penguins. In: Stonehouse B (ed) The Biology of Penguins: Biology
and Environment. Macmillan, London, pp 189-269.
Watts AC, Perry JH, Smith SE, Burgess MA, Wilkinson BE, Szantoi Z, Ifju PG, Percival HF (2010)
Small unmanned aircraft systems for low-altitude aerial surveys. Journal of Wildlife
Management 74 (7):1614-1619.
Waugh SM, Weimerskirch H, Cherel Y, Shankar U, Prince PA, Sagar PM (1999a) Exploitation of
the marine environment by two sympatric albatrosses in the Pacific Southern Ocean.
Marine Ecology Progress Series 177:243-254.
Waugh SM, Weimerskirch H, Moore PJ, Sagar PM (1999b) Population dynamics of Black-
browed and Grey-headed Albatrosses Diomedea melanophrys and D. chrysostoma at
Campbell Island, New Zealand, 1942-96. Ibis 141 (2):216-225.
Westerskov K (1960) Birds of Campbell Island. Wlidlife Publication, vol 61. New Zealand
Department of Internal Affairs, Wellington.
White GC, Burnham KP (1999) Program MARK: survival estimation from populations of marked
animals. Bird Study 46:120-139.
Wiley AE, Ostrom PH, Welch AJ, Fleischer RC, Gandhi H, Southon JR, Stafford TW, Penniman JF,
Hu D, Duvall FP, James HF (2013) Millennial-scale isotope records from a wide-ranging
predator show evidence of recent human impact to oceanic food webs. Proceedings of
the National Academy of Sciences 110 (22):8972-8977.
Williams AJ (1980) Offspring reduction in Macaroni and Rockhopper Penguins. Auk 97 (4):754-
759.
Williams AJ (1982) Chick-feeding rates of macaroni and Rockhopper Penguins at Marion Island.
Ostrich 53 (3):129-134.
Williams CT, Buck CL, Sears J, Kitaysky AS (2007) Effects of nutritional restriction on nitrogen
and carbon stable isotopes in growing seabirds. Oecologia 153 (1):11-18.
Williams M, Robertson CJ (1996) The Campbell Island Teal: history and review. Wildfowl 47
(47):134-166.
205
Williams TD (1990) Growth and survival in Macaroni Penguin, Eudyptes chrysolophus, A- and B-
chicks: do females maximise investment in the large B-egg? Oikos 59:349-354.
Williams TD, Croxall JP (1991) Annual variation in breeding biology of Macaroni Penguins,
Eudyptes chrysolophus, at Bird Island, South Georgia. Journal of Zoology (London)
223:189-202.
Williams TD (1994) Intraspecific variation in egg size and egg composition in birds: effects on
offspring fitness. Biological Reviews of the Cambridge Philosophical Society 69 (1):35-
59.
Williams TD (1995) The Penguins: Spheniscidae. Bird Families of the World. Oxford University
Press, Oxford.
Williams TD (2012) Physiological Adaptations forBreeding in Birds. Princeton University Press.
Willis T, Fu D, Hanchet S (2007) Correlates of southern blue whiting year class strength on the
Campbell Island Rise, 1977–2002. New Zealand Fisheries Assessment Report, vol
2007/40. Ministry of Fisheries, Wellington.
Wilmshurst JM, Bestic KL, Meurk CD, McGlone MS (2004) Recent spread of Dracophyllum scrub
on subantarctic Campbell Island, New Zealand: climatic or anthropogenic origins?
Journal of Biogeography 31 (3):401-413.
Wilson R, La Cock G, Wilson M-P, Mollagee F (1985) Differential digestion of fish and squid in
Jackass Penguins Spheniscus demersus. Ornis Scandinavica 16 (1):77-79.
Wiltshire AJ, Scofield RP (2000) Population estimate of breeding Northern Giant Petrels
Macronectes halli on Campbell Island, New Zealand. Emu 100:186-191.
Wojczulanis-Jakubas K, Jakubas D (2012) When and why does my mother leave me? The
question of brood desertion in the Dovekie (Alle alle). Auk 129 (4):632-637.
Wolf SG, Sydeman WJ, Hipfner JM, Abraham CL, Tershy BR, Croll DA (2009) Range-wide
reproductive consequences of ocean climate variability for the seabird Cassin's Auklet.
Ecology 90 (3):742-753.
Worm B, Barbier EB, Beaumont N, Duffy JE, Folke C, Halpern BS, Jackson JBC, Lotze HK, Micheli
F, Palumbi SR, Sala E, Selkoe KA, Stachowicz JJ, Watson R (2006) Impacts of biodiversity
loss on ocean ecosystem services. Science 314 (5800):787-790.
Xavier JC, Trathan PN, Croxall JP, Wood AG, Podesta G, Rodhouse PG (2004) Foraging ecology
and interactions with fisheries of Wandering Albatrosses (Diomedea exulans) breeding
at South Georgia. Fisheries Oceanography 13 (5):324-344.
Yorio P, Borboroglu GP, Potti J, Moreno J (2001) Breeding biology of Magellanic PSenguins
Spheniscus magellanicus at Golfo San Jorge, Patagonia, Argentina. Marine Ornithology
29:75-79.