Embed Size (px)
Citation preview

Copyright John Worthington 2002 www.jweducation.com
Perceptions of Young Children’s Learning and Computer Use
Discussion Seminar Canberra
Tuesday 12 March 2002 Dr John Worthington
Copyright John Worthington 2002 www.jweducation.com
Summary
• Information technology and literacy
• Technology at home and school
• Parent and teacher perceptions of attributes related to children’s interest in computers and television, and skills related to using computers
• Theoretical model of the how the perceptions of parents and teachers change over time.
• Conclusion
Copyright John Worthington 2002 www.jweducation.com
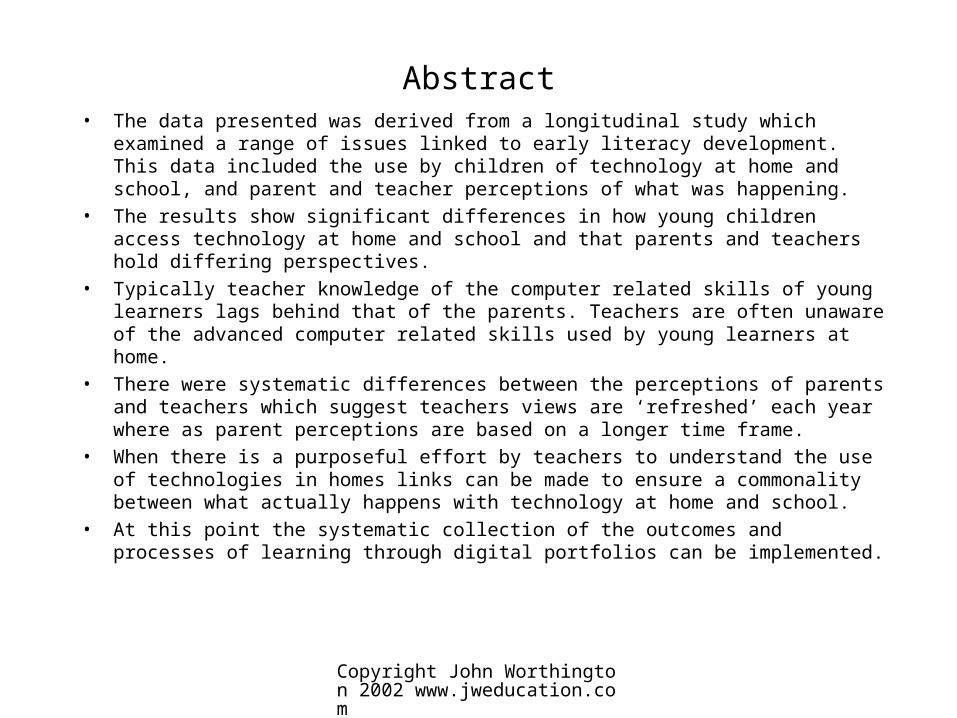
Abstract• The data presented was derived from a longitudinal study which examined a range of
issues linked to early literacy development. This data included the use by children of technology at home and school, and parent and teacher perceptions of what was happening.
• The results show significant differences in how young children access technology at home and school and that parents and teachers hold differing perspectives.
• Typically teacher knowledge of the computer related skills of young learners lags behind that of the parents. Teachers are often unaware of the advanced computer related skills used by young learners at home.
• There were systematic differences between the perceptions of parents and teachers which suggest teachers views are ‘refreshed’ each year where as parent perceptions are based on a longer time frame.
• When there is a purposeful effort by teachers to understand the use of technologies in homes links can be made to ensure a commonality between what actually happens with technology at home and school.
• At this point the systematic collection of the outcomes and processes of learning through digital portfolios can be implemented.
Copyright John Worthington 2002 www.jweducation.com
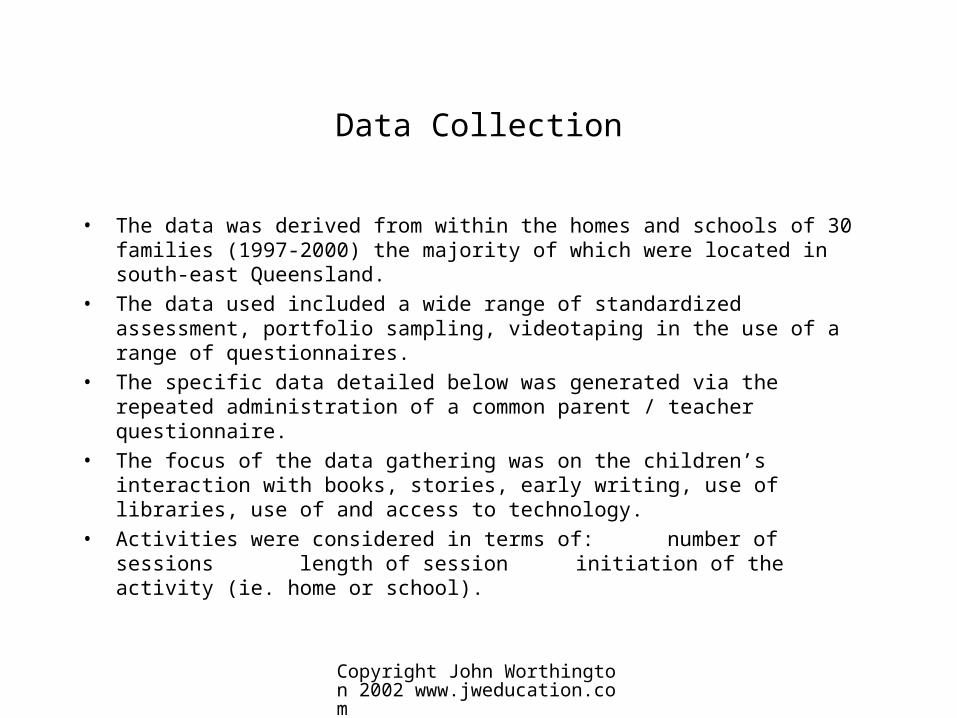
Data Collection
• The data was derived from within the homes and schools of 30 families (1997-2000) the majority of which were located in south-east Queensland.
• The data used included a wide range of standardized assessment, portfolio sampling, videotaping in the use of a range of questionnaires.
• The specific data detailed below was generated via the repeated administration of a common parent / teacher questionnaire.
• The focus of the data gathering was on the children’s interaction with books, stories, early writing, use of libraries, use of and access to technology.
• Activities were considered in terms of: number of sessionslength of session
initiation of the activity (ie. home or school).
Copyright John Worthington 2002 www.jweducation.com
Participant children
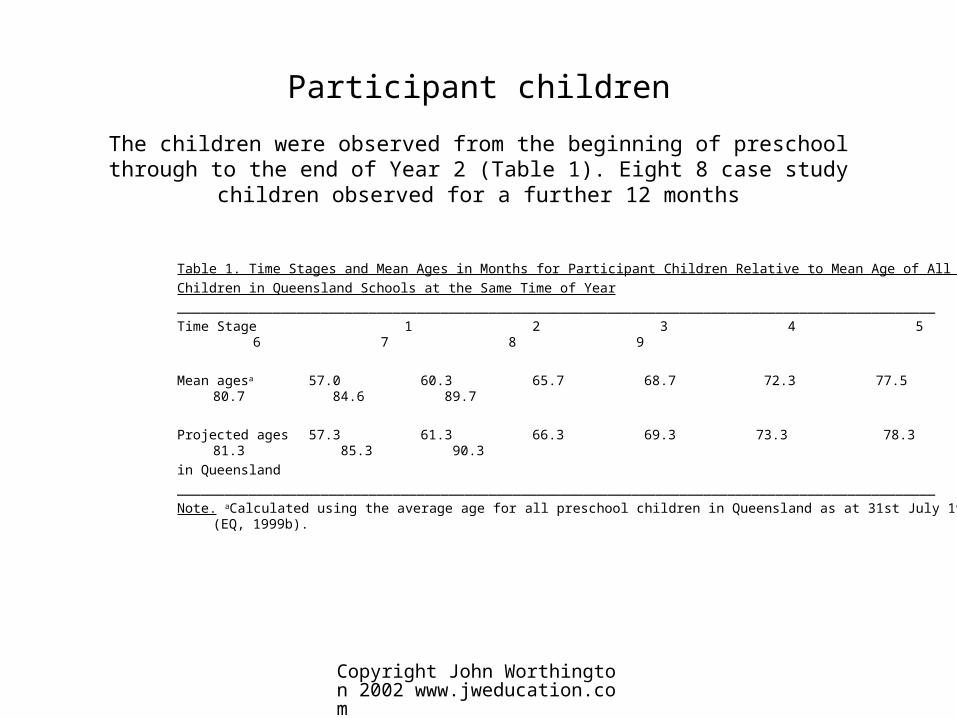
The children were observed from the beginning of preschool through to the end of Year 2 (Table 1). Eight 8 case study children observed for a further 12 months
Table 1. Time Stages and Mean Ages in Months for Participant Children Relative to Mean Age of All
Children in Queensland Schools at the Same Time of Year
_______________________________________________________________________________________________
Time Stage 1 2 3 4 5 6 7 8 9
Mean agesa 57.0 60.3 65.7 68.7 72.3 77.5 80.7 84.6 89.7
Projected ages 57.3 61.3 66.3 69.3 73.3 78.3 81.3 85.3 90.3
in Queensland
_______________________________________________________________________________________________
Note. aCalculated using the average age for all preschool children in Queensland as at 31st July 1999 (EQ, 1999b).
Copyright John Worthington 2002 www.jweducation.com
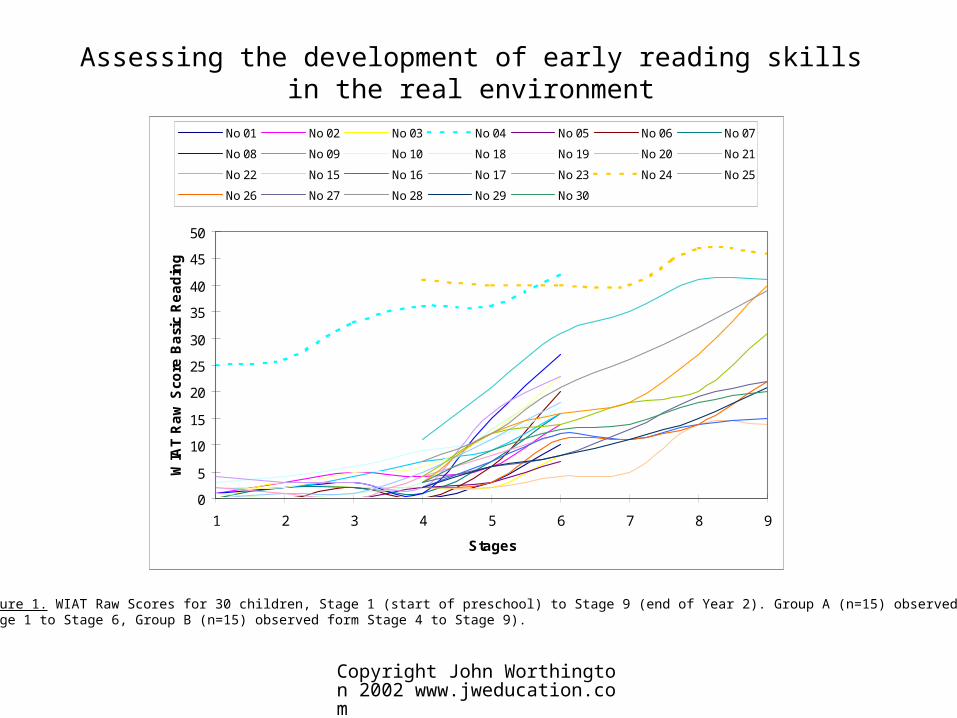
Assessing the development of early reading skills in the real environment
0
5
10
15
20
25
30
35
40
45
50
1 2 3 4 5 6 7 8 9
Stages
WIA
T R
aw
Sco
re B
asi
c R
ea
din
g
No 01 No 02 No 03 No 04 No 05 No 06 No 07
No 08 No 09 No 10 No 18 No 19 No 20 No 21
No 22 No 15 No 16 No 17 No 23 No 24 No 25
No 26 No 27 No 28 No 29 No 30
Figure 1. WIAT Raw Scores for 30 children, Stage 1 (start of preschool) to Stage 9 (end of Year 2). Group A (n=15) observed from Stage 1 to Stage 6, Group B (n=15) observed form Stage 4 to Stage 9).

Copyright John Worthington 2002 www.jweducation.com
Computer use at home and school
Table 2. Means and Standard Deviations for Reported Computer use at Home and School in the Previous Week across Stages 3-9 _____________________________________________________________________________
Home computer use__ School computer use__ Stage na Total minutes Total minutes M SD M (SD) ______________________________________________________________________________ 3 15 114.00 (143.96) 10.33 (11.87) 4 15 110.93 (136.60) 18.00 (17.25)
5 15 99.17 (114.43) 29.50 (23.13)
6 30 91.77 (122.15) 24.50 (21.51)
7 15 98.53 (123.22) 21.00 (15.83)
8 15 79.00 (77.00) 43.00 (22.58)
9 15 64.00 (73.37) 42.33 (46.63) _______________________________________________________________________________ Note. aNumber of children at Stage 6 in Year 1 was 30 as this was the point of overlap for the group.

Copyright John Worthington 2002 www.jweducation.com
Total minutes of reported computer use at home in previous week
9876543
200
100
0
Stage
Minutes
Figure 2. Total minutes of reported computer use at home in previous week (error bars represent 95% confidence intervals). Group of 30 participants, 15 observed at 4 regular intervals from end of preschool (Stage 3) through to end of Year 1 (Stage 6), 15 observed at 4 regular intervals from the endof Year 1 (Stage 5) to end of Year 2 (Stage 9), all 30 participants were observed at the end of Year 1 (Stage 6).
Copyright John Worthington 2002 www.jweducation.com
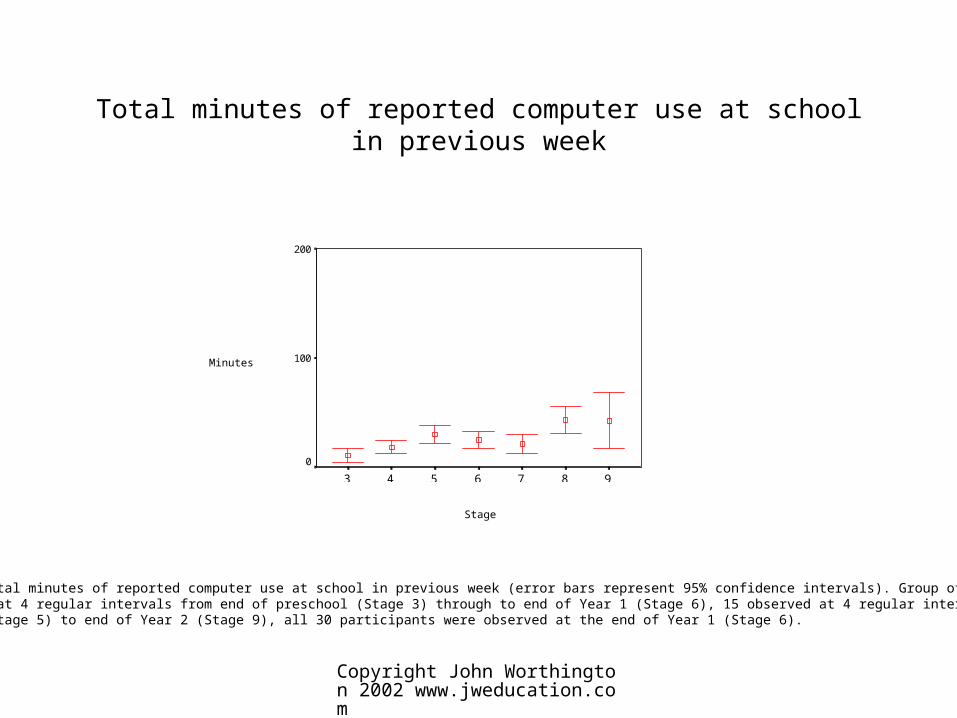
Total minutes of reported computer use at school in previous week
9876543
200
100
0
Minutes
Stage
Figure 3. Total minutes of reported computer use at school in previous week (error bars represent 95% confidence intervals). Group of 30 participants,15 observed at 4 regular intervals from end of preschool (Stage 3) through to end of Year 1 (Stage 6), 15 observed at 4 regular intervals from the endof Year 1 (Stage 5) to end of Year 2 (Stage 9), all 30 participants were observed at the end of Year 1 (Stage 6).
Copyright John Worthington 2002 www.jweducation.com
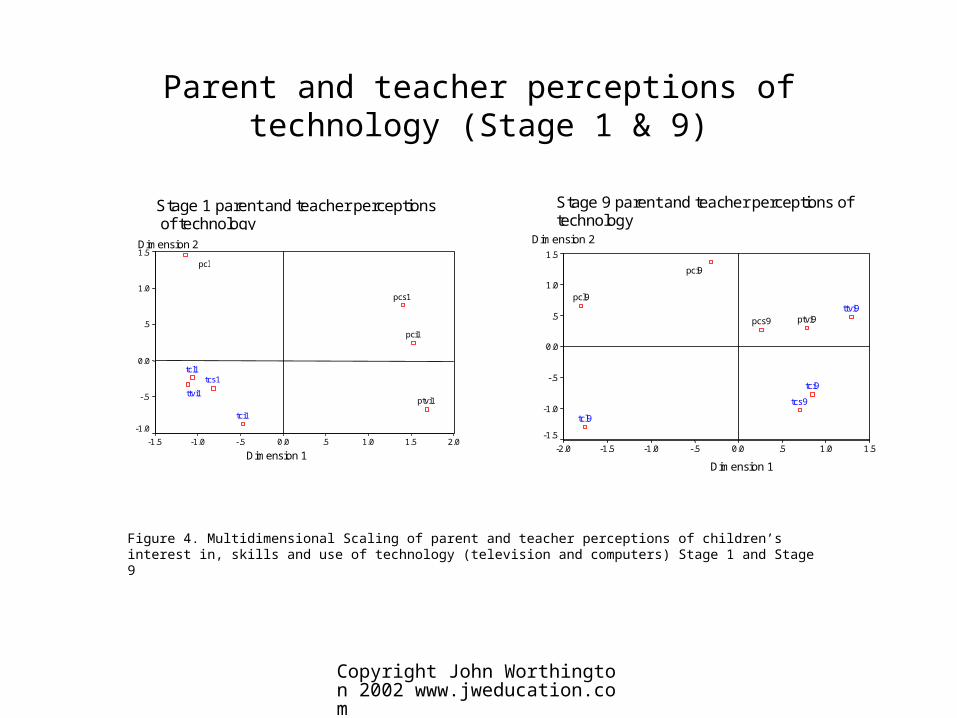
Parent and teacher perceptions of technology (Stage 1 & 9)
Stage 1 parent and teacher perceptions of technology
Dimension 12.01.51.0.50.0-.5-1.0-1.5
Dimension 21.5
1.0
.5
0.0
-.5
-1.0
ttvi1
tcl1tcs1
tci1
ptvi1
pcs1
pci1
pcl1
Stage 9 parent and teacher perceptions oftechnology
Dimension 1
1.51.0.50.0-.5-1.0-1.5-2.0
Dimension 21.5
1.0
.5
0.0
-.5
-1.0
-1.5
pci9
tcs9
tcl9
ttvi9ptvi9
pcl9
pcs9
tci9
Figure 4. Multidimensional Scaling of parent and teacher perceptions of children’s interest in, skills and use of technology (television and computers) Stage 1 and Stage 9
Copyright John Worthington 2002 www.jweducation.com
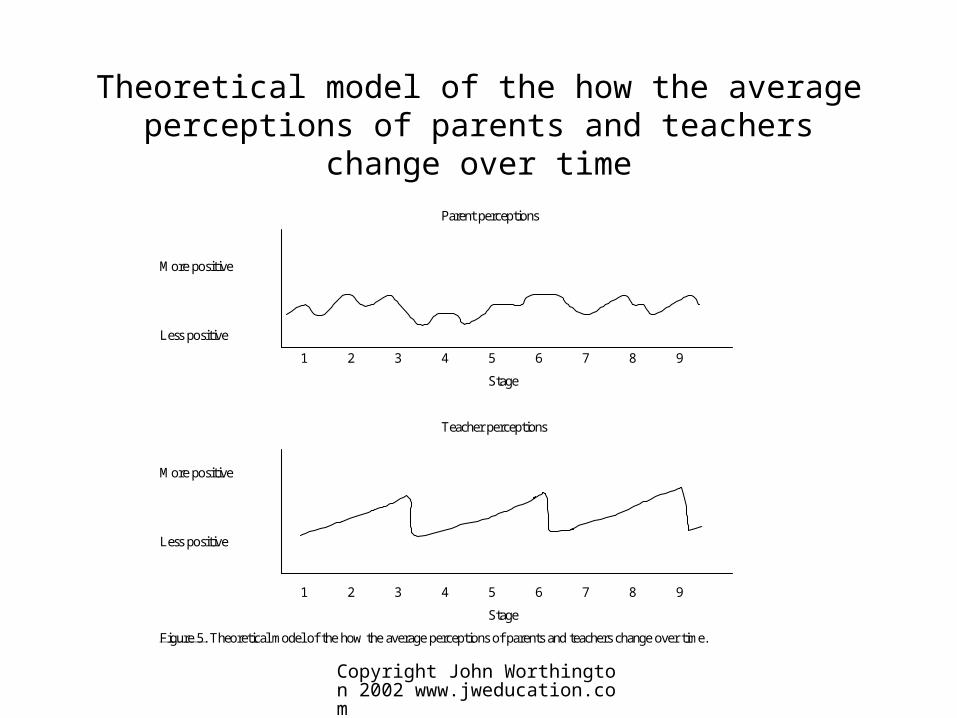
Theoretical model of the how the average perceptions of parents and teachers change over time
Parent perceptions
More positive
Less positive
1 2 3 4 5 6 7 8 9
Stage
Teacher perceptions
More positive
Less positive
1 2 3 4 5 6 7 8 9
Stage
Figure 5. Theoretical model of the how the average perceptions of parents and teachers change over time.
Copyright John Worthington 2002 www.jweducation.com
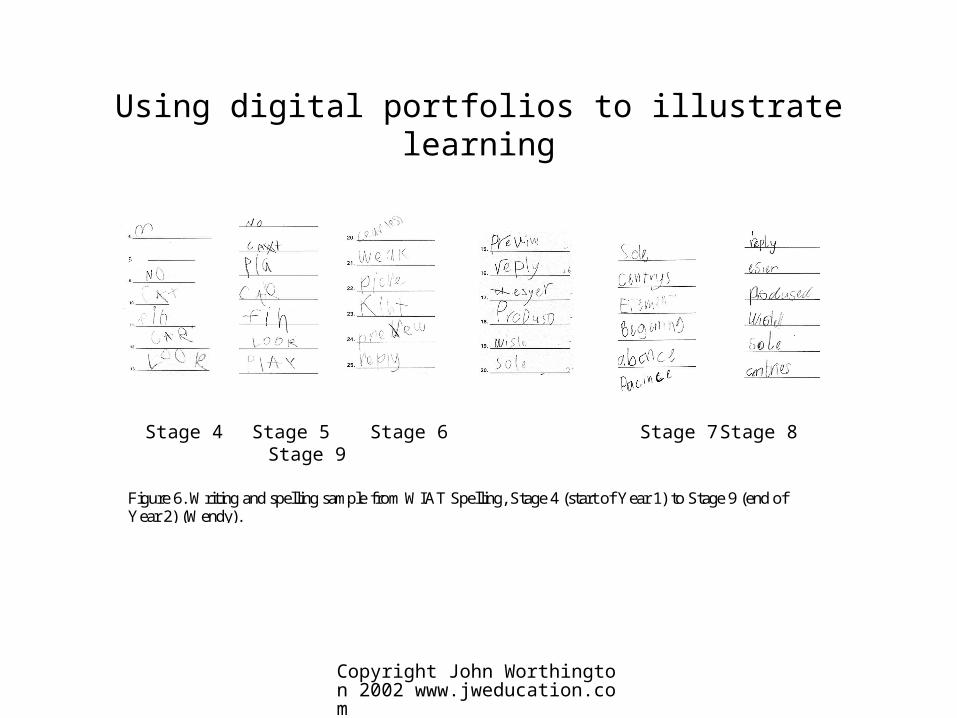
Using digital portfolios to illustrate learning
Figure 6. Writing and spelling sample from WIAT Spelling, Stage 4 (start of Year 1) to Stage 9 (end of Year 2) (Wendy).
Stage 4 Stage 5 Stage 6 Stage 7 Stage 8 Stage 9
Copyright John Worthington 2002 www.jweducation.com
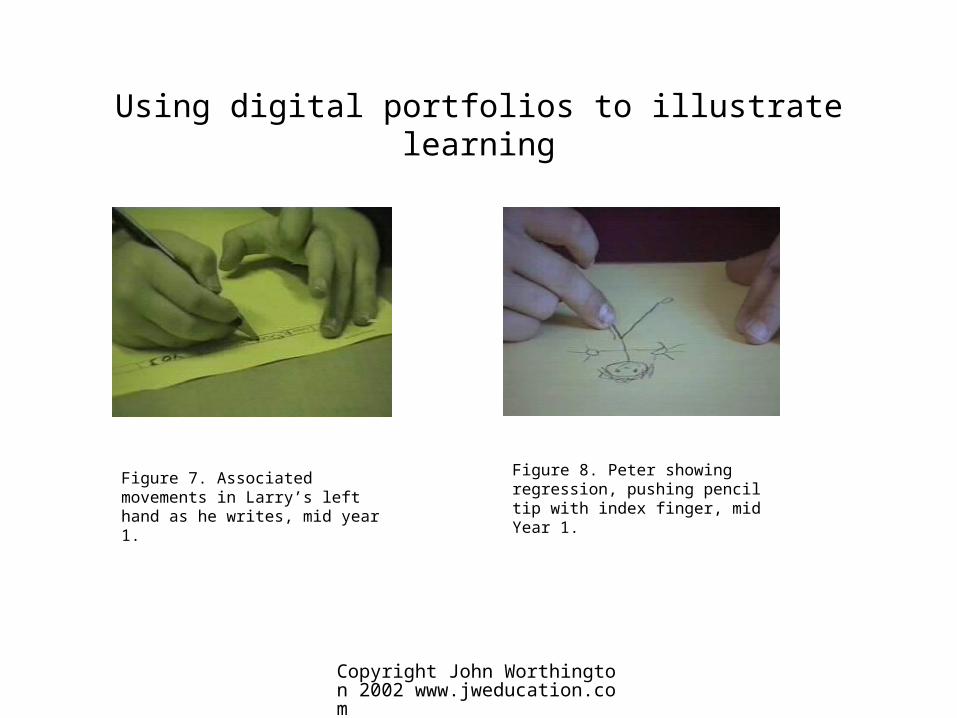
Using digital portfolios to illustrate learning
Figure 7. Associated movements in Larry’s left hand as he writes, mid year 1.
Figure 8. Peter showing regression, pushing pencil tip with index finger, mid Year 1.
Copyright John Worthington 2002 www.jweducation.com
Conclusions
• The data show that these young children spent far more time involved with technology at home than at school.
• As the children moved into formal schooling their use of technology at home and school both in absolute terms and relative terms.
• There were dramatic difference between the perceptions of parents and teachers as they related to specific technology related issues.
• A model to describe in overall terms the development of and the differences between how teachers and parents perceive the changes that occur as young children move into formal schooling.
• Teachers need to be trained to work systematically with parents to collect and interpret digital portfolios that illustrate learning.
• Clinicians need to be vigilant to the differences between parent and teacher perspectives.