Embed Size (px)
Citation preview
Copyright THE DEPARTMENT OF STATISTICS – BAHAMAS MAY 2019
“Short extracts from this publication may be copied or reproduced, for individual use,
without permission, provided the source is fully acknowledged. More extensive
reproduction or storage in a retrieval system, in any form or by any means, electronic,
mechanical, photocopying, recording or otherwise, requires prior permission of the
Department of Statistics–Bahamas.”
Published by The Department of Statistics
P.O. Box N-3904
Nassau, Bahamas
TABLE OF CONTENTS
PAGE
NO. Foreword
Acknowledgements
Highlights from The May 2019 Labour Force and Household Income Survey 1-3
Outline of the Labour Force Survey
1.1.1.1. Purpose
2.2.2.2. Sample Design Field Procedure and Estimation Processes of the 2019 Survey
2.1 Sample Design
2.2 Field Operations
2.3 Method of Data Collection
2.4 Estimation Procedures
3.3.3.3. Reliability of Data
3-7
SECTION I – LABOUR FORCE CHARACTERISTICS
CHART
NO.
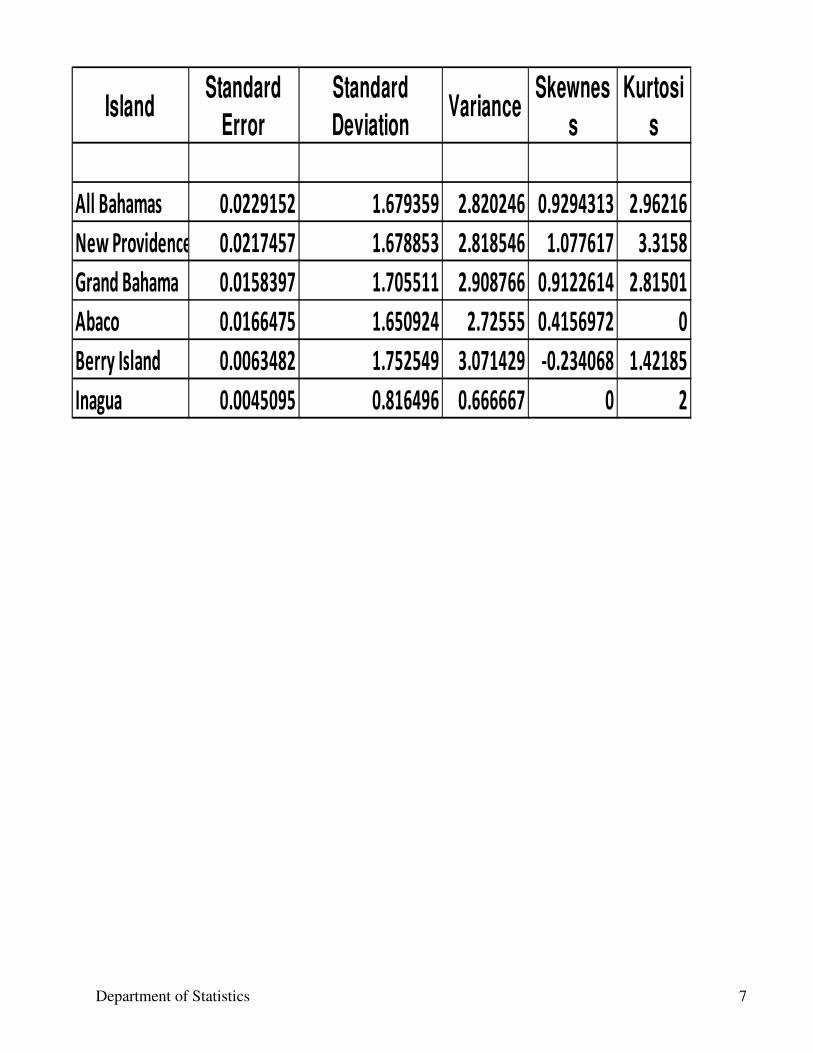
I Total Labour Force: 2012-2019 8
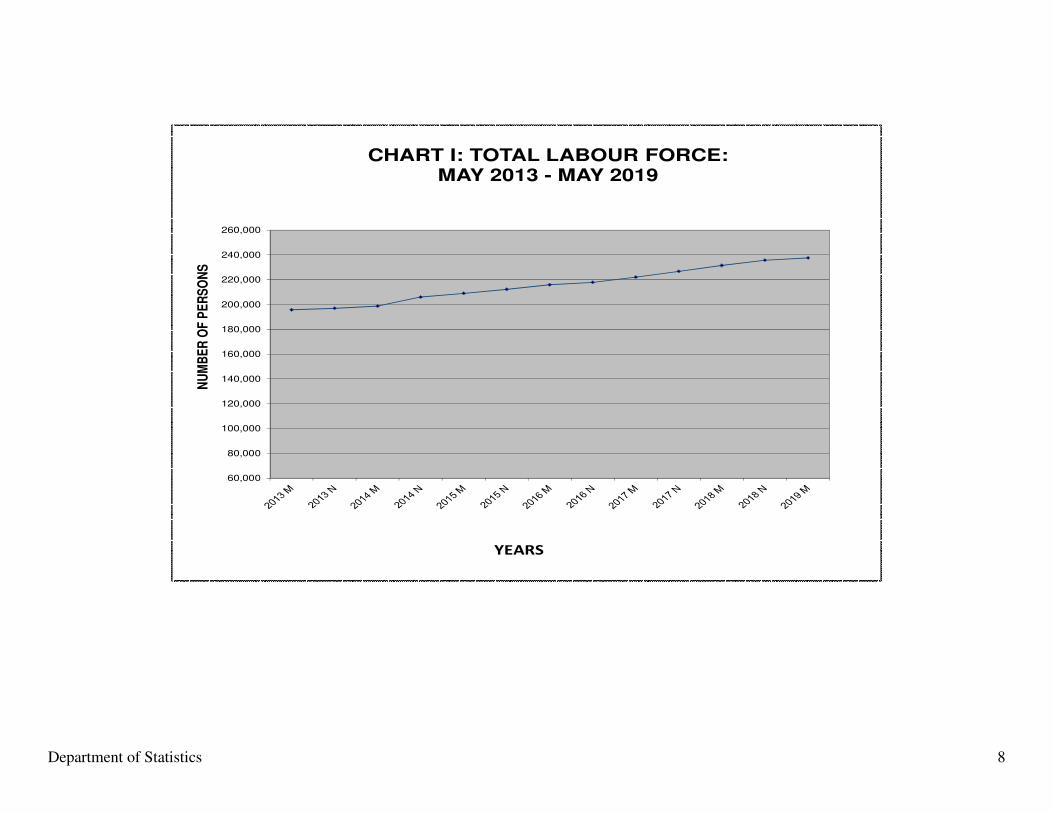
II Labour Force Participation Rates by Sex: Nov 2018 & May 2019 9
III
Unemployment Rates by Sex:2012-2019 10
IV
Lorenze Curve Percentages of Aggregate House hold Income
1973, 1986, 1999, 2013 , 2017, 2018 & 2019
11
V Distribution Labour Force by Educational Qualification: May 2019 12
VI Labour Force by Educational Attainment & Sex: May 2019 13
VII Labour Force with No Schooling by Sex: May 2019 14
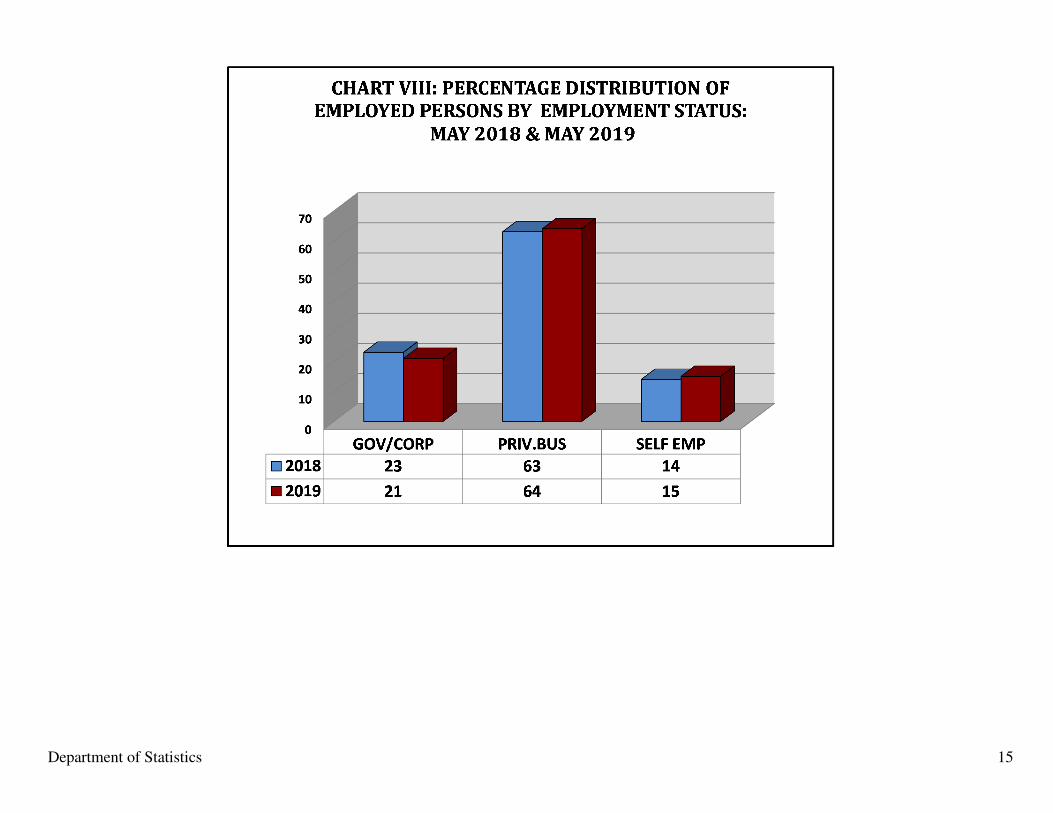
VIII
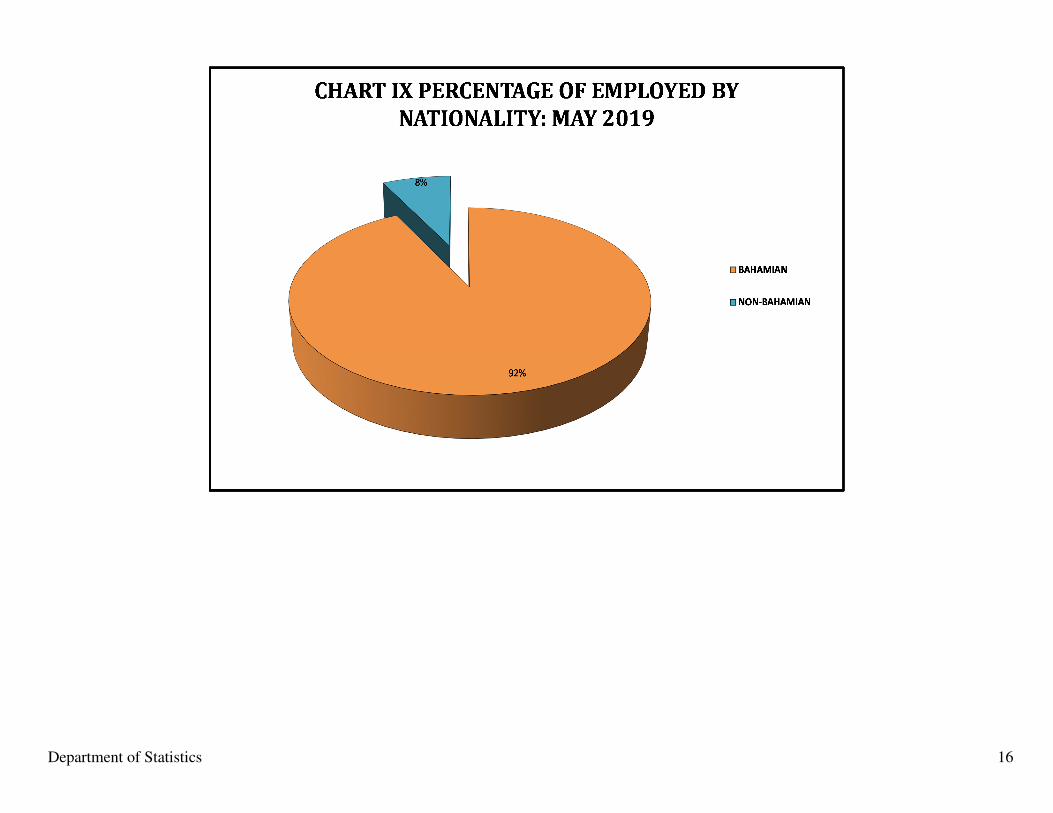
IX
Percentage Distribution of Employment by their Employment Status : 2017-
2019
Percentage Distribution of Employed by Nationality: May 2019
15
16
TABLE
NO.
Summary Tables
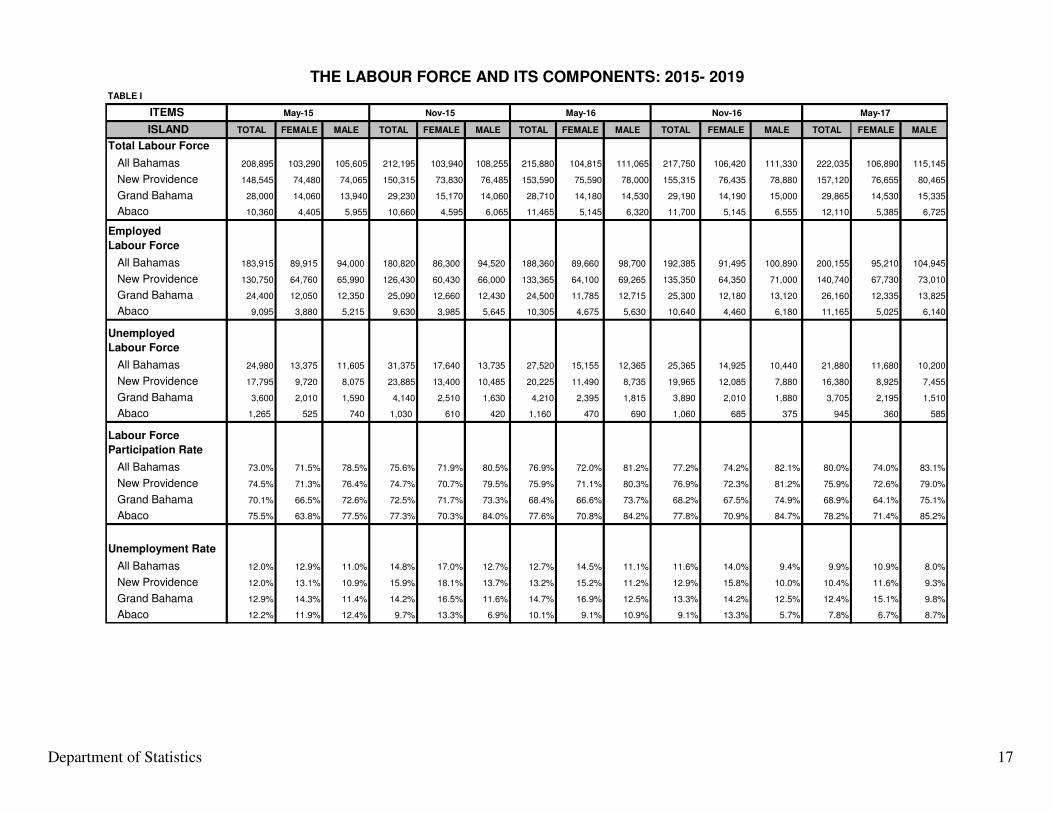
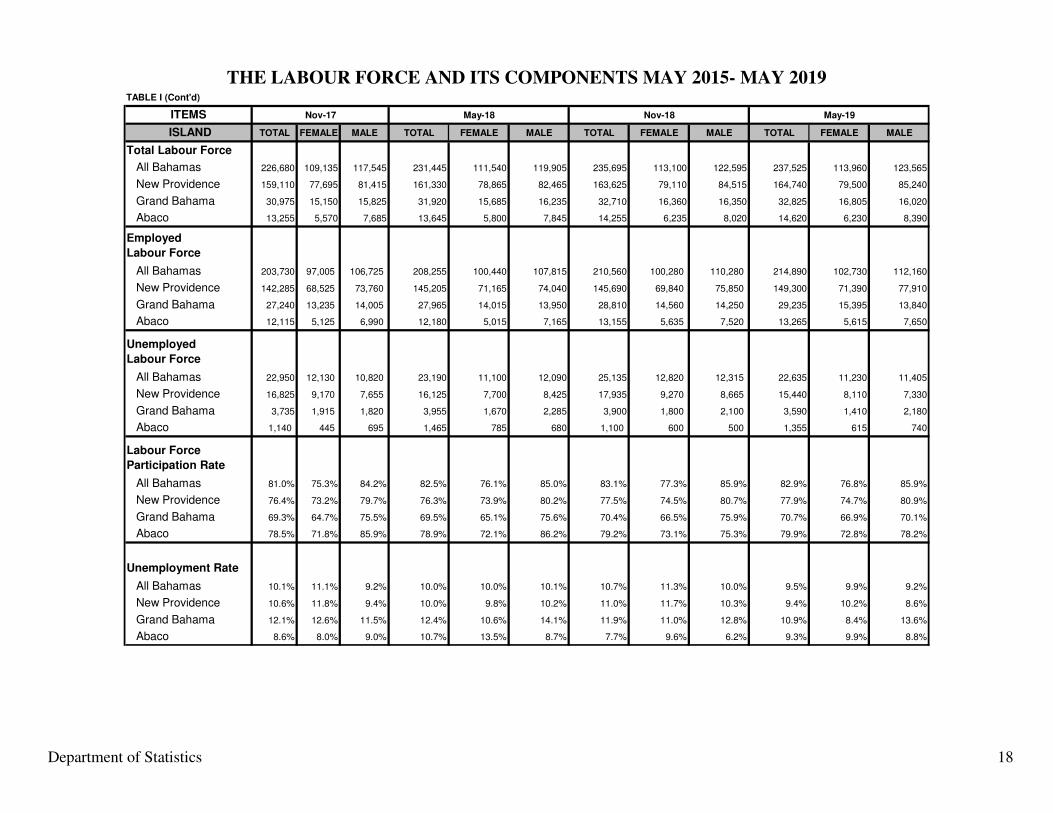
i The Labour Force and Its Components: May 2012-2019 17 & 18
ii The Labour Force and Its Components: May 2019 19
iii
iv
Number of Households and Household Income:
All Bahamas, New Providence. Grand Bahama, & Abaco: May 2019
Employment Permanent and Vulerable: 2012-2019
20
21
SECTION 1: LABOUR FORCE CHARACTERISTICS
1.1 Labour Force by Age Group and Sex: May 2019 All Bahamas
23
1.2 Labour Force by Age Group and Sex: May 2019 New Providence 24
1.3 Labour Force by Age Group and Sex: May 2019 Grand Bahama 25
1.4 Labour Force by Age Group and Sex: May 2019 Abaco 26
2.1 Labour Force by Educational Attainment and Sex: May 2019 All Bahamas 27
2.2 Labour Force by Educational Attainment and Sex: May 2019
New Providence 28
2.3 Labour Force by Educational Attainment and Sex: May 2019 Grand Bahama 29
2.4 Labour Force by Educational Attainment and Sex: May 2019 Abaco 30
3.1 Labour Force by Highest Examination Passed & Sex : May 2019
All Bahamas 31
3.2 Labour Force by Highest Examination Passed & Sex : May 2019
New Providence 32
3.3 Labour Force by Highest Examination Passed & Sex : May 2019
Grand Bahama 33
3.4 Labour Force by Highest Examination Passed & Sex : May 2019 Abaco 34
SECTION II – THE EMPLOYED LABOUR FORCE
4.1 Employed Persons by Sex & Employment Status: May 2019 All Bahamas 35
4.2 Employed Persons by Sex & Employment Status: May 2019
New Providence 36
4.3 Employed Persons by Sex & Employment Status: May 2019 Grand Bahama 37
4.4 Employed Persons by Sex & Employment Status: May 2019 Abaco 38
5.1 Employed Persons by Employment Status & Citizenship: May 2019
All Bahamas 39
5.2 Employed Persons by Employment Status & Citizenship: May 2019
New Providence 40
5.3 Employed Persons by Employment Status & Citizenship: May 2019
Grand Bahama 41
5.4 Employed Persons by Employment Status & Citizenship: May 2019 Abaco 42
6.1 Employed Persons by Sex & Industrial Group May: 2019 All Bahamas 43
6.2 Employed Persons by Sex & Industrial Group: May 2019 New Providence 44
6.3 Employed Persons by Sex & Industrial Group: May 2019 Grand Bahama 45
6.4 Employed Persons by Sex & Industrial Group: May 2019 Abaco 46
7.1 Employed Persons by Sex and Occupational Group May 2019:
All Bahamas 47
7.2 Employed Persons by Sex and Occupational Group: May 2019
New Providence 48
7.3 Employed Persons by Sex and Occupational Group May 2019:
Grand Bahama 49
7.4 Employed Persons by Sex and Occupational Group: May 2019
Abaco 50
8.1 Employed Persons Who Did Not Work During the Reference Week by Sex
and Reasons For Not Working: May 2019 All Bahamas 51
8.2 Employed Persons Who Did Not Work During the Reference Week by Sex
and Reasons For Not Working: May 2019 New Providence 52
SECTION III – THE UNEMPLOYED LABOUR FORCE
9.1 Unemployed Persons by Sex and Duration of unemployment: May 2019
All Bahamas 54
9.2 Unemployed Persons by Sex and Duration of unemployment: May 2019
New Providence 55
9.3 Unemployed Persons by Sex and Duration of unemployment: May 2019
Grand Bahama 56
9.4 Unemployed Persons by Sex and Duration of unemployment: May 2019
Abaco 57
10.1 Unemployed Persons by Sex and Reasons for leaving last job: May 2019
All Bahamas 58
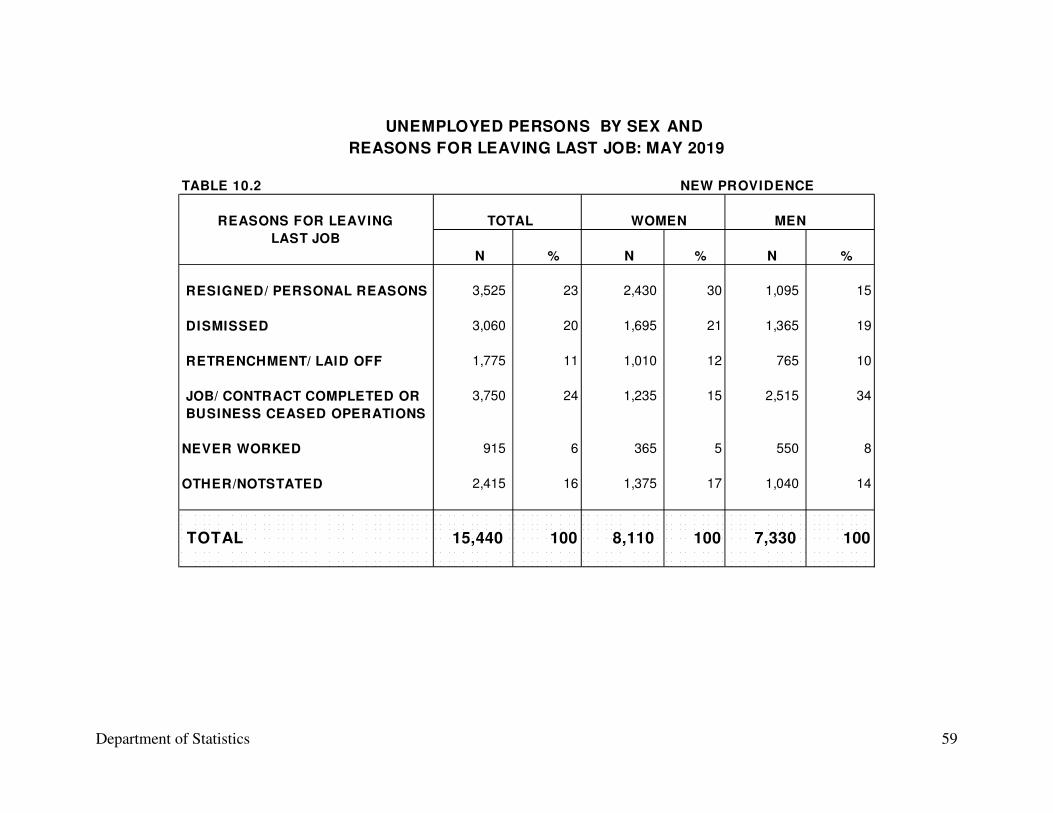
10.2 Unemployed Persons by Sex and Reasons for leaving last job: May 2019
New Providence 59
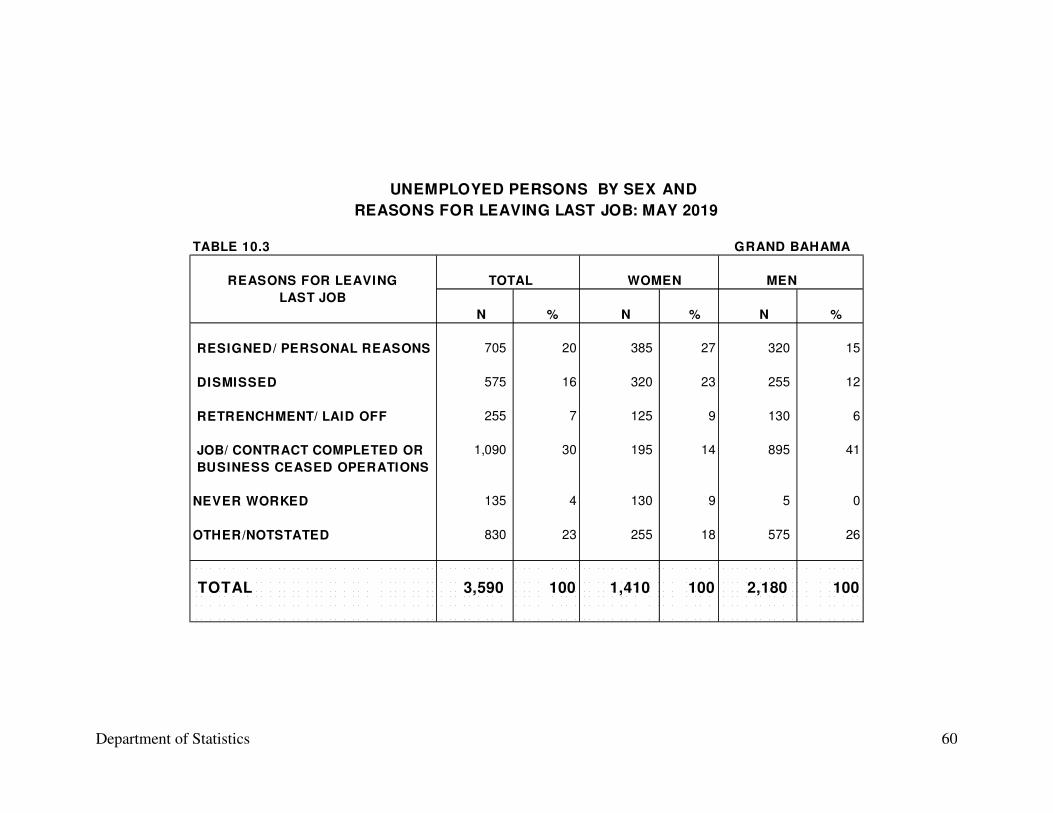
10.3 Unemployed Persons by Sex and Reasons for leaving last job: May 2019
Grand Bahama 60
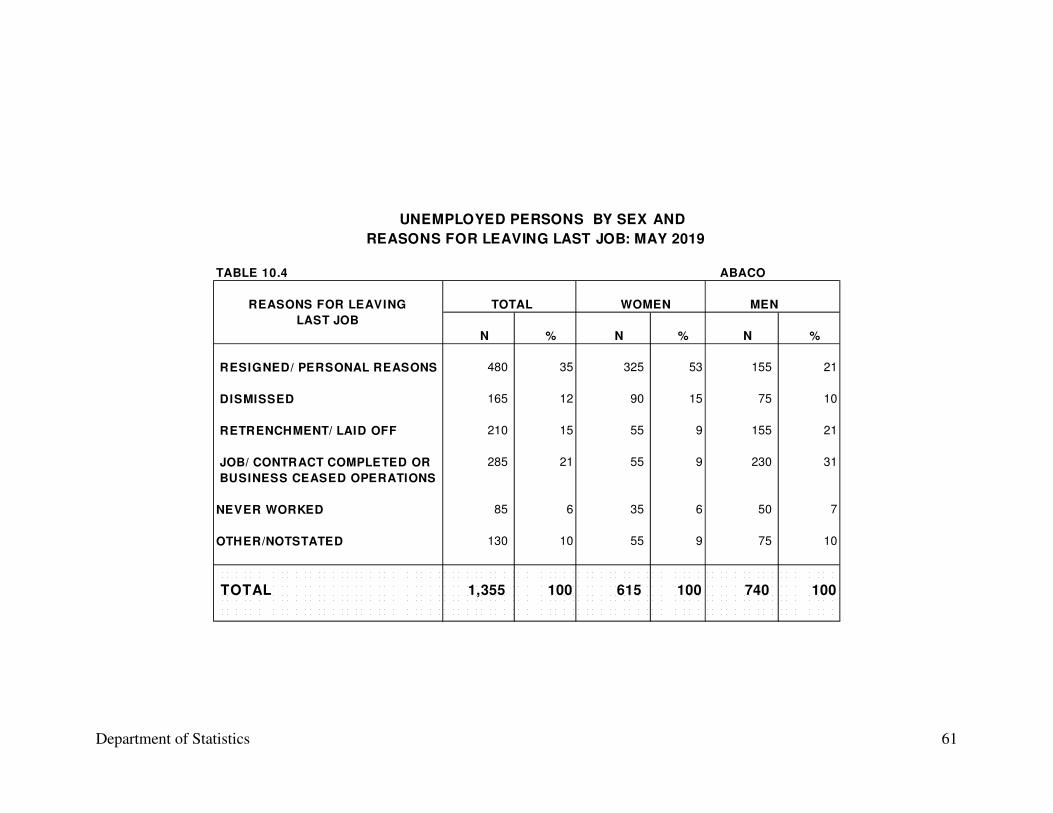
10.4 Unemployed Persons by Sex and Reasons for leaving last job: May 2019
Abaco 61
SECTION IV – DISCOURAGED WORKERS
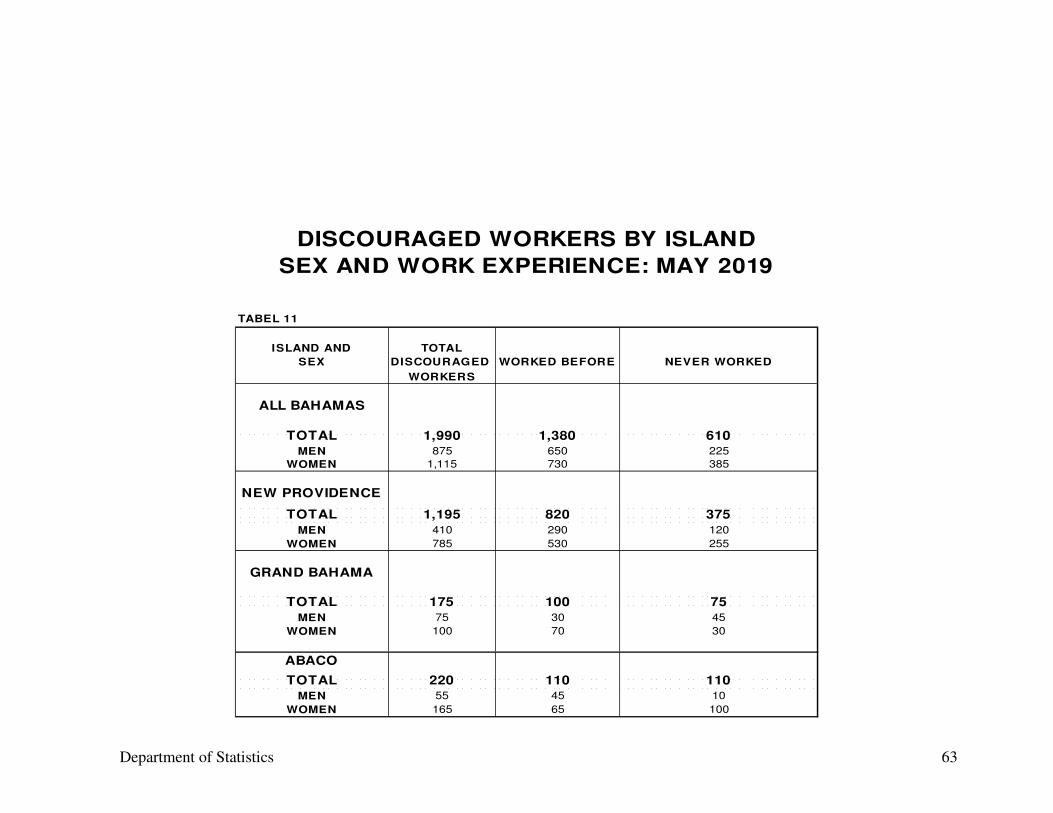
11 Discouraged Workers by Island, Sex and Work Experience: May 2019
All Bahamas 63
SECTION V – HOUSEHOLDS
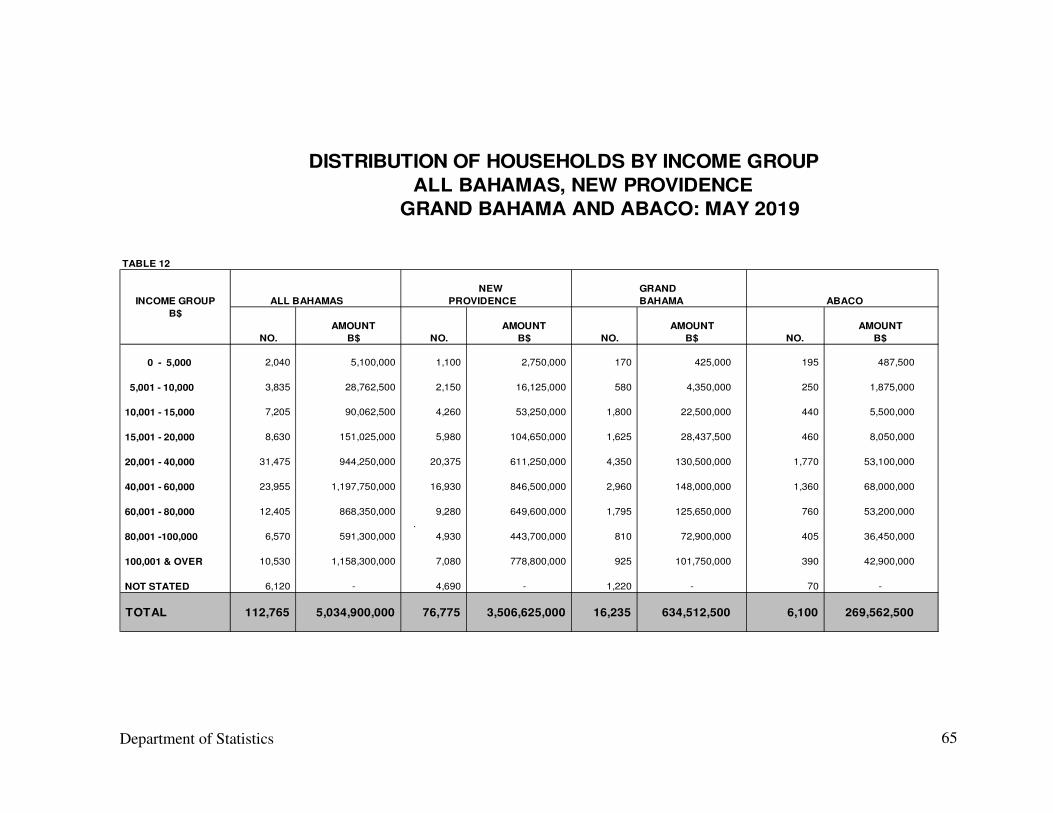
12 Distribution of Household by Income Group: May 2019
All Bahamas, New Providence, Grand Bahama, Abaco 65
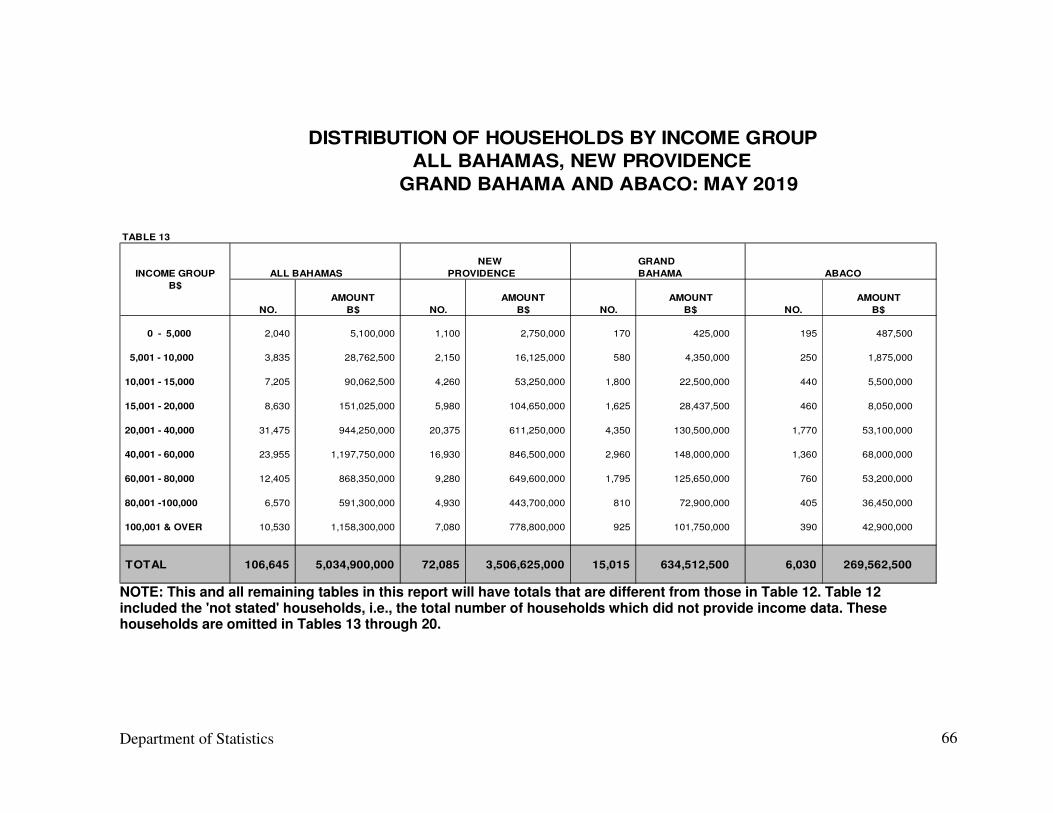
13 Distribution of Households by Income Group: May 2019
All Bahamas, New Providence and Grand Bahama and Abaco 66
14
Distribution of Households, Household Income, Mean Income and Median
Income by Sex of Head of Household: May 2019
All Bahamas, New Providence, Grand Bahama and Abaco
67
15 Distribution of Households by Income Group and Sex of Head of Household:
All Bahamas, New Providence, Grand Bahama & Abaco : May 2019 68& 69
16
Distribution of Households, Household Income and Mean Income by Marital
Status of Head of Household:
All Bahamas, New Providence , Grand Bahama and Abaco: May 2019
70 & 71
17.1 Distribution of Households by Income Group and Marital Status of Head of
Household: All Bahamas May 2019 72
17.2 Distribution of Households by Income Group and Marital Status of Head of
Household: New Providence May 2019 73
17.3 Distribution of Households by Income Group and Marital Status of Head of
Household: Grand Bahama May 2019 74
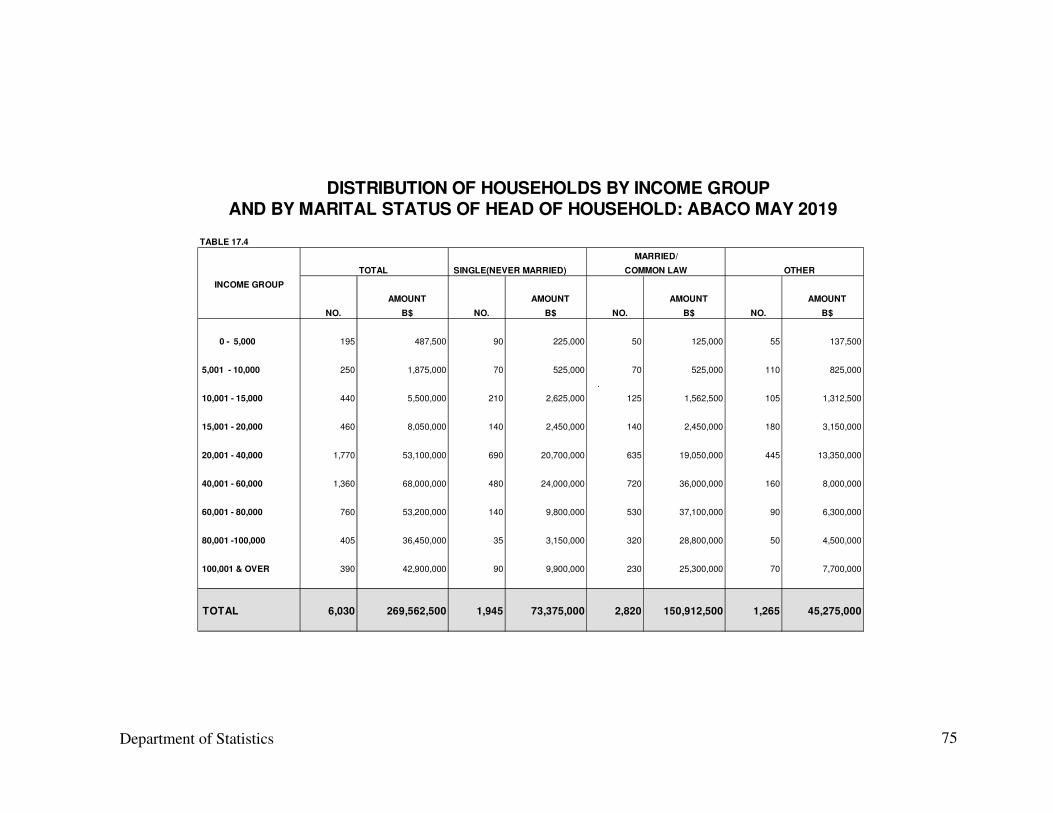
17.4 Distribution of Households by Income Group and Marital Status of Head of
Household: Abaco May 2019 75
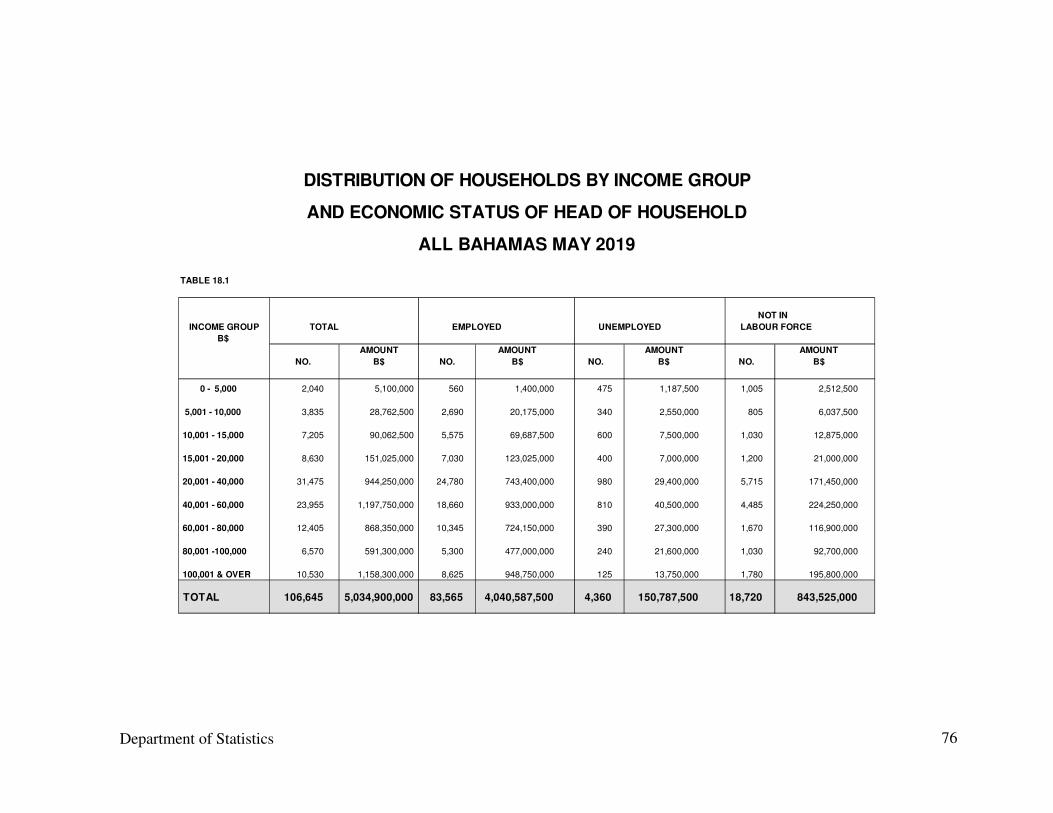
18.1 Distribution of Households by Income Group and Economic Status of Head
of Household: All Bahamas May 2019 76
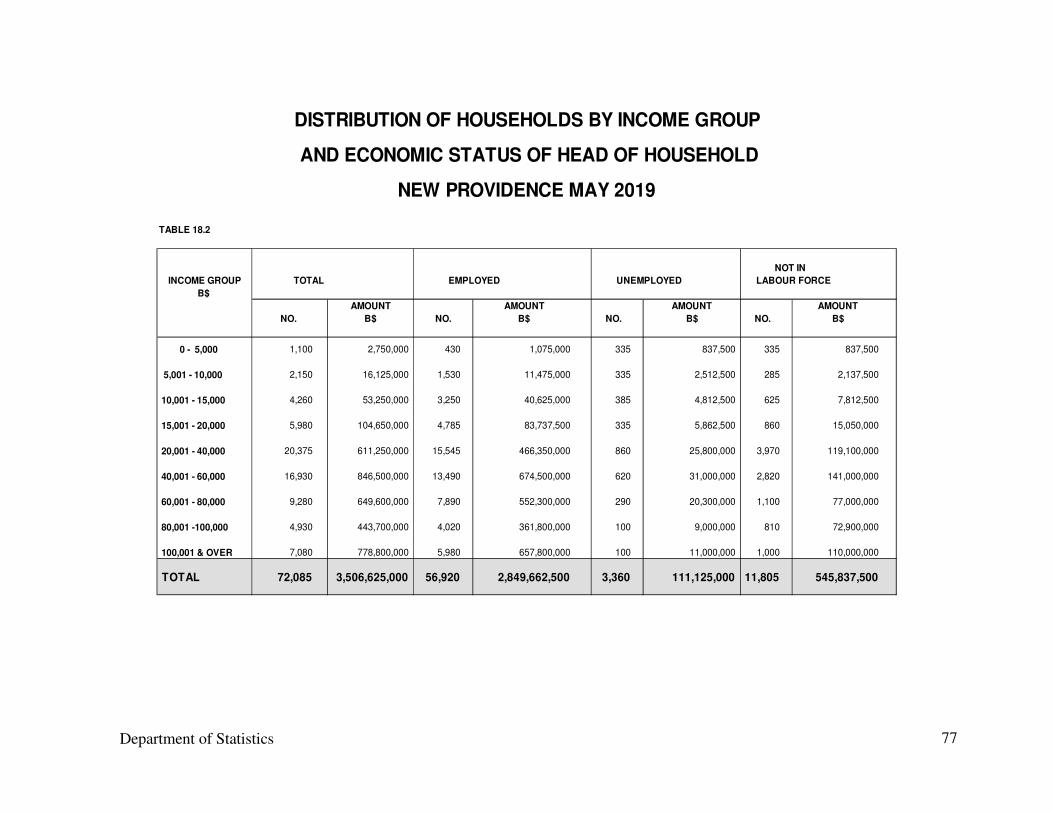
18.2
Distribution of Households by Income Group and Economic Status of Head
of Household: New Providence May 2019
77
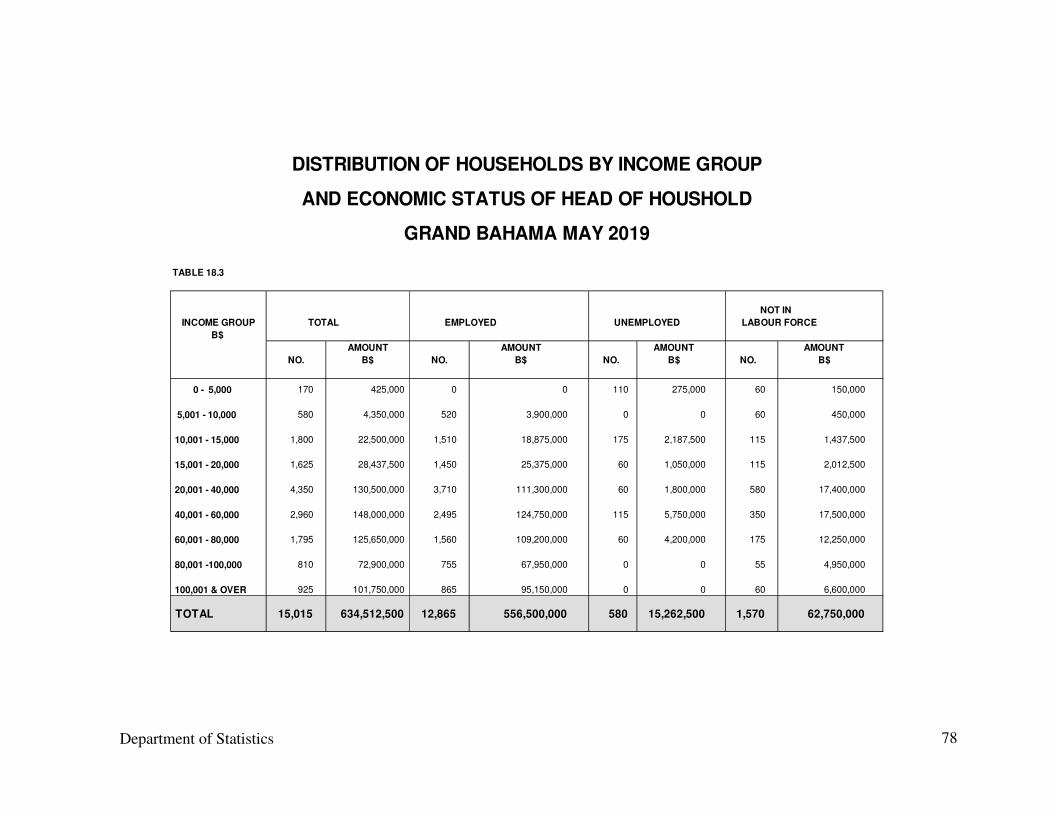
18.3 Distribution of Households by Income Group and Economic Status of Head
of Household: Grand Bahama May 2019 78
18.4 Distribution of Households by Income Group and Economic Status of Head
of Household: Abaco May 2019 79
19
Distribution of Households, Household and Mean Income by Economic
Status of Head of Household: May 2019
All Bahamas, New Providence, Grand Bahama and Abaco
80 & 81
20
Households by Islands indicating Access to Amenities: May 2019
All Bahamas, New Providence, Grand Bahama, Abaco
82
21
Number of Households with Persons who have Cellular Phone
By Island: May 2019 83
APPENDICES
Historical Background 84
Concepts and Definitions 86-90
The Questionnaire 91-114
FOREWORD
The Labour Force Report is one of the most widely used publications of the Department
of Statistics. It is used extensively by a wide cross section of the population; in particular
other government agencies, secondary and tertiary students, media houses, researchers
and private companies, as well as regional and international agencies.
Details on the survey’s sample design along with concepts, definitions and methodology
are presented in this report. Additionally, a brief note on the reliability of the data and
their salient features are also included.
The report provides statistical summaries comprising tables and charts that show Labour
Force components and characteristics of the Employed and Unemployed.
The Labour Force Section was responsible for the collection, data processing, tabulation
and analysis. All these contributions are gratefully acknowledged.
Acting Director of Statistics
ACKNOWLEDGEMENTS
The Department of Statistics wishes to thank the Bahamian public for the cooperation
received throughout the year and looks forward to their continued support in the future.
The Department also wishes to record the contribution of its staff in the development,
preparation and publication of this Report. This includes staff of the Department and
temporary staff hired to assist with the exercise of data collection. Special thanks to the
staff of The Labour Force section, namely Erica Francis, Kenneth Storr, Clarence Carey,
Betty Stubbs, Martha Missick, Jean Hepburn and Kayla Armbrister for their invaluable
contribution.
The analysis was done by Cypreanna Winters under the supervision of Leona Wilson,
Acting Director.
Department of Statistics 1
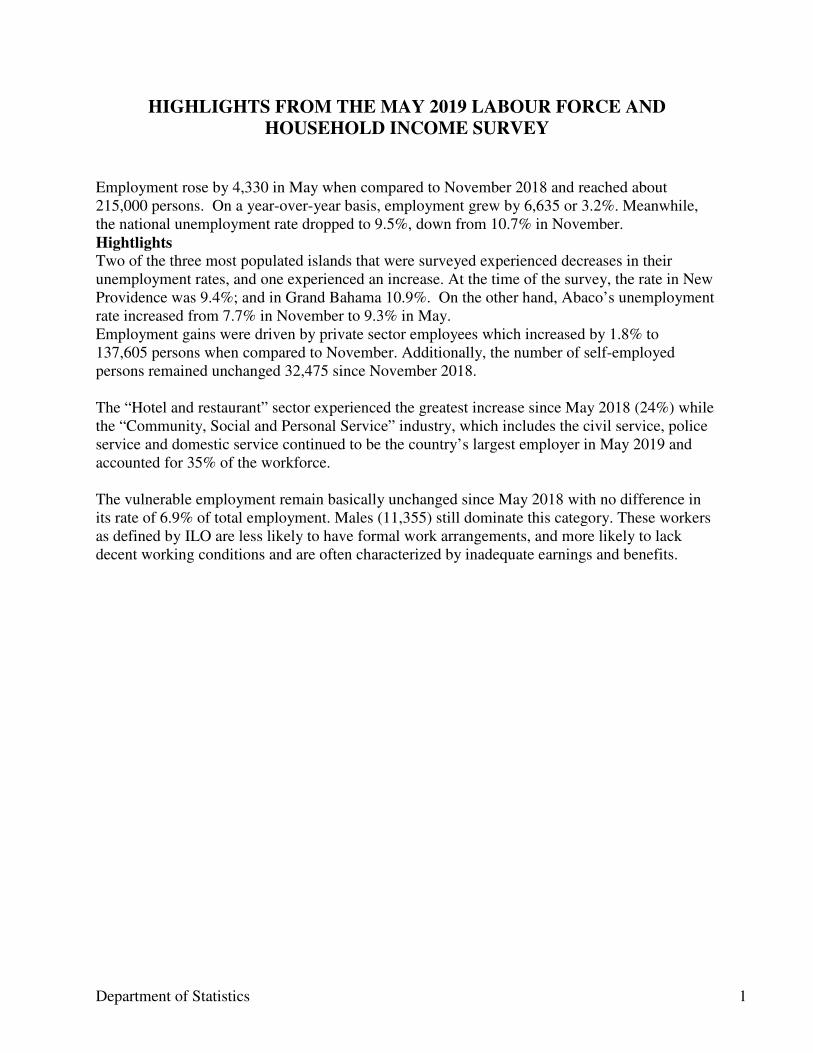
HIGHLIGHTS FROM THE MAY 2019 LABOUR FORCE AND
HOUSEHOLD INCOME SURVEY
Employment rose by 4,330 in May when compared to November 2018 and reached about
215,000 persons. On a year-over-year basis, employment grew by 6,635 or 3.2%. Meanwhile,
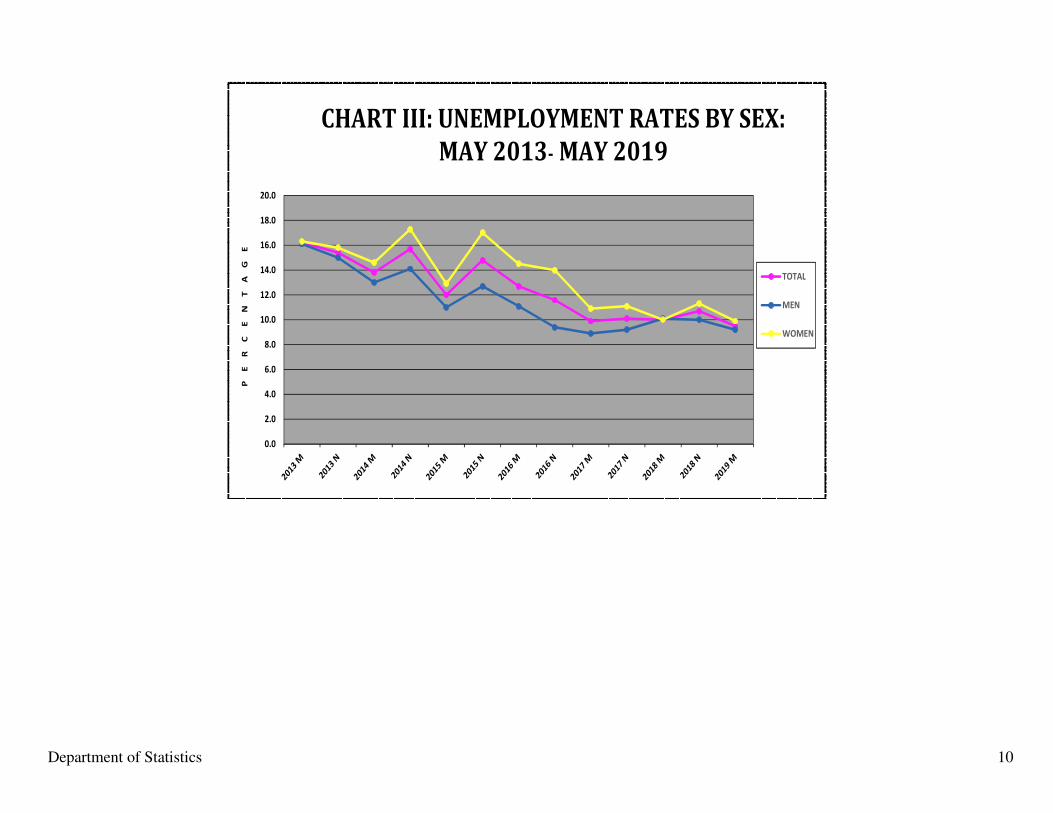
the national unemployment rate dropped to 9.5%, down from 10.7% in November.
Hightlights
Two of the three most populated islands that were surveyed experienced decreases in their
unemployment rates, and one experienced an increase. At the time of the survey, the rate in New
Providence was 9.4%; and in Grand Bahama 10.9%. On the other hand, Abaco’s unemployment
rate increased from 7.7% in November to 9.3% in May.
Employment gains were driven by private sector employees which increased by 1.8% to
137,605 persons when compared to November. Additionally, the number of self-employed
persons remained unchanged 32,475 since November 2018.
The “Hotel and restaurant” sector experienced the greatest increase since May 2018 (24%) while
the “Community, Social and Personal Service” industry, which includes the civil service, police
service and domestic service continued to be the country’s largest employer in May 2019 and
accounted for 35% of the workforce.
The vulnerable employment remain basically unchanged since May 2018 with no difference in
its rate of 6.9% of total employment. Males (11,355) still dominate this category. These workers
as defined by ILO are less likely to have formal work arrangements, and more likely to lack
decent working conditions and are often characterized by inadequate earnings and benefits.
Department of Statistics 2
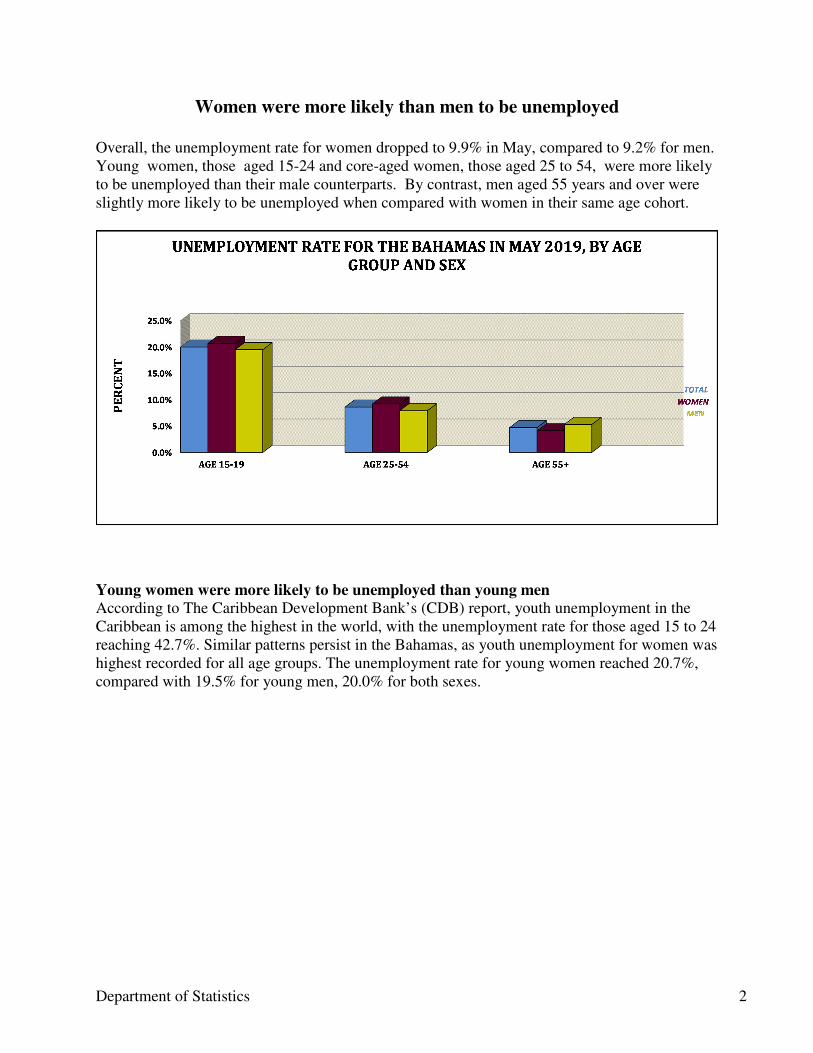
Women were more likely than men to be unemployed
Overall, the unemployment rate for women dropped to 9.9% in May, compared to 9.2% for men.
Young women, those aged 15-24 and core-aged women, those aged 25 to 54, were more likely
to be unemployed than their male counterparts. By contrast, men aged 55 years and over were
slightly more likely to be unemployed when compared with women in their same age cohort.
Young women were more likely to be unemployed than young men
According to The Caribbean Development Bank’s (CDB) report, youth unemployment in the
Caribbean is among the highest in the world, with the unemployment rate for those aged 15 to 24
reaching 42.7%. Similar patterns persist in the Bahamas, as youth unemployment for women was
highest recorded for all age groups. The unemployment rate for young women reached 20.7%,
compared with 19.5% for young men, 20.0% for both sexes.
Department of Statistics 3
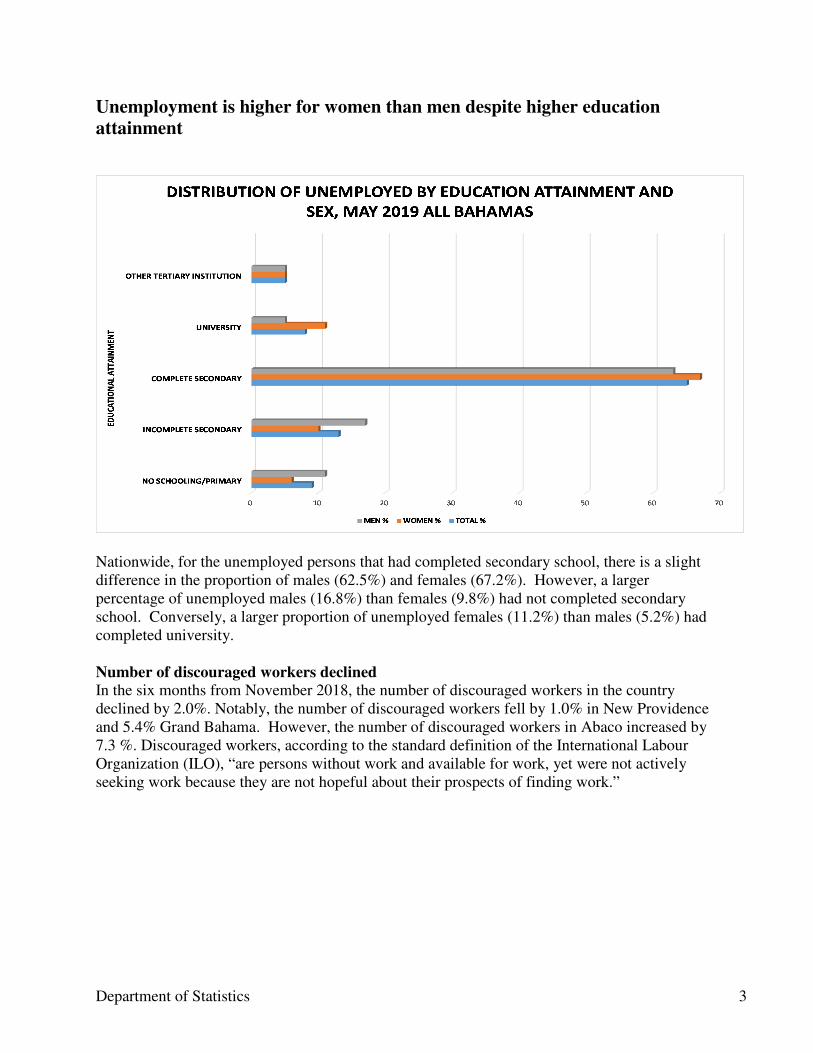
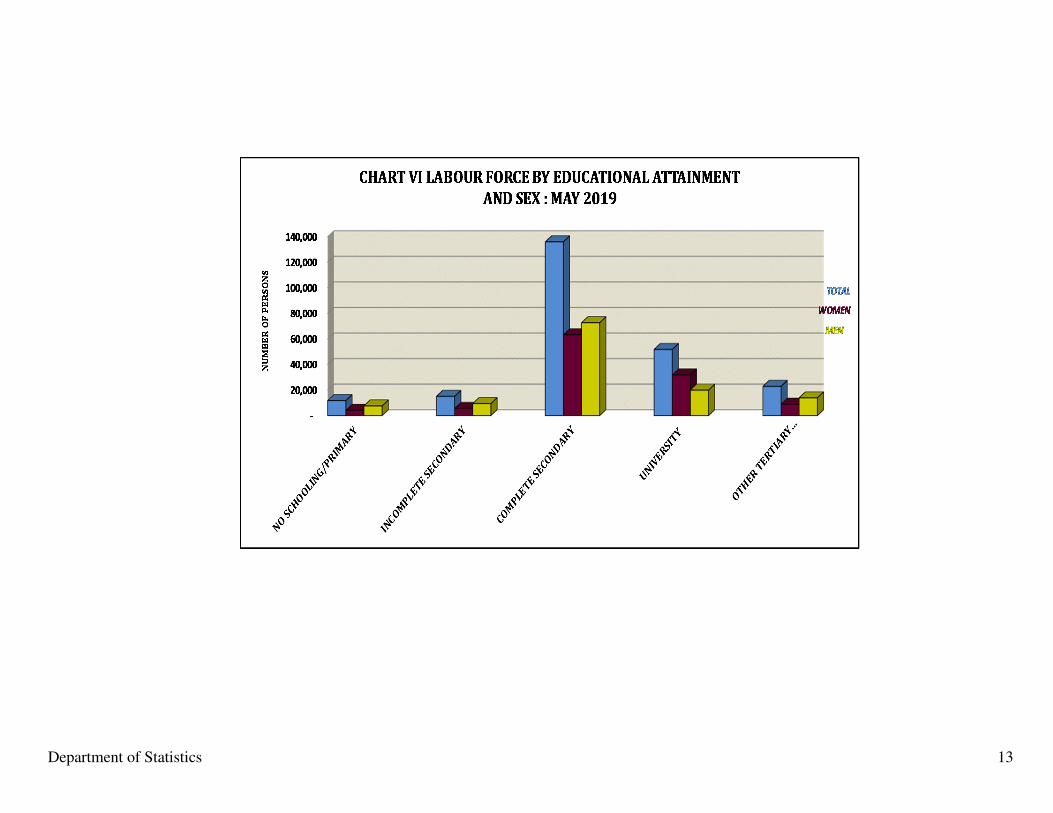
Unemployment is higher for women than men despite higher education
attainment
Nationwide, for the unemployed persons that had completed secondary school, there is a slight
difference in the proportion of males (62.5%) and females (67.2%). However, a larger
percentage of unemployed males (16.8%) than females (9.8%) had not completed secondary
school. Conversely, a larger proportion of unemployed females (11.2%) than males (5.2%) had
completed university.
Number of discouraged workers declined
In the six months from November 2018, the number of discouraged workers in the country
declined by 2.0%. Notably, the number of discouraged workers fell by 1.0% in New Providence
and 5.4% Grand Bahama. However, the number of discouraged workers in Abaco increased by
7.3 %. Discouraged workers, according to the standard definition of the International Labour
Organization (ILO), “are persons without work and available for work, yet were not actively
seeking work because they are not hopeful about their prospects of finding work.”
Department of Statistics 4
OUTLINE OF THE LABOUR FORCE SURVEY
PURPOSE
The primary objective of the Labour Force Survey (LFS) of The Bahamas is to provide up-to-
date information on the Labour Force size and characteristics on an annual basis.
2. SAMPLE DESIGN, FIELD PROCEDURES AND ESTIMATION PROCESSES OF
THE 2019
SURVEY
2.1 SAMPLE DESIGN
In general the LFS sample is drawn from New Providence, Grand Bahama and most recently
Abaco and two or three additional Family Islands. The Family Islands covered in each cycle of
the LFS are rotated in and out of sample to ensure that over time the more populated islands are
represented directly. For May 2019 Inagua and Berry Island remained in the sample and will be
rotated out in the November 2019 round. This concludes all the islands inclusive before The
Census 2020.
The Department utilizes a multi-stage-stratified design in which each selected island forms a
stratum. Each stratum contains a number of supervisory districts, which correspond to the
political constituencies, as they existed in 2010. All supervisory districts are represented in the
sample. The supervisory districts are further subdivided into enumeration districts. The number
of enumeration districts depends on the number of households in the supervisory district as each
enumeration area comprises about 150 households. In turn, enumeration districts (ED’s) are
selected at random based on the size of the supervisory district relative to the stratum. Finally,
households within the selected ED's are selected randomly.
The May 2019 sample included 2,500 private households in New Providence, Grand Bahama,
Abaco, Berry Island and Inagua, and All persons 15 years of age and over within these
households who were usual residents were interviewed.
2.2 FIELD OPERATIONS
In practice, the survey includes two phases of fieldwork. In the first phase all the households in
the selected enumeration districts are listed. This procedure takes approximately four (4) months.
The second phase, which usually occurs in May, consists of enumerating randomly selected
households from the lists of households of the enumeration districts. Administrative field checks
usually last for four weeks after the enumeration.
Department of Statistics 5
2.3 METHOD OF DATA COLLECTION
Data for the labour force are collected by personal interview, usually with the head or other
responsible member of the household. Every year approximately ninety-five enumerators and
twenty supervisors are recruited to complete the task.
2.4 ESTIMATION PROCEDURES
Information from individuals and households with like characteristics are weighted-up to
produce separate population estimates by sex based on the population ratio estimation method.
In the estimating procedure the estimates of the total Non-Institutional Population 15 years old
and over is used to blow up the sample estimates. Separate raising factors are calculated for
males and females using the formula:
Pi
pi
Where Pi is the estimated total population 15 years and over and pi is the sample population 15
years and over.
Department of Statistics 6
3. RELIABILITY OF DATA
The estimates in this report are based on information collected in the May 2019 sample survey
carried out in New Providence, Grand Bahama, Abaco, Berry Island and Inagua. These estimates
are prone to sampling errors and therefore are subjected to statistical tests, which help in
ascertaining the reliability of the data
The absolute value of the standard error and its value in relation to the magnitude of the statistics
(proportion in this instance) being estimated should be cited. For this purpose, the standard error
can be expressed as a proportion (percent) of the value being estimated. This is called the
relative error or coefficient of variation. Therefore, when using data, comparisons of the larger
estimates may be used with confidence but smaller estimates should be regarded with caution.
For instance, small differences from one period to another may be due only to sampling error.
For this reason, comparison of particular variables from one survey to another should be used
cautiously and should be regarded only as a guideline for ascertaining general trends.
This is an inevitable limitation of data obtained by sampling, and consequently, restricts the
detailed cross-classifications that can be attempted. Detailed cross-classification or detailed
information for very small areas can be best obtained from a Census.
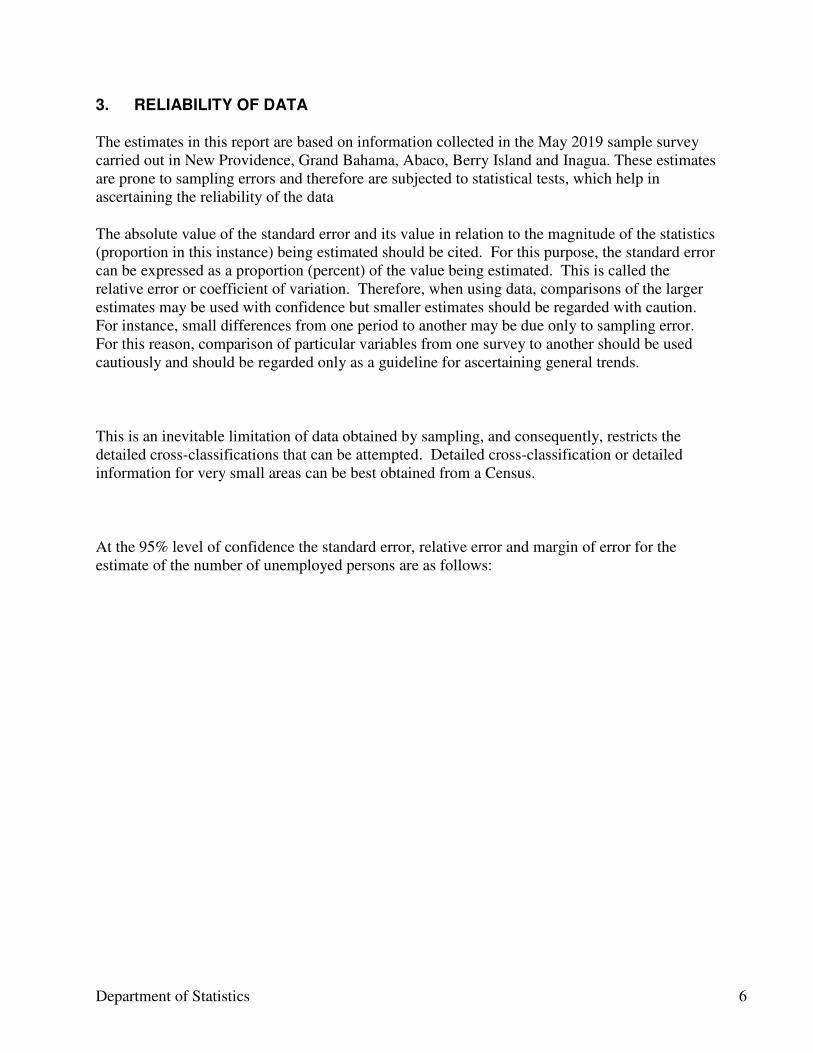
At the 95% level of confidence the standard error, relative error and margin of error for the
estimate of the number of unemployed persons are as follows:
Department of Statistics 7
IslandStandard
Error
Standard
DeviationVariance
Skewnes
s
Kurtosi
s
All Bahamas 0.0229152 1.679359 2.820246 0.9294313 2.96216
New Providence 0.0217457 1.678853 2.818546 1.077617 3.3158
Grand Bahama 0.0158397 1.705511 2.908766 0.9122614 2.81501
Abaco 0.0166475 1.650924 2.72555 0.4156972 0
Berry Island 0.0063482 1.752549 3.071429 -0.234068 1.42185
Inagua 0.0045095 0.816496 0.666667 0 2
Department of Statistics 8
60,000
80,000
100,000
120,000
140,000
160,000
180,000
200,000
220,000
240,000
260,000
NU
MB
ER
OF
PE
RS
ON
S
CHART I: TOTAL LABOUR FORCE:MAY 2013 - MAY 2019
YEARS
Department of Statistics 9
Department of Statistics 10
0.0
2.0
4.0
6.0
8.0
10.0
12.0
14.0
16.0
18.0
20.0
TOTAL
MEN
WOMEN
PE
RC
EN
TA
GE
CHART III: UNEMPLOYMENT RATES BY SEX:
MAY 2013- MAY 2019
Department of Statistics 11
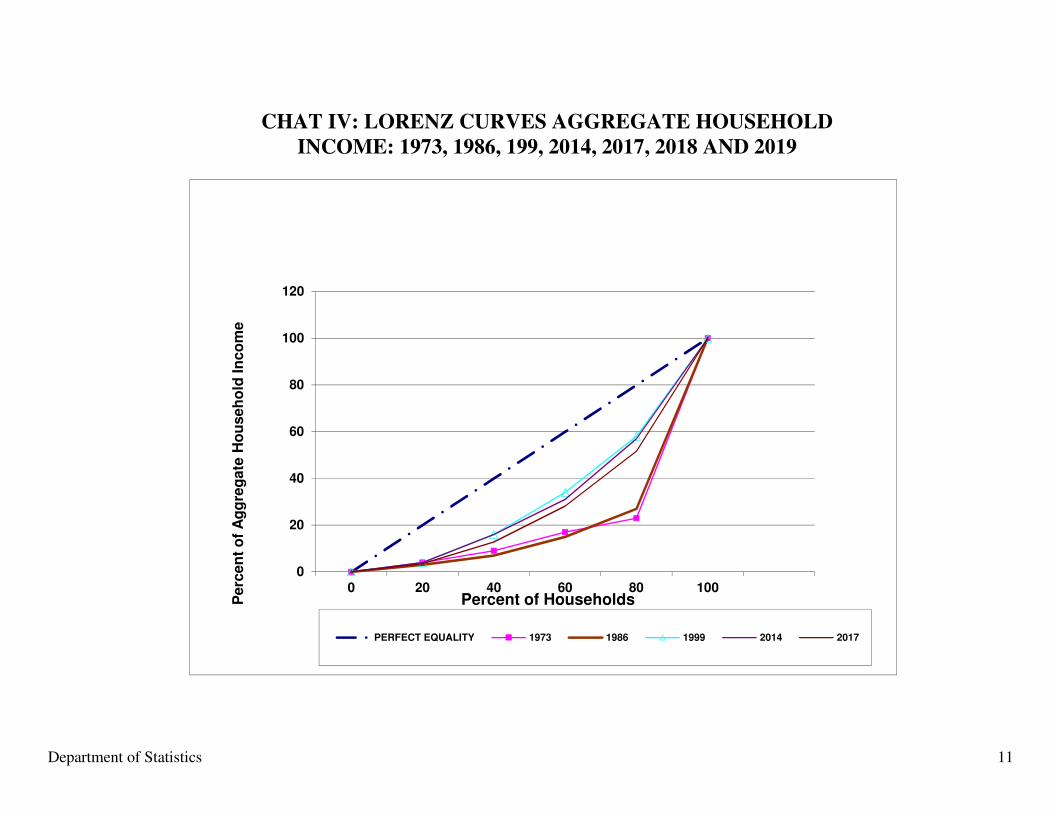
0
20
40
60
80
100
120
0 20 40 60 80 100
Perc
en
t o
f A
gg
reg
ate
Ho
useh
old
In
co
me
Percent of Households
PERFECT EQUALITY 1973 1986 1999 2014 2017
CHAT IV: LORENZ CURVES AGGREGATE HOUSEHOLD
INCOME: 1973, 1986, 199, 2014, 2017, 2018 AND 2019
Department of Statistics 12
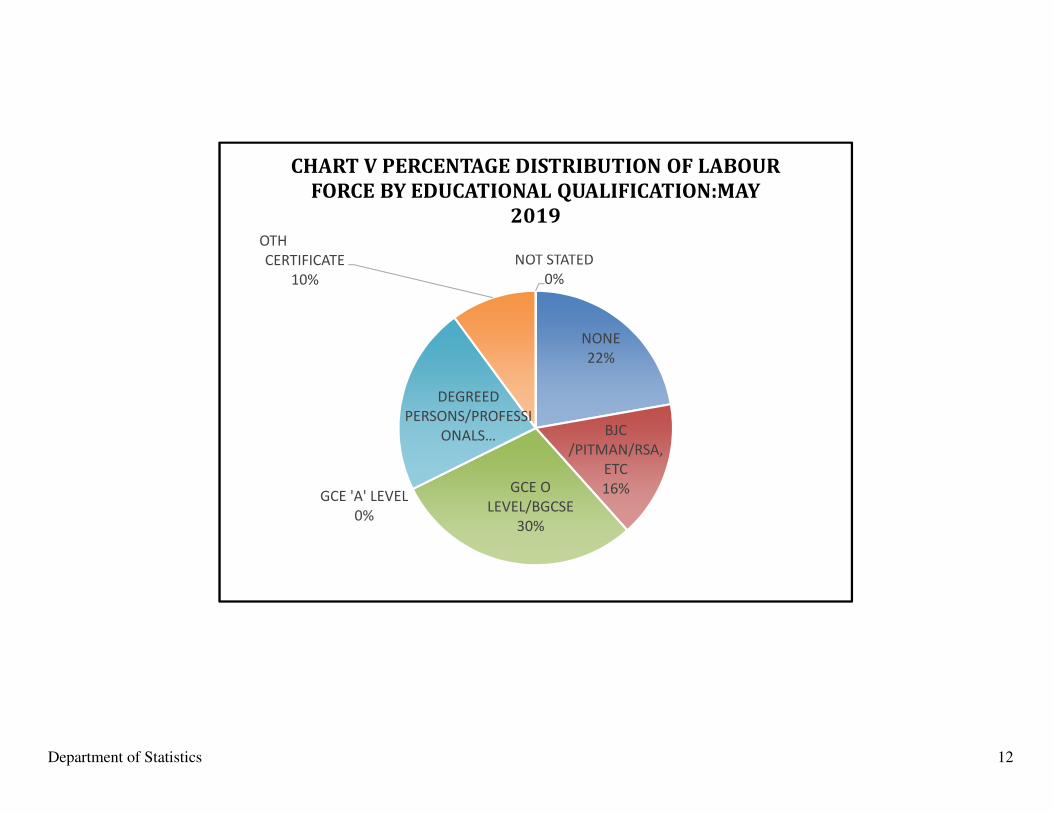
NONE
22%
BJC
/PITMAN/RSA,
ETC
16%GCE O
LEVEL/BGCSE
30%
GCE 'A' LEVEL
0%
DEGREED
PERSONS/PROFESSI
ONALS…
OTHER TRADE
CERTIFICATE
10%
NOT STATED
0%
CHART V PERCENTAGE DISTRIBUTION OF LABOUR
FORCE BY EDUCATIONAL QUALIFICATION:MAY
2019
Department of Statistics 13

Department of Statistics 14
Department of Statistics 15
Department of Statistics 16
Department of Statistics 17
TABLE I
ITEMS
ISLAND TOTAL FEMALE MALE TOTAL FEMALE MALE TOTAL FEMALE MALE TOTAL FEMALE MALE TOTAL FEMALE MALE
Total Labour Force
All Bahamas 208,895 103,290 105,605 212,195 103,940 108,255 215,880 104,815 111,065 217,750 106,420 111,330 222,035 106,890 115,145
New Providence 148,545 74,480 74,065 150,315 73,830 76,485 153,590 75,590 78,000 155,315 76,435 78,880 157,120 76,655 80,465
Grand Bahama 28,000 14,060 13,940 29,230 15,170 14,060 28,710 14,180 14,530 29,190 14,190 15,000 29,865 14,530 15,335
Abaco 10,360 4,405 5,955 10,660 4,595 6,065 11,465 5,145 6,320 11,700 5,145 6,555 12,110 5,385 6,725
Employed
Labour Force
All Bahamas 183,915 89,915 94,000 180,820 86,300 94,520 188,360 89,660 98,700 192,385 91,495 100,890 200,155 95,210 104,945
New Providence 130,750 64,760 65,990 126,430 60,430 66,000 133,365 64,100 69,265 135,350 64,350 71,000 140,740 67,730 73,010
Grand Bahama 24,400 12,050 12,350 25,090 12,660 12,430 24,500 11,785 12,715 25,300 12,180 13,120 26,160 12,335 13,825
Abaco 9,095 3,880 5,215 9,630 3,985 5,645 10,305 4,675 5,630 10,640 4,460 6,180 11,165 5,025 6,140
Unemployed
Labour Force
All Bahamas 24,980 13,375 11,605 31,375 17,640 13,735 27,520 15,155 12,365 25,365 14,925 10,440 21,880 11,680 10,200
New Providence 17,795 9,720 8,075 23,885 13,400 10,485 20,225 11,490 8,735 19,965 12,085 7,880 16,380 8,925 7,455
Grand Bahama 3,600 2,010 1,590 4,140 2,510 1,630 4,210 2,395 1,815 3,890 2,010 1,880 3,705 2,195 1,510
Abaco 1,265 525 740 1,030 610 420 1,160 470 690 1,060 685 375 945 360 585
Labour Force
Participation Rate
All Bahamas 73.0% 71.5% 78.5% 75.6% 71.9% 80.5% 76.9% 72.0% 81.2% 77.2% 74.2% 82.1% 80.0% 74.0% 83.1%
New Providence 74.5% 71.3% 76.4% 74.7% 70.7% 79.5% 75.9% 71.1% 80.3% 76.9% 72.3% 81.2% 75.9% 72.6% 79.0%
Grand Bahama 70.1% 66.5% 72.6% 72.5% 71.7% 73.3% 68.4% 66.6% 73.7% 68.2% 67.5% 74.9% 68.9% 64.1% 75.1%
Abaco 75.5% 63.8% 77.5% 77.3% 70.3% 84.0% 77.6% 70.8% 84.2% 77.8% 70.9% 84.7% 78.2% 71.4% 85.2%
Unemployment Rate
All Bahamas 12.0% 12.9% 11.0% 14.8% 17.0% 12.7% 12.7% 14.5% 11.1% 11.6% 14.0% 9.4% 9.9% 10.9% 8.0%
New Providence 12.0% 13.1% 10.9% 15.9% 18.1% 13.7% 13.2% 15.2% 11.2% 12.9% 15.8% 10.0% 10.4% 11.6% 9.3%
Grand Bahama 12.9% 14.3% 11.4% 14.2% 16.5% 11.6% 14.7% 16.9% 12.5% 13.3% 14.2% 12.5% 12.4% 15.1% 9.8%
Abaco 12.2% 11.9% 12.4% 9.7% 13.3% 6.9% 10.1% 9.1% 10.9% 9.1% 13.3% 5.7% 7.8% 6.7% 8.7%
May-15 Nov-15 May-16
THE LABOUR FORCE AND ITS COMPONENTS: 2015- 2019
May-17Nov-16
Department of Statistics 18
THE LABOUR FORCE AND ITS COMPONENTS MAY 2015- MAY 2019
TABLE I (Cont'd)
ITEMS
ISLAND TOTAL FEMALE MALE TOTAL FEMALE MALE TOTAL FEMALE MALE TOTAL FEMALE MALE
Total Labour Force
All Bahamas 226,680 109,135 117,545 231,445 111,540 119,905 235,695 113,100 122,595 237,525 113,960 123,565
New Providence 159,110 77,695 81,415 161,330 78,865 82,465 163,625 79,110 84,515 164,740 79,500 85,240
Grand Bahama 30,975 15,150 15,825 31,920 15,685 16,235 32,710 16,360 16,350 32,825 16,805 16,020
Abaco 13,255 5,570 7,685 13,645 5,800 7,845 14,255 6,235 8,020 14,620 6,230 8,390
Employed
Labour Force
All Bahamas 203,730 97,005 106,725 208,255 100,440 107,815 210,560 100,280 110,280 214,890 102,730 112,160
New Providence 142,285 68,525 73,760 145,205 71,165 74,040 145,690 69,840 75,850 149,300 71,390 77,910
Grand Bahama 27,240 13,235 14,005 27,965 14,015 13,950 28,810 14,560 14,250 29,235 15,395 13,840
Abaco 12,115 5,125 6,990 12,180 5,015 7,165 13,155 5,635 7,520 13,265 5,615 7,650
Unemployed
Labour Force
All Bahamas 22,950 12,130 10,820 23,190 11,100 12,090 25,135 12,820 12,315 22,635 11,230 11,405
New Providence 16,825 9,170 7,655 16,125 7,700 8,425 17,935 9,270 8,665 15,440 8,110 7,330
Grand Bahama 3,735 1,915 1,820 3,955 1,670 2,285 3,900 1,800 2,100 3,590 1,410 2,180
Abaco 1,140 445 695 1,465 785 680 1,100 600 500 1,355 615 740
Labour Force
Participation Rate
All Bahamas 81.0% 75.3% 84.2% 82.5% 76.1% 85.0% 83.1% 77.3% 85.9% 82.9% 76.8% 85.9%
New Providence 76.4% 73.2% 79.7% 76.3% 73.9% 80.2% 77.5% 74.5% 80.7% 77.9% 74.7% 80.9%
Grand Bahama 69.3% 64.7% 75.5% 69.5% 65.1% 75.6% 70.4% 66.5% 75.9% 70.7% 66.9% 70.1%
Abaco 78.5% 71.8% 85.9% 78.9% 72.1% 86.2% 79.2% 73.1% 75.3% 79.9% 72.8% 78.2%
Unemployment Rate
All Bahamas 10.1% 11.1% 9.2% 10.0% 10.0% 10.1% 10.7% 11.3% 10.0% 9.5% 9.9% 9.2%
New Providence 10.6% 11.8% 9.4% 10.0% 9.8% 10.2% 11.0% 11.7% 10.3% 9.4% 10.2% 8.6%
Grand Bahama 12.1% 12.6% 11.5% 12.4% 10.6% 14.1% 11.9% 11.0% 12.8% 10.9% 8.4% 13.6%
Abaco 8.6% 8.0% 9.0% 10.7% 13.5% 8.7% 7.7% 9.6% 6.2% 9.3% 9.9% 8.8%
May-19Nov-17 May-18 Nov-18
Department of Statistics 19
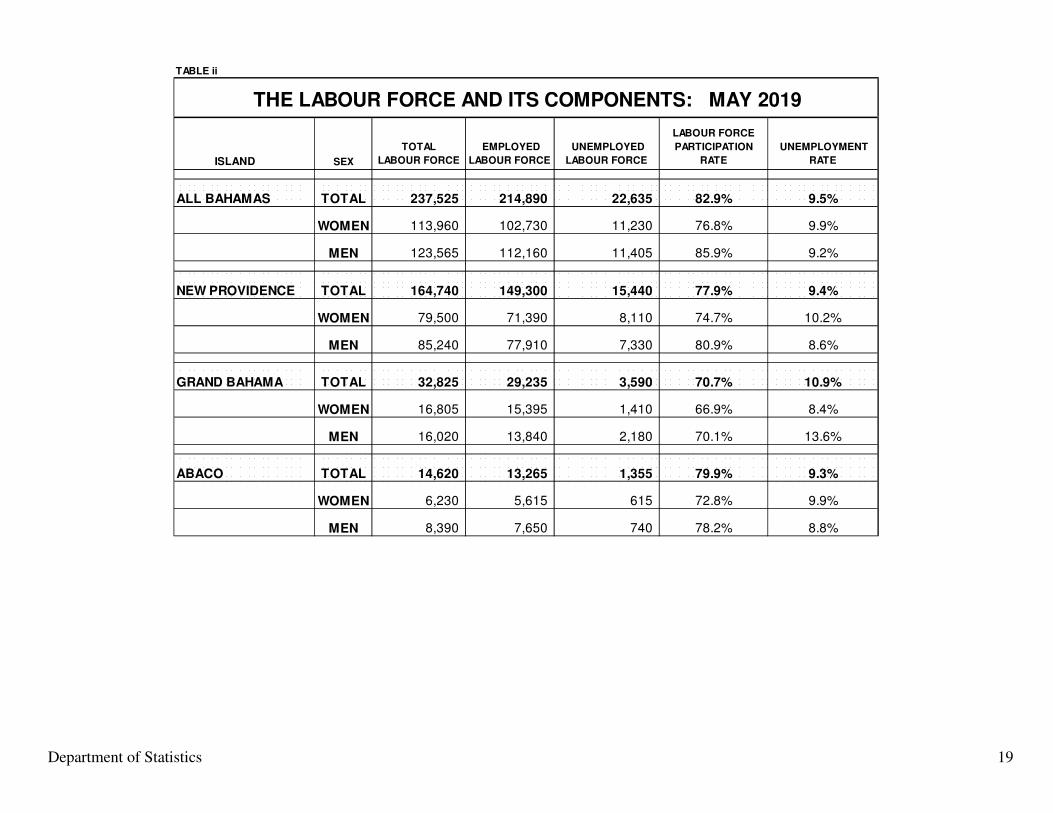
TABLE ii
THE LABOUR FORCE AND ITS COMPONENTS: MAY 2019
ISLAND SEX
TOTAL
LABOUR FORCE
EMPLOYED
LABOUR FORCE
UNEMPLOYED
LABOUR FORCE
LABOUR FORCE
PARTICIPATION
RATE
UNEMPLOYMENT
RATE
ALL BAHAMAS TOTAL 237,525 214,890 22,635 82.9% 9.5%
WOMEN 113,960 102,730 11,230 76.8% 9.9%
MEN 123,565 112,160 11,405 85.9% 9.2%
NEW PROVIDENCE TOTAL 164,740 149,300 15,440 77.9% 9.4%
WOMEN 79,500 71,390 8,110 74.7% 10.2%
MEN 85,240 77,910 7,330 80.9% 8.6%
GRAND BAHAMA TOTAL 32,825 29,235 3,590 70.7% 10.9%
WOMEN 16,805 15,395 1,410 66.9% 8.4%
MEN 16,020 13,840 2,180 70.1% 13.6%
ABACO TOTAL 14,620 13,265 1,355 79.9% 9.3%
WOMEN 6,230 5,615 615 72.8% 9.9%
MEN 8,390 7,650 740 78.2% 8.8%
Department of Statistics 20
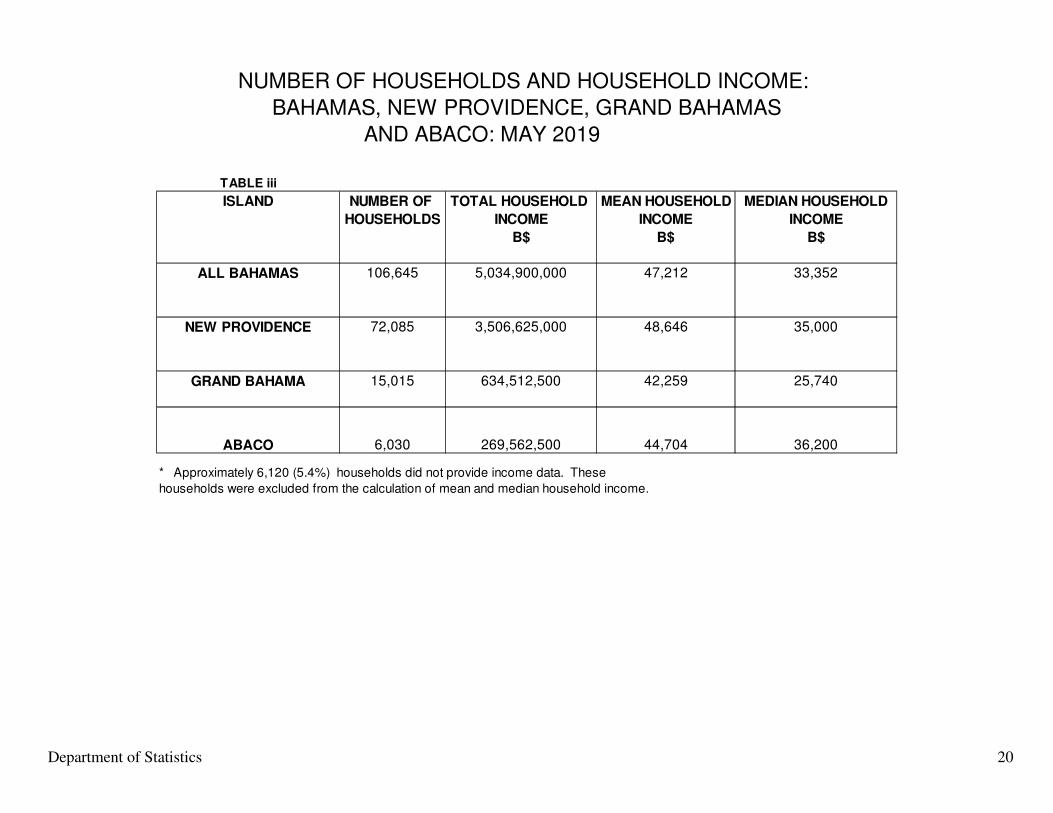
NUMBER OF HOUSEHOLDS AND HOUSEHOLD INCOME:
AND ABACO: MAY 2019
TABLE iii
ISLAND NUMBER OF TOTAL HOUSEHOLD MEAN HOUSEHOLD MEDIAN HOUSEHOLD
HOUSEHOLDS INCOME INCOME INCOME
B$ B$ B$
ALL BAHAMAS 106,645 5,034,900,000 47,212 33,352
NEW PROVIDENCE 72,085 3,506,625,000 48,646 35,000
GRAND BAHAMA 15,015 634,512,500 42,259 25,740
ABACO 6,030 269,562,500 44,704 36,200
* Approximately 6,120 (5.4%) households did not provide income data. These
households were excluded from the calculation of mean and median household income.
BAHAMAS, NEW PROVIDENCE, GRAND BAHAMAS
Department of Statistics 21
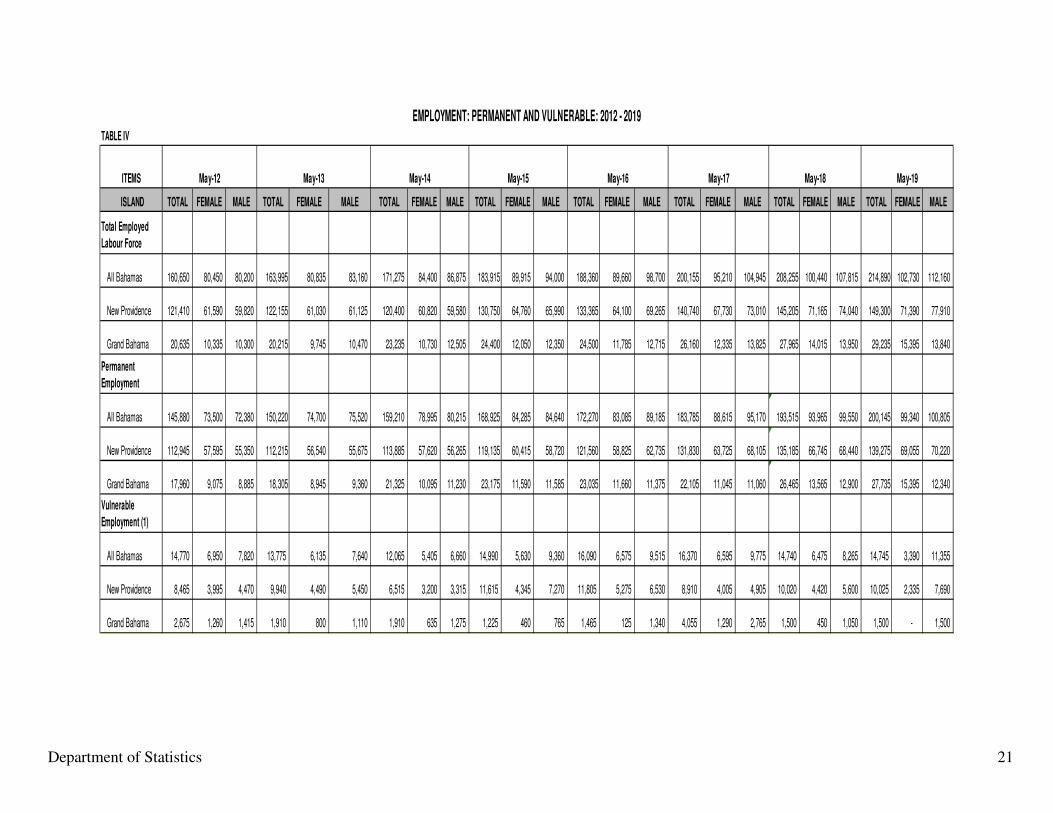
TABLE IV
ITEMS
ISLAND TOTAL FEMALE MALE TOTAL FEMALE MALE TOTAL FEMALE MALE TOTAL FEMALE MALE TOTAL FEMALE MALE TOTAL FEMALE MALE TOTAL FEMALE MALE TOTAL FEMALE MALE
Total Employed
Labour Force
All Bahamas 160,650 80,450 80,200 163,995 80,835 83,160 171,275 84,400 86,875 183,915 89,915 94,000 188,360 89,660 98,700 200,155 95,210 104,945 208,255 100,440 107,815 214,890 102,730 112,160
New Providence 121,410 61,590 59,820 122,155 61,030 61,125 120,400 60,820 59,580 130,750 64,760 65,990 133,365 64,100 69,265 140,740 67,730 73,010 145,205 71,165 74,040 149,300 71,390 77,910
Grand Bahama 20,635 10,335 10,300 20,215 9,745 10,470 23,235 10,730 12,505 24,400 12,050 12,350 24,500 11,785 12,715 26,160 12,335 13,825 27,965 14,015 13,950 29,235 15,395 13,840
Permanent
Employment
All Bahamas 145,880 73,500 72,380 150,220 74,700 75,520 159,210 78,995 80,215 168,925 84,285 84,640 172,270 83,085 89,185 183,785 88,615 95,170 193,515 93,965 99,550 200,145 99,340 100,805
New Providence 112,945 57,595 55,350 112,215 56,540 55,675 113,885 57,620 56,265 119,135 60,415 58,720 121,560 58,825 62,735 131,830 63,725 68,105 135,185 66,745 68,440 139,275 69,055 70,220
Grand Bahama 17,960 9,075 8,885 18,305 8,945 9,360 21,325 10,095 11,230 23,175 11,590 11,585 23,035 11,660 11,375 22,105 11,045 11,060 26,465 13,565 12,900 27,735 15,395 12,340
Vulnerable
Employment (1)
All Bahamas 14,770 6,950 7,820 13,775 6,135 7,640 12,065 5,405 6,660 14,990 5,630 9,360 16,090 6,575 9,515 16,370 6,595 9,775 14,740 6,475 8,265 14,745 3,390 11,355
New Providence 8,465 3,995 4,470 9,940 4,490 5,450 6,515 3,200 3,315 11,615 4,345 7,270 11,805 5,275 6,530 8,910 4,005 4,905 10,020 4,420 5,600 10,025 2,335 7,690
Grand Bahama 2,675 1,260 1,415 1,910 800 1,110 1,910 635 1,275 1,225 460 765 1,465 125 1,340 4,055 1,290 2,765 1,500 450 1,050 1,500 - 1,500
May-19
EMPLOYMENT: PERMANENT AND VULNERABLE: 2012 - 2019
May-17May-16May-15May-12 May-13 May-14 May-18
Department of Statistics
SECTION I –LABOUR FORCE CHARACTERISTICS
Department of Statistics 23
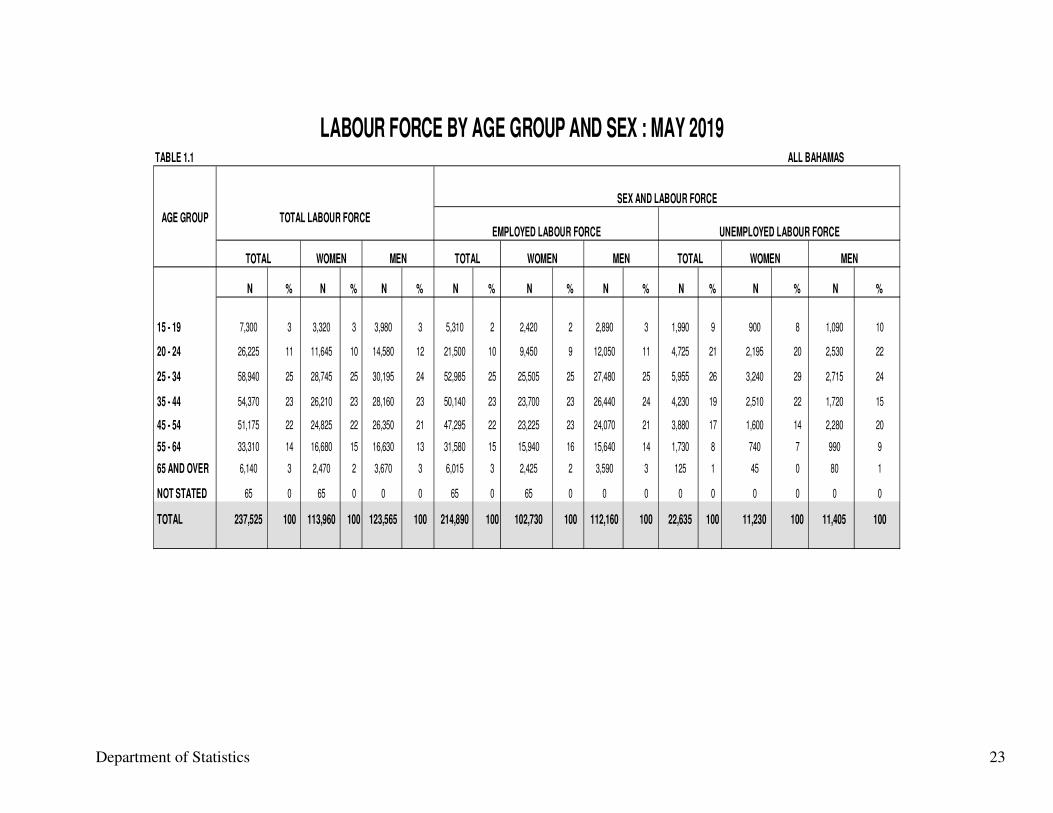
TABLE 1.1 ALL BAHAMAS
AGE GROUP
N % N % N % N % N % N % N % N % N %
15 - 19 7,300 3 3,320 3 3,980 3 5,310 2 2,420 2 2,890 3 1,990 9 900 8 1,090 10
20 - 24 26,225 11 11,645 10 14,580 12 21,500 10 9,450 9 12,050 11 4,725 21 2,195 20 2,530 22
25 - 34 58,940 25 28,745 25 30,195 24 52,985 25 25,505 25 27,480 25 5,955 26 3,240 29 2,715 24
35 - 44 54,370 23 26,210 23 28,160 23 50,140 23 23,700 23 26,440 24 4,230 19 2,510 22 1,720 15
45 - 54 51,175 22 24,825 22 26,350 21 47,295 22 23,225 23 24,070 21 3,880 17 1,600 14 2,280 20
55 - 64 33,310 14 16,680 15 16,630 13 31,580 15 15,940 16 15,640 14 1,730 8 740 7 990 9
65 AND OVER 6,140 3 2,470 2 3,670 3 6,015 3 2,425 2 3,590 3 125 1 45 0 80 1
NOT STATED 65 0 65 0 0 0 65 0 65 0 0 0 0 0 0 0 0 0
TOTAL 237,525 100 113,960 100 123,565 100 214,890 100 102,730 100 112,160 100 22,635 100 11,230 100 11,405 100
TOTAL WOMEN MEN
LABOUR FORCE BY AGE GROUP AND SEX : MAY 2019
SEX AND LABOUR FORCE
TOTAL LABOUR FORCEEMPLOYED LABOUR FORCE UNEMPLOYED LABOUR FORCE
TOTAL WOMEN MEN TOTAL WOMEN MEN
Department of Statistics 24
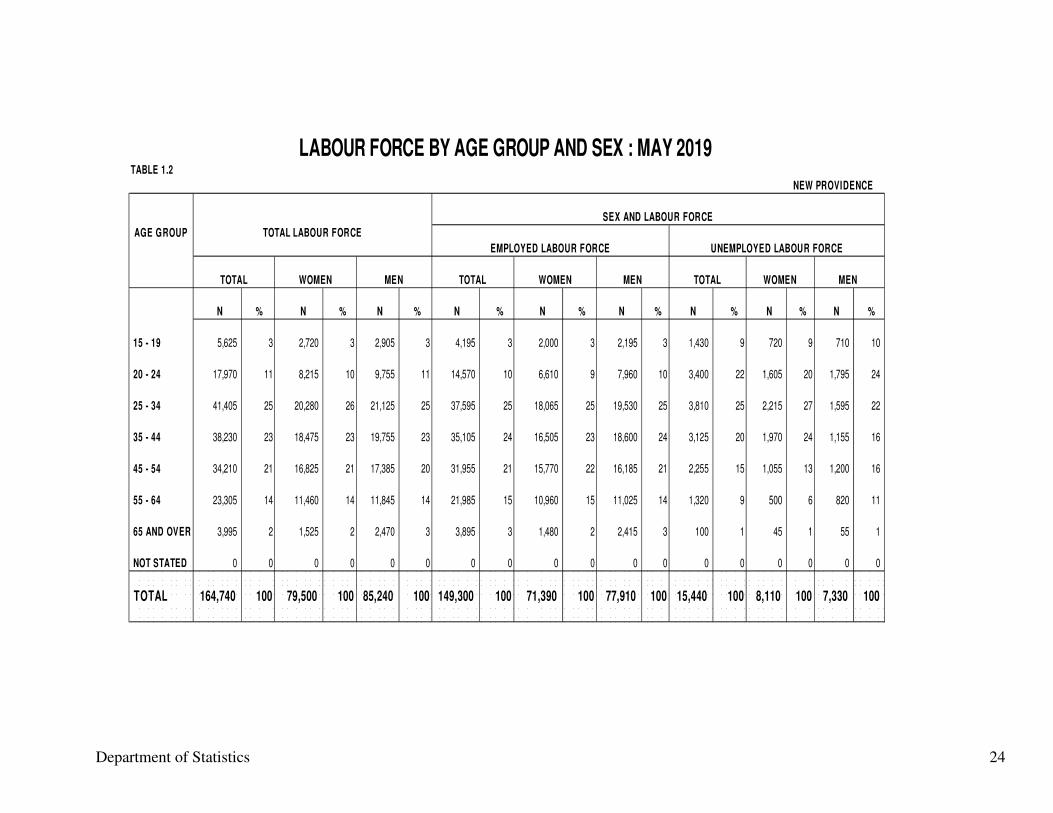
TABLE 1.2
NEW PROVIDENCE
SEX AND LABOUR FORCE
AGE GROUP TOTAL LABOUR FORCE
EMPLOYED LABOUR FORCE UNEMPLOYED LABOUR FORCE
TOTAL WOMEN MEN TOTAL WOMEN MEN TOTAL WOMEN MEN
N % N % N % N % N % N % N % N % N %
15 - 19 5,625 3 2,720 3 2,905 3 4,195 3 2,000 3 2,195 3 1,430 9 720 9 710 10
20 - 24 17,970 11 8,215 10 9,755 11 14,570 10 6,610 9 7,960 10 3,400 22 1,605 20 1,795 24
25 - 34 41,405 25 20,280 26 21,125 25 37,595 25 18,065 25 19,530 25 3,810 25 2,215 27 1,595 22
35 - 44 38,230 23 18,475 23 19,755 23 35,105 24 16,505 23 18,600 24 3,125 20 1,970 24 1,155 16
45 - 54 34,210 21 16,825 21 17,385 20 31,955 21 15,770 22 16,185 21 2,255 15 1,055 13 1,200 16
55 - 64 23,305 14 11,460 14 11,845 14 21,985 15 10,960 15 11,025 14 1,320 9 500 6 820 11
65 AND OVER 3,995 2 1,525 2 2,470 3 3,895 3 1,480 2 2,415 3 100 1 45 1 55 1
NOT STATED 0 0 0 0 0 0 0 0 0 0 0 0 0 0 0 0 0 0
TOTAL 164,740 100 79,500 100 85,240 100 149,300 100 71,390 100 77,910 100 15,440 100 8,110 100 7,330 100
LABOUR FORCE BY AGE GROUP AND SEX : MAY 2019
Department of Statistics 25
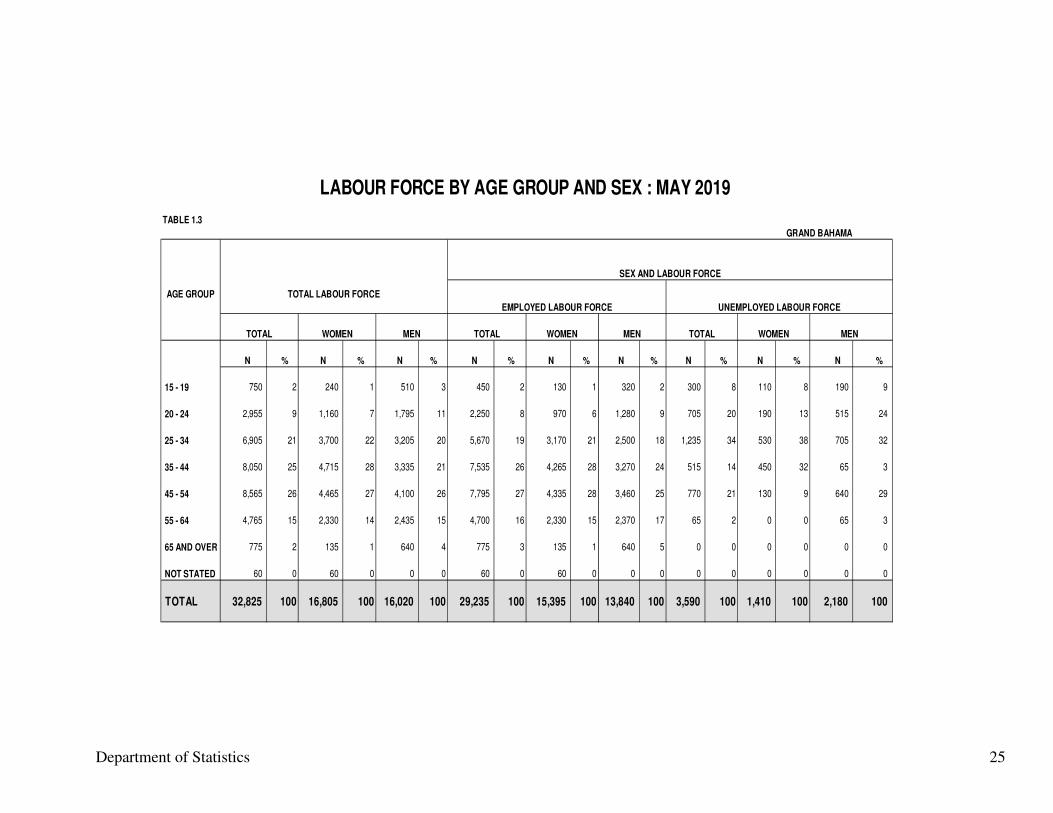
TABLE 1.3
GRAND BAHAMA
AGE GROUP
N % N % N % N % N % N % N % N % N %
15 - 19 750 2 240 1 510 3 450 2 130 1 320 2 300 8 110 8 190 9
20 - 24 2,955 9 1,160 7 1,795 11 2,250 8 970 6 1,280 9 705 20 190 13 515 24
25 - 34 6,905 21 3,700 22 3,205 20 5,670 19 3,170 21 2,500 18 1,235 34 530 38 705 32
35 - 44 8,050 25 4,715 28 3,335 21 7,535 26 4,265 28 3,270 24 515 14 450 32 65 3
45 - 54 8,565 26 4,465 27 4,100 26 7,795 27 4,335 28 3,460 25 770 21 130 9 640 29
55 - 64 4,765 15 2,330 14 2,435 15 4,700 16 2,330 15 2,370 17 65 2 0 0 65 3
65 AND OVER 775 2 135 1 640 4 775 3 135 1 640 5 0 0 0 0 0 0
NOT STATED 60 0 60 0 0 0 60 0 60 0 0 0 0 0 0 0 0 0
TOTAL 32,825 100 16,805 100 16,020 100 29,235 100 15,395 100 13,840 100 3,590 100 1,410 100 2,180 100
MEN TOTAL WOMEN MEN
LABOUR FORCE BY AGE GROUP AND SEX : MAY 2019
SEX AND LABOUR FORCE
TOTAL LABOUR FORCE
EMPLOYED LABOUR FORCE UNEMPLOYED LABOUR FORCE
TOTAL WOMEN MEN TOTAL WOMEN
Department of Statistics 26
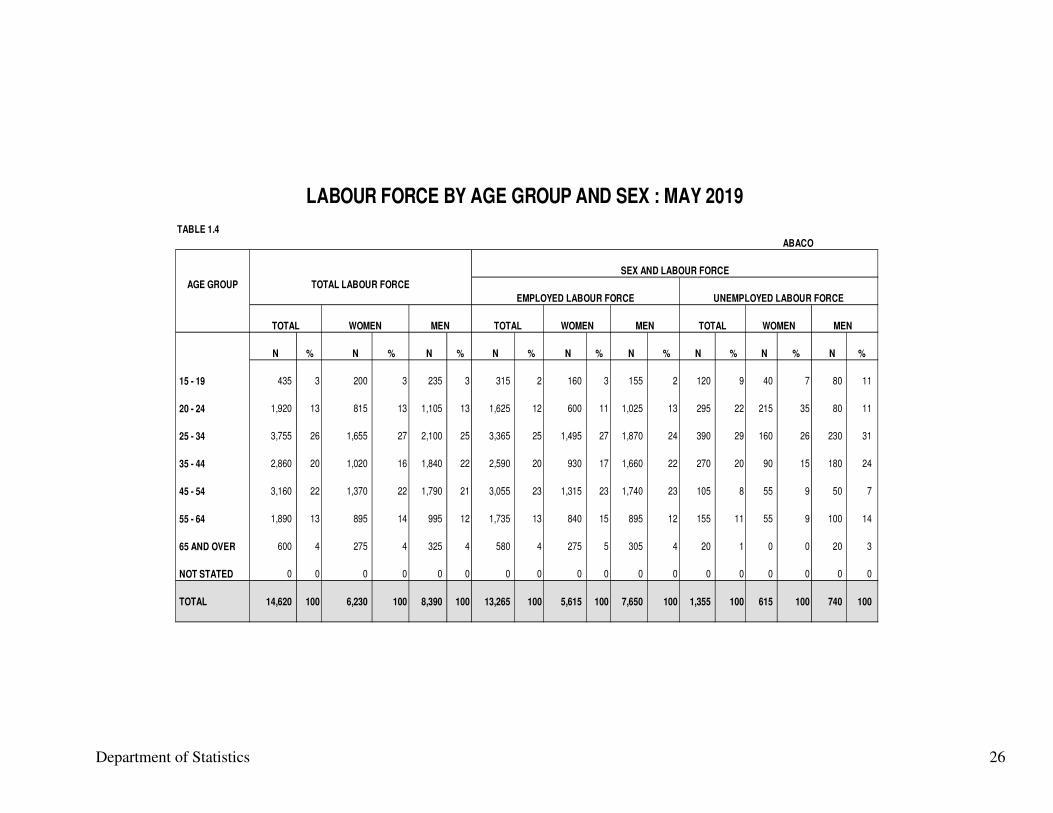
TABLE 1.4
ABACO
AGE GROUP
N % N % N % N % N % N % N % N % N %
15 - 19 435 3 200 3 235 3 315 2 160 3 155 2 120 9 40 7 80 11
20 - 24 1,920 13 815 13 1,105 13 1,625 12 600 11 1,025 13 295 22 215 35 80 11
25 - 34 3,755 26 1,655 27 2,100 25 3,365 25 1,495 27 1,870 24 390 29 160 26 230 31
35 - 44 2,860 20 1,020 16 1,840 22 2,590 20 930 17 1,660 22 270 20 90 15 180 24
45 - 54 3,160 22 1,370 22 1,790 21 3,055 23 1,315 23 1,740 23 105 8 55 9 50 7
55 - 64 1,890 13 895 14 995 12 1,735 13 840 15 895 12 155 11 55 9 100 14
65 AND OVER 600 4 275 4 325 4 580 4 275 5 305 4 20 1 0 0 20 3
NOT STATED 0 0 0 0 0 0 0 0 0 0 0 0 0 0 0 0 0 0
TOTAL 14,620 100 6,230 100 8,390 100 13,265 100 5,615 100 7,650 100 1,355 100 615 100 740 100
MEN TOTAL WOMEN MEN
LABOUR FORCE BY AGE GROUP AND SEX : MAY 2019
SEX AND LABOUR FORCE
TOTAL LABOUR FORCE
EMPLOYED LABOUR FORCE UNEMPLOYED LABOUR FORCE
TOTAL WOMEN MEN TOTAL WOMEN
Department of Statistics 27
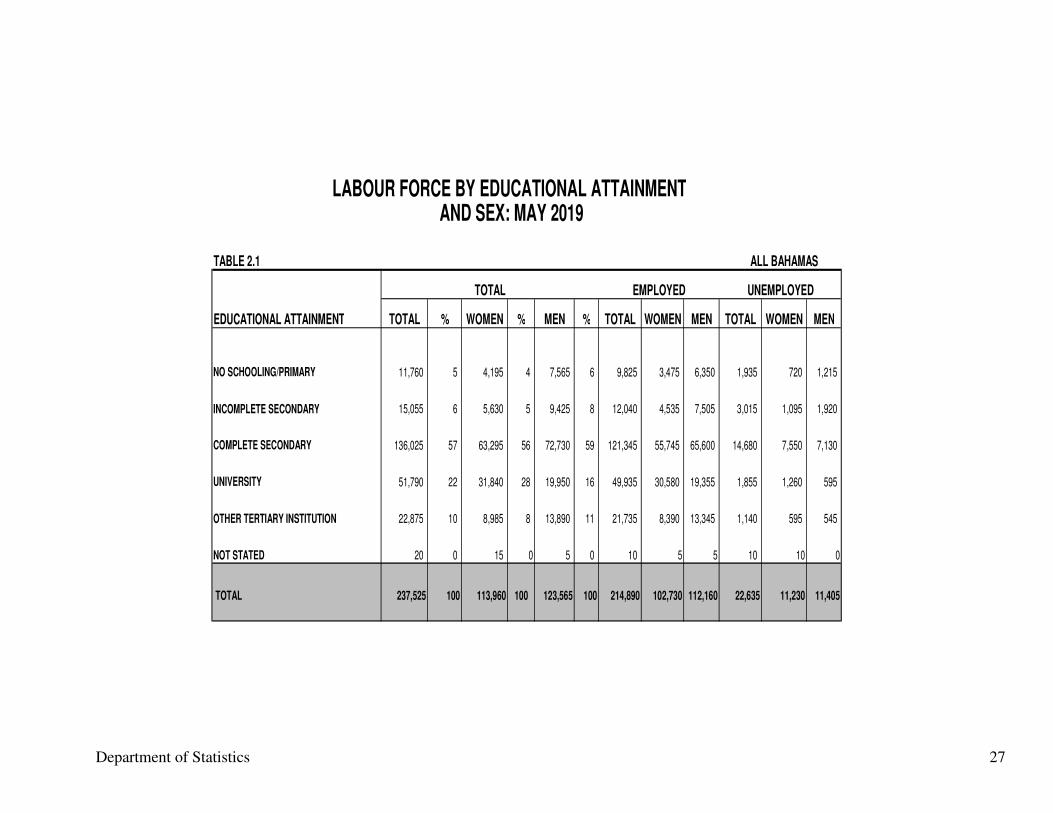
TABLE 2.1 ALL BAHAMAS
EDUCATIONAL ATTAINMENT TOTAL % WOMEN % MEN % TOTAL WOMEN MEN TOTAL WOMEN MEN
NO SCHOOLING/PRIMARY 11,760 5 4,195 4 7,565 6 9,825 3,475 6,350 1,935 720 1,215
INCOMPLETE SECONDARY 15,055 6 5,630 5 9,425 8 12,040 4,535 7,505 3,015 1,095 1,920
COMPLETE SECONDARY 136,025 57 63,295 56 72,730 59 121,345 55,745 65,600 14,680 7,550 7,130
UNIVERSITY 51,790 22 31,840 28 19,950 16 49,935 30,580 19,355 1,855 1,260 595
OTHER TERTIARY INSTITUTION 22,875 10 8,985 8 13,890 11 21,735 8,390 13,345 1,140 595 545
NOT STATED 20 0 15 0 5 0 10 5 5 10 10 0
TOTAL 237,525 100 113,960 100 123,565 100 214,890 102,730 112,160 22,635 11,230 11,405
LABOUR FORCE BY EDUCATIONAL ATTAINMENT AND SEX: MAY 2019
TOTAL EMPLOYED UNEMPLOYED
Department of Statistics 28
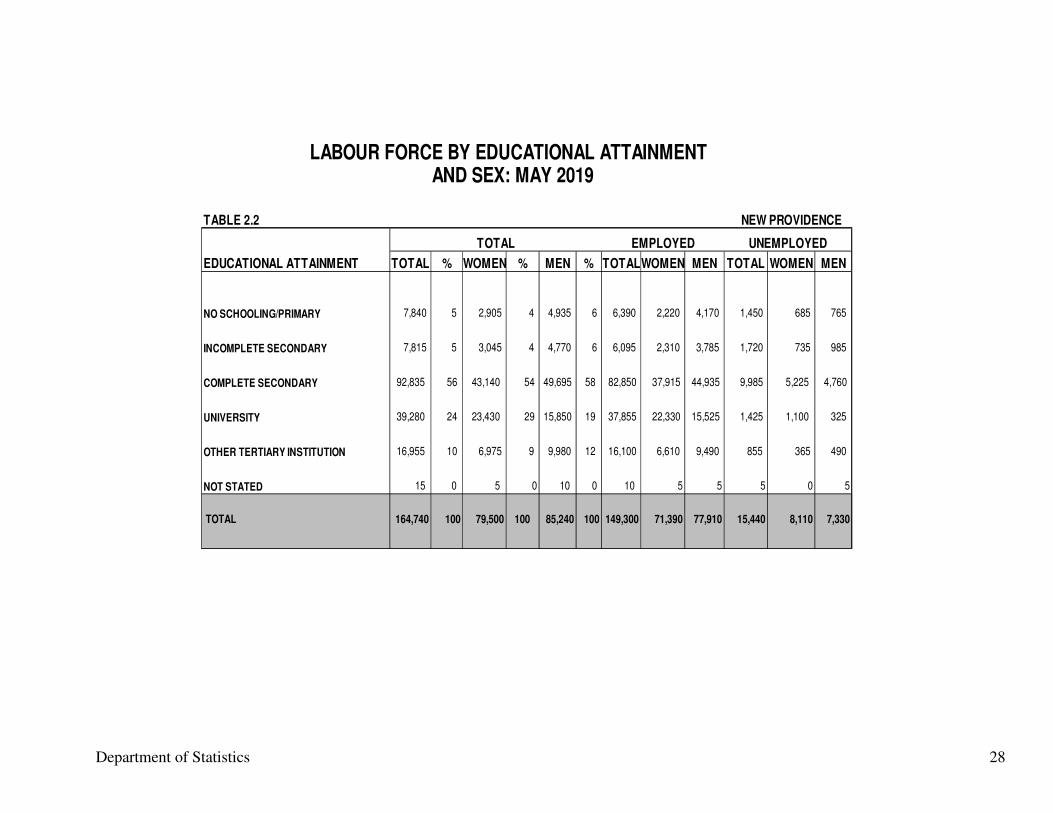
TABLE 2.2 NEW PROVIDENCE
EDUCATIONAL ATTAINMENT TOTAL % WOMEN % MEN % TOTALWOMEN MEN TOTAL WOMEN MEN
NO SCHOOLING/PRIMARY 7,840 5 2,905 4 4,935 6 6,390 2,220 4,170 1,450 685 765
INCOMPLETE SECONDARY 7,815 5 3,045 4 4,770 6 6,095 2,310 3,785 1,720 735 985
COMPLETE SECONDARY 92,835 56 43,140 54 49,695 58 82,850 37,915 44,935 9,985 5,225 4,760
UNIVERSITY 39,280 24 23,430 29 15,850 19 37,855 22,330 15,525 1,425 1,100 325
OTHER TERTIARY INSTITUTION 16,955 10 6,975 9 9,980 12 16,100 6,610 9,490 855 365 490
NOT STATED 15 0 5 0 10 0 10 5 5 5 0 5
TOTAL 164,740 100 79,500 100 85,240 100 149,300 71,390 77,910 15,440 8,110 7,330
LABOUR FORCE BY EDUCATIONAL ATTAINMENT AND SEX: MAY 2019
TOTAL EMPLOYED UNEMPLOYED
Department of Statistics 29
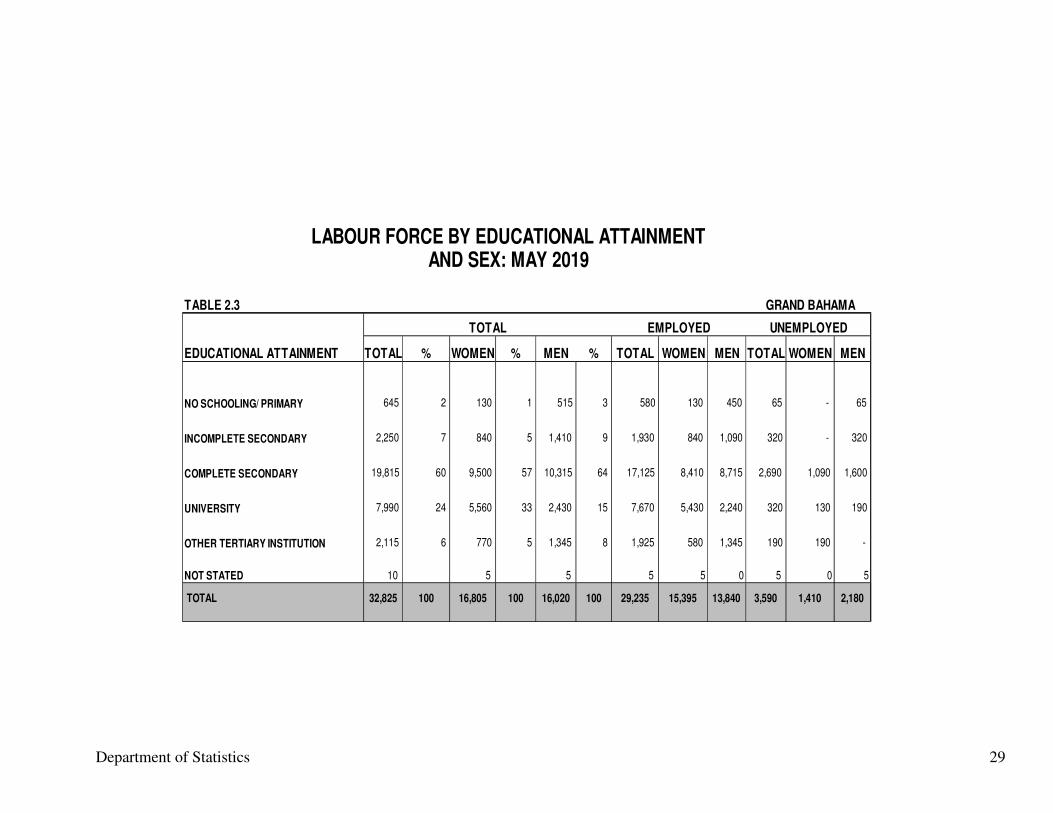
TABLE 2.3 GRAND BAHAMA
EDUCATIONAL ATTAINMENT TOTAL % WOMEN % MEN % TOTAL WOMEN MEN TOTAL WOMEN MEN
NO SCHOOLING/ PRIMARY 645 2 130 1 515 3 580 130 450 65 - 65
INCOMPLETE SECONDARY 2,250 7 840 5 1,410 9 1,930 840 1,090 320 - 320
COMPLETE SECONDARY 19,815 60 9,500 57 10,315 64 17,125 8,410 8,715 2,690 1,090 1,600
UNIVERSITY 7,990 24 5,560 33 2,430 15 7,670 5,430 2,240 320 130 190
OTHER TERTIARY INSTITUTION 2,115 6 770 5 1,345 8 1,925 580 1,345 190 190 -
NOT STATED 10 5 5 5 5 0 5 0 5
TOTAL 32,825 100 16,805 100 16,020 100 29,235 15,395 13,840 3,590 1,410 2,180
LABOUR FORCE BY EDUCATIONAL ATTAINMENTAND SEX: MAY 2019
TOTAL EMPLOYED UNEMPLOYED
Department of Statistics 30
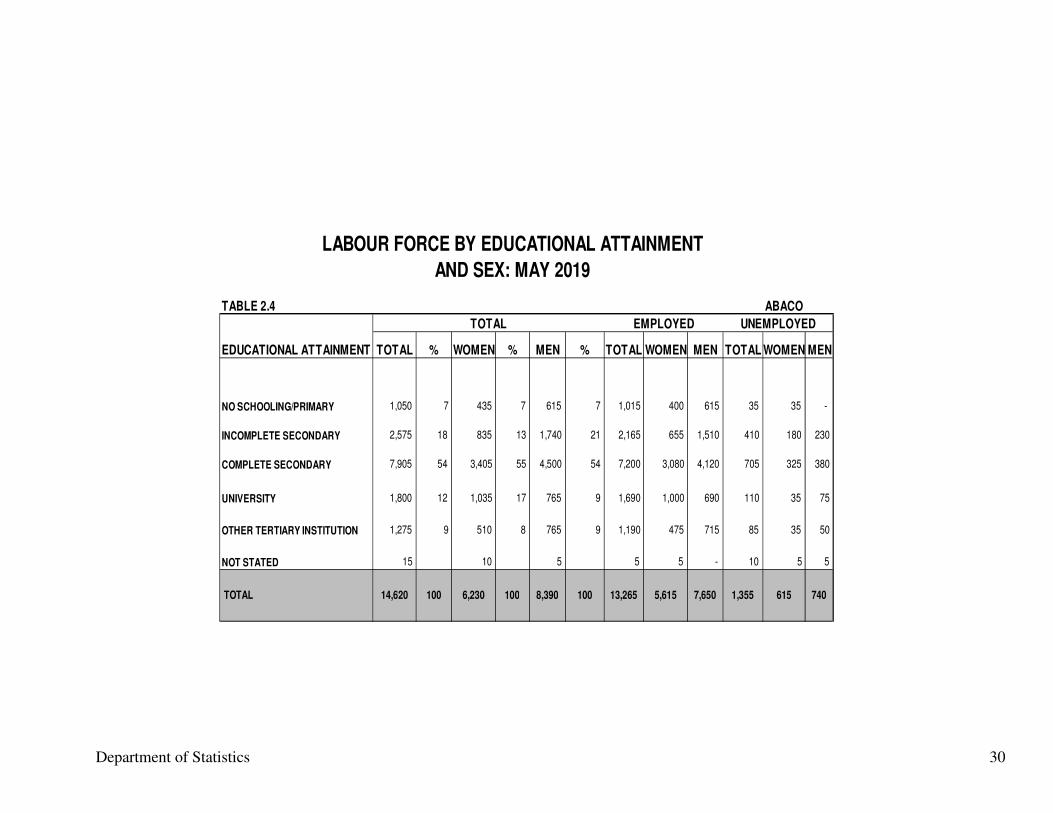
TABLE 2.4 ABACO
EDUCATIONAL ATTAINMENT TOTAL % WOMEN % MEN % TOTAL WOMEN MEN TOTAL WOMEN MEN
NO SCHOOLING/PRIMARY 1,050 7 435 7 615 7 1,015 400 615 35 35 -
INCOMPLETE SECONDARY 2,575 18 835 13 1,740 21 2,165 655 1,510 410 180 230
COMPLETE SECONDARY 7,905 54 3,405 55 4,500 54 7,200 3,080 4,120 705 325 380
UNIVERSITY 1,800 12 1,035 17 765 9 1,690 1,000 690 110 35 75
OTHER TERTIARY INSTITUTION 1,275 9 510 8 765 9 1,190 475 715 85 35 50
NOT STATED 15 10 5 5 5 - 10 5 5
TOTAL 14,620 100 6,230 100 8,390 100 13,265 5,615 7,650 1,355 615 740
LABOUR FORCE BY EDUCATIONAL ATTAINMENT
AND SEX: MAY 2019
TOTAL EMPLOYED UNEMPLOYED
Department of Statistics 31
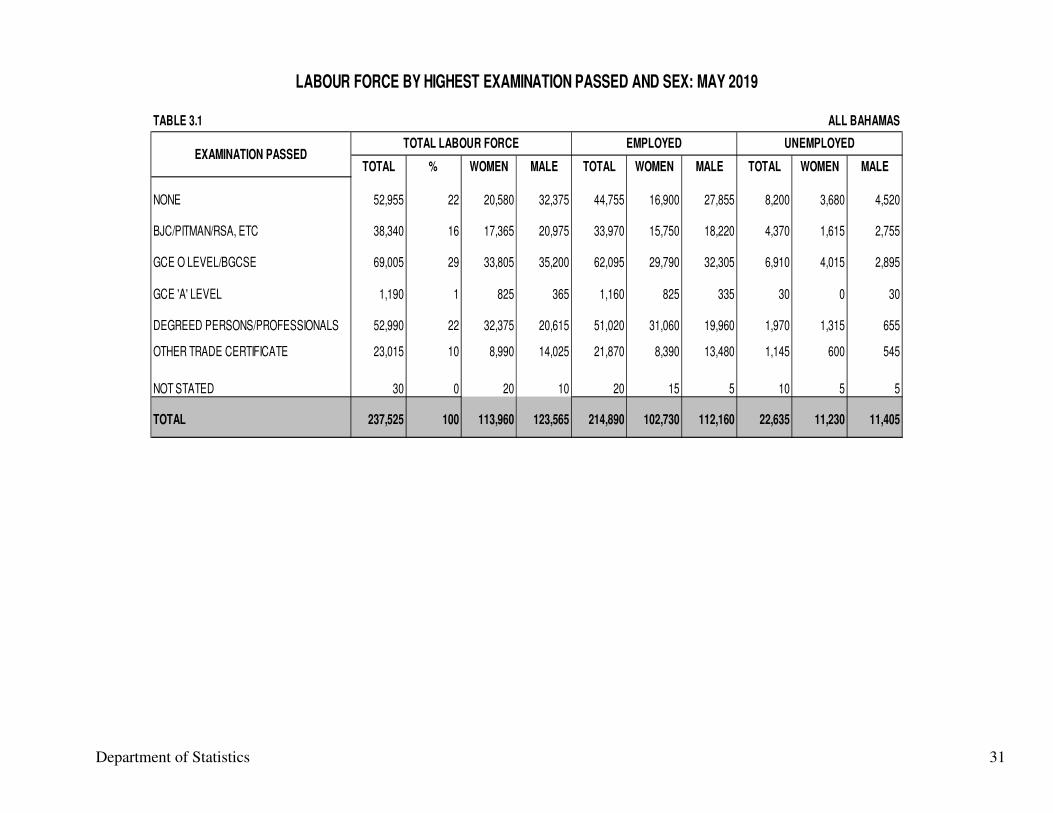
TABLE 3.1
TOTAL % WOMEN MALE TOTAL WOMEN MALE TOTAL WOMEN MALE
NONE 52,955 22 20,580 32,375 44,755 16,900 27,855 8,200 3,680 4,520
BJC/PITMAN/RSA, ETC 38,340 16 17,365 20,975 33,970 15,750 18,220 4,370 1,615 2,755
GCE O LEVEL/BGCSE 69,005 29 33,805 35,200 62,095 29,790 32,305 6,910 4,015 2,895
GCE 'A' LEVEL 1,190 1 825 365 1,160 825 335 30 0 30
DEGREED PERSONS/PROFESSIONALS 52,990 22 32,375 20,615 51,020 31,060 19,960 1,970 1,315 655
OTHER TRADE CERTIFICATE 23,015 10 8,990 14,025 21,870 8,390 13,480 1,145 600 545
NOT STATED 30 0 20 10 20 15 5 10 5 5
TOTAL 237,525 100 113,960 123,565 214,890 102,730 112,160 22,635 11,230 11,405
LABOUR FORCE BY HIGHEST EXAMINATION PASSED AND SEX: MAY 2019
ALL BAHAMAS
EXAMINATION PASSEDTOTAL LABOUR FORCE EMPLOYED UNEMPLOYED
Department of Statistics 32
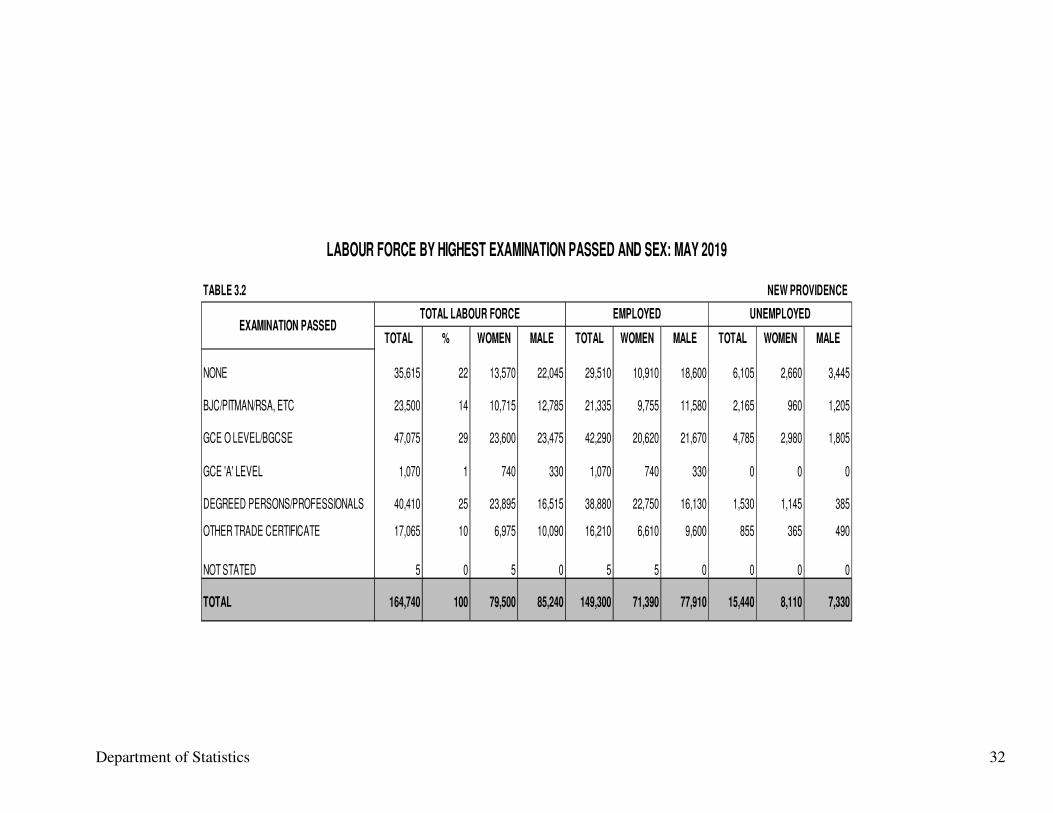
TABLE 3.2
TOTAL % WOMEN MALE TOTAL WOMEN MALE TOTAL WOMEN MALE
NONE 35,615 22 13,570 22,045 29,510 10,910 18,600 6,105 2,660 3,445
BJC/PITMAN/RSA, ETC 23,500 14 10,715 12,785 21,335 9,755 11,580 2,165 960 1,205
GCE O LEVEL/BGCSE 47,075 29 23,600 23,475 42,290 20,620 21,670 4,785 2,980 1,805
GCE 'A' LEVEL 1,070 1 740 330 1,070 740 330 0 0 0
DEGREED PERSONS/PROFESSIONALS 40,410 25 23,895 16,515 38,880 22,750 16,130 1,530 1,145 385
OTHER TRADE CERTIFICATE 17,065 10 6,975 10,090 16,210 6,610 9,600 855 365 490
NOT STATED 5 0 5 0 5 5 0 0 0 0
TOTAL 164,740 100 79,500 85,240 149,300 71,390 77,910 15,440 8,110 7,330
LABOUR FORCE BY HIGHEST EXAMINATION PASSED AND SEX: MAY 2019
NEW PROVIDENCE
EXAMINATION PASSEDTOTAL LABOUR FORCE EMPLOYED UNEMPLOYED
Department of Statistics 33
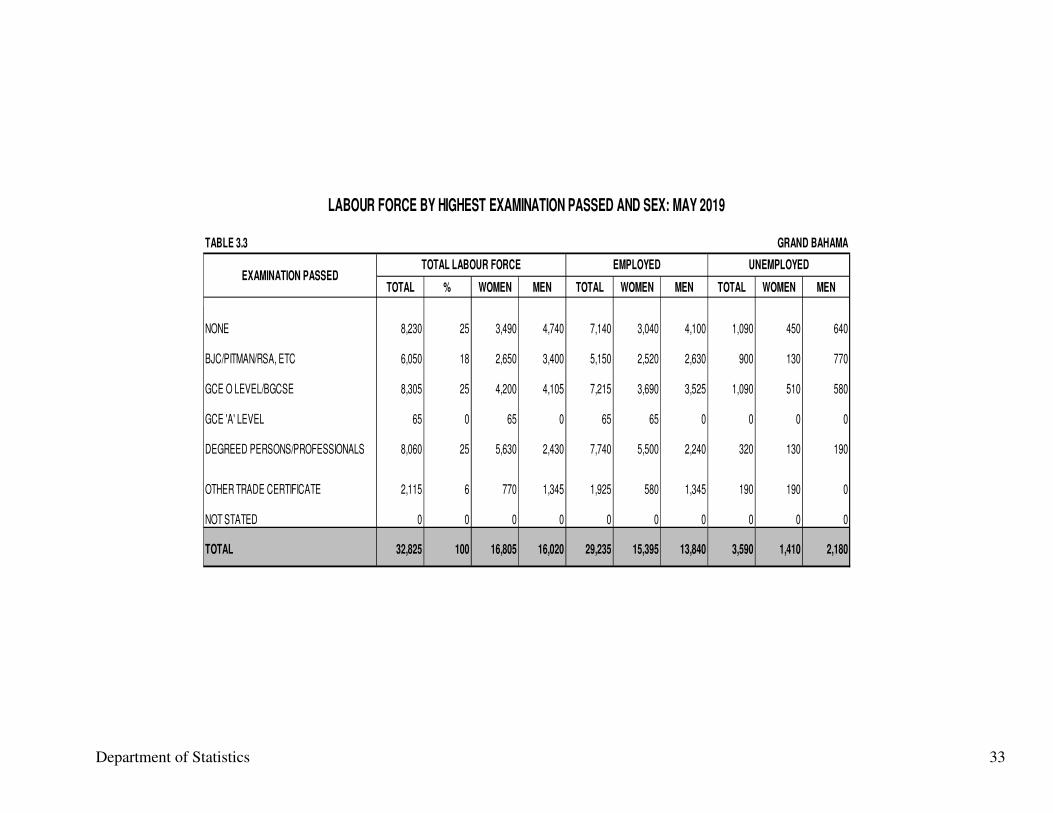
TABLE 3.3
TOTAL % WOMEN MEN TOTAL WOMEN MEN TOTAL WOMEN MEN
NONE 8,230 25 3,490 4,740 7,140 3,040 4,100 1,090 450 640
BJC/PITMAN/RSA, ETC 6,050 18 2,650 3,400 5,150 2,520 2,630 900 130 770
GCE O LEVEL/BGCSE 8,305 25 4,200 4,105 7,215 3,690 3,525 1,090 510 580
GCE 'A' LEVEL 65 0 65 0 65 65 0 0 0 0
DEGREED PERSONS/PROFESSIONALS 8,060 25 5,630 2,430 7,740 5,500 2,240 320 130 190
OTHER TRADE CERTIFICATE 2,115 6 770 1,345 1,925 580 1,345 190 190 0
NOT STATED 0 0 0 0 0 0 0 0 0 0
TOTAL 32,825 100 16,805 16,020 29,235 15,395 13,840 3,590 1,410 2,180
LABOUR FORCE BY HIGHEST EXAMINATION PASSED AND SEX: MAY 2019
GRAND BAHAMA
EXAMINATION PASSEDTOTAL LABOUR FORCE EMPLOYED UNEMPLOYED
Department of Statistics 34
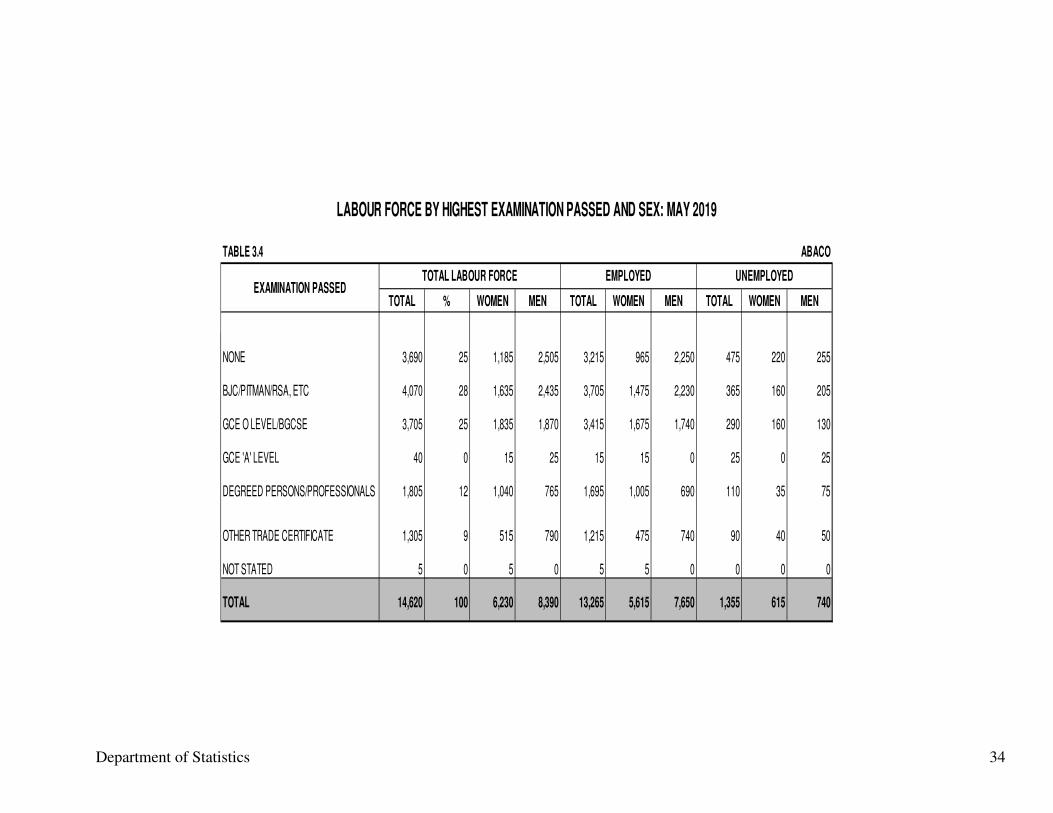
TABLE 3.4
TOTAL % WOMEN MEN TOTAL WOMEN MEN TOTAL WOMEN MEN
NONE 3,690 25 1,185 2,505 3,215 965 2,250 475 220 255
BJC/PITMAN/RSA, ETC 4,070 28 1,635 2,435 3,705 1,475 2,230 365 160 205
GCE O LEVEL/BGCSE 3,705 25 1,835 1,870 3,415 1,675 1,740 290 160 130
GCE 'A' LEVEL 40 0 15 25 15 15 0 25 0 25
DEGREED PERSONS/PROFESSIONALS 1,805 12 1,040 765 1,695 1,005 690 110 35 75
OTHER TRADE CERTIFICATE 1,305 9 515 790 1,215 475 740 90 40 50
NOT STATED 5 0 5 0 5 5 0 0 0 0
TOTAL 14,620 100 6,230 8,390 13,265 5,615 7,650 1,355 615 740
LABOUR FORCE BY HIGHEST EXAMINATION PASSED AND SEX: MAY 2019
ABACO
EXAMINATION PASSEDTOTAL LABOUR FORCE EMPLOYED UNEMPLOYED
Department of Statistics
SECTION II – THE EMPLOYED LABOUR FORCE
Department of Statistics
35
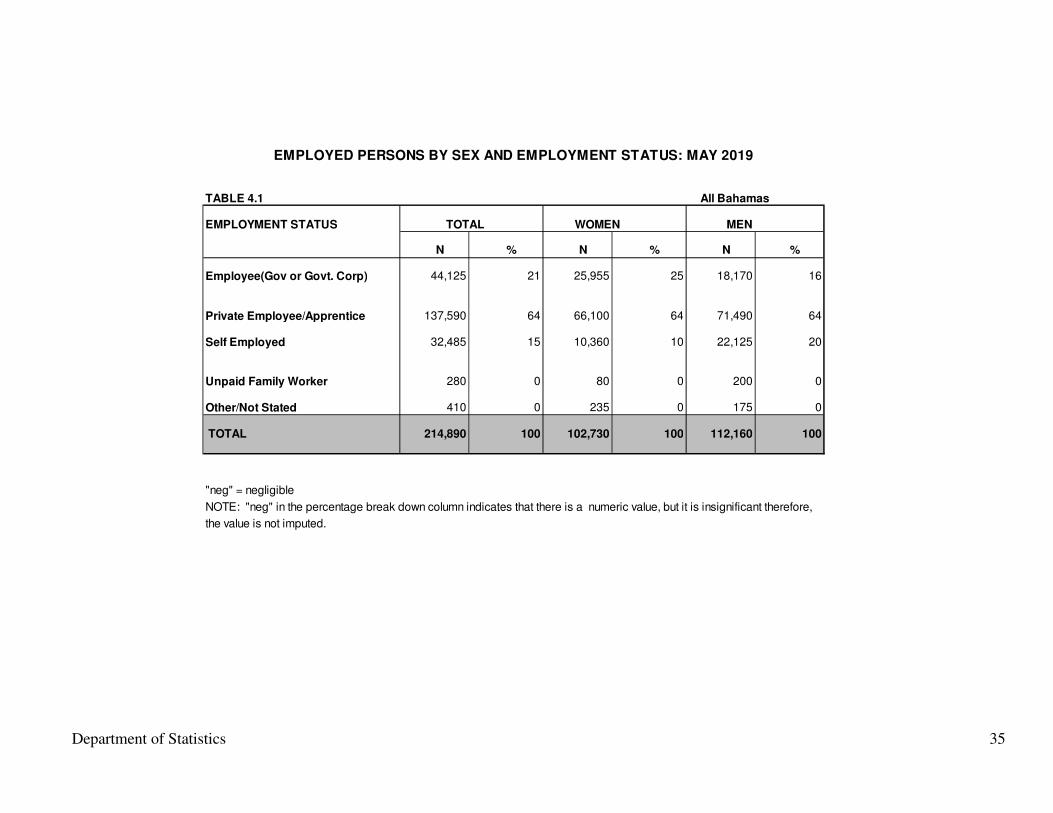
TABLE 4.1 All Bahamas
EMPLOYMENT STATUS TOTAL WOMEN MEN
N % N % N %
Employee(Gov or Govt. Corp) 44,125 21 25,955 25 18,170 16
Private Employee/Apprentice 137,590 64 66,100 64 71,490 64
Self Employed 32,485 15 10,360 10 22,125 20
Unpaid Family Worker 280 0 80 0 200 0
Other/Not Stated 410 0 235 0 175 0
TOTAL 214,890 100 102,730 100 112,160 100
"neg" = negligible
NOTE: "neg" in the percentage break down column indicates that there is a numeric value, but it is insignificant therefore,
the value is not imputed.
EMPLOYED PERSONS BY SEX AND EMPLOYMENT STATUS: MAY 2019
Department of Statistics
36
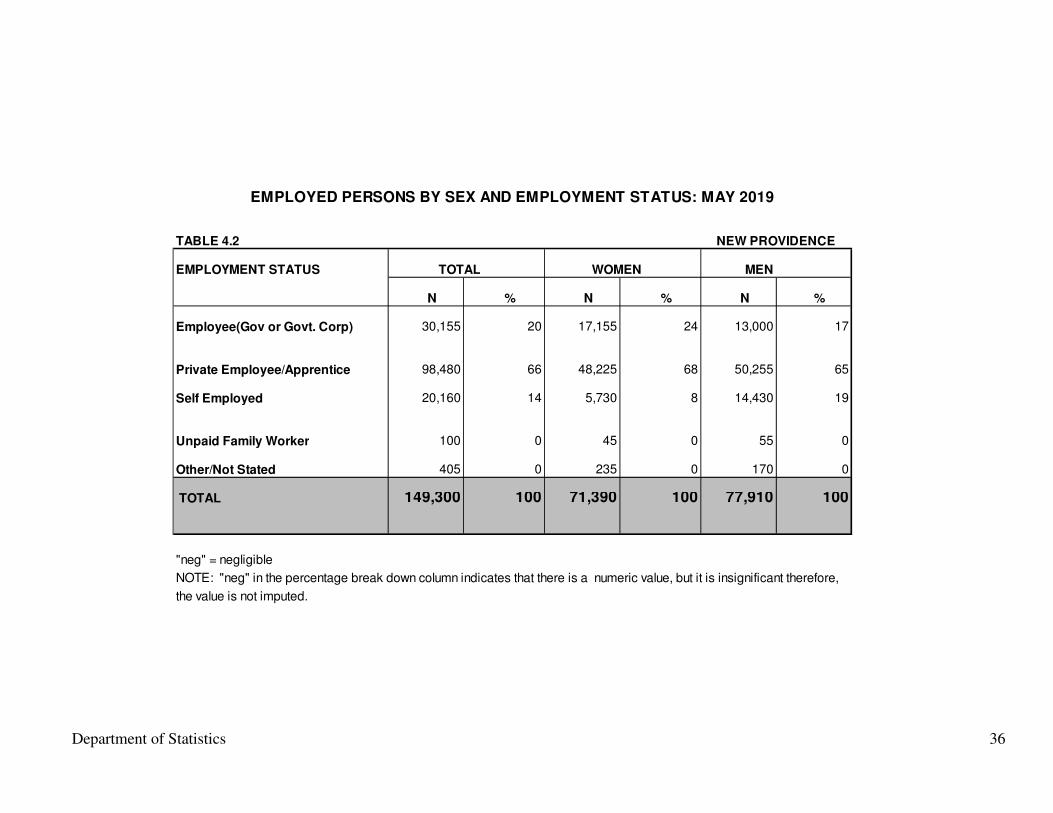
TABLE 4.2 NEW PROVIDENCE
EMPLOYMENT STATUS TOTAL WOMEN MEN
N % N % N %
Employee(Gov or Govt. Corp) 30,155 20 17,155 24 13,000 17
Private Employee/Apprentice 98,480 66 48,225 68 50,255 65
Self Employed 20,160 14 5,730 8 14,430 19
Unpaid Family Worker 100 0 45 0 55 0
Other/Not Stated 405 0 235 0 170 0
TOTAL 149,300 100 71,390 100 77,910 100
"neg" = negligible
NOTE: "neg" in the percentage break down column indicates that there is a numeric value, but it is insignificant therefore,
the value is not imputed.
EMPLOYED PERSONS BY SEX AND EMPLOYMENT STATUS: MAY 2019
Department of Statistics
37
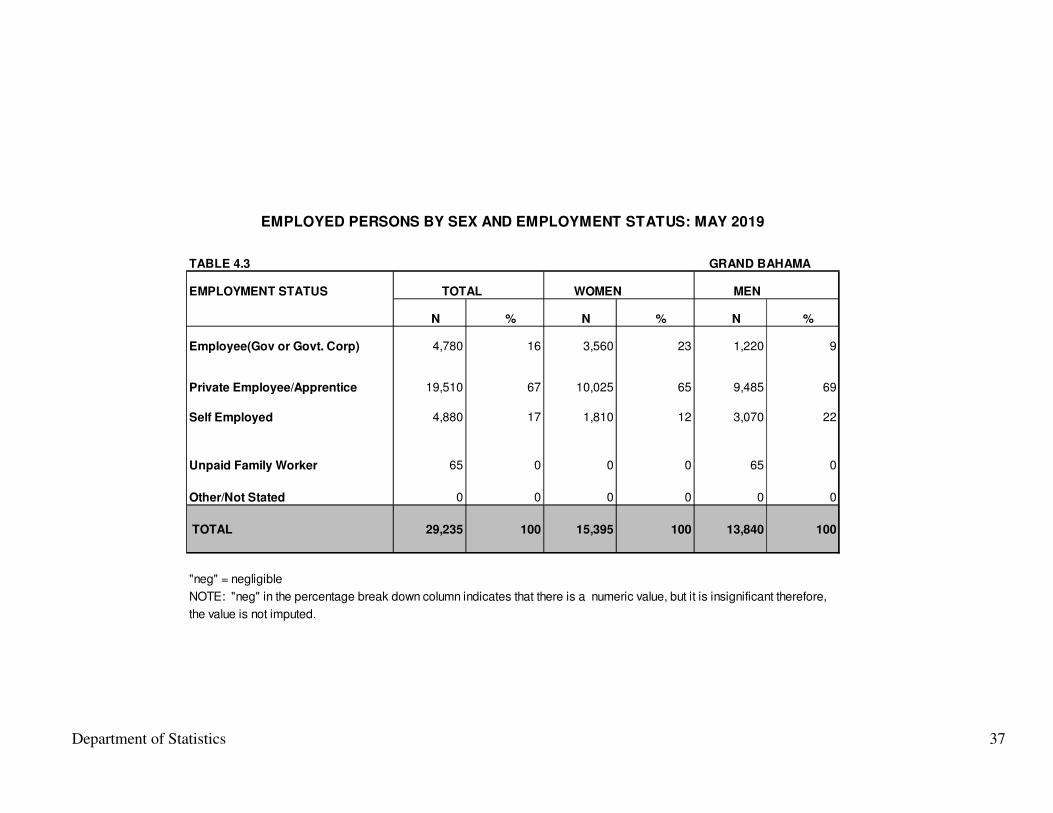
TABLE 4.3 GRAND BAHAMA
EMPLOYMENT STATUS TOTAL WOMEN MEN
N % N % N %
Employee(Gov or Govt. Corp) 4,780 16 3,560 23 1,220 9
Private Employee/Apprentice 19,510 67 10,025 65 9,485 69
Self Employed 4,880 17 1,810 12 3,070 22
Unpaid Family Worker 65 0 0 0 65 0
Other/Not Stated 0 0 0 0 0 0
TOTAL 29,235 100 15,395 100 13,840 100
"neg" = negligible
NOTE: "neg" in the percentage break down column indicates that there is a numeric value, but it is insignificant therefore,
the value is not imputed.
EMPLOYED PERSONS BY SEX AND EMPLOYMENT STATUS: MAY 2019
Department of Statistics
38
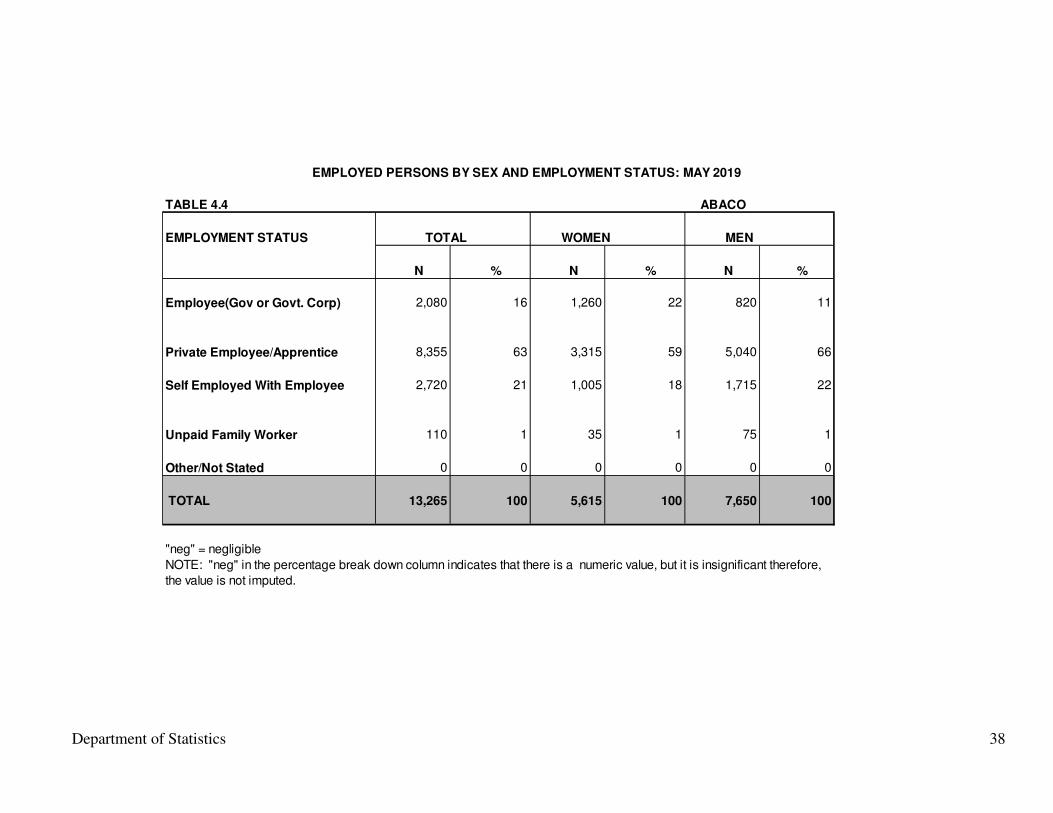
TABLE 4.4 ABACO
EMPLOYMENT STATUS TOTAL WOMEN MEN
N % N % N %
Employee(Gov or Govt. Corp) 2,080 16 1,260 22 820 11
Private Employee/Apprentice 8,355 63 3,315 59 5,040 66
Self Employed With Employee 2,720 21 1,005 18 1,715 22
Unpaid Family Worker 110 1 35 1 75 1
Other/Not Stated 0 0 0 0 0 0
TOTAL 13,265 100 5,615 100 7,650 100
"neg" = negligible
NOTE: "neg" in the percentage break down column indicates that there is a numeric value, but it is insignificant therefore,
the value is not imputed.
EMPLOYED PERSONS BY SEX AND EMPLOYMENT STATUS: MAY 2019
Department of Statistics
39
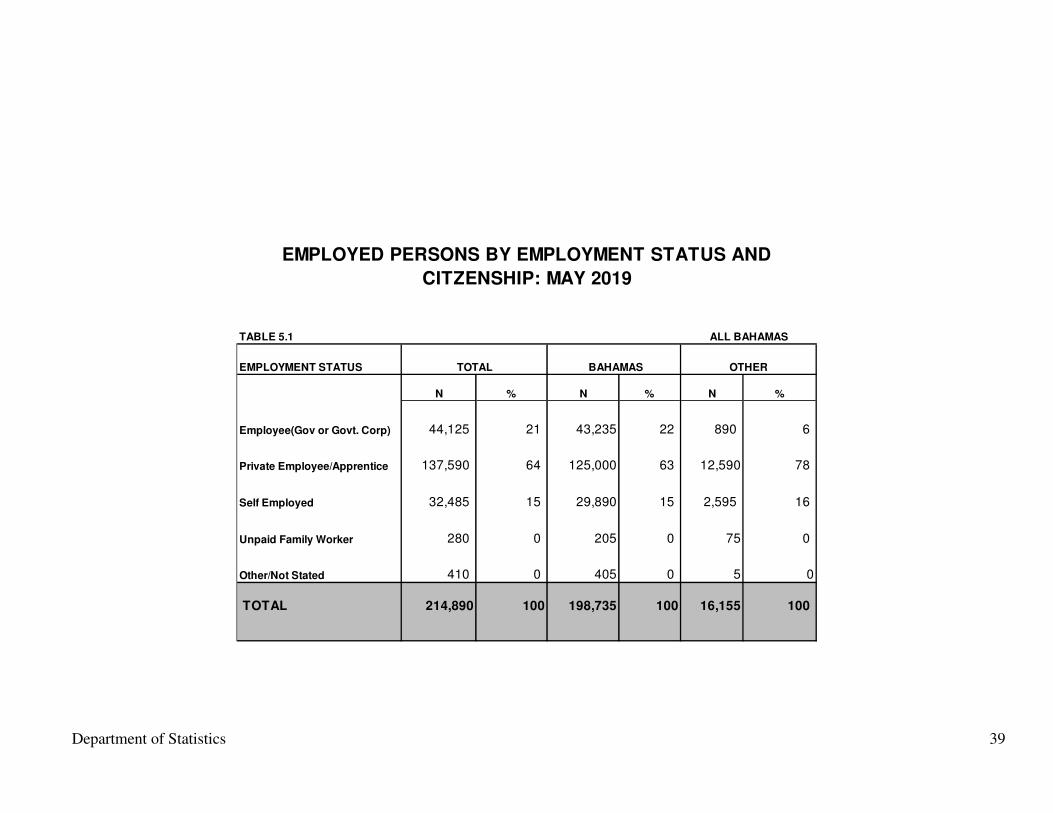
TABLE 5.1
EMPLOYMENT STATUS
N % N % N %
Employee(Gov or Govt. Corp) 44,125 21 43,235 22 890 6
Private Employee/Apprentice 137,590 64 125,000 63 12,590 78
Self Employed 32,485 15 29,890 15 2,595 16
Unpaid Family Worker 280 0 205 0 75 0
Other/Not Stated 410 0 405 0 5 0
TOTAL 214,890 100 198,735 100 16,155 100
EMPLOYED PERSONS BY EMPLOYMENT STATUS AND
CITZENSHIP: MAY 2019
ALL BAHAMAS
BAHAMAS OTHERTOTAL
Department of Statistics
40
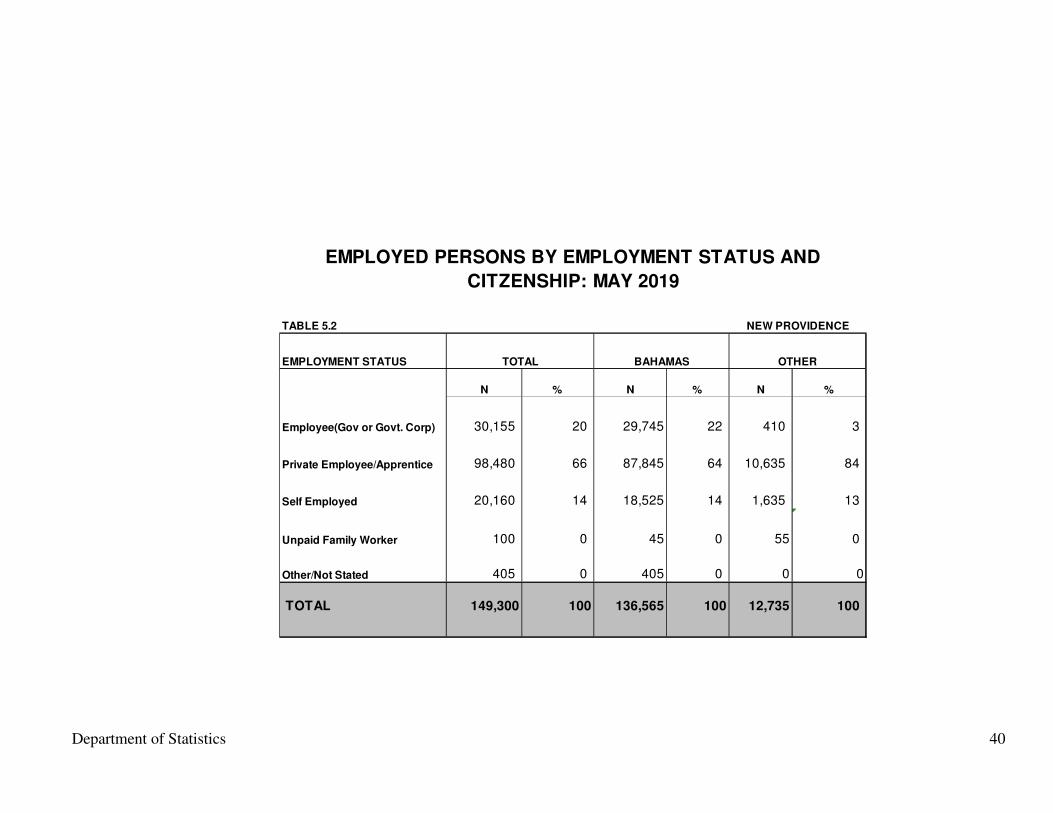
TABLE 5.2
EMPLOYMENT STATUS
N % N % N %
Employee(Gov or Govt. Corp) 30,155 20 29,745 22 410 3
Private Employee/Apprentice 98,480 66 87,845 64 10,635 84
Self Employed 20,160 14 18,525 14 1,635 13
Unpaid Family Worker 100 0 45 0 55 0
Other/Not Stated 405 0 405 0 0 0
TOTAL 149,300 100 136,565 100 12,735 100
NEW PROVIDENCE
OTHERBAHAMASTOTAL
EMPLOYED PERSONS BY EMPLOYMENT STATUS AND
CITZENSHIP: MAY 2019
Department of Statistics
41
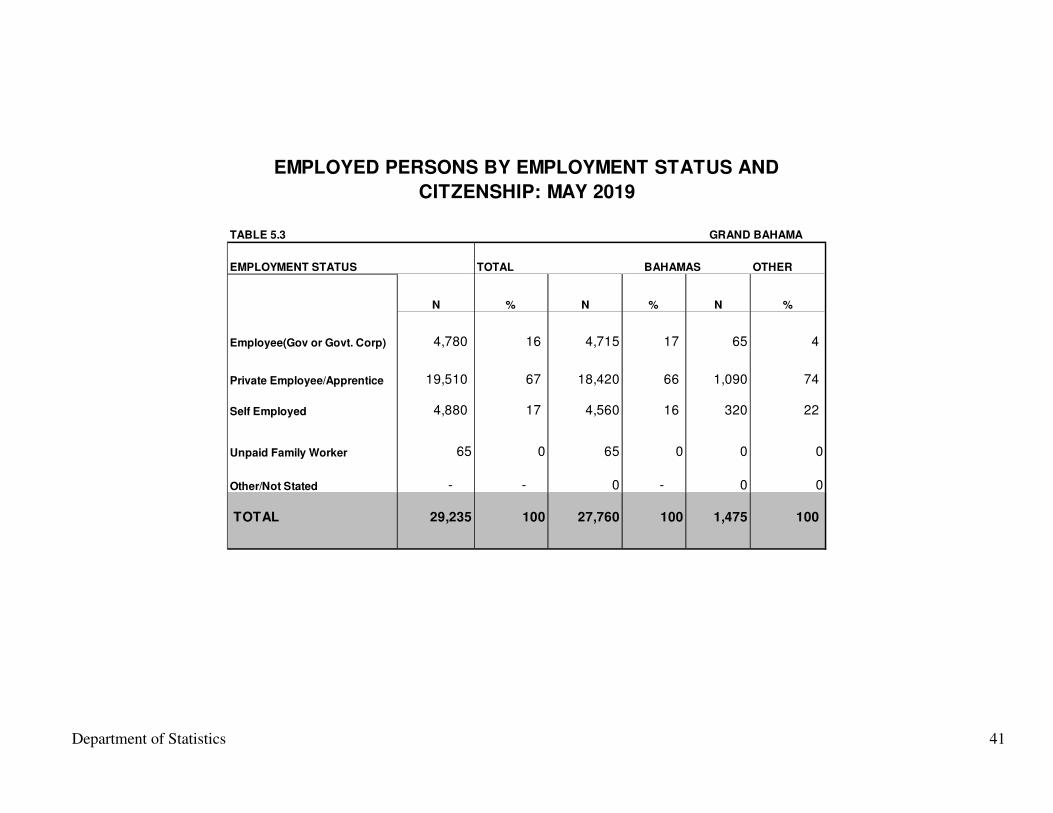
TABLE 5.3
EMPLOYMENT STATUS TOTAL BAHAMAS OTHER
N % N % N %
Employee(Gov or Govt. Corp) 4,780 16 4,715 17 65 4
Private Employee/Apprentice 19,510 67 18,420 66 1,090 74
Self Employed 4,880 17 4,560 16 320 22
Unpaid Family Worker 65 0 65 0 0 0
Other/Not Stated - - 0 - 0 0
TOTAL 29,235 100 27,760 100 1,475 100
GRAND BAHAMA
EMPLOYED PERSONS BY EMPLOYMENT STATUS AND
CITZENSHIP: MAY 2019
Department of Statistics
42
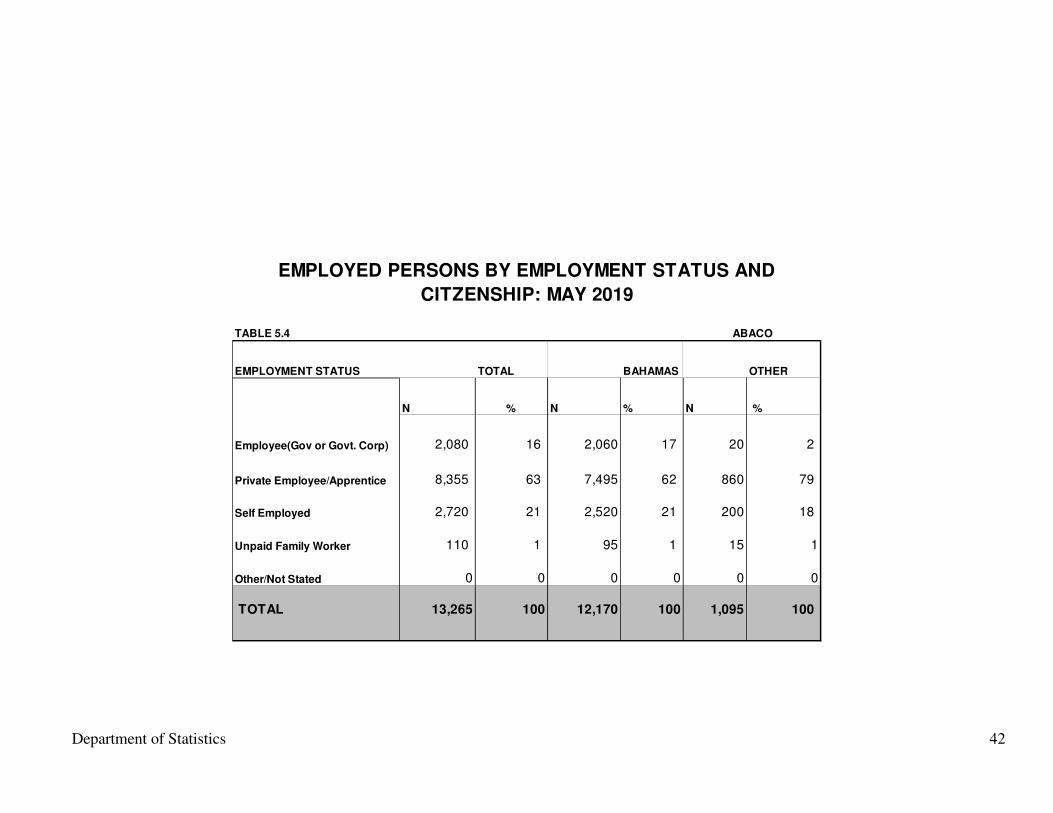
TABLE 5.4
EMPLOYMENT STATUS TOTAL BAHAMAS OTHER
N % N % N %
Employee(Gov or Govt. Corp) 2,080 16 2,060 17 20 2
Private Employee/Apprentice 8,355 63 7,495 62 860 79
Self Employed 2,720 21 2,520 21 200 18
Unpaid Family Worker 110 1 95 1 15 1
Other/Not Stated 0 0 0 0 0 0
TOTAL 13,265 100 12,170 100 1,095 100
ABACO
EMPLOYED PERSONS BY EMPLOYMENT STATUS AND
CITZENSHIP: MAY 2019
Department of Statistics
43
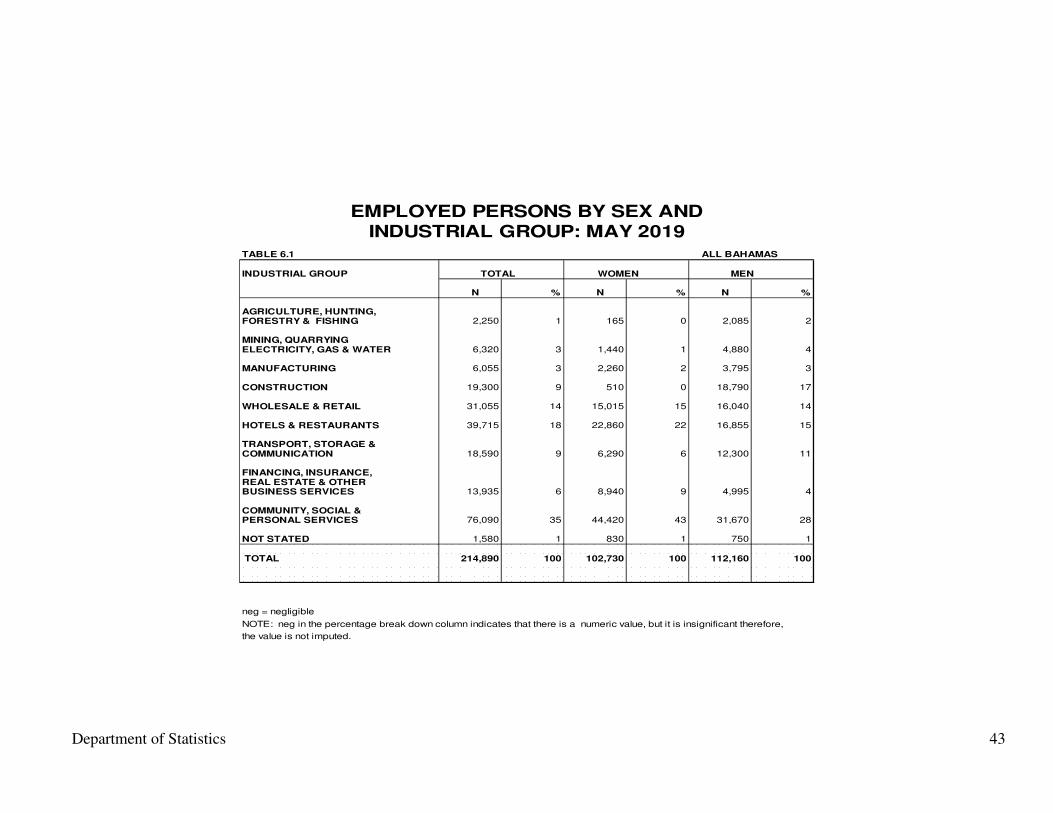
TABLE 6.1 ALL BAHAMAS
INDUSTRIAL GROUP TOTAL WOMEN MEN
N % N % N %
AGRICULTURE, HUNTING,FORESTRY & FISHING 2,250 1 165 0 2,085 2
MINING, QUARRYING ELECTRICITY, GAS & WATER 6,320 3 1,440 1 4,880 4
MANUFACTURING 6,055 3 2,260 2 3,795 3
CONSTRUCTION 19,300 9 510 0 18,790 17
WHOLESALE & RETAIL 31,055 14 15,015 15 16,040 14
HOTELS & RESTAURANTS 39,715 18 22,860 22 16,855 15
TRANSPORT, STORAGE &COMMUNICATION 18,590 9 6,290 6 12,300 11
FINANCING, INSURANCE,REAL ESTATE & OTHERBUSINESS SERVICES 13,935 6 8,940 9 4,995 4
COMMUNITY, SOCIAL &PERSONAL SERVICES 76,090 35 44,420 43 31,670 28
NOT STATED 1,580 1 830 1 750 1
TOTAL 214,890 100 102,730 100 112,160 100
neg = negligible
NOTE: neg in the percentage break down column indicates that there is a numeric value, but it is insignificant therefore,
the value is not imputed.
EMPLOYED PERSONS BY SEX ANDINDUSTRIAL GROUP: MAY 2019
Department of Statistics
44
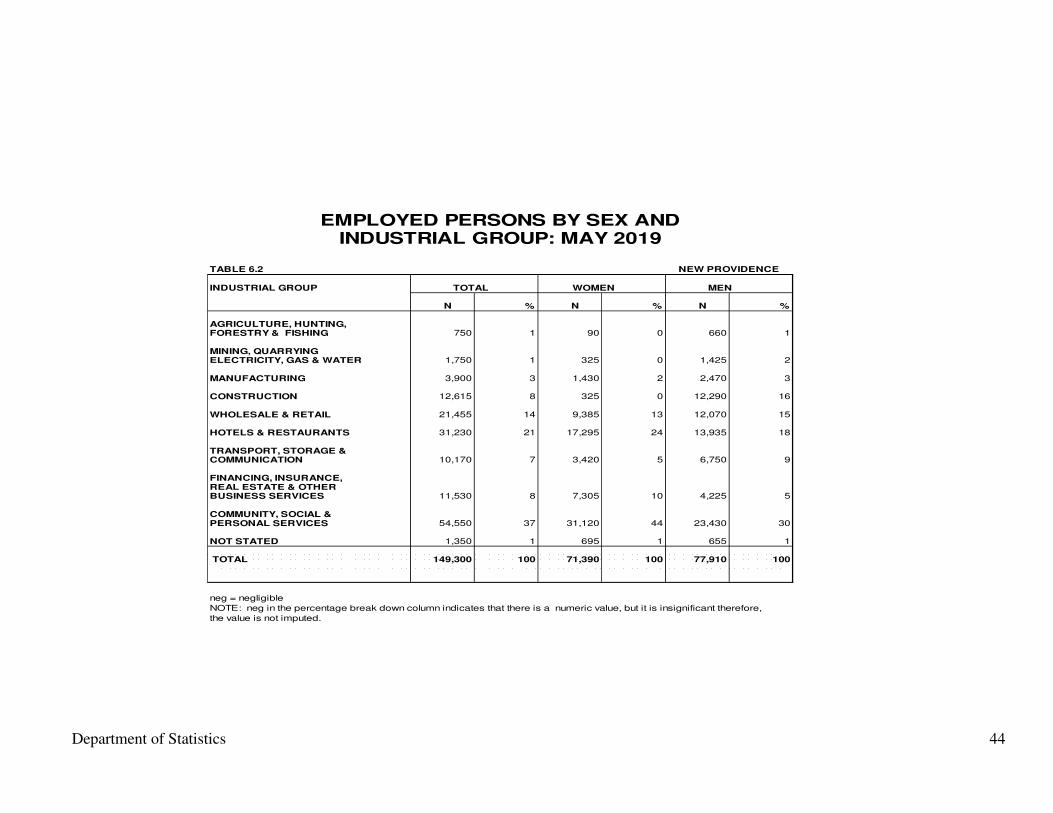
TABLE 6.2 NEW PROVIDENCE
INDUSTRIAL GROUP TOTAL WOMEN MEN
N % N % N %
AGRICULTURE, HUNTING,FORESTRY & FISHING 750 1 90 0 660 1
MINING, QUARRYING ELECTRICITY, GAS & WATER 1,750 1 325 0 1,425 2
MANUFACTURING 3,900 3 1,430 2 2,470 3
CONSTRUCTION 12,615 8 325 0 12,290 16
WHOLESALE & RETAIL 21,455 14 9,385 13 12,070 15
HOTELS & RESTAURANTS 31,230 21 17,295 24 13,935 18
TRANSPORT, STORAGE &COMMUNICATION 10,170 7 3,420 5 6,750 9
FINANCING, INSURANCE,REAL ESTATE & OTHERBUSINESS SERVICES 11,530 8 7,305 10 4,225 5
COMMUNITY, SOCIAL &PERSONAL SERVICES 54,550 37 31,120 44 23,430 30
NOT STATED 1,350 1 695 1 655 1
TOTAL 149,300 100 71,390 100 77,910 100
neg = negligible
NOTE: neg in the percentage break down column indicates that there is a numeric value, but it is insignificant therefore,
the value is not imputed.
INDUSTRIAL GROUP: MAY 2019EMPLOYED PERSONS BY SEX AND
Department of Statistics
45
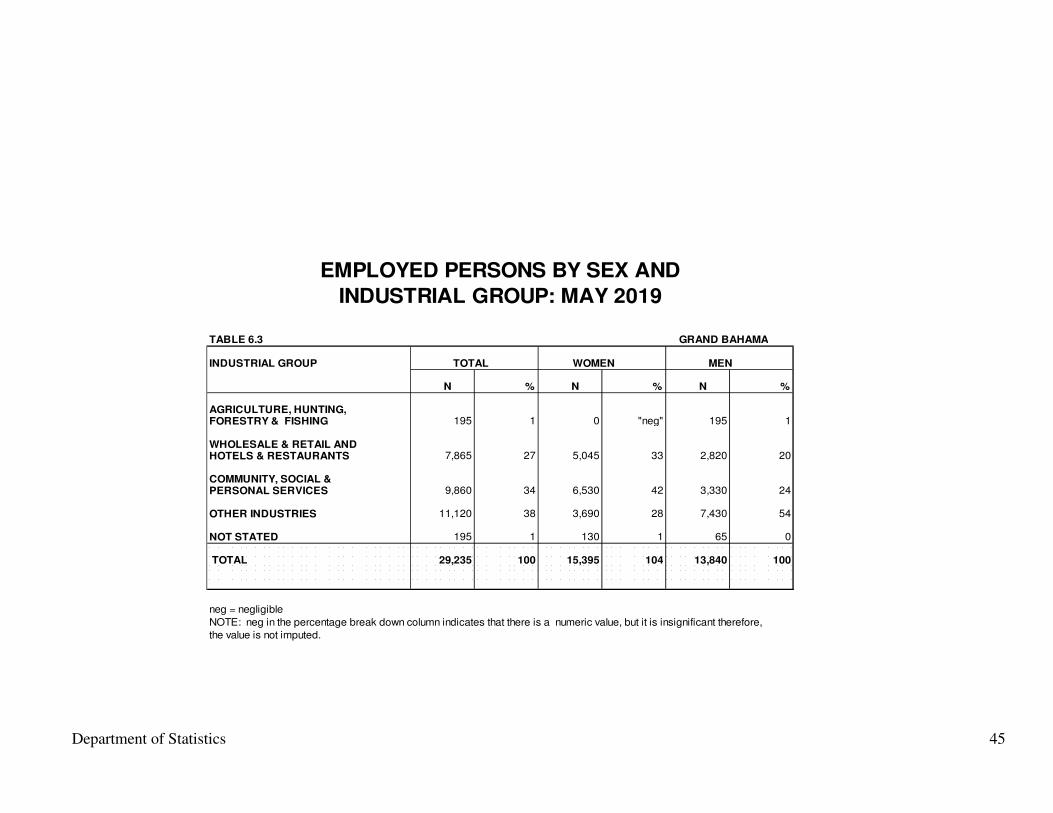
TABLE 6.3 GRAND BAHAMA
INDUSTRIAL GROUP TOTAL WOMEN MEN
N % N % N %
AGRICULTURE, HUNTING,FORESTRY & FISHING 195 1 0 "neg" 195 1
WHOLESALE & RETAIL ANDHOTELS & RESTAURANTS 7,865 27 5,045 33 2,820 20
COMMUNITY, SOCIAL &PERSONAL SERVICES 9,860 34 6,530 42 3,330 24
OTHER INDUSTRIES 11,120 38 3,690 28 7,430 54
NOT STATED 195 1 130 1 65 0
TOTAL 29,235 100 15,395 104 13,840 100
neg = negligible
NOTE: neg in the percentage break down column indicates that there is a numeric value, but it is insignificant therefore,
the value is not imputed.
EMPLOYED PERSONS BY SEX AND
INDUSTRIAL GROUP: MAY 2019
Department of Statistics 46
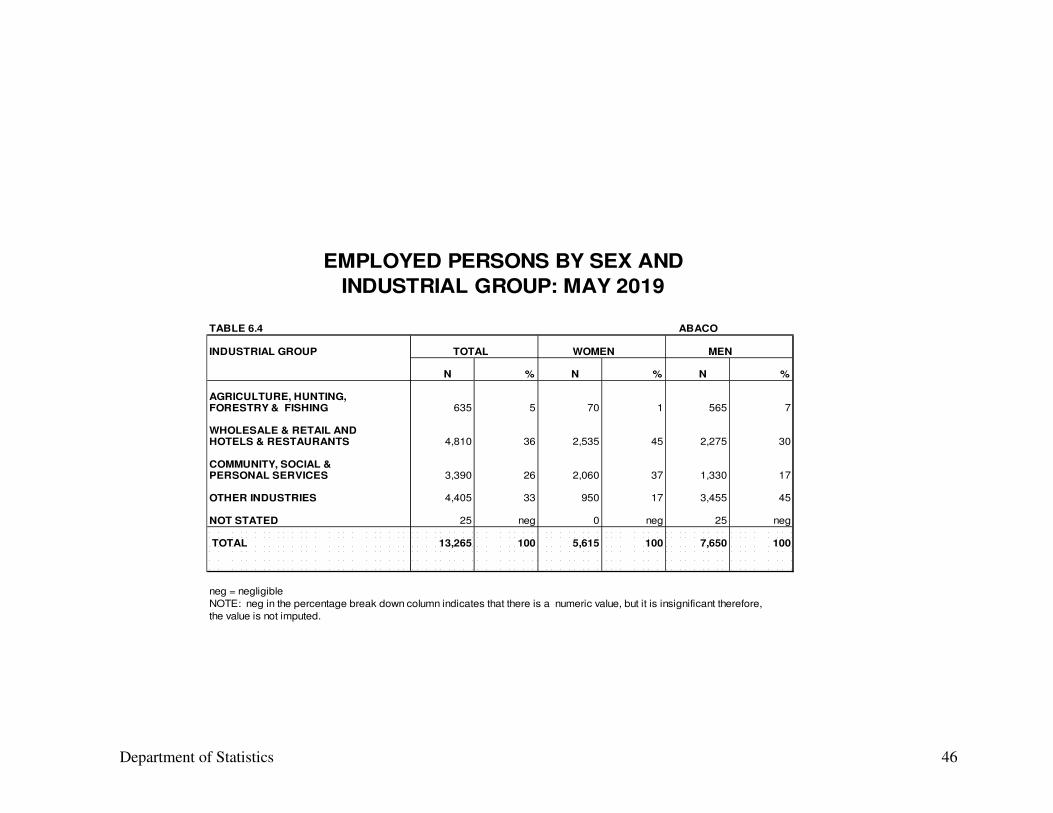
TABLE 6.4 ABACO
INDUSTRIAL GROUP TOTAL WOMEN MEN
N % N % N %
AGRICULTURE, HUNTING,FORESTRY & FISHING 635 5 70 1 565 7
WHOLESALE & RETAIL ANDHOTELS & RESTAURANTS 4,810 36 2,535 45 2,275 30
COMMUNITY, SOCIAL &PERSONAL SERVICES 3,390 26 2,060 37 1,330 17
OTHER INDUSTRIES 4,405 33 950 17 3,455 45
NOT STATED 25 neg 0 neg 25 neg
TOTAL 13,265 100 5,615 100 7,650 100
neg = negligible
NOTE: neg in the percentage break down column indicates that there is a numeric value, but it is insignificant therefore,
the value is not imputed.
EMPLOYED PERSONS BY SEX AND
INDUSTRIAL GROUP: MAY 2019

Department of Statistics 47
EMPLOYED PERSONS BY SEX AND
OCCUPATIONAL GROUP: MAY 2019
TABLE 7.1 ALL BAHAMAS
OCCUPATIONAL GROUP TOTAL WOMEN MEN
N % N % N % LEGISLATORS & SENIOR
OFFICIALS 16,125 8 8,320 8 7,805 7
PROFESSIONALS, TECHNICIANS& ASSOCIATE PROFESSIONALS 42,900 20 25,255 25 17,645 16
CLERKS 19,230 9 15,625 15 3,605 3
SERVICE WORKERS & SHOPMARKET SALES WORKERS 62,815 29 37,245 36 25,570 23
SKILLED AGRICULTURAL ANDFISHERY WORKERS 4,220 2 220 neg 4,000 4
CRAFT AND RELATED WORKERS.PLANT & MACHINE OPERATORSAND ASSEMBLERS 37,500 17 2,570 3 34,930 31
ELEMENTARY OCCUPATIONS 30,075 14 12,520 12 17,555 16
NOT STATED 2,025 1 975 1 1,050 1
TOTAL 214,890 100 102,730 100 112,160 100
neg = negligibleNOTE: neg in the percentage break down column indicates that there is a numeric value, but it is insignificant therefore,the value is not imputed.
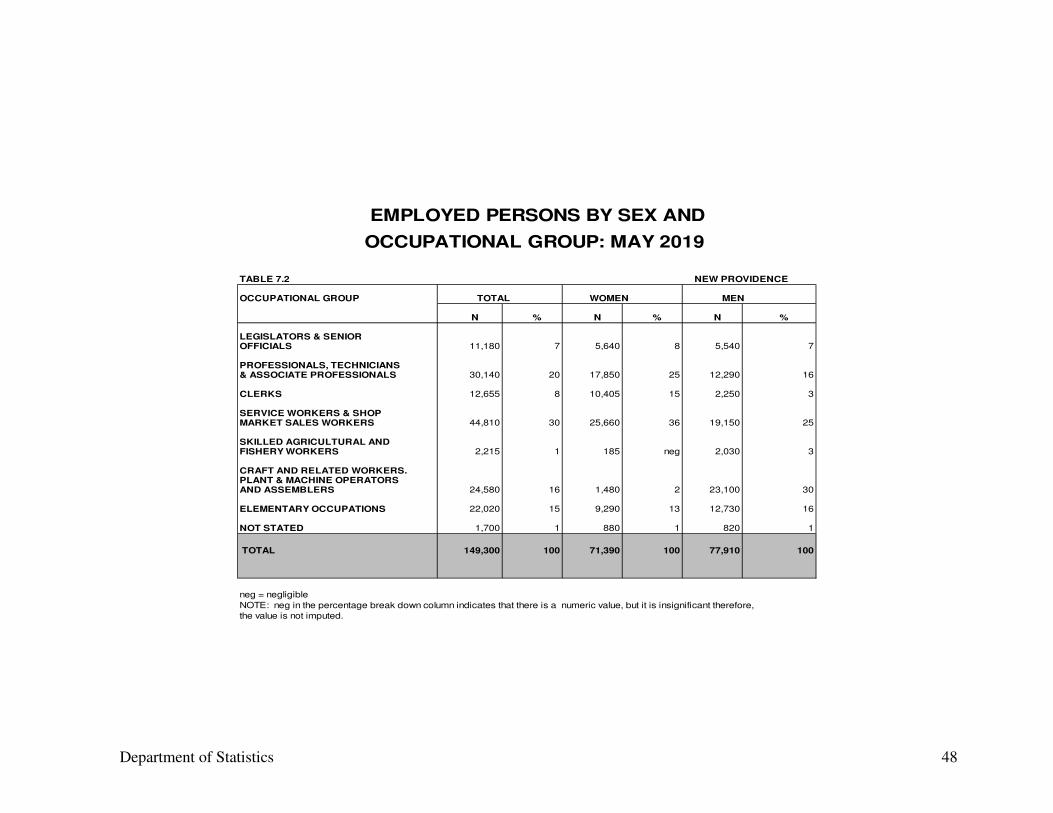
Department of Statistics 48
EMPLOYED PERSONS BY SEX AND
OCCUPATIONAL GROUP: MAY 2019
TABLE 7.2 NEW PROVIDENCE
OCCUPATIONAL GROUP TOTAL WOMEN MEN
N % N % N %
LEGISLATORS & SENIOR OFFICIALS 11,180 7 5,640 8 5,540 7
PROFESSIONALS, TECHNICIANS& ASSOCIATE PROFESSIONALS 30,140 20 17,850 25 12,290 16
CLERKS 12,655 8 10,405 15 2,250 3
SERVICE WORKERS & SHOPMARKET SALES WORKERS 44,810 30 25,660 36 19,150 25
SKILLED AGRICULTURAL ANDFISHERY WORKERS 2,215 1 185 neg 2,030 3
CRAFT AND RELATED WORKERS.PLANT & MACHINE OPERATORSAND ASSEMBLERS 24,580 16 1,480 2 23,100 30
ELEMENTARY OCCUPATIONS 22,020 15 9,290 13 12,730 16
NOT STATED 1,700 1 880 1 820 1
TOTAL 149,300 100 71,390 100 77,910 100
neg = negligible
NOTE: neg in the percentage break down column indicates that there is a numeric value, but it is insignificant therefore,
the value is not imputed.
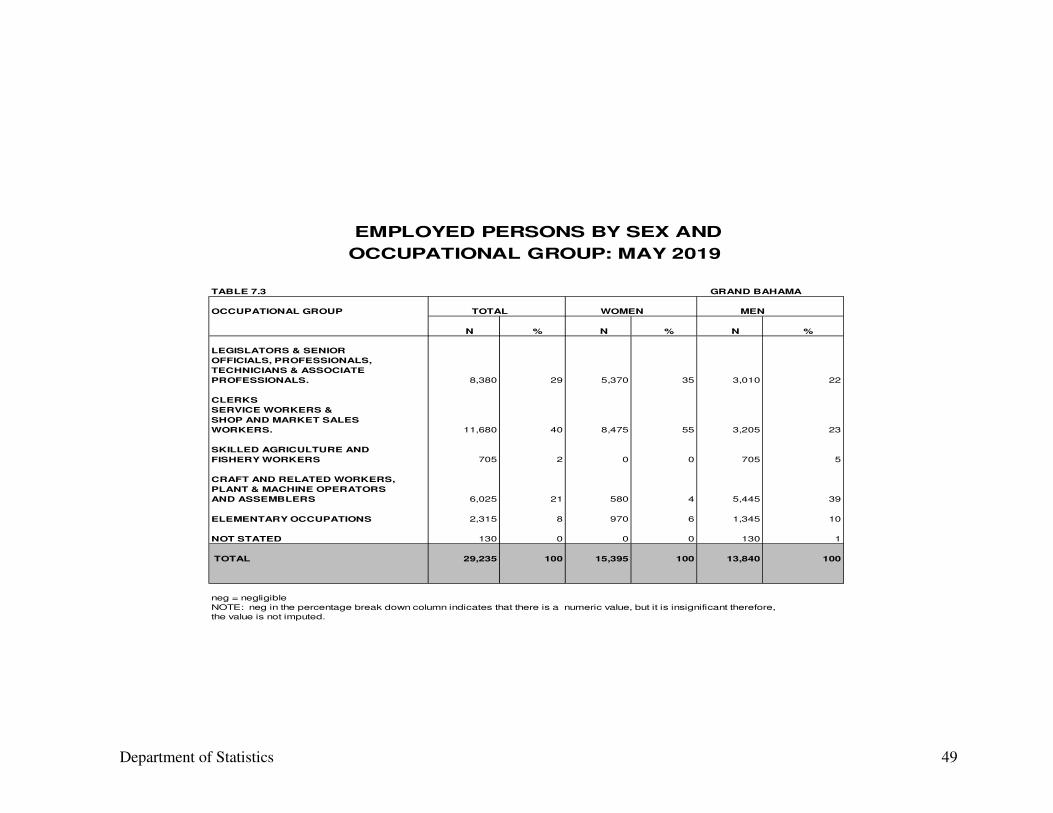
Department of Statistics 49
EMPLOYED PERSONS BY SEX AND
OCCUPATIONAL GROUP: MAY 2019
TABLE 7.3 GRAND BAHAMA
OCCUPATIONAL GROUP TOTAL WOMEN MEN
N % N % N %
LEGISLATORS & SENIOR
OFFICIALS, PROFESSIONALS,
TECHNICIANS & ASSOCIATE
PROFESSIONALS. 8,380 29 5,370 35 3,010 22
CLERKS
SERVICE WORKERS &
SHOP AND MARKET SALES
WORKERS. 11,680 40 8,475 55 3,205 23
SKILLED AGRICULTURE AND
FISHERY WORKERS 705 2 0 0 705 5
CRAFT AND RELATED WORKERS,
PLANT & MACHINE OPERATORS
AND ASSEMBLERS 6,025 21 580 4 5,445 39
ELEMENTARY OCCUPATIONS 2,315 8 970 6 1,345 10
NOT STATED 130 0 0 0 130 1
TOTAL 29,235 100 15,395 100 13,840 100
neg = negligible
NOTE: neg in the percentage break down column indicates that there is a numeric value, but it is insignificant therefore,
the value is not imputed.
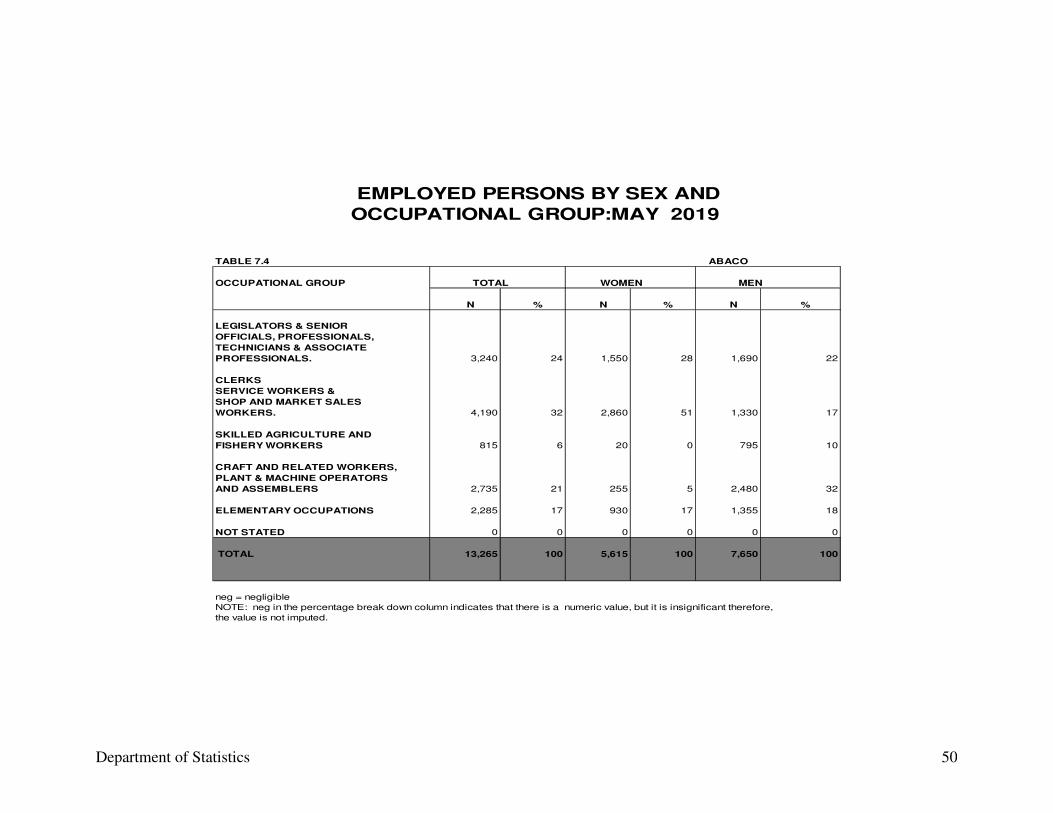
Department of Statistics 50
EMPLOYED PERSONS BY SEX AND
OCCUPATIONAL GROUP:MAY 2019
TABLE 7.4 ABACO
OCCUPATIONAL GROUP TOTAL WOMEN MEN
N % N % N %
LEGISLATORS & SENIOR
OFFICIALS, PROFESSIONALS,
TECHNICIANS & ASSOCIATE
PROFESSIONALS. 3,240 24 1,550 28 1,690 22
CLERKS
SERVICE WORKERS &
SHOP AND MARKET SALES
WORKERS. 4,190 32 2,860 51 1,330 17
SKILLED AGRICULTURE AND
FISHERY WORKERS 815 6 20 0 795 10
CRAFT AND RELATED WORKERS,
PLANT & MACHINE OPERATORS
AND ASSEMBLERS 2,735 21 255 5 2,480 32
ELEMENTARY OCCUPATIONS 2,285 17 930 17 1,355 18
NOT STATED 0 0 0 0 0 0
TOTAL 13,265 100 5,615 100 7,650 100
neg = negligible
NOTE: neg in the percentage break down column indicates that there is a numeric value, but it is insignificant therefore,
the value is not imputed.
Department of Statistics 51
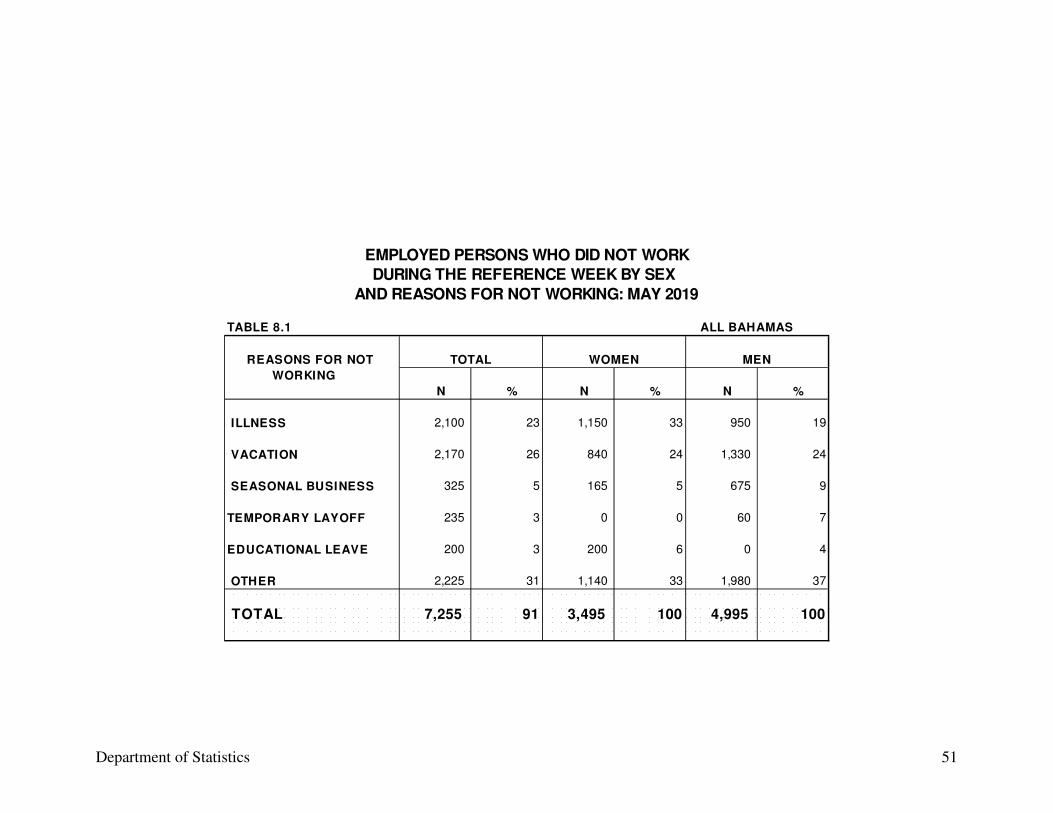
EMPLOYED PERSONS WHO DID NOT WORK
DURING THE REFERENCE WEEK BY SEX
AND REASONS FOR NOT WORKING: MAY 2019
TABLE 8.1 ALL BAHAMAS
REASONS FOR NOT TOTAL WOMEN MEN
WORKING
N % N % N %
ILLNESS 2,100 23 1,150 33 950 19
VACATION 2,170 26 840 24 1,330 24
SEASONAL BUSINESS 325 5 165 5 675 9
TEMPORARY LAYOFF 235 3 0 0 60 7
EDUCATIONAL LEAVE 200 3 200 6 0 4
OTHER 2,225 31 1,140 33 1,980 37
TOTAL 7,255 91 3,495 100 4,995 100
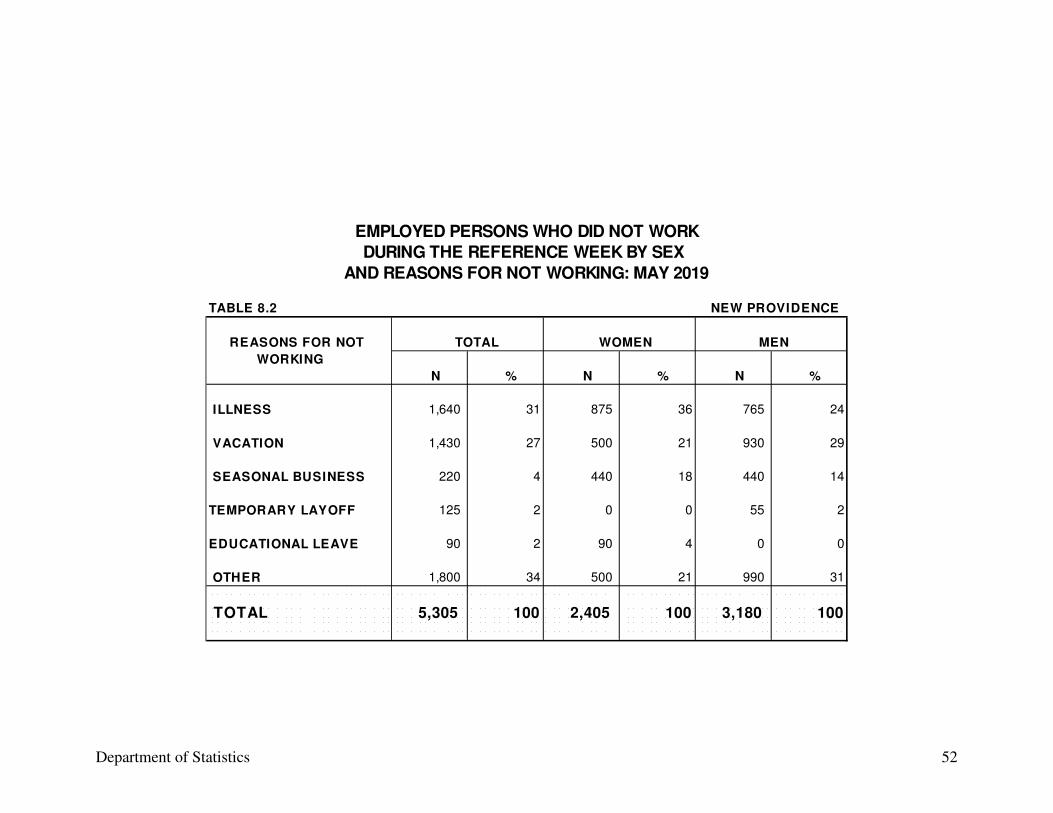
Department of Statistics 52
EMPLOYED PERSONS WHO DID NOT WORK
DURING THE REFERENCE WEEK BY SEX
AND REASONS FOR NOT WORKING: MAY 2019
TABLE 8.2 NEW PROVIDENCE
REASONS FOR NOT TOTAL WOMEN MEN
WORKING
N % N % N %
ILLNESS 1,640 31 875 36 765 24
VACATION 1,430 27 500 21 930 29
SEASONAL BUSINESS 220 4 440 18 440 14
TEMPORARY LAYOFF 125 2 0 0 55 2
EDUCATIONAL LEAVE 90 2 90 4 0 0
OTHER 1,800 34 500 21 990 31
TOTAL 5,305 100 2,405 100 3,180 100
SECTION III – THE UNEMPLOYED LABOUR FORCE
Department of Statistics
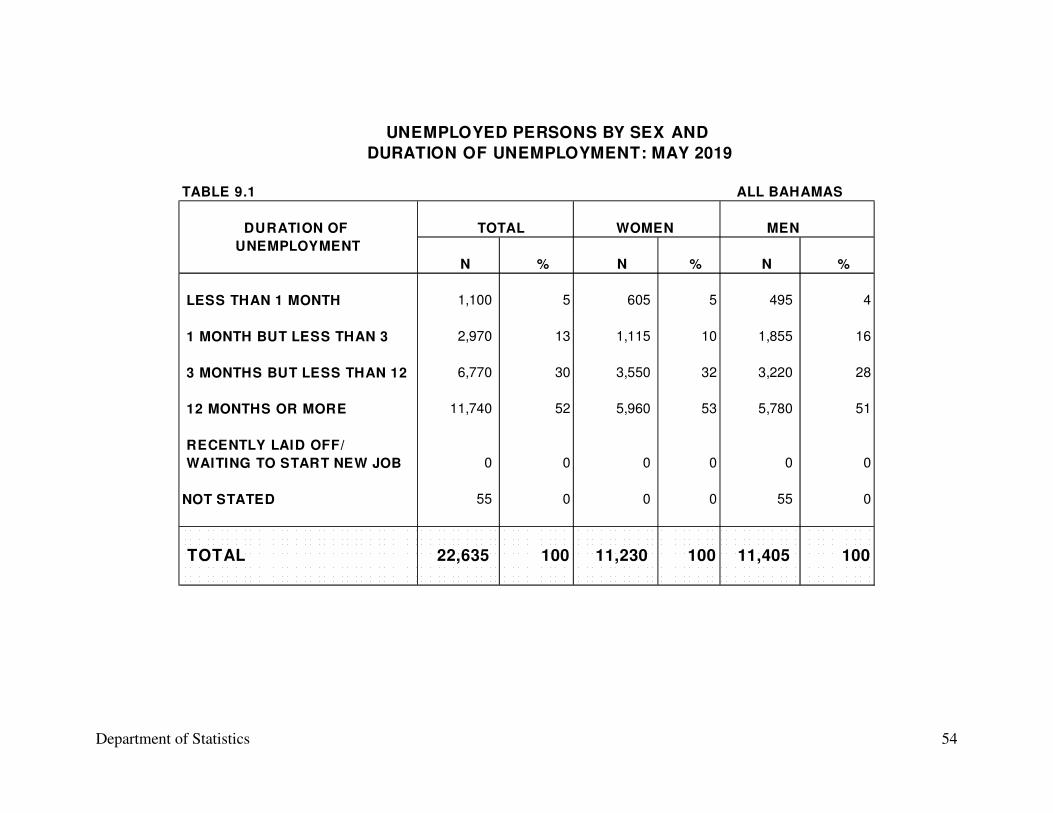
54
TABLE 9.1 ALL BAHAMAS
DURATION OF TOTAL WOMEN MEN
UNEMPLOYMENT
N % N % N %
LESS THAN 1 MONTH 1,100 5 605 5 495 4
1 MONTH BUT LESS THAN 3 2,970 13 1,115 10 1,855 16
3 MONTHS BUT LESS THAN 12 6,770 30 3,550 32 3,220 28
12 MONTHS OR MORE 11,740 52 5,960 53 5,780 51
RECENTLY LAID OFF/
WAITING TO START NEW JOB 0 0 0 0 0 0
NOT STATED 55 0 0 0 55 0
TOTAL 22,635 100 11,230 100 11,405 100
DURATION OF UNEMPLOYMENT: MAY 2019
UNEMPLOYED PERSONS BY SEX AND
Department of Statistics
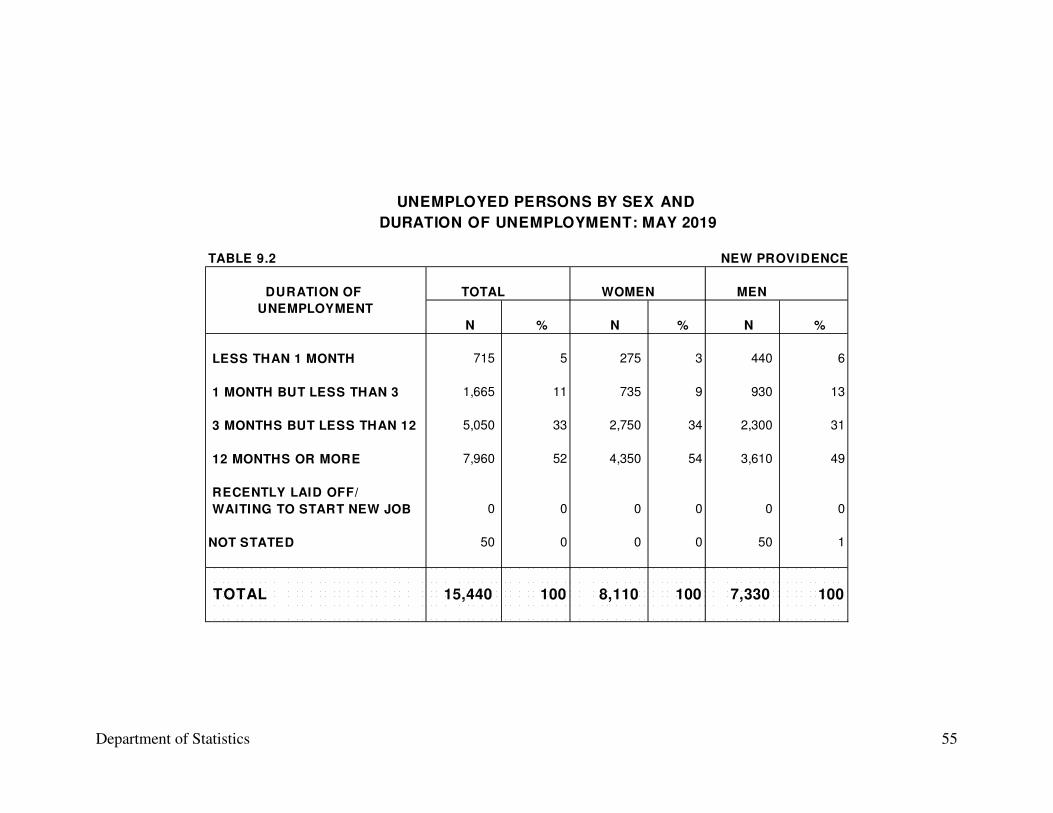
55
TABLE 9.2 NEW PROVIDENCE
DURATION OF TOTAL WOMEN MEN
UNEMPLOYMENT
N % N % N %
LESS THAN 1 MONTH 715 5 275 3 440 6
1 MONTH BUT LESS THAN 3 1,665 11 735 9 930 13
3 MONTHS BUT LESS THAN 12 5,050 33 2,750 34 2,300 31
12 MONTHS OR MORE 7,960 52 4,350 54 3,610 49
RECENTLY LAID OFF/
WAITING TO START NEW JOB 0 0 0 0 0 0
NOT STATED 50 0 0 0 50 1
TOTAL 15,440 100 8,110 100 7,330 100
UNEMPLOYED PERSONS BY SEX AND
DURATION OF UNEMPLOYMENT: MAY 2019
Department of Statistics
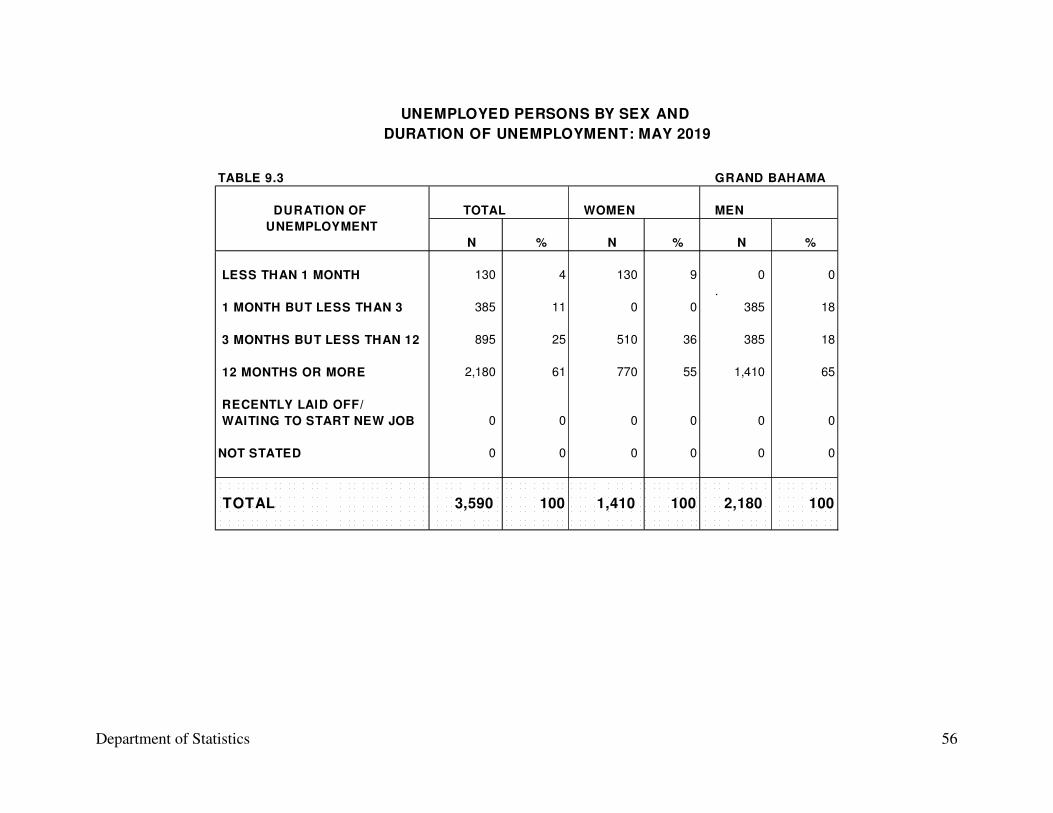
56
TABLE 9.3 GRAND BAHAMA
DURATION OF TOTAL WOMEN MEN
UNEMPLOYMENT
N % N % N %
LESS THAN 1 MONTH 130 4 130 9 0 0
.
1 MONTH BUT LESS THAN 3 385 11 0 0 385 18
3 MONTHS BUT LESS THAN 12 895 25 510 36 385 18
12 MONTHS OR MORE 2,180 61 770 55 1,410 65
RECENTLY LAID OFF/
WAITING TO START NEW JOB 0 0 0 0 0 0
NOT STATED 0 0 0 0 0 0
TOTAL 3,590 100 1,410 100 2,180 100
UNEMPLOYED PERSONS BY SEX AND
DURATION OF UNEMPLOYMENT: MAY 2019
Department of Statistics
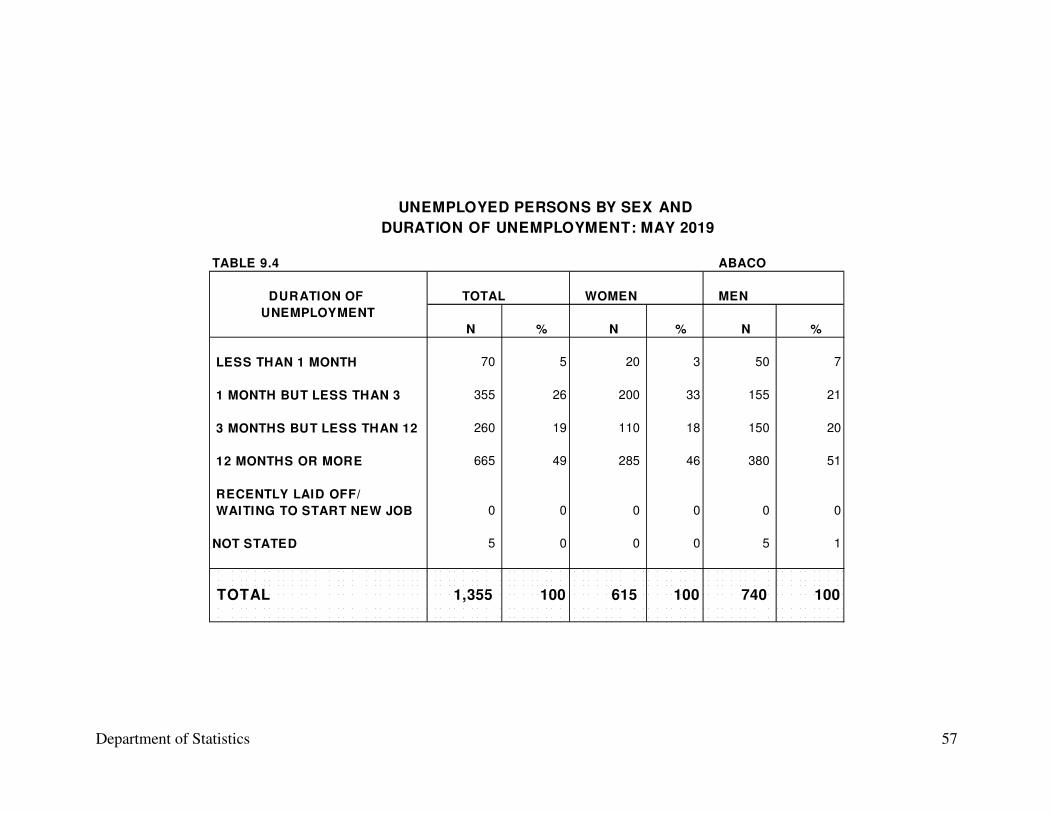
57
TABLE 9.4 ABACO
DURATION OF TOTAL WOMEN MEN
UNEMPLOYMENT
N % N % N %
LESS THAN 1 MONTH 70 5 20 3 50 7
1 MONTH BUT LESS THAN 3 355 26 200 33 155 21
3 MONTHS BUT LESS THAN 12 260 19 110 18 150 20
12 MONTHS OR MORE 665 49 285 46 380 51
RECENTLY LAID OFF/
WAITING TO START NEW JOB 0 0 0 0 0 0
NOT STATED 5 0 0 0 5 1
TOTAL 1,355 100 615 100 740 100
UNEMPLOYED PERSONS BY SEX AND
DURATION OF UNEMPLOYMENT: MAY 2019
Department of Statistics
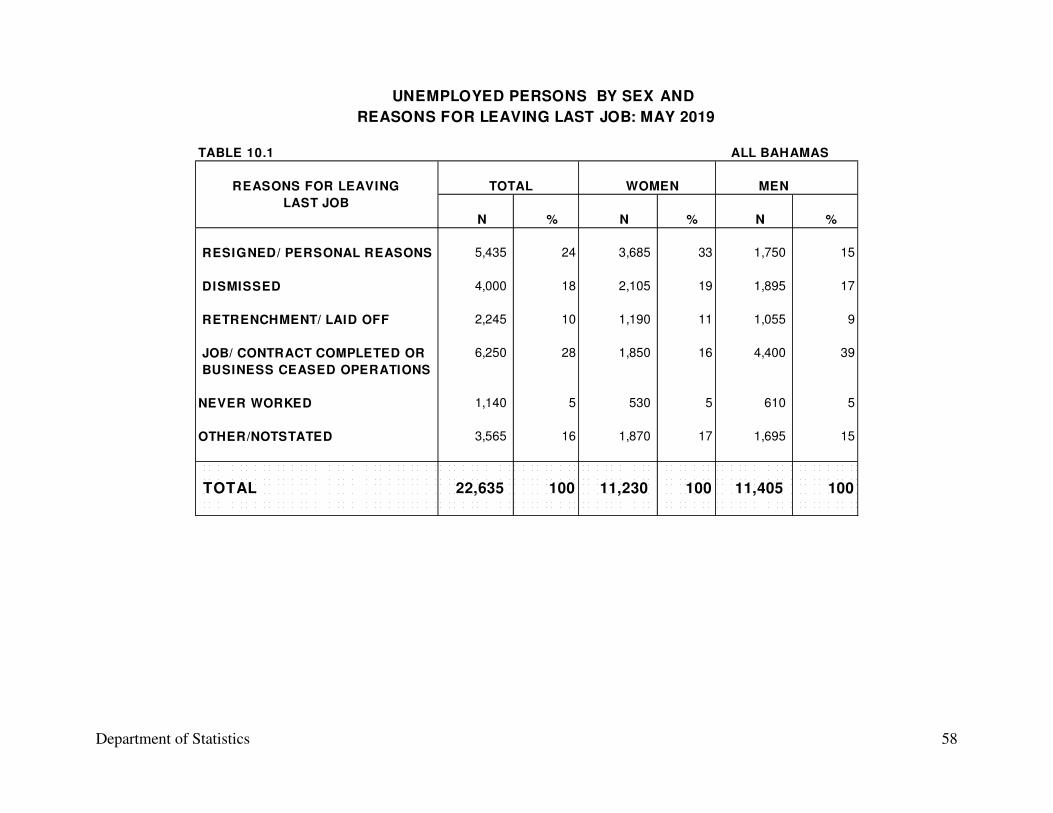
58
TABLE 10.1 ALL BAHAMAS
REASONS FOR LEAVING TOTAL WOMEN MEN
LAST JOB
N % N % N %
RESIGNED/ PERSONAL REASONS 5,435 24 3,685 33 1,750 15
DISMISSED 4,000 18 2,105 19 1,895 17
RETRENCHMENT/ LAID OFF 2,245 10 1,190 11 1,055 9
JOB/ CONTRACT COMPLETED OR 6,250 28 1,850 16 4,400 39
BUSINESS CEASED OPERATIONS
NEVER WORKED 1,140 5 530 5 610 5
OTHER/NOTSTATED 3,565 16 1,870 17 1,695 15
TOTAL 22,635 100 11,230 100 11,405 100
UNEMPLOYED PERSONS BY SEX AND
REASONS FOR LEAVING LAST JOB: MAY 2019
Department of Statistics
59
TABLE 10.2 NEW PROVIDENCE
REASONS FOR LEAVING TOTAL WOMEN MEN
LAST JOB
N % N % N %
RESIGNED/ PERSONAL REASONS 3,525 23 2,430 30 1,095 15
DISMISSED 3,060 20 1,695 21 1,365 19
RETRENCHMENT/ LAID OFF 1,775 11 1,010 12 765 10
JOB/ CONTRACT COMPLETED OR 3,750 24 1,235 15 2,515 34
BUSINESS CEASED OPERATIONS
NEVER WORKED 915 6 365 5 550 8
OTHER/NOTSTATED 2,415 16 1,375 17 1,040 14
TOTAL 15,440 100 8,110 100 7,330 100
UNEMPLOYED PERSONS BY SEX AND
REASONS FOR LEAVING LAST JOB: MAY 2019
Department of Statistics
60
TABLE 10.3 GRAND BAHAMA
REASONS FOR LEAVING TOTAL WOMEN MEN
LAST JOB
N % N % N %
RESIGNED/ PERSONAL REASONS 705 20 385 27 320 15
DISMISSED 575 16 320 23 255 12
RETRENCHMENT/ LAID OFF 255 7 125 9 130 6
JOB/ CONTRACT COMPLETED OR 1,090 30 195 14 895 41
BUSINESS CEASED OPERATIONS
NEVER WORKED 135 4 130 9 5 0
OTHER/NOTSTATED 830 23 255 18 575 26
TOTAL 3,590 100 1,410 100 2,180 100
REASONS FOR LEAVING LAST JOB: MAY 2019
UNEMPLOYED PERSONS BY SEX AND
Department of Statistics
61
TABLE 10.4 ABACO
REASONS FOR LEAVING TOTAL WOMEN MEN
LAST JOB
N % N % N %
RESIGNED/ PERSONAL REASONS 480 35 325 53 155 21
DISMISSED 165 12 90 15 75 10
RETRENCHMENT/ LAID OFF 210 15 55 9 155 21
JOB/ CONTRACT COMPLETED OR 285 21 55 9 230 31
BUSINESS CEASED OPERATIONS
NEVER WORKED 85 6 35 6 50 7
OTHER/NOTSTATED 130 10 55 9 75 10
TOTAL 1,355 100 615 100 740 100
UNEMPLOYED PERSONS BY SEX AND
REASONS FOR LEAVING LAST JOB: MAY 2019
SECTION IV – DISCOURAGED WORKERS
Department of Statistics 63
TABEL 11
ISLAND AND TOTAL
SEX DISCOURAGED WORKED BEFORE NEVER WORKED
WORKERS
ALL BAHAMAS
TOTAL 1,990 1,380 610MEN 875 650 225
WOMEN 1,115 730 385
NEW PROVIDENCE
TOTAL 1,195 820 375MEN 410 290 120
WOMEN 785 530 255
GRAND BAHAMA
TOTAL 175 100 75MEN 75 30 45
WOMEN 100 70 30
ABACO
TOTAL 220 110 110MEN 55 45 10
WOMEN 165 65 100
DISCOURAGED WORKERS BY ISLAND
SEX AND WORK EXPERIENCE: MAY 2019
SECTION V – HOUSEHOLDS
Department of Statistics
65
TABLE 12
NEW GRAND
INCOME GROUP ALL BAHAMAS PROVIDENCE BAHAMA ABACO
B$
AMOUNT AMOUNT AMOUNT AMOUNT
NO. B$ NO. B$ NO. B$ NO. B$
0 - 5,000 2,040 5,100,000 1,100 2,750,000 170 425,000 195 487,500
5,001 - 10,000 3,835 28,762,500 2,150 16,125,000 580 4,350,000 250 1,875,000
10,001 - 15,000 7,205 90,062,500 4,260 53,250,000 1,800 22,500,000 440 5,500,000
15,001 - 20,000 8,630 151,025,000 5,980 104,650,000 1,625 28,437,500 460 8,050,000
20,001 - 40,000 31,475 944,250,000 20,375 611,250,000 4,350 130,500,000 1,770 53,100,000
40,001 - 60,000 23,955 1,197,750,000 16,930 846,500,000 2,960 148,000,000 1,360 68,000,000
60,001 - 80,000 12,405 868,350,000 9,280 649,600,000 1,795 125,650,000 760 53,200,000
.
80,001 -100,000 6,570 591,300,000 4,930 443,700,000 810 72,900,000 405 36,450,000
100,001 & OVER 10,530 1,158,300,000 7,080 778,800,000 925 101,750,000 390 42,900,000
NOT STATED 6,120 - 4,690 - 1,220 - 70 -
TOTAL 112,765 5,034,900,000 76,775 3,506,625,000 16,235 634,512,500 6,100 269,562,500
DISTRIBUTION OF HOUSEHOLDS BY INCOME GROUP
ALL BAHAMAS, NEW PROVIDENCE
GRAND BAHAMA AND ABACO: MAY 2019
Department of Statistics
66
NOTE: This and all remaining tables in this report will have totals that are different from those in Table 12. Table 12 included the 'not stated' households, i.e., the total number of households which did not provide income data. These households are omitted in Tables 13 through 20.
TABLE 13
NEW GRAND
INCOME GROUP ALL BAHAMAS PROVIDENCE BAHAMA ABACO
B$
AMOUNT AMOUNT AMOUNT AMOUNT
NO. B$ NO. B$ NO. B$ NO. B$
0 - 5,000 2,040 5,100,000 1,100 2,750,000 170 425,000 195 487,500
5,001 - 10,000 3,835 28,762,500 2,150 16,125,000 580 4,350,000 250 1,875,000
10,001 - 15,000 7,205 90,062,500 4,260 53,250,000 1,800 22,500,000 440 5,500,000
15,001 - 20,000 8,630 151,025,000 5,980 104,650,000 1,625 28,437,500 460 8,050,000
20,001 - 40,000 31,475 944,250,000 20,375 611,250,000 4,350 130,500,000 1,770 53,100,000
40,001 - 60,000 23,955 1,197,750,000 16,930 846,500,000 2,960 148,000,000 1,360 68,000,000
60,001 - 80,000 12,405 868,350,000 9,280 649,600,000 1,795 125,650,000 760 53,200,000
80,001 -100,000 6,570 591,300,000 4,930 443,700,000 810 72,900,000 405 36,450,000
100,001 & OVER 10,530 1,158,300,000 7,080 778,800,000 925 101,750,000 390 42,900,000
TOTAL 106,645 5,034,900,000 72,085 3,506,625,000 15,015 634,512,500 6,030 269,562,500
DISTRIBUTION OF HOUSEHOLDS BY INCOME GROUP
ALL BAHAMAS, NEW PROVIDENCE
GRAND BAHAMA AND ABACO: MAY 2019
Department of Statistics
67
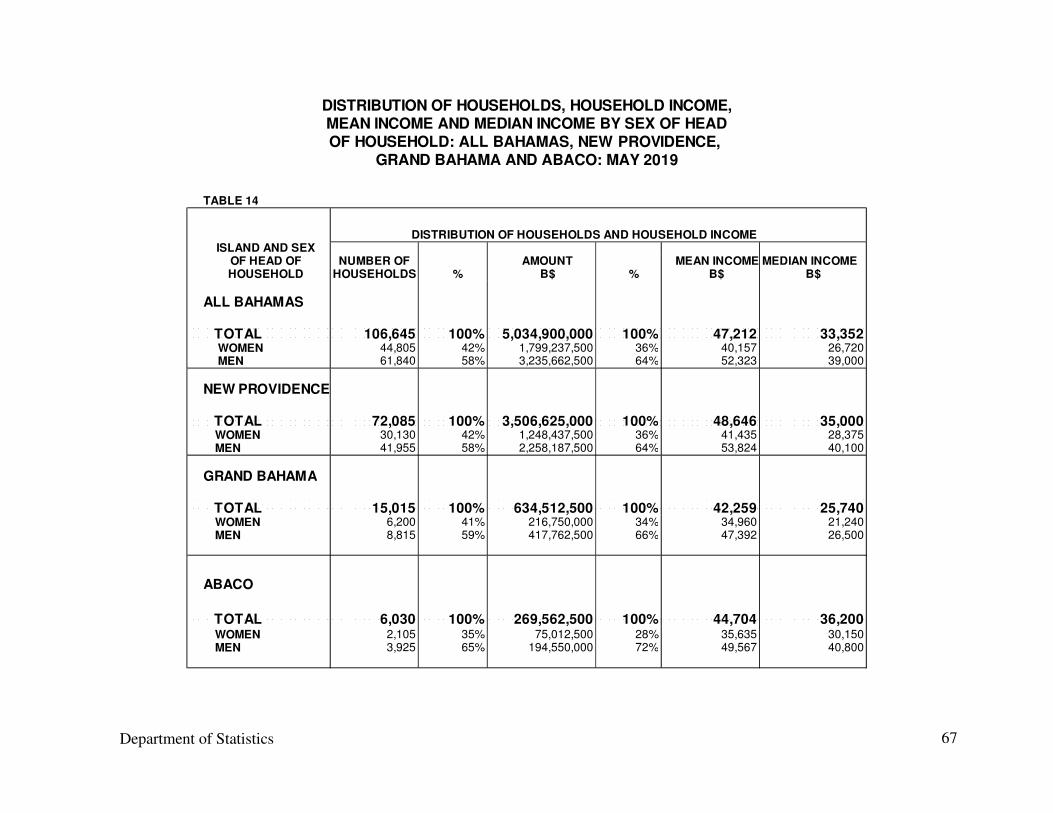
DISTRIBUTION OF HOUSEHOLDS, HOUSEHOLD INCOME,MEAN INCOME AND MEDIAN INCOME BY SEX OF HEADOF HOUSEHOLD: ALL BAHAMAS, NEW PROVIDENCE,
GRAND BAHAMA AND ABACO: MAY 2019
TABLE 14
DISTRIBUTION OF HOUSEHOLDS AND HOUSEHOLD INCOMEISLAND AND SEX
OF HEAD OF NUMBER OF AMOUNT MEAN INCOME MEDIAN INCOMEHOUSEHOLD HOUSEHOLDS % B$ % B$ B$
ALL BAHAMAS
TOTAL 106,645 100% 5,034,900,000 100% 47,212 33,352 WOMEN 44,805 42% 1,799,237,500 36% 40,157 26,720 MEN 61,840 58% 3,235,662,500 64% 52,323 39,000
NEW PROVIDENCE
TOTAL 72,085 100% 3,506,625,000 100% 48,646 35,000 WOMEN 30,130 42% 1,248,437,500 36% 41,435 28,375 MEN 41,955 58% 2,258,187,500 64% 53,824 40,100
GRAND BAHAMA
TOTAL 15,015 100% 634,512,500 100% 42,259 25,740 WOMEN 6,200 41% 216,750,000 34% 34,960 21,240 MEN 8,815 59% 417,762,500 66% 47,392 26,500
ABACO
TOTAL 6,030 100% 269,562,500 100% 44,704 36,200 WOMEN 2,105 35% 75,012,500 28% 35,635 30,150 MEN 3,925 65% 194,550,000 72% 49,567 40,800
Department of Statistics
68
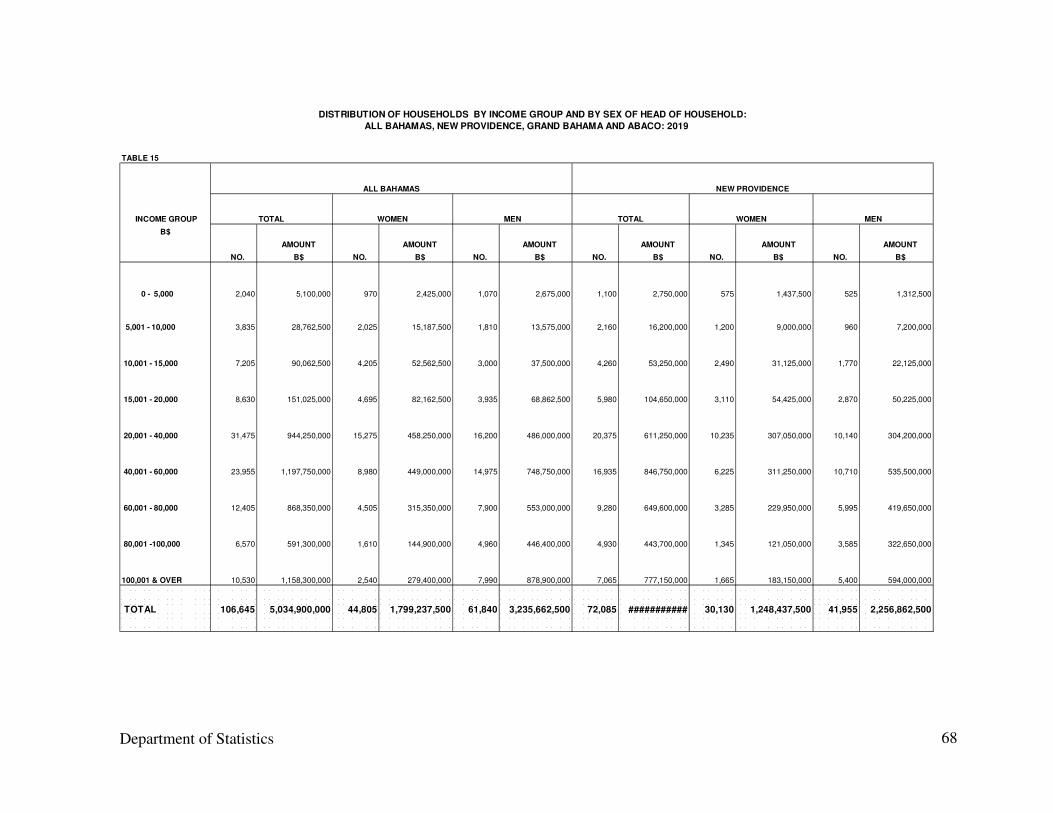
TABLE 15
ALL BAHAMAS NEW PROVIDENCE
INCOME GROUP TOTAL WOMEN MEN TOTAL WOMEN MEN
B$
AMOUNT AMOUNT AMOUNT AMOUNT AMOUNT AMOUNT
NO. B$ NO. B$ NO. B$ NO. B$ NO. B$ NO. B$
0 - 5,000 2,040 5,100,000 970 2,425,000 1,070 2,675,000 1,100 2,750,000 575 1,437,500 525 1,312,500
5,001 - 10,000 3,835 28,762,500 2,025 15,187,500 1,810 13,575,000 2,160 16,200,000 1,200 9,000,000 960 7,200,000
10,001 - 15,000 7,205 90,062,500 4,205 52,562,500 3,000 37,500,000 4,260 53,250,000 2,490 31,125,000 1,770 22,125,000
15,001 - 20,000 8,630 151,025,000 4,695 82,162,500 3,935 68,862,500 5,980 104,650,000 3,110 54,425,000 2,870 50,225,000
20,001 - 40,000 31,475 944,250,000 15,275 458,250,000 16,200 486,000,000 20,375 611,250,000 10,235 307,050,000 10,140 304,200,000
40,001 - 60,000 23,955 1,197,750,000 8,980 449,000,000 14,975 748,750,000 16,935 846,750,000 6,225 311,250,000 10,710 535,500,000
60,001 - 80,000 12,405 868,350,000 4,505 315,350,000 7,900 553,000,000 9,280 649,600,000 3,285 229,950,000 5,995 419,650,000
80,001 -100,000 6,570 591,300,000 1,610 144,900,000 4,960 446,400,000 4,930 443,700,000 1,345 121,050,000 3,585 322,650,000
100,001 & OVER 10,530 1,158,300,000 2,540 279,400,000 7,990 878,900,000 7,065 777,150,000 1,665 183,150,000 5,400 594,000,000
TOTAL 106,645 5,034,900,000 44,805 1,799,237,500 61,840 3,235,662,500 72,085 ########### 30,130 1,248,437,500 41,955 2,256,862,500
DISTRIBUTION OF HOUSEHOLDS BY INCOME GROUP AND BY SEX OF HEAD OF HOUSEHOLD:
ALL BAHAMAS, NEW PROVIDENCE, GRAND BAHAMA AND ABACO: 2019
Department of Statistics
69
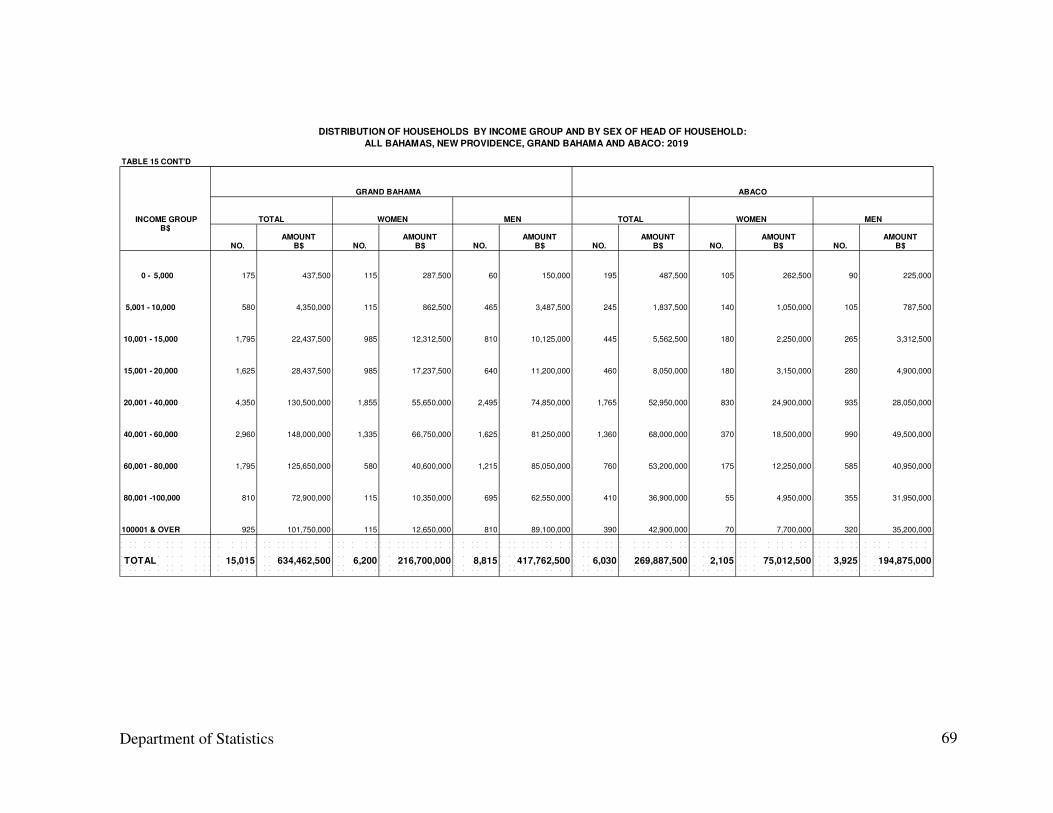
TABLE 15 CONT'D
GRAND BAHAMA ABACO
INCOME GROUP TOTAL WOMEN MEN TOTAL WOMEN MENB$
AMOUNT AMOUNT AMOUNT AMOUNT AMOUNT AMOUNTNO. B$ NO. B$ NO. B$ NO. B$ NO. B$ NO. B$
0 - 5,000 175 437,500 115 287,500 60 150,000 195 487,500 105 262,500 90 225,000
5,001 - 10,000 580 4,350,000 115 862,500 465 3,487,500 245 1,837,500 140 1,050,000 105 787,500
10,001 - 15,000 1,795 22,437,500 985 12,312,500 810 10,125,000 445 5,562,500 180 2,250,000 265 3,312,500
15,001 - 20,000 1,625 28,437,500 985 17,237,500 640 11,200,000 460 8,050,000 180 3,150,000 280 4,900,000
20,001 - 40,000 4,350 130,500,000 1,855 55,650,000 2,495 74,850,000 1,765 52,950,000 830 24,900,000 935 28,050,000
40,001 - 60,000 2,960 148,000,000 1,335 66,750,000 1,625 81,250,000 1,360 68,000,000 370 18,500,000 990 49,500,000
60,001 - 80,000 1,795 125,650,000 580 40,600,000 1,215 85,050,000 760 53,200,000 175 12,250,000 585 40,950,000
80,001 -100,000 810 72,900,000 115 10,350,000 695 62,550,000 410 36,900,000 55 4,950,000 355 31,950,000
100001 & OVER 925 101,750,000 115 12,650,000 810 89,100,000 390 42,900,000 70 7,700,000 320 35,200,000
TOTAL 15,015 634,462,500 6,200 216,700,000 8,815 417,762,500 6,030 269,887,500 2,105 75,012,500 3,925 194,875,000
DISTRIBUTION OF HOUSEHOLDS BY INCOME GROUP AND BY SEX OF HEAD OF HOUSEHOLD:
ALL BAHAMAS, NEW PROVIDENCE, GRAND BAHAMA AND ABACO: 2019
Department of Statistics
70
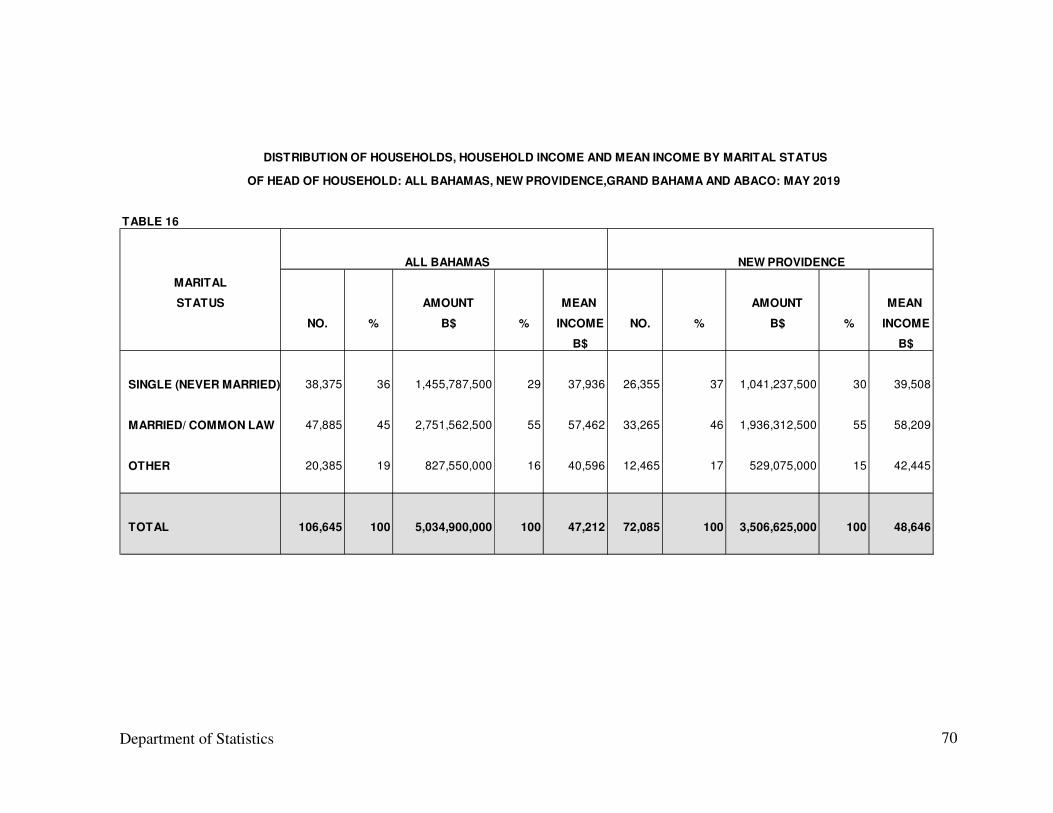
TABLE 16
ALL BAHAMAS NEW PROVIDENCE
MARITAL
STATUS AMOUNT MEAN AMOUNT MEAN
NO. % B$ % INCOME NO. % B$ % INCOME
B$ B$
SINGLE (NEVER MARRIED) 38,375 36 1,455,787,500 29 37,936 26,355 37 1,041,237,500 30 39,508
MARRIED/ COMMON LAW 47,885 45 2,751,562,500 55 57,462 33,265 46 1,936,312,500 55 58,209
OTHER 20,385 19 827,550,000 16 40,596 12,465 17 529,075,000 15 42,445
TOTAL 106,645 100 5,034,900,000 100 47,212 72,085 100 3,506,625,000 100 48,646
DISTRIBUTION OF HOUSEHOLDS, HOUSEHOLD INCOME AND MEAN INCOME BY MARITAL STATUS
OF HEAD OF HOUSEHOLD: ALL BAHAMAS, NEW PROVIDENCE,GRAND BAHAMA AND ABACO: MAY 2019
Department of Statistics
71
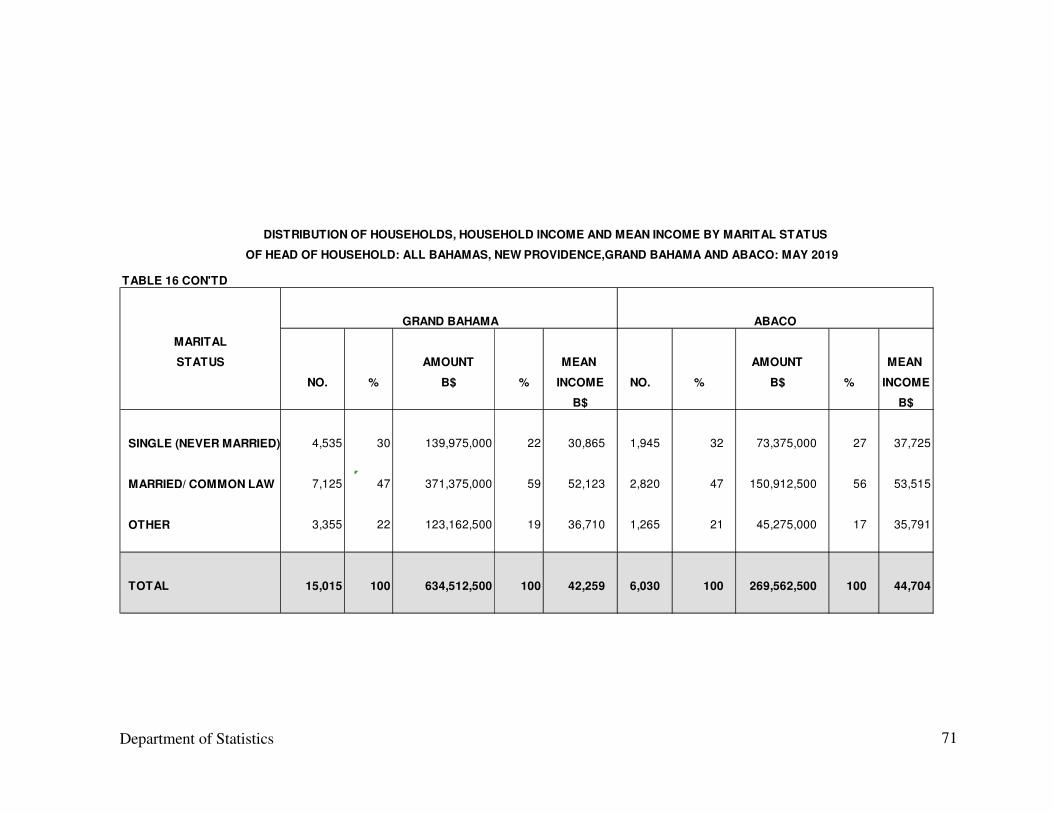
TABLE 16 CON'TD
MARITAL
STATUS AMOUNT MEAN AMOUNT MEAN
NO. % B$ % INCOME NO. % B$ % INCOME
B$ B$
SINGLE (NEVER MARRIED) 4,535 30 139,975,000 22 30,865 1,945 32 73,375,000 27 37,725
MARRIED/ COMMON LAW 7,125 47 371,375,000 59 52,123 2,820 47 150,912,500 56 53,515
OTHER 3,355 22 123,162,500 19 36,710 1,265 21 45,275,000 17 35,791
TOTAL 15,015 100 634,512,500 100 42,259 6,030 100 269,562,500 100 44,704
GRAND BAHAMA ABACO
DISTRIBUTION OF HOUSEHOLDS, HOUSEHOLD INCOME AND MEAN INCOME BY MARITAL STATUS
OF HEAD OF HOUSEHOLD: ALL BAHAMAS, NEW PROVIDENCE,GRAND BAHAMA AND ABACO: MAY 2019
Department of Statistics
72
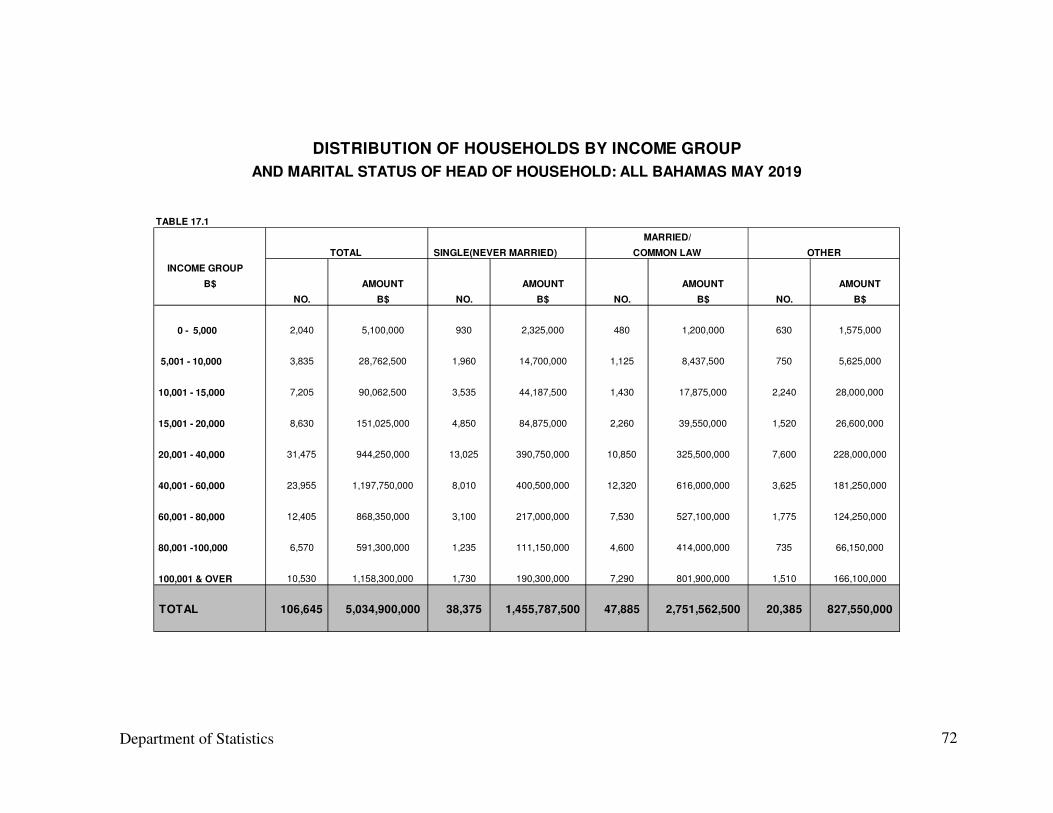
TABLE 17.1
TOTAL SINGLE(NEVER MARRIED)
INCOME GROUP
B$ AMOUNT AMOUNT AMOUNT AMOUNT
NO. B$ NO. B$ NO. B$ NO. B$
0 - 5,000 2,040 5,100,000 930 2,325,000 480 1,200,000 630 1,575,000
5,001 - 10,000 3,835 28,762,500 1,960 14,700,000 1,125 8,437,500 750 5,625,000
10,001 - 15,000 7,205 90,062,500 3,535 44,187,500 1,430 17,875,000 2,240 28,000,000
15,001 - 20,000 8,630 151,025,000 4,850 84,875,000 2,260 39,550,000 1,520 26,600,000
20,001 - 40,000 31,475 944,250,000 13,025 390,750,000 10,850 325,500,000 7,600 228,000,000
40,001 - 60,000 23,955 1,197,750,000 8,010 400,500,000 12,320 616,000,000 3,625 181,250,000
60,001 - 80,000 12,405 868,350,000 3,100 217,000,000 7,530 527,100,000 1,775 124,250,000
80,001 -100,000 6,570 591,300,000 1,235 111,150,000 4,600 414,000,000 735 66,150,000
100,001 & OVER 10,530 1,158,300,000 1,730 190,300,000 7,290 801,900,000 1,510 166,100,000
TOTAL 106,645 5,034,900,000 38,375 1,455,787,500 47,885 2,751,562,500 20,385 827,550,000
DISTRIBUTION OF HOUSEHOLDS BY INCOME GROUP
AND MARITAL STATUS OF HEAD OF HOUSEHOLD: ALL BAHAMAS MAY 2019
MARRIED/
COMMON LAW OTHER
Department of Statistics
73
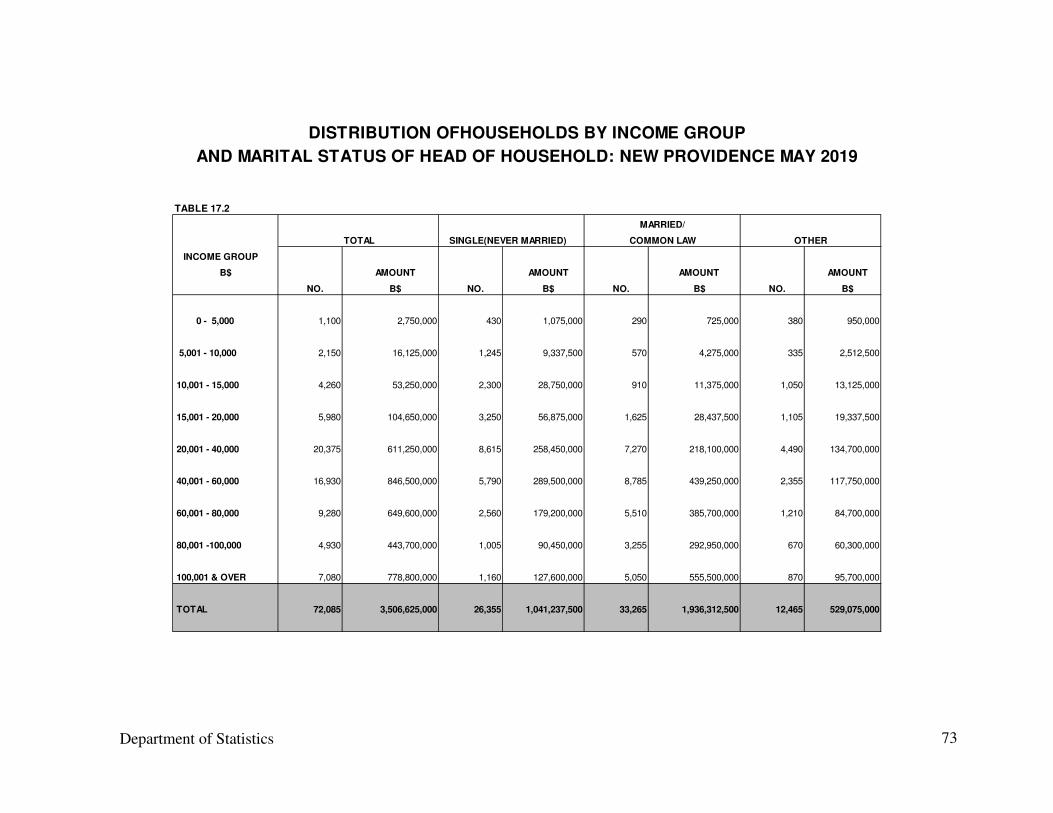
TABLE 17.2
TOTAL SINGLE(NEVER MARRIED)
INCOME GROUP
B$ AMOUNT AMOUNT AMOUNT AMOUNT
NO. B$ NO. B$ NO. B$ NO. B$
0 - 5,000 1,100 2,750,000 430 1,075,000 290 725,000 380 950,000
5,001 - 10,000 2,150 16,125,000 1,245 9,337,500 570 4,275,000 335 2,512,500
10,001 - 15,000 4,260 53,250,000 2,300 28,750,000 910 11,375,000 1,050 13,125,000
15,001 - 20,000 5,980 104,650,000 3,250 56,875,000 1,625 28,437,500 1,105 19,337,500
20,001 - 40,000 20,375 611,250,000 8,615 258,450,000 7,270 218,100,000 4,490 134,700,000
40,001 - 60,000 16,930 846,500,000 5,790 289,500,000 8,785 439,250,000 2,355 117,750,000
60,001 - 80,000 9,280 649,600,000 2,560 179,200,000 5,510 385,700,000 1,210 84,700,000
80,001 -100,000 4,930 443,700,000 1,005 90,450,000 3,255 292,950,000 670 60,300,000
100,001 & OVER 7,080 778,800,000 1,160 127,600,000 5,050 555,500,000 870 95,700,000
TOTAL 72,085 3,506,625,000 26,355 1,041,237,500 33,265 1,936,312,500 12,465 529,075,000
DISTRIBUTION OFHOUSEHOLDS BY INCOME GROUP
AND MARITAL STATUS OF HEAD OF HOUSEHOLD: NEW PROVIDENCE MAY 2019
MARRIED/
COMMON LAW OTHER
Department of Statistics
74
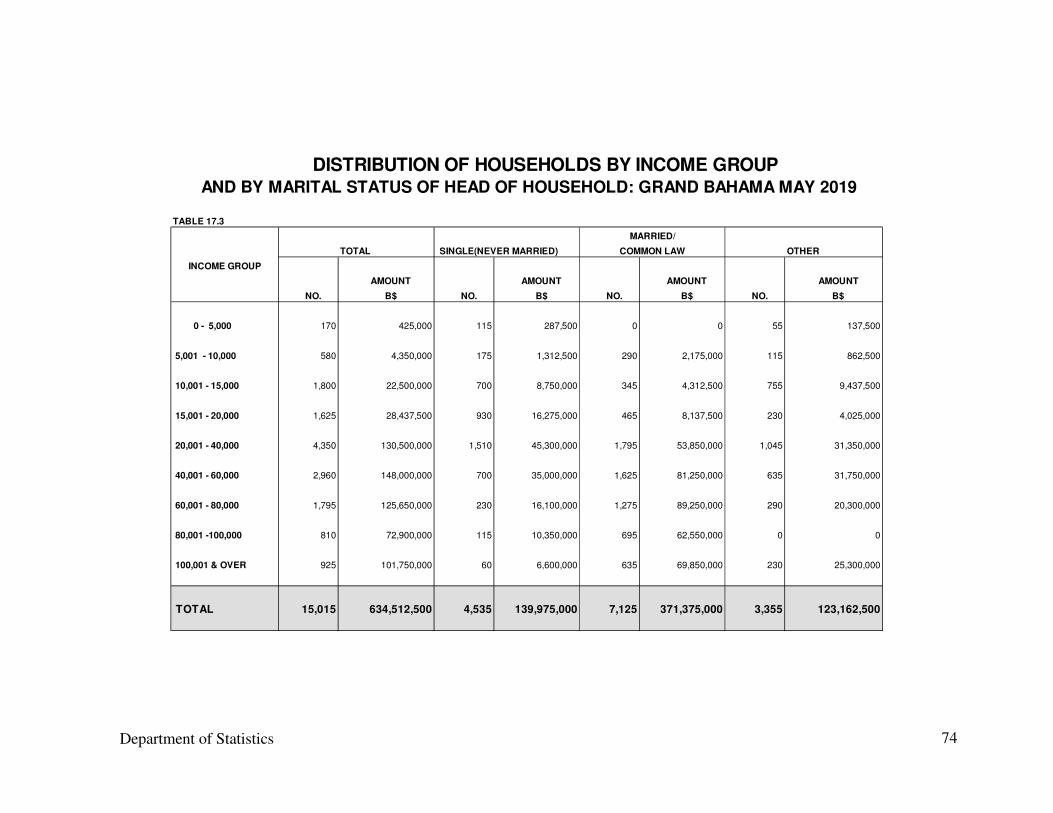
TABLE 17.3
TOTAL SINGLE(NEVER MARRIED) OTHER
INCOME GROUP
AMOUNT AMOUNT AMOUNT AMOUNT
NO. B$ NO. B$ NO. B$ NO. B$
0 - 5,000 170 425,000 115 287,500 0 0 55 137,500
5,001 - 10,000 580 4,350,000 175 1,312,500 290 2,175,000 115 862,500
10,001 - 15,000 1,800 22,500,000 700 8,750,000 345 4,312,500 755 9,437,500
15,001 - 20,000 1,625 28,437,500 930 16,275,000 465 8,137,500 230 4,025,000
20,001 - 40,000 4,350 130,500,000 1,510 45,300,000 1,795 53,850,000 1,045 31,350,000
40,001 - 60,000 2,960 148,000,000 700 35,000,000 1,625 81,250,000 635 31,750,000
60,001 - 80,000 1,795 125,650,000 230 16,100,000 1,275 89,250,000 290 20,300,000
80,001 -100,000 810 72,900,000 115 10,350,000 695 62,550,000 0 0
100,001 & OVER 925 101,750,000 60 6,600,000 635 69,850,000 230 25,300,000
TOTAL 15,015 634,512,500 4,535 139,975,000 7,125 371,375,000 3,355 123,162,500
DISTRIBUTION OF HOUSEHOLDS BY INCOME GROUP AND BY MARITAL STATUS OF HEAD OF HOUSEHOLD: GRAND BAHAMA MAY 2019
MARRIED/
COMMON LAW
Department of Statistics
75
TABLE 17.4
TOTAL SINGLE(NEVER MARRIED) OTHER
INCOME GROUP
AMOUNT AMOUNT AMOUNT AMOUNT
NO. B$ NO. B$ NO. B$ NO. B$
0 - 5,000 195 487,500 90 225,000 50 125,000 55 137,500
5,001 - 10,000 250 1,875,000 70 525,000 70 525,000 110 825,000
.
10,001 - 15,000 440 5,500,000 210 2,625,000 125 1,562,500 105 1,312,500
15,001 - 20,000 460 8,050,000 140 2,450,000 140 2,450,000 180 3,150,000
20,001 - 40,000 1,770 53,100,000 690 20,700,000 635 19,050,000 445 13,350,000
40,001 - 60,000 1,360 68,000,000 480 24,000,000 720 36,000,000 160 8,000,000
60,001 - 80,000 760 53,200,000 140 9,800,000 530 37,100,000 90 6,300,000
80,001 -100,000 405 36,450,000 35 3,150,000 320 28,800,000 50 4,500,000
100,001 & OVER 390 42,900,000 90 9,900,000 230 25,300,000 70 7,700,000
TOTAL 6,030 269,562,500 1,945 73,375,000 2,820 150,912,500 1,265 45,275,000
DISTRIBUTION OF HOUSEHOLDS BY INCOME GROUP AND BY MARITAL STATUS OF HEAD OF HOUSEHOLD: ABACO MAY 2019
MARRIED/
COMMON LAW
Department of Statistics
76
TABLE 18.1
NOT IN
INCOME GROUP TOTAL EMPLOYED UNEMPLOYED LABOUR FORCE
B$
AMOUNT AMOUNT AMOUNT AMOUNT
NO. B$ NO. B$ NO. B$ NO. B$
0 - 5,000 2,040 5,100,000 560 1,400,000 475 1,187,500 1,005 2,512,500
5,001 - 10,000 3,835 28,762,500 2,690 20,175,000 340 2,550,000 805 6,037,500
10,001 - 15,000 7,205 90,062,500 5,575 69,687,500 600 7,500,000 1,030 12,875,000
15,001 - 20,000 8,630 151,025,000 7,030 123,025,000 400 7,000,000 1,200 21,000,000
20,001 - 40,000 31,475 944,250,000 24,780 743,400,000 980 29,400,000 5,715 171,450,000
40,001 - 60,000 23,955 1,197,750,000 18,660 933,000,000 810 40,500,000 4,485 224,250,000
60,001 - 80,000 12,405 868,350,000 10,345 724,150,000 390 27,300,000 1,670 116,900,000
80,001 -100,000 6,570 591,300,000 5,300 477,000,000 240 21,600,000 1,030 92,700,000
100,001 & OVER 10,530 1,158,300,000 8,625 948,750,000 125 13,750,000 1,780 195,800,000
TOTAL 106,645 5,034,900,000 83,565 4,040,587,500 4,360 150,787,500 18,720 843,525,000
DISTRIBUTION OF HOUSEHOLDS BY INCOME GROUP
AND ECONOMIC STATUS OF HEAD OF HOUSEHOLD
ALL BAHAMAS MAY 2019
Department of Statistics
77
TABLE 18.2
NOT IN
INCOME GROUP TOTAL EMPLOYED UNEMPLOYED LABOUR FORCE
B$
AMOUNT AMOUNT AMOUNT AMOUNT
NO. B$ NO. B$ NO. B$ NO. B$
0 - 5,000 1,100 2,750,000 430 1,075,000 335 837,500 335 837,500
5,001 - 10,000 2,150 16,125,000 1,530 11,475,000 335 2,512,500 285 2,137,500
10,001 - 15,000 4,260 53,250,000 3,250 40,625,000 385 4,812,500 625 7,812,500
15,001 - 20,000 5,980 104,650,000 4,785 83,737,500 335 5,862,500 860 15,050,000
20,001 - 40,000 20,375 611,250,000 15,545 466,350,000 860 25,800,000 3,970 119,100,000
40,001 - 60,000 16,930 846,500,000 13,490 674,500,000 620 31,000,000 2,820 141,000,000
60,001 - 80,000 9,280 649,600,000 7,890 552,300,000 290 20,300,000 1,100 77,000,000
80,001 -100,000 4,930 443,700,000 4,020 361,800,000 100 9,000,000 810 72,900,000
100,001 & OVER 7,080 778,800,000 5,980 657,800,000 100 11,000,000 1,000 110,000,000
TOTAL 72,085 3,506,625,000 56,920 2,849,662,500 3,360 111,125,000 11,805 545,837,500
DISTRIBUTION OF HOUSEHOLDS BY INCOME GROUP
AND ECONOMIC STATUS OF HEAD OF HOUSEHOLD
NEW PROVIDENCE MAY 2019
Department of Statistics
78
TABLE 18.3
NOT IN
INCOME GROUP TOTAL EMPLOYED UNEMPLOYED LABOUR FORCE
B$
AMOUNT AMOUNT AMOUNT AMOUNT
NO. B$ NO. B$ NO. B$ NO. B$
0 - 5,000 170 425,000 0 0 110 275,000 60 150,000
5,001 - 10,000 580 4,350,000 520 3,900,000 0 0 60 450,000
10,001 - 15,000 1,800 22,500,000 1,510 18,875,000 175 2,187,500 115 1,437,500
15,001 - 20,000 1,625 28,437,500 1,450 25,375,000 60 1,050,000 115 2,012,500
20,001 - 40,000 4,350 130,500,000 3,710 111,300,000 60 1,800,000 580 17,400,000
40,001 - 60,000 2,960 148,000,000 2,495 124,750,000 115 5,750,000 350 17,500,000
60,001 - 80,000 1,795 125,650,000 1,560 109,200,000 60 4,200,000 175 12,250,000
80,001 -100,000 810 72,900,000 755 67,950,000 0 0 55 4,950,000
100,001 & OVER 925 101,750,000 865 95,150,000 0 0 60 6,600,000
TOTAL 15,015 634,512,500 12,865 556,500,000 580 15,262,500 1,570 62,750,000
DISTRIBUTION OF HOUSEHOLDS BY INCOME GROUP
AND ECONOMIC STATUS OF HEAD OF HOUSHOLD
GRAND BAHAMA MAY 2019
Department of Statistics
79
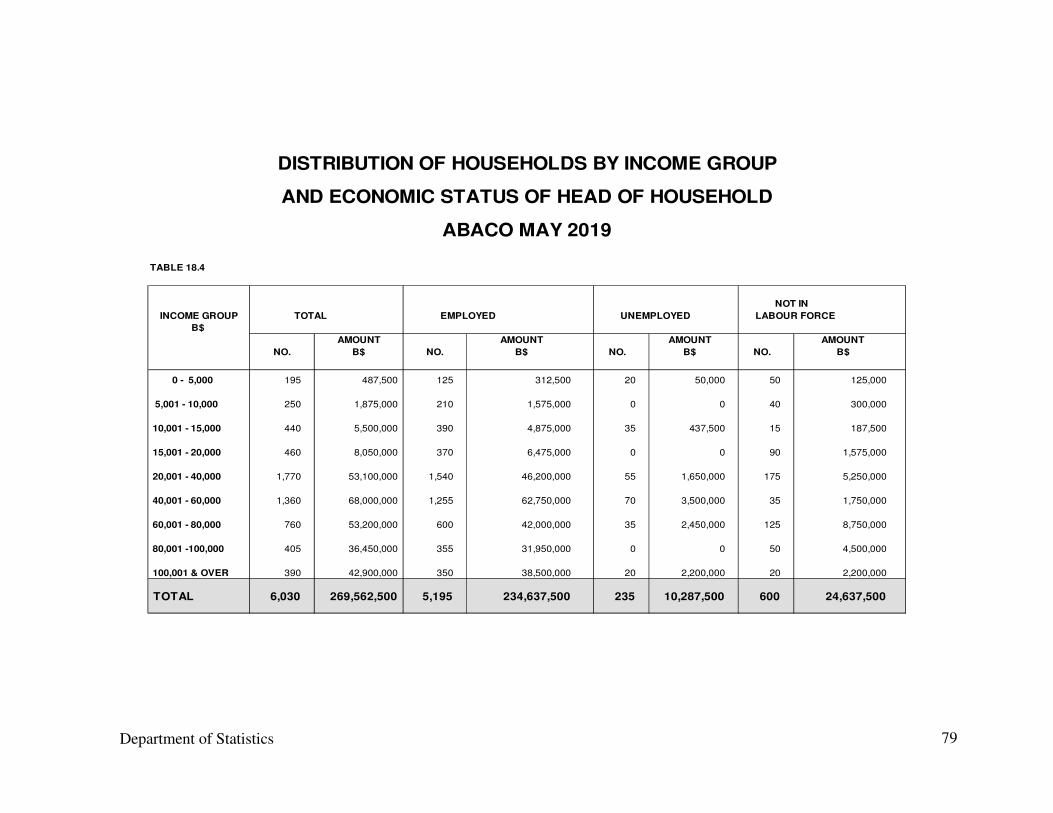
TABLE 18.4
NOT IN
INCOME GROUP TOTAL EMPLOYED UNEMPLOYED LABOUR FORCE
B$
AMOUNT AMOUNT AMOUNT AMOUNT
NO. B$ NO. B$ NO. B$ NO. B$
0 - 5,000 195 487,500 125 312,500 20 50,000 50 125,000
5,001 - 10,000 250 1,875,000 210 1,575,000 0 0 40 300,000
10,001 - 15,000 440 5,500,000 390 4,875,000 35 437,500 15 187,500
15,001 - 20,000 460 8,050,000 370 6,475,000 0 0 90 1,575,000
20,001 - 40,000 1,770 53,100,000 1,540 46,200,000 55 1,650,000 175 5,250,000
40,001 - 60,000 1,360 68,000,000 1,255 62,750,000 70 3,500,000 35 1,750,000
60,001 - 80,000 760 53,200,000 600 42,000,000 35 2,450,000 125 8,750,000
80,001 -100,000 405 36,450,000 355 31,950,000 0 0 50 4,500,000
100,001 & OVER 390 42,900,000 350 38,500,000 20 2,200,000 20 2,200,000
TOTAL 6,030 269,562,500 5,195 234,637,500 235 10,287,500 600 24,637,500
DISTRIBUTION OF HOUSEHOLDS BY INCOME GROUP
AND ECONOMIC STATUS OF HEAD OF HOUSEHOLD
ABACO MAY 2019
Department of Statistics
80
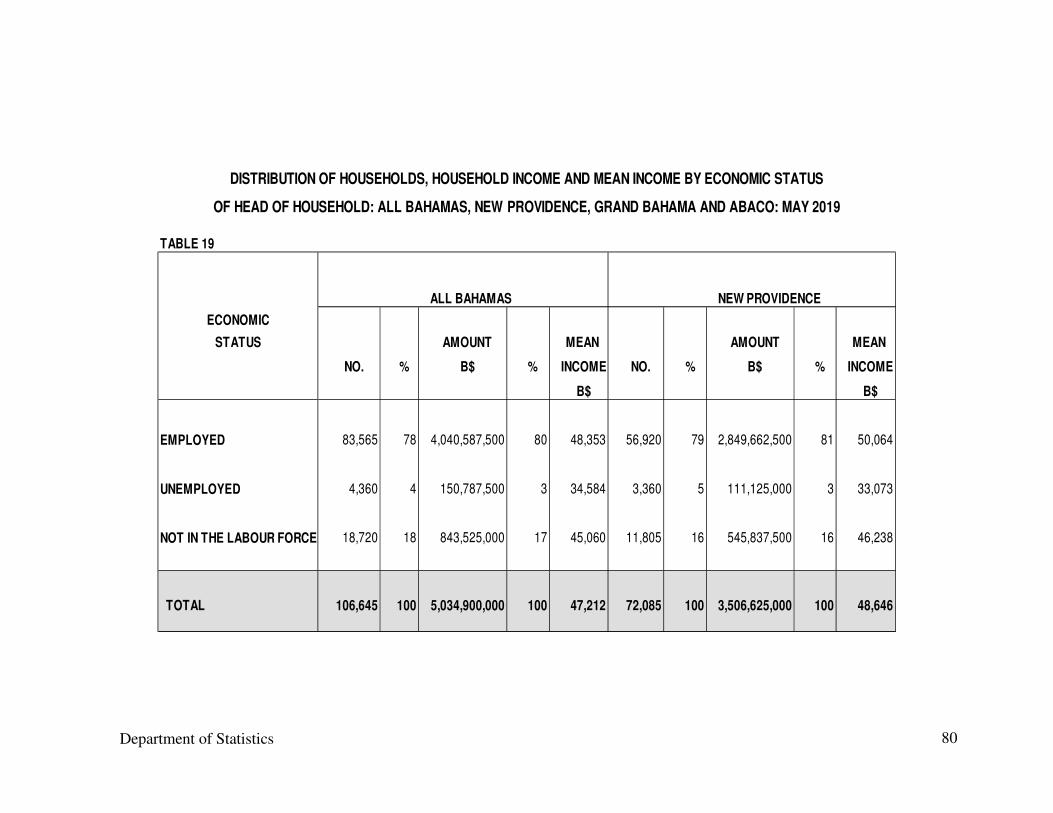
TABLE 19
ALL BAHAMAS NEW PROVIDENCE
ECONOMIC
STATUS AMOUNT MEAN AMOUNT MEAN
NO. % B$ % INCOME NO. % B$ % INCOME
B$ B$
EMPLOYED 83,565 78 4,040,587,500 80 48,353 56,920 79 2,849,662,500 81 50,064
UNEMPLOYED 4,360 4 150,787,500 3 34,584 3,360 5 111,125,000 3 33,073
NOT IN THE LABOUR FORCE 18,720 18 843,525,000 17 45,060 11,805 16 545,837,500 16 46,238
TOTAL 106,645 100 5,034,900,000 100 47,212 72,085 100 3,506,625,000 100 48,646
DISTRIBUTION OF HOUSEHOLDS, HOUSEHOLD INCOME AND MEAN INCOME BY ECONOMIC STATUS
OF HEAD OF HOUSEHOLD: ALL BAHAMAS, NEW PROVIDENCE, GRAND BAHAMA AND ABACO: MAY 2019
Department of Statistics
81
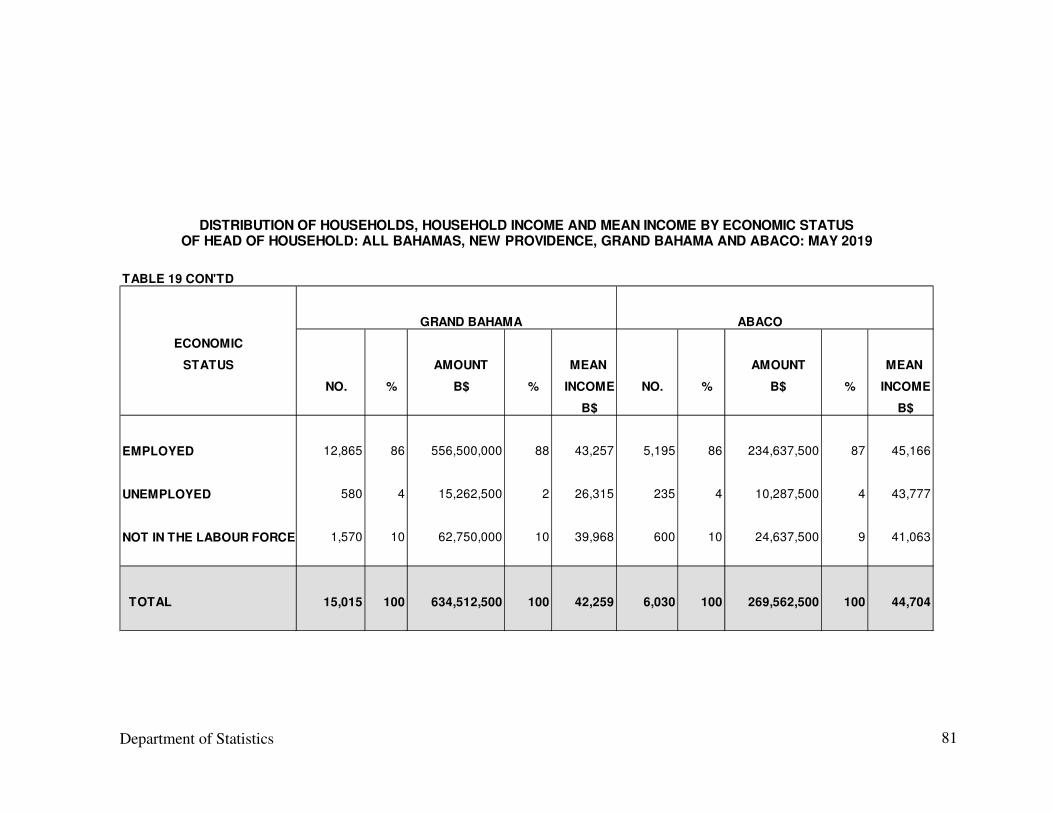
TABLE 19 CON'TD
GRAND BAHAMA ABACO
ECONOMIC
STATUS AMOUNT MEAN AMOUNT MEAN
NO. % B$ % INCOME NO. % B$ % INCOME
B$ B$
EMPLOYED 12,865 86 556,500,000 88 43,257 5,195 86 234,637,500 87 45,166
UNEMPLOYED 580 4 15,262,500 2 26,315 235 4 10,287,500 4 43,777
NOT IN THE LABOUR FORCE 1,570 10 62,750,000 10 39,968 600 10 24,637,500 9 41,063
TOTAL 15,015 100 634,512,500 100 42,259 6,030 100 269,562,500 100 44,704
DISTRIBUTION OF HOUSEHOLDS, HOUSEHOLD INCOME AND MEAN INCOME BY ECONOMIC STATUSOF HEAD OF HOUSEHOLD: ALL BAHAMAS, NEW PROVIDENCE, GRAND BAHAMA AND ABACO: MAY 2019
Department of Statistics
82
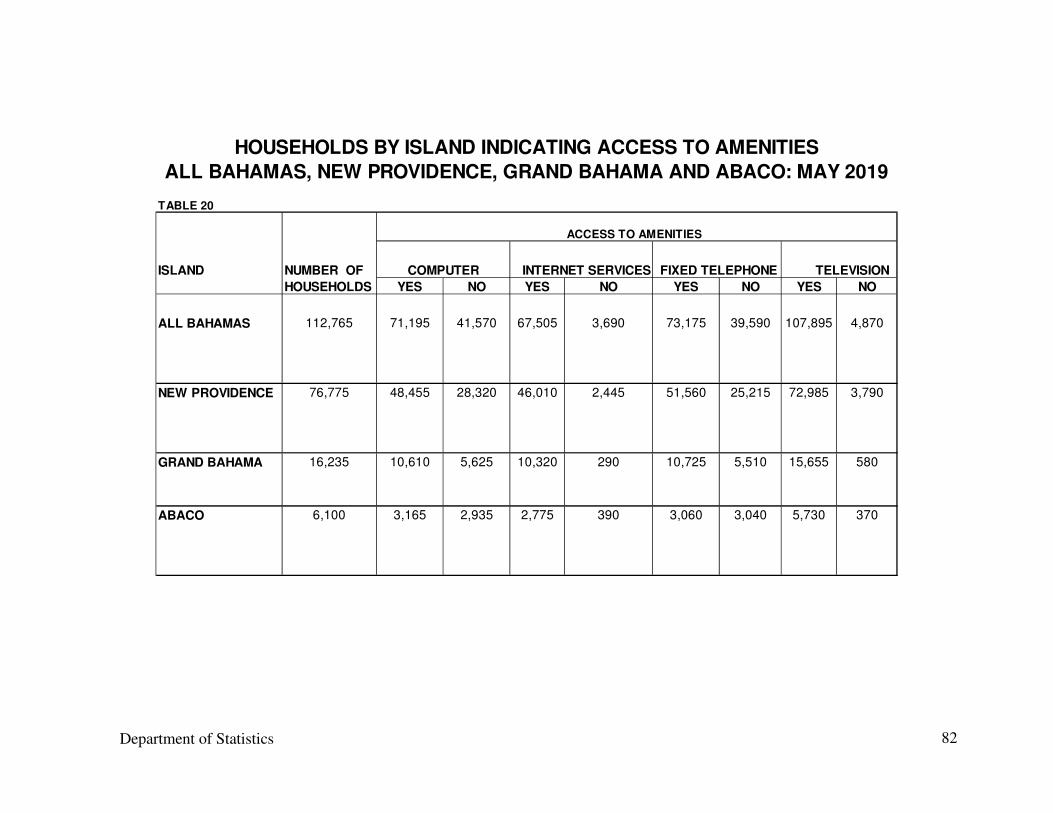
TABLE 20
ACCESS TO AMENITIES
ISLAND NUMBER OF
HOUSEHOLDS YES NO YES NO YES NO YES NO
ALL BAHAMAS 112,765 71,195 41,570 67,505 3,690 73,175 39,590 107,895 4,870
NEW PROVIDENCE 76,775 48,455 28,320 46,010 2,445 51,560 25,215 72,985 3,790
GRAND BAHAMA 16,235 10,610 5,625 10,320 290 10,725 5,510 15,655 580
ABACO 6,100 3,165 2,935 2,775 390 3,060 3,040 5,730 370
HOUSEHOLDS BY ISLAND INDICATING ACCESS TO AMENITIES
ALL BAHAMAS, NEW PROVIDENCE, GRAND BAHAMA AND ABACO: MAY 2019
COMPUTER INTERNET SERVICES FIXED TELEPHONE TELEVISION
Department of Statistics
83
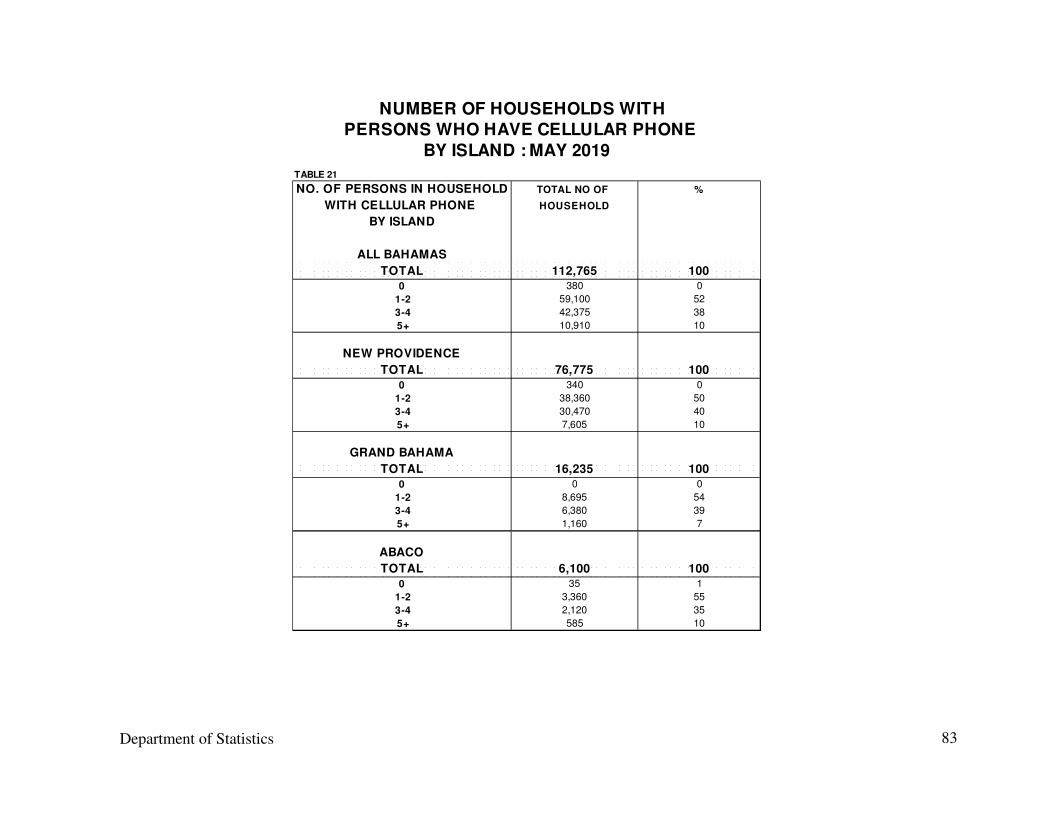
PERSONS WHO HAVE CELLULAR PHONE
BY ISLAND : MAY 2019
TABLE 21
NO. OF PERSONS IN HOUSEHOLD TOTAL NO OF %
WITH CELLULAR PHONE HOUSEHOLD
BY ISLAND
ALL BAHAMAS
TOTAL 112,765 1000 380 0
1-2 59,100 52
3-4 42,375 38
5+ 10,910 10
NEW PROVIDENCE
TOTAL 76,775 1000 340 0
1-2 38,360 50
3-4 30,470 40
5+ 7,605 10
GRAND BAHAMA
TOTAL 16,235 1000 0 0
1-2 8,695 54
3-4 6,380 39
5+ 1,160 7
ABACO
TOTAL 6,100 1000 35 1
1-2 3,360 55
3-4 2,120 35
5+ 585 10
NUMBER OF HOUSEHOLDS WITH
84
APPENDIX I –HISTORICAL BACKGROUD
85
HISTORICAL BACKGROUND
In 1973, the Department of Statistics (DOS) introduced the first Household Survey.
It was designed to collect data on the Labour Force as well as Household Income.
The survey was conducted biennially until 1979, after which there was a break in
the series. The survey was revived in 1986 and since 1988 has been conducted
annually except in census years.
In 1991, a Rotational Sample Survey was introduced and since the 2000 Census a
new design was implemented. The early surveys covered New Providence, Grand
Bahama and six of the Family Islands. This coverage proved costly and was also
difficult to manage. Results, from the latest Census indicated that New Providence
and Grand Bahama accounted for approximately 85% of both population and
dwellings in The Bahamas. Therefore, the new sample design has New Providence
and Grand Bahama and Abaco sampled annually with the remaining islands
sampled on a rotation basis.
86
APPENDIX II - CONCEPTS AND DEFINITIONS
87
CONCEPTS AND DEFINITIONS
REFERENCE WEEK
In 2019, the enumeration began on May 6th and continued until the end of May. The week
proceeding this period, April 9th to May 5th, was the reference week. All data collected referred
to economic activity during that seven-day period.
PRIVATE HOUSEHOLD
A private household is defined as a person or group of persons who live together and who
collectively make provision for sustenance, budgeting and other essentials for living. Any one of
the following may constitute a household:
i) a family with or without lodgers or servants.
ii) a person living alone.
iii) a group of unrelated persons living together.
HEAD OF HOUSEHOLD
The head of the household is that person who is acknowledged as such by the other members.
This is usually but not necessarily, the person who bears the chief responsibility for the economic
maintenance of the household.
HOUSEHOLD INCOME
This is the total annual receipts of personal incomes of all persons in the household and includes
payments for production, such as wages and salaries, income from self-employment and earned
rent, dividends and interest receipts.
AGE
Age refers to age at last birthday in years
MARITAL STATUS
This refers to the personal status of each individual in relation to the marriage laws, or customs
of The Bahamas. Marital status categories are as follows:
i) single(never married)
ii) married(legally)
iii) common-law
iv) other
88
THE LABOUR FORCE/ ECONOMICALLY ACTIVE POPULATION
The labour force is that segment of the population, fifteen years of age and over, engaged in or
willing and able to be engaged in the production of goods and services. It is composed of those
persons with jobs- the Employed, and those without jobs but who were engaged in some job-
seeking activity- the Unemployed.
THE EMPLOYED POPULATION
This includes:
i) all persons 15 years of age and over who worked for pay any time during the
reference week or who worked without pay for at least one hour in a family-
operated enterprise.
ii) Persons who were temporarily absent from their regular jobs because of vacation,
illness, inclement weather, or similar reasons.
THE UNEMPLOYED POPULATION
The unemployed population incorporates persons 15 years of age and over who did not work or
have a job from which they were temporarily absent during the reference week, but were actively
looking for work in the four weeks prior to the survey week and were able and willing to work.
Persons who did not look for work because they were on layoff or waiting to start a new job
within the following 30 days were also counted among the unemployed.
THE UNEMPLOYMENT RATE
Represents the number of persons unemployed as a percentage of the labour force.
THE LABOUR FORCE PARTICIPATION RATE
The percentage of the population 15 years of age and over that is in the labour force (people who
work or are looking for work).
EMPLOYMENT STATUS
Classifies persons as follows:
i) Government Employees- individuals who work for a government department or
corporation.
ii) Private Employees- individuals who work for a private business.
iii) Self-Employed Persons – persons who operate their own business, with or without
paid help.
iv) Unpaid Family Workers- persons who work in family enterprises, without pay, for at
least one hour during the reference week.
89
OCCUPATION
This refers to the type of work actually performed by individuals. Classification is according to
the International Standard Classification of Occupations (ISCO).
INDUSTRY
The industry in which individuals are classified relates to the main type of economic activity
carried on by the firms or business in which they are employed. Classification is based on the
International Standard Industrial Classification of all Economic Activities (ISIC).
PART-TIME WORKERS
For the purposes of the survey, part-time workers were determined subjectively (an individual’s
own assessment). To obtain this information employed persons were asked, “Do you work full-
time or part-time?”
DISCOURAGED WORKERS
These are persons who may or may not have worked before, are able and willing to work, but are
not actively seeking work because they believe they would not find work. Because they were
not seeking work during the four weeks preceding the date of enumeration they were not counted
among the unemployed and are therefore, not a part of the labour force.

84