Embed Size (px)
Citation preview

Copyright Warning & Restrictions
The copyright law of the United States (Title 17, United States Code) governs the making of photocopies or other
reproductions of copyrighted material.
Under certain conditions specified in the law, libraries and archives are authorized to furnish a photocopy or other
reproduction. One of these specified conditions is that the photocopy or reproduction is not to be “used for any
purpose other than private study, scholarship, or research.” If a, user makes a request for, or later uses, a photocopy or reproduction for purposes in excess of “fair use” that user
may be liable for copyright infringement,
This institution reserves the right to refuse to accept a copying order if, in its judgment, fulfillment of the order
would involve violation of copyright law.
Please Note: The author retains the copyright while the New Jersey Institute of Technology reserves the right to
distribute this thesis or dissertation
Printing note: If you do not wish to print this page, then select “Pages from: first page # to: last page #” on the print dialog screen

The Van Houten library has removed some of the personal information and all signatures from the approval page and biographical sketches of theses and dissertations in order to protect the identity of NJIT graduates and faculty.
ABSTRACT
TERAHERTZ WIRELESS COMMUNICATION
by Ke Su
The goal of this thesis is to explore Terahertz (THz) wireless communication technology.
More specifically the objective is to develop and characterize several THz
communication systems and study the effect of atmosphere propagation through fog
droplets and dust particles on THz communications.
For demonstration, a THz continuous wave (CW) photomixing system is
designed. Terahertz signals are phase encoded with both analog ramp signals and
pseudorandom binary data, transmitted over a short distance, and detected. The limitation
of transmission bandwidth, low single to noise ratio, vibration effects are also analyzed.
In order to study and compare propagation features of THz links with infrared (IR) links
under different weather conditions, a THz and IR communications lab setup with a
maximum data rate of 2.5 Gb/s at 625 GHz carrier frequency and 1.5 µm wavelength,
have been developed respectively. A usual non return-to-zero (NRZ) format is applied to
modulate the IR channel but a duobinary coding technique is used for driving the
multiplier chain-based 625 GHz source, which enables signaling at high data rate and
higher output power. The bit-error rate (BER), signal-to-noise ratio (SNR) and power on
the receiver side have been measured, which describe the signal performance.
Since weather conditions such as fog and dust exhibit a spectral dependence in the
atmospheric attenuation, the corresponding impact on THz in comparison with IR
communications is not equivalent. Simulation results of attenuation by fog and dust in the
millimeter and sub-millimeter waveband (from 0.1 to 1 THz) and infrared waveband (1.5

µm) are presented and compared. Experimentally, after THz and IR beams propagated
through the same weather conditions (fog), performance of both channels are analyzed
and compared. The attenuation levels for the IR beam are typically several orders of
magnitude higher than those for the THz beam. Mie scattering theory was used to study
the attenuation of THz and IR radiation due to the dust particle. Different amounts of dust
are loaded in the chamber to generate a variety of concentration for beam propagation. As
the dust loading becomes heavier, the measured attenuation becomes more severe. Under
identical dust concentrations, IR wavelengths are strongly attenuated while THz shows
almost no impact.

TERAHERTZ WIRELESS COMMUNICATION
by Ke Su
A Dissertation Submitted to the Faculty of
New Jersey Institute of Technology and Rutgers, the State University of New Jersey - Newark
in Partial Fulfillment of the Requirements for the Degree of Doctor of Philosophy in Applied Physics
Federated Department of Physics
January 2012

Copyright © 2012 by Ke Su
ALL RIGHTS RESERVED .

APPROVAL PAGE
TERAHERTZ WIRELESS COMMUNICATION
Ke Su Dr. John F. Federici, Dissertation Advisor Date Distinguished Professor of Physics, NJIT Dr. Lothar Moeller, Committee Member Date Bell Labs, Alcatel-Lucent, Holmdel, NJ Dr. Tao Zhou, Committee Member Date Associate Professor of Physics, NJIT Dr. Andrei Sirenko, Committee Member Date Associate Professor of Physics, NJIT Dr. Zhen Wu, Committee Member Date Professor of Physics, Rutgers University, Newark, NJ Dr. Haim Grebel, Committee Member Date Professor of Electrical and Computer Engineering, NJIT

BIOGRAPHICAL SKETCH
Author: Ke Su
Degree: Doctor of Philosophy
Date: January 2012
Undergraduate and Graduate Education:
• Doctor of Philosophy in Applied Physics,New Jersey Institute of Technology, Newark, NJ, 2012
• Master of Science in Material Science,Fudan University, Shanghai, P. R. China, 2006
• Bachelor of Science in Applied Physics,Zhengzhou University, Zhengzhou, P. R. China, 2003
Major: Applied Physics
Presentations and Publications:
K. Su, L. Moeller, R. B. Barat, and J. F. Federici, " Experimental comparison ofperformance degradation from terahertz and infrared wireless link in fog," Journalof the Optical Society of America A: Optics and Image Science, and Vision(Accepted) (2011).
J. F. Federici, L. Moeller, and K. Su, " Terahertz communications," in Handbook ofTerahertz Technology for Imaging and Sensing (Submitted) (2011).
L. Moeller, J. F. Federici, and K. Su, "2.5 Gbit/s duobinary signalling with narrowbandwidth 0.625 terahertz source," Electronics Letters 47, 856-858 (2011).
L. Moeller, J. F. Federici, and K. Su, "THz wireless communications: 2.5 Gb/s error-freetransmission at 625 GHz using a narrow-bandwidth 1 mW THz source," inGeneral Assembly and Scientific Symposium, URSI, (Istanbul 2011).
K. Su, Z. Liu, R. B. Barat, D. E. Gary, Z.-H. Michalopoulou, and J. F. Federici, "Two-dimensional interferometric and synthetic aperture imaging with a hybridterahertz/ millimeter wave system," Appl. Opt. 49, E13-E19 (2010).
iv

v
Z.-H. Michalopoulou, S. Mukherjee, Y. Hor, K. Su, Z. Liu, R. B. Barat, D. E. Gary, and J. F. Federici, "RDX detection with THz spectroscopy," Journal of Infrared, Millimeter, and Terahertz Waves 31, 1171-1181 (2010).
Z. Liu, K. Su, D. E. Gary, J. F. Federici, R. B. Barat, and Z.-H. Michalopoulou, "Video-
rate terahertz interferometric and synthetic aperture imaging," Appl. Opt. 48, 3788-3795 (2009).
A. M. Sinyukov, Z. Liu, Y. L. Hor, K. Su, R. B. Barat, D. E. Gary, Z.-H. Michalopoulou,
I. Zorych, J. F. Federici, and D. Zimdars, "Rapid-phase modulation of terahertz radiation for high-speed terahertz imaging and spectroscopy," Opt. Lett. 33, 1593-1595 (2008).
K. Su, Z. Liu, D. E. Gary, R. B. Barat, Z.-H. Michalopoulou, and J. F. Federici,
"Interferometric and synthetic aperture real-time terahertz imaging," presentation at American Physics Society Meeting, (Pittsburgh, PA, March 2009).
K. Su, Z. Liu, L. Moeller, and J. F. Federici, "Data encoding on continuous wave THz
signals for sensing," presentation at International Symposium on Spectral Sensing Research, (Hoboken, NJ, June 2008).
K. Su, Z. Liu, D. E. Gary, R. B. Barat, Z.-H. Michalopoulou, and J. F. Federici, "Video-
rate terahertz interferometric synthetic aperture imaging," presentation at Eighth New Jersey Universities Homeland Security Research Consortium Symposium, (Princeton, NJ, December 2008).

vi
To my beloved parents, my husband and my son
谨献给我深爱的父母谨献给我深爱的父母谨献给我深爱的父母谨献给我深爱的父母, 丈夫和儿子丈夫和儿子丈夫和儿子丈夫和儿子

vii
ACKNOWLEDGMENT
I would like to express my sincere gratitude to Dr. John Federici, my academic advisor,
not only for his extensive knowledge, insight, and guidance in the academic field, but
also for his support, encouragement, and personal advice. Special appreciation is given to
Dr. Lothar Moeller at Bell Labs Lucent Technologies. As one of my committee members,
Dr. Moeller has always been extremely generous with his time, knowledge and ideas to
help me with experimental methodology and system setup development.
Appreciation is also extended to Dr. Andrei Sirenko, Dr. Tao Zhou, Dr. Zhen Wu
and Dr. Haim Grebel for actively participating in my research and serving in my
dissertation committee.
I would like to acknowledge Dr. Barat Robert for numerous conversations and
valuable advices for developing the fog and dust chamber. I also thank my friends in the
lab and physics department for their help and discussions during my years at NJIT. The
staff of physics department was extremely kind and helpful to me, and my work wouldn't
have been completed without their help.
This research is supported by the National Science Foundation under Grant No.
ECCS-1102222.
Finally, I wish to offer the utmost appreciation to my beloved family: my husband
and my little baby boy for their understanding and the sacrifices they have made
throughout my study and my parents for their encouragement and endless support in my
life.

viii
TABLE OF CONTENTS
Chapter Page
1 INTRODUCTION……………………………………………………………… 1
1.1 Terahertz Communication Systems………………………………………. 1
1.1.1 THz Time-Domain Systems……………………………………… 5
1.1.2 Photonic MMW/ UTC-PD Opto-Electronics Systems …………... 8
1.1.3 Integrated Circuit Systems………………………………………... 9
1.1.4 Multiplied Microwave Systems…………………………………... 10
1.1.5 Quantum Cascade Laser Systems………………………………… 11
1.2 Infrared Communication Systems………………………………………... 12
1.3 Atmospheric and Free-Space Damping Including Fog, Rain, Dust and
Snow on THz and IR links………………………………………………...
15
1.3.1 Basic Definitions………………………………………………….. 15
1.3.1.1 Atmosphere……………………………………………... 15
1.3.1.2 Aerosol………………………………………………….. 16
1.3.1.3 Attenuation……………………………………………... 16
1.3.1.4 Absorption……………………………………………… 16
1.3.1.5
1.3.1.6
Scattering………………………………………………..
Scintillation……………………………………………...
17
17
1.3.2 Atmospheric Attenuation of THz and IR communication Links… 18
1.3.2.1 Simulations……………………………………………... 18
ix
TABLE OF CONTENTS (Continued)
Chapter Page
1.3.2.2 Experimental Characterization of Environment on THz
Communication Links…………………………………
19
1.3.3 Scintillation Effects on the THz and IR Communication Link…... 22
2 EXPERIMENTAL METHODOLOGY………………………………………. 25
2.1 THz CW Photo Mixing Communication System……………………….. 25
2.1.1 Distributed Feedback (DFB) Diode Laser System………………. 27
2.1.1.1 DFB Laser Source……………………………………… 27
2.1.1.2 BoosTA (High Power Semiconductor Optical
Amplifiers)…………………………………………….. 28
2.1.1.3 ISCAN (Quadrature Interferometer)………………….. 28
2.1.2 Signal Modulation………………………………………………. 30
2.1.3 THz Generation and Detection………………………………….. 32
2.1.3.1 Theory…………………………………………………. 32
2.1.3.2 Photoconductive Antenna…………………………….. 33
2.2 Frequency Multiplier Chain Based 625 GHz Wireless Communication
System……………………………………………………………………
34
2.2.1 THz Source……………………………………………………….. 35
2.2.2 Signal Modulation (Duobinary Modulation)……………………. 36
2.2.3 Transmission Channel…………………………………………… 37

x
TABLE OF CONTENTS (Continued)
Chapter Page
2.2.4 THz Receiver and Signal Detection…………………………….. 37
2.3 IR Wireless Communication System at 1.5 µm…………………………. 38
2.3.1 Transmitter and Receiver Elements of IR Communication Link… 39
2.3.2 Proportional–Integral–Derivative Controller (PID Controller)….. 41
2.3.2.1 Introduction of PID Topology………………………….. 41
2.3.2.2 PID Controller for the Fog Environment………………. 42
2.3.3 Data Acquisition…………………………………………………. 43
3 PERFORMANCE ANALYSIS AND CHARACTERIZATION OF THE
DATA LINKS………………………………………………………………….
44
3.1 Characterization of THz CW Photo Mixing Data Link………………….. 44
3.1.1 Analog Ramp Signal Modulation………………………………… 44
3.1.2 Pseudorandom Bit Sequence (PRBS) Modulation………………. 46
3.1.3 Characterization of THz Tx and Rx by Fast Spectrum Scanning… 47
3.1.4 Limitation of THz CW Photo Mixing Data Link………………… 49
3.1.4.1 THz Tx and Rx Spectrum Limitation………………….. 49
3.1.4.2 Bandwidth Limitation………………………………….. 50
3.1.4.3 Low Signal to Noise Ratio (SNR) and Vibration Effects. 50
3.2 Characterization of Frequency Multiplier Chain Based 625 GHz Wireless
Communication Link…………………………………………………….. 51
xi
TABLE OF CONTENTS (Continued)
Chapter Page
3.2.1 Double Balanced Mixer Characteristics…………………………. 51
3.2.2 Power Transfer Function Measurement………………………… 52
3.2.3 Performance of Duobinary Modulation Technique……………… 53
3.2.4 Performance Analysis of Detected Signal………………………... 55
3.2.5 Signal-To-Noise Ratio (SNR) Measurement…………………… 57
3.3 Characterization of IR Wireless Communication System at 1.5 µm…….. 58
4 COMPARISON OF PERFORMANCE DEGRADATION FROM
TERAHERTZ AND INFRARED WIRELESS LINKS IN FOG……………..
59
4.1 Fog Introduction………………………………………………………… 60
4.2 Fog Attenuation and Scattering Mechanisms…………………………… 61
4.2.1 Fog Attenuation…………………………………………………. 61
4.2.2 Scattering Mechanism…………………………………………… 62
4.3 Scintillation Effects on the THz and IR Communication Link…………... 64
4.4 Millimeter Wave Attenuation Due to Fog………………………………. 67
4.4.1 Double-Debye Model……………………………………………. 67
4.4.2 Simulation Results……………………………………………….. 69
4.5 Infrared Wave Attenuation Due to Fog…………………………………... 71
4.5.1 Full Mie Scattering Calculation: Theoretical Approach…………. 71
4.5.1.1 Total Extinction Coefficient…………………………… 71

xii
TABLE OF CONTENTS (Continued)
Chapter Page
4.5.1.2 Particle Size Distribution………………………………. 72
4.5.1.3 Fog Attenuation………………………………………… 72
4.5.2 Empirical Approach………………………………………………. 73
4.5.2.1 Principles of Kruse, Kim and Al Nabulsi Models……… 73
4.5.3 Simulation Results………………………………………………... 75
4.6 Experimental Results…………………………………………………….. 78
4.6.1 Experimental Setup……………………………………………… 78
4.6.2 Experimental Results…………………………………………….. 79
4.6.2.1 Signal Attenuation by Fog……………………………… 79
4.6.2.2 Fog Visibility Characterization………………………… 82
4.6.2.3 Scintillation Effects in Fog Chamber………………….. 83
5 COMPARISON OF PERFORMANCE DEGRADATION FROM
TERAHERTZ AND INFRARED WIRELESS LINKS IN DUST…………….
86
5.1 Experimental Methodology………………………………………………. 87
5.1.1 Dust Particle Size Distribution for Bentonite……………………. 87
5.1.2 Dust Chamber Design…………………………………………….. 88
5.1.3 Force Balance Analysis of the Dust Particle……………………... 90
5.1.3.1 The Intermediate Range of Reynolds Numbers………… 93
5.1.3.2 Is Newton’s Regime Appropriate?................................... 94
xiii
TABLE OF CONTENTS (Continued)
Chapter Page
5.1.3.3 Is the Reynolds Number in the Stoke’s Regime?............. 94
5.1.3.4 Volumetric Flow Rate Calculation……………………... 95
5.1.4 Experiment Setup………………………………………………… 95
5.2 Mie Scattering Theory……………………………………………………. 96
5.3 Experimental Results…………………………………………………….. 98
5.3.1 0.05 g of Dust…………………………………………………….. 98
5.3.1.1 Transmission Link Performance with Disabled PID
Controller……………………………………………….
98
5.3.1.2 Scintillation Effects study with PID Controller………… 101
5.3.2 0.08 g of Dust………………………………………………........... 104
5.3.2.1 Transmission Link Performance with Disabled PID
Controller……………………………………………….
104
5.3.2.2 Scintillation Effects Study with PID Controller……….. 106
5.3.3 Comparison of Different Dust Densities…………………………. 107
5.4 Simulation Results………………………………………………………... 109
6 CONCLUSIONS AND FUTURE PERSPECTIVES…………………………... 115
6.1 Summary of Research Results……………………………………………. 115
6.2 Future Work………………………………………………………………. 117

xiv
LIST OF TABLES
Table Page
1.1 Summary of THz Communication Link Measurements ........................................
4
1.2 Division of Infrared Radiation by International Organization for Standardization (ISO)……………………………………………………….……………………..
13
4.1 Typical Fog Droplets with Radius, and Corresponding Size Parameter for Wavelengths of 480 µm and 1.5 µm....…………………………………………...
63
4.2 Double-Debye Model Predication of Attenuation for Frequency Up to 1000 GHz, Water Content: w=1g/m3 ……………….....……………………………….
69
4.3 DSD Gamma Parameters, Reflectivity Z, LWC and Visibility V of the Considered Four Models of the Fog...……………………....................................
72
4.4 Comparison of THz Experimental and Theoretical Specific Attenuation at Different Visibility ……………………………………………………………….
83
5.1 Bentonite Particle Size Distribution Parameter …..….....……………………….. 87
5.2 Reynolds Numbers for Different Regimes………………………………………. 93
xv
LIST OF FIGURES
Figure Page
1.1 The electromagnetic spectrum...……..…………………..………………………. 1
1.2 Experimental setup for analog THz communication link using and external THz modulator ………………………………………………………………………...
5
1.3 THz communication set-up based on THz TDS system………………………….
6
1.4 (a)-(c) Eye diagrams at different data rate and error-free operation, (d) at 1.5 Mb/s with BER=10-4, (e) measured and simulated required TVS at different data rates……………………………………………………………………………….
8
1.5 Microwave frequency multiplier (a) THz source (b) THz receiver……………... 10
1.6 Schematic of link showing quantum cascade laser at left and quantum well photodetector on right……………………………………………………………
12
1.7 Calculated atmospheric attenuation in THz and IR band………………………... 18
1.8 Comparison of attenuation coefficient between calculation and measurements at 103 GHz for a 1 minute integration time…………………………………………
20
1.9 Measured BER for 120GHz wireless link (10.3Gb/s data rate) versus rain attenuation………………………………………………………………………..
21
1.10 Comparison between calculation and measurements at 355.2 GHz for a 1 minute integration time…………………………………………………………...............
21
1.11 Air turbulence causes refractive index fluctuations resulting into speckle (intensity variations at receiver) that limits the reach of IR systems……………..
23
2.1 Schematic diagram for THz CW photo mixing communication system (a) laser system (b) optical system (c) signal modulation and detection (d) THz Tx and Rx ………………………………………………………………………………...
26
2.2 Quadrature interferometer (ISCAN)……………………………………………... 29
2.3 Quadrature signal and corresponding mode signatures………………………….. 30

xvi
LIST OF FIGURES (Continued)
Figure Page
2.4 Electro-optic phase modulator …………………………………………………... 31
2.5 Terahertz generation Laser-gated photoconductive antenna Vbias: Bias voltage applied to the gallium-arsenide (GaAs) substrate ………………………………..
34
2.6 Schematic of up converting frequency multiplier chain based 625 GHz transmission link ………………………………………………………………...
35
2.7 (a) Schematic diagram of IR wireless communication link, (b) IR source, (c) IR receiver and signal detection …………………………………………………….
39
2.8 The block diagram of PID controller……………………………………………. 41
3.1 THz detector voltage output versus time as a function of modulated phase. The sawtooth waveforms (left column) illustrate the modulated voltage (modulation rate is 100 kHz). Middle column and left column are simulated detector signals and experimental detector output, respectively. (a) Phase modulation is 5 radian (smaller than ), corresponding modulation voltage is 290V (b) Phase modulation is , corresponding modulation voltage is 360V (c) Phase modulation is 8 radian (larger than ), corresponding modulation voltage is 460V………………………………………………………………………………
45
3.2 Eye diagrams at different data rates (a) data rate:150kb/s (b) data rate: 200kb/s (c) data rate:400kb/s (b) data rate: 500kb/s. ……………………………………..
47
3.3 Rapid frequency tuning curves for the measured THz (a) 1 THz scanning range with 1 GHz step (b) Unit in logarithmic scale with 1 GHz step (c) 30 GHz to 130 GHz scanning range with 100MHz step…………………………………….
48
3.4 (a) THz detector voltage output versus time as a function of modulated phase. (modulation rate is 100 kHz, THz carrier wave frequency: 91GHz). CH1: the sawtooth waveform (modulation function) CH2: detected signal from THz Rx. (b) noise level……………………………………………………………………..
50
3.5 Double balanced mixer characteristics…………………………………………... 51
3.6 Power transfer function of system and spectrum of data signal at THz source input………………………………………………………………………………
53

xvii
LIST OF FIGURES (Continued)
Figure Page
3.7 Eye diagrams at 100 ps/div (a) output PPG, (b) output add & delay filter, (c) after low pass filter (LPF1), (d) input to THz source (carrier @12.5 GHz), (e) output RX LPF, and (f) corresponding signal spectra……………………………
54
3.8 Bit error curves for long and short PRBSs with and without decision threshold optimization. Eye diagram at decision gate input………………………………..
57
3.9 IR BER curves for long and short PRBSs with fixed decision threshold optimized at BER=10-6 ………………………………………………………….
58
4.1 (a) Size parameter distribution of fog particles for wavelength of 480 um (625 GHz) and 1.5 um and the corresponding regions for Rayleigh, Mie, and non-selective or geometrical scattering………………………………………………..
63
4.1 (b) Isotropic scattering (Rayleigh scattering) and forward scattering (Mie scattering)…………………………………………………………………………
64
4.2 Air turbulence causes refractive index fluctuations resulting into speckle (intensity variations at receiver) that limits the reach of IR systems……………..
65
4.3 (a) Double-Debye model predication of attenuation for frequency up to 1000 GHz, water content: w=1g/m3 and temperature from -20 ℃ to +20 ℃ (b) Logarithmic scale…………………………………………………………………
70
4.4 (a) Extinction coefficients versus wavelength for advection fog and various visibility values as derived from FASCOD (b) Extinction coefficients vs wavelength for radiation fog and various visibility values as derived from FASCOD…………………………………………………………………………
73
4.5 Specific attenuation using Kruse model for 1550 nm wavelength………………. 76
4.6 Specific attenuation using Kim model for 1550 nm wavelength………………… 76
4.7 Specific attenuation using Al Nabulsi model for 1550 nm wavelength…………. 77
4.8 Specific attenuation for 1550 nm wavelength predicted by different models…… 77
4.9 Specific attenuation versus wavelength for various visibility values derived from Kim model…………………………………………………………………..
78

xviii
LIST OF FIGURES (Continued)
Figure Page
4.10 (a) Schematic diagram of THz and IR wireless communication link through fog chamber, (b) IR source, (c) IR receiver and signal detection…………………….
79
4.11 (a) Attenuation of THz link and IR link with time (b) Log(BER) of THz link and IR link with time (c) IR attenuation in dB relative to THz attenuation in dB over time………………………………………………………………………….
81
4.12 Specific Attenuation of THz link and IR link with time (dB/km)……………….. 82
4.13 Infrared visibility with time calculated by Kim model …………………………. 82
4.14 (a) Individiually normalized outputs of photodetectors(PD1, PD2, PD3) in dB, b) Opitcal power of IR and RF power of THz due to fog, c) Log(BER) of IR and THz links impaired by fog………………………………………………………..
85
5.1 Particle size distribution of Bentonite measured by laser diffraction particle size analyzer…………………………………………………………………………...
87
5.2 (a) Schematic diagram of dust chamber design (b) real picture of dust chamber design…………………………………………………………………………….
89
5.3 Free body diagram of the dust particle…………………………………………... 90
5.4 (a) Schematic diagram of THz and IR wireless communication link through dust chamber, (b) IR source, (c) IR receiver and signal detection…………………….
96
5.5 (a) Predicted IR attenuation due to spherical airborne particles, (b) Predicted THz attenuation due to spherical airborne particles…………………………….
98
5.6 Detected IR signal for the 0.05gram dust (a) Free Space (PD-2) (b) SM Fiber Detector (PD-3) (c) Optical Power of IR(dBm), (d) Log(BER) of IR…………...
99
5.7 (a) Attenuation of THz link and IR link with time (b) Log(BER) of THz link and IR link with time……………………………………………………………..
100
5.8 Detected IR signal with single mode fiber detector and free space detector for the source caused vibration……………………………………………………….
101

xix
LIST OF FIGURES (Continued)
Figure Page
5.9 (a) Individually normalized outputs of photodetector(PD-1, PD-2, PD-3) in dB, (b) opitcal power of IR and RF power of THz due to dust, (c) Log(BER) of IR and THz links impaired by dust………………………………………………….
103
5.10 Detected IR signal for the 0.08gram dust (a) Free Space (PD-2) (b) SM Fiber Detector (PD-3) (c) Optical Power of IR(dBm), (d) Log(BER) of IR…………..
104
5.11 (a) Attenuation of THz link and IR link with time (0.08gram) (b) Log(BER) of THz link and IR link with time…………………………………………………...
105
5.12 (a) Individually normalized outputs of photodetector (PD1, PD2, PD3) (b) outputs of the photodetector with noise elimination……………………………...
106
5.13 (a) Normalized voltage detected by free space detector (PD-2) for different amount of the dust (b) Optical power of IR for different amounts of dust (c) Log(BER) of IR for different amounts of dust …………………………………..
107
5.14 (a) Attenuation for different amount of the dust (b) Log(BER) of THz for different amounts of dust…………………………………………………………
109
5.15 (a) The extinction efficiency as a function of size parameter. (b) The extinction efficiency as a function of frequency. (c) The relationship between parameter size and frequency………………………………………………………………..
111
5.16 The particle density with time…………………………………………………… 113
5.17 Comparison of experimental results and simulation results of THz attenuation ……………………………………………………………………….
114
1
CHAPTER 1
INTRODUCTION
In this chapter, basic background information of Terahertz (THz) technology and Infrared
(IR) technology are introduced. Then ongoing research on the development of
experimental THz communication links and IR communication links is reviewed. Finally,
scintillation effects and atmospheric and weather impacts (dust, fog, rain) on the THz and
IR communication are discussed and compared.
1.1 Terahertz Communication Systems
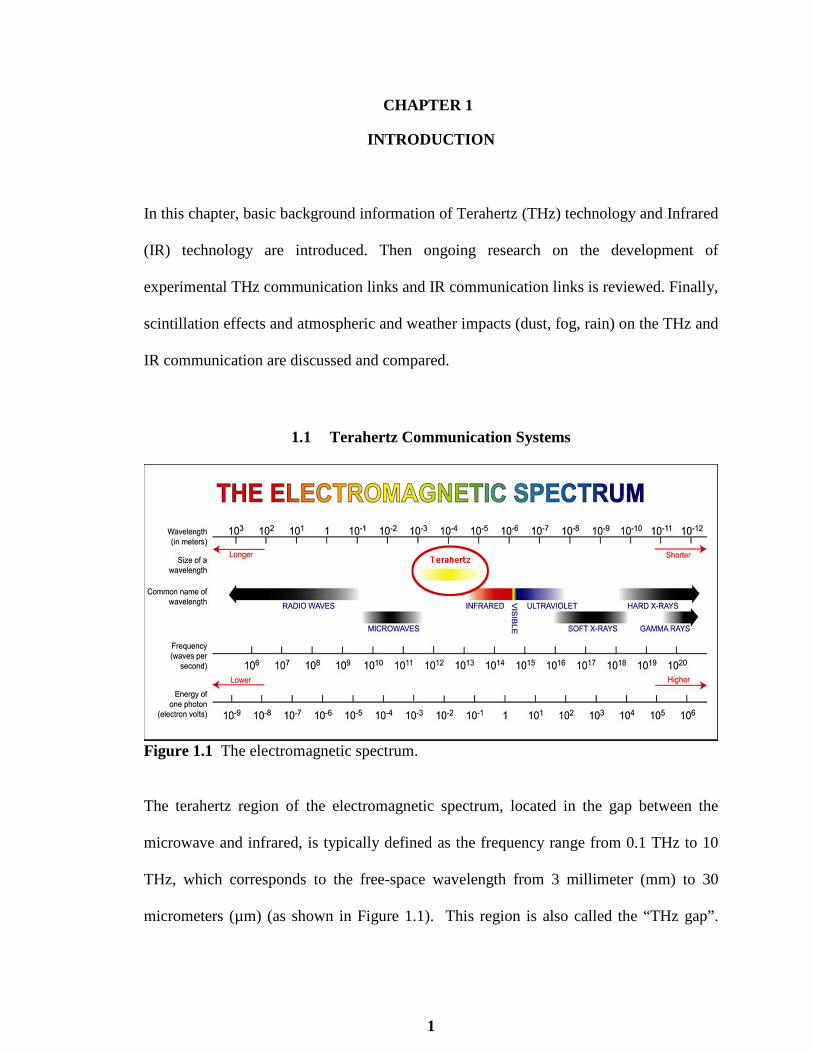
Figure 1.1 The electromagnetic spectrum.
The terahertz region of the electromagnetic spectrum, located in the gap between the
microwave and infrared, is typically defined as the frequency range from 0.1 THz to 10
THz, which corresponds to the free-space wavelength from 3 millimeter (mm) to 30
micrometers (µm) (as shown in Figure 1.1). This region is also called the “THz gap”.

2
It is bridging the gap between the electronic and photonic response. Below the THz range
(microwaves), electronic components are commercially available. In the frequency range
higher than THz (optical and infrared waves), high efficient thermal sources and
commercial thermal cameras (detectors) are available and optical techniques are
applicable. However, within the THz range, neither optical nor electronics devices could
fully meet the application requirements. It lacks suitable components such as convenient
and inexpensive sources, sensitive detectors, and high speed modulators.
Over the past few years, the field of terahertz science and technology has changed
dramatically. Many new advances in the technology of THz sources and detectors [1-3]
have revolutionized the field. Many applications for THz systems has been introduced in
the literature, ranging from explosive and concealed weapon detection [4-6], biology
imaging [7, 8], nondestructive testing and quality [9, 10] control to next generation
wireless communication systems. Here, the focus is on describing approaches to wireless
THz communication.
Edholm’s law of bandwidth [11] predicts the need of data rates around 5-10 Gb/s
in 10-15 years from now. The increasing demand for higher data rates suggests the
development of wireless communication networks at higher carrier frequencies.
Consequently, one can expect that such systems will soon push towards to the low THz
frequency range due to its inherently larger accessible bandwidth compared to microwave
and millimeter communication bands [12]. A review by Koch [13] in 2007 predicts that
Wireless LAN systems will be replaced or supplemented by the THz based
communication systems in 2017-2023.
3
Compared to microwave or millimeter wave systems, THz wireless
communication link offers some advantages. The summary is as follows:
• Ultra-high bandwidth: THz communications have the potential for increased bandwidth capacity compared to microwave systems.
• Unregulated frequencies: Frequencies above 300 GHz are currently unallocated by the Federal Frequency Allocation Commission (FCC) and offer very high bandwidth.
• Directional beam: THz communications are inherently more directional than microwave or millimeter (MMW) links since THz waves have less free-space diffraction. The link budget analysis [15] suggested at the same antenna aperture with the microwave, transmission for the 350 GHz require a large gain per antenna, which requires THz emission to be highly directional and therefore, line of sight detection is required.
• High security: THz communication can be implemented as a “secure” communication link [16]. THz can support ultrahigh bandwidth spread spectrum systems, which can enable secure communication, large capacity networks, and protection against channel jamming attacks.
Towards higher carrier competing frequencies (IR), THz also shows some
advantages, such as:
• Lower attenuation of THz radiation compared to IR under certain weather conditions (fog and dust).
• Scintillation effects of THz radiation are smaller than IR radiation which allows THz to provide longer links compared to wireless IR link.
• There is more ambient IR light noise typically present compared to ambient THz noise.
• There is an eye safety with IR wavelengths requiring that IR transmitted power be limited to eye-safe power levels, however, THz is safe for human health with available commercial source power.
In this following part, the recent developments of ultrahigh-speed wireless
communication links using carrier frequencies of over 100 GHz will be reviewed (as
shown in Table 1.1).

4
Table 1.1 Summary of THz Communication Link Measurements. BER Stands for Bit-Error-Rate. PDA Stands for Photoconductive Antenna. MZM Stands for Mach-Zender Modulator. PRBS Stands for Pseudo Random Bit Sequence. UTC-PD Stands for Uni-Traveling Carrier Photodetector. ASK Stands for Amplitude-Shift Keying. NRC Stands for Non-Return-to-Zero. MMIC Stands for Millimeter Wave Integrated Circuits
Source: [16, 35]
THz system THz carrier frequency (GHz)
Modulation hardware
Maximum distance (m)
Modulation method Modulation rate or bandwidth
BER Reference
THz time-domain
system
300 External modulator 0.48 Analog 6 kHz [17] 300 PDA 1 Analog 5 Kb/s [18] 300 PDA 1 Digital (PRBS) 1 MHz 10-8 [19]
Opto-electronic /UTC-PD
120 Optical MZM modulator
100 Digital (PRBS)
10 Gb/s 10-10 [20]
120 Optical MZM modulator
250 450
Digital (ASK)
3 Gb/s 10-10 [21, 22]
200 Optical MZM modulator
2.6 Digital (NRZ)
1.0625 Gb/s 10-9 [23]
250 Optical modulator 0.5 Digital (ASK)
8 Gb/s 10-10 [24, 25]
300-400 Optical modulator 0.5 Digital (ASK)
2 Gb/t, 12.5 Gb/t 10-12 [26, 27]
Millimeter wave integrated circuit
120 MMIC 800 Digital (ASK) 10 Gb/s 10-12 [28]
120 MMIC 5800 Digital (ASK) 10 Gb/s 10-12
[29]
Microwave multiplication
300 Sub harmonic mixer
22 Analog 6 MHz [30]
300 Sub harmonic mixer
52 Digital video broadcasting
96 Mb/s ~10-8 at 30cm
[31]
625 Microwave mixer 1 Duobinary/ PRBS 2.5 Gb/s 10-10 [32]
Quantum cascade laser (QCL)
3800 Electronic modulation of QCL
2 Quantum cascade laser 10 kHz [33, 34]

5
1.1.1 THz Time-Domain Systems (TDS)
The first three THz wireless communication links in the Table 1.1 are all based on THz
time-domain systems. All three structures have some common characteristics: (a)
photoconductive antenna (PDA) structures are all utilized as the THz transmitter and
receivers (b) transmission center frequency is roughly 0.3 THz (c) The maximum data
rate is limited by the repetition rate of the Ti: Sapphire Laser (typically ~80 MHz) and
electronic bandwidth of the PDA (~1 MHz) (d) To detect the maximum THz signal at the
peak of THz pulse, the transmitter to receiver distance ant timing of the gating pulsed
need to be adjusted. Consequently, timing jitter of the laser or variations in the optical
path length degrades the quality of the link.
Figure 1.2 Experimental setup for analog THz communication link using an external THz modulator. Source: [17]
Kleine-Ostmann et al. [17] first demonstrated the transmission of an audio signal
through THz communication links which utilized a modified THz time-domain system
and an external modulator based on the depletion of a two-dimensional electron gas

6
(shown in Figure 1.2). The audio signals up to 25 kHz could be transmitted through a
0.48 m distance. The bandwidth of the THz detection was limited by the time-constant of
the lock-in and 7 kHz cutoff frequency of the I-V amplifier.
Another analog THz link based on THz time-domain system was demonstrated by
Liu et al. [18]. The audio signals were modulated upon the THz carrier by directly
modulating the bias voltage of the THz receiver. The transmission distance is about 100
cm. The 3 dB frequency response of the transmission channel was about 20 kHz. To
demonstrate the fidelity of data transmission, music was transmitted through the data
channel by using the electronic output from a computer’s speaker to modulate the
electronic bias to the THz transmitter. In frequency domain, good fidelity of data
transmission up to ~2 kHz could be observed.
Figure 1.3 THz communication set-up based on THz TDS system. HA: high-voltage amplifier, PCS: photoconductive switch, TA: transimpedance amplifier, PA: preamplifier, LP: low pass, CLK: clock tone. Source:[19]
7
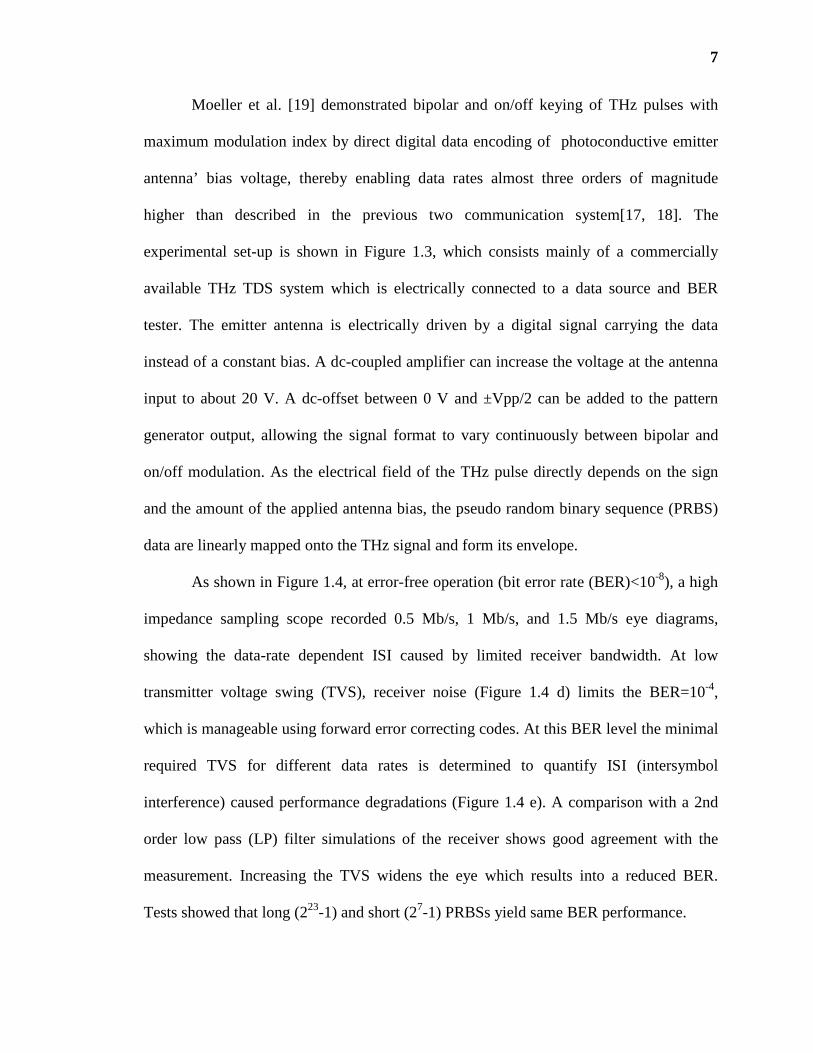
Moeller et al. [19] demonstrated bipolar and on/off keying of THz pulses with
maximum modulation index by direct digital data encoding of photoconductive emitter
antenna’ bias voltage, thereby enabling data rates almost three orders of magnitude
higher than described in the previous two communication system[17, 18]. The
experimental set-up is shown in Figure 1.3, which consists mainly of a commercially
available THz TDS system which is electrically connected to a data source and BER
tester. The emitter antenna is electrically driven by a digital signal carrying the data
instead of a constant bias. A dc-coupled amplifier can increase the voltage at the antenna
input to about 20 V. A dc-offset between 0 V and ±Vpp/2 can be added to the pattern
generator output, allowing the signal format to vary continuously between bipolar and
on/off modulation. As the electrical field of the THz pulse directly depends on the sign
and the amount of the applied antenna bias, the pseudo random binary sequence (PRBS)
data are linearly mapped onto the THz signal and form its envelope.
As shown in Figure 1.4, at error-free operation (bit error rate (BER)<10-8), a high
impedance sampling scope recorded 0.5 Mb/s, 1 Mb/s, and 1.5 Mb/s eye diagrams,
showing the data-rate dependent ISI caused by limited receiver bandwidth. At low
transmitter voltage swing (TVS), receiver noise (Figure 1.4 d) limits the BER=10-4,
which is manageable using forward error correcting codes. At this BER level the minimal
required TVS for different data rates is determined to quantify ISI (intersymbol
interference) caused performance degradations (Figure 1.4 e). A comparison with a 2nd
order low pass (LP) filter simulations of the receiver shows good agreement with the
measurement. Increasing the TVS widens the eye which results into a reduced BER.
Tests showed that long (223-1) and short (27-1) PRBSs yield same BER performance.

8
Figure 1.4 (a)-(c) Eye diagrams at different data rate and error-free operation, (d) at 1.5 Mb/s with BER=10-4, (e) measured and simulated required TVS at different data rates. Source:[19]
1.1.2 Photonic MMW/UTC-PD Opto-Electronics Systems
Over the years, Nippon Telegraph and Telephone Corporation (NTT) group in Japan has
achieved substantial innovations in hardware components and several sub-THz
communication links which have been developed [26]. There are three types of systems
listed in Table 1.1.
• Photonic MMW/UTC-PD THz sources and Schottky diode detector [20].

9
• Photonic MMW/UTC-PD THz sources and MMIC receivers [21].
• An integrated MMIC transmitter and receiver [28].
The first two are radio-over-fiber (RoF) systems, which refer to modulating
optical carrier signals at millimeter wave frequencies. The optical signals can be routed to
a THz transmitter module using low loss optical fibers. Within the THz transmitter
module, the modulated optical beam is converted to a THz signal using a uni-traveling
carrier photodiode (UTC-PD) and launched into free space using a feed horn. The
motivations and advantages of the ROF system are several folds, listed as followed:
• A RoF system could be an attractive solution to line of sight requirement limitation because the millimeter signals can be transmitted over long distances by using optical fibers with an optical frequency comb.
• A RoF system can easily be integrated into a high-speed optical fiber communication link as part of a first mile and last mile solution.
1.1.3 Integrated Circuit Systems
While the 1.5µm fiber-optical components of the RoF systems enable easy integration
with high-speed optical communications systems, there is a drawback of the photonic
approach in terms of additional optical components, system size, total cost, and added
power consumption. Clearly, replacing the opto-electronic THz source with an integrated
electronic device - which could function in concert with the Monolithic Microwave
Integrated Circuit (MMIC) receiver chip – would eliminate many of these issues.
Yamaguchi et al. [28] implemented a flexible coplanar waveguide MMIC chipset [36],
which included amplifiers, modulators, and demodulators, as the THz transmitter and
receiver in a 10 Gb/s wireless link. The link exhibited a 10-12 BER of a 10 Gb/s signal
over 800 m distance [28]. Improvements to the 120 GHz transmitter and well as

10
implementation of forward error correction algorithms have extended the link distance to
5.8 km with an error-free transmission of 10 Gb/s data [29].
1.1.4 Multiplied Microwave Systems
Figure 1.5 Microwave frequency multiplier (a) THz source (b) THz receiver. Source: [30]
Jastrow et al. demonstrated the analog [30] and digital [31] video signal transmission at
300 GHz using a microwave multiplier system. As shown in Figure 1.5, the system
consists of a frequency multiplied (6X) 16.66 GHz local oscillator (LO). The resulting
150 GHz signal is converted to a 290-310 GHz signal using a sub-harmonic mixer and a
DC-10GHz signal generator. The receiver LO is 16.38 GHz so that the intermediate
frequency (IF) of the receiver (5 GHz) is detected using heterodyne detection.
To demonstrate data transmission, Jastrow et al. transmit a color video baseband
signal with 6 MHz bandwidth which is modulated on an ultrahigh frequency (UHF)
carrier (855.25MHz) and then acts as the “signal generator” to be transmitted over THz
11
link. At the receiver, the 5 GHz intermediate frequency (IF) is mixed down to baseband
and fed to a standard TV card. The TV card input requires a minimum signal to noise of
ratio of 40 dB. The image quality if viewed on computer screen. Using just the THz feed
horns, excellent picture quality is reported up to 0.5 m with significant degradation
observable at transmission distances of 0.8 m. When lenses are used to collimate the THz
radiation, a maximum link distance of 22 m is achieved. The system [30] has been used
for digital transmission [31], which is capable of transmitting digital video broadcast
(DVB) data at a rate of 96 MB/s over a distance of 52 m using forward error correction
codes. A multiplied microwave source for THz communication experiments at 625 GHz
has been recently reported [32]. Power, bit-error rate (BER), and signal-to-noise ratio
(SNR) measurements on the receiver side describe the signal performance of a 625 GHz
link with duobinary format driving THz source. The structure and the experimental
results will be described in detail in Chapter 2 and Chapter 3.
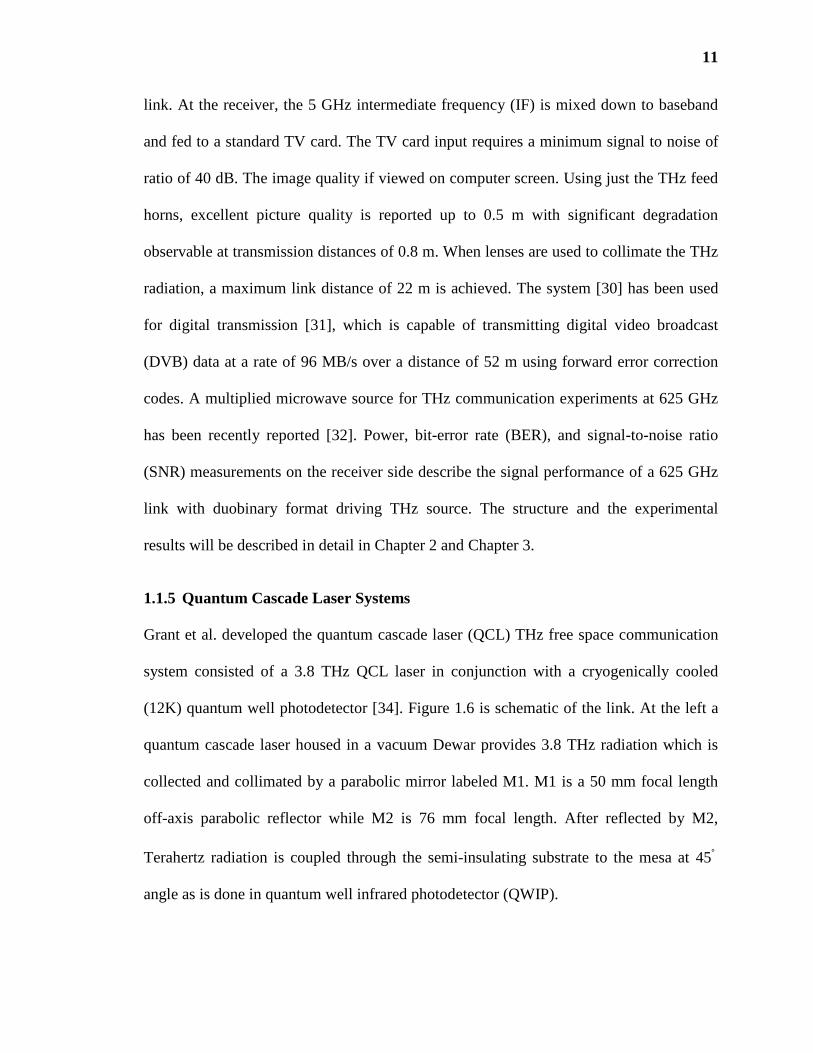
1.1.5 Quantum Cascade Laser Systems
Grant et al. developed the quantum cascade laser (QCL) THz free space communication
system consisted of a 3.8 THz QCL laser in conjunction with a cryogenically cooled
(12K) quantum well photodetector [34]. Figure 1.6 is schematic of the link. At the left a
quantum cascade laser housed in a vacuum Dewar provides 3.8 THz radiation which is
collected and collimated by a parabolic mirror labeled M1. M1 is a 50 mm focal length
off-axis parabolic reflector while M2 is 76 mm focal length. After reflected by M2,
Terahertz radiation is coupled through the semi-insulating substrate to the mesa at 45°
angle as is done in quantum well infrared photodetector (QWIP).

12
Figure 1.6 Schematic of link showing quantum cascade laser at left and quantum well photodetector on right. Source: [34]
Analog audio data was transmitted over 2 m path length. Under normal operation,
a custom-made pulse generator generated 8ns pulses at a repetition rate of 455 kHz. On
top of this constant modulation, an audio frequency modulation is applied. The resulting
combined signal electronically modulates the QCL. The quantum well photodetector is
sufficiently fast enough to measure the 455 kHz pulse repetition rate as well as the side-
bands generated by the audio modulation. The electronic output of the photo-detector is
amplified and passed through a 10 kHz low pass filter. Finally, the signal is passed to the
antenna input of an AM radio to recover the audio signal. No information or metrics were
presented as to the recovered audio signal quality.
1.2 Infrared (IR) Communication Systems
The infrared radiation is the region of electromagnetic spectrum between the THz and
visible light, which is in the frequency range from 100 THz to 430 THz, and the
corresponding wavelength range from 0.7 µm to 1000 µm. The whole infrared band can
13
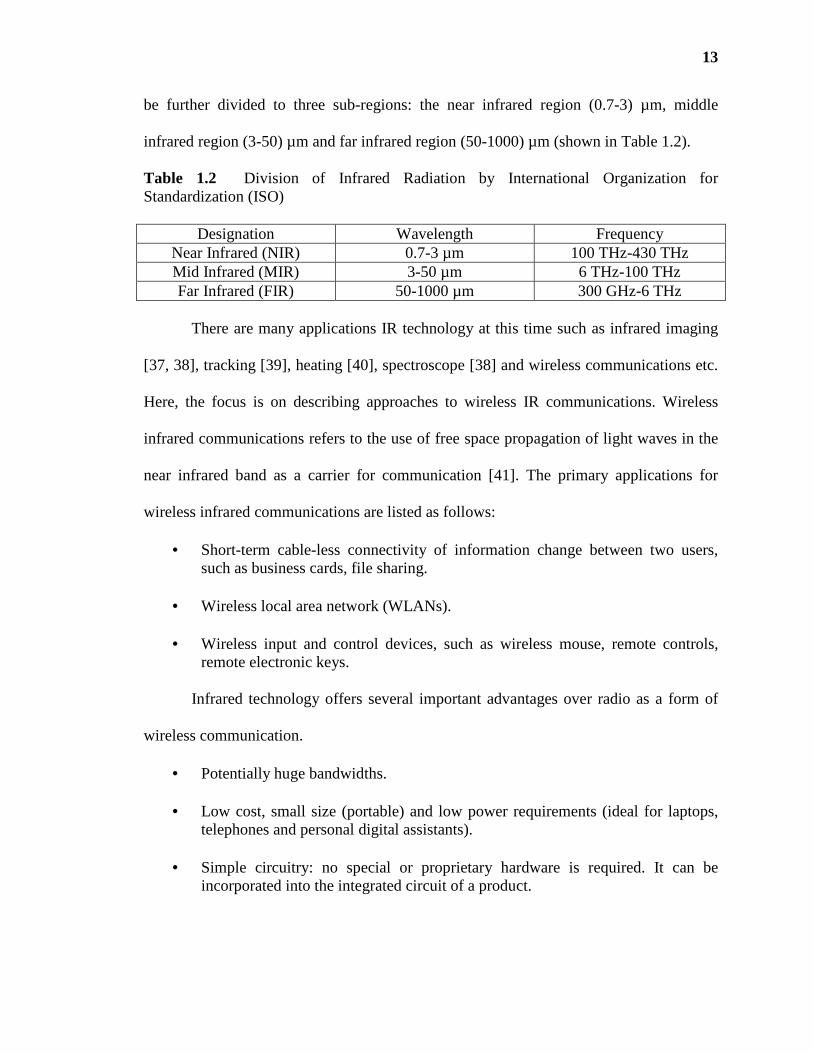
be further divided to three sub-regions: the near infrared region (0.7-3) µm, middle
infrared region (3-50) µm and far infrared region (50-1000) µm (shown in Table 1.2).
Table 1.2 Division of Infrared Radiation by International Organization for Standardization (ISO)
Designation Wavelength Frequency Near Infrared (NIR) 0.7-3 µm 100 THz-430 THz Mid Infrared (MIR) 3-50 µm 6 THz-100 THz Far Infrared (FIR) 50-1000 µm 300 GHz-6 THz
There are many applications IR technology at this time such as infrared imaging
[37, 38], tracking [39], heating [40], spectroscope [38] and wireless communications etc.
Here, the focus is on describing approaches to wireless IR communications. Wireless
infrared communications refers to the use of free space propagation of light waves in the
near infrared band as a carrier for communication [41]. The primary applications for
wireless infrared communications are listed as follows:
• Short-term cable-less connectivity of information change between two users, such as business cards, file sharing.
• Wireless local area network (WLANs). • Wireless input and control devices, such as wireless mouse, remote controls,
remote electronic keys.
Infrared technology offers several important advantages over radio as a form of
wireless communication.
• Potentially huge bandwidths. • Low cost, small size (portable) and low power requirements (ideal for laptops,
telephones and personal digital assistants). • Simple circuitry: no special or proprietary hardware is required. It can be
incorporated into the integrated circuit of a product.

14
• Higher security: This signal confinement over short distance makes it easy to secure transmissions against casual eavesdropping.
• Immunity to electromagnetic interference (EMI): IR does not interfere with
signals from other devices.
• Portable.
However, despite the advantages presented by the infrared medium, IR also
shows some drawbacks:
• Line of sight: transmitters and receivers must be almost directly aligned (able to see each other) to communicate.
• Blocked from persons and objects. Communication from one room to another
requires the installation of infrared access points that are interconnected via a wired backbone.
• Short range: performance drops off with longer distances.
• Light, weather sensitive: high attenuation when transmitted through air and
atmosphere phenomena such as direct sunlight, rain, fog, dust, pollution. THz transmission could offer an effective alternative in this environment.
• Eye safety: IR has eye safety issue which causes the power limitation.
IR free space communication links at 1.5 µm wavelength are the most common
optical transmission for short reach (up to 10 km). As previously noted by Koch, wireless
IR systems are 30 years old, yet until recently the highest data rates reported were 155
Mb/s for the indoor systems (for diffuse configurations) [14]. The author demonstrated
155 Mb/s wireless transmissions with electronic position detection and tracking of the
transmitter at an imaging infrared receiver over a distance of nearly 2 m. A 2007 review
[42] of the field in IR shows no improvement beyond the 155 Mb/s data rate reported in
2001. Only recently has a 10 Gb/s data rate been demonstrated in a simulated
atmospheric environment [42]. The key to increasing the IR wireless data rate to 10 Gb/s
was advanced modulation formats such as orthogonal frequency division multiplexing.
15
For outdoor systems, optical wireless links have been demonstrated for distances of more
than 25 miles and up to 40 Gb/s [43, 44].
When IR is used for outdoor systems, two of the most important issues with IR
free-space communications are transceiver misalignment due to atmospheric turbulence
and/or humidity fluctuations in the beam path (scintillation) as well as atmospheric
absorbance of the IR signal [45]. Atmospheric turbulence and humidity fluctuations cause
temporally and spatially dependence variations in the atmospheric real refractive index.
Consequently, the location of the IR beam on the receiver tends to vary in time leading to
scintillation effects. One of the solutions proposed is use of backup links, such as THz
communication links.
1.3 Atmospheric and Free-Space Damping Including Fog, Rain, Dust and Snow
on THz and IR links
When THz and IR links are used for outdoor communications, the adverse atmospheric
conditions, such as fog, rain, dust and snow will affect the performance of transmission
links to different degrees. In this section, the basic definitions will be introduced and
experimental characterization of environment on THz and IR communication links will
be discussed and compared.
1.3.1 Basic Definitions
1.3.1.1 Atmosphere. Atmosphere is defined as the gaseous mass or envelope
surrounding the Earth, which is primarily composed of nitrogen ( 2N , 78%), oxygen ( 2O ,
21%), and argon ( ,1Ar %), but there are also a number of other elements such as water (

16
2H O , 0% to 7%) and carbon dioxide ( 2CO , 0.01% to 1%), present in smaller amounts.
There are also small particles that contribute to the composition of the atmosphere, such
as particles generated by combustion, dust, debris, and soil. The combination of all the
elements comprising the atmosphere contributes to its absorption and its behavior.
1.3.1.2 Aerosol. An aerosol is a suspension of solid or liquid particles such as haze
particles, clouds, and fog in a gaseous medium with the size range commonly between
0.01 and 10 mµ in the radius. The incoming light can be absorbed and scattered by
aerosol suspended droplets or particles. The fog droplets are the most important
atmospheric elements that contribute to the attenuation of an optical signal through Mie
scattering. The loss of light by scattering increases the atmospheric extinction, which is
the sum of actual absorption and scattering. The concentration of aerosol particles is high
close to the earth’s surface and low at high altitudes.
1.3.1.3 Attenuation. Atmospheric attenuation is defined as the process whereby some or
all of the energy of an electromagnetic wave is lost (absorbed or/and scattered) when
traversing the atmosphere [46]. For the typical wavelengths employed by wireless IR
links (850 nm, 1550 nm), the attenuation contribution from the atmosphere is relatively
low compared to the attenuation contribution from weather conditions. Gebhart et al. [47]
mention that attenuation values are around 0.2 dB/km for clear atmospheric conditions,
and 10 dB/km in urban regions (due to dust). Attenuation due to heavy fog, on the other
hand, can reach values greater than 300 dB/km.
1.3.1.4 Absorption. Absorption is the process of conversion of the energy of a photon
to internal energy, when electromagnetic radiation is captured by matter. When particles
17
in the atmosphere absorb light, this absorption provokes a transition (or excitation) in the
particle’s molecules from a lower energy level to a higher one. In the context of optical
wireless communications, the absorption peak refers to the specific wavelength at which
most power is absorbed by a particular impurity in a specific medium. The atmospheric
absorption is wavelength dependent and the atmospheric windows due to absorption are
created by atmospheric gas.
1.3.1.5 Scattering. Scattering is defined as the dispersal of a beam of particles or of
radiation into a range of directions as a result of physical interactions. When a particle
intercepts an electromagnetic wave, part of wave’s energy is removed by the particle and
re-radiated into a solid angle centered at it. The details of the scattering principle will be
introduced in Chapter 4.
1.3.1.6 Scintillation. With regard to communications, scintillation is defined as a
random fluctuation on the received field strength caused by irregular changes in the
transmission path over time [46]. In the specific case of optical wireless communications,
this term refers to the strength variation of an optical signal as it travels through air, and it
derives from small fluctuations (optical turbulence) in the index of refraction along the
optical path. After fog, low clouds, and direct sunlight, scintillation is the factor that
causes most significant performance deterioration of an optical wireless links.
Scintillation effect can accumulate over a few kilometers of propagation distance.
Scintillation also appears to be more significant when the receiver has a small aperture
[48].

18
1.3.2 Atmospheric Attenuation of THz and IR Communication Links
1.3.2.1 Simulations. Atmospheric attenuation of THz and IR communications are
impacted differently by weather conditions such as fog, rain, snow, and humidity. Figure
1.7 compares the atmosphere attenuation of millimeter waves, THz and IR waves at sea
level for different weather conditions.
Figure 1.7 Calculated atmospheric attenuation in THz and IR band. ITU recommendations are used from 10 to 1000 GHz. MODTRAN 4 is used from 30 to 0.3 microns. A code for the 1-10 THz region was developed by MMW Concepts LLL[49]. The dashed line corresponds to 4 mm/hr of rain. The dash-dot line corresponds to 100m visibility of fog, and the solid line corresponds to US standard atmospheric conditions at sea level (59% relative humidity = 7.5 g/m3 water content). The dotted line corresponds to 15 g/m3 of water content. A wavelength of 1.5 µm corresponds to 2×10⁵ GHz. Source:[49]
Under fog conditions the THz absorption at ~625 GHz is around 20 dB/km which
is considerably lower than the 200 dB/km that the 1.5 µm wavelength suffers. The
maximum reach of THz radiation in fog can be much larger than those of usual IR based
systems. Thus T-rays based communication systems could serve as a back-up for foggy

19
weather when IR signaling fails. It also should be noted that above 200 GHz and below
10 THz, the attenuation is dominated by atmospheric water vapor, with attenuation due to
rain and fog playing a minor role. In the IR, fog and smoke will cause significant
attenuation.
1.3.2.2 Experimental Characterization of Environment on THz Communication
Links. As noted by Brown [50] in his extensive consideration of MMW and THz remote
sensing systems, there is little or no experimental data on THz scattering by fog, rain,
particulates, etc. Brown attributes the limited experimental data to a lack of calibrated
THz instrumentation and the general difficulty in distinguishing absorption from
scattering effects.
Recent measurements of THz propagation through a humid atmosphere [51]
characterize attenuation of the water vapor form 0.2 to 2 THz using THz time-domain
spectroscopy and show higher attenuation than previously measured or predicted in this
THz transmission windows.
For the rain environment, the experimental data at 97 GHz [52] indicates a
reasonable agreement between measured rain attenuation values and those predicted by
different models. Differences in the measured and predicted values suggest that further
measurements are required to fully validate rain attenuation models at the higher MMW
or sub-THz frequency range. At a frequency region of above 100 GHz, the effect of rain
has been characterized only at 103 GHz [53], 120 GHz [54], and 355.2 GHz [55].
Utsunomiya and Sekine conducted propagation experiments at 103 GHz over 390 m. The
experimental data was compared with the calculation from the relationship between the
attenuation and the rainfall rate for the Marshall-Palmer, Best, Joss-Thams-Waldvogel
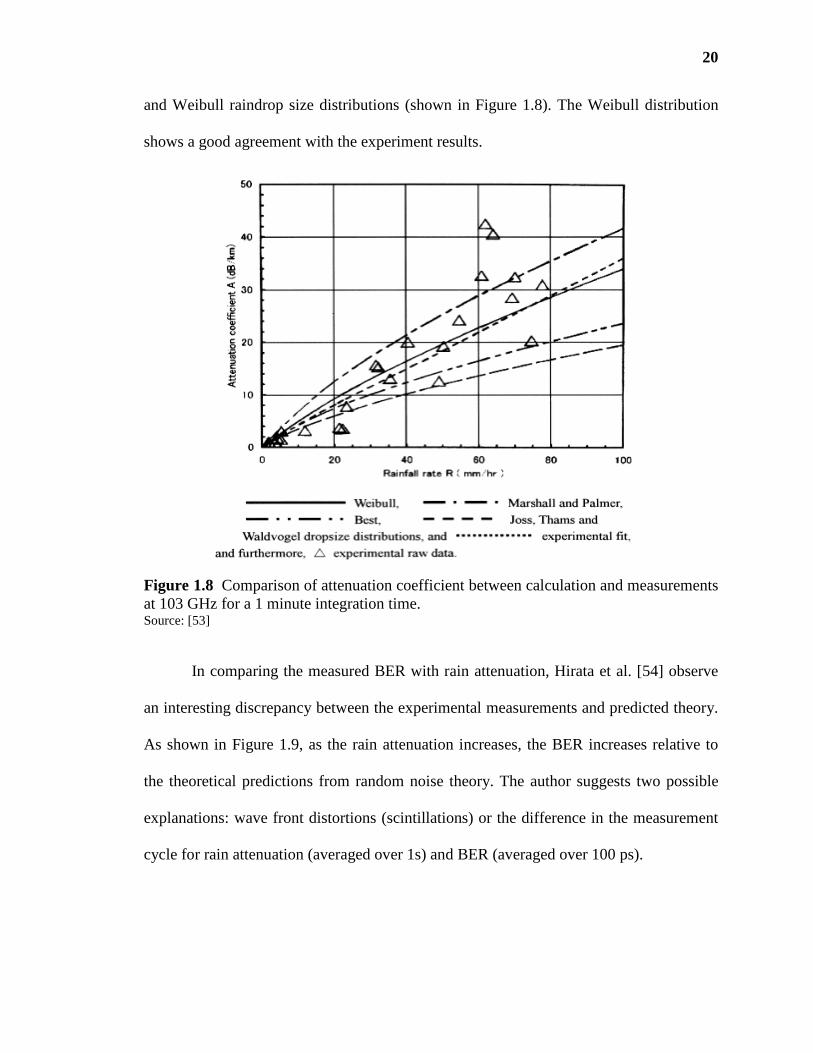
20
and Weibull raindrop size distributions (shown in Figure 1.8). The Weibull distribution
shows a good agreement with the experiment results.
Figure 1.8 Comparison of attenuation coefficient between calculation and measurements at 103 GHz for a 1 minute integration time. Source: [53]
In comparing the measured BER with rain attenuation, Hirata et al. [54] observe
an interesting discrepancy between the experimental measurements and predicted theory.
As shown in Figure 1.9, as the rain attenuation increases, the BER increases relative to
the theoretical predictions from random noise theory. The author suggests two possible
explanations: wave front distortions (scintillations) or the difference in the measurement
cycle for rain attenuation (averaged over 1s) and BER (averaged over 100 ps).

21
Figure 1.9 Measured BER for 120GHz wireless link (10.3Gb/s data rate) versus rain attenuation. Source: [54]
Figure 1.10 Comparison between calculation and measurements at 355.2 GHz for a 1 minute integration time. Source: [55]
The rain attenuation at 355.2 GHz was measured at the National Defense
Academy and calculated using four rain-drop-size distribution and International
22
Telecommunication Union (ITU-R) specific attenuation models. The calculated results
were compared with propagation experiments under rainfall intensities of up to 25 mm/hr
(shown in Figure 1.10), which proves that the experimental propagation results were in
good agreement with of the calculation from the specific attenuation model for use in
predication method recommended by ITU-R provides the best fit for the experimental
data.
The first direct experimental performance comparison between THz (625GHz)
and IR (1.5 µm) communication links, meaning that both signals passing the same
weather conditions (fog), has been recently reported [56]. The measurements results will
be described in detail in Chapter 4.
Due to the relatively small size of atmospheric particulates such as dust and
smoke compared to the THz wavelength, one would expect minimal THz attenuation due
to airborne particulates. Mann [57] had predicted that fog and smoke has little or no
effect up to 1 THz. A rough estimate of the attenuation can be made assuming that the
particulates act as spherical Mie scattering centers. Following a simple Mie scattering
formalism that was used previously to study attenuation of THz radiation due to particle
grains one can estimate the attenuation at IR, THz and sub-THz frequencies using known
particles sizes and concentrations. The details will be discussed in Chapter 5.
1.3.3 Scintillation Effects on the THz and IR Communication Link
There have been some measurements of scintillation effects at 97 GHz which showed
that the long-term probability distribution of scintillation amplitudes due to rain could be
modeled by the Mousley-Vilar equation [52]. Knowledge of the scintillation amplitude
distribution can be used to predict the degradation of the communication link due to

23
scintillation. Experimental evidence that has been published concerning the effect of
scintillation on THz communication includes brief comments [21, 22] and a more
detailed analysis in [23]. Yamaguchi et al. [28] shows the measurement of the
scintillations due to the effect of wind on the propagating 125 GHz radiation (shown in
Figure 1.11). When wind velocity increased, the receiver axis deviation also increased
which caused the input power to decrease. However, since the input power even in the
presence of the wind was greater than the minimum required, the authors did not observe
any increase in BER due to the wind.
Figure 1. 11 Experiment result for the 800 m transmission: input power versus wind velocity and Receiver axis deviation. Source: [28]
For the IR links, experimental results on scintillation were reported by Gebhart et
al. [47] for a very long wireless IR link (of over 61 km). Their results show amplitude
variations (at the receiver) originated by air turbulence during clear sky conditions of up
to 30 dB. Their results also indicate that this problem becomes more significant as the
distance between the transmitter and the receiver increases. Also, Scintillation effects

24
have been analyzed and a variety of theoretical models have been built to characterize the
scintillation effects on the IR links [58, 59].
25
CHAPTER 2
EXPERIMENTAL METHODOLOGY
In order to study and compare propagation features of Terahertz (THz) links with
Infrared (IR) links under different weather conditions, THz and IR communication lab
setups were developed. In this chapter, the experimental methodologies are presented
with emphasis on the design of two types of THz communication systems, namely THz
continuous-wave (CW) photomixing communication system [60-62] and frequency
multiplier chain based 625 GHz communication system [32, 63]. The IR wireless
communication system at 1.5 µm [56] and proportional-integral-derivative (PID)
controller [64] used for dynamic range improvement for the IR system are also described.
2.1 THz CW Photo Mixing Communication System
For the THz CW photomixing configuration two laser sources are typically multiplied or
mixed in a device such as a photoconductive antenna structure [65-67], where laser
beams with the Terahertz difference frequency excite charge carries in the semiconductor
material. Terahertz radiation is generated at the difference frequency of the two laser
sources. The value of the beat frequency can be easily regulated by changing the
temperature of the laser diodes, or laser current. For the communication experiments
reported here, the phase of one of the lasers is modulated using an optoelectronic
magnesium-oxide-doped lithium niobate (MgO: LiNbO3) phase modulator, which is
connected to a pseudorandom bit sequence (PRBS) generator. Since the speed of

26
modulators can be as high as the gigahertz range, one essentially can eliminate the speed
limitations due to mechanical scanning in acquiring a THz waveform.
The experimental setup for the THz CW photo mixing communication system is
sketched below in Figure 2.1, which includes distributed feedback (DFB) laser system,
optics, THz transmitter (Tx) and receiver (Rx), signal modulation, and detection
subsystems.
Figure 2.1 Schematic diagram for THz CW photo mixing communication system. (a) laser system (b) optical system (c) signal modulation and detection (d) THz Tx and Rx.
As shown in Figure 2.1, THz radiation is generated at the beating frequency of
two single mode distributed Bragg reflector diode lasers (TOPTICA DL DFB) operating
near 850 nm. The output of each laser is evenly split using the first pair of beam splitters.
The MgO: LiNbO3 phase modulator (New Focus 4002) is inserted into one of the beams
from Laser Diode #2, which could be modulated either by analogy signal (generated by
function generator) or digital signal (generated by pseudorandom bit sequence generator).
After splitting and passing one beam through the modulator, the light from the two lasers
are combined with another pair of beam splitters. The combined laser light is couple

27
into polarization maintaining optical fibers and delivered to both the THz transmitter (Tx)
and receiver (Rx) which are low-Temperature-Grown GaAs bowtie-type photo-
conductive dipole antennae (PDA). The PDA is mounted on the back of a semi
hemispherical silicon lens which reduces the divergence of the THz radiation from the
antenna. The total optical power on both channels is ~25 mW. A bias of 20 V DC is
applied to power the THz transmitter. Two identical THz lenses with short focal lengths
(~32 mm) allow source beam transmissions over distances of 1 meter (beam diameter ~
20 mm) followed by refocusing of the beam on the receiver side into the receiver.
2.1.1 Distributed Feedback (DFB) Diode Laser System
For the photo mixing system, it is necessary to ensure a single-mode operation of both
lasers. The DFB technique is utilized in the system to eliminate multimode operation of
diodes. The DFB Laser system employs two Toptica DFB diode lasers with center
wavelength of 855 nm, BoosTA (high power semiconductor optical amplifiers) and
ISCAN (quadrature interferometer, laser mode monitor and frequency control).
2.1.1.1 DFB Laser Source. DFB diodes feature a diffraction grating structure within the
active region of the semiconductor. The structure builds a one dimensional interference
grating (Bragg Scattering). The grating provides optical feedback for the laser, restricting
their emission spectrum to a single longitudinal mode.
The DFB diode can be tuned by changing either the chip temperature (thermal
tuning rate: 25 GHz/K (0.058 nm/K) or the operating current (electrical tuning rate: 1.1
GHz/mA (0.0027 nm/mA) [68]. Thermal tuning achieves extremely large mode-hop free
scan ranges (continuous frequency scans of up to 1400 GHz can be realized by means of
28
a temperature sweep of ~50 K). Electric tuning is favorable for rapid modulation and
frequency stabilization tasks.
Each DFB Laser is protected from optical feedback by a 60 dB isolator, and
coupled into the 90:10 single mode (SM), polarization-maintaining Panda fiber coupler.
Its weaker output, approximately 1% of the guided light intensity, is launched in the
ISCAN (quadrature interferometer) used in the frequency and power control loops of the
respective laser. Another port is connected to the BoosTA (amplifiers).
2.1.1.2 BoosTA (High Power Semiconductor Optical Amplifiers). The BoosTA is the
high power semiconductor optical amplifier. With 40 mW BoosTA input power, the
maximum power after amplification can reach 400 mW, which provides the high power
source for the terahertz generation.
2.1.1.3 ISCAN (Quadrature Interferometer). The attainable frequency resolution of a
CW terahertz setup is only limited by the frequency stability and linewidth of the utilized
laser sources. However, the sensitivity of the DFB wavelength to changes in temperature-
the very effect responsible for the large tuning range-makes the DFB laser susceptible to
frequency jitter and drifts. Without active frequency control, this result in a technical
linewidth of ~5 MHz on time scale of 100 ms, while the drift can be as high as several
100 MHz within few minutes. For high-speed terahertz communication, this is clearly not
sufficient.

29
Figure 2.2 Quadrature interferometer (ISCAN). Source: [68]
For frequency stabilization as well as controlled frequency tuning, each DFB laser
is regulated by electronic feedback from a fiber-coupled quadrature interferometer
(ISCAN) [69]. The principle of the ISCAN is based on quadrature signal generation
within a low-finesse temperature stabilized Fabry-Perot etalon (Figure 2.2). A wedge
shaped beam splitter within the interferometer head generates two low-intensity probe
beams (PBA and PBB), which enter a low-finesse, temperature-stabilized Fabry–Perot
etalon (free spectral range of 7.7 GHz) under slightly different angles. The etalon
generates a pair of interference signals with a relative phase of / 2π . These signals are
detected by two photodiodes (a, b) and combined into a quadrature signal, the phase of
which is a linear function of the optical frequency. Two further photodiodes within the
quadrature interferometer serve to monitor the laser intensity. The intensity value is used
in an additional control loop that corrects the laser current in order to maintain a constant
average output power over the entire tuning range of the DFB laser.
The normalized quadrature signal can be visualized on an oscilloscope operating
in XY-mode: when the laser frequency is scanned, each of the photodiodes a and b

30
detects an oscillating, near-sinusoidal signal. The XY-display yields a circle, where the
momentary phase angle corresponds to the laser frequency. The completed circumference
of the circle represents the range of the frequency scan. A mode-hop free scan yields a
smooth curve, whereas a mode-hop within the scan range is recognized by a sudden jump
across the circle (Figure 2.3). Using the Iscan, the frequency stability can be better than
20 MHz/24 hours.
Figure 2.3 Quadrature signal and corresponding mode signatures. Source: [68]
2.1.2 Signal Modulation
A New Focus 4002 MgO: LiNbO3 phase modulator is used in the experiments, which can
be operated at any frequency from DC to 100 MHz. It is based upon the linear electro-
optic effect—the change in the refractive index is linearly proportional to the applied
electric field. The applied voltage induces a change in refractive index along the
polarization axis of the infrared laser beam. By varying the applied voltage to the phase

31
modulator, the optical path length experienced by the propagating laser beam varies
proportionally.
The configuration of phase modulator is illustrated in Figure 2.4. It contains an
electro-optic crystal of length l with electrodes separated by the crystal thickness d (the
electrode spacing). The voltage V is applied directly across the crystal’s electrodes,
which is perpendicular to the light propagation (transverse modulation mode). The
generated electrical field can be expressed as:
l
d
-V
+V
Light Out
Electrodes
Figure 2.4 Electro-optic phase modulator.
VE
d= (2.1)
The induced index of refractive change by an external electric field signal is:
333
1
2 en n r E∆ = (2.2)
where n∆ is the change of the refraction index, en is the unperturbed refraction index of
the crystal (the refractive index of the crystal at zero voltage) and 33r is the electro-optic
coefficient. The phase shift obtained by applying a voltage V at the input SMA
(SubMiniature version A) connector can be expressed as:
32
2 2∆ ∆ ∆L l n
π πϕλ λ
= = (2.3)
where L is the optical path length (OPL), l is the geometric length of the crystal and λ is
the vacuum wavelength of the DFB laser. Substituting Equations 2.1 and 2.2 into 2.3,
yields a phase change as a function of:
333( ) ( ).m e
lt n r V t
d
πϕλ
= (2.4)
The half-wave voltage is defined as the voltage that could produce a phase shift of π,
which is
�� =�
�������
� (2.5)
For the phase modulation model 4002, the half-wave voltage is typically 178 volts at 850
nm, corresponding to a modulation depth, β, of 0.0176 radians/volt.
2.1.3 THz Generation and Detection
2.1.3.1 Theory. THz radiation is generated by photo mixing of the two laser beams in
the THz transmitter. The generated THz wave can be presented as a product of electric
fields[62],
[ ]1 2 1 1 1 2 2 2 1 2~ ~ sin( ) sin( ) ~ cos( )THz oE E E E t E t E E tω φ ω φ ω φ⋅ + + ∆ + ∆��� ���
(2.6)
where 1 2ω ω ω∆ = − , 0 1 2φ φ φ∆ = − , 1E and 2E are the amplitudes of infrared DFB electric
fields at the frequencies1ω and 2ω , and phases 1φ and 2φ , respectively. In Equation 2.6, it
is assumed that the polarization of the two beams from laser diode #1 and #2 are parallel
so that the vector dot product of the infrared E fields simply becomes a scalar

33
multiplication. The electro-optic phase modulator will induce an addition phase shift
( )m tφ which gives:
[ ]1 2~ cos( ( )THz o mE E E t tω φ φ∆ + ∆ + (2.7)
The detected THz signal is determined by mixing (multiplying) the incoming THz
radiation of Equation 2.7 with the two infrared DFB signals present at the THz detector:
det 1 2 1 1 3 2 2 4~ ( ) ~ ( , ) sin( ) sin( )THz THz pE E E E E t E t E tφ ω φ ω φ⋅ ⋅ + + (2.8)
Simplifying Equation 2.8 gives
2 2det 1 2 1 3 2 4~ cos( ( ) ( ) ( ))m pE E E tφ φ φ φ φ φ+ + − + −
(2.9)
where 3φ and 4φ represent the phase of the beams from DFB #1 and DFB #2,
respectively, at the THz receiver. The phase shiftpφ is induced by the free space between
the transmitter and receiver. Consequently, the voltage produced by the THz detector
varies sinusoidally with a linear increasing applied voltage to the phase modulator.
2.1.3.2 Photoconductive Antenna. THz Transmitter and Receivers are low temperature
grown Gallium Arsenide (LT-GaAs) antennas [70, 71]. THz radiation is generated using
a photoconductive emitter consisting of a small piece of semiconductor crystal
(commonly gallium arsenide) on which two planar metal electrodes form an antenna
supporting a large electric field across its surface (see Figure 2.5). A laser beam (with
some beat frequency1 2ω ω− ) is focused onto the gap between the electrodes. This
generates charge carriers in the form of electron–hole pairs at the plate of the
semiconductor. The application of a bias voltage accelerates these charge carriers. An

34
induced current is generated, which radiates a THz wave into the free space. An external
silicon lens reduces the divergence of the THz radiation from the antenna. The
photoconductive receiver (operating in reverse way to the transmitter) is used as the
detection technique.
Figure 2.5 Terahertz generation laser-gated photoconductive antenna Vbias: Bias voltage applied to the gallium-arsenide (GaAs) substrate.
2.2 Frequency Multiplier Chain Based 625 GHz Wireless Communication System
In order to obtain simultaneously high output power and larger transmitter bandwidth at a
high carrier frequency, a frequency multiplier chain based a 625GHz wireless
communication system was developed. A duobinary modulation technique [72, 73]
utilized in the system ensured a sufficiently narrow spectrum bandwidth to pass an up-
converting frequency multiplier chain. Compared to other transmitter architectures, the
source seems to have advantages in terms of maximum output power when considering
currently commercially available components. On the receiver side, a Schottky diode
operated in direct detection modes, convert the THz signal to baseband, which is less

35
complex than mixer based receivers. The block diagram (Figure 2.6) shows the main
transmitter and receiver elements of the up converting frequency multiplier chain based
625 GHz transmission link.
2 2 2
2 3
X X X
X X
→ →→ →
2X
Figure 2.6 Schematic of up converting frequency multiplier chain based 625 GHz transmission link.
2.2.1 THz Source
The THz source (Virginia Diodes Inc.) is based on a Frequency-Multiplier-Chain with
about 1 mW output power when operated in a continuous wave (CW) mode. It consists of
an amplifier driven at 2 W saturation power followed by four frequency doublers and one
frequency tripler, all based on biased Schottky diodes, which feed a horn antenna with
2.4 mm aperture. A launched tone within the frequency acceptance band between 12.2
GHz and 13.6 GHz gets up converted into a frequency band between 585 GHz and 653
GHz. The biasing of the Schottky diodes is actively controlled. However, the feedback
loop cannot counteract amplitude variations by a data modulation due to its bandwidth
limitation to the kHz range.
36
2.2.2 Signal Modulation (Duobinary Modulation)
The source’s acceptance frequency band between 12.8-13.6 GHz for an applied input RF
tone requires multi Gb/s data rate signals with comparably narrow bandwidth such that
intersymbol interference (ISI) effects [74] caused by bandwidth reduction can remain
small. Duo-binary modulation yields a relatively compact spectrum compared to regular
(non-return-to-zero) NRZ modulation by applying phase coding and pulse widening.
Several techniques have been proposed to generate duobinary modulation. The delay-
and-add approach is applied in the system.
As shown in the signal modulation block of Figure 2.6, a 2.5 Gb/s NRZ format is
generated by a pulse pattern generator (PPG) with adjustable output power. The signal is
divided into two replicas by means of a wideband 6 dB electrical power splitter and one
branch is delayed by the duration of a bit (400 ps) with respect to the other. The replicas
are combined with another 6 dB power splitter, terminated with 10 dB 50 Ohm
attenuators at both input, in order to achieve better impedance matching and less
reflections. A quasi Gaussian low pass filter (LPF-1) with about 1700 MHz 3 dB
bandwidth is then applied to reduce the spectral width of the signal, mainly by cutting off
its tail. This signal is launched into the intermediate frequency (IF) port of a double
balanced mixer where the data modulates the output of a frequency synthesizer that is
connected to the local oscillator (LO) port. It is a specific feature of the double-balanced
mixer that a negative input at the IF port causes a 180 degree phase shift of the signal at
the radio frequency (RF) output. This is utilized to establish the required phase coding for
duobinary modulation. The data signal enters the THz source and modulates the THz
radiation which emanates from the horn antenna of the THz source with 2.4 mm aperture.
37
Note, after the first frequency doubler of the source, the duobinary phase coding is
eliminated due to the squaring operation of the Schottky diode.
2.2.3 Transmission Channel
The output of the horn antenna is collimated by a THz lens (beam diameter ~20 mm)
with short focal length (~32 mm) and transmitted over distances with up to a few meters
length. After that an identical THz lens couples the beam into a receiver horn similar to
the transmitter antenna whose output is connected to a zero biased Schottky diode.
2.2.4 THz Receiver and Signal Detection
The detector functions in the low power region (input power <10 mW) to good
approximation as a square law converter with a responsitivity of about 2500 V/W at 600
GHz. The Schottky diode’s output is amplified by about 42 dB using two amplifiers (80
kHz-7 GHz pass band, 6 dB noise figure, maximum output power~19 dBm) and filtered
by a quasi-Gaussian low pass filter (LPF-2) with 3GHz 3dB-bandwidth. A 6dB electrical
power splitter launches one output (Vpp~500mV) to a high-speed scope or a Bit Error
Rate Tester (BERT) and the other to a 2.5 Gb/s NRZ clock recovery circuit that
synchronizes the measurement equipment.
Note that the current detector design, based on commercially available Schottky
diodes, is suboptimal for high-speed signaling. The video resistance of the diodes, under
low input power, is nominally ~1.5k Ohm and connected via a series of 50 Ohm
transmission lines and cables to an external high-speed electrical amplifier with matched
input impedance [75]. For low speed applications and after replacing the amplifier with a
high impedance device, a voltage of about 70 mV at the Schottky diode output is
detectable. However with 50 Ohm termination of the diode a significantly smaller voltage

38
level is accessible at the high-speed amplifier input. A rough estimate (applying voltage
divider rule 50/1550) shows thus only about 3% of the signal voltage generated in the
Schottky diode is applied to the amplifier input. This estimate can be used to determine
the operation regime of the diode. At the amplifier output RF powers of about -14 dBm
for a BER around 10-9 is typically. Assuming an amplifier gain of about 42 dB, the
aforementioned voltage conversion factor of the diode, and a diode responsivity of 2500
V/W yields an effective launched THz power of about 20 µW. This is significantly more
than the vendor specs for the linear operation range of the device. An iris with 8.5 mm
aperture, inserted concentrically into the beam, limits its total power to an amount that
results in a BER of about 10-7 for an unloaded fog chamber.
2.3 IR Wireless Communication System at 1.5 µm
The block diagram (Figure 2.7) shows the main transmitter and receiver elements of IR
communication link, data acquisition interfaces, and proportional-integral-derivative
controller (PID controller) for IR power stabilization.

39
PD_2
(Free Space)
Beam
SplitterTransmission Channel Beam
SplitterIris
Data
Collection
(DAQ)
PID
Controller
Output
Measure
Lens
Beam
Expander
BERT
2.5 Gb/s
Signal Modulation
PD_1
IR Source
IR Receiver
and
Signal Detection
MM
Fiber
Coupler
PD_3
(SM
Fiber)
MM
SM
DC
(a)
Figure 2.7 (a) Schematic diagram of IR wireless communication link, (b) IR source, (c) IR receiver and signal detection.
2.3.1 Transmitter and Receiver Elements of IR Communication Link
The IR transmitter (Figure 2.7 (a)) consists of a DFB laser (wavelength~1550 nm), a
Mach-Zehnder optical modulator, a high power erbium-doped fiber amplifier (EDFA), a
narrow bandwidth optical filter (~1 nm bandwidth), a low loss variable optical attenuator
(VOA) and a fiber based polarization controller (FPC). All are connected by standard
single mode fiber. The beam splitting ratio is polarization dependent and the FPC is
40
adjusted to achieve the maximum detectable receiver power. The Mach-Zehnder
modulator is driven by the same 2.5 Gb/s NRZ signal as the THz transmitter. An EDFA
amplifies the modulator output to about 25 dBm, the maximum input power of the
bandpass filter, which reduces the detection of spontaneous emission on the receiver side.
After passing through the VOA, controlled by a proportional-integral-derivative
controller (PID controller), the IR signal is launched into the 90:10 single mode (SM)
fiber coupler. Its weaker output, launched into photo detector PD-1 serves as monitor for
the power entering the fog chamber. A fiber collimator expands the IR beam to about 20
mm diameter, which is comparable to the THz beam size before the iris.
The collimated IR beam could be superposed with the THz beam using a beam
combiner (see above) with 55% reflection ratio at 45 degree incident angle, transmitted
through the environment chamber (such as fog, dust, humidity chamber), and deflected at
its output with a similar beam splitter to spatially separate THz and IR signals. The
second beam splitter taps of a fraction of the IR power leaving the chamber and launches
it towards a large area photo diode (effective area 19.6 mm2) of detector PD-2, which in
combination with PD-1 is used to determine the power loss caused by the chamber load.
The remaining beam power enters via a fiber collimator a 1x2 multi-mode (MM) fiber
coupler with 50:50 splitting ratio. Its output power is launched to a low bandwidth photo
detector (PD-3) with a 1 m long standard single mode fiber (SSMF) and to a dc-coupled
IR lightwave converter (Agilent 81495A) with 9 GHz bandwidth. The lightwave
converter is twofold used for data detection and measuring the optical power of the
incoming signal, which is accessible via general purpose interface bus (GPIB). A bias tee
(Figure 2.6 (c)) at the converter output allows for extracting a voltage proportional to the

41
DC components of the data signal, which serves as feedback for the PID controller of the
VOA. The ac-output of the bias tee is strongly attenuated and thereafter amplified in
order to level the signal-to-noise ratio (SNR) such that BERs around 10-7 and higher can
be adjusted while satisfying the BERT requirements of input voltage swings between 250
mV and 2 V.
2.3.2 Proportional-Integral-Derivative Controller (PID Co ntroller)
2.3.2.1 Introduction of PID Topology. The controller consists of a front end with
differential input amplifier (proportional control), followed by an integrator and a
differentiator, arranged in what is known as ‘ideal’ PID topology. PID topology provides
a simple way to minimize the effect of disturbances to a system. As shown in Figure 2.8,
A PID controller calculates an "error" value as the difference between a measured process
variable and a desired setpoint (ε =set point-measured process variable). Then the
controller uses the error to generate three control signals:
1. Proportional, the amplified error: P ε×
2. Integral, the time integral of the error signal multiplied by a gain coefficient :I dtε∫
3. Derivative, the time derivative of the amplified error signal multiplied by a gain
coefficient D :d
Ddt
ε
Figure 2.8 The block diagram of PID controller.
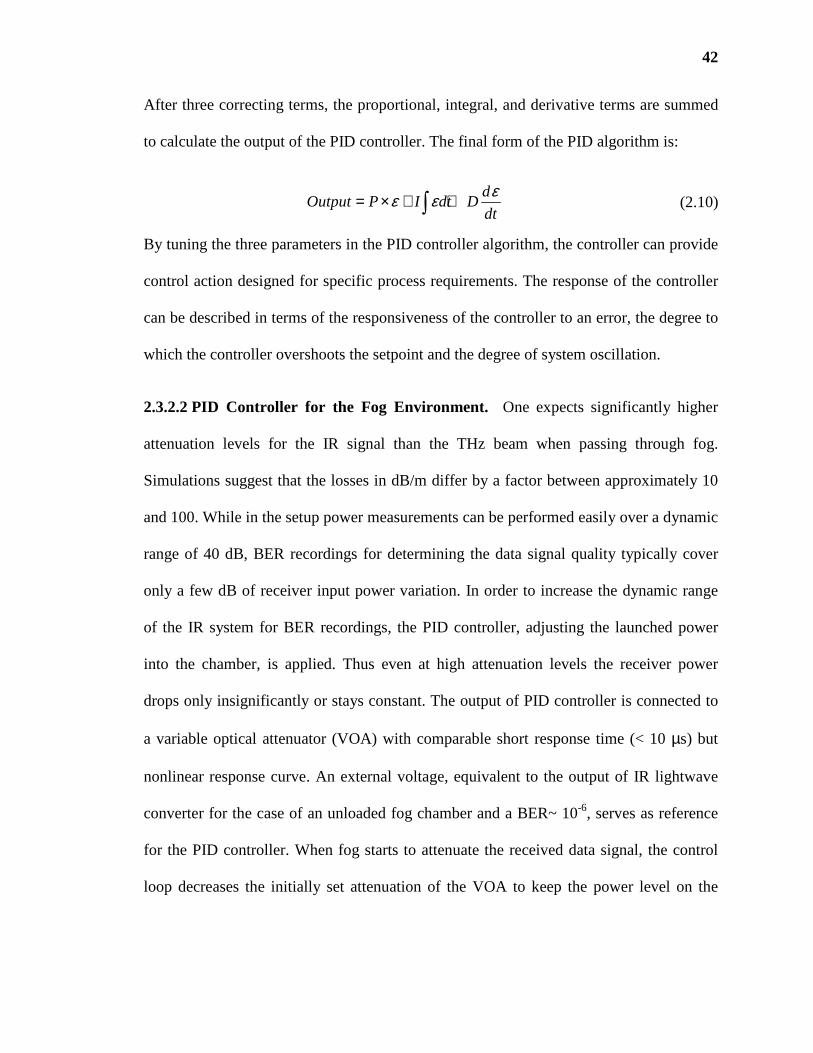
42
After three correcting terms, the proportional, integral, and derivative terms are summed
to calculate the output of the PID controller. The final form of the PID algorithm is:
dOutput P I dt D
dt
εε ε= × + +∫ (2.10)
By tuning the three parameters in the PID controller algorithm, the controller can provide
control action designed for specific process requirements. The response of the controller
can be described in terms of the responsiveness of the controller to an error, the degree to
which the controller overshoots the setpoint and the degree of system oscillation.
2.3.2.2 PID Controller for the Fog Environment. One expects significantly higher
attenuation levels for the IR signal than the THz beam when passing through fog.
Simulations suggest that the losses in dB/m differ by a factor between approximately 10
and 100. While in the setup power measurements can be performed easily over a dynamic
range of 40 dB, BER recordings for determining the data signal quality typically cover
only a few dB of receiver input power variation. In order to increase the dynamic range
of the IR system for BER recordings, the PID controller, adjusting the launched power
into the chamber, is applied. Thus even at high attenuation levels the receiver power
drops only insignificantly or stays constant. The output of PID controller is connected to
a variable optical attenuator (VOA) with comparable short response time (< 10 µs) but
nonlinear response curve. An external voltage, equivalent to the output of IR lightwave
converter for the case of an unloaded fog chamber and a BER~ 10-6, serves as reference
for the PID controller. When fog starts to attenuate the received data signal, the control
loop decreases the initially set attenuation of the VOA to keep the power level on the
43
receiver side constant. Typically, the control loop can cover a dynamic range of about 5
to 10 dB under stable operation.
2.3.3 Data Acquisition
The output of PD-1, PD-2, and PD-3 are recorded via a DAQ board with 16 bit resolution
and 1 kHz and 10 kHz sampling rate, sufficiently high to track even the fastest
fluctuations of the signals. BERs, RF power of THz signal, and optical power of the IR
signal are recorded via GPIB. A LabView time controller, set to a minimum clock rate of
500 ms, which the GPIB interface can handle, synchronizes all recordings.
44
CHAPTER 3
PERFORMANCE ANALYSIS AND CHARACTERIZATION OF THE DA TA LINKS
In this chapter, data modulation and transmission of THz signals and IR signals are
demonstrated and analyzed. For the THz CW photomixing communication system, THz
signal are phase encoded with both analog ramp signal and pseudorandom binary data,
transmitted over a short distance and detected. The limitations of transmission bandwidth,
low signal to noise ratio, vibration effects are also discussed here. The THz spectrum
response exhibits significant spectral peaks and valleys. To circumvent the inherent
limitation of the THz CW system and compare propagation features of THz links with IR
links under different weather conditions, a THz and IR communications lab setup with a
maximum data rate of 2.5 Gb/s at 625 GHz carrier frequency and 1.5 µm wavelength ,
have been developed, respectively. A usual non return-to-zero (NRZ) format is applied to
modulate the IR channel but a duobinary coding technique is used for driving the
multiplier chain-based 625 GHz source, which enables signaling at high data rate and
higher output power. The bit-error rate (BER), signal-to-noise ratio (SNR) and power on
the receiver side have been measured, which describe the signal performance.
3.1 Characterization of THz CW Photo Mixing Data Link
3.1.1 Analog Ramp Signal Modulation
According to Equation 2.9, the output voltage from THz receiver (Rx) varies sinusoidally
with a linearly increasing applied voltage. However, if the voltage swing corresponds to a
phase shift that was either smaller than or larger than 2π, the output voltage from the THz

45
Rx would not be perfectly sinusoidal. The corresponding voltage swing required for a
complete 2π phase shift in the modulator is 360 V.
-80
-40
0
40
80
0 20 40
Tim e (microseconds)
Volta
ge
(mV
)
-80
-40
0
40
80
0 20 40
T im e (m icroseconds)
Vo
ltag
e (m
V)
Figure 3.1 THz detector voltage output versus time as a function of modulated phase. The sawtooth waveforms (left column) illustrate the modulated voltage (modulation rate is 100 kHz). Middle column and left column are simulated detector signals and experimental detector output, respectively. (a) Phase modulation is 5 radian (smaller than 2� ), corresponding modulation voltage is 290 V (b) Phase modulation is 2π , corresponding modulation voltage is 360 V (c) Phase modulation is 8 radian (larger than 2π), corresponding modulation voltage is 460 V.
As shown in Figure 3.1, a linear voltage ramp waveform with different maximum
voltages swing corresponding to 5 radian (smaller than 2π), 2π, and 8 radian (larger than
2π) phase shift were applied to the phase modulator, the output of the THz receiver can
then be recorded with a digital oscilloscope that locks to the ramp modulation frequency.
The need for a complete 2π phase shift in the modulator is illustrated in Figure 3.1.b. For
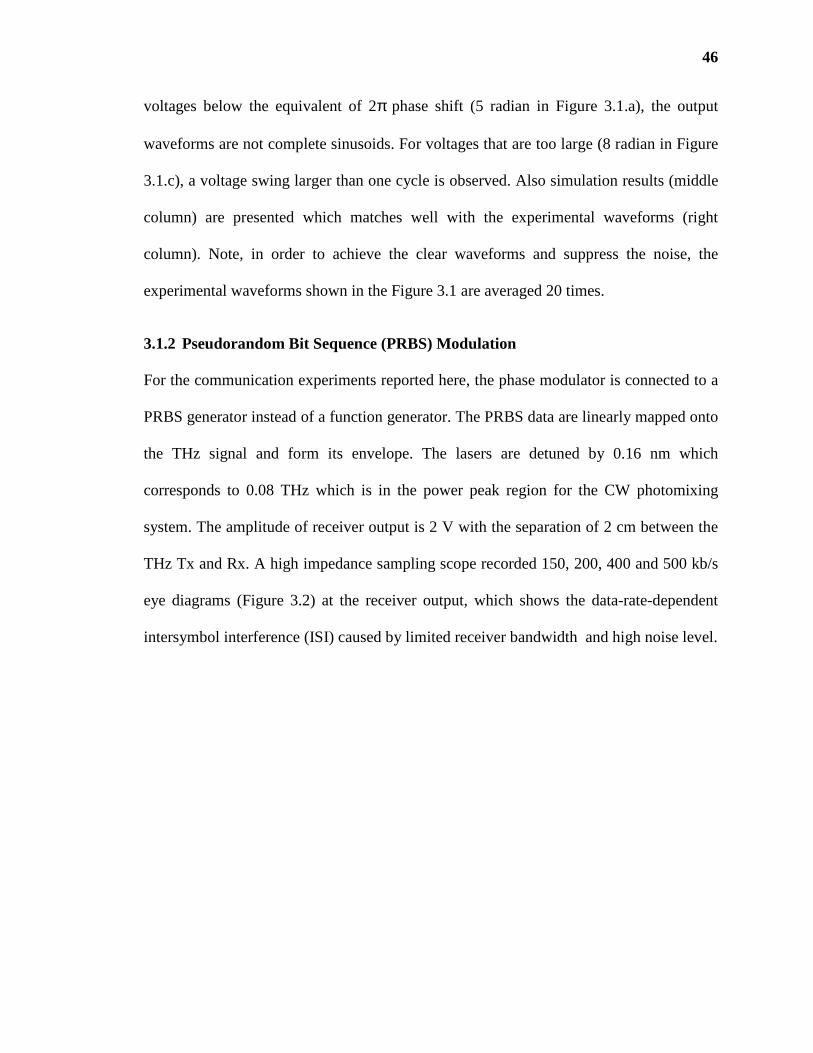
46
voltages below the equivalent of 2π phase shift (5 radian in Figure 3.1.a), the output
waveforms are not complete sinusoids. For voltages that are too large (8 radian in Figure
3.1.c), a voltage swing larger than one cycle is observed. Also simulation results (middle
column) are presented which matches well with the experimental waveforms (right
column). Note, in order to achieve the clear waveforms and suppress the noise, the
experimental waveforms shown in the Figure 3.1 are averaged 20 times.
3.1.2 Pseudorandom Bit Sequence (PRBS) Modulation
For the communication experiments reported here, the phase modulator is connected to a
PRBS generator instead of a function generator. The PRBS data are linearly mapped onto
the THz signal and form its envelope. The lasers are detuned by 0.16 nm which
corresponds to 0.08 THz which is in the power peak region for the CW photomixing
system. The amplitude of receiver output is 2 V with the separation of 2 cm between the
THz Tx and Rx. A high impedance sampling scope recorded 150, 200, 400 and 500 kb/s
eye diagrams (Figure 3.2) at the receiver output, which shows the data-rate-dependent
intersymbol interference (ISI) caused by limited receiver bandwidth and high noise level.
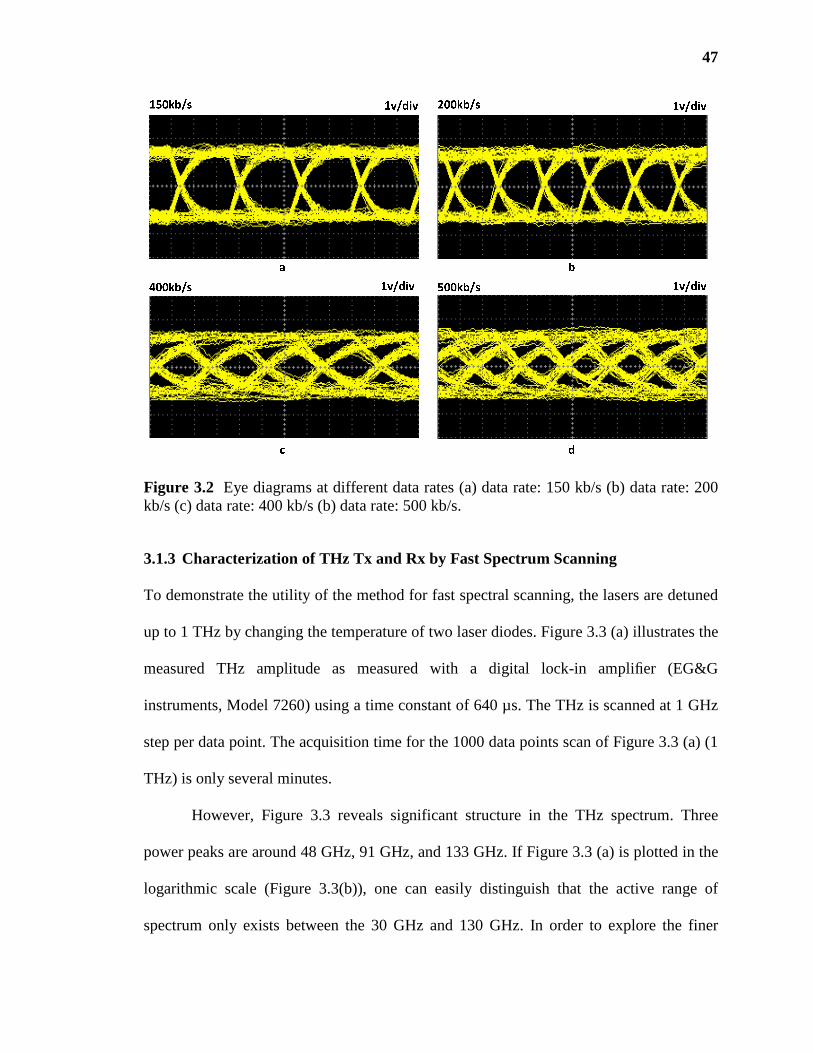
47
Figure 3.2 Eye diagrams at different data rates (a) data rate: 150 kb/s (b) data rate: 200 kb/s (c) data rate: 400 kb/s (b) data rate: 500 kb/s.
3.1.3 Characterization of THz Tx and Rx by Fast Spectrum Scanning
To demonstrate the utility of the method for fast spectral scanning, the lasers are detuned
up to 1 THz by changing the temperature of two laser diodes. Figure 3.3 (a) illustrates the
measured THz amplitude as measured with a digital lock-in amplifier (EG&G
instruments, Model 7260) using a time constant of 640 µs. The THz is scanned at 1 GHz
step per data point. The acquisition time for the 1000 data points scan of Figure 3.3 (a) (1
THz) is only several minutes.
However, Figure 3.3 reveals significant structure in the THz spectrum. Three
power peaks are around 48 GHz, 91 GHz, and 133 GHz. If Figure 3.3 (a) is plotted in the
logarithmic scale (Figure 3.3(b)), one can easily distinguish that the active range of
spectrum only exists between the 30 GHz and 130 GHz. In order to explore the finer
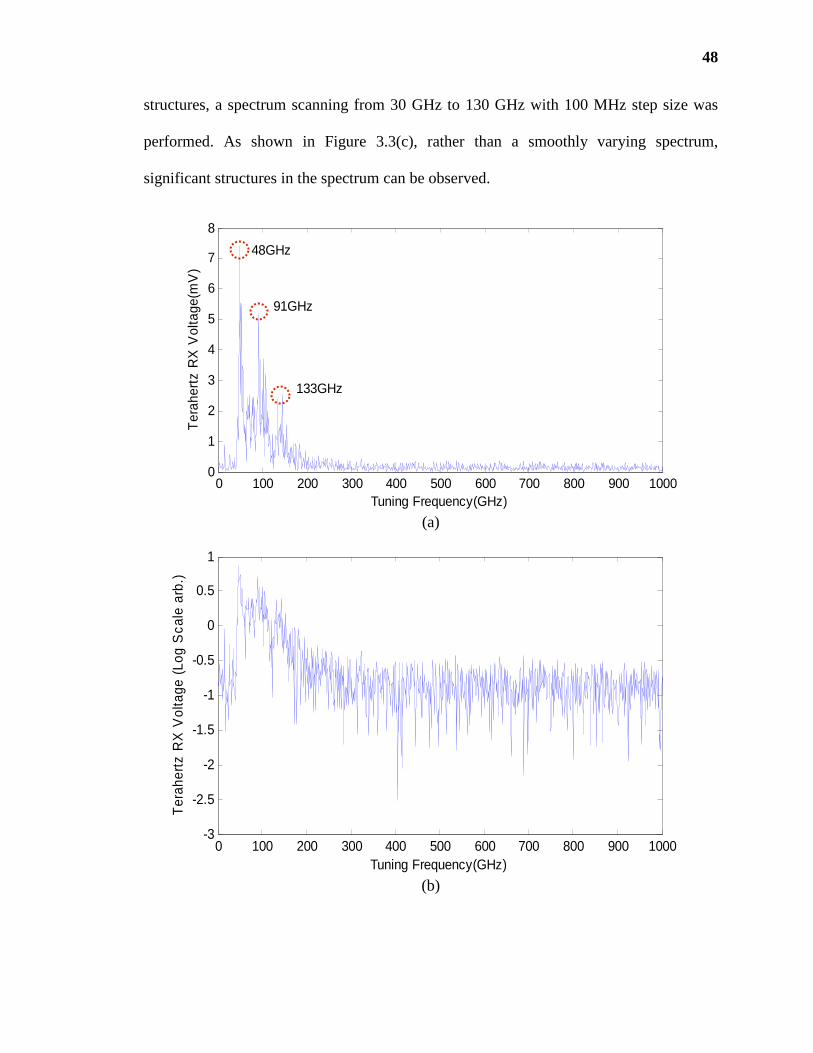
48
structures, a spectrum scanning from 30 GHz to 130 GHz with 100 MHz step size was
performed. As shown in Figure 3.3(c), rather than a smoothly varying spectrum,
significant structures in the spectrum can be observed.
(a)
(b)
0 100 200 300 400 500 600 700 800 900 10000
1
2
3
4
5
6
7
8
Tuning Frequency(GHz)
Ter
aher
tz R
X V
olta
ge(m
V)
91GHz
133GHz
48GHz
0 100 200 300 400 500 600 700 800 900 1000-3
-2.5
-2
-1.5
-1
-0.5
0
0.5
1
Tuning Frequency(GHz)
Ter
aher
tz R
X V
olta
ge (
Log
Sca
le a
rb.)

49
(c)
Figure 3.3 Rapid frequency tuning curves for the measured THz (a) 1 THz scanning range with 1 GHz step (b) Unit in logarithmic scale with 1 GHz step (c) 30 GHz to 130 GHz scanning range with 100MHz step.
3.1.4 Limitation of THz CW Photo Mixing Data Link
Analog ramp signal modulation, PRBS digital signal transmission, and fast spectrum
scanning were demonstrated in the previous sections. The transmission bandwidth, low
signal to noise ratio, vibration effects and significant structure of the THz Tx and Rx
which limits the maximum transmission distance and bit error rate (BER) measurement
will be discussed in the following sections.
3.1.4.1 THz Tx and Rx Spectrum Limitation. As shown in Figure 3.3, when the
frequencies of two lasers are detuned from 0 THz to 1 THz, the detected signals from
THz receiver contains quite abundant structures; especially there are three power peak
regions around 48 GHz, 91 GHz and 133 GHz. Also the effect region of THz signals for
this hardware system is limited to 200 GHz. Because of low THz signals above 200
GHz, the THz photomixing communication system can only operate at selected
30 40 50 60 70 80 90 100 110 120 1300
2
4
6
8
10
Tuning Frequency(GHz)
Ter
aher
tz R
X V
olta
ge(m
V)
101.3GHz
89.8GHz
94.5GHz
47.2GHz
49.3GHz
51GHz
54.5GHz 78.5GHz

50
frequencies below 200 GHz. Unfortunately, within this frequency range, the atmosphere
effects (humidity, fog, rain, particulates) on the THz transmission are relative low
compared to higher THz frequencies, which means the comparable experiments of THz
and IR under different weather conditions cannot be performed with the CW photomixing
system.
3.1.4.2 Bandwidth Limitation. The RF bandwidth of the (MgO: LiNbO3) 4002 phase
modulator is 100 MHz and the electronic bandwidth of the amplifier of the
photoconductive antenna (PDA) THz receiver is roughly 420 kHz. So the maximum
speed of the current system is limited by 420 kHz.
3.1.4.3 Low Signal to Noise Ratio (SNR) and Vibration Effects.
Figure 3.4 (a) THz detector voltage output versus time as a function of modulated phase. (modulation rate is 100 kHz, THz carrier wave frequency: 91 GHz). CH1: the sawtooth waveform (modulation function) CH2: detected signal from THz Rx. (b) noise level. The 100 kHz ramp signals are modulated on the THz carrier wave at 91GHz (power peak
region), transmitted and detected. The separation of the THz Tx and Rx around 1cm. As
shown in Figure 3.4, the detected signal is around 1 volt peak to peak with 200mv noise.
The low SNR limits the maximum transmission distance. The small vibrations of the

51
table and air flow also change the optical path length and cause the detected signal
unstable.
3.2 Characterization of Frequency Multiplier Chain Based 625 GHz Wireless
Communication Link
3.2.1 Double Balanced Mixer Characteristics
Figure 3.5 shows the characterization of the double-balanced mixer used in the
modulation section. For dc-voltages in the range of the voltage swing of the launched
data signal and applied to the intermediate frequency (IF) port of the mixer, the amplitude
swing of the output signal is recorded when a 12.933 GHz tone is connected to the local
oscillator port of the mixer. A small offset for applied dc-voltage between -5 mV and +5
mV can be observed.
Figure 3.5 Double balanced mixer characteristics.

52
3.2.2 Power Transfer Function Measurement
As discussed in Chapter 2, for the 625GHz communication link, the receiver horn is
connected to a zero biased Schottky diode, which functions in the low power regime
(input power <10 µW) as square law detector with large baseband bandwidth, meaning
that the detector's output voltage is proportional to its incident power measure in watts.
The responsitivity of the detector is about 2500 V/W at 600 GHz. The “power transfer
function” of the current system is characterized by sweeping the input frequency of the
THz source across its acceptance band and the output voltage of the Schottky diode is
also recorded. Figure 3.6 indicates a pass band that is impaired with a ~4 dB dip and 1 dB
ripples. These ripples cause group delay variations across the filter passband and
amplitude fluctuations, which together with the limited bandwidth make this source less
suitable for signal modulation with a comparable wide spectrum (direct 2.5 Gb/s non-
return-to-zero (NRZ)). Also Figure 3.6 indicates the optimal frequency position of the
carrier at 12.933 GHz (corresponding to T-rays frequency at ~625 GHz) where best
system performance is achieved.
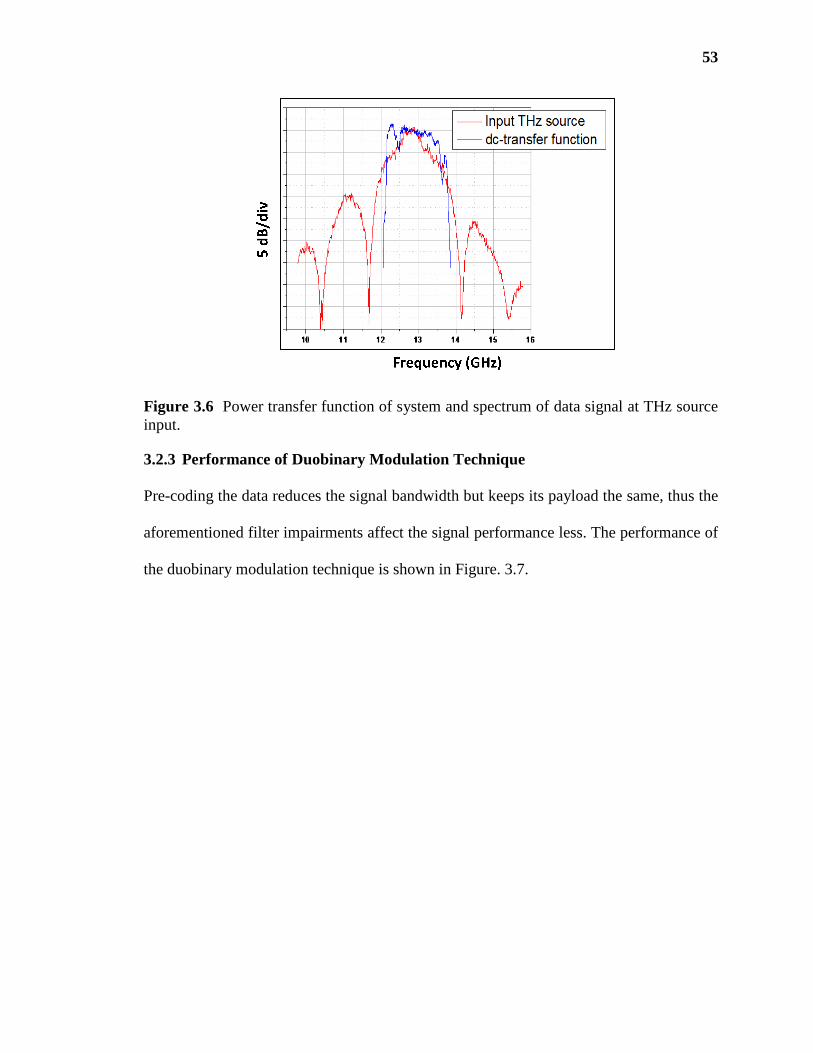
53
Figure 3.6 Power transfer function of system and spectrum of data signal at THz source input.
3.2.3 Performance of Duobinary Modulation Technique
Pre-coding the data reduces the signal bandwidth but keeps its payload the same, thus the
aforementioned filter impairments affect the signal performance less. The performance of
the duobinary modulation technique is shown in Figure. 3.7.
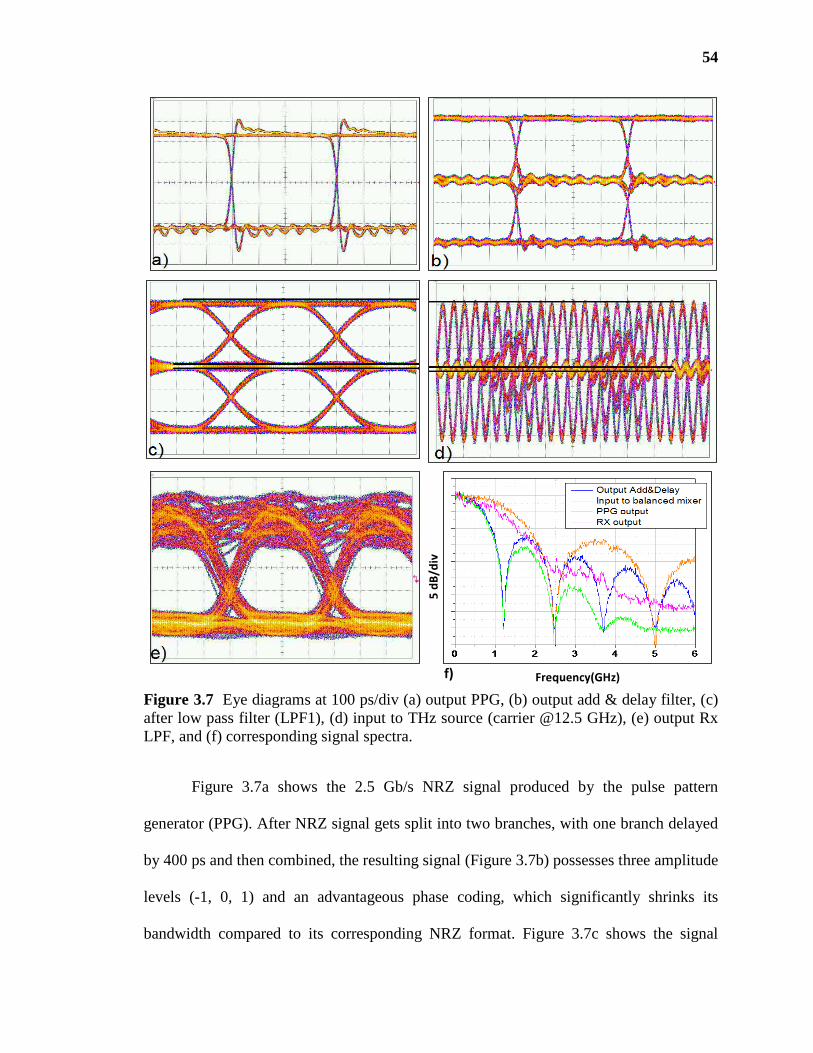
54
f) Frequency(GHz)
5 d
B/d
iv
Figure 3.7 Eye diagrams at 100 ps/div (a) output PPG, (b) output add & delay filter, (c) after low pass filter (LPF1), (d) input to THz source (carrier @12.5 GHz), (e) output Rx LPF, and (f) corresponding signal spectra.
Figure 3.7a shows the 2.5 Gb/s NRZ signal produced by the pulse pattern
generator (PPG). After NRZ signal gets split into two branches, with one branch delayed
by 400 ps and then combined, the resulting signal (Figure 3.7b) possesses three amplitude
levels (-1, 0, 1) and an advantageous phase coding, which significantly shrinks its
bandwidth compared to its corresponding NRZ format. Figure 3.7c shows the signal
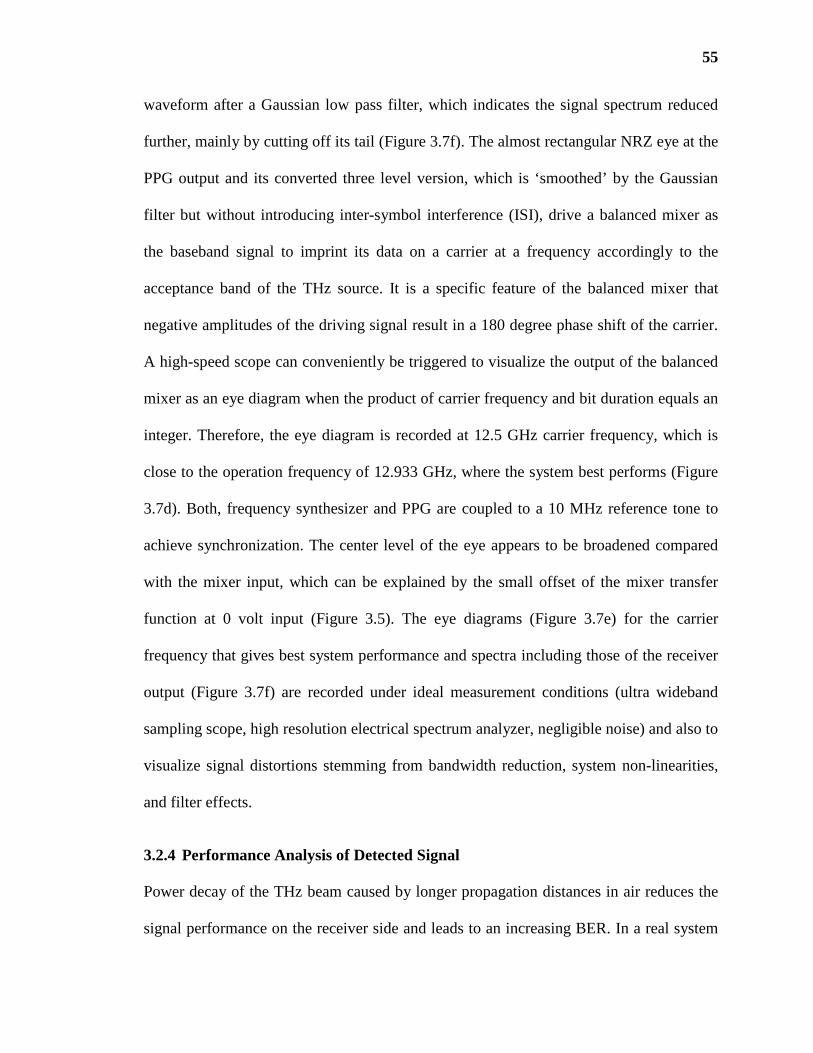
55
waveform after a Gaussian low pass filter, which indicates the signal spectrum reduced
further, mainly by cutting off its tail (Figure 3.7f). The almost rectangular NRZ eye at the
PPG output and its converted three level version, which is ‘smoothed’ by the Gaussian
filter but without introducing inter-symbol interference (ISI), drive a balanced mixer as
the baseband signal to imprint its data on a carrier at a frequency accordingly to the
acceptance band of the THz source. It is a specific feature of the balanced mixer that
negative amplitudes of the driving signal result in a 180 degree phase shift of the carrier.
A high-speed scope can conveniently be triggered to visualize the output of the balanced
mixer as an eye diagram when the product of carrier frequency and bit duration equals an
integer. Therefore, the eye diagram is recorded at 12.5 GHz carrier frequency, which is
close to the operation frequency of 12.933 GHz, where the system best performs (Figure
3.7d). Both, frequency synthesizer and PPG are coupled to a 10 MHz reference tone to
achieve synchronization. The center level of the eye appears to be broadened compared
with the mixer input, which can be explained by the small offset of the mixer transfer
function at 0 volt input (Figure 3.5). The eye diagrams (Figure 3.7e) for the carrier
frequency that gives best system performance and spectra including those of the receiver
output (Figure 3.7f) are recorded under ideal measurement conditions (ultra wideband
sampling scope, high resolution electrical spectrum analyzer, negligible noise) and also to
visualize signal distortions stemming from bandwidth reduction, system non-linearities,
and filter effects.
3.2.4 Performance Analysis of Detected Signal
Power decay of the THz beam caused by longer propagation distances in air reduces the
signal performance on the receiver side and leads to an increasing BER. In a real system

56
several effects can contribute to such power decrease. However here the power decay is
emulated by reducing the detected T-ray power with an iris inserted concentrically into
beam to limit its effective diameter (Figure 2.5). The total receiver output power is
measured with a RF power meter while we record the corresponding BER with and
without threshold optimization (Figure 3.8). After optimizing the data decision threshold
at a BER of about 1x 10⁻³ (BER level that can be reduced to ~1 x 10-15 by forward error
correction coding with 7% overhead used in lightwave transmission systems[76])
increasing of the detected THz power leads to smaller BER up to 2.5 x 10⁻⁷ where further
power enhancement does not reduce the error count (noise floor) for long PRBS (231-1).
In case of threshold adjustment error-free operation is achieved at power levels above -
14dBm at same pattern length. The impact of the PRBS length is investigated by
performing similar BER measurements with shorter patterns. For this the data is directly
triggered with the PPG clock in order to avoid artifacts caused by the clock recovery
when driven with long PRBSs. Short PRBS do not show noise floors as exemplifies with
a 27-1 pattern in both cases with and without decision threshold adjustment. A reason for
this could be saturation effects of the receiver Schottky diode and bandwidth limitations
of the receiver amplifiers. The clock recovery did not further degrade the system
performance.

57
Figure 3.8 Bit error curves for long and short PRBSs with and without decision threshold optimization. Eye diagram at decision gate input.
3.2.5 Signal-To-Noise Ratio (SNR) Measurement
In order to determine the signal-to-noise ratio (SNR) a short and periodically repeated
PRBS (27-1, 215-1) data is modulated and then measured with a high resolution electrical
spectrum analyzer. The noise level at the Rx amplifier output is measured as well. The
noise level is about 18 dB above the intrinsic noise floor of the electrical spectrum
analyzer (ESA) and independent of the launched THz power. The total receiver noise was
measured with a RF power meter to ~-36.4 dB. The obtained error rates are in fair
agreement with the theoretical amounts expected for bipolar coding if vertical eye closure
as visible in Figure 3.7e is accounted for in the calculation. The internal pre-amp of the
12.5 Gb/s bit error rate tester (BERT) does not significantly add noise to the data signal.
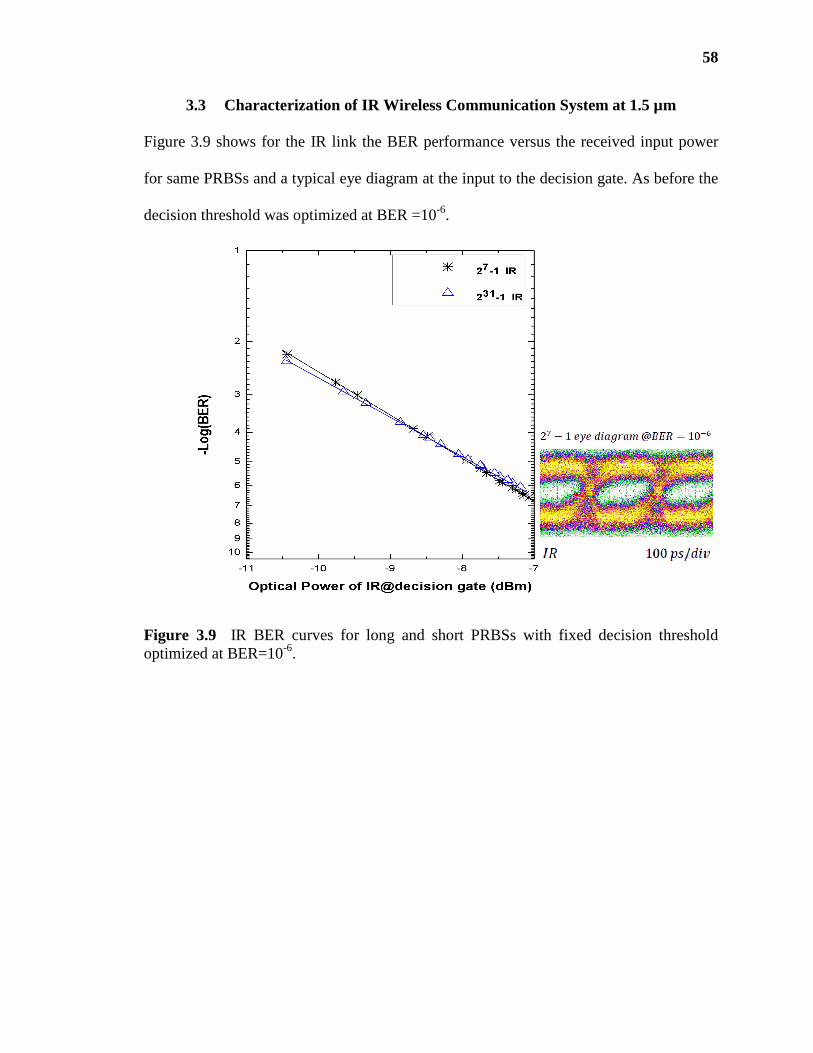
58
3.3 Characterization of IR Wireless Communication System at 1.5 µm
Figure 3.9 shows for the IR link the BER performance versus the received input power
for same PRBSs and a typical eye diagram at the input to the decision gate. As before the
decision threshold was optimized at BER =10-6.
Figure 3.9 IR BER curves for long and short PRBSs with fixed decision threshold optimized at BER=10-6.

59
CHAPTER 4
COMPARISON OF PERFORMANCE DEGRADATION FROM TERAHER TZ AND INFRARED WIRELESS LINKS IN FOG
Since weather conditions such as fog exhibit a spectral dependence in the atmospheric
attenuation, the corresponding impact on THz in comparison with IR communications are
not equivalent. At frequencies below 1000 GHz, the size of fog particles is considerably
smaller than the carrier wavelength, so that the Rayleigh scattering can be applied to
replace the much more complicated Mie scattering theory [77]. The attenuation by fog
can be modeled using a simple double-Debye model for the dielectric permittivity of
water [78], based on the total liquid water content. In the IR range, this is no longer true
and the distribution of the particle size must be considered. Assuming that the particle
size distributions follow the Deirmendjian modified gamma function [79], models such
MODTRAN [80], LOWTRAN [81] and FASCOD [82, 83] can be applied in the IR range
to perform the full Mie calculation scattering for some known particle size distributions.
For a more practical approach, one could use visibility data to predict specific attenuation
using the empirical models, such as the Kruse [84], Kim [85] and Naboulsi [86] models.
In this chapter, simulation results of attenuation by fog in the millimeter and sub-
millimeter waveband (from 0.1 to 1 THz) and infrared waveband (1.5 µm) are presented
and compared. An IR beam at 1.5 µm wavelength carrying the same data load is
superposed with the THz beam. After propagating through the same weather conditions
(fog), performance of both channels are analyzed and compared.

60
4.1 Fog Introduction
Fog is a collection of suspended water droplet or ice crystals near the Earth’s surface that
leads to a reduction of horizontal visibility below 1 km [87]. Fog normally can form
when the air becomes nearly saturated with water (relative humidity close to 100%) and
water vapor produce condensation around nuclei in the air (assuming sufficient
condensation nuclei are present in the air).
Fog can be characterized by several physical parameters, such as visibility, water
content ( 3/g m ), and drop size distribution. Several types of fog can be distinguished
depending on how the cooling induced the condensation occurred, but generally
advection fog and radiation fog are most encountered [88]. Advection fog is usually
coastal fog which forms when warm, moist air moves over colder surface (tropical air
encounters cooler waters). The diameter of the drop size is close to 20 µm and the liquid
water content is higher than 0.20 3/g m . Radiation fog forms inland, which is generated
by the cooling of land by thermal radiation until the air temperature approaches the dew
point. Its liquid water content varies between 0.01 and 0.1 3/g m and particle diameter is
around 4 µm.
In the lab environment, in order to compare propagation properties as measured
by different regions of the electromagnetic spectrum, the artificial fog is generated by
dripping liquid Nitrogen into a cup filled with hot water (temperature about ~80°C)
which is placed inside the fog chamber containing the propagating IR and THz beams. In
order to duplicate more closely naturally fogs, no condensation nuclei were added, the
steam condensing on the nuclei normally present in the air. The only apparent difference
61
between artificial fog produced in this manner and natural fog is the sized of the fog
droplets, the artificial fog being composed of somewhat smaller particle of more uniform
size [89].
The droplet sizes of the fog particles are measured using the microscope. The fog
droplets are collected on slides covered with a thin layer of mineral oil. If the oil is
properly saturated with water, the evaporation of the drops can be prevented and the
drops will retain their spherical shape [90]. It suggests an average diameter of the fog
drops in a range of 8 µm. Better photographic contrast can be obtained if a proper dark
field illuminator is used [90].
4.2 Fog Attenuation and Scattering Mechanisms
4.2.1 Fog Attenuation
Atmospheric attenuation is also called extinction, defined as the process whereby some or
all the energy of an electromagnetic wave is lost (absorbed and/or scattered) when
traversing the atmosphere. According to the Beer’s-Lambert Law [91], the attenuation of
laser radiation through the atmosphere can be expressed as:
( )( , )( , )
( ,0)RP R
R eP
γ λλτ λλ
−= = (4.1)
where R is transmission distance, ( , )Rτ λ is total transmittance of the atmosphere at the
wavelength λ , ( , )P Rλ is optical power at the distance R , ( ,0)P λ is initial emitted
optical power, and ( )γ λ is attenuation or the total extinction coefficient (per unit of
length). The total extinction coefficient ( )γ λ is composed of two parts: absorption term
and scattering term and can be expressed as:

62
( ) ( ) ( ) ( ) ( ) ( ) ( )m p m pγ λ α λ β λ α λ α λ β λ β λ= + = + + + (4.2)
where ( )α λ is absorption coefficient, ( )β λ is scattering coefficient, and the subscripts m
and p designate the molecular and aerosol processes, respectively.
The absorption and scattering can be expressed in terms of the absorption and
scattering cross section (aσ and sσ , respectively) of the individual particles that are
involved:
a aNα σ= (4.3)
s sNβ σ= (4.4)
where aN and sN are the concentrations of the absorbers and scatterers,
respectively.
Fog droplets in the atmosphere can be considered as approximately spheres with a
complex refractive index, which is also temperature dependent. In both THz region (625
GHz) and Infrared region (1.5 µm), the contributions of absorption to the total attenuation
coefficient are very small, while the effects of scattering dominate the total attenuation
coefficient [92].
4.2.2 Scattering Mechanism
The type of scattering is determined by the size of the specific particle with respect to the
transmission wavelength and can be divided into three domains based on a dimensionless
size parameter α which is defined as:
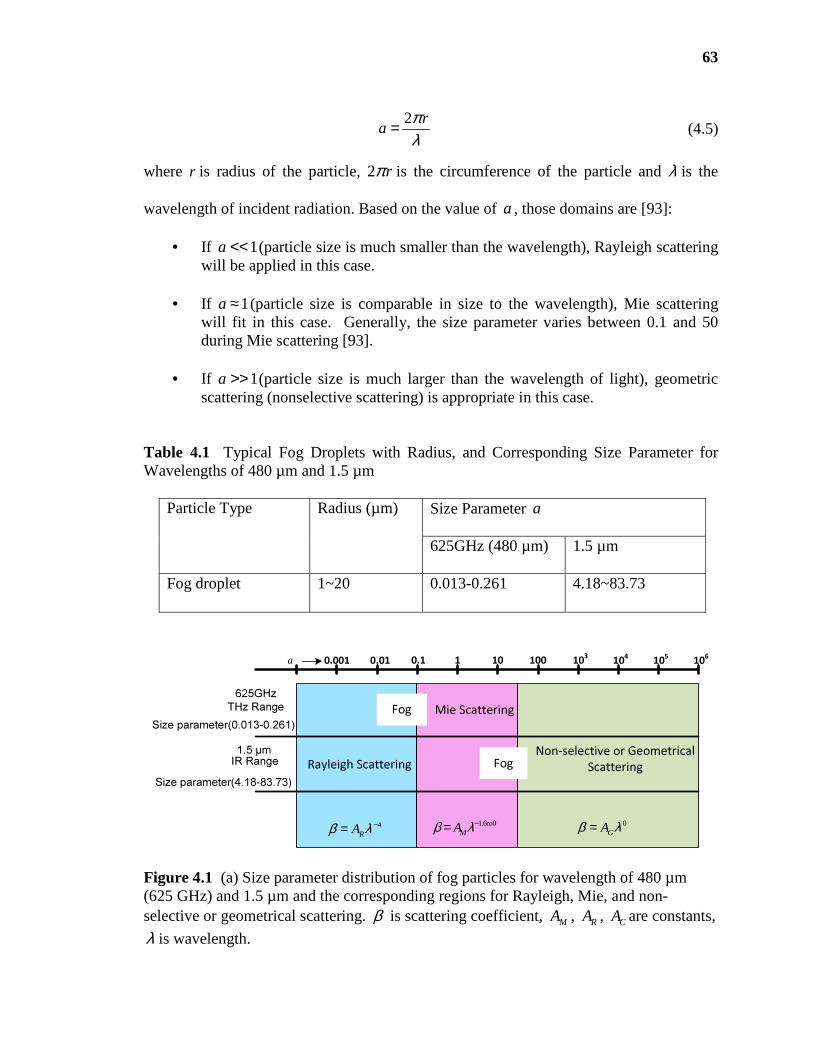
63
2 ra
πλ
= (4.5)
where r is radius of the particle, 2 rπ is the circumference of the particle and λ is the
wavelength of incident radiation. Based on the value of a , those domains are [93]:
• If 1a << (particle size is much smaller than the wavelength), Rayleigh scattering will be applied in this case.
• If 1a ≈ (particle size is comparable in size to the wavelength), Mie scattering will fit in this case. Generally, the size parameter varies between 0.1 and 50 during Mie scattering [93].
• If 1a >> (particle size is much larger than the wavelength of light), geometric scattering (nonselective scattering) is appropriate in this case.
Table 4.1 Typical Fog Droplets with Radius, and Corresponding Size Parameter for Wavelengths of 480 µm and 1.5 µm
Particle Type Radius (µm) Size Parameter a 625GHz (480 µm)
1.5 µm
Fog droplet 1~20 0.013-0.261 4.18~83.73
Size parameter(0.013-0.261)
Size parameter(4.18-83.73)
a 0.1 1 100100.010.001 103
104
105
106
625GHz
THz Range
1.5 µmIR Range
Fog
FogRayleigh Scattering
Mie Scattering
Non-selective or Geometrical
Scattering
4RAβ λ−= 1.6 0to
MAβ λ−= 0GAβ λ=
Figure 4.1 (a) Size parameter distribution of fog particles for wavelength of 480 µm (625 GHz) and 1.5 µm and the corresponding regions for Rayleigh, Mie, and non-selective or geometrical scattering. β is scattering coefficient, MA , RA , CA are constants,
λ is wavelength.
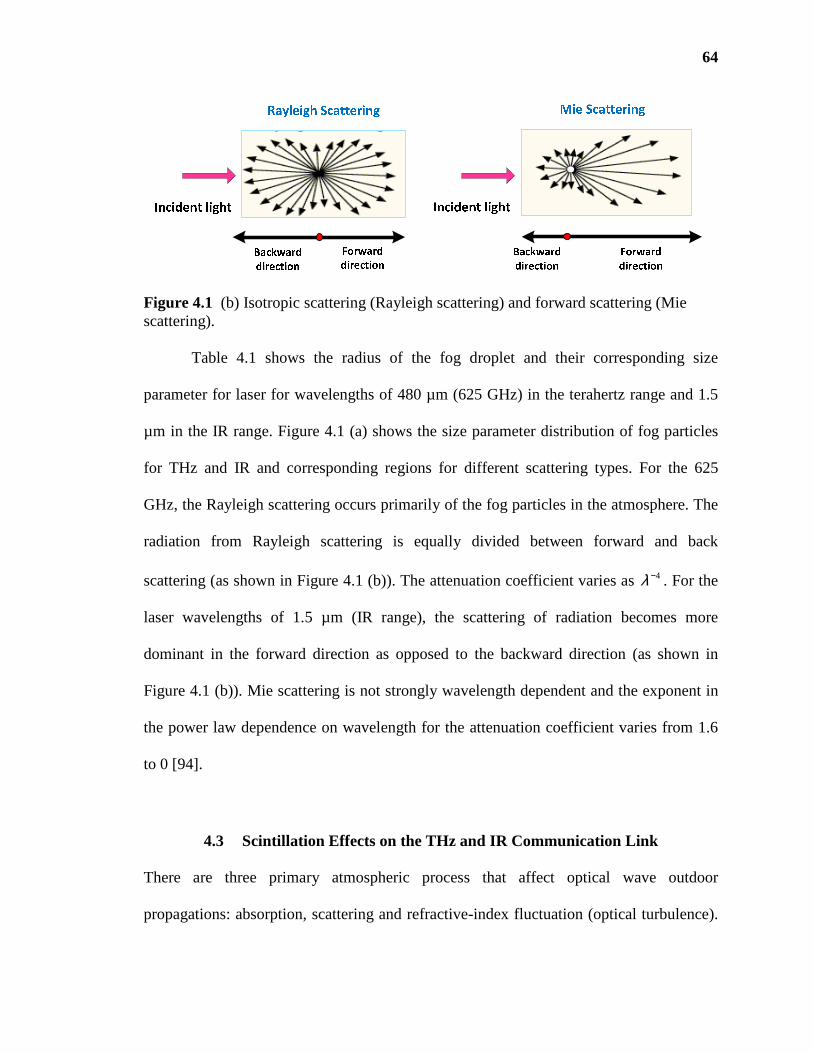
64
Figure 4.1 (b) Isotropic scattering (Rayleigh scattering) and forward scattering (Mie scattering).
Table 4.1 shows the radius of the fog droplet and their corresponding size
parameter for laser for wavelengths of 480 µm (625 GHz) in the terahertz range and 1.5
µm in the IR range. Figure 4.1 (a) shows the size parameter distribution of fog particles
for THz and IR and corresponding regions for different scattering types. For the 625
GHz, the Rayleigh scattering occurs primarily of the fog particles in the atmosphere. The
radiation from Rayleigh scattering is equally divided between forward and back
scattering (as shown in Figure 4.1 (b)). The attenuation coefficient varies as 4λ − . For the
laser wavelengths of 1.5 µm (IR range), the scattering of radiation becomes more
dominant in the forward direction as opposed to the backward direction (as shown in
Figure 4.1 (b)). Mie scattering is not strongly wavelength dependent and the exponent in
the power law dependence on wavelength for the attenuation coefficient varies from 1.6
to 0 [94].
4.3 Scintillation Effects on the THz and IR Communication Link
There are three primary atmospheric process that affect optical wave outdoor
propagations: absorption, scattering and refractive-index fluctuation (optical turbulence).

65
Absorption and scattering by the gases and particulates of the atmosphere give rise
primarily to attenuation of the laser beam, which are introduced in Section 4.2. In the
following section, scintillation effects will be introduced.
With regard to communications, scintillation is defined as a random intensity
fluctuation on the received field strength caused by irregular changes in the transmission
path over time [46]. The strength variation of an optical signal as it travels through air
derives from small fluctuations (optical turbulence) in the index of refraction along the
optical path. The atmospheric turbulence arises when air parcels of different temperatures
are mixed by wind and convection. The individual air parcels, or turbulence cells, break
up into smaller cells and eventually lose their identity. In the meantime, however, the
mixing produces fluctuation in the density and therefore in the refractive index of air
[95].
Figure 4.2 Air turbulence causes refractive index fluctuations resulting into speckle (intensity variations at receiver) that limits the reach of IR systems. Source: [16]
The fluctuations of the real refractive index through the path of a beam can cause
random deflection and interference between different portions of the wavefront and
destroy the flat phase front of an IR light beam when it passes through a few kilometers
of air. Even if a single local refractive index fluctuation only slightly distort the wave’s
phase front, the effect can accumulate over a few kilometers of propagation distance

66
resulting into a complete or almost complete destruction of the phase front. As a
consequence, on the receiver side the beam cross section appears as a speckle pattern
(Figure 4.2) with huge local and temporal intensity variations preventing detection of
constant signal power. After passing through fog, low clouds, and direct sunlight,
scintillation of the carrier wave is the factor that causes most significant performance
deterioration of an optical wireless link. Because of the constantly changing pattern,
scintillation appears to be more significant when the receiver has s small aperture.
As will be shown below, THz beams are much less susceptible to scintillation
compared to IR beams. The index of refraction value in the atmosphere depends on
temperature, pressure, and humidity of air and on the temperature, pressure, and humidity
of air and on the wavelength used for the transmission. The refraction index of air in the
millimeter wave band up to a few hundred GHz can be well approximated as function of
temperature and pressure by [96]:
6v7.761 4810 10mmW a
Pn P
T T− ≈ + + ×
(4.6)
where T, aP , vP stand for the temperature in Kelvin, the atmospheric pressure in kPa,
and the water vapor pressure in kPa, respectively. Similarly, for IR wavelengths the
refraction index of air can be written as[95]:
6 3 2 61 7.76 10 1 7.52 10 ) 1 7.76 10a aIR
P Pn
T Tλ− − − − ≈ + × + × ≅ + ×
(4.7)
where λ stands for the wavelength in µm. The formula does not consider humidity
as it only insignificantly degrades IR propagation. Under the assumption of relevant air
parameters a numerical comparison of both formulas shows that even at high levels of
water vapor pressure the refraction index changes in both the THz and IR bands are

67
comparable. Since scintillation effects are driven by variations in phase, the relevant
parameter is the variation in the optical path length relative to the electromagnetic
wavelength. Since the variation in the optical path length for both the IR and THz are
comparable (the changes in refractive index are commensurate), the relative magnitudes
of the phase variations are predominately determined by the electromagnetic wavelength.
The wavelength of THz at ~200 GHz is approximately 1000 times longer than the
wavelength of 1.5 µm light. In summary, while time-varying fluctuations in the real
refractive index of the atmospheric path leads to scintillation effects in wireless
communications, these effects are smaller for THz compared to IR wireless links [16].
4.4 Millimeter Wave Attenuation Due to Fog
For the fog particles, generally less than 20 µm, the Rayleigh approximation is valid for
the frequency range between 10 GHz and 1000 GHz. To calculate propagation effects,
the Rayleigh scattering approximation can be applied to replace the much more
complicated Mie scattering theory.
4.4.1 Double-Debye Model
The attenuation by fog from 10 to 1000 GHz can be calculated using a simple double-
Debye model for the dielectric permittivity of water based on the total liquid water
content, developed by Liebe [78] and adopted by the international Telecommunication
Union in Recommendation (ITU-R P.840-4) [97, 98].
When the Rayleigh scattering approximation is valid, the specific attenuation
within fog can be written as:

68
c lK wγ = (4.8)
2
0.819
''(1 )l
fK
ε η=
+ (4.9)
2 '
''
εηε+= (4.10)
where cγ is specific attenuation (dB/km) in the fog, lK is specific attenuation coefficient
(dBkm-1g-1m3), w is liquid water density (g/m3). The liquid water density in fog is
typically about 0.05 g/m3 for medium fog (visibility of the order of 300 m) and 0.5 g/m3
for thick fog (visibility of the order of 50 m). In the above equationf is the
frequency(GHz), 'ε and ''ε are the real and image part of the complex dielectric
permittivity of water which can be computed with double-Debye model:
0 1 1 22 2
( ) ( )''( )
[1 ( / ) ] [1 ( / ) ]p p s s
f ff
f f f f f f
ε ε ε εε − −= ++ +
(4.11)
0 1 1 222 2
'( )[1 ( / ) ] [1 ( / ) ]p s
ff f f f
ε ε ε εε ε− −= + ++ +
(4.12)
with three permittivity constants given by,
0( ) 77.6 103.3( 1)Tε θ= + − (4.13)
1 5.48ε = (4.14)
2 3.51ε = (4.15)
The relative inverse temperature variable θ can be expressed as,

69
300 /Tθ = (4.16)
with T representing the temperature (K). The principal and secondary relaxation
frequencies are:
2( ) 20.09 142( 1) 294( 1)pf T θ θ= − − + − (4.17)
and
( ) 590 1500( 1)sf T θ= − − (4.18)
In summary, (4.8)-(4.18) represent the propagation model for the fog droplets from 10 to
1000 GHz.
4.4.2 Simulation Results
The fog attenuation from 10 GHz to 1000 GHz at several temperatures are evaluated by
Rayleigh approximation and displayed in Figure 4.3(a). Figure 4.3(b) is in the
logarithmic scale. Selected numerical values of the attenuation are listed in Table 4.2.
Table 4.2 Double-Debye Model Predication of Attenuation for Frequency Up to 1000 GHz, Water Content: w=1g/m3
Frequency
(GHz) cγ (T=-20℃)
(dB/km)
cγ (T=-10℃)
(dB/km)
cγ (T=0℃)
(dB/km)
cγ (T=10℃)
(dB/km)
cγ (T=20℃)
(dB/km)
300 11.0843 12.4123 13.9210 15.1108 15.7974
400 14.0374 15.8171 17.7635 19.4355 20.6363
500 16.4556 18.8518 21.3424 23.5158 25.1914
800 20.9017 25.1923 29.5697 33.5219 36.8206
1000 22.4296 27.6469 33.0955 38.1767 42.5875

70
(a)
(b)
Figure 4.3 (a) Double-Debye model predication of attenuation for frequency up to 1000 GHz, water content: w=1g/m3 and temperature from -20 ℃ to +20 ℃ (b) Logarithmic scale.
0 100 200 300 400 500 600 700 800 900 10000
5
10
15
20
25
30
35
40
45
Frequency(GHz)
Att
enua
tion(
dB/k
m)
T=20°CT=10°CT=0°CT=-10°CT=-20°C
100
101
102
103
10-4
10-3
10-2
10-1
100
101
102
Frequency(GHz)
Atten
uatio
n(dB
/km
)
T=20°CT=10°CT=0°CT=-10°CT=-20°C
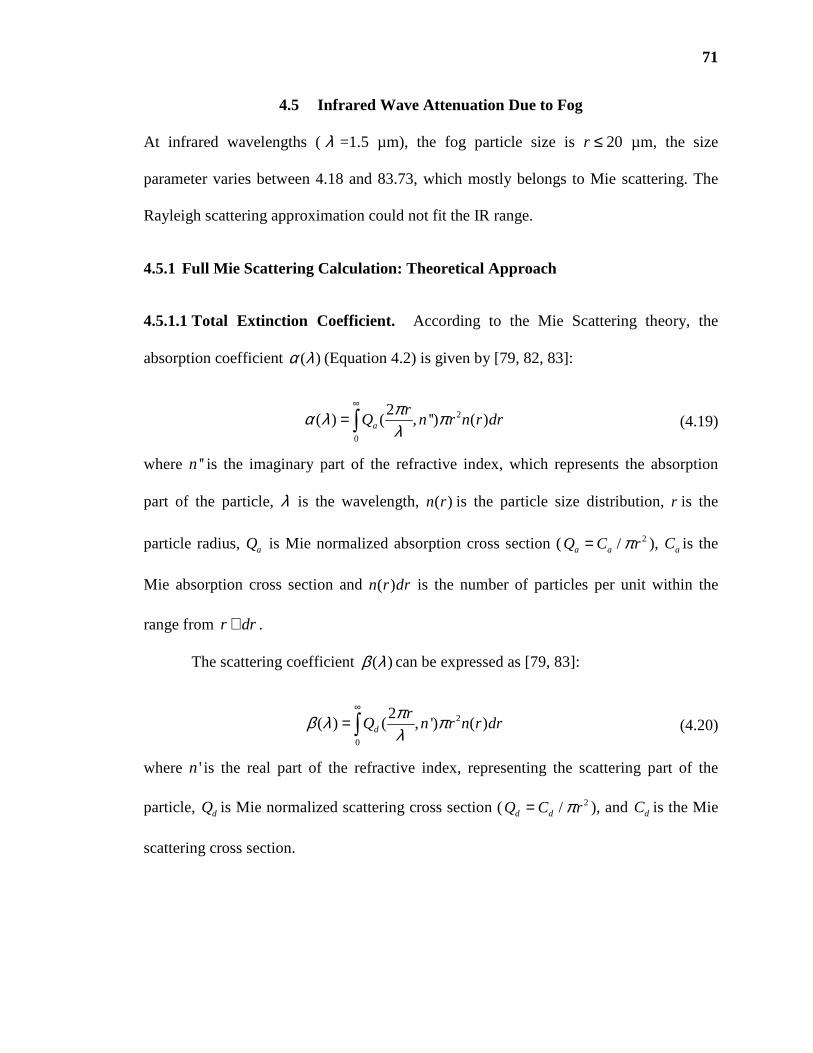
71
4.5 Infrared Wave Attenuation Due to Fog
At infrared wavelengths (λ =1.5 µm), the fog particle size is 20r ≤ µm, the size
parameter varies between 4.18 and 83.73, which mostly belongs to Mie scattering. The
Rayleigh scattering approximation could not fit the IR range.
4.5.1 Full Mie Scattering Calculation: Theoretical Approach
4.5.1.1 Total Extinction Coefficient. According to the Mie Scattering theory, the
absorption coefficient ( )α λ (Equation 4.2) is given by [79, 82, 83]:
2
0
2( ) ( , '') ( )a
rQ n r n r dr
πα λ πλ
∞
= ∫ (4.19)
where ''n is the imaginary part of the refractive index, which represents the absorption
part of the particle, λ is the wavelength, ( )n r is the particle size distribution, r is the
particle radius, aQ is Mie normalized absorption cross section ( 2/a aQ C rπ= ), aC is the
Mie absorption cross section and ( )n r dr is the number of particles per unit within the
range from r dr+ .
The scattering coefficient ( )β λ can be expressed as [79, 83]:
2
0
2( ) ( , ') ( )d
rQ n r n r dr
πβ λ πλ
∞
= ∫ (4.20)
where 'n is the real part of the refractive index, representing the scattering part of the
particle, dQ is Mie normalized scattering cross section ( 2/d dQ C rπ= ), and dC is the Mie
scattering cross section.

72
4.5.1.2 Particle Size Distribution. Silverman and Sprague use the Deirmendjian
modified gamma distribution [79] to describe the size distribution of the particles, which
can be expressed as:
( ) exp( )m nn r c r b r= ⋅ − ⋅ (4.21)
where ( )n r is the number of the particles per unit volume and per unit increasement of
the particle radius r (µm), while m, b and n are parameters that characterize the particle
size distribution. The constant c is a normalization constant. For two different types of
fog: heavy adventure fog and moderate radiation fog, the typical parameters are given in
the Table 4.3.
4.5.1.3 Fog Attenuation. If the particle size distribution, water refractive index and
absorption and scattering cross sections are known, the extinction coefficients can be
calculated using Equation 4.20 and Equation 4.21 and software modeling code such as
FASCOD [82], LOWTRAN [80] and MODTRAN [80].
Table 4.3 DSD Gamma Parameters, Reflectivity Z, LWC and Visibility V of the Considered Four Models of Fog Type of fog
Model c α b γ Z(dBz) LWC
( 3gm− )
V(km)
Advection 1. strong
2. light
0.06592 3 0.3 1 -3.03 0.9 0.02
0.027 3 0.375 1 -16.79 0.078 0.089
Radiation 3. strong
4. light
2.37305 6 1.5 1 -31.27 0.062 0.146
607.5 6 3.0 1 -46.32 0.016 0.352
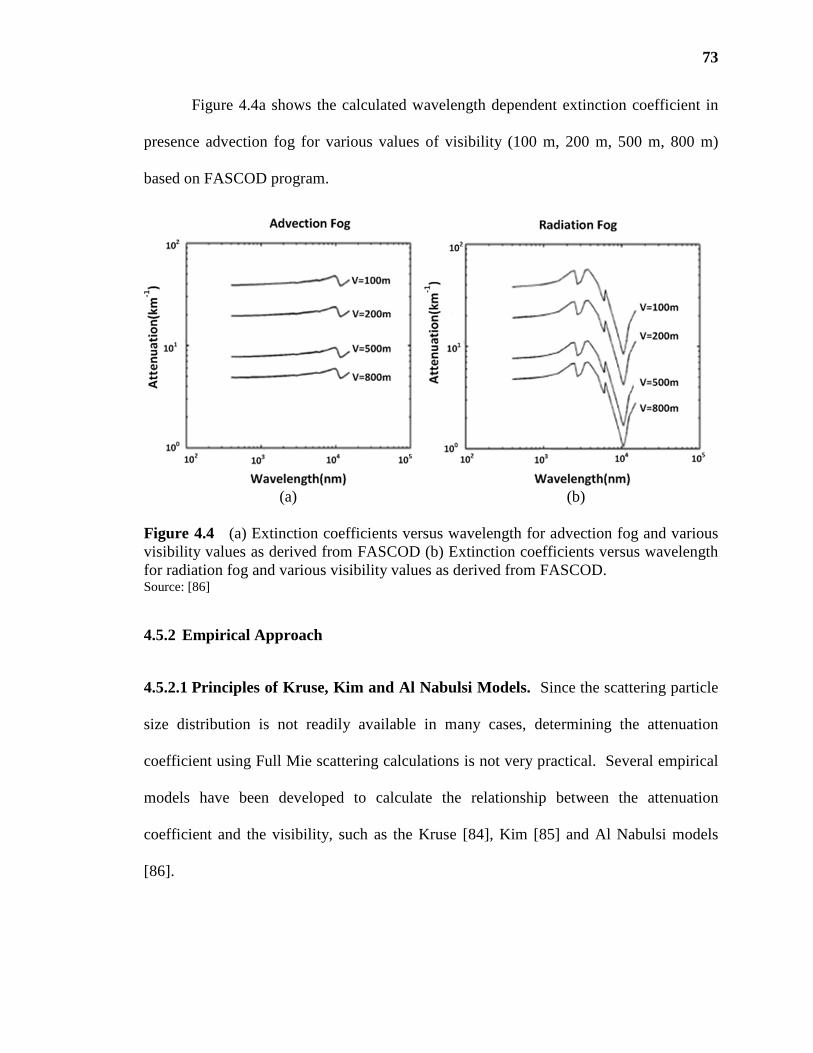
73
Figure 4.4a shows the calculated wavelength dependent extinction coefficient in
presence advection fog for various values of visibility (100 m, 200 m, 500 m, 800 m)
based on FASCOD program.
(a) (b)
Figure 4.4 (a) Extinction coefficients versus wavelength for advection fog and various visibility values as derived from FASCOD (b) Extinction coefficients versus wavelength for radiation fog and various visibility values as derived from FASCOD. Source: [86]
4.5.2 Empirical Approach
4.5.2.1 Principles of Kruse, Kim and Al Nabulsi Models. Since the scattering particle
size distribution is not readily available in many cases, determining the attenuation
coefficient using Full Mie scattering calculations is not very practical. Several empirical
models have been developed to calculate the relationship between the attenuation
coefficient and the visibility, such as the Kruse [84], Kim [85] and Al Nabulsi models
[86].

74
The atmospheric visibility is defined as a distance where the 550 nmcollimated
light beam is attenuated to a fraction (5% or 2%) of original power [84], which can be
given by the Koschmieder Law:
550
3.912
nm
Vγ
= (4.22)
For both Kruse and Kim model, the attenuation coefficient is approximated by
3.912( ) ( )
550q
V
λγ λ −= (4.23)
where q is depends on the scattering particle size distribution, which can be determined
by the experimental data. It is given by the Kruse model:
1/3
1.6 50
1.3 6 50
0.585 6
V km
q km V km
V V km
> = < < <
(4.24)
A new expression for the value of q in Equation 6 for visibility< 6 km, is proposed by the
Kim model
1.6 50
1.3 6 50
0 500
0.5 500 1
0.16 0.34 1 6
V km
km V km
q V m
V m V km
V km V km
> < < = < − < <
+ < <
(4.25)
For the Al Naboulsi model, fog attenuation coefficient caused by advection fog is:
0.11478 3.38367( )
V
λγ λ += (4.26)
The fog attenuation coefficient caused by radiation fog is:
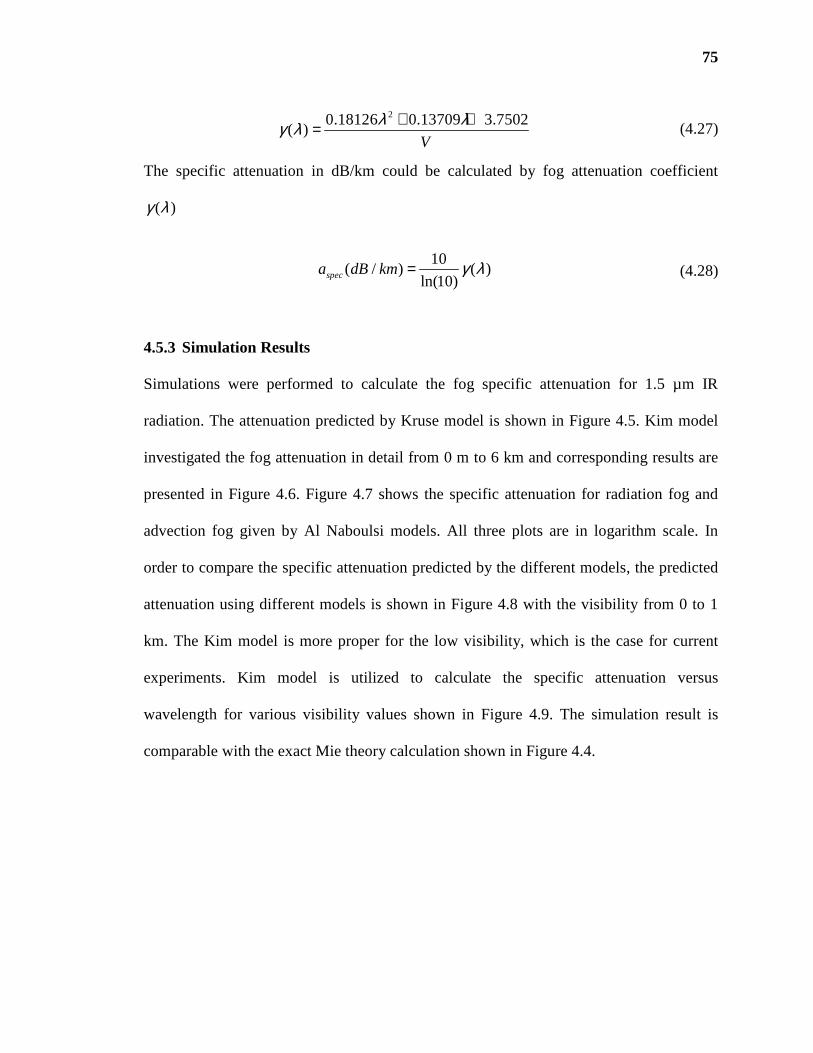
75
20.18126 0.13709 3.7502( )
V
λ λγ λ + += (4.27)
The specific attenuation in dB/km could be calculated by fog attenuation coefficient
( )γ λ
10( / ) ( )
ln(10)speca dB km γ λ= (4.28)
4.5.3 Simulation Results
Simulations were performed to calculate the fog specific attenuation for 1.5 µm IR
radiation. The attenuation predicted by Kruse model is shown in Figure 4.5. Kim model
investigated the fog attenuation in detail from 0 m to 6 km and corresponding results are
presented in Figure 4.6. Figure 4.7 shows the specific attenuation for radiation fog and
advection fog given by Al Naboulsi models. All three plots are in logarithm scale. In
order to compare the specific attenuation predicted by the different models, the predicted
attenuation using different models is shown in Figure 4.8 with the visibility from 0 to 1
km. The Kim model is more proper for the low visibility, which is the case for current
experiments. Kim model is utilized to calculate the specific attenuation versus
wavelength for various visibility values shown in Figure 4.9. The simulation result is
comparable with the exact Mie theory calculation shown in Figure 4.4.
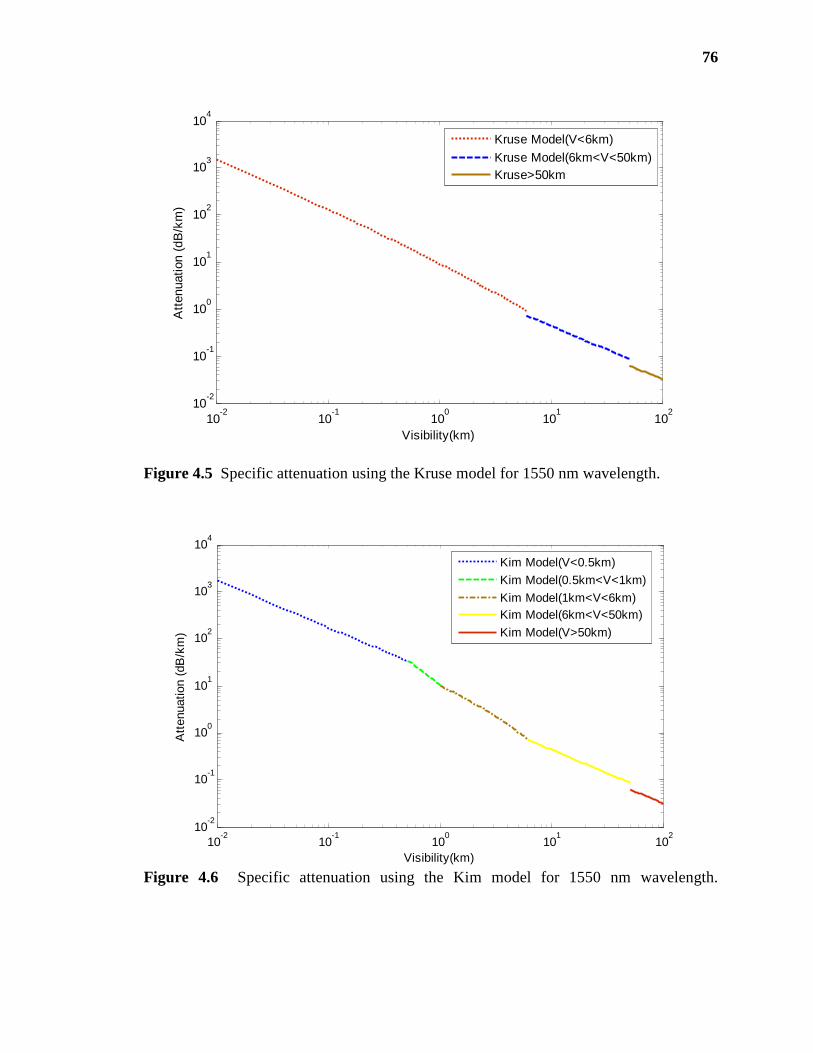
76
Figure 4.5 Specific attenuation using the Kruse model for 1550 nm wavelength.
Figure 4.6 Specific attenuation using the Kim model for 1550 nm wavelength.
10-2
10-1
100
101
102
10-2
10-1
100
101
102
103
104
Visibility(km)
Att
enua
tion
(dB
/km
)
Kruse Model(V<6km)
Kruse Model(6km<V<50km)Kruse>50km
10-2
10-1
100
101
102
10-2
10-1
100
101
102
103
104
Visibility(km)
Att
enua
tion
(dB
/km
)
Kim Model(V<0.5km)
Kim Model(0.5km<V<1km)
Kim Model(1km<V<6km)Kim Model(6km<V<50km)
Kim Model(V>50km)

77
Figure 4.7 Specific attenuation using Al Nabulsi model for 1550 nm wavelength.
Figure 4.8 Specific attenuation for 1550 nm wavelength predicted by different models.
10-1
100
101
102
10-1
100
101
102
103
Visibility(km)
Att
enua
tion(
dB/k
m)
Advection Fog
Radiation Fog
0 0.1 0.2 0.3 0.4 0.5 0.6 0.7 0.8 0.9 10
200
400
600
800
1000
1200
1400
1600
1800
Visibility(km)
Att
enua
tion(
dB/k
m)
Al Naboulsi Advection Fog Model
ALNaboulsi Radiation Fog Model
Kruse ModelKim Model(0.5km<V<1km)
Kim Model(V<0.5km)

78
Figure 4.9 Specific attenuation versus wavelength for various visibility values derived from the Kim model.
4.6 Experimental Results
4.6.1 Experimental Setup
An IR beam at 1.5 µm wavelength carrying the same data load as the THz system is
superposed with the THz beam, propagating through the same weather conditions (fog)
(shown in Figure 4.10). As both beams pass through the same channel perturbations and
as their degradations are recorded simultaneously, the weather impact on both channels
can be simultaneously analyzed and compared. The block diagram (Figure 4.10) shows
the main transmitter and receiver elements of the THz and IR communication links, the
optics for combining beams, the fog chamber, data acquisition interfaces, and control
loops for IR power stabilization. The features of the THz link followed by some remarks
about the IR channel have been explained in Chapter 2 and Chapter 3.
10-1
100
101
102
100
101
102
103
Wavelength(um)
Att
enua
tion(
dB/k
m)
V=100m
V=200mV=500m
V=800m
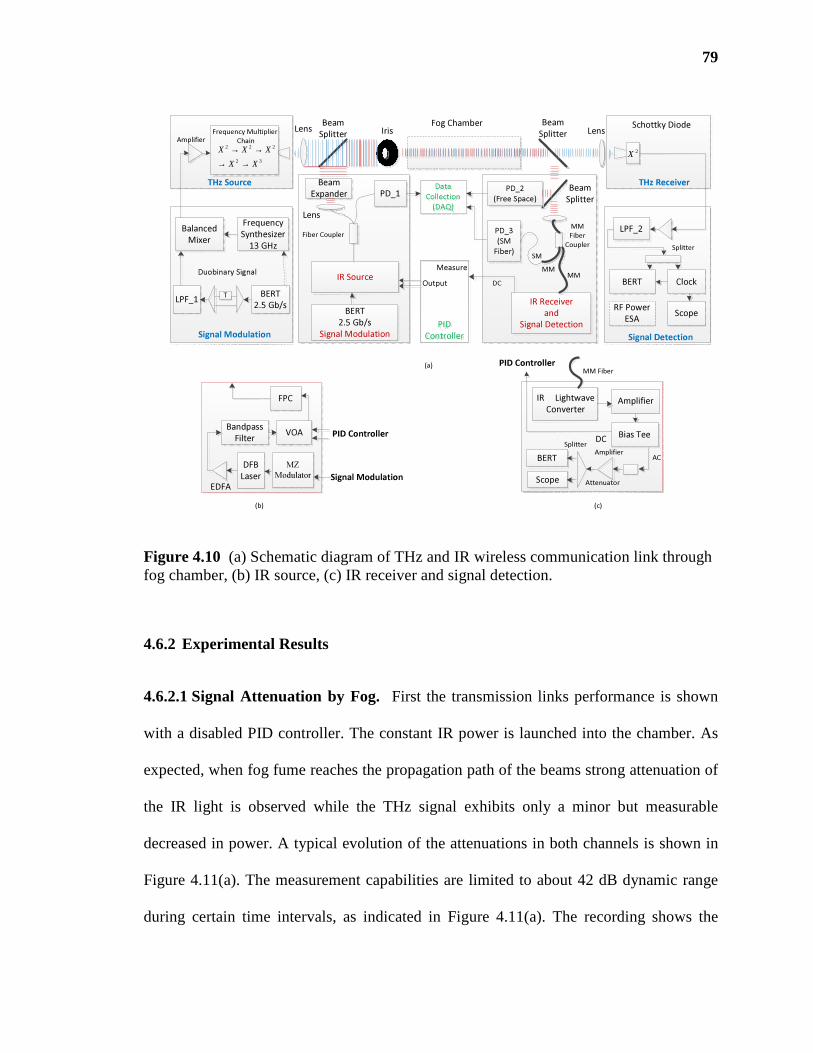
79
Amplifier
Amplifier
Signal ModulationEDFA
DFB
Laser
Bandpass
FilterVOA
FPC
PID Controller
MZ
Modulator
PD_2
(Free Space)
Frequency
Synthesizer
13 GHz
Frequency Multiplier
Chain
THz Source
2 2 2
2 3
X X X
X X
→ →→ →
Balanced
Mixer
BERT
2.5 Gb/sT
LPF_1
Duobinary Signal
Beam
Splitter
Lens LensBeam
Splitter
Fog Chamber Beam
SplitterIris
2X
LPF_2
BERT
RF Power
ESA
Clock
Scope
Schottky Diode
Data
Collection
(DAQ)
PID
Controller
Output
Measure
THz Receiver
Splitter
Signal DetectionSignal Modulation
Lens
Beam
Expander
BERT
2.5 Gb/s
Signal Modulation
PD_1
IR Source
Fiber Coupler
IR Receiver
and
Signal Detection
MM
Fiber
Coupler
PD_3
(SM
Fiber)
MMMM
SM
DC
Amplifier
(a)
(b) (c)
Amplifier
Bias TeeDC
PID Controller
ACBERT
Scope
AmplifierSplitter
Attenuator
IR Lightwave
Converter
MM Fiber
Figure 4.10 (a) Schematic diagram of THz and IR wireless communication link through fog chamber, (b) IR source, (c) IR receiver and signal detection.
4.6.2 Experimental Results
4.6.2.1 Signal Attenuation by Fog. First the transmission links performance is shown
with a disabled PID controller. The constant IR power is launched into the chamber. As
expected, when fog fume reaches the propagation path of the beams strong attenuation of
the IR light is observed while the THz signal exhibits only a minor but measurable
decreased in power. A typical evolution of the attenuations in both channels is shown in
Figure 4.11(a). The measurement capabilities are limited to about 42 dB dynamic range
during certain time intervals, as indicated in Figure 4.11(a). The recording shows the
80
noise floor of the power meter and not the actual IR power level. Clearly there is a huge
difference in the IR and THz attenuation. Usually, even ‘small’ amounts of fog are
sufficient to block the IR beam after a few seconds of diffusion. When the IR attenuation
reaches about 4 dB, the BER measurement of the IR signal collapses in agreement with
the receiver performance shown in Figure 4.11(a) and Figure 4.11(b). For the THz
channel, a functional relation between the attenuation for both signals and the recorded
BERs is clearly visible. After some 10s of second the fog disappears into the lab
environment or is converted into humidity thus both links regain or approach their
original performance, respectively. The ratio of the IR channel attenuation over the THz
channel attenuation (Figure 4.11(c)), both measured in dB, shows a trend to become
smaller towards the end of the measurement. However, while one would expect the total
attenuation in either channel to change in time as the particle density of the fog decreases
in time, one would expect the ration of attenuation coefficients in the IR and THz to be
fixed. Likely, over time, the fog is converted into humidity during the recording time.
The conversion of fog to humidity impairs the THz signal relatively stronger than the IR
signal. This hypothesis is in agreement with Figure 4.11(b) where the THz link towards
the end of the measurement maintains a small attenuation while the IR attenuation
approaches zero.

81
(a)
(b)
(c)
Figure 4.11 (a) Attenuation of THz link and IR link with time (b) Log(BER) of THz link and IR link with time (c) IR attenuation in dB relative to THz attenuation in dB over time.
0 5 10 15 20 25 300
10
20
30
40
5050
Time(s)
Atten
uatio
n of
IR
Lin
k(dB
)
0 5 10 15 20 25 300
0.2
0.4
0.6
0.8
11
Atten
uatio
n of
TH
z Li
nk(d
B)IR Noise Floor
IR LinkTHz Link
0 5 10 15 20 25 30-7
-4
-1-1
Time(s)
Log(
BE
R) of
IR
Lin
k(dB
)
0 5 10 15 20 25 30-5.9
-5.5
-5.1
Log(
BE
R) of
TH
z Li
nk(d
B)
IR Link
THz Link
0 5 10 15 200
40
80
120
160160
Time(s)
IR (dB
)/TH
z (d
B) R
atio
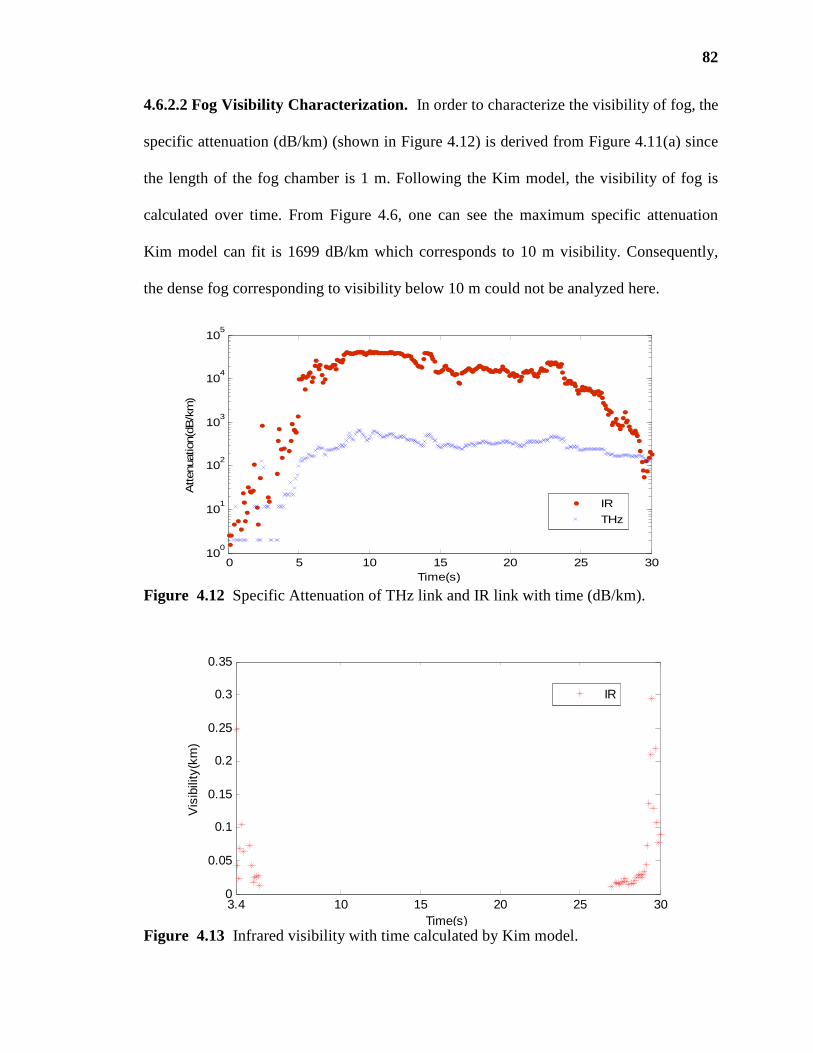
82
4.6.2.2 Fog Visibility Characterization. In order to characterize the visibility of fog, the
specific attenuation (dB/km) (shown in Figure 4.12) is derived from Figure 4.11(a) since
the length of the fog chamber is 1 m. Following the Kim model, the visibility of fog is
calculated over time. From Figure 4.6, one can see the maximum specific attenuation
Kim model can fit is 1699 dB/km which corresponds to 10 m visibility. Consequently,
the dense fog corresponding to visibility below 10 m could not be analyzed here.
Figure 4.12 Specific Attenuation of THz link and IR link with time (dB/km).
Figure 4.13 Infrared visibility with time calculated by Kim model.
0 5 10 15 20 25 3010
0
101
102
103
104
105
Time(s)
Atten
uatio
n(dB
/km
)
IR
THz
3.4 10 15 20 25 300
0.05
0.1
0.15
0.2
0.25
0.3
0.35
Time(s)
Vis
ibili
ty(k
m)
IR
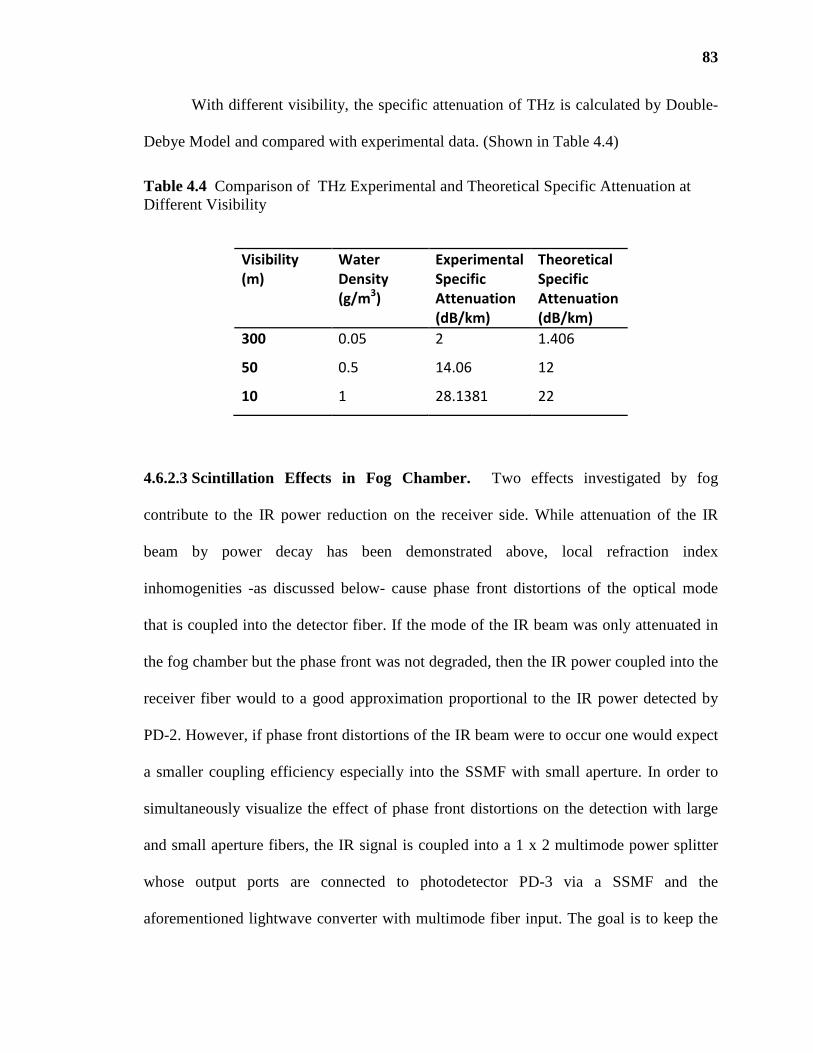
83
With different visibility, the specific attenuation of THz is calculated by Double-
Debye Model and compared with experimental data. (Shown in Table 4.4)
Table 4.4 Comparison of THz Experimental and Theoretical Specific Attenuation at Different Visibility
4.6.2.3 Scintillation Effects in Fog Chamber. Two effects investigated by fog
contribute to the IR power reduction on the receiver side. While attenuation of the IR
beam by power decay has been demonstrated above, local refraction index
inhomogenities -as discussed below- cause phase front distortions of the optical mode
that is coupled into the detector fiber. If the mode of the IR beam was only attenuated in
the fog chamber but the phase front was not degraded, then the IR power coupled into the
receiver fiber would to a good approximation proportional to the IR power detected by
PD-2. However, if phase front distortions of the IR beam were to occur one would expect
a smaller coupling efficiency especially into the SSMF with small aperture. In order to
simultaneously visualize the effect of phase front distortions on the detection with large
and small aperture fibers, the IR signal is coupled into a 1 x 2 multimode power splitter
whose output ports are connected to photodetector PD-3 via a SSMF and the
aforementioned lightwave converter with multimode fiber input. The goal is to keep the
Visibility
(m)
Water
Density
(g/m3)
Experimental
Specific
Attenuation
(dB/km)
Theoretical
Specific
Attenuation
(dB/km)
300 0.05 2 1.406
50 0.5 14.06 12
10 1 28.1381 22

84
optical power at the data receiver’s input constant by means of the PID controller when
fog enters the beam so that the BER should not change (constant signal quality). The
outputs of all photo detectors are simultaneously recorded along with the BER and
transmitter output power of the IR channel (Figure. 4.14). In order to allow an easier
overview on the variations of the recorded signals we plot relative changes on a decibel
scale. When fog diffuses into the IR beam after about 3s recording time the PID
controller enhances the IR power launched into the chamber and measured by
photodetector PD-1. Up to about 17s recording time the control loop can compensate the
power loss inside the chamber. Thereafter, the maximum transmitter output power is
insufficient to further equalize the losses of the link until the link attenuation drops back
at about 22s recording time to a level within the power margin of the system. While the
detected optical power at the data receiver stays almost constant (for t< 17s) we see small
changes of the output of PD-2. Around pointer ‘A’ these variations are less than 0.15 dB
but show that the receiver power and detected power of PD-2 are not always exactly
proportional to each other. However, the variations of the power coupled into the SSMF
appear more pronounced (up to +/- 2dB). The variations in outputs of both PD-2 and PD-
3 indicate that scintillation effects impair the IR beam. The fog and humidity impact on
the THz signal is generally small while visualization of possible scintillation effects in
the THz beam is below the measurement precision. Small kinks in the received power of
the data receiver (pointer ‘B’) could be caused by rapidly changing signal attenuation and
noise which affects the stable operation of the PID controller for short time. Interestingly,
at pointer ‘C’ and ‘D’ the chamber attenuation for the IR beam is almost zero whereas the
attenuation of the THz signal is about 0.1 dB. Likely, at these recording times fog was

85
converted into humidity which impacts the IR signal comparably less than the THz
signal. The RF power meter provides a two digit reading after the comma, which explains
the rough quantization of the recorded signal.
Figure 4.14 (a) Individiually normalized outputs of photodetectors (PD-1, PD-2, PD-3) in dB, (b) Opitcal power of IR and RF power of THz due to fog, (c) Log(BER) of IR and THz links impaired by fog.
0 5 10 15 20 25
0
5
10
(a) Time(s)
Att
enua
tion(
dB)
0 5 10 15 20 25-8.5
-8
-7.5
(b) Time(s)
Opi
tcal
Pow
er o
f IR
(dB
m)
0 5 10 15 20 25-10.8
-10.7
-10.6
RF
Pow
er o
f T
Hz(
dBm
)
0 5 10 15 20 25-6
-5.5
-5
-4.5
(c) Time(s)
Log(
BE
R)
of I
R
0 5 10 15 20 25-5.9
-5.8
-5.7
-5.6
Log(
BE
R)
of T
Hz
IR
THz
IR
THz
SM Fiber Detector(PD3)
Free Space(PD2)
Input Power(PD1)
B
C D
A

86
CHAPTER 5
COMPARISON OF PERFORMANCE DEGRADATION FROM TERAHERT Z AND INFRARED WIRELESS LINKS IN DUST
Due to the relatively small size of atmospheric particles such as dust and smoke
compared to THz wavelength, one would expect minimal THz attenuation due to
airborne particulates. Mann had predicted that smoke has little or no effect up to 1 THz
[57]. Attenuation caused by scattering strongly increases when the wavelength of the
radiation nears the particle size, which explains why dust and pollution can significantly
impair IR transmission. Under the dust conditions, IR transmission is considerable better
than for fog [99]. Gebhart et al. [47] mentions that for the typical wavelengths employed
by wireless IR links (780 nm and 1550 nm), attenuation due to dust is around 10 dB/km
in urban regions. On the other hand, the attenuation due to heavy fog can reach values
great than 300 dB/km. In this chapter, an IR beam (1.5 µm wavelength) carrying the
same data load as the THz beam is superposed with the THz beam (625 GHz), and
propagated through the same aerosol conditions (Bentonite particle with mean size of
diameter 8.6 µm). Different amounts of dust (0.05 g, 0.08 g and 0.13 g) are loaded in the
test chamber to generate a variety of dust concentrations for beam propagation. The
optical power attenuation and BER are measured, analyzed and compared. As the dust
loading becomes heavier (and extinction increases), the measured attenuation becomes
more severe. Under identical dust concentrations, IR wavelengths are strongly attenuated
while THz wavelength shows almost no impact. Therefore, THz communications are a
better option than IR wireless links in a battle-field or wildfire environments in which
large concentrations of airborne particulates would be expected. For some specific link
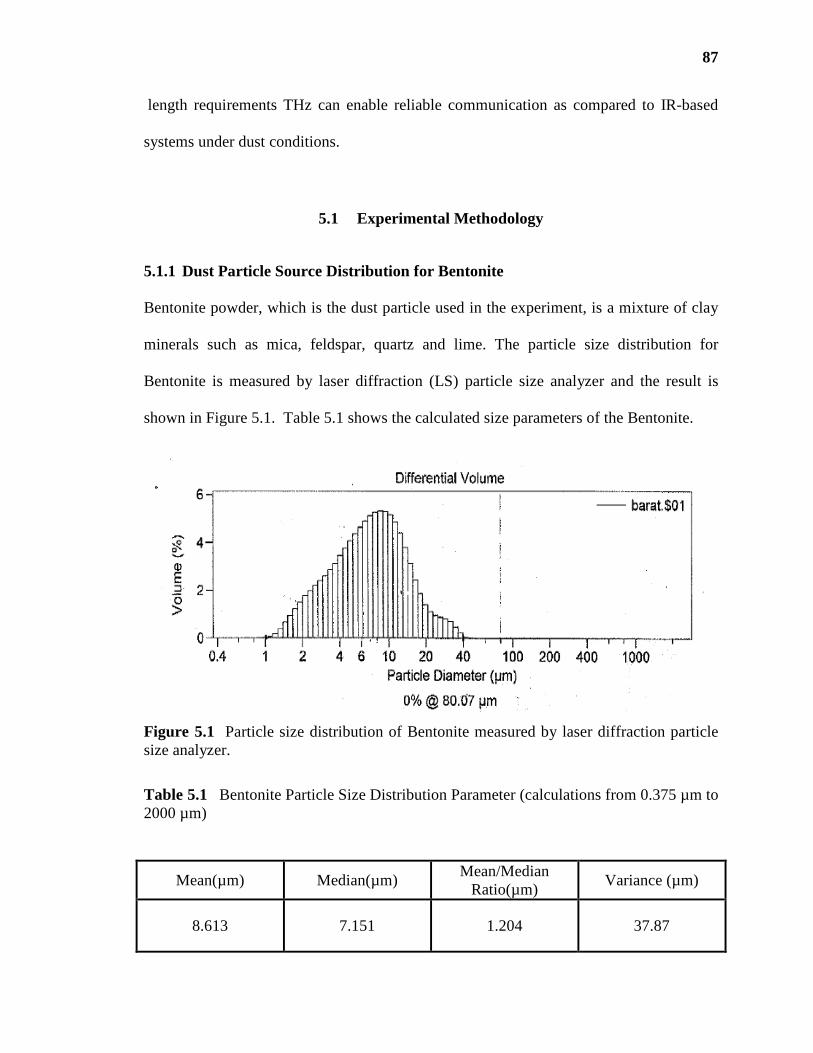
87
length requirements THz can enable reliable communication as compared to IR-based
systems under dust conditions.
5.1 Experimental Methodology
5.1.1 Dust Particle Source Distribution for Bentonite
Bentonite powder, which is the dust particle used in the experiment, is a mixture of clay
minerals such as mica, feldspar, quartz and lime. The particle size distribution for
Bentonite is measured by laser diffraction (LS) particle size analyzer and the result is
shown in Figure 5.1. Table 5.1 shows the calculated size parameters of the Bentonite.
Figure 5.1 Particle size distribution of Bentonite measured by laser diffraction particle size analyzer.
Table 5.1 Bentonite Particle Size Distribution Parameter (calculations from 0.375 µm to 2000 µm)
Mean(µm) Median(µm) Mean/Median
Ratio(µm) Variance (µm)
8.613 7.151 1.204 37.87
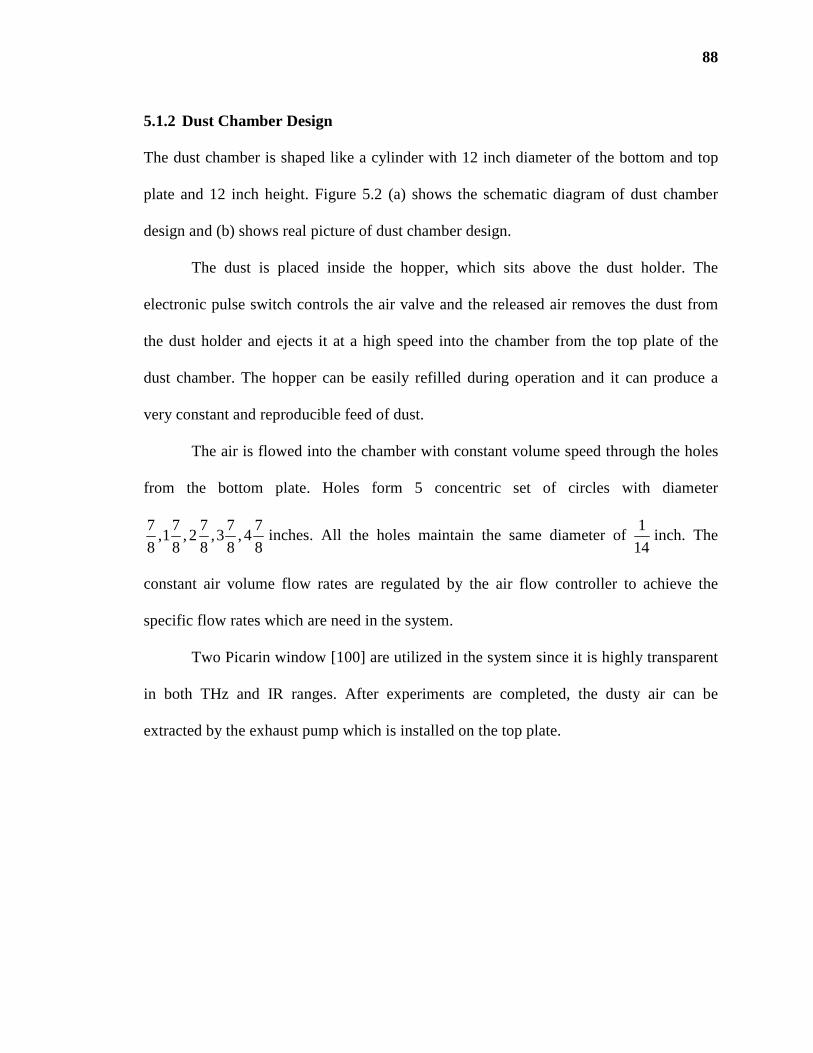
88
5.1.2 Dust Chamber Design
The dust chamber is shaped like a cylinder with 12 inch diameter of the bottom and top
plate and 12 inch height. Figure 5.2 (a) shows the schematic diagram of dust chamber
design and (b) shows real picture of dust chamber design.
The dust is placed inside the hopper, which sits above the dust holder. The
electronic pulse switch controls the air valve and the released air removes the dust from
the dust holder and ejects it at a high speed into the chamber from the top plate of the
dust chamber. The hopper can be easily refilled during operation and it can produce a
very constant and reproducible feed of dust.
The air is flowed into the chamber with constant volume speed through the holes
from the bottom plate. Holes form 5 concentric set of circles with diameter
7 7 7 7 7,1 ,2 ,3 ,4
8 8 8 8 8inches. All the holes maintain the same diameter of
1
14inch. The
constant air volume flow rates are regulated by the air flow controller to achieve the
specific flow rates which are need in the system.
Two Picarin window [100] are utilized in the system since it is highly transparent
in both THz and IR ranges. After experiments are completed, the dusty air can be
extracted by the exhaust pump which is installed on the top plate.
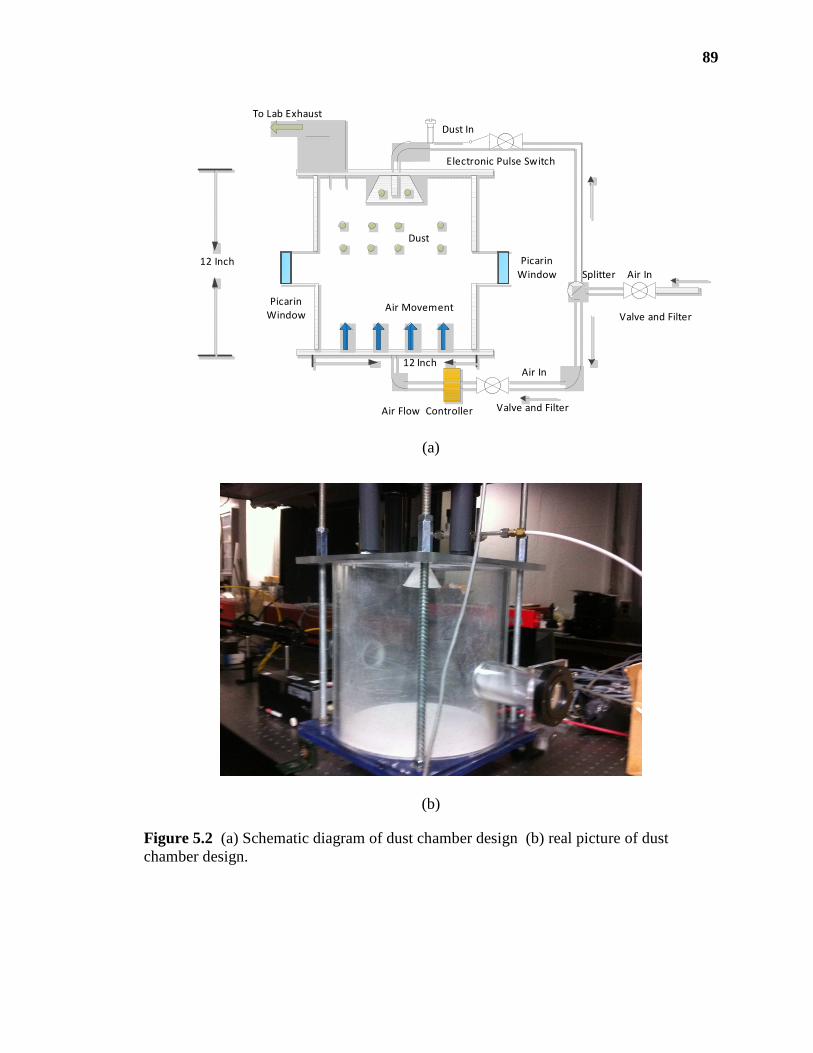
89
Dust In
Air Movement
Picarin
Window
Picarin
Window
Dust
Valve and Filter
Air In
Electronic Pulse Switch
Air In
Valve and Filter
Splitter
Air Flow Controller
12 Inch
To Lab Exhaust
12 Inch
(a)
(b)
Figure 5.2 (a) Schematic diagram of dust chamber design (b) real picture of dust chamber design.
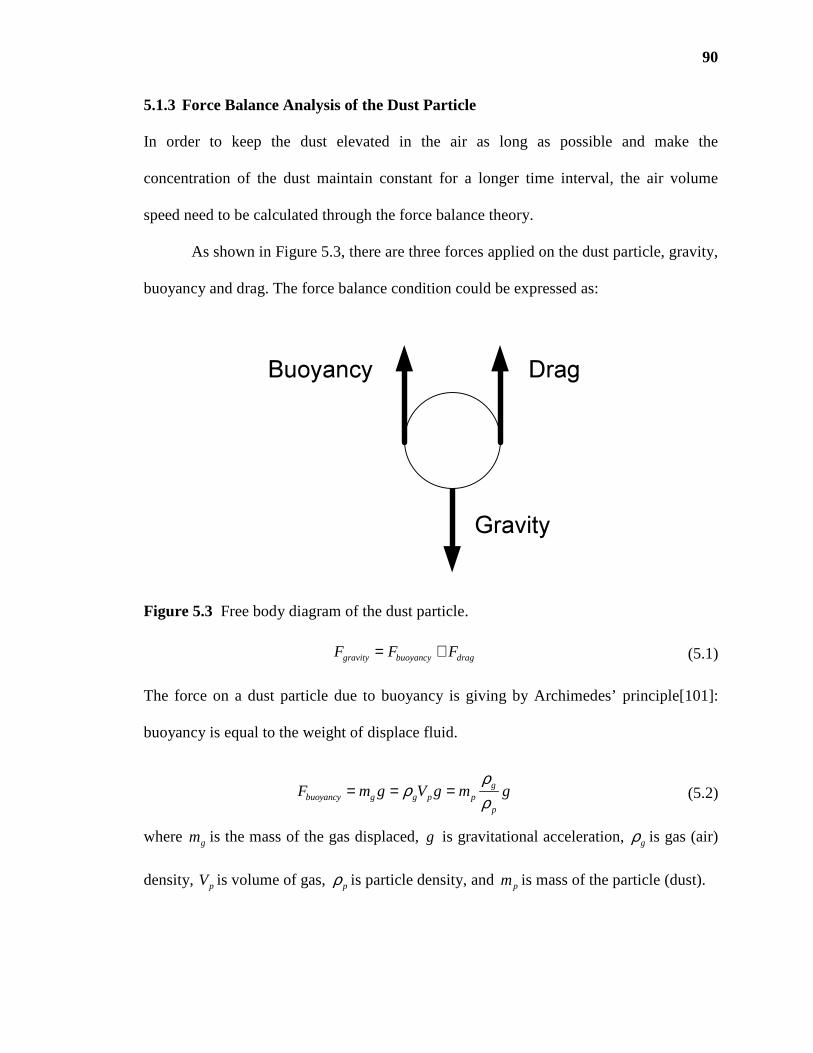
90
5.1.3 Force Balance Analysis of the Dust Particle
In order to keep the dust elevated in the air as long as possible and make the
concentration of the dust maintain constant for a longer time interval, the air volume
speed need to be calculated through the force balance theory.
As shown in Figure 5.3, there are three forces applied on the dust particle, gravity,
buoyancy and drag. The force balance condition could be expressed as:
Gravity
DragBuoyancy
Figure 5.3 Free body diagram of the dust particle.
gravity buoyancy dragF F F= + (5.1)
The force on a dust particle due to buoyancy is giving by Archimedes’ principle[101]:
buoyancy is equal to the weight of displace fluid.
gbuoyancy g g p p
p
F m g V g m gρ
ρρ
= = = (5.2)
where gm is the mass of the gas displaced, g is gravitational acceleration, gρ is gas (air)
density, pV is volume of gas, pρ is particle density, and pm is mass of the particle (dust).
91
The gravity force can be expressed as:
gravity pF m g= (5.3)
The drag force (air resistance) could be calculated using:
2( )
2D g p g
drag
C V V AF
ρ−= (5.4)
where DC is drag coefficient, gV is the velocity of gas, pV is the velocity of the particle,
g pV V− is the speed of the particle (dust) relative to the gas (air), A is area of the
orthographic projection of the object on a plane perpendicular to the direction of motion,
for a sphere 2( )2
pdA π= , where pd is particle diameter. The drag force can further be
expressed as:
2 2( )
8D g p g p
drag
C V V dF
ρ π−= (5.5)
substituting Equations 5.2, 5.3 and 5.5 into the Equation 5.1. The force balance condition
could be rewritten as:
2 2( )
8g D g p g p
p pp
C V V dm g m g
ρ ρ πρ
−= + (5.6)
substituting 0pV = into the Equation 5.6 and solving the Equation forgV , which
should be the air velocity which could keep particle remains elevated and motionless,
yields
1
2
2
8(1 )p g
gD p g p
m gV
C d
ρπ ρ ρ
= −
(5.7)
92
where the density of the Bentonite particles is 32.7 /p g cmρ = ,[102] and the average
diameter 48 8 10pd um cm−= = × .
The drag coefficient DC is defined as:
RD be
aC = (5.8)
where Re is Reynolds number[103], which is defined as:
( )R p g p g
eg
d V V ρµ−
= (5.9)
where gµ is dynamic viscosity of the gas ( / ( )kg m s⋅ . This value depends mostly on the
temperature 300K (26.85 degrees Celsius) and is computed using Sutherland's
formula[104]:
* * 3/20 0( / ) ( / )g a b T Tµ µ= (5.10)
where 00.555a T C= + , 0.555b T C= + , 0µ is reference viscosity in centipoise at
reference temperature 0T , 0T is reference temperature in degrees, and C is Sutherland’s
constant. The dynamic viscosity gµ can be calculated as:
3
2
93000.555 524.07 120 50.01827 ( ) 0.0187
9 524.070.555 (300 ) 1205
g m Pa s m Pa sµ×× += ⋅ ⋅ × = ⋅ ⋅
× × + (5.11)
According to the Reynolds number, there are three regimes, Stocks regimes, Intermediate
regimes and Newton’s regimes [105] for DC , shown in Table 5.2.

93
Table 5.2 Reynolds Numbers for Different Regimes
Reynolds Number
Regime a b
0 0.4eR< < Stokes 24 1
0.4 500eR< < Intermediate 10 0.5
500eR > Newton’s 0.43 0.0
In the following sections, the Reynolds number will be calculated to determine
the appropriate regime.
5.1.3.1 The Intermediate Range of Reynolds Numbers. Assuming the drag coefficient
DC is in the intermediate regime:
1
2
12
1010 g
be p g
Dge
µ
RC
d VR
a
ρ
= =
= (5.12)
3
6p
p p
dm
πρ=
(5.13)
substituting Equation 5.12 and 5.13 into Equation 5.7 yields 1
1 23 2
2
81
6 10p p g p g g
gp g p
d g d VV
µd
π ρ ρ ρπ ρ ρ
= −
(5.14)
gV can be solved from Equation 5.14:
( )2
3
1
3
0.26
( )
p p g
g
g
d gV
u
ρ ρ
ρ
− =
( )2
4 2 3 3 3
15 3 3 3
8*10 9.8 / 2.7 1.169*10 /0.26* 6.618 /
(1.87*10 / *1.169*10 / )
cm m s g cmcm s
kg ms g cm
− −
− −
− = = (5.15)
94
substituting Equation 5.15 to 5.9 gives a Reynolds number value of
4 3 38*10 *6.618 *1.169*10 /0.03
0.02 /p g g
e
cmcm g cmd v sR
µ g ms
ρ− −
= = = (5.16)
The calculated value of the eR should be in the Stoke’s regime, which is conflict with the
assumption (intermediate regime).
5.1.3.2 Is Newton’s Regime Appropriate? Assuming that the drag coefficient DC is in
the Newton’s regime:
0.43D be
aC
R= = (5.17)
( )1
2
3.1p p g
gg
d gV
ρ ρρ
−=
1
4 2 3 3 2
3 3
8*10 9.8 / (2.7 1.169*10 ) /3.1 131.886 /
1.169*10 /
cm m s g cmcm s
g cm
− −
−
−= =
(5.18)
substituting Equation 5.18 into Equation 5.9,
4 3 38*10 *131.886 *1.169*10 /0.59
0.02 /p g g
e
cmcm g cmd v sR
µ g ms
ρ− −
= = = (5.19)
eR is in the Stoke’s regime, which shows that the assumption of Newton’s regime is
incorrect.
5.1.3.3 Is the Reynolds Number in the Stoke’s Regime? Assuming that the drag
coefficient DC is in the Stoke’s regime:
95
24D b
e e
aC
R R= = (5.20)
( )2 8 2 2
3 364*10 9.8 /(2.7 1.169*10 ) / 0.47 /
18 18*0.02 /p
g p g
d g cm m sV g cm cm s
µ g msρ ρ
−−= − = − = (5.21)
4 3 38*10 *0.47 *1.169*10 /0.002
0.02 /p g g
e
cmcm g cmd v sR
µ g ms
ρ− −
= = = (5.22)
Note that this value for Reynolds number is in the Stoke’s regime, clearly, the choice of
the drag coefficient and corresponding Reynolds number are consistent.
5.1.3.4 Volumetric Flow Rate Calculation. The volumetric flow gQ rate is kept
constant in the whole system:
2
2 0.474*
4c
g g
ftcmd
Q A v vs
ππ= = =
2?3
3
20.47 3.14 0.47 3.30.5/
14 30.5 60 / 20.59 /
4 4 10scm lit min lit min
× × ==×
×× ×= = (5.23)
where 12cd = inches is diameter of the dust chamber cylinder.
From the calculation, one can conclude that in order to keep the dust elevated and
motionless as long as possible and maintain an approximately constant dust
concentration, the gas flow rate should keep 20.59 lit/min.
5.1.4 Experiment Setup
As shown in Figure 5.4, the schematic diagram of THz and IR wireless communication
link through dust chamber is same with the fog link (in Chapter 4) except that the fog
chamber is replaced by the dust chamber. Also, for the fog chamber, picarin is used as the
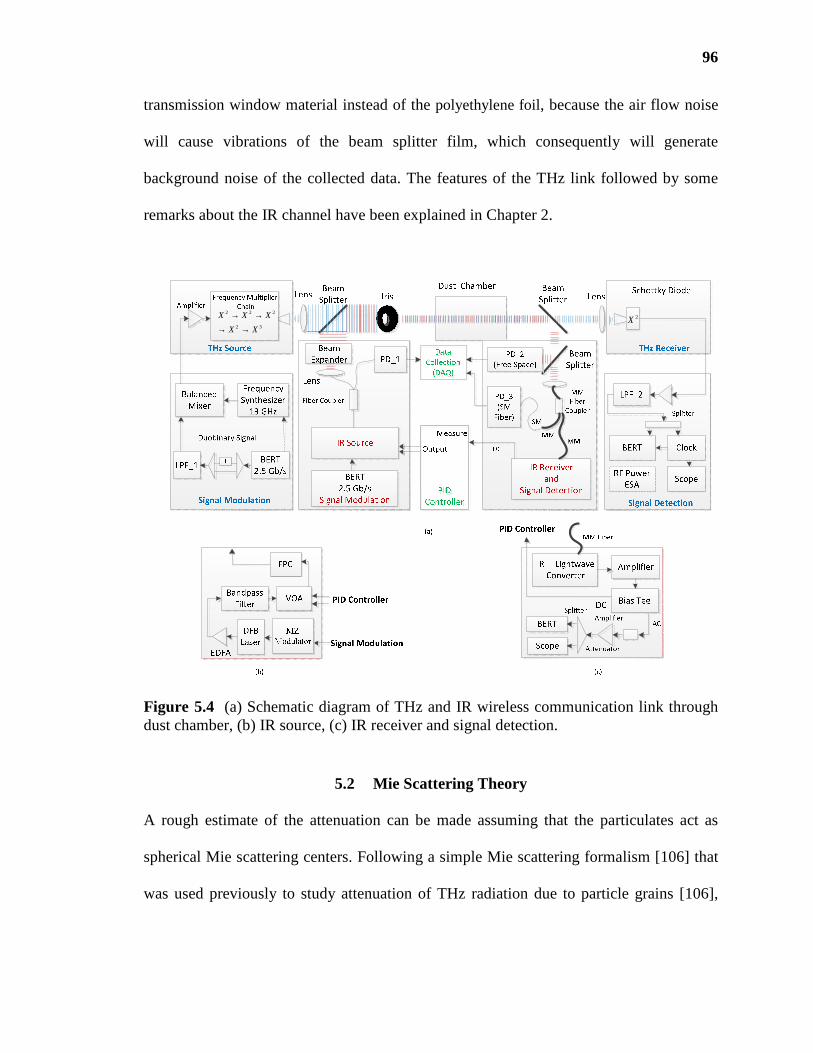
96
transmission window material instead of the polyethylene foil, because the air flow noise
will cause vibrations of the beam splitter film, which consequently will generate
background noise of the collected data. The features of the THz link followed by some
remarks about the IR channel have been explained in Chapter 2.
2 2 2
2 3
X X X
X X
→ →→ →
2X
Figure 5.4 (a) Schematic diagram of THz and IR wireless communication link through dust chamber, (b) IR source, (c) IR receiver and signal detection.
5.2 Mie Scattering Theory
A rough estimate of the attenuation can be made assuming that the particulates act as
spherical Mie scattering centers. Following a simple Mie scattering formalism [106] that
was used previously to study attenuation of THz radiation due to particle grains [106],

97
one can estimate the attenuation at IR, THz and sub-THz frequencies using known
particles sizes and concentrations. The extinction coefficient takes on the following form:
2
1
( ) (2 1)Re( )2th m m
m
cv N m a b
vγ
π
∞
=
= + +∑ (5.24)
where N is number of grains per unit volume, which will vary greatly depending on the
method of dust production processes, c is the speed of light and ma , mb are coefficient of
the infinite summation such that,
' '
' '
' '
' '
( ) ( ) ( ) ( )
( ) ( ) ( ) ( )
( ) ( ) ( ) ( )
( ) ( ) ( ) ( )
m m m mm
m m m m
m m m mm
m m m m
y x n y xa
y x n y x
n y x y xb
n y x y x
ψ ψ ψ ψψ ζ ψ ζψ ψ ψ ψψ ζ ψ ζ
−=−
−=−
(5.25)
where
(2)
( ) ( )
( ) ( )m m
m m
z zj z
z zh z
ψζ
=
= (5.26)
here ( )mj z and (2) ( )mh z are spherical Bessel functions of the first kind and third
kind [107], respectively. The parameter zcan be either 2 vr
xc
π= or 2 vr
yc
π= , where r
is the radius of the spherical particle and n is the frequency independent refractive index
of the particle. And the extinction coefficient ( )thu v here takes into account both the
intrinsic absorption of the materials as well as extrinsic losses involving single scattering
events. As an example, attenuation due to the battlefield particles can be estimated using
Equations 5.24, 5.25 and 5.26. For the calculation, parameters used are particle density:
65 10 /N cc= × , particle radius 0.2r mµ= and a real index of refraction: 1.5. The size
parameter for the THz range (0-3THz) is from (0~0.012) and for IR range (0.6 µm~100
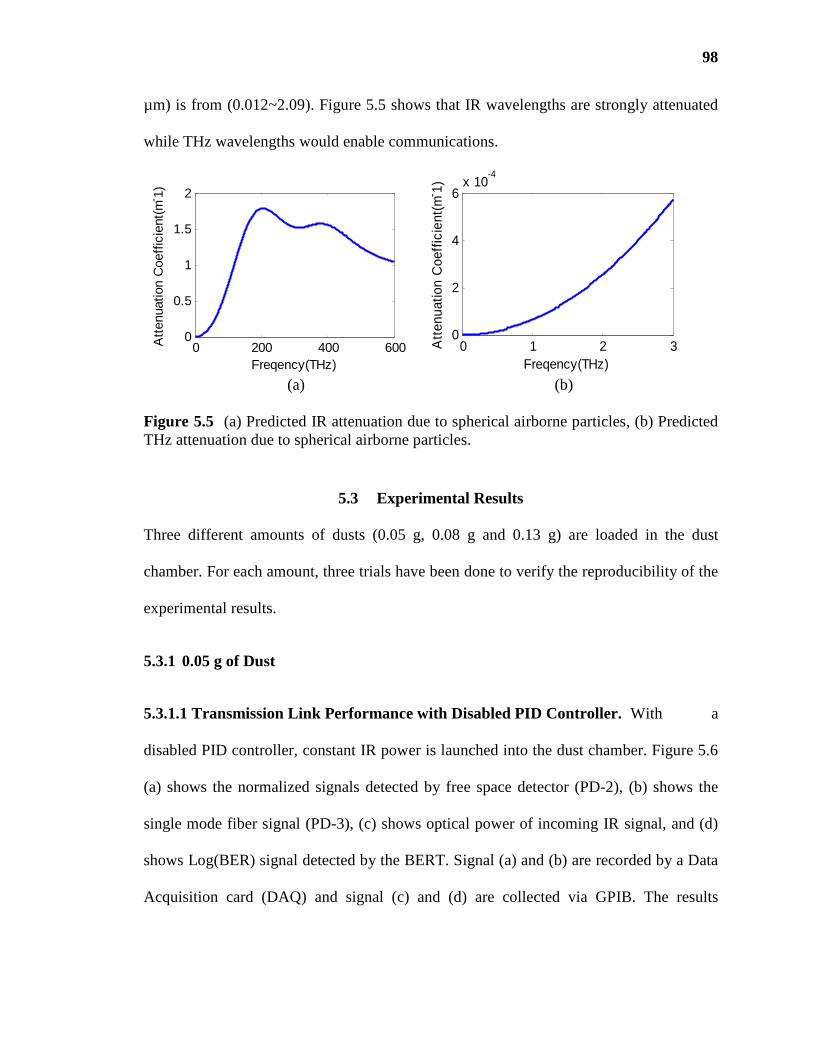
98
µm) is from (0.012~2.09). Figure 5.5 shows that IR wavelengths are strongly attenuated
while THz wavelengths would enable communications.
(a) (b)
Figure 5.5 (a) Predicted IR attenuation due to spherical airborne particles, (b) Predicted THz attenuation due to spherical airborne particles.
5.3 Experimental Results
Three different amounts of dusts (0.05 g, 0.08 g and 0.13 g) are loaded in the dust
chamber. For each amount, three trials have been done to verify the reproducibility of the
experimental results.
5.3.1 0.05 g of Dust
5.3.1.1 Transmission Link Performance with Disabled PID Controller. With a
disabled PID controller, constant IR power is launched into the dust chamber. Figure 5.6
(a) shows the normalized signals detected by free space detector (PD-2), (b) shows the
single mode fiber signal (PD-3), (c) shows optical power of incoming IR signal, and (d)
shows Log(BER) signal detected by the BERT. Signal (a) and (b) are recorded by a Data
Acquisition card (DAQ) and signal (c) and (d) are collected via GPIB. The results
0 200 400 6000
0.5
1
1.5
2
Freqency(THz)
Att
enua
tion
Coe
ffic
ient
(m- 1)
0 1 2 30
2
4
6x 10
-4
Freqency(THz)
Att
enua
tion
Coe
ffic
ient
(m- 1)

99
showed good repeatability of all three trials, which ensure the accuracy and reliability of
each experiment.
(a) (b)
(c) (d)
Figure 5.6 Detected IR signal for the 0.05gram dust (a) Free Space (PD-2) (b) SM Fiber Detector (PD-3) (c) Optical Power of IR(dBm), (d) Log(BER) of IR.
A typical evolution of the attenuations in both THz and IR channels is shown in
Figure 5.7 (a). As expected, when dust is launched in the propagation path of the beams,
the attenuation (around 1.8 dB) of the IR light is visible while the impact on THz could
be neglected. The IR signal collapses in agreement with the receiver performance shown
in Figure 5.7 (b) and record BERs of THz in Figure 5.7 (b) verify again that the dust
effects on THz is negligible. After 350 seconds almost all the dust particles have fallen
0 100 200 3000.4
0.6
0.8
1
Time(second)
Nor
mal
ized
Vol
tage
Free Space(PD2) First Trial
Second Trial
Third Trial
0 100 200 3000.5
0.6
0.7
0.8
0.9
1
1.1
Time(second)
Nor
mal
ized
Vol
tage
SM Fiber Detector(PD3) First Trial
Second Trial
Third Trial
0 100 200 300-17
-16
-15
-14
-13
-12
Time(second)
Opt
ical
Pow
er o
f IR
(dB
m)
First Trial
Second Trial
Third Trial
0 100 200 300-6
-5
-4
-3
-2
-1
Time(second)
Log(
BE
R)
of I
R
First Trial
Second Trial
Third Trial

100
down to the bottom of the chamber thus both links regain and approach their original
performance, respectively.
(a)
(b)
Figure 5.7 (a) Attenuation of THz link and IR link with time (b) Log(BER) of THz link and IR link with time.
0 50 100 150 200 250 300 350-0.5
0
0.5
1
1.5
2
2.5
3
3.5
Time(second)
Att
enua
tion
(dB
)
IR
THz
0 50 100 150 200 250 300 350-5.5
-5
-4.5
-4
-3.5
-3
-2.5
-2
Time(second)
Log(
BE
R)
(dB
)
IR
THz
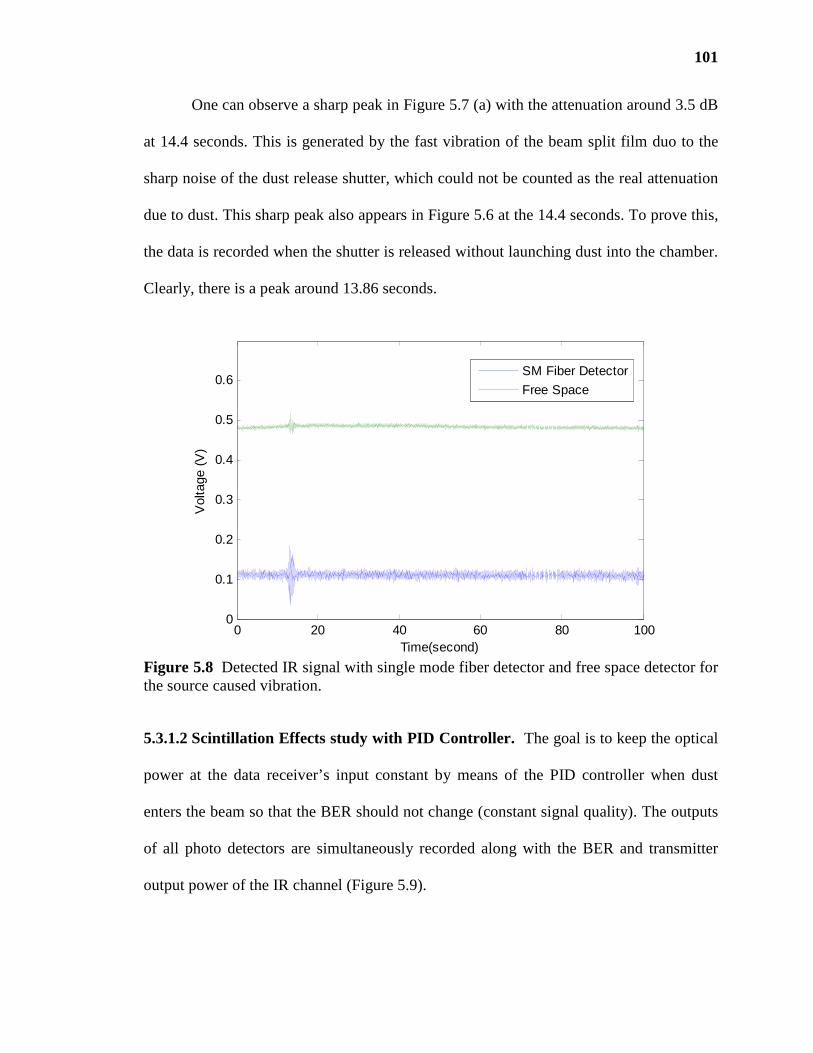
101
One can observe a sharp peak in Figure 5.7 (a) with the attenuation around 3.5 dB
at 14.4 seconds. This is generated by the fast vibration of the beam split film duo to the
sharp noise of the dust release shutter, which could not be counted as the real attenuation
due to dust. This sharp peak also appears in Figure 5.6 at the 14.4 seconds. To prove this,
the data is recorded when the shutter is released without launching dust into the chamber.
Clearly, there is a peak around 13.86 seconds.
Figure 5.8 Detected IR signal with single mode fiber detector and free space detector for the source caused vibration.
5.3.1.2 Scintillation Effects study with PID Controller. The goal is to keep the optical
power at the data receiver’s input constant by means of the PID controller when dust
enters the beam so that the BER should not change (constant signal quality). The outputs
of all photo detectors are simultaneously recorded along with the BER and transmitter
output power of the IR channel (Figure 5.9).
0 20 40 60 80 1000
0.1
0.2
0.3
0.4
0.5
0.6
Time(second)
Vol
tage
(V
)
SM Fiber Detector
Free Space

102
When dust is launched into the IR beam after about 20 s recording time, the PID
controller enhances the IR power launched into the chamber and measured by
photodetector PD-1. Up to about 50 s recording time the control loop can not compensate
the power loss inside the chamber, the maximum transmitter output power is insufficient
to further equalize the losses of the link until the link attenuation drops back at about 50s
recording time to a level within the power margin of the system. After that, the detected
optical power at the data receiver stays almost constant (for t>50 s).

103
Figure 5.9 (a) Individually normalized outputs of photodetector(PD-1, PD-2, PD-3) in dB, (b) opitcal power of IR and RF power of THz due to dust, (c) Log(BER) of IR and THz links impaired by dust.
Unlike the fog, scintillation effects can not be observed in the IR links when the
dust is launched. The possible reasons are listed below:
• Attenuation in the link: the attenuation due to the fog is 5 dB, which is more significant than the dust link (1.5 dB).
0 50 100 150 200 250-4
-2
0
2
(a) Time(s)
Att
enua
tion
(dB
)
0 50 100 150 200 250-16
-15
-14
-13
-12-12
Opt
ical
Pow
er o
f IR
(dB
m)
0 50 100 150 200 250-10.9
-10.85
-10.8
-10.75
-10.7-10.7
(b) Time(s)
RF
Pow
er o
f T
Hz(
dBm
)
0 50 100 150 200 250-6
-5
-4
-3
-2
(c) Time(s)
Log(
BE
R)
of I
R
0 50 100 150 200 250-5.2
-5.15
-5.1
-5.05
-5
Log(
BE
R)
of T
Hz
Input Power(PD1)
SM Fiber Detector(PD3)
Free Space(PD2)
IR
THz
IR
THz

104
• Fluctuation changing speed: fog generation process causes much more irregular changes, which strengthen the scintillations effects. However, when dust is launched in the chamber, due to the force balance design, the density of the dust is changed very smoothly and slowly and the fluctuation effects will become smaller.
5.3.2 0.08 g of Dust
5.3.2.1 Transmission Link Performance with Disabled PID Controller. Figure 5.10
shows the detected signals for 0.08 gram dust. The results also showed good repeatability
of all three trials.
(a) (b)
(c ) (d)
Figure 5.10 Detected IR signal for the 0.08gram dust (a) Free Space (PD_2) (b) SM Fiber Detector (PD_3) (c) Optical Power of IR(dBm), (d) Log(BER) of IR.
Figure 5.11 shows the comparison of IR and THz for power attenuation and BER
change. Clearly there is a huge difference in the IR and THz attenuation.
0 100 200 300 4000
0.5
1
1.5
Time(second)
Nor
mal
ized
Vol
tage
First Trial
Second TrialThird Trial
0 100 200 300 4000
0.5
1
Time(second)
Nor
mal
ized
Vol
tage
SM Fiber Detector(PD3) First Trial
Second Trial
Third Trial
0 100 200 300 400-18
-16
-14
-12
Time(second)
Opt
ical
Pow
er o
f IR
(dB
m)
First Trial
Second Trial
Third Trial
0 100 200 300 400-6
-4
-2
0
Time(second)
Log(
BE
R)
of I
R
First Trial
Second Trial
Third Trial

105
(a)
(b) Figure 5.11 (a) Attenuation of THz link and IR link with time (0.08g) (b) Log(BER) of THz link and IR link with time.
0 50 100 150 200 250 300 350 400-1
0
1
2
3
4
5
Time(second)
Att
enua
tion
(dB
)
THz
IR
0 50 100 150 200 250 300 350 400-5.5
-5
-4.5
-4
-3.5
-3
-2.5
-2
-1.5
-1
Time(second)
Log(
BE
R)
dB
IR
THz

106
5.3.2.2 Scintillation Effects study with PID Controller.
(a)
(b)
Figure 5.12 (a) Individually normalized outputs of photodetector (PD1, PD2, PD3) (b) outputs of the photodetector with noise elimination.
0 20 40 60 80 100 120 140 160 180 200-4
-3
-2
-1
0
1
2
Time(second)
Att
enua
tion
(dB
)
Input Power(PD1)
SM Fiber Detector(PD3)
Free Space(PD2)
0 20 40 60 80 100 120 140 160 180 200-4
-3
-2
-1
0
1
2
Time(second)
Att
enua
tion(
dB)
Input Power(PD1)
SM Fiber Detector(PD3)
Free Space(PD2)
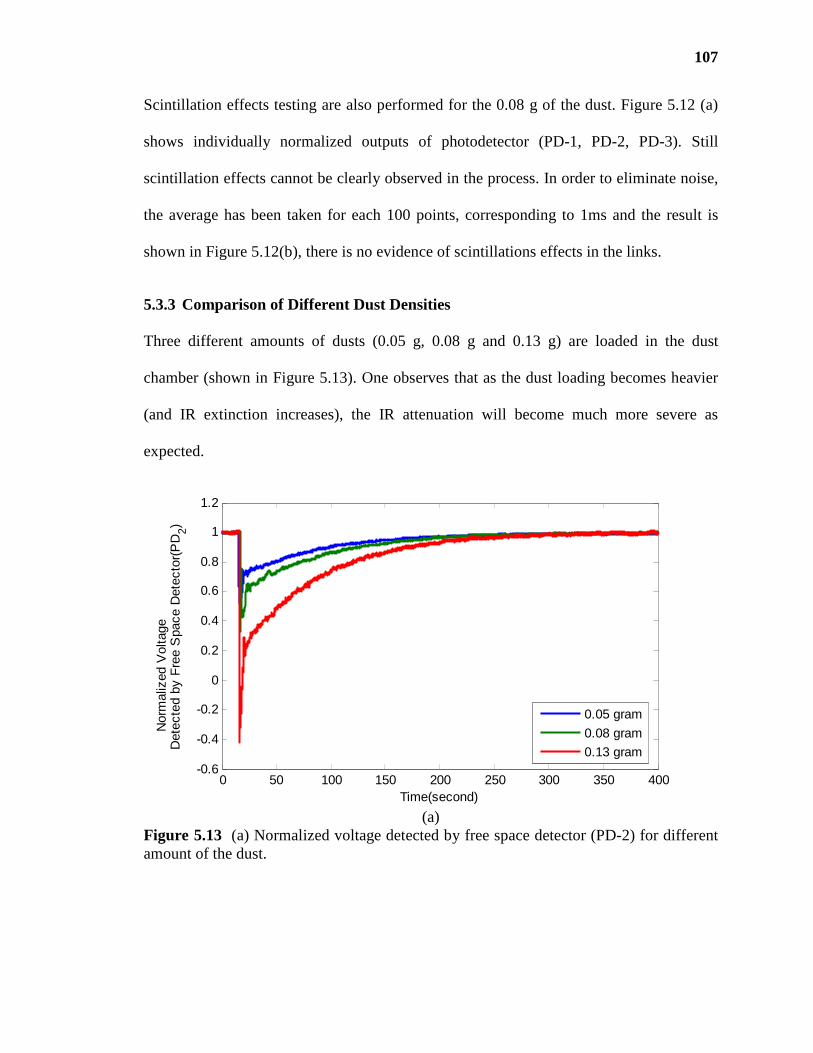
107
Scintillation effects testing are also performed for the 0.08 g of the dust. Figure 5.12 (a)
shows individually normalized outputs of photodetector (PD-1, PD-2, PD-3). Still
scintillation effects cannot be clearly observed in the process. In order to eliminate noise,
the average has been taken for each 100 points, corresponding to 1ms and the result is
shown in Figure 5.12(b), there is no evidence of scintillations effects in the links.
5.3.3 Comparison of Different Dust Densities
Three different amounts of dusts (0.05 g, 0.08 g and 0.13 g) are loaded in the dust
chamber (shown in Figure 5.13). One observes that as the dust loading becomes heavier
(and IR extinction increases), the IR attenuation will become much more severe as
expected.
(a)
Figure 5.13 (a) Normalized voltage detected by free space detector (PD-2) for different amount of the dust.
0 50 100 150 200 250 300 350 400-0.6
-0.4
-0.2
0
0.2
0.4
0.6
0.8
1
1.2
Time(second)
Nor
mal
ized
Vol
tage
Det
ecte
d by
Fre
e S
pace
Det
ecto
r(P
D2)
0.05 gram
0.08 gram
0.13 gram

108
(b)
Figure 5.13 (b) Optical power of IR for different amounts of dust.
(c)
Figure 5.13 (c) Log(BER) of IR for different amounts of dust.
From Figure 5.14, one can see there is no effect on the THz links for different
density of dust. Still, the peak around 14.4 seconds is due to the vibration of the beam
splitter caused by the powder release shutter noise.
0 50 100 150 200 250 300 350 400-21
-20
-19
-18
-17
-16
-15
-14
-13
-12
Time(second)
Opt
ical
Pow
er o
f IR
(dB
m)
0.05 gram
0.08 gram0.13 gram
0 50 100 150 200 250 300 350 400-6
-5
-4
-3
-2
-1
0
Time(second)
Log(
BE
R)
of I
R
0.05 gram
0.08 gram0.13 gram

109
(a)
(b)
Figure 5.14 (a) Attenuation for different amount of the dust (b) Log(BER) of THz for different amounts of dust.
5.4 Simulation Results
The particle concentration is decreasing slowly with time, since all the dusts will finally
fall down to the bottom of the chamber. In this section, the particle concentration at
0 50 100 150 200 250 300 350 400-1
-0.5
0
0.5
1
Time(second)
Att
enua
tion(
dB)
0.05 gram
0.08 gram0.13 gram
0 50 100 150 200 250 300 350 400-5.5
-5
-4.5
-4
-3.5
Time(second)
Log(
BE
R)
(dB
)
0.05 gram
0.08 gram0.13 gram

110
different time is estimated though the IR attenuation according Beers-Lambert
Law(Chapter 4.2) and Mie scattering theory[106]. Then the THz attenuation is simulated
through Mie scattering theory, which shows good agreement with the experimental data.
According to the Beers-Lambert Law, the attenuation of laser radiation through
atmosphere can be expressed as (see Chapter 4.2):
( ) ( )( , )( , )
( ,0)s sN RR R RP R
R e e e eP
σγ λ α β βλτ λλ
−− − + −= = = = = (5.27)
where ( , )P Rλ is optical power at the distance R , ( ,0)P λ is initial emitted optical
power, ( )γ λ is extinction coefficient (per unit of length). α is absorption coefficient, β
is scattering coefficient, sσ is scattering section, andsN is particle concentration.
From Equation 5.27, the particle concentration sN can be calculated as:
( , )ln( )
( ,0)s
s
P R
PN
R
λλ
σ
−= (5.28)
The attenuation is defined as:
10
( ,0)_ 10 log
( , )
Patt dB
P R
λλ
= × (5.29)
According the Equation 5.28 and 5.29, the relationship between the sN and
attenuation in dB can be expressed as:
_ ln10
10ss
att dBN
R σ×=
× × (5.30)
From Equation 5.24, the total extinction cross sections can be calculated as:
2
21
( ) (2 1)Re( )2s m m
m
cv m a b
vσ
π
∞
=
= + +∑ (5.31)
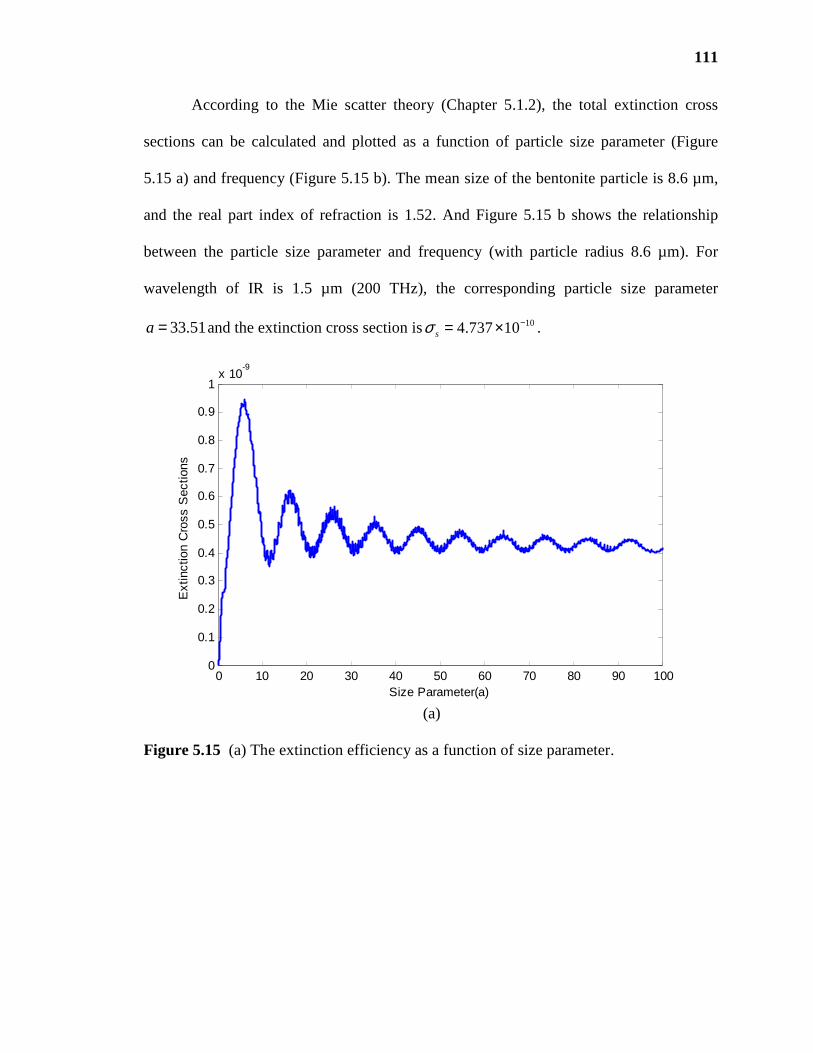
111
According to the Mie scatter theory (Chapter 5.1.2), the total extinction cross
sections can be calculated and plotted as a function of particle size parameter (Figure
5.15 a) and frequency (Figure 5.15 b). The mean size of the bentonite particle is 8.6 µm,
and the real part index of refraction is 1.52. And Figure 5.15 b shows the relationship
between the particle size parameter and frequency (with particle radius 8.6 µm). For
wavelength of IR is 1.5 µm (200 THz), the corresponding particle size parameter
33.51a = and the extinction cross section is 104.737 10sσ −= × .
(a)
Figure 5.15 (a) The extinction efficiency as a function of size parameter.
0 10 20 30 40 50 60 70 80 90 1000
0.1
0.2
0.3
0.4
0.5
0.6
0.7
0.8
0.9
1x 10
-9
Size Parameter(a)
Ext
inct
ion
Cro
ss S
ectio
ns
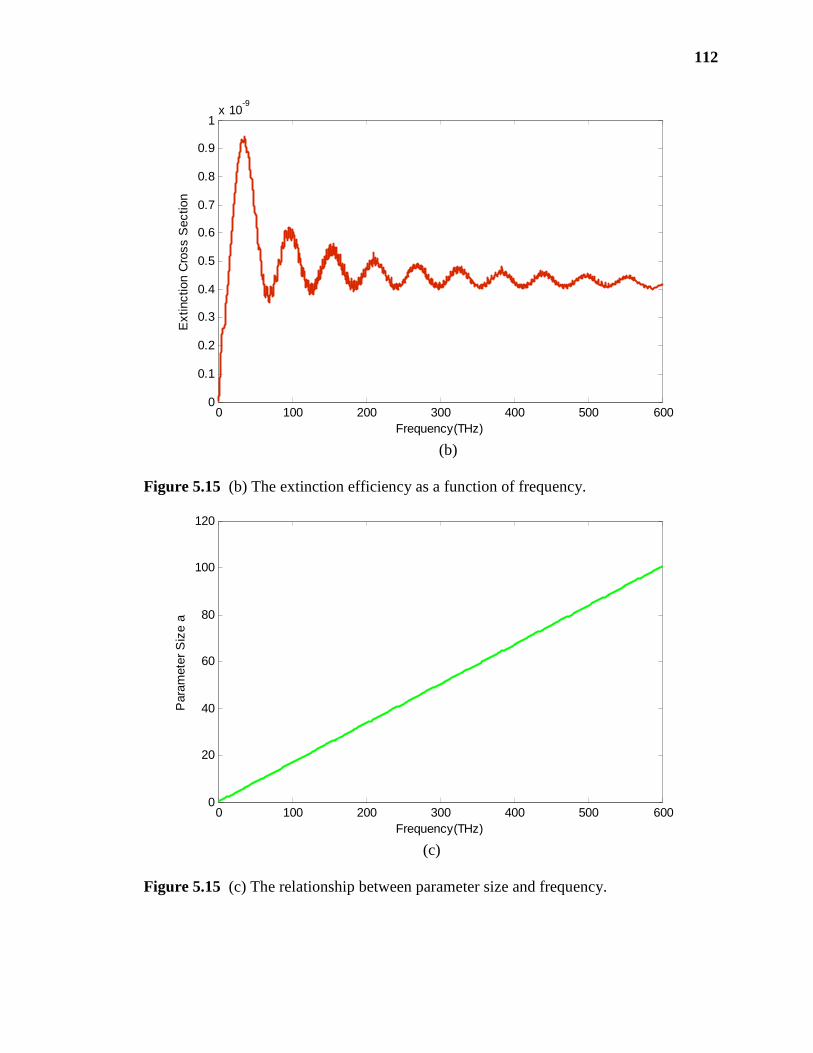
112
(b)
Figure 5.15 (b) The extinction efficiency as a function of frequency.
(c)
Figure 5.15 (c) The relationship between parameter size and frequency.
0 100 200 300 400 500 6000
0.1
0.2
0.3
0.4
0.5
0.6
0.7
0.8
0.9
1x 10
-9
Frequency(THz)
Ext
inct
ion
Cro
ss S
ectio
n
0 100 200 300 400 500 6000
20
40
60
80
100
120
Frequency(THz)
Par
amet
er S
ize
a

113
According to the IR attenuation data of 0.08 g of dust (Figure 5.10a) and
substituting extinction cross section 104.737 10sσ −= × to Equation 5.30, the particle
concentration during different time can be calculated and plotted as Figure 5.16. The
particle concentration varies from 9 31.5 10 /m× to almost 0. Using Equations 5.24, 5.29
and 5.30, the THz attenuation with time is calculated and plotted as Figure 5.17. The
maximum attenuation of the THz is 0.1, which is twice of the experimental curve shown
in Figure 5.11 b. The possible reason could be in the simulation process, only mean
particle size is considered. To achieve the better results, particle size distribution could be
considered in the simulation process.
Figure 5.16 The particle density with time.
0 50 100 150 200 250 300 350 400-0.5
0
0.5
1
1.5
2
2.5x 10
9
Time (s)
Par
ticle
Den
sity
(/m
3 )
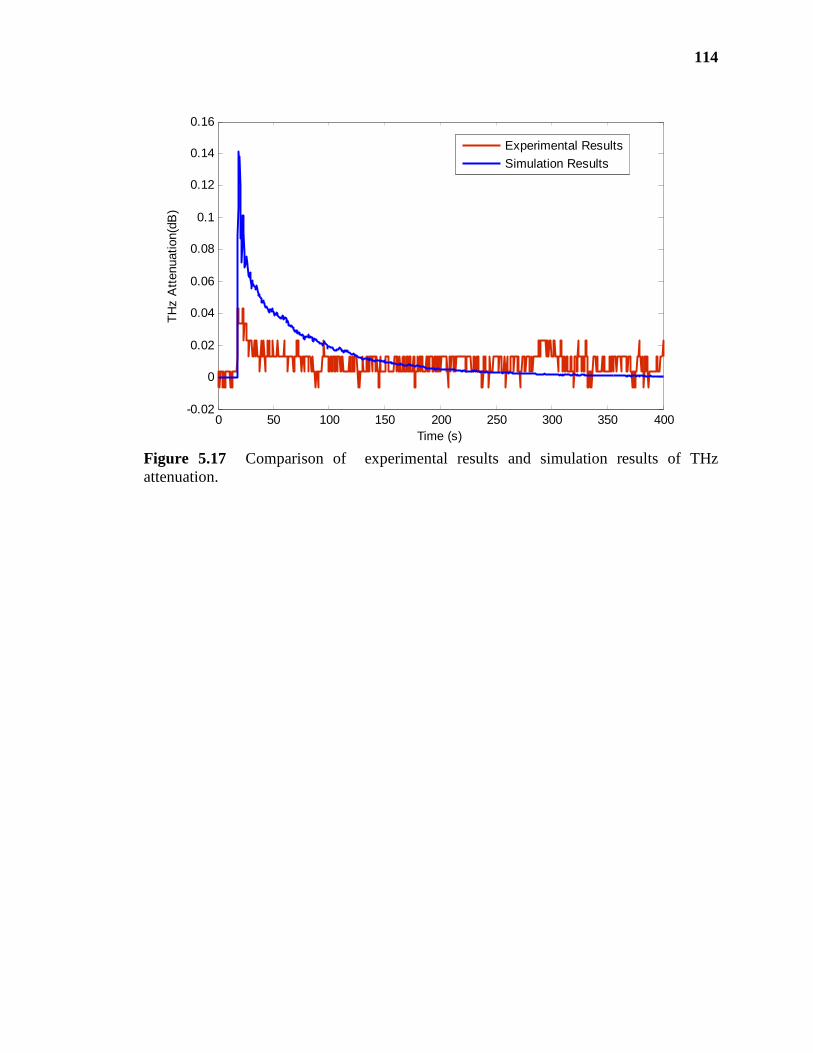
114
Figure 5.17 Comparison of experimental results and simulation results of THz attenuation.
0 50 100 150 200 250 300 350 400-0.02
0
0.02
0.04
0.06
0.08
0.1
0.12
0.14
0.16
Time (s)
TH
z A
tten
uatio
n(dB
)
Experimental Results
Simulation Results
115
CHAPTER 6
CONCLUSIONS AND FUTURE PERSPECTIVES
In this chapter, the contribution made in this dissertation research work is summarized
and the future work is mentioned. The research work described in this thesis has made
unique, original contributions in several areas of instrument development (625 GHz
transmission link), comparison of the atmosphere attenuation due to airborne particulates
(fog and dust ), and experimental scintillation effects study of IR links.
6.1 Summary of Research Results
In order to study and compare propagation features of Terahertz (THz) links with
Infrared (IR) links under different weather conditions such as fog and dust, a THz and IR
communications lab setup with a maximum data rate of 2.5 Gb/s at 625 GHz carrier
frequency and 1.5 um wavelength, respectively have been developed. A usual non return-
to-zero (NRZ) format is applied to modulate the IR channel but a duobinary coding
technique is used for driving the multiplier chain based 625 GHz source, which enables
signaling at high data rate and higher output power. The bit-error rate (BER), signal-to-
noise ratio (SNR) and power on the receiver side have been measured, which describe the
signal performance.
At frequencies below 1000 GHz, the size of fog particles is considerably smaller
than the carrier wavelength, so that the Rayleigh absorption can be applied to replace the
much more complicated Mie scattering theory. On the frequency range from 10 GHz-
1000 GHz, the attenuation by fog is modeled using a simple double-Debye model for the

116
dielectric permittivity of water, based on the total liquid water content. In the IR range,
this is no longer true and the distribution of the particle size must be considered. The
specific attenuation is predicted using the empirical models, such as the Kruse, Kim and
Alnabulsi models. Simulation results of attenuation by fog in the millimeter and sub-
millimeter waveband (from 0.1 to 1 THz) and infrared waveband (1.5 µm) are presented
and compared. An IR beam at 1.5 µm wavelength carrying the same data load is
superposed with the THz beam. After propagating through the same weather conditions
(fog), experimental performance of both channels are analyzed and compared.
Due to the relatively small size of atmosphere particles such as dust and smoke
compared to THz wavelength, one would expect minimal THz attenuation due to
airborne particulates. Gebhart et al. [47] mentions for the typical wavelengths employed
by wireless IR links (780 nm and 1550 nm), attenuation due to dust is around 10dB/km in
urban regions. An IR beam at 1.5 µm wavelength carrying the same data load is
superposed with the THz beam (625 GHz), propagating through the same aerosol
conditions (Bentonite particle with mean size of diameter 8.6 µm). The optical power
attenuation and BER are measured, analyzed and compared. Under same dust
concentration, IR wavelengths are strongly attenuated while THz wavelength shows
almost no impact, so THz communication could apply in the battle filed or wildfire
environments and for some specific link length requirements THz can enable reliable
communication instead of IR based systems under dust environment. Also, different
amounts of dust (0.05 g, 0.08 g and 0.13 g) are loaded in the chamber to generate
different dust concentration environment. As the dust loading becomes heavier (and
extinction increases), the attenuation will become more severe.
117
6.2 Future Work
As mentioned above, atmosphere attenuation caused by fog and dust are investigated
theoretically and experimentally in this thesis dissertation. The characteristics and effects
of other atmosphere phenomena to which outdoor wireless links are exposed, such as
rain, humidity, turbulence should be studied in the future research work.
118
REFERENCES
1. G. K. Kitaeva, "Terahertz generation by means of optical lasers," Laser Physics Letters 5, 559-576 (2008).
2. K. Vodopyanov, "Terahertz-wave generation with periodically inverted gallium arsenide," Laser Physics 19, 305-321 (2009).
3. V. Bratman, M. Glyavin, T. Idehara, Y. Kalynov, A. Luchinin, V. Manuilov, S. Mitsudo, I. Ogawa, T. Saito, Y. Tatematsu, and V. Zapevalov, "Review of subterahertz and terahertz gyrodevices at IAP RAS and FIR FU," Plasma Science, IEEE Transactions on 37, 36-43 (2009).
4. R. Appleby and H. B. Wallace, "Standoff detection of weapons and contraband in the 100 GHz to 1 THz region," Antennas and Propagation, IEEE Transactions on 55, 2944-2956 (2007).
5. J. F. Federici, D. Gary, R. Barat, and Z.-H. Michalopoulou, "Detection of explosives by terahertz imaging," in Counter-Terrorist Detection Techniques of Explosives, J. Yinon, ed. (Elsevier, Boston, MA, 2007).
6. A. Sinyukov, I. Zorych, Z.-H. Michalopoulou, D. Gary, R. Barat, and J. F. Federici, "Detection of explosives by Terahertz synthetic aperture imaging—focusing and spectral classification," Comptes Rendus Physique 9, 248-261 (2008).
7. K. Ajito and Y. Ueno, "THz chemical imaging for biological applications," Terahertz Science and Technology, IEEE Transactions on 1, 293-300 (2011).
8. P. H. Siegel, "Terahertz technology in biology and medicine," Microwave Theory and Techniques, IEEE Transactions on 52, 2438-2447 (2004).
9. J. F. Federici, R. L. Wample, D. Rodriguez, and S. Mukherjee, "Application of terahertz Gouy phase shift from curved surfaces for estimation of crop yield," Appl. Opt. 48, 1382-1388 (2009).
10. Y. L. Hor, J. F. Federici, and R. L. Wample, "Nondestructive evaluation of cork enclosures using terahertz/millimeter wave spectroscopy and imaging," Appl. Opt. 47, 72-78 (2008).
11. S. Cherry, "Edholm's law of bandwidth," Spectrum, IEEE 41, 58-60 (2004).

119
12. P. Zhouyue and F. Khan, "An introduction to millimeter-wave mobile broadband systems," Communications Magazine, IEEE 49, 101-107 (2011).
13. M. Koch, "Terahertz communications: A 2020 vision," in Terahertz Frequency Detection and Identification of Materials and Objects, R. E. Miles, X.-C. Zhang, H. Eisele, and A. Krotkus, eds. (Springer Science and Business Media, Dordrecht, The Netherlands 2007), pp. 325-338.
14. V. Jungnickel, T. Haustein, A. Forck, and C. v. Helmolt, "155 Mbit/s wireless transmission with imaging infrared receiver," Electronics Letters 37, 314-315 (2001).
15. R. Piesiewicz, T. Kleine-Ostmann, N. Krumbholz, D. Mittleman, M. Koch, J. Schoebel, and T. Kurner, "Short-range ultra-broadband terahertz communications: concepts and perspectives," Antennas and Propagation Magazine, IEEE 49, 24-39 (2007).
16. J. F. Federici and L. Moller, "Review of terahertz and subterahertz wireless communications," J. Appl. Phys. 107, 111101 (2010).
17. T. Kleine-Ostmann, K. Pierz, G. Hein, P. Dawson, and M. Koch, "Audio signal transmission over THz communication channel using semiconductor modulator," Electronics Letters 40, 124-126 (2004).
18. T.-A. Liu, G.-R. Lin, Y.-C. Chang, and C.-L. Pan, "Wireless audio and burst communication link with directly modulated THz photoconductive antenna," Opt. Express 13, 10416-10423 (2005).
19. L. Möller, J. Federici, A. Sinyukov, C. Xie, H. C. Lim, and R. C. Giles, "Data encoding on terahertz signals for communication and sensing," Opt. Lett. 33, 393-395 (2008).
20. A. Hirata, T. Kosugi, N. Meisl, T. Shibata, and T. Nagatsuma, "High-directivity photonic emitter using photodiode module integrated with HEMT amplifier for 10-Gbit/s wireless link," Microwave Theory and Techniques, IEEE Transactions on 52, 1843-1850 (2004).
21. A. Hirata, H. Takahashi, R. Yamaguchi, T. Kosugi, K. Murata, T. Nagatsuma, N. Kukutsu, and Y. Kado, "Transmission characteristics of 120-GHz-band wireless link using radio-on-fiber technologies," Lightwave Technology, Journal of 26, 2338-2344 (2008).
120
22. A. Hirata, "10-Gbit/s wireless communications technology using sub-terahertz waves," Proc. SPIE 6772, 67720B (2007).
23. G. Ducournau, P. Szriftgiser, D. Bacquet, A. Beck, T. Akalin, E. Peytavit, M. Zaknoune, and J. F. Lampin, "Optically power supplied Gbit/s wireless hotspot using 1.55 um THz photomixer and heterodyne detection at 200 GHz," Electronics Letters 46, 1349-1351 (2010).
24. H. J. Song, K. Ajito, A. Hirata, A. Wakatsuki, T. Furuta, N. Kukutsu, and T. Nagatsuma, "Multi-gigabit wireless data transmission at over 200-GHz," in 34th International Conference on Infrared, Millimeter, and Terahertz Waves, (2009), pp. 1-2.
25. H. J. Song, K. Ajito, A. Hirata, A. Wakatsuki, Y. Muramoto, T. Furuta, N. Kukutsu, T. Nagatsuma, and Y. Kado, "8 Gbit/s wireless data transmission at 250 GHz," Electronics Letters 45, 1121-1122 (2009).
26. T. Nagatsuma, H. Ito, and T. Ishibashi, "High-power RF photodiodes and their applications," Laser & Photonics Reviews 3, 123-137 (2009).
27. T. Kleine-Ostmann and T. Nagatsuma, "A review on terahertz communications research," Journal of Infrared, Millimeter and Terahertz Waves 32, 143-171 (2011).
28. R. Yamaguchi, A. Hirata, T. Kosugi, H. Takahashi, N. Kukutsu, T. Nagatsuma, Y. Kado, H. Ikegawa, H. Nishikawa, and T. Nakayama, "10-Gbit/s MMIC wireless link exceeding 800 meters," in Radio and Wireless Symposium, IEEE, 2008), 695-698.
29. A. Hirata, T. Kosugi, H. Takahashi, J. Takeuchi, K. Murata, N. Kukutsu, Y. Kado, S. Okabe, T. Ikeda, F. Suginosita, K. Shogen, H. Nishikawa, A. Irino, T. Nakayama, and N. Sudo, "5.8-km 10-Gbps data transmission over a 120-GHz-band wireless link," in Wireless Information Technology and Systems (ICWITS), 2010 IEEE International Conference on, 2010), 1-4.
30. C. Jastrow, K. Munter, R. Piesiewicz, T. Kurner, M. Koch, and T. Kleine-Ostmann, "300 GHz channel measurement and transmission system," in IRMMW-THz 33rd International Conference on Infrared, Millimeter and Terahertz Waves, 2008), 1-2.
31. C. Jastrow, S. Priebe, B. Spitschan, J. Hartmann, M. Jacob, T. Kurner, T. Schrader, and T. Kleine-Ostmann, "Wireless digital data transmission at 300 GHz," Electronics Letters 46, 661-663 (2010).
121
32. L. Moeller, J. Federici, and K. Su, "2.5 Gbit/s duobinary signalling with narrow bandwidth 0.625 terahertz source," Electronics Letters 47, 856-858 (2011).
33. H. C. Liu, L. Hui, S. Chun-ying, Z. R. Wasilewski, A. J. SpringThorpe, and J. C. Cao, "Terahertz Quantum Well Photodetectors," Selected Topics in Quantum Electronics, IEEE Journal of 14, 374-377 (2008).
34. P. D. Grant, S. R. Laframboise, R. Dudek, M. Graf, A. Bezinger, and H. C. Liu, "Terahertz free space communications demonstration with quantum cascade laser and quantum well photodetector," Electronics Letters 45, 952-954 (2009).
35. J. F. Federici, L. Moeller, and K. Su, "Terahertz communications " in Handbook of Terahertz Technology for Imaging and Sensing (2011).
36. T. Kosugi, M. Tokumitsu, T. Enoki, M. Muraguchi, A. Hirata, and T. Nagatsuma, "120-GHz Tx/Rx chipset for 10-Gbit/s wireless applications using 0.1 um-gate InP HEMTs," in Compound Semiconductor Integrated Circuit Symposium, 2004. IEEE, 2004), 171-174.
37. G. Planinsic, "Infrared thermal imaging: fundamentals, research and applications," European Journal of Physics 32, 1431 (2011).
38. N. T. Hunt, "2D-IR spectroscopy: ultrafast insights into biomolecule structure and function," Chemical Society Reviews 38, 1837-1848 (2009).
39. P. Zappi, E. Farella, and L. Benini, "Tracking motion direction and distance with pyroelectric IR sensors," Sensors Journal, IEEE 10, 1486-1494 (2010).
40. K. Krishnamurthy, H. K. Khurana, J. Soojin, J. Irudayaraj, and A. Demirci, "Infrared heating in food processing: an overview," Comprehensive Reviews in Food Science and Food Safety 7, 2-13 (2008).
41. J. M. Kahn and J. R. Barry, "Wireless infrared communications," Proceedings of the IEEE 85, 265-298 (1997).
42. K. D. Langer and J. Grubor, "Recent developments in optical wireless communications using infrared and visible light," in ICTON 9th International Conference on Transparent Optical Networks, (2007), pp. 146-151.

122
43. J. R. Barry, J. M. Kahn, E. A. Lee, and D. G. Messerschmitt, "High-speed nondirective optical communication for wireless networks," Network, IEEE 5, 44-54 (1991).
44. K. S. Natarajan, K. C. Chen, and P. D. Hortensius, "Considerations for the design of high speed wireless optical networks," IEEE Workshop on Wireless LANs, 140-143 (1991).
45. D. Kedar and S. Arnon, "Urban optical wireless communication networks: the main challenges and possible solutions," Communications Magazine, IEEE 42, S2-S7 (2004).
46. R. Ramire-Iniguez, S. M. Idrus, and Z. Sun, Optical Wireless Communications: IR for Wireless Connectivity (Auerbach Publications, Boca Raton, FL, 2008).
47. M. Gebhart, E. Leitgeb, and J. Bregenzer, "Atmospheric effects on optical wireless links," in Proceedings of the 7th International Conference on Telecommunications, (2003), pp. 395-401 vol.392.
48. A. Al-habasch, K. W. Fischer, C. S. Cornish, K. N. Desmet, and J. Nash, "Comparison between experimental and theoretical probability of fade for free space optical communications," Optical Wireless Communications V, Proceedings of SPIE 4873, 79-89 (2002).
49. MMW_Concepts, retrieved 11/01/2011, http://mmwconcepts.com/home.html.
50. E. R. Brown, "THz generation by photomixing in ultrafast photoconductors," in Terahertz Sensing Technology, D. L. Woolard, W. R. Loerop, and M. Shur, eds. (World Scientific, River Edge, NJ, 2003).
51. Y. Yang, A. Shutler, and D. Grischkowsky, "Measurement of the transmission of the atmosphere from 0.2 to 2 THz," Opt. Express 19, 8830-8838 (2011).
52. S. A. Khan, A. N. Tawfik, C. J. Gibbins, and B. C. Gremont, "Extra-high frequency line-of-sight propagation for future urban communications," Antennas and Propagation, IEEE Transactions on 51, 3109-3121 (2003).
53. T. Utsunomiya and M. Sekine, "Rain attenuation at 103 GHz in millimeter wave ranges," International Journal of Infrared and Millimeter Waves 26, 1651-1660 (2005).

123
54. A. Hirata, R. Yamaguchi, H. Takahashi, T. Kosugi, K. Murata, N. Kukutsu, and Y. Kado, "Effect of Rain Attenuation for a 10-Gb/s 120-GHz-Band Millimeter-Wave Wireless Link," Microwave Theory and Techniques, IEEE Transactions on 57, 3099-3105 (2009).
55. S. Ishii, S. Sayama, and T. Kamei, "Measurement of rain attenuation in terahertz wave range," Wireless Engineering and Technology 2, 119-124 (2011).
56. K. Su, L. Moeller, R. Barat, and J. F. Federici, " Experimental comparison of performance degradation from terahertz and infrared wireless link in fog," Journal of the Optical Society of America A: Optics and Image Science, and Vision (Accepted) (2011).
57. C. M. Mann, "Towards terahertz communications systems " in Terahertz Sources and Systems, R. E. Miles, P. Harrison, and D. Lippens, eds. (Kluwer Academic Norwell, MA, 2001).
58. M. Al-Habash, "Mathematical model for the irradiance probability density function of a laser beam propagating through turbulent media," Opt. Eng. 40, 1554 (2001).
59. L. C. Andrews and R. L. Phillips, "I-K distribution as a universal propagation model of laser beams in atmospheric turbulence," J. Opt. Soc. Am. A 2, 160-163 (1985).
60. Z. Liu, K. Su, D. E. Gary, J. F. Federici, R. B. Barat, and Z.-H. Michalopoulou, "Video-rate terahertz interferometric and synthetic aperture imaging," Appl. Opt. 48, 3788-3795 (2009).
61. K. Su, Z. Liu, R. B. Barat, D. E. Gary, Z.-H. Michalopoulou, and J. F. Federici, "Two-dimensional interferometric and synthetic aperture imaging with a hybrid terahertz/ millimeter wave system," Appl. Opt. 49, E13-E19 (2010).
62. A. M. Sinyukov, Z. Liu, Y. L. Hor, K. Su, R. B. Barat, D. E. Gary, Z.-H. Michalopoulou, I. Zorych, J. F. Federici, and D. Zimdars, "Rapid-phase modulation of terahertz radiation for high-speed terahertz imaging and spectroscopy," Opt. Lett. 33, 1593-1595 (2008).
63. L. Moeller, J. F. Federici, and K. Su, "THz wireless communications: 2.5 Gb/s error-free transmission at 625 GHz using a narrow-bandwidth 1 mW THz source," in General Assembly and Scientific Symposium, URSI, (Istanbul 2011).

124
64. A. Visioli, Practical PID control (Springer, London, 2006).
65. S. M. Duffy, S. Verghese, and K. A. McIntosh, in Sensing with Terahertz Radiation, D. Mittleman, ed. (Springer, Berlin, 2003).
66. E. R. Brown, "Electronic devices and advanced systems technology " in Terahertz Sensing Technology, D. L. Woolard, W. R. Loerop, and M. S. Shur, eds. (World Scientific NJ, 2003).
67. E. F. Plinski, "Terahertz photomixer," Bulletin of the Polish Academy of Sciences 58(2010).
68. Toptica, retrieved 11/01/2011, http://www.toptica.com/.
69. M. Wirts, "Method and device for measuring and stabilization using signals from a Fabry-Perot," (2001).
70. P. Kordos, M. Marso, and M. Mikulics, "Performance optimization of GaAs-based photomixers as sources of THz radiation," Applied Physics A: Materials Science & Processing 87, 563-567 (2007).
71. K. Sakai, Terahertz Optoelectronics, Topics in applied physics (Springer, Berlin, 2005).
72. D. Penninckx, M. Chbat, L. Pierre, and J. P. Thiery, "The phase-shaped binary transmission (PSBT): a new technique to transmit far beyond the chromatic dispersion limit," Photonics Technology Letters, IEEE 9, 259-261 (1997).
73. A. Lender, "The duobinary technique for high-speed data transmission," IEEE Trans. Commun. Electron. 82, 214-218 (1963).
74. S. Haykin, Digital Communications (Wiley, New York, 1988).
75. T. W. Crowe, D. W. Porterfield, J. L. Hesler, and W. L. Bishop, "Submillimeter-wave and terahertz diodes, components and subsystems," in Infrared Millimeter Waves and 14th International Conference on Teraherz Electronics, Joint 31st International Conference on IRMMW-THz, (2006), pp. 396-396.
76. T. Mizuochi, "Recent progress in forward error correction and its interplay with transmission impairments," Selected Topics in Quantum Electronics, IEEE Journal of 12, 544-554 (2006).

125
77. H. C. van de Hulst, Light Scattering by Small Particles, Structure of matter series (Wiley, New York, 1957).
78. H. J. Liebe, T. Manabe, and G. A. Hufford, "Millimeter-wave attenuation and delay rates due to fog/cloud conditions," Antennas and Propagation, IEEE Transactions on 37, 1617-1612 (1989).
79. D. Deirmendjian, Electromagnetic Scattering on Spherical Polydispersions (Elsevier, New York, 1969).
80. L. W. Abreu and G. P. Anderson, "The MODTRAN 2/3 Report and LOWTRAN 7 MODEL," F19628-91-C-0132 (1996).
81. "LOWTRAN 7: Status, review, and impact for short-to-long-wavelength infrared applications," in AGARD, Atmospheric Propagation in the UV, Visible, IR, and MM-Wave Region and Related Systems Aspects, F. X. Kneizys, G. P. Anderson, E. P. Shettle, L. W. Abreu, J. H. Chetwynd, J. E. A. Selby, W. O. Gallery, and S. A. Clough, eds. (1990).
82. S. A. Clough, F. X. Kneizys, E. P. Shettle, and G. P. Anderson, "Atmospheric radiance and transmittance: FASCOD2," in Sixth Conference on Atmospheric Radiation, American Meteorological Society, (Boston, MA, 1986), p. 141.
83. S. A. Clough, F. X. Kneizys, L. S. Rothman, and W. O. Gallery, "Atmospheric spectral transmittance and radiance - FASCOD1B," in Atmospheric transmission, (SPIE - The International Society for Optical Engineering, 1981), 152-166.
84. P. W. Kruse, L. D. McGlauchilin, and R. B. McQuistan, Elements of Infrared Technology: Generation, Transmission and Detection (Wiley, New York, 1962).
85. I. Kim, B. McArthur, and E. Korevaar, "Comparison of laser beam propagation at 785 and 1550 nm in fog and haze for optical wireless communications," in Proc. SPIE (2001), pp. 26-37.
86. M. Alnaboulsi, H. Sizun, and F. de Fornel, "Fog attenuation prediction for optical and infrared waves," Optical Engineering 43, 11 (2004).
87. I. Gultepe, Fog and Boundary Layer Clouds: Fog Visibility and Forecasting (Birkhauser Basel, Toronto, Canada, 2007).
126
88. H. R. Byers, General Meteorology (McGraw-Hill, New York, 1959).
89. H. G. Houghton, "The transmission of visible light through fog," Physical Review 38, 152 (1931).
90. H. G. Houghton and W. H. Radford, "On the measurement of drop size and liquid water content in fogs and clouds," Physical Oceanography and Meteorology 6(1938).
91. H. Weichel, Laser Beam Propagation in the Atmosphere (SPIE, Bellingham, WA, 1990).
92. D. Harris, "The attenuation of electromagnetic waves due to atmospheric fog," International Journal of Infrared and Millimeter Waves 16, 1091-1108 (1995).
93. J. M. Wallace and P. V. Hobbs, Atmospheric Science: An Introductory Survey (Academic Press, Orlando, FL, 1977).
94. W. E. K. Middleton, Vision Through the Atmosphere (University of Toronto Press, Toronto, Canada, 1952).
95. L. C. Andrews and R. L. Phillips, Laser Beam Propagation through Random Media (SPIE Press, Bellingham, WA, 1998).
96. R. L. Freeman, Radio system design for telecommunications 2nd ed. (Wiley, New York 1997).
97. "ITU-R recommendation P.840-4: attenuation due to clouds and fog," (International Telecommunication Union (ITU), Switzerland, 2009).
98. Z. Zhao and Z. Wu, "Millimeter-wave attenuation due to fog and clouds," International Journal of Infrared and Millimeter Waves 21, 1607-1615 (2000).
99. J. Williams, "Infrared Transmission and Path Radiance through Dust and Fog," (Army Research Lab., MD, 1993).
100. Picarin, "Microtech Instrument, Inc", retrieved 11/01/2011, http://www.mtinstruments.com/.
101. T. L. Heath, The Works of Archimedes (Cambridge University Press, UK, 1897).
127
102. G. D. Brunton, "Density and compressibility of wyoming bentonite particles," Clays and Clay Minerals 36, 94-95 (1988).
103. O. Reynolds, "An experimental investigation of the circumstances which determine whether the motion of water shall be direct or sinuous, and of the law of resistance in parallel channels," Proceedings of the Royal Society of London 35, 84-99 (1883).
104. Crane Technical Paper No. 410 "Flow of Fluids through Valves, Fittings, and Pipe" (Crane Co., Michigan, 1988).
105. R. J. Emrich, Fluid Dynamics, Methods of Experimental Physics (Academic Press, New York, 1981), Vol. 18.
106. C. F. Bohren and D. R. Huffman, Absorption and Scattering of Light by Small Particles (Wiley, New York, 1983).
107. Handbook of Mathematical Functions: with Formulas, Graphs, and Mathematical Tables (Dover Publications, Mineola, NY, 1964).