Embed Size (px)
Citation preview

1
Coral mortality induced by the 2015-2016 El-Niño in Indonesia: 1
the effect of rapid sea level fall 2 3
Eghbert Elvan Ampou1,2,3, Ofri Johan4, Christophe E. Menkes5, Fernando Niño3, Florence Birol3, 4
Sylvain Ouillon3, Serge Andréfouët1,2 5
6
1UMR9220 ENTROPIE, Institut de Recherche pour le Développement, Université de la Réunion, CNRS, B.P.A5, 98848, 7 Noumea ,New Caledonia 8
2Institute for Marine Research and Observation. SEACORM / INDESO center. Jl. Baru Perancak, Negara-Jembrana, Bali 9 82251, Indonesia 10
3Laboratoire d’Etudes en Géophysique et Océanographie Spatiales, Université de Toulouse, CNRS, IRD, CNES, UPS, 14 11 avenue Edouard-Belin, 31400 Toulouse, France 12
4Research and Development Institute for Ornamental Fish Culture, Jl. Perikanan No. 13, Pancoran Mas, Kota Depok, 13 Jawa Barat 16436, Indonesia 14
5Laboratoire d'Océanographie et du Climat: Expérimentations et Approches Numériques, Sorbonne Universités, UPMC 15 Université Paris 06, IPSL, UMR CNRS/IRD/MNHN, B.P.A5- 98848, Noumea, New Caledonia 16
17
Correspondence to: Serge Andréfouët,. E-mail: [email protected] 18
19
Biogeosciences Discuss., doi:10.5194/bg-2016-375, 2016Manuscript under review for journal BiogeosciencesPublished: 9 September 2016c© Author(s) 2016. CC-BY 3.0 License.

2
Abstract: The 2015-2016 El-Niño and related ocean warming has generated significant coral bleaching and mortality 20
worldwide. In Indonesia, first signs of bleaching were reported in April 2016. However, this El Niño has impacted 21
Indonesian coral reefs since 2015 through a different process than temperature-induced bleaching. In September 2015, 22
altimetry data shows that sea level was at its lowest in the past 12 years, affecting corals living in the bathymetric range 23
exposed to unusual emersion. In March 2016, Bunaken Island (North Sulawesi) displayed up to 85% mortality on reef 24
flats dominated by Porites, Heliopora and Goniastrea corals with differential mortality rates by coral genus. Almost all 25
reef flats showed evidence of mortality, representing 30% of Bunaken reefs. For reef flat communities which were living 26
at a depth close to the pre-El Niño mean low sea level, the fall induced substantial mortality likely by higher daily aerial 27
exposure a least during low tide periods. Altimetry data was used to map sea level fall throughout Indonesia, suggesting 28
that similar mortality could be widespread for shallow reef flat communities, which accounts for a vast percent of the 29
total extent of coral reefs in Indonesia. The altimetry historical records also suggest that such event was not unique in the 30
past two decades, therefore rapid sea level fall could be more important in the dynamics and resilience of Indonesian reef 31
flat communities than previously thought. The clear link between mortality and sea level fall also calls for a refinement 32
of the hierarchy of El Niño impacts and their consequences on coral reefs. 33
34
Key-words: ENSO; Absolute Dynamic Topography; Sea Level Anomaly, Coral reef; Indonesia; Coral Triangle 35
36
1. Introduction 37
El Niño-Southern Oscillation (ENSO) is the most important coupled ocean-atmosphere phenomenon impacting climate 38
variability at global and inter annual time scales (McPhaden, 2007). The consequences on coral reefs have been well 39
documented, especially since the 1997-1998 massive coral bleaching event, which reached planetary dimension (Hoegh-40
Guldberg, 1999). In short, El Niño increases temperature in several coral reef regions and induces zooxanthellae 41
expulsion from the coral polyp, resulting in coral colony looking white, hence “bleaching”. If the situation persists the 42
coral colony eventually dies. Coral bleaching intensity has been related to different temperature thresholds, other 43
environmental factors and stressors, and type of zooxanthellae and corals (Baker et al., 2008). Bleaching episodes due to 44
ocean warming were recorded during the strong 1982-83 El Niño in Australia (Glynn, 2000) and have since been 45
reported worldwide in several instances (Guest et al., 2012; Wouthuyzen et al., 2015). The last bleaching episode has 46
occurred in 2015-2016 during what occurs to be the strongest El Niño event on record (Schiermeier, 2015). Bleaching 47
events were often global in the past, including Indonesia (Suharsono 1990; Guest et al., 2012; Wouthuyzen et al., 2015). 48
Last reports for Indonesia in 2016 are still under analysis, and Reef Check survey locations are presented at 49
http://reefcheck.or.id/bleaching-indonesia-peringatan/. It is thus assumed that coral bleaching induced by ocean warming 50
will be the main culprit if post-El Niño surveys report coral mortalities. 51
52
While in Bunaken National Park in February 23rd – March 5th 2016 for a biodiversity survey, we noticed recent 53
mortalities on the upper part of many massive colonies on several reef flats. This prompted a systematic investigation of 54
the phenomenon’s spatial distribution. We report here observations on what appears to be the first significant impact of 55
the 2015-2016 El Niño on Indonesia reefs. Unlike what is expected during such a strong event, the mortality was not 56
Biogeosciences Discuss., doi:10.5194/bg-2016-375, 2016Manuscript under review for journal BiogeosciencesPublished: 9 September 2016c© Author(s) 2016. CC-BY 3.0 License.

3
related to warm water induced-bleaching, but could be tracked to rapid sea level variations. Coral mortality data around 57
Bunaken Island are provided, and we investigate various altimetry and sea level anomaly data sets to explain mortality. 58
The clear link between mortality and sea level fall calls for a refinement of the hierarchy of El Niño impacts and their 59
sequences on coral reefs. 60
61
2. Material and Methods 62
Bunaken National Park (BNP) is located at the northwest tip of Sulawesi, Indonesia. The location is at the core of the 63
epicenter of marine biodiversity, the so-called Coral Triangle, a vast area spanning Malaysia to Solomon Island, where 64
the number of marine species is maximum (Hoeksema, 2007). BNP includes several islands with Bunaken Island 65
(1.62379°N, 124.76114°E) one of the most studied Indonesian reef site. Bunaken Island is surrounded by a simple 66
fringing reef system, comprising reef flats, several small enclosed lagoons and forereefs. The tide regime is semi-diurnal, 67
but with marked diurnal inequalities (Ray et al. 2005), with a maximum spring tidal range that can reach 2.52 m. 68
Bunaken Island is generally exposed to southwest wind from May to October, resulting in calm seas due to the short 69
fetch between mainland and the island, and to northwest wind from November to February, which can be strong at time 70
and generate large waves breaking on the west and north shores. 71
72
Two previous BNP surveys for habitat mapping, in May-June 2014 and May-June 2015, did not show any significant 73
signs of widespread mortalities on reef flats. Different species of corals were frequently exposed above water level at 74
low spring tide, yet they were entirely alive (Fig. 1). Microatolls were present. They have not been studied in Bunaken 75
NP, but by similarity with other sites, their growth is likely constrained by a Mean Low Water (MLW), between Mean 76
Low Water Neaps (MLWN) and Mean Low Water Springs (MLWS) (Smithers and Woodroffre, 2000; Goodwin and 77
Harvey 2008). Several reef flats were characterized by compact communities of massive and semi-massive colonies that 78
could be described as keep-up communities limited in their vertical growth by the MLW (by analogy with the 79
terminology of Holocene reefs provided by Neumann and Macintyre, 1985). 80
81
In contrast with the 2015 observations, in late February 2016, during a coral biodiversity census survey, we noticed the 82
widespread occurrences of dead massive corals and we performed a systematic investigation on the spatial distribution of 83
the phenomenon. All reef flats around Bunaken Island were visually surveyed and recent mortality was recorded 84
(presence/absence). Geographic coordinates of the presence of mortality were compiled to map its extent. Then, in 85
different locations around the island, mortality was measured on six reef flat locations characterized by high coral cover 86
and different dominant massive coral species, principally Porites lutea and the octocoral Heliopora coerulea, using six 87
10-meter long Line Intercept Transect (LIT) (English et al., 1997). We recorded the percent cover of live and dead tissue 88
for each coral, the species/genus for each coral, and substrate categories between colonies. 89
90
A clear sharp horizontal limit of tissue mortality was present in impacted colonies. The distribution of dead tissue 91
between colonies and among colonies (Fig. 1) suggested that mortality was related to sea level variations, with increased 92
aerial exposure time during the last few months. In order to test this hypothesis, different sea level anomaly products 93
were investigated, based on their temporal coverage and spatial resolution. First, we used gridded altimetry data in terms 94
of Absolute Dynamic Topography (ADT), from the Archiving, Validation and Interpretation of Satellite Oceanographic 95
Biogeosciences Discuss., doi:10.5194/bg-2016-375, 2016Manuscript under review for journal BiogeosciencesPublished: 9 September 2016c© Author(s) 2016. CC-BY 3.0 License.

4
Data center (AVISO) at the spatial resolution of ¼°. ADT provides the sea level with respect to the geoid. Data is 96
available from 1993 to 2016, allowing a long-term comparison of the sea level trends. The mean ADT over the period 97
were extracted for a small box next to Bunaken Island (1.5-1.7° N; 124.5-124.8° E), a larger box (3 by 3 degrees around 98
the smaller box) centered on Bunaken Island and including the north of Sulawesi and Tomini Bay in the south, and for 99
the entire Indonesia (-14.9-10.0°S, 94.9-140.0°E). The difference between the minimum value (observed in September 100
2015) and the 2005-2014 mean or the 1993-2016 mean periods were also computed. 101
102
Second, to extract geophysical information from higher spatial resolution altimeter data, we used the along-track 103
measurements from SARAL/AltiKa Geophysical Data Records (GDRs) distributed by the AVISO service 104
(http://www.aviso.altimetry.fr/fr/). This data set was chosen because the new Ka-band instrument from SARAL has a 105
finer spatial resolution and enables a better observation of coastal zones (Verron et al., 2015). Data extends from March 106
2013 (cycle 1 of the satellite mission) to May 2016 (cycle 33), with a repeat period of 35 days. Over this period, we use 107
all altimeter observations located between 10°S-10°N and 105°E-140°E. Two tracks (#535 and #578) intersect the north 108
of Sulawesi Island and contain sampling points just off Bunaken Island. The data analysis is done in terms of sea level 109
anomalies (SLA) computed from the 1-Hz altimeter measurements and geophysical corrections provided in GDRs 110
products. The SLA data processing and editing are described in details in Birol and Niño (2015). The 1-Hz SLA data 111
have a spatial resolution of ~7 km along the satellite tracks. In order to quantify the spatial variations of the regional sea 112
level change in March 2013-May 2016, a linear trend model is applied (using a simple linear regression) to the individual 113
SLA time series observed at the different points along the altimeter tracks crossing the area of interest. The trend is the 114
slope of the regression (in cm.y-1). The resulting 3-year sea level trend values can be represented on a map. 115
116
3. Results 117
3. 1 Mortality rates per dominant coral genus 118
For all colonies found on the six stations, dead tissues were found on the top and upper-flank of the colonies, with the 119
lower part of the colonies remaining healthy (Fig. 1). Mortality was not limited to microatoll-shaped colonies only. 120
Round massive colonies were also impacted. On microatolls and other colonies that may have lived close to MLW, the 121
width of dead tissue appeared to be around a maximum of 15 cm. Dead tissues were systematically covered by turf algae, 122
with cyanobacteria in some cases, suggesting that the stressor responsible for the mortality occurred few months earlier. 123
There were no obvious preferential directions in tissue damage at colony surface as it has been previously reported for 124
intertidal reef flat corals in Thailand (Brown et al. 1994). 125
126
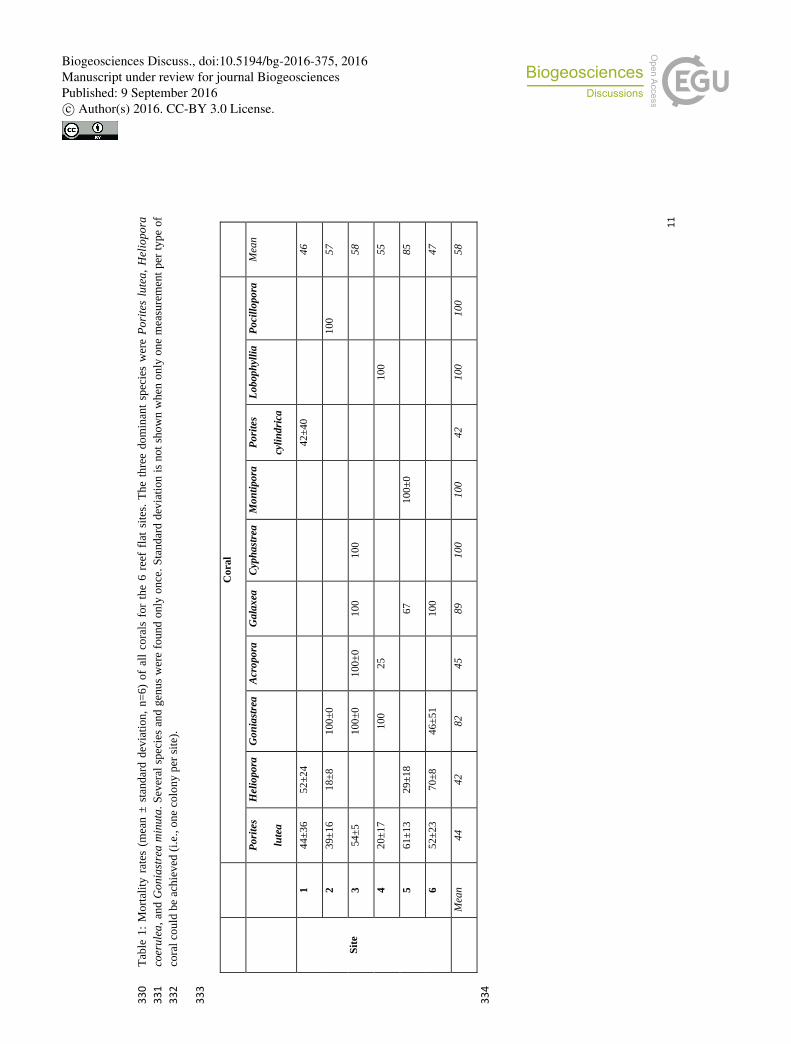
The six surveyed reef flat locations were dominated by H. coerulea and P. lutea, while other genus and species occurred 127
less frequently (Table 1). When taking into account all genus, up to 85% of the colonies were dead (Site 5). The average 128
mortality was around 58% all sites included (Fig. 2). When it was present Goniastrea minuta colonies were the most 129
impacted, with a 82% mortality on average (Fig. 2). Highest mortalities were found on keep-up communities relative to 130
sea level (Fig. 1). 131
132
Biogeosciences Discuss., doi:10.5194/bg-2016-375, 2016Manuscript under review for journal BiogeosciencesPublished: 9 September 2016c© Author(s) 2016. CC-BY 3.0 License.

5
3.2 Map of occurrences of mortality 133
The survey around the island revealed presence of mortality all around the island except the north reef flats where corals 134
were scarce and encrusting (Fig. 2). The same coral genus as listed in Table 1 were impacted, but mortality levels 135
differed depending on colony heights. When colonies were clearly below the present minimum sea level, they remained 136
healthy (Fig. 1). The map of positive observations shows that mortality has occurred mostly along the crest, which is 137
expected to be the most vulnerable during sea level fall (Fig. 2). The survey suggests that nearly 163 hectares, or 30% of 138
the entire reef system, has been impacted by some mortality. However, this does not mean that 30% of the reef has died. 139
140
3.3 Absolute Dynamic Topography time series 141
The ADT time-series (Fig. 3) shows a significant sea level fall congruent with El Niño periods, at all spatial scales, 142
although the pattern is not as pronounced at Indonesia-scale (Fig. 3). The 1997-1998 and the 2015-2016 years display the 143
highest falls. The September 2015 value is the local minima, considering the last ten years (Fig. 3). The 8 cm fall in 144
September 2015 compared to the previous 4 years, and the 15 cm fall compared to the 1993-2016 mean (Fig. 3) is 145
consistent with the pattern of mortality following a maximum of ~15 cm width on the top of the impacted micro-atolls 146
and colonies that were living close to the mean low sea-level before the event (Fig. 1). 147
148
3.4 Sea Level Anomaly trends 149
SARAL/AltiKa data in March 2013-May 2016 are shown in Figure 4 for a small area that includes Bunaken Island (top) 150
and a larger box (bottom) covering part of the western equatorial Pacific Ocean and Coral Triangle. A substantial sea 151
level fall is observed around Bunaken Island, with values ranging from 4 to 8 cm/year (12 to 24 cm accumulated over 3 152
years, Fig. 4). Further analysis of the individual sea level time series indicates that the overall trend is explained, and 153
accelerated, by the fall due to El Niño (not shown). This result agrees with findings from Luu et al. (2015) around 154
Malaysia and can be extended to much of the Coral Triangle. The Figure 4 shows that this phenomenon is consistent 155
over a large part of Indonesia and the warm water pool, with strong differences in sea level variations (up to -15 cm/year 156
are observed between Asia and Micronesia, north of 5°N and east of 130°E). 157
158
4. Discussion 159
We aimed here to document the spatial scale and the cause of an ecological event that could be easily overlooked when 160
documenting the 2016 El Niño impact on Indonesian coral reefs. Many studies have emphasized the role of 161
hydrodynamics and sea level on the status and mortality of coral communities growing on reef flats (e.g., Anthony and 162
Kerswell, 2007; Hopley, 2011; Lowe et al., 2016). Here we emphasize, with altimetry data for one the first time for a 163
reef flat study (see Tartinville and Rancher 1997), that the 2015-2016 El Niño has generated such mortality, well before 164
any ocean warming-induced bleaching. The exact time of the mortality remains unknown, but it is likely congruent to the 165
lowest level in September 2015. The aspect of the colonies in February 2016, with algal turf covering the dead part (Fig. 166
1), is also consistent with a lowest sea level occurring few months earlier. The Figure 1 shows corals that were fine in 167
Biogeosciences Discuss., doi:10.5194/bg-2016-375, 2016Manuscript under review for journal BiogeosciencesPublished: 9 September 2016c© Author(s) 2016. CC-BY 3.0 License.
6
May 2015 even when exposed to aerial exposure during low spring tide, without wave or wind, for several hours, during 168
several days of spring tide. Thus, we assume the mortality was due to several weeks of lower water, including spring tide 169
periods, which is compatible with the temporal resolution of the altimetry observations. The aerial exposure could have 170
led to tissue heating, desiccation, photosystem or other cell functions damage (Brown, 1997). It is possible that colonies 171
could have look bleached during that period (Brown et al. 1994). Lack of wind-induced wave in the September period 172
also prevented wave washing and water mixing which could have limited the damage (Anthony and Kerswell, 2007). 173
174 The various satellite Sea Surface Temperature (SST) products for coral bleaching warning available at 175
http://coralreefwatch.noaa.gov/ do not suggest any bleaching risk in the Bunaken region before June 2016, hence the 176
wide mortality we observed can not be simply explained by ocean warming due to El Niño. We also verified on 177
http://earthquake.usgs.gov/ that between the May 2015 habitat mapping survey and the February 2016 coral survey, no 178
tectonic movement could generate such a 15 cm–uplift, with an upward shift of coral colonies relative to sea level as it 179
has been reported in different places in the past, including in Sumatra, Indonesia after the 2004 Sumatra Earthquake 180
(Meltzner et al. 2006). An uplift of that magnitude would be related to a significant event, but there are no reports higher 181
than a 6.3 magnitude earthquake (16th September 2015, origin 1.884°N 126.429°E) in the north Sulawesi area for that 182
period. 183
184
Altimetry data have been seldom used to study coral reef processes, even in a sea level rise era that may affect coral reef 185
communities and islands. They have been useful to assess the physical environment (wave, tide, circulation, lagoon 186
water renewal) around islands and reefs (e.g., Tartinville and Rancher, 1997; Andréfouët et al., 2001; Burradge et al., 187
2003; Andréfouët et al., 2012; Gallop et al., 2014), or explain larval connectivity and offshore physical transport between 188
reefs (e.g., Christie et al., 2010), but this is the first time to our knowledge that altimetry data, including the new 189
SARAL/AltiKa data, are related to a coral ecology event. Different measures of sea level and sea level anomalies 190
confirmed an anomalous situation following the development of the 2015-2016 El Niño, resulting in lower sea level 191
regionally averaging 8 cm in the north of Sulawesi compared to the previous 4 years (Figs. 3-5). Mortality patterns on 192
coral colonies strongly suggests that sea level fall is responsible of the coral die-off that could reach 80% of reef flat 193
colonies that were in a keep-up position relative to, usually, rising sea-level in this region (Fenoglio-Marc et al; 2012). 194
195
While mortality due to sea level fall was characterized opportunistically in Bunaken NP, the impact remains unquantified 196
elsewhere. However, we speculate that similar events have occurred throughout the Indonesian seas when considering 197
ADT values for this region (Fig. 5). Particularly impacted by sea level fall could have been the stretch of reefs and 198
islands between South Sumatra, South Java, the Flores Sea and Timor, and the domain centered by Seram island and 199
comprised between East Sulawesi, West Papua and the Banda Sea. These areas have substantial reef flat presence (e.g., 200
for the Lesser Sunda region comprised between Bali, Maluku and Timor islands, see maps in Torres-Pulliza et al., 2013). 201
202
Specifically for Bunaken NP, the event we have witnessed helps explaining long term observations of reef flat dynamics 203
and resilience. Indeed, our surveys and historical very high resolution satellite imagery show around Bunaken Island the 204
fast colonization of reef flats by Heliopora coerula and by carpets of branching Montipora in the years 2004-2012, a 205
Biogeosciences Discuss., doi:10.5194/bg-2016-375, 2016Manuscript under review for journal BiogeosciencesPublished: 9 September 2016c© Author(s) 2016. CC-BY 3.0 License.

7
period congruent to substantial rising sea level (Fig. 3) (Fenoglio-Marc et al. 2012). Rising seas has allowed these corals, 206
especially fast growing and opportunistic like H. coerula (Babcock, 1990; Yasuda et al., 2012) to cover previously bare 207
reef flats by taking advantage of the additional accommodation space. A similar process occurred in Heron Island reef 208
flats in Australia, with an artificially-induced sea level rise due to local engineering work (Scopélitis et al., 2011). In 209
Bunaken, and probably elsewhere in Indonesia and the Coral Triangle, the 2015-2016 El Niño event counter-balances 210
this period of coral growth with rising seas. 211
212
The ADT time-series (Fig. 3) suggests that similar low level situations have probably previously occurred, and almost 213
certainly at least in 1997-1998, the highest anomaly on altimetry record. Reef flat coral mortality reported in the Coral 214
Triangle as the consequences of bleaching in these years is thus most likely also the consequences of sea level fall. The 215
discrimination between thermal and sea level fall-induced mortality could be difficult to pinpoint on reef flats, if surveys 216
had occurred several months after the thermally-induced bleaching. In Bunaken NP, mortality due to sea level fall 217
preceded by nearly 7 months the first occurrences of bleaching in Indonesia, reported in April 2016. The real impact of 218
sea level fall could have been largely underestimated during all El Niño episodes and especially in Asia. The 219
implications for coral reef monitoring in the Coral Triangle are substantial. Surveys that may have started in April 2016 220
may be confused and assigned reef flat mortalities to coral bleaching. In future years, monitoring SLA may be as 221
important as monitoring SST. While there are several SST-indices specifically used as early-warning signals for potential 222
coral bleaching (Teneva et al., 2012), there are no sea level indices specific for coral reef flats. However, several ENSO 223
indices can help tracking the likelihood of similar events for Indonesia. The high correlation between the NINO3_4 224
index and ADT over the 1993-2016 period (monthly mean minus seasonal baseline, Fig. 6) shows this potential. Other 225
indices, such as the Southern Oscillation Index (SOI, computed as the pressure difference between Darwin and Tahiti), 226
or the Equatorial SOI (defined by the pressure difference between the Indonesia-SLP, standardized anomalies of sea 227
level, and the Equatorial Eastern Pacific SLP) appears to be even more suitable over Indonesia and the Coral Triangle to 228
develop suitable early-warning signals related to sea level variations. 229
230
5. Conclusion 231
This study reports coral mortality in Indonesia after a El Niño-induced sea level fall. The fact that sea level fall, or 232
extremely low tides, induces coral mortality is not new, but this study demonstrates that through rapid sea level fall, the 233
2015-2016 El Niño has impacted Indonesian shallow coral reefs well before that high sea surface temperature could 234
trigger any coral bleaching. Sea level fall appear as a major mortality factor for Bunaken Island in North Sulawesi, and 235
altimetry suggests similar impact throughout Indonesia. Our findings confirm that El Niño impacts are multiple and the 236
different processes need to be understood for an accurate diagnostic of the vulnerability of Indonesian coral reefs to 237
climate disturbances. This study also illustrates how to monitor local sea level to interpret changes in a particular coastal 238
location. For Indonesia coral reefs, in addition to sea level fall depending on the ENSO situation, further changes can be 239
expected, due to coral bleaching, diseases, predator outbreaks, storms and sea level rise (Baird et al., 2013; Johan et al., 240
2014). Considering the level of services that shallow coral reefs offer, in coastal protection, food security and tourism, 241
the tools presented here offer valuable information to infer the proper diagnostic after climate-induced disturbances. 242
Biogeosciences Discuss., doi:10.5194/bg-2016-375, 2016Manuscript under review for journal BiogeosciencesPublished: 9 September 2016c© Author(s) 2016. CC-BY 3.0 License.

8
243
Competing interests 244
The authors declare that they have no conflict of interest. 245
Acknowledgements 246
This study was possible with the support of the INfrastructure DEvelopment of Space Oceanography (INDESO) project 247
in Indonesia, and its Coral Reef Monitoring Application. Fieldwork on Bunaken Island was authorized by the research 248
permit 4B/TKPIPA/E5/Dit.KI/IV/2016 delivered by the Ministry of Research, Technology and Higher Education of the 249
Republic of Indonesia to SA. 250
251
References 252
Andréfouët, S., Pages, J., Tartinville, B.: Water renewal time for classification of atoll lagoons in the Tuamotu 253 Archipelago (French Polynesia), Coral Reefs, 20, 399-408, 2001. 254
Andréfouët, S., Ardhuin, F., Queffeulou, P., and Le Gendre, R.: Island shadow effects and the wave climate of the 255 Western Tuamotu Archipelago (French Polynesia) inferred from altimetry and numerical model data, Mar. Poll. Bull., 256 65, 415-424, 2012. 257
Anthony, K. R. N. and Kerswell, A. P.: Coral mortality following extreme low tides and high solar radiation, Marine 258 Biology, 151, 1623-1631, 2007. 259
Babcock, R.: Reproduction and development of the blue coral Heliopora coerulea (Alcyonaria: Coenothecalia), Mar. 260 Biol., 104, 475–481, 1990. 261
Baird, A.H., Pratchett, M.S., Hoey, A.S., Herdiana, Y., and Campbell, S.J.: Acanthaster planci is a major cause of coral 262 mortality in Indonesia, Coral Reefs, 32, 803–812, 2013. 263
Baker, A.C., Glynn, P.W., and Riegl, B.: Climate change and coral reef bleaching: An ecological assessment of long-264 term impacts, recovery trends and future outlook, Estuar. Coast. Shelf Sci., 80, 435–471, 2008. 265
Birol, F., and Niño, F.: Ku– and Ka-band Altimeter Data in the Northwestern Mediterranean Sea: Impact on the 266 Observation of the Coastal Ocean Variability, Mar. Geod., 38, 313–327. doi:10.1080/01490419.2015.1034814, 2015. 267
Burrage, D. M., Steinberg, C.R., Mason, L.B., and Bode, L.:Tidal corrections for TOPEX altimetry in the Coral Sea and 268 Great Barrier Reef Lagoon: Comparisons with long-term tide gauge records, J. Geophys. Res., 108(C7), 3241, 2003. 269
Brown, B. E.: Adaptations of reef corals to physical environmental stress, Advances in Marine Biology, 31, 221-299, 270 1997. 271
Brown, B. E., Dunne, R. P., Scoffin, T. P., and LeTessier, M. D. A.: Solar damage in intertidal corals, Marine Ecology 272 Progress Series, 105, 219-230, 1994. 273
Christie, M.R., Tissot, B.N., Albins, M.A., Beets, J.P., Jia, Y., Ortiz, D.M., Thompson, S.E., and Hixon, M.A.: Larval 274 Connectivity in an Effective Network of Marine Protected Areas, PlosOne, 5, e15715, 2010. 275
English, S., Wilkinson, C., and Baker, V.: Survey Manual for Tropical Marine Resources, 2nd edition., ASEAN. ed. 276 Australia Marine Science Project, Living Coastal Resources, Australian Institute of Marine Science, Townsville, 277 Australia, 1997. 278
Biogeosciences Discuss., doi:10.5194/bg-2016-375, 2016Manuscript under review for journal BiogeosciencesPublished: 9 September 2016c© Author(s) 2016. CC-BY 3.0 License.

9
Fenoglio-Marc, L., Schone, T., Illigner, J., Becker, M., Manurung, P., and Khafid: Sea level change and vertical motion 279 from satellite altimetry, tide gauges and GPS in the Indonesian region, Mar. Geod., 35, 137-150, 2012. 280
Gallop, S.L., Young, I.R., Ranasinghe, R., Durrant, T.H., and Haigh, I.D.: The large-scale influence of the Great Barrier 281 Reef matrix on wave attenuation, Coral Reefs, 33, 1167-1178, 2014. 282
Glynn, P.W.: El Nino-Southern Oscillation mass mortalities of reef corals; a model of high temperature marine 283 extinctions?, Geol. Soc. Spec. Publ., 178, 117–133, 2000. 284
Goodwin, I. and Harvey, N.: Subtropical sea-level history from coral microatolls in the Southern Cook Islands, since 300 285 AD, Marine Geology, 253, 14-25, 2008. 286
Guest, J.R., Baird, A.H., Maynard, J.A., Muttaqin, E., Edwards, A.J., Campbell, S.J., Yewdall, K., Affendi, Y.A., and 287 Chou, L.M.: Contrasting patterns of coral bleaching susceptibility in 2010 suggest an adaptive response to thermal stress, 288 PlosOne, 7, e33353, 2012. 289
Hoegh-Guldberg, O.: Climate change, coral bleaching and the future of the world’s coral reefs, Mar. Freshw. Res., 50, 290 839–866, 1999. 291
Hoeksema, B.: Delineation of the Indo-Malayan centre of maximum marine biodiversity: The Coral Triangle. In: 292 Renema, W. (Ed.), Biogeography, Time, and Place: Distributions, Barriers, and Islands. Springer, pp. 117-178, 2007. 293
Hopley, D.: Climate change: impact of sea level rise on reef flat zonation and productivity. In: Encyclopedia of modern 294 coral reefs. Structure, form and process, Hopley, D. (Ed.), Springer, Berlin, 2011. 295
Johan, O., Bengen, D.G., Zamani, N.P., Suharsono, Smith, D., Lusiastuti, and A.M., Sweet, M.J.: Microbial community 296 of black band disease on infection, healthy, and dead part of scleractinian Montipora sp. colony at Seribu Islands, 297 Indonesia, Indonesian Aquaculture Journal, 9, 1-11, 2014. 298
Lowe, R., Pivan, X., Falter, J., Symonds, G., and Gruber, R.: Rising sea levels will reduce extreme temperature 299 variations in tide-dominated reef habitats, Science Advances, 2, e1600825, 2016. 300
Luu, Q.H., Tkalich, P., and Tay, T.W.: Sea level trend and variability around Peninsular Malaysia, Ocean Sci., 11, 617–301 628, 2015 302
McPhaden, M.J.: El Niño and La Niña: Physical Mechanisms and Climate Impacts. In: The Impact of Environmental 303 Variability on Ecological Systems. D. A. Vasseur and K. S. McCann (Eds.). Springer, New York, p. 1-16, 2007. 304
Meltzner, A. J., Sieh, K., Abrams, M., Agnew, D. C., Hudnut, K. W., Avouac, J. P., and Natawidjaja, D. H.: Uplift and 305 subsidence associated with the great Aceh-Andaman earthquake of 2004, Journal of Geophysical Research-Solid Earth, 306 111, B02407, 2006. 307
Neumann, Macintyre, I.G.: Reef response to sea level rise: keep-up, catch-up or give-up? Proc. of the 5th Int. Coral Reef 308 Congress, Tahiti, 3-105-110, 1985. 309
Ray, R., Egbert, G., and Erofeeva, S.: A brief overview of tides in the Indonesian Seas, Oceanography, 18, 74-79, 2005. 310
Schiermeier, Q.: Hunting the Godzilla El Niño, Nature, 526, 490–491, 2015. 311
Scopélitis, J., Andréfouët, S., Phinn, S., Done, T., and Chabanet, P.: Coral colonisation of a shallow reef flat in response 312 to rising sea level: quantification from 35 years of remote sensing data at Heron Island, Australia, Coral Reefs, 30, 951-313 965, 2011. 314
Smithers, S. G. and Woodroffe, C. D.: Microatolls as sea-level indicators on a mid-ocean atoll, Marine Geology, 168, 315 61-78, 2000. 316
Suharsono.: Ecological and physiological implications of coral bleaching at Pari Island, Thousand Islands, Indonesia 317 (Electronic Thesis or Dissertation). University of Newcastle Upon Tyne, 1990. 318
Tartinville, B. and Rancher, J.: Wave-induced flow over Mururoa atoll reef, Journal of Coastal Research, 16, 776-781, 319 2000. 320
Biogeosciences Discuss., doi:10.5194/bg-2016-375, 2016Manuscript under review for journal BiogeosciencesPublished: 9 September 2016c© Author(s) 2016. CC-BY 3.0 License.

10
Teneva, L., Karnauskas, M., Logan, C., Bianucci, L., Currie, J., and Kleypas, J.: Predicting coral bleaching hotspots: The 321 role of regional variability in thermal stress and potential adaptation rates, Coral Reefs, 31, 1-12, 2012. 322
Verron, J., Sengenes, P., Lambin, J., Noubel, J., Steunou, N., Guillot, A., Picot, N., Coutin-Faye, S., Sharma, R., Gairola, 323 R.M., Raghava Murthy, D.V.A., Richman, J.G., Griffin, D., Pascual, A., Rémy, F., and Gupta, P.K.: The SARAL/AltiKa 324 Altimetry Satellite Mission, Mar. Geod., 38, 2–21, 2015. 325
Wouthuyzen, S., Abrar, M., and Lorwens, J.: Pengungkapan Kejadian Pemutihan Karang Tahun 2010 di Perairan 326 Indonesia Melalui Analisis Suhu Permukaan Laut, Oseanologi Dan Limnol. Indones., 1, 305–327, 2015. 327
Yasuda, N., Abe, M., Takino, T., Kimura, M., Lian, C., Nagai, S., Nakano, Y., and Nadaoka, K.: Large-scale mono-328 clonal structure in the north peripheral population of blue coral, Heliopora coerulea, Mar. Genomics, 7, 33–35, 2012. 329
Biogeosciences Discuss., doi:10.5194/bg-2016-375, 2016Manuscript under review for journal BiogeosciencesPublished: 9 September 2016c© Author(s) 2016. CC-BY 3.0 License.
11
Tabl
e 1:
Mor
talit
y ra
tes
(mea
n ±
stan
dard
dev
iatio
n, n
=6)
of a
ll co
rals
for
the
6 re
ef f
lat s
ites.
The
thre
e do
min
ant s
peci
es w
ere
Pori
tes
lute
a, H
elio
pora
33
0 co
erul
ea, a
nd G
onia
stre
a m
inut
a. S
ever
al s
peci
es a
nd g
enus
wer
e fo
und
only
onc
e. S
tand
ard
devi
atio
n is
not
sho
wn
whe
n on
ly o
ne m
easu
rem
ent p
er ty
pe o
f 33
1 co
ral c
ould
be
achi
eved
(i.e
., on
e co
lony
per
site
). 33
2
33
3
Cor
al
Pori
tes
lute
a
Hel
iopo
ra
Gon
iast
rea
Acr
opor
a G
alax
ea
Cyp
hast
rea
Mon
tipor
a Po
rite
s
cylin
dric
a
Lobo
phyl
lia
Poci
llopo
ra
Mea
n
1 44
±36
52±2
4
42±4
0
46
2 39
±16
18±8
10
0±0
100
57
3 54
±5
10
0±0
100±
0 10
0 10
0
58
4 20
±17
10
0 25
10
0
55
5 61
±13
29±1
8
67
100±
0
85
Site
6 52
±23
70±8
46
±51
10
0
47
M
ean
44
42
82
45
89
100
100
42
100
100
58
33
4
Biogeosciences Discuss., doi:10.5194/bg-2016-375, 2016Manuscript under review for journal BiogeosciencesPublished: 9 September 2016c© Author(s) 2016. CC-BY 3.0 License.

12
335
Figure 1: Bunaken reef flats. A: a living Heliopora coerula (blue coral) community in 2015 in a 336
keep-up position relative to mean low sea level, with almost all the space occupied by corals. In that 337
case, a 15-cm sea level fall will impact most of the reef flat. B: Healthy Porites lutea (yellow and 338
pink massive corals) reef flat colonies in May 2014 observed at low spring tide. The upper part of 339
colonies is above water, yet healthy. C: Same colonies in February 2016. The white line visualizes 340
tissue mortality limit. Large Porites colonies (P1, P2) at low tide levels in 2014 are affected, while 341
lower colonies (P3) are not. D: P1 colony in 2014. E: viewed from another angle, P1 colony in 342
February 2016. E: Reef flat community with scattered Heliopora colonies in February 2016, with 343
tissue mortality and algal turf overgrowth. 344
Biogeosciences Discuss., doi:10.5194/bg-2016-375, 2016Manuscript under review for journal BiogeosciencesPublished: 9 September 2016c© Author(s) 2016. CC-BY 3.0 License.

13
345
Figure 2: Top: Bunaken location. Sulawesi is the large island in grey. Middle: The yellow area 346
shows where coral mortality occurred around Bunaken reef flats, with the position of six sampling 347
stations. Dark areas between the yellow mask and the land are seagrass beds. Blue-cyan areas are 348
slopes and reef flats without mortality. Bottom: Mortality rates for the 6 sites for two dominant 349
species Porites lutea and Heliopora coerulea. The latter is not found on Sites 3 and 4. 350
351
Biogeosciences Discuss., doi:10.5194/bg-2016-375, 2016Manuscript under review for journal BiogeosciencesPublished: 9 September 2016c© Author(s) 2016. CC-BY 3.0 License.

14
352
Figure 3: Time series of ADT, minus the mean over the 1993-2016 period, for Bunaken Island (top), North 353 Sulawesi (middle), and Indonesia (bottom). The corresponding spatial domains are shown Figure 5. El Nino 354 periods (http://www.cpc.ncep.noaa.gov/products/analysis_monitoring/ensostuff/ensoyears.shtml) are depicted 355 with light shadings. The September 2015 minimum corresponds to a 8 cm fall compared to the minima the 356 four previous years, and a 14 cm fall compared to the 1993-2016 mean. The 1998 El Niño displays the largest 357 sea level fall. 358
Biogeosciences Discuss., doi:10.5194/bg-2016-375, 2016Manuscript under review for journal BiogeosciencesPublished: 9 September 2016c© Author(s) 2016. CC-BY 3.0 License.

15
359
Figure 4: Top: Map of along-track SLA trend (in cm.year-1), 2013-2016, for the north Sulawesi area. 360
The position of Bunaken Island is shown (BNK). Bottom: Map of along-track SLA trend (1-Hz), 361
2013-2016, for Indonesia. The domain on the top panel is the rectangle in the Indonesia map. 362
Biogeosciences Discuss., doi:10.5194/bg-2016-375, 2016Manuscript under review for journal BiogeosciencesPublished: 9 September 2016c© Author(s) 2016. CC-BY 3.0 License.

16
363
Figure 5: Top: Map of the 2005-2014 Absolute Dynamic Topography (ADT, in centimeters) average 364
over Indonesia. Middle: Map of the September 2015 ADT mean value over Indonesia. The two 365
squares indicate the domain just around Bunaken Island (arrow on top panel) and the north Sulawesi 366
domain used for the ADT time-series presented in Figure 3. Bottom: Map of correlation between 367
ADT and the Nino3-4 index (1993-2016, monthly average minus seasonal cycle). 368
Biogeosciences Discuss., doi:10.5194/bg-2016-375, 2016Manuscript under review for journal BiogeosciencesPublished: 9 September 2016c© Author(s) 2016. CC-BY 3.0 License.