Embed Size (px)
Citation preview

CORAL REEFS
Climate change disables coralbleaching protection on the GreatBarrier ReefTracy D. Ainsworth,1*† Scott F. Heron,2,3* Juan Carlos Ortiz,4,5* Peter J. Mumby,4,5
Alana Grech,6 Daisie Ogawa,1,7 C. Mark Eakin,2 William Leggat1,7*
Coral bleaching events threaten the sustainability of the Great Barrier Reef (GBR). Here weshow that bleaching events of the past three decades have been mitigated by inducedthermal tolerance of reef-building corals, and this protective mechanism is likely to be lostunder near-future climate change scenarios. We show that 75% of past thermal stressevents have been characterized by a temperature trajectory that subjects corals to aprotective, sub-bleaching stress, before reaching temperatures that cause bleaching. Suchconditions confer thermal tolerance, decreasing coral cell mortality and symbiont lossduring bleaching by over 50%. We find that near-future increases in local temperature ofas little as 0.5°C result in this protective mechanism being lost, which may increase therate of degradation of the GBR.
In the past three decades, bleaching eventshave caused reef-wide declines in coral acrosstheGreat Barrier Reef (GBR) (1). Coral bleach-ing is a stress response that results in theloss of intracellular symbiotic dinoflagel-
lates (Symbiodinium) and/or their photosyntheticpigments; on a broad spatial scale, bleachingresults from extended warm periods (1). Thefrequency and intensity of such bleaching eventsare expected to increase as sea surface tem-perature (SST) continues to rise under climate
change (2, 3). Acclimatization and adaptation tofuture temperature conditions have been sug-gested asmechanisms by which corals may with-stand increasing SST, reducing the severity ofcoral bleaching and ameliorating mortality (4–6).Although the extent of adaptation remains un-certain (7), processes of acclimatization have beenstudied empirically. An important driver of ther-mal acclimatization in any organism is the var-iance of temperature to which it is exposed (8).Sub-lethal pre-stress events reset physiological
and molecular mechanisms that underpin theinnate stress response, and provide a means tosurvive subsequent stress events (9). However,the influence of pre-stress events on thermaltolerance is not well understood in marine eco-systems.Herewe show that such pre-stress eventsdo occur on the GBR and serve to increase phys-iological preparation for the intense thermalstress that results in coral bleaching. We provideexperimental evidence to show that this mecha-nism has probably reduced the impact of his-torical bleaching events, and we predict that suchprotective pre-stress events coulddisappearwithina few decades.To quantify the thermal regimes that GBR
corals have experienced, we examined 27 years ofsatellite-based SST records (at a resolution of0.5°) and found that 372 thermal stress events,capable of causing bleaching, occurred across 115reef pixels (10). We identified three thermal tra-jectories associated with past bleaching events,
RESEARCH | REPORTS
338 15 APRIL 2016 • VOL 352 ISSUE 6283 sciencemag.org SCIENCE
1Australian Research Council Centre of Excellence for CoralReef Studies, James Cook University, Townsville 4810,Australia. 2Coral Reef Watch, U.S. National Oceanic andAtmospheric Administration (NOAA), College Park, MD20740, USA. 3Marine Geophysical Laboratory, College ofScience, Technology and Engineering, James CookUniversity, Townsville 4811, Australia. 4Marine SpatialEcology Lab, School of Biological Sciences, University ofQueensland, Brisbane 4072, Australia. 5Australian ResearchCouncil Centre of Excellence for Coral Reef Studies,University of Queensland, Brisbane 4072, Australia.6Department of Environmental Sciences, MacquarieUniversity, Sydney 2109, Australia. 7The College of PublicHealth, Medical and Veterinary Sciences, James CookUniversity, Townsville 4810, Australia.*These authors contributed equally to this work. †Correspondingauthor. E-mail: [email protected]
Fig. 1. Sea temperature trajectories before and during coral bleachingstress eventson theGBR. (A) Schematic of the three temperature trajectorieson the GBR during previous (the past 27 years) bleaching level thermalanomalies, where SSTreached the local bleaching threshold, 2°C above the localMMM baseline. (Top, blue line) protective trajectory; (middle, red line) singlebleaching trajectory; and (bottom, green line) repetitive bleaching trajectory.The black line represents diurnal temperature variation; the colored lines reflectthe nighttime-only satellite data. The pre-stress period (PS) is the duration of
the pre-stress pulse exceeding the MMM; the recovery period (RP) is the durationbelow the MMM after the pulse. The horizontal axis spans 90 days. (B) Thepredominant trajectory for each reef pixel (n = 115) is shown by color as for (A),except that green shows equal incidence of repetitive and protective trajec-tories (no pixels were predominated by the repetitive trajectory). Black pixelsindicate that the local bleaching threshold (MMM+2°C) was never reached.Thehistogram (inset) shows the frequency of the predominant trajectories for reefpixels (table S2).
on August 8, 2020
http://science.sciencem
ag.org/D
ownloaded from

characterized by the presence and intensity of apre-stress (sub-bleaching) warming period (Fig.1A and fig. S1). Warming events were quantifiedrelative to two thresholds: (i) the long-termmaximum monthly mean (MMM) temperature,which sets a baseline from which warming canbe identified; and (ii) the local coral bleachingthreshold (MMM+2°C) (11). The predominanttrajectory, accounting for 75% of thermal stressevents (n = 277), was characterized by an SSTevent that exceeded the local MMM but re-mained below the bleaching threshold. The SSTthen returned below the MMM, for an averagerecovery period of 10 days, before increasingabove the local bleaching threshold (Fig. 1A andtable S1); we term this the protective trajectory.The second trajectory was characterized by adirect SST increase from below the MMM toexceed the local bleaching threshold, with no
pre-stress or recovery period. This trajectory,which we term the single bleaching trajectory,occurred in 20% (n = 77) of thermal stress events(Fig. 1, A and B). The final trajectory exceeded thelocal bleaching threshold in two peaks, separatedby an average recovery period of 9 days below thelocal MMM (Fig. 1, A and B, and table S1). Weterm this the repetitive bleaching trajectory, andit accounted for 5% (n = 18) of identified thermalstress events on the GBR (Fig. 1B).Having identified three thermal trajectories in
situ, we studied the physiological response ofcorals to each temperature trajectory under ex-perimental conditions, using the model speciesAcropora aspera (10). Corals exposed to the pro-tective trajectory underwent characteristic al-terations (12–15) of the symbiotic organisms’photochemistry and heat stress responses thatled to the acquisition of thermal tolerance and
reduced bleaching and coral cell death (Fig. 2).Cell death is a conserved response to thermalstress and represents the cellular driver of partial-and whole-colony mortality (16). Using a multi-variate analysis, we showed that the differenttemperature trajectories result in distinct expres-sion profiles of stress-related genes during coralbleaching (Fig. 2A and tables S7 and S8). Spe-cifically, the gene expression of corals under theprotective trajectory differed significantly fromthat under both the single bleaching (P = 0.03)and repetitive bleaching (P = 0.02) trajectories,and was more similar to that found in corals notexposed to thermal stress (Fig. 2A). Gene ex-pression in the single bleaching and repetitivebleaching trajectories was indistinguishable (P =0.422). These gene expression profiles were as-sociated with lower levels of localized cell deathunder the protective trajectory (30 ± 4% of cells)than either the single bleaching trajectory (56 ±4%) or repetitive bleaching trajectory (70 ± 2%)(Fig. 2B, C). In addition, the extent of bleaching(Symbiodinium loss) was less (P < 0.01) in coralsexposed to the protective than either of the othertwo trajectories (Fig. 2B and table S6). In short,corals and their endosymbiotic Symbiodiniumacquired thermal tolerance after exposure to thesublethal, pre-stress protective trajectory thathas predominated throughout the GBR over thepast 27 years. However, corals experiencing thesingle bleaching and repetitive bleaching trajec-tories did not acquire thermal tolerance, whichresulted in poorer physiological outcomes and agreater loss of symbionts and coral tissue duringcoral bleaching.Given that sea temperatures are steadily rising,
an obvious concern is that the sub-bleachingtemperature event of the protective trajectorycould eventually exceed the bleaching threshold,switching events frombeingprotective to becomingincreasingly lethal. To examine how climate changeis projected to alter our three bleaching trajecto-ries, we applied temperature offsets to the ob-served 27-year time series of SST (10), whichimplicitly incorporates spatially variable interan-nual variation andENSO events (Fig. 3, A to T).Wetook this approach because climate model pre-dictions are incapable of resolving meaningfulspatial variation in the rate of warming acrossthe GBR (17). This approach was validated by thecorrelation between historical annual maximumSST and summer-average SST [linear regressionslope = 0.98, coefficient of determination (r2) =0.82], which supports the hypothesis that all sum-mer temperatures will increase consistently (fig.S2). Moreover, the drivers of SST pulsing (windspeed, solar radiation, and tidal flow; see the sup-plementary text) are expected to exhibit less thana 2% change by 2100 under most climate models(18). Our simulations project that if SST increasesby +2°C, as could occur by 2100 under currentwarming trajectories, the number of thermalstress events will increase (Fig. 3, A to E). Withinthese, the proportion of events benefiting fromthe protective trajectory falls by two-thirds, from75% (historical) to only 22% (Fig. 3, F to J).Concurrently, the proportion of single bleaching
SCIENCE sciencemag.org 15 APRIL 2016 • VOL 352 ISSUE 6283 339
Fig. 2. Effects of temperature trajectories on cell death and Symbiodinium cell density ofA. aspera at bleaching. (A) Principal coordinate ordination plot of the gene expression patternsof the apopotic genes (Bcl-2, Bak, Bok, Bax, Bak, BI, and BIR) under ambient conditions (no thermalstress; white) and the three temperature trajectories: protective (blue), single bleaching (red), and repetitivebleaching (green). Each point represents an individual coral. PC01, principal coordinate ordination axis 1;PC02, principal coordinate ordination axis 2. (B) Coral cell death (bars) and Symbiodinium density (lines) atbleaching; colors are as for (A). (C to F) In situ end labeling of coral tissue exposed to (C) ambientconditions and the (D) protective, (E) single bleaching, and (F) repetitive bleaching trajectories. Healthyhaematoxylin-counterstained nuclei are stained blue, In situ end-labeled nuclei undergoing cell death arestained red.
RESEARCH | REPORTSon A
ugust 8, 2020
http://science.sciencemag.org/
Dow
nloaded from

trajectory events will increase from 21% (Fig. 3, Kand L) to 71% (Fig. 3, K and O), implying thatthermal stress events become far more lethal forcorals. The proportion of repetitive bleaching didnot dramatically increase (5 to 7%), but the ab-solute number increased from 18 to 219 reefpixels experiencing this temperature regime overa 10-year period (Fig. 3, P to T, and table S2).We predict that most of the reefs that have
only experienced the protective trajectory to date(gray in Fig. 3, L and Q) will begin to experiencethe single and repetitive bleaching trajectorieswhen SST is approximately 0.5°C higher thanpresent (Fig. 3, M and R, and insets in H, M, andR), which will be within 4 decades at historicalwarming rates (19). The sensitivity of reefs tosuchwarming varies geographically (Fig. 3, H,M,and R). For example, reefs in the southern GBRcould experience more single bleaching trajec-tory events at lower temperature increases thanelsewhere on the GBR (Fig. 3, L to O). Once thereis a 1°C increase in SST, the majority of reefs are
likely to experience single trajectory bleaching atleast once per decade (Fig. 3, D and N).The prevalence of an SST trajectory on the
GBR that can stimulate thermal tolerance hasnot previously been recognized, nor has the ef-fect of this induced tolerance on mitigatingbleaching events been examined. Acroporid co-rals, such as A. aspera used here, are some of themost important taxa in driving rapid recoveryand resilience in Pacific coral reefs (3). We there-fore integrated our experimental results into avalidated simulation model for GBR coral com-munities (3) and evaluated how corals wouldfare under contrasting emissions scenarios beingconsidered by the Intergovernmental Panel onClimate Change: business-as-usual representativeconcentration pathway 8.5 (RCP8.5) (20) and alow-carbon economy in which CO2 concentra-tions are limited to a peak of 450 parts permillionby 2040, RCP2.6 (21). We used the relative pro-portions of dead cells within corals that occurredafter experimental exposure to the three SST tra-
jectories (Fig. 2B) as a proxy for estimating theextent of coral colony mortality during each typeof thermal stress event (10). Under business-as-usual (high) carbon emissions, the long-term out-lookof reefswas bleak, irrespective of their currentthermal trajectory (Fig. 4, A, C, and E); coral coverbecame low (<5%) toward the end of the century.However, the protective trajectory delayed theonset of this condition by approximately 20 years,which may yet prove to be evolutionarily signifi-cant.Moving to aggressive action to reduce green-house gas emissions, the outlook for reefs was farbetter, particularly on reefs experiencing theprotective trajectory, where no net long-termdecline was predicted (Fig. 4B). However, evenunder aggressive action, coral cover on reefsexposed to the single and repetitive bleachingtrajectories will fall below 5% (Fig. 4, D and F).Although our ecosystemmodel now allows for
processes of thermal acclimatization, it does notprovide for adaptation, mostly because the ratesand mechanisms of adaptation in corals remain
340 15 APRIL 2016 • VOL 352 ISSUE 6283 sciencemag.org SCIENCE
Fig. 3. Projected changes in the frequency of thermal stress events,and SST trajectories, with +0.5°C, +1.0°C, and +2.0°C SST warming.Stress event frequency at 50-km reef pixels (A) averaged across the GBR;and spatial distribution under (B) recent conditions, and (C) +0.5°C, (D)+1.0°C, and (E) +2.0°C projections. Proportions of events from each tra-jectory are as follows: (F to J) protective, (K to O) single bleaching, (P to T)
repetitive bleaching. Inset histograms show the percentage of reef pixels(vertical axis) with [(B) to (E)] bleaching frequency per decade (horizontalaxis) or [(G) to (J), (L) to (O), and (Q) to (T)] trajectory frequency(horizontal axis) for each projected warming. Black pixels in (B), (G), (L),and (Q) indicate that no severe stress events occurred (not present inprojected warming).
RESEARCH | REPORTSon A
ugust 8, 2020
http://science.sciencemag.org/
Dow
nloaded from

uncertain (7). Adaptation may mitigate the im-pact of climate change and improve the chancesof coral reef ecosystem recovery (4, 6, 22–24).Reefs of the GBR experience a variety of dis-
turbances, only some of which are subject tomanagement interventions. Our analysis revealsthat the exposure to sub-lethal pre-stress eventsvaries dramatically among reefs, with some hav-ing an inherent level of “protection from” or“preparedness for” the conditions that inducecoral bleaching, whereas others experience mul-tiple stress exposures in a single event. Recogniz-ing such spatial variability is important whentargeting management actions that aim to mit-igate coral reef degradation in the future. Forexample, local management interventions thatreduce cumulative stress impacts (such as im-pacts caused by pollution, sedimentation, andcrown-of-thorns starfish outbreaks) could be pri-oritized toward reefs that exhibit protective tra-
jectories, thereby serving to minimize biologicaland physical stressors simultaneously and help-ing to build ecosystem resilience.
REFERENCES AND NOTES
1. G. De’ath, J. M. Lough, K. E. Fabricius, Science 323, 116–119(2009).
2. R. van Hooidonk, J. A. Maynard, S. Planes, Nat. Clim. Change 3,508–511 (2013).
3. J. C. Ortiz, Y.-M. Bozec, N. H. Wolff, C. Doropoulos,P. J. Mumby, Nat. Clim. Change 4, 1090–1094 (2014).
4. J. M. Pandolfi, S. R. Connolly, D. J. Marshall, A. L. Cohen,Science 333, 418–422 (2011).
5. C. R. Voolstra et al., PLOS One 6, e20392(2011).
6. S. R. Palumbi, D. J. Barshis, N. Traylor-Knowles, R. A. Bay,Science 344, 895–898 (2014).
7. P. J. Mumby, R. van Woesik, Curr. Biol. 24, R413–R423(2014).
8. J. J. Ruel, M. P. Ayres, Trends Ecol. Evol. 14, 361–366(1999).
9. D. B. Berry, A. P. Gasch, Mol. Biol. Cell 19, 4580–4587(2008).
10. Materials and methods are available as supplementarymaterials on Science Online.
11. E. T. Game, M. E. Watts, S. Wooldridge, H. P. Possingham, Ecol.Appl. 18, 670–680 (2008).
12. D. J. Barshis et al., Proc. Natl. Acad. Sci. U.S.A. 110, 1387–1392(2013).
13. A. J. Bellantuono, C. Granados-Cifuentes, D. J. Miller,O. Hoegh-Guldberg, M. Rodriguez-Lanetty, PLOS One 7,e50685 (2012).
14. T. D. Ainsworth et al., Sci. Rep. 1, 160 (2011).15. A. J. Bellantuono, O. Hoegh-Guldberg, M. Rodriguez-Lanetty,
Proc. Biol. Sci. 279, 1100–1107 (2012).16. D. Tchernov et al., Proc. Natl. Acad. Sci. U.S.A. 108,
9905–9909 (2011).17. L. Kwiatkowski, P. J. Halloran, P. Mumby, D. Stephenson, Clim.
Dyn. 43, 1483–1496 (2014).18. D. L. Hartmann et al., The Physical Science Basis. Contribution
of Working Group I to the Fifth Assessment Report of theIntergovernmental Panel on Climate Change (Cambridge Univ.Press, 2013).
19. J. M. Lough, J. Environ. Monit. 10, 21–29 (2008).20. K. Riahi et al., Clim. Change 109, 33–57 (2011).21. D. van Vuuren et al., Clim. Change 109, 95–116 (2011).22. C. A. Logan, J. P. Dunne, C. M. Eakin, S. D. Donner, Glob.
Change Biol. 20, 125–139 (2014).
SCIENCE sciencemag.org 15 APRIL 2016 • VOL 352 ISSUE 6283 341
Fig. 4. Coral cover simulations under high (A, C, and E) and low (B, D, and F) CO2 emission scenarios (RCP8.5 and RCP2.6).This incorporates differentialmortality rates associated with protective [(A) and (B)] single bleaching [(C) and (D)] and repetitive bleaching [(E) and (G)] trajectories. Colored lines representthe average coral cover among simulations; gray lines represent the trajectory of each of the 50 simulations for each scenario.
RESEARCH | REPORTSon A
ugust 8, 2020
http://science.sciencemag.org/
Dow
nloaded from
23. P. L. Munday, R. R. Warner, K. Monro, J. M. Pandolfi,D. J. Marshall, Ecol. Lett. 16, 1488–1500 (2013).
24. B. M. Riegl, S. J. Purkis, A. S. Al-Cibahy, M. A. Abdel-Moati,O. Hoegh-Guldberg, PLOS One 6, e24802 (2011).
ACKNOWLEDGMENTS
The authors thank the following funding bodies: AustralianResearch Council Discovery Program grant DP130101421 (awardedto W.L. and T.D.A.); Australian Research Council Super ScienceProgram grant FS110200046 (awarded to Terry P. Hughes,Director, Australian Research Council Centre of Excellence forCoral Reef Studies); Australian Research Council Centre ofExcellence for Coral Reef Studies grant CE0561435; the GreatBarrier Reef Foundation (Coral Health Grant); the NOAA NationalEnvironmental Satellite, Data, and Information Service; and theNOAA Coral Reef Conservation Program. The authors thankN. Wolff for providing SST projections and help in analysis of
ecosystem model components and M. De Freitas Prazeres for cellcounts. The contents in this manuscript are solely the opinions ofthe authors and do not constitute a statement of policy, decision,or position on behalf of NOAA or the U.S. government. T.D.A.,S.F.H., J.C.O., and W.L. designed the study. T.D.A., D.O., and W.L.conducted experimental procedures and physiological analyses.S.F.H. and C.M.E. conducted SST and oceanographic analyses.J.C.O. and P.J.M. conducted predictive modeling and modelvalidation. T.D.A., S.F.H., J.C.O., P.J.M., A.G., C.M.E., and W.L. wroteand finalized the manuscript. Code for the analysis of SST datais available through contact and collaboration with S. Heron([email protected]). Code for the ecosystem model isavailable through contact and collaboration with J.-C. Ortiz( [email protected]). The NOAA data and code are availablefrom a dedicated web page: http://coralreefwatch.noaa.gov/publications/AinsworthEtAl_2016.php. All data and code areavailable at FigShare project number 12040: Ecosystems
model code and scripts (DOI 10.6084/m9.figshare.3081127);Bleaching on the GBR data release (DOI 10.6084/m9.figshare.3081127); Physiology and gene expression data (DOI 10.6084/m9.figshare.3081064). D.O. is currently employed by BoehringerIngelheim, Fremont, CA. The authors declare no competingfinancial interests.
SUPPLEMENTARY MATERIALS
www.sciencemag.org/content/352/6283/338/suppl/DC1Materials and MethodsSupplementary TextFigs. S1 to S8Tables S1 to S8
10 September 2015; accepted 10 March 201610.1126/science.aac7125
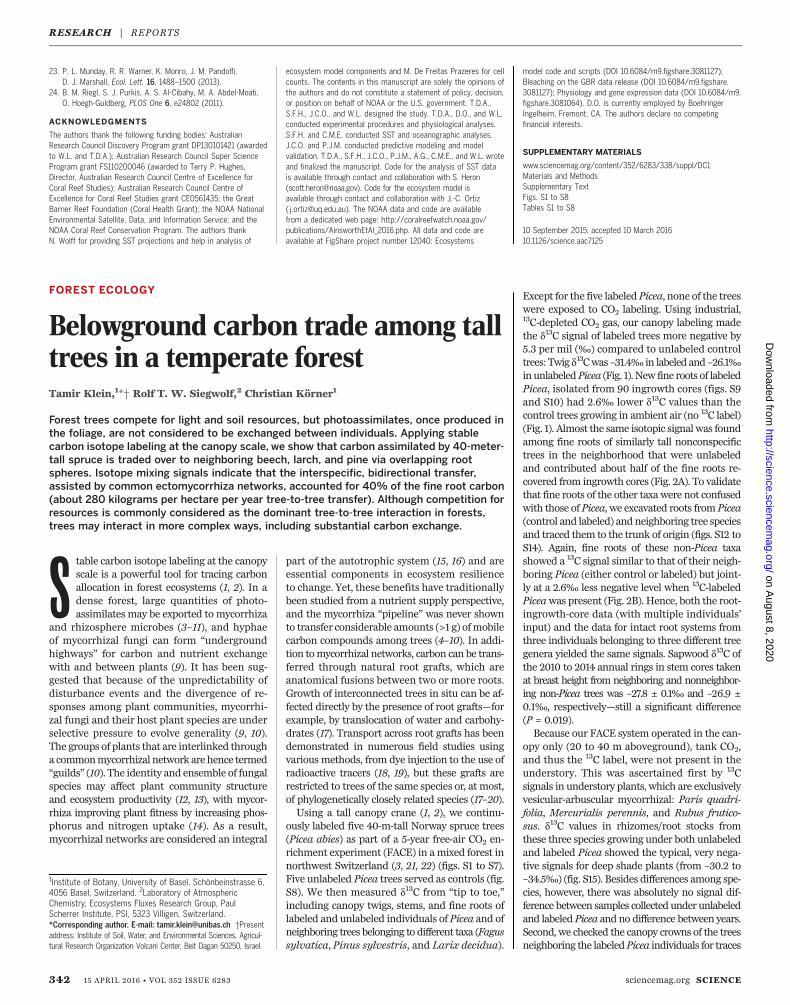
FOREST ECOLOGY
Belowground carbon trade among talltrees in a temperate forestTamir Klein,1*† Rolf T. W. Siegwolf,2 Christian Körner1
Forest trees compete for light and soil resources, but photoassimilates, once produced inthe foliage, are not considered to be exchanged between individuals. Applying stablecarbon isotope labeling at the canopy scale, we show that carbon assimilated by 40-meter-tall spruce is traded over to neighboring beech, larch, and pine via overlapping rootspheres. Isotope mixing signals indicate that the interspecific, bidirectional transfer,assisted by common ectomycorrhiza networks, accounted for 40% of the fine root carbon(about 280 kilograms per hectare per year tree-to-tree transfer). Although competition forresources is commonly considered as the dominant tree-to-tree interaction in forests,trees may interact in more complex ways, including substantial carbon exchange.
Stable carbon isotope labeling at the canopyscale is a powerful tool for tracing carbonallocation in forest ecosystems (1, 2). In adense forest, large quantities of photo-assimilates may be exported to mycorrhiza
and rhizosphere microbes (3–11), and hyphaeof mycorrhizal fungi can form “undergroundhighways” for carbon and nutrient exchangewith and between plants (9). It has been sug-gested that because of the unpredictability ofdisturbance events and the divergence of re-sponses among plant communities, mycorrhi-zal fungi and their host plant species are underselective pressure to evolve generality (9, 10).The groups of plants that are interlinked througha commonmycorrhizal network are hence termed“guilds” (10). The identity and ensemble of fungalspecies may affect plant community structureand ecosystem productivity (12, 13), with mycor-rhiza improving plant fitness by increasing phos-phorus and nitrogen uptake (14). As a result,mycorrhizal networks are considered an integral
part of the autotrophic system (15, 16) and areessential components in ecosystem resilienceto change. Yet, these benefits have traditionallybeen studied from a nutrient supply perspective,and the mycorrhiza “pipeline” was never shownto transfer considerable amounts (>1 g) ofmobilecarbon compounds among trees (4–10). In addi-tion tomycorrhizal networks, carbon can be trans-ferred through natural root grafts, which areanatomical fusions between two or more roots.Growth of interconnected trees in situ can be af-fected directly by the presence of root grafts—forexample, by translocation of water and carbohy-drates (17). Transport across root grafts has beendemonstrated in numerous field studies usingvarious methods, from dye injection to the use ofradioactive tracers (18, 19), but these grafts arerestricted to trees of the same species or, at most,of phylogenetically closely related species (17–20).Using a tall canopy crane (1, 2), we continu-
ously labeled five 40-m-tall Norway spruce trees(Picea abies) as part of a 5-year free-air CO2 en-richment experiment (FACE) in amixed forest innorthwest Switzerland (3, 21, 22) (figs. S1 to S7).Five unlabeled Picea trees served as controls (fig.S8). We then measured d13C from “tip to toe,”including canopy twigs, stems, and fine roots oflabeled and unlabeled individuals of Picea and ofneighboring trees belonging to different taxa (Fagussylvatica, Pinus sylvestris, and Larix decidua).
Except for the five labeled Picea, none of the treeswere exposed to CO2 labeling. Using industrial,13C-depleted CO2 gas, our canopy labeling madethe d13C signal of labeled trees more negative by5.3 per mil (‰) compared to unlabeled controltrees: Twig d13Cwas –31.4‰ in labeled and –26.1‰in unlabeledPicea (Fig. 1). New fine roots of labeledPicea, isolated from 90 ingrowth cores (figs. S9and S10) had 2.6‰ lower d13C values than thecontrol trees growing in ambient air (no 13C label)(Fig. 1). Almost the same isotopic signalwas foundamong fine roots of similarly tall nonconspecifictrees in the neighborhood that were unlabeledand contributed about half of the fine roots re-covered from ingrowth cores (Fig. 2A). To validatethat fine roots of the other taxawere not confusedwith those of Picea, we excavated roots from Picea(control and labeled) and neighboring tree speciesand traced them to the trunk of origin (figs. S12 toS14). Again, fine roots of these non-Picea taxashowed a 13C signal similar to that of their neigh-boring Picea (either control or labeled) but joint-ly at a 2.6‰ less negative level when 13C-labeledPiceawas present (Fig. 2B). Hence, both the root-ingrowth-core data (with multiple individuals’input) and the data for intact root systems fromthree individuals belonging to three different treegenera yielded the same signals. Sapwood d13C ofthe 2010 to 2014 annual rings in stem cores takenat breast height from neighboring and nonneighbor-ing non-Picea trees was –27.8 ± 0.1‰ and –26.9 ±0.1‰, respectively—still a significant difference(P = 0.019).Because our FACE system operated in the can-
opy only (20 to 40 m aboveground), tank CO2,and thus the 13C label, were not present in theunderstory. This was ascertained first by 13Csignals in understory plants, which are exclusivelyvesicular-arbuscular mycorrhizal: Paris quadri-folia, Mercurialis perennis, and Rubus frutico-sus. d13C values in rhizomes/root stocks fromthese three species growing under both unlabeledand labeled Picea showed the typical, very nega-tive signals for deep shade plants (from –30.2 to–34.5‰) (fig. S15). Besides differences among spe-cies, however, there was absolutely no signal dif-ference between samples collected under unlabeledand labeled Picea and no difference between years.Second, we checked the canopy crowns of the treesneighboring the labeledPicea individuals for traces
342 15 APRIL 2016 • VOL 352 ISSUE 6283 sciencemag.org SCIENCE
1Institute of Botany, University of Basel, Schönbeinstrasse 6,4056 Basel, Switzerland. 2Laboratory of AtmosphericChemistry, Ecosystems Fluxes Research Group, PaulScherrer Institute, PSI, 5323 Villigen, Switzerland.*Corresponding author. E-mail: [email protected] †Presentaddress: Institute of Soil, Water, and Environmental Sciences, Agricul-tural Research Organization Volcani Center, Beit Dagan 50250, Israel.
RESEARCH | REPORTSon A
ugust 8, 2020
http://science.sciencemag.org/
Dow
nloaded from

Climate change disables coral bleaching protection on the Great Barrier Reef
William LeggatTracy D. Ainsworth, Scott F. Heron, Juan Carlos Ortiz, Peter J. Mumby, Alana Grech, Daisie Ogawa, C. Mark Eakin and
DOI: 10.1126/science.aac7125 (6283), 338-342.352Science
, this issue p. 338Scienceacclimation. The result has been increasing bleaching and death; notably extreme during 2016 in the wake of El Niño.organisms and resilience to thermal stress. More recently, temperature hikes have been severe and precludedorganisms. In the past, pulses of elevated temperatures that presaged hot seasons stimulated the acclimation of coral
have tracked the effects of three decades of increasing heat stress on coralet al.to climate change. Ainsworth The Australian Great Barrier Reef (GBR) is one of Earth's most extraordinary natural wonders, but it is vulnerable
Bleaching of the Great Barrier Reef
ARTICLE TOOLS http://science.sciencemag.org/content/352/6283/338
MATERIALSSUPPLEMENTARY http://science.sciencemag.org/content/suppl/2016/04/13/352.6283.338.DC1
REFERENCES
http://science.sciencemag.org/content/352/6283/338#BIBLThis article cites 22 articles, 6 of which you can access for free
PERMISSIONS http://www.sciencemag.org/help/reprints-and-permissions
Terms of ServiceUse of this article is subject to the
is a registered trademark of AAAS.ScienceScience, 1200 New York Avenue NW, Washington, DC 20005. The title (print ISSN 0036-8075; online ISSN 1095-9203) is published by the American Association for the Advancement ofScience
Copyright © 2016, American Association for the Advancement of Science
on August 8, 2020
http://science.sciencem
ag.org/D
ownloaded from


![A Stochastic Fluid Model for the Adaptive Bleaching Hypothesis€¦ · Coral bleaching Figure 3:Coral bleaching on the Great Barrier Reef [5]. Zooxanthellae are expelled from coral](https://img.pdfslide.net/doc/110x75/5f961022a2c76e1bf923204e/a-stochastic-fluid-model-for-the-adaptive-bleaching-coral-bleaching-figure-3coral.jpg)