Embed Size (px)
Citation preview
Corangamite CMA
Annual Report 2016-2017
2
TABLE OF CONTENTS
Corangamite CMA Annual Report ISSN 1441-3477.
The Corangamite CMA acknowledges the traditional custodians of the land and waters where we work and pay our respects to the Elders past and present.
SECTION 1 OUR REGION AND THE YEAR IN REVIEW 4
SECTION 2 REGIONAL CATCHMENT STRATEGY IMPLEMENTATION 10
SECTION 3 REPORTING CATCHMENT CONDITION 15
SECTION 4 MAXIMISING NATURAL RESOURCE MANAGEMENT INVESTMENT IN THE REGION 45
SECTION 5 CORANGAMITE CMA – OUR ORGANISATION, COMPLIANCE AND DISCLOSURES 51
SECTION 6 FINANCIAL STATEMENTS 63
SECTION 7 APPENDICES – KEY PERFORMANCE INDICATORS 100
TABLE OF CONTENTS
3
Corangamite CMA Annual Report 2016-2017
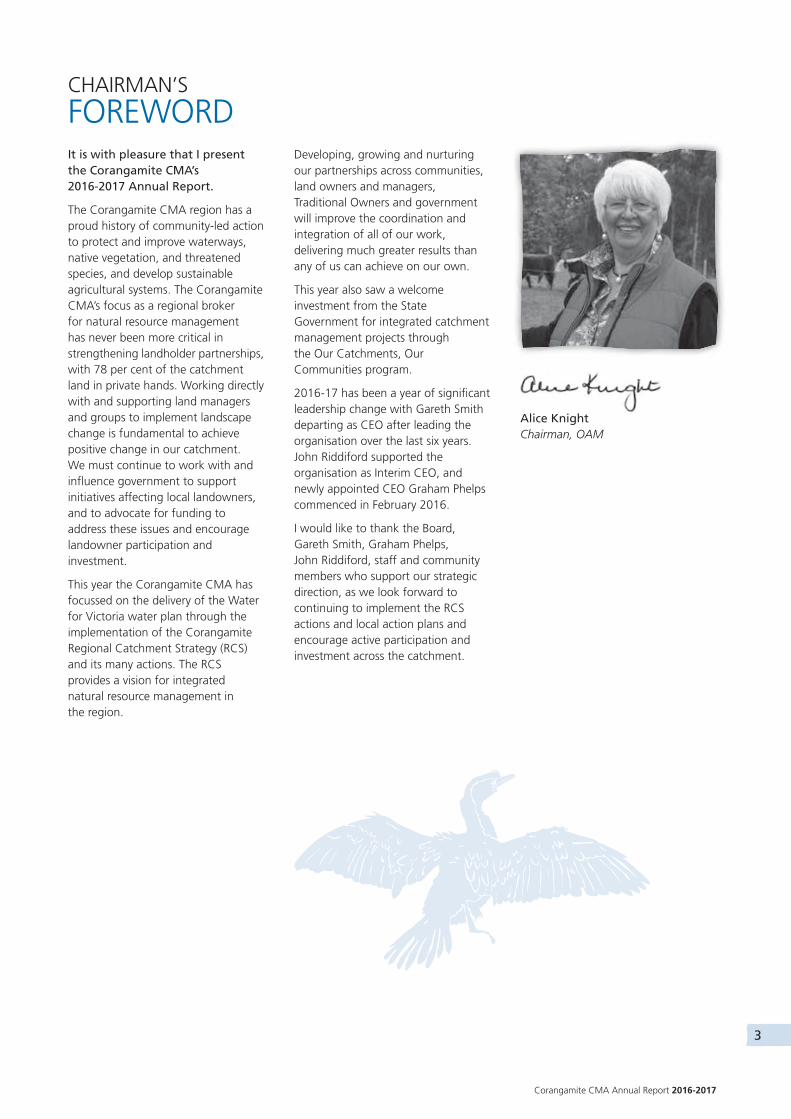
CHAIRMAN’S FOREWORDIt is with pleasure that I present the Corangamite CMA’s 2016-2017 Annual Report.
The Corangamite CMA region has a proud history of community-led action to protect and improve waterways, native vegetation, and threatened species, and develop sustainable agricultural systems. The Corangamite CMA’s focus as a regional broker for natural resource management has never been more critical in strengthening landholder partnerships, with 78 per cent of the catchment land in private hands. Working directly with and supporting land managers and groups to implement landscape change is fundamental to achieve positive change in our catchment. We must continue to work with and influence government to support initiatives affecting local landowners, and to advocate for funding to address these issues and encourage landowner participation and investment.
This year the Corangamite CMA has focussed on the delivery of the Water for Victoria water plan through the implementation of the Corangamite Regional Catchment Strategy (RCS) and its many actions. The RCS provides a vision for integrated natural resource management in the region.
Developing, growing and nurturing our partnerships across communities, land owners and managers, Traditional Owners and government will improve the coordination and integration of all of our work, delivering much greater results than any of us can achieve on our own.
This year also saw a welcome investment from the State Government for integrated catchment management projects through the Our Catchments, Our Communities program.
2016-17 has been a year of significant leadership change with Gareth Smith departing as CEO after leading the organisation over the last six years. John Riddiford supported the organisation as Interim CEO, and newly appointed CEO Graham Phelps commenced in February 2016.
I would like to thank the Board, Gareth Smith, Graham Phelps, John Riddiford, staff and community members who support our strategic direction, as we look forward to continuing to implement the RCS actions and local action plans and encourage active participation and investment across the catchment.
Alice Knight Chairman, OAM
4
SE
CT
ION
1 S
EC
TIO
N 2
SE
CT
ION
3 S
EC
TIO
N 4
SE
CT
ION
5 S
EC
TIO
N 6
SE
CT
ION
7
OUR REGION AND THE YEAR IN REVIEW
ABOUT THE CORANGAMITE CMA REGION 5
- ABOUT THE REGION 5
- FORMATION 6
- CORANGAMITE CMA’S ROLE 6
CHIEF EXECUTIVE OFFICER’S REPORT FOR 2016-17 7
HIGHLIGHTS 8
SECTION 1
OUR REGION AND THE YEAR IN REVIEW
5
Corangamite CMA Annual Report 2016-2017
SE
CT
ION
1 S
EC
TIO
N 2
SE
CT
ION
3 S
EC
TIO
N 4
SE
CT
ION
5 S
EC
TIO
N 6
SE
CT
ION
7
OTWAY COASTBASIN
LAKECORANGAMITE
BASIN
BARWON RIVERBASIN
MOORABOOLRIVERBASIN
Colac
Geelong
Ballarat
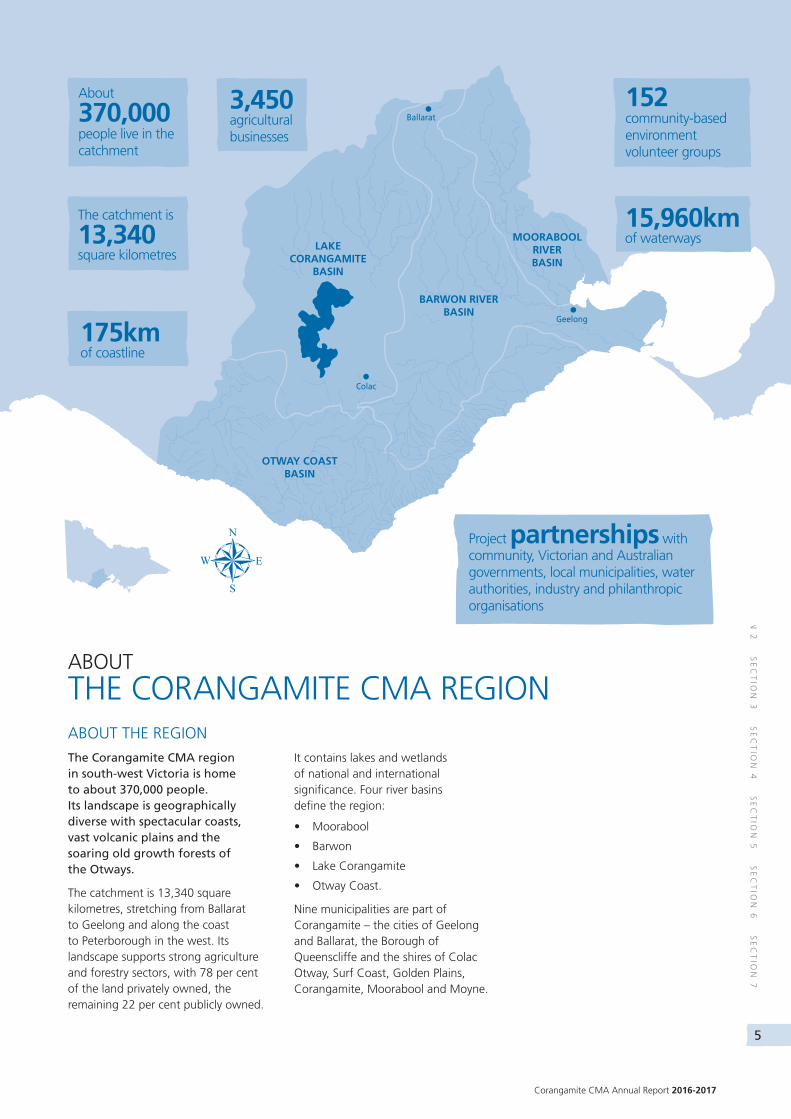
About
370,000 people live in the catchment
175kmof coastline
3,450agricultural businesses
Project partnerships with community, Victorian and Australian governments, local municipalities, water authorities, industry and philanthropic organisations
The catchment is
13,340 square kilometres
152 community-based environment volunteer groups
15,960kmof waterways
ABOUT THE REGION
The Corangamite CMA region in south-west Victoria is home to about 370,000 people. Its landscape is geographically diverse with spectacular coasts, vast volcanic plains and the soaring old growth forests of the Otways.
The catchment is 13,340 square kilometres, stretching from Ballarat to Geelong and along the coast to Peterborough in the west. Its landscape supports strong agriculture and forestry sectors, with 78 per cent of the land privately owned, the remaining 22 per cent publicly owned.
It contains lakes and wetlands of national and international significance. Four river basins define the region:
• Moorabool
• Barwon
• Lake Corangamite
• Otway Coast.
Nine municipalities are part of Corangamite – the cities of Geelong and Ballarat, the Borough of Queenscliffe and the shires of Colac Otway, Surf Coast, Golden Plains, Corangamite, Moorabool and Moyne.
ABOUT
THE CORANGAMITE CMA REGION
6
SE
CT
ION
1 S
EC
TIO
N 2
SE
CT
ION
3 S
EC
TIO
N 4
SE
CT
ION
5 S
EC
TIO
N 6
SE
CT
ION
7
OUR REGION AND THE YEAR IN REVIEW
FORMATION
The Corangamite CMA was formed by an Order in Council on 23 June 1997, to take effect from 1 July 1997, to oversee the management of land and water resources.
The Corangamite CMA’s formation was based on an understanding and commitment to the sustainable use, conservation and restoration of those resources across the Corangamite CMA region.
The Corangamite CMA is established under the Catchment and Land Protection Act 1994.
On the same date, the Otway Region Water Authority was abolished and the part pertaining to the Lough Calvert drainage district was transferred to the Corangamite CMA.
The responsible Ministers for the period:
• From 1 July 2016 to 30 July 2017 was the Hon Lisa Neville, Minister for Environment, Climate Change and Water.
• From 1 July 2016 to 30 July 2017 were the Hon Lily D’Ambrosio, Minister for Energy, Environment and Climate Change, and the Hon Lisa Neville, Minister for Water.
CORANGAMITE CMA’S ROLE
The Corangamite CMA’s role in accordance with the CaLP Act 1994 and the Water Act 1989 Statement of Obligations is to:
• review, renew and coordinate the implementation of the Regional Catchment Strategy (RCS)
• identify priority activities and programs for implementation under the RCS
• ensure community involvement in regional decision making and provide advice to the Victorian and Australian governments on priorities and allocation of resources
• work with the Department of Environment, Land Water and Planning (DELWP) to ensure work is coordinated with the Corangamite CMA and aligned with the goals of the RCS
• establish and support community committees for RCS implementation
• provide services relating to integrated waterway, floodplain and drainage management for the protection, maintenance and improvement of river health
• provide direct service provision responsibility for waterway management, floodplain management and regional drainage functions (the Corangamite CMA has these provisions under parts seven and 10 of the Water Act 1989)
• provide advice to government on regional priorities, guidelines for integrated management of resources and matters relating to catchment management, land protection and the condition of land and water resources to comply with legislative requirements.
VISION:A healthy Corangamite catchment valued by engaged communities.
ABOUT
THE CORANGAMITE CMA REGION

7
Corangamite CMA Annual Report 2016-2017
SE
CT
ION
1 S
EC
TIO
N 2
SE
CT
ION
3 S
EC
TIO
N 4
SE
CT
ION
5 S
EC
TIO
N 6
SE
CT
ION
7
CEO’S REPORT
FOR 2016-17Leading, encouraging, facilitating and coordinating effective community engagement and action in catchment management are the most important things that the Corangamite Catchment Management Authority does to help our community to achieve the vision of “a healthy Corangamite catchment valued by engaged communities”.
I am pleased that this Annual Report provides many examples of the different ways the Corangamite CMA has performed these functions over the past year.
All of our programs are developed in consultation with communities and partners, often supported by dedicated steering and advisory committees who generously give their time and knowledge to help to design and guide programs. Importantly, we have three new projects funded through the Our Catchments, Our Communities initiative funding that are bringing together community members, land owners, industry and local government to improve integrated catchment management. The Rivers 2040 project on the Moorabool will also deliver a model of integrated catchment management with environmental, economic and social outcomes.
On-ground action by landowners and community members is fundamental to catchment health and in 2016-17, the Corangamite CMA awarded 150 community grants worth more than $2 million to enable community members, land owners and other partners to deliver important catchment management activities.
A review of the first three years of our Regional Catchment Strategy was completed during the year and showed that during this period, the Corangamite CMA has delivered through land owners and community members over 40,000 ha of agricultural land practice change improvements, more than 6,000 ha of weed control, nearly 40,00 ha of vegetation management and over 150 km of fencing to protect waterways and vegetation.
It also found that 80 to 90 per cent of the Corangamite CMA’s vegetation projects have occurred in priority areas, 95 per cent of projects are protecting vulnerable or threatened vegetation communities and there are 52 threatened fauna species and 20 threatened flora species being protected across over 200 sites under contracted management.
A highlight of our Indigenous Participation Project was the Wiyn-murrup yangarramela (fire spirit come back) – joint traditional Aboriginal fire project that supported Wadawurrung Traditional Owners to work with Wathaurong Aboriginal Co-operative, Aboriginal Community, Golden Plains Shire, DELWP, the CFA, Parks Victoria and three CMAs to undertake a cultural burn at Bakers Reserve in Teesdale alongside a more typical fuel reduction burn. The learnings and the relationships from this project have been enormous.
The Corangamite CMA also supports community and land owner action by providing access to knowledge and information. The Corangamite CMA ran or supported more than 300 events to over 3,000 participants. Our partnership with CERDI at Federation University is delivering outstanding on-line tools for NRM planning, soil health and floodplain information as well as portals for Waterwatch and Estuarywatch. Farmtalk magazine and the Corangamite CMA’s Blog were launched this year, providing other tools for sharing stories and information.
Our floodplains team continued to support the eleven local governments across the region to manage effective and sustainable development providing floodplain advice on over 450 planning referrals, 350 flood advice request, and leading the councils in the preparation of a regional Floodplain strategy.
A particularly notable achievement of the year was the environmental drying of Reedy Lake for the first time in 10 years. Seven years of planning and engagement with local communities, stakeholder groups and commercial interests went into achieving this and the environmental outcomes have been outstanding.
Finally, it is worth noting that the staff of the Corangamite CMA have delivered these outstanding achievements through a time of considerable change and I would like to thank them and Gareth Smith and John Riddiford for maintaining the great work of the Corangamite CMA with local communities through that period.
Graham Phelps Chief Executive Officer
8
SE
CT
ION
1 S
EC
TIO
N 2
SE
CT
ION
3 S
EC
TIO
N 4
SE
CT
ION
5 S
EC
TIO
N 6
SE
CT
ION
7
OUR REGION AND THE YEAR IN REVIEW
HIGHLIGHTS
DURING
2016-2017...
Delivered 373 EVENTS, WORKSHOPS & FORUMS to 3,785
PARTICIPANTS
Attended 36 and provided waterway information and activities to over 3,900COMMUNITY MEMBERS
COMMUNITY EVENTS
Over $2 to support on ground works and community engagementactivities through more than 150 COMMUNITY GRANTS
MILLIONAWARDED
Provided support to partners to deliver 97 EVENTS, WORKSHOPS & FORUMS to 5,170 PARTICIPANTS
The 2017 Corangamite River Detectives school program supported
1,458STUDENTS from
40 SCHOOLS
Processed more than 800REQUESTS for flooding advice, planning referrals WORKS ON WATERWAYS PERMITS&
Corangamite CMA’s Waterwatch and EstuaryWatch programs have supported
over150 to conduct regular water quality testing to inform estuarine/catchment management
VOLUNTEERCITIZEN SCIENTISTS
9
Corangamite CMA Annual Report 2016-2017
SE
CT
ION
1 S
EC
TIO
N 2
SE
CT
ION
3 S
EC
TIO
N 4
SE
CT
ION
5 S
EC
TIO
N 6
SE
CT
ION
7
OUR CATCHMENTS, OUR COMMUNITIES
Engaging community, local government, industry groups and agency stakeholders to deliver three integrated catchment projects. Applying the innovative adaptive pathways approach to planning for climate change impacts on the Western District Lakes.
NRM PLANNING PORTAL GROWS
Four Landscape Zones have been completed on the NRM online planning portal with the remaining landscape zones expected to be completed by 2017.
NRM PLANNING FOR CLIMATE CHANGE
Through the Our Catchments, Our Communities program the Corangamite CMA commenced an innovative NRM planning process called ‘adaptation pathways’ for the Western District Lakes, the project enables multiple possible future outcomes and addresses the uncertainty of climate change.
ENVIRONMENTAL WATER
The Corangamite CMA has successfully completed a 12 month wetting and drying regime at Reedy Lake. This is the first time this has occurred since the entitlement was established in 2011. This milestone represents a significant environmental achievement in restoring an important area of Victoria’s biodiversity.
INDIGENOUS PARTICIPATION PROGRAM
Wiyn-murrup yangarramela (fire spirit come back) – joint traditional Aboriginal fire project including Traditional Owners, Wathaurong Aboriginal Co-operative and Aboriginal community members held its second cultural burn. In partnership with Golden Plains Shire, Corangamite CMA, DELWP and Parks Vic, the Wadawarrung Traditional Owners completed a traditional burn of Bakers Lane Reserve in Teesdale.
WATERWATCH AND ESTUARYWATCH PORTALS
The new Waterwatch and EstuaryWatch online portals and database have made valuable citizen science data more accessible than ever.
WATERWAY RESTORATION PARTNERSHIPS
37 landholders were awarded contracts, with 473 ha and 108 km of river frontage under active management under the waterway restoration program.
CORANGAMITE FLOOD PORTAL
The Corangamite Floodplain Portal was launched. Developed in partnership with Federation University Ballarat Campus the portal provides the community with easy access to the latest flood data and preliminary floodplain advice.
SOIL HEALTH
The Upper Barwon Landcare Network produces the first regional edition of “Farm Talk” magazine, providing landholders and local communities’ exposure to leading thinking on sustainable agriculture.
REGIONAL LANDCARE FACILITATOR
The Regional Landcare Facilitator program has delivered a highly successful series of farm resilience workshops looking at succession planning for farming families to support farmers.
BARWON THROUGH GEELONG
Construction of a 180 m long rowing landing was completed, the new landing will support the social and economic benefits provided by rowing to the Geelong community.
DRAINAGE SCHEME PROGRAM
The upgrade of the Cundare Barrage Fishway now allows thousands of native fish to leave the hypersaline waters of Lake Corangamite to obtain refuge in Cundare Pool and the Woady Yaloak River.
THE WOADY YALOAK DIVERSION AND LOUGH CALVERT DRAINAGE SCHEMES PROJECT
Operational infrastructure upgrades and maintenance works have begun on the Woady Yaloak Diversion and Lough Calvert Drainage Scheme. The extension of the boundary of the Western District Lakes Ramsar site is being explored.
10
SE
CT
ION
1 S
EC
TIO
N 2
SE
CT
ION
3 S
EC
TIO
N 4
SE
CT
ION
5 S
EC
TIO
N 6
SE
CT
ION
7
REGIONAL CATCHMENT STRATEGY IMPLEMENTATION
ABOUT THE REGIONAL CATCHMENT STRATEGY 11
CORANGAMITE RCS 2013-2019 – THE STORY SO FAR 11
HIGHLIGHTS 12
FUTURE NEEDS 14
SECTION 2
REGIONAL CATCHMENT STRATEGY IMPLEMENTATION
Corangamite CMA Annual Report 2016-2017
11
SE
CT
ION
1 S
EC
TIO
N 2
SE
CT
ION
3 S
EC
TIO
N 4
SE
CT
ION
5 S
EC
TIO
N 6
SE
CT
ION
7
ABOUT THE
REGIONAL CATCHMENT STRATEGYThe Corangamite Regional Catchment Strategy 2013-2019 (RCS) was developed over the course of 2012, under the provisions of the Catchment and Land Protection Act 1994, with substantial community input, and guidance by the Victorian Catchment Management Council and the then Department of Sustainability and Environment. In May 2013, the Strategy was approved by the Minister for Environment and Climate Change and the Minister for Water.
The Corangamite RCS is a blueprint for catchment health. It provides a strategic, integrated framework for natural resource management in the Corangamite CMA region of Victoria. The RCS recognises the strong connection between the health of the catchment and the wellbeing of the community.
It encourages greater participation and investment in the protection, enhancement and restoration of land, water and biodiversity resources in the Corangamite region.
The RCS identifies desired regional outcomes and priorities, as well as describing an approach for further inclusion of local priorities, and provides an overarching strategic framework for action.
In providing a blueprint for natural resource management of the catchment, the RCS describes:
• a vision for the Corangamite region
• an overarching catchment goal
• a strategy to achieve the goal
• four foundations for change, with objectives and actions
• natural resource management objectives and actions
• monitoring and evaluation objectives and actions.
The RCS builds on the considerable work carried out in the region under previous strategies developed in 1997 and 2003.
CORANGAMITE RCS 2013-2019
THE STORY SO FARACHIEVEMENTS AND FUTURE DIRECTION
The Corangamite CMA acknowledges the traditional custodians of the land and waters where we work and pay our respects to the Elders past and present.
The Corangamite Regional Catchment Strategy 2013-2019 provides a vision for the integrated management of natural resources in the Corangamite region. It is a blueprint for catchment health in the future and builds on the achievements and lessons from the past.
THE VISION
A healthy Corangamite catchment valued by engaged communities.
THE GOAL
Increase the protection, enhancement and restoration of valuable natural resources to improve the health and sustainable productivity of the Corangamite catchment.
The RCS is now half way through its implementation and a mid-term review has been completed to evaluate its effectiveness to date.
Whilst the major focus for the review has been on how gaps, new information and the lessons to date may impact the final three years of implementation and the RCS renewal, the review has also highlighted a range of achievements.
12
SE
CT
ION
1 S
EC
TIO
N 2
SE
CT
ION
3 S
EC
TIO
N 4
SE
CT
ION
5 S
EC
TIO
N 6
SE
CT
ION
7
REGIONAL CATCHMENT STRATEGY IMPLEMENTATION
FOUNDATIONS FOR CHANGE
“The RCS will have succeeded if it can achieve increased: participation, investment, integration and coordination (partnerships) and knowledge sharing.”
In the first three years of RCS implementation there have been a range of highlights that show significant progress towards achieving the four foundations for change.
Each of the foundations are headed in the right direction, with further work over the next three years to measure practice change and the depth of engagement to determine the changes that have resulted from participation in catchment or natural resource management.
ACHIEVEMENTS IN THE FIRST THREE YEARS
• 27,993 participants at engagement events
• 842 partnerships
• 186 management agreements
• 151 km of fencing
• 3,941 ha of vegetation management
• 6,131 ha of weed control
• 40,591 ha of agricultural practice change.
Source: Victorian CMA Actions and Achievement reports 2013-14, 2014-15 and 2015-16.
HIGHLIGHTS
Participation Integration and coordination (partnerships)
On average more than 13,000 people are participating in natural resource management in the region each year.
Participation in incentive based tenders and grant programs have more than doubled since the RCS commenced.
The Corangamite CMA commenced an Indigenous Participation Program in late 2013.
Land managers, community groups such as Landcare and the broader community are the target audience for more than 73 per cent of the events run.
The Corangamite Landcare Support Plan (2013) has been completed and is assisting volunteer groups to achieve local landscape change.
Partnerships in the Corangamite region with regional community groups and stakeholder agencies are wide ranging, healthy and productive.
Collaborative research partnerships with Deakin University, CSIRO, Federation University, RMIT and the Southern Slopes Climate Change Adaptation Research Group (SCARP) have led to a significant increase in regionally specific climate change knowledge.
A new partnership between Surfing Victoria and the Corangamite CMA is enabling both partners to increase the involvement of the surfing community in natural resource management.
A partnership between Southern Farming Systems and the Corangamite CMA is the cornerstone of the Land Health Program delivering local trials and local knowledge in a co-operative approached with the Landcare community.
Investment Knowledge sharing
An Investment Recruitment Strategy has been completed to increase corporate and philanthropic investment for natural resource management in the region.
The ‘NRM planning portal’ developed in partnership with regional Landcare networks and Federation University is now available, and is testing how online mapping can be used to identify local and regional priorities and encourage partnership projects in the region.
Accessibility to knowledge and information has improved greatly with four new web portals and two new websites developed to assist with knowledge sharing for flood information, climate change, soils, local planning, Waterwatch and EstuaryWatch.
Over 400 knowledge sharing events have been undertaken.
The skills of more than 35 Aboriginal people have been increase through training and development opportunities. The staff of Corangamite CMA have gained increased cultural awareness, in particular of traditional burning practices.
Corangamite CMA Annual Report 2016-2017
13
SE
CT
ION
1 S
EC
TIO
N 2
SE
CT
ION
3 S
EC
TIO
N 4
SE
CT
ION
5 S
EC
TIO
N 6
SE
CT
ION
7
THE REGION’S NATURAL RESOURCES
“The RCS will have succeeded if it can achieve landscape change – greater protection, enhancement and restoration of valuable natural resources.”
In the first three years of RCS implementation there have been a number of highlights relating to the region’s natural resources.
Data from the mid-term review shows that on-ground investment is going towards high value and cost-effective projects, and the majority of investment has been within RCS priority areas.
HIGHLIGHTS
Rivers, estuaries, floodplains, wetlands Native vegetation
The Corangamite Waterway Strategy has been finalised and sets regional priorities to guide on-ground investment to rivers, estuaries and wetlands. Development of a regional floodplain management strategy is underway.
There has been a significant increase in the amount of waterways (river banks and wetlands) that have been protected or enhanced. A majority of projects have occurred within or upstream of priority waterways.
New data being collected for waterway projects shows that the condition of waterways under contracted management is expected to improve.
Investment in inland native vegetation projects has been targeted to high value and cost-effective projects. 87 per cent of the benefits that were available from a pool of project proposals were purchased for just 40 per cent of the total proposal value.
80 per cent of all inland native vegetation projects have occurred within RCS priority areas.
95 per cent of projects are protecting Ecological Vegetation Classes (EVCs) that have a Bioregional Conservation Status of endangered or vulnerable. These EVCs include plains grassland, plains grassy wetland, herb-rich foothill forest and stony rises woodland.
Soils and agricultural land Coasts and marine
The RCS has instigated the current Corangamite CMA Land Health program and increased the focus on soils and agricultural production within the region.
Average annual participation of landholders in the Land Health program has increased by over 400 per cent on 2010-13 average participation rates.
Peer reviewed regional soil data spanning all 15 landscape zones is now available through the award winning Corangamite CMA Soil Health Knowledge Base.
Investment in coastal biodiversity projects has been targeted to high value and cost-effective projects. 97 per cent of the benefits that were available from a pool of project proposals were purchased for just 38 per cent of the total proposal value.
Almost 90 per cent of all coastal projects have occurred within RCS priority areas. EVCs protected include heathy woodland, coastal alkaline scrub, estuarine wetland and coastal saltmarsh. Twenty different EPBC listed marine bird species and 105 sites containing these species are under contracted management for habitat protection.
Aquifers Threatened flora and fauna
Groundwater information is now readily available and easily accessed in the Corangamite region via Southern Rural Water’s online interactive portal ‘The Groundwater Hub of Southern Victoria’.
The Otway Lower Aquifer Local Management Plan LMP is being developed and will combine five current Groundwater Management Units into one plan.
Overall there are 52 threatened fauna across 247 sites and 20 threatened flora species found at 80 different sites that are being protected under contracted management.
Fauna species protected include the brolga, Corangamite Water Skink, Orange-bellied Parrot, Growling Grass Frog and Rufous Bristlebird. Flora species include orchids, scurfpeas and eucalypts.
14
SE
CT
ION
1 S
EC
TIO
N 2
SE
CT
ION
3 S
EC
TIO
N 4
SE
CT
ION
5 S
EC
TIO
N 6
SE
CT
ION
7
REGIONAL CATCHMENT STRATEGY IMPLEMENTATION
USE AND IMPACT OF THE RCS
An online survey was conducted in late 2016 to understand the use and effectiveness of the RCS within the region. It was sent to 165 individuals from 62 different organisations and groups and there was a 26 per cent response rate.
Results showed 90 per cent of respondents used the RCS at least sometimes, and it was mainly used to understand regional priorities and plan for projects and/or on-ground works, however there was a preference towards using RCS sub-strategies for details associated with this planning. A key finding was that the RCS should remain as a high level strategic document and that over the next 5-10 years it should focus on:
• protecting natural resources
• continuing the focus on community participation
• identifying joint priorities for investment
• addressing climate change.
RECOMMENDATIONS FOR THE FUTURE
Assessment of the achievements, gaps, new information and RCS impact through the mid-term review has led to over sixty recommendations being made.
Key themes that are priorities for attention in the final three years of RCS implementation include:
• improving Aboriginal participation in NRM
• embedding climate change knowledge into planning, decision making and on-ground activities
• implementing current RCS actions that are yet to commence
• increasing involvement of partners in RCS implementation
• expanding the spatial web based NRM planning portal, and investigating its effectiveness for use in planning the next RCS
• improving monitoring and data collection efforts to ensure that outcomes can be determined and reported
• adapting to changes that will occur as a result of the new Marine and Coastal Act (once complete).
FUTURE
NEEDS
Corangamite CMA Annual Report 2016-2017
15
SE
CT
ION
1 S
EC
TIO
N 2
SE
CT
ION
3 S
EC
TIO
N 4
SE
CT
ION
5 S
EC
TIO
N 6
SE
CT
ION
7
ANNUAL CONDITION REPORT 16
COMMUNITY PARTICIPATION 31
BIODIVERSITY 36
WATER 38
LAND 41
COASTS 43
SECTION 3
REPORTING CATCHMENT CONDITION
The following report on activities towards achieving the RCS and condition of community participation, biodiversity, water, land, and coast.
16
SE
CT
ION
1 S
EC
TIO
N 2
SE
CT
ION
3 S
EC
TIO
N 4
SE
CT
ION
5 S
EC
TIO
N 6
SE
CT
ION
7
REPORTING CATCHMENT CONDITION
OVERVIEW
This section of the report provides an assessment of the current state of the region’s environment, and a reflection on the likely impact of annual management interventions, as well as natural events and observed changes at the appropriate scale of intervention. A key purpose of monitoring the state of the catchment and prevailing climatic conditions is to help identify opportunities for adapting and changing planned actions for the year ahead.
In Victoria there are five applicable catchment condition themes: waterways; biodiversity; land; coasts and community. The following section discusses each of the applicable themes and provides:
• a description of regional context
• benchmark condition or background levels and trends
• a regional annual assessment of prevailing climatic conditions
• rationale in support of the annual assessment
• a relevant case study.
ASSESSMENT OF IMPACTSIn addition to an overview of background condition and trends, the impact assessment provided for each theme describes the level of confidence that catchment managers have in the future given the events of the previous 12 months, recently delivered interventions (i.e. protection or restoration works) or as result of the prevailing climatic conditions. The assessment is based on the available science and/or expert advice, as well as evidence gained during the preceding year and uses the criteria detailed in Table 1.
A positive assessment indicates a high level of confidence about future direction (trajectory) of restoration or protection activities on the health of the environment or an expected positive direction of environmental change in response to prevailing seasonal conditions. By contrast, a concerned or highly concerned assessment indicates a much lower level of confidence in the success of management intervention, or an expected negative direction of environmental change in response to prevailing seasonal conditions.
ANNUAL
CONDITION REPORT
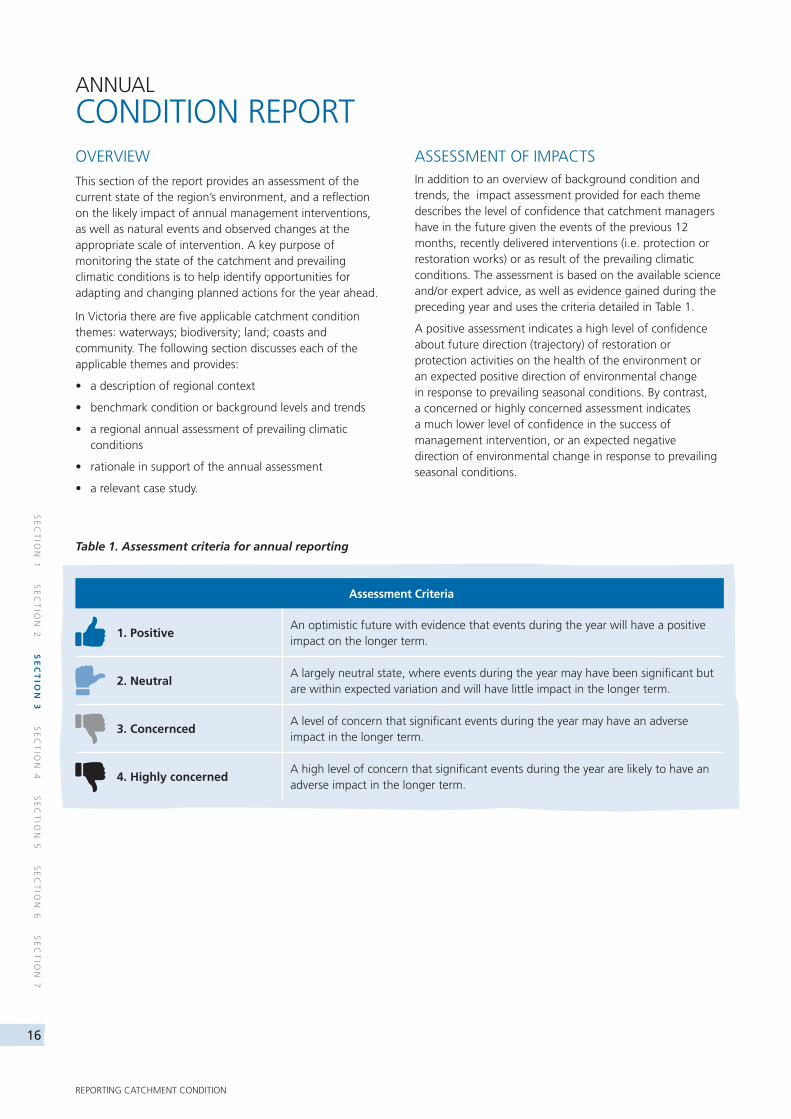
Assessment Criteria
1. Positive An optimistic future with evidence that events during the year will have a positive impact on the longer term.
2. Neutral A largely neutral state, where events during the year may have been significant but are within expected variation and will have little impact in the longer term.
3. Concernced A level of concern that significant events during the year may have an adverse impact in the longer term.
4. Highly concernedA high level of concern that significant events during the year are likely to have an adverse impact in the longer term.
Table 1. Assessment criteria for annual reporting
Corangamite CMA Annual Report 2016-2017
17
SE
CT
ION
1 S
EC
TIO
N 2
SE
CT
ION
3 S
EC
TIO
N 4
SE
CT
ION
5 S
EC
TIO
N 6
SE
CT
ION
7
WATERWAYS
Background condition
Factors affecting the condition of rivers, wetlands and estuaries
Waterways, and the aquatic and terrestrial ecosystems that they support, are the most notable characteristics of the Corangamite region of Victoria. The major waterway systems of the Barwon and associated Leigh and Moorabool rivers, the Western District Lakes and the great ocean road waterways are unique and integral to the environmental, economic and social values of the region.
The overall environmental condition of waterways is determined by the combined state of key characteristics such as habitat, water regimes, water quality, vegetation and connectivity. Broader catchment condition, land use, natural events like floods and bushfires, development and climate change can all directly influence the environmental condition and values of waterways. Waterway management needs to consider how both natural and anthropogenic factors (i.e., human impact via farming practices, recreation, urban development, etc.) impact on waterway condition and, therefore, on the values of waterways.
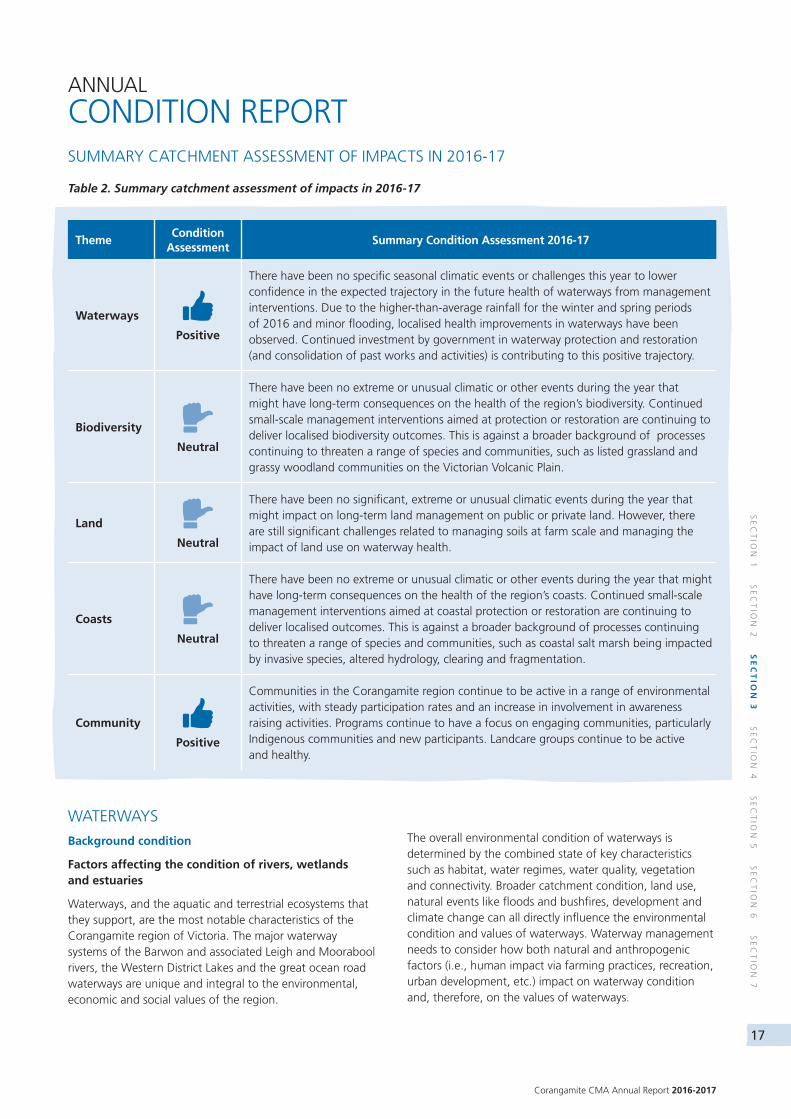
SUMMARY CATCHMENT ASSESSMENT OF IMPACTS IN 2016-17
ANNUAL
CONDITION REPORT
ThemeCondition
AssessmentSummary Condition Assessment 2016-17
Waterways
Positive
There have been no specific seasonal climatic events or challenges this year to lower confidence in the expected trajectory in the future health of waterways from management interventions. Due to the higher-than-average rainfall for the winter and spring periods of 2016 and minor flooding, localised health improvements in waterways have been observed. Continued investment by government in waterway protection and restoration (and consolidation of past works and activities) is contributing to this positive trajectory.
Biodiversity
Neutral
There have been no extreme or unusual climatic or other events during the year that might have long-term consequences on the health of the region’s biodiversity. Continued small-scale management interventions aimed at protection or restoration are continuing to deliver localised biodiversity outcomes. This is against a broader background of processes continuing to threaten a range of species and communities, such as listed grassland and grassy woodland communities on the Victorian Volcanic Plain.
Land
Neutral
There have been no significant, extreme or unusual climatic events during the year that might impact on long-term land management on public or private land. However, there are still significant challenges related to managing soils at farm scale and managing the impact of land use on waterway health.
Coasts
Neutral
There have been no extreme or unusual climatic or other events during the year that might have long-term consequences on the health of the region’s coasts. Continued small-scale management interventions aimed at coastal protection or restoration are continuing to deliver localised outcomes. This is against a broader background of processes continuing to threaten a range of species and communities, such as coastal salt marsh being impacted by invasive species, altered hydrology, clearing and fragmentation.
Community
Positive
Communities in the Corangamite region continue to be active in a range of environmental activities, with steady participation rates and an increase in involvement in awareness raising activities. Programs continue to have a focus on engaging communities, particularly Indigenous communities and new participants. Landcare groups continue to be active and healthy.
Table 2. Summary catchment assessment of impacts in 2016-17
18
SE
CT
ION
1 S
EC
TIO
N 2
SE
CT
ION
3 S
EC
TIO
N 4
SE
CT
ION
5 S
EC
TIO
N 6
SE
CT
ION
7
REPORTING CATCHMENT CONDITION
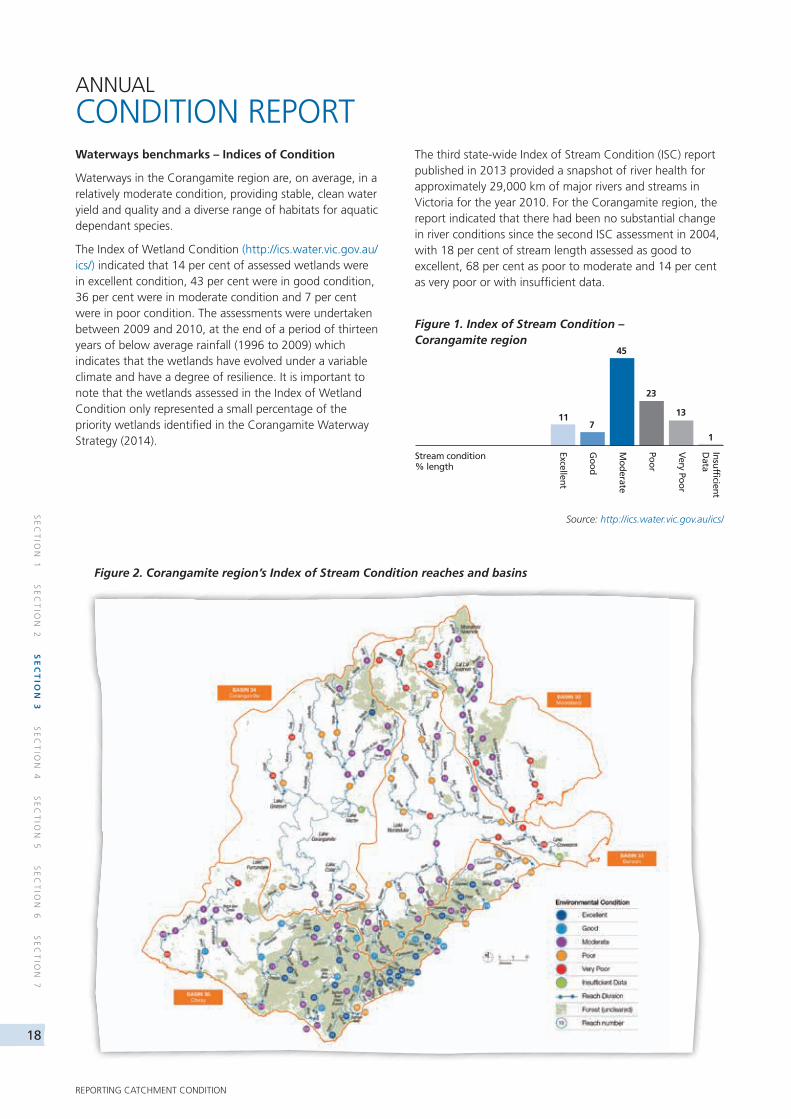
Waterways benchmarks – Indices of Condition
Waterways in the Corangamite region are, on average, in a relatively moderate condition, providing stable, clean water yield and quality and a diverse range of habitats for aquatic dependant species.
The Index of Wetland Condition (http://ics.water.vic.gov.au/ics/) indicated that 14 per cent of assessed wetlands were in excellent condition, 43 per cent were in good condition, 36 per cent were in moderate condition and 7 per cent were in poor condition. The assessments were undertaken between 2009 and 2010, at the end of a period of thirteen years of below average rainfall (1996 to 2009) which indicates that the wetlands have evolved under a variable climate and have a degree of resilience. It is important to note that the wetlands assessed in the Index of Wetland Condition only represented a small percentage of the priority wetlands identified in the Corangamite Waterway Strategy (2014).
The third state-wide Index of Stream Condition (ISC) report published in 2013 provided a snapshot of river health for approximately 29,000 km of major rivers and streams in Victoria for the year 2010. For the Corangamite region, the report indicated that there had been no substantial change in river conditions since the second ISC assessment in 2004, with 18 per cent of stream length assessed as good to excellent, 68 per cent as poor to moderate and 14 per cent as very poor or with insufficient data.
ANNUAL
CONDITION REPORT
Stream condition% length
Excellent
Go
od
Mo
derate
Poo
r
Very Po
or
Insu
fficient
Data
117
45
23
13
1
Figure 1. Index of Stream Condition – Corangamite region
Source: http://ics.water.vic.gov.au/ics/
Figure 2. Corangamite region’s Index of Stream Condition reaches and basins
Corangamite CMA Annual Report 2016-2017
19
SE
CT
ION
1 S
EC
TIO
N 2
SE
CT
ION
3 S
EC
TIO
N 4
SE
CT
ION
5 S
EC
TIO
N 6
SE
CT
ION
7
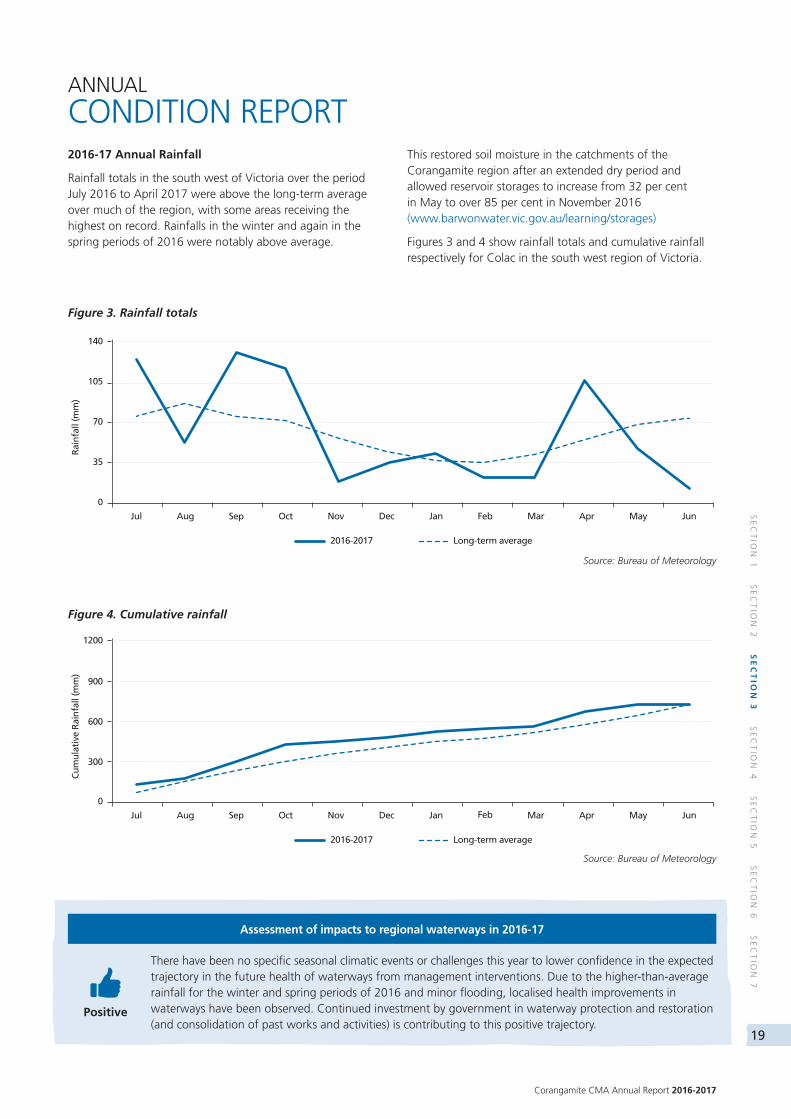
2016-17 Annual Rainfall
Rainfall totals in the south west of Victoria over the period July 2016 to April 2017 were above the long-term average over much of the region, with some areas receiving the highest on record. Rainfalls in the winter and again in the spring periods of 2016 were notably above average.
This restored soil moisture in the catchments of the Corangamite region after an extended dry period and allowed reservoir storages to increase from 32 per cent in May to over 85 per cent in November 2016 (www.barwonwater.vic.gov.au/learning/storages)
Figures 3 and 4 show rainfall totals and cumulative rainfall respectively for Colac in the south west region of Victoria.
ANNUAL
CONDITION REPORT
140
105
70
35
0
Jan MarFeb MayApr JunJul Aug Sep Oct Nov Dec
Rai
nfa
ll (m
m)
Long-term average2016-2017
FebJan Mar MayApr JunJul Aug Sep Oct Nov Dec
1200
900
600
300
0
Cu
mu
lati
ve R
ain
fall
(mm
)
Long-term average2016-2017
Figure 3. Rainfall totals
Source: Bureau of Meteorology
Source: Bureau of Meteorology
Figure 4. Cumulative rainfall
Assessment of impacts to regional waterways in 2016-17
Positive
There have been no specific seasonal climatic events or challenges this year to lower confidence in the expected trajectory in the future health of waterways from management interventions. Due to the higher-than-average rainfall for the winter and spring periods of 2016 and minor flooding, localised health improvements in waterways have been observed. Continued investment by government in waterway protection and restoration (and consolidation of past works and activities) is contributing to this positive trajectory.
20
SE
CT
ION
1 S
EC
TIO
N 2
SE
CT
ION
3 S
EC
TIO
N 4
SE
CT
ION
5 S
EC
TIO
N 6
SE
CT
ION
7
REPORTING CATCHMENT CONDITION
Rationale for assessment:
• Continued investment in riparian protection and enhancement: in 2016-17 the Corangamite Waterways Grants Program provided $1,537,963 in funding to 41 sites, enabling the establishment of six off-stream watering points, 157 ha of weed control, revegetation over 472 ha, installation of 101 km of fencing over 681 ha of priority and/or high value waterways.
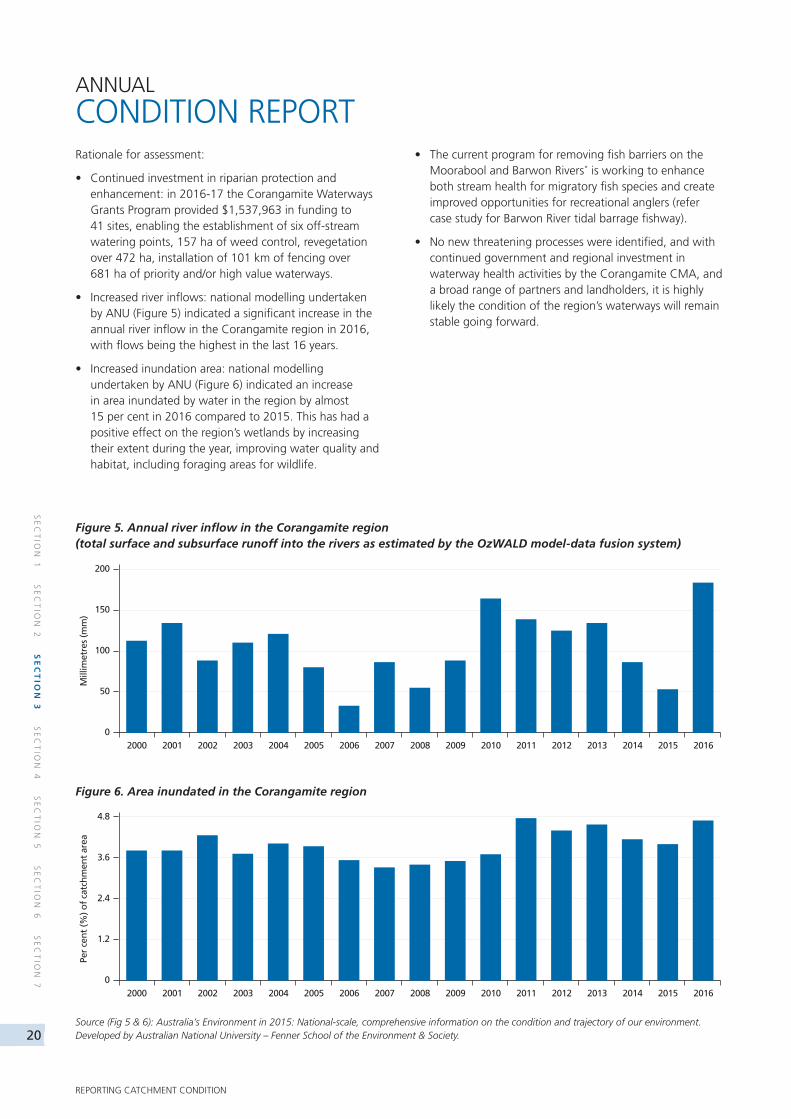
• Increased river inflows: national modelling undertaken by ANU (Figure 5) indicated a significant increase in the annual river inflow in the Corangamite region in 2016, with flows being the highest in the last 16 years.
• Increased inundation area: national modelling undertaken by ANU (Figure 6) indicated an increase in area inundated by water in the region by almost 15 per cent in 2016 compared to 2015. This has had a positive effect on the region’s wetlands by increasing their extent during the year, improving water quality and habitat, including foraging areas for wildlife.
• The current program for removing fish barriers on the Moorabool and Barwon Rivers* is working to enhance both stream health for migratory fish species and create improved opportunities for recreational anglers (refer case study for Barwon River tidal barrage fishway).
• No new threatening processes were identified, and with continued government and regional investment in waterway health activities by the Corangamite CMA, and a broad range of partners and landholders, it is highly likely the condition of the region’s waterways will remain stable going forward.
ANNUAL
CONDITION REPORT
Figure 5. Annual river inflow in the Corangamite region (total surface and subsurface runoff into the rivers as estimated by the OzWALD model-data fusion system)
Figure 6. Area inundated in the Corangamite region
Source (Fig 5 & 6): Australia’s Environment in 2015: National-scale, comprehensive information on the condition and trajectory of our environment. Developed by Australian National University – Fenner School of the Environment & Society.
200
150
100
50
02000 20022001 20042003 2005 2006 2007 2008 2009 2010 2011 2012 20142013 2015 2016
Mill
imet
res
(mm
)
4.8
3.6
2.4
1.2
02000 20022001 20042003 2005 2006 2007 2008 2009 2010 2011 2012 20142013 2015 2016
Per
cen
t (%
) of
catc
hm
ent
area
Corangamite CMA Annual Report 2016-2017
21
SE
CT
ION
1 S
EC
TIO
N 2
SE
CT
ION
3 S
EC
TIO
N 4
SE
CT
ION
5 S
EC
TIO
N 6
SE
CT
ION
7* Note: Gellibrand, Barwon and Moorabool Rivers are priority waterways under the Corangamite Waterway Strategy 2014-22.1 Australia’s Environment in 2015: National-scale, comprehensive information on the condition and trajectory of our environment. Developed by Australian National University – Fenner School of the Environment & Society.
CHARLEYS CREEK WATERWAY PROTECTION PROJECT
CHALLENGE
Willow infestation and unrestricted stock access to the banks of Charleys Creek (a tributary of the Gellibrand River*) were impacting water quality and the long-term health of the creek and contributing to adverse impacts downstream.
APPROACH
Focusing on two properties, building trust and rapport with the absentee owner and the property manager, and providing funding support for fencing, revegetation and willow removal, the Corangamite CMA has gained landholder commitment to restore the creek banks and its riparian vegetation.
RESULTS
A buffer strip of native vegetation is being created along a section of Charleys Creek, which will act as a filter to stop soil sediment and nutrients from entering the waterway from catchment run-off. This will improve water quality in the immediate area, as well as downstream into the Gellibrand River, delivering benefits to drinking water supplies.
Replacing willows with native vegetation has ecological benefits for fish and other animals that use the waterway. Managing cattle access to the waterway also reduces bank damage and erosion and reduces animal waste from entering the waterway.
The property owner has taken great pride in being able to restore the environment along the creek, improving the aesthetics of the area, and is influencing other landholders in the area to consider undertaking similar projects.
KEY PARTNERS
Property owners and managers, Anam Cara Cattle Club, LAWROC Landcare group (Central Otway Landcare Network) and the Corangamite CMA.
BIODIVERSITY
Background condition
The extent of native vegetation and the conservation status of native species
Since European settlement, the region has lost almost 75 per cent of its original vegetation cover. Most of the current losses of native vegetation may be attributed to loss in condition (80 per cent) with 20 per cent being removed through clearing (VEAC, 2011). From the moist foothill forests in the south, to the dry foothill forests to the north and the grassy woodland and grassland communities in between, about half of the region’s remaining native vegetation is found on public land and the remainder, including ‘remnant vegetation’ is found on private land.
Despite the historical loss in vegetation cover, recent research undertaken by Australian National University 2015 has demonstrated a small (1 per cent) increase in tree cover in the region from 2012 to 2016, with the overall extent of tree cover having steadily increased since the early 1970s (20.5 per cent to 24 per cent respectively)1.
The Corangamite CMA region is home to flora and fauna species that are unique to the area, many of which are dependent on the natural assets mentioned above such as native vegetation, waterways and wetlands. Unfortunately, the region has over 300 species that are classified as threatened in Victoria, with 53 listed as threatened at a national scale.
Four of the five Victorian marine bioregions are represented in the Corangamite region: Central Victoria; Central Bass Strait; Victorian Embayments and Otway.
Biodiversity benchmark – Strategic biodiversity score
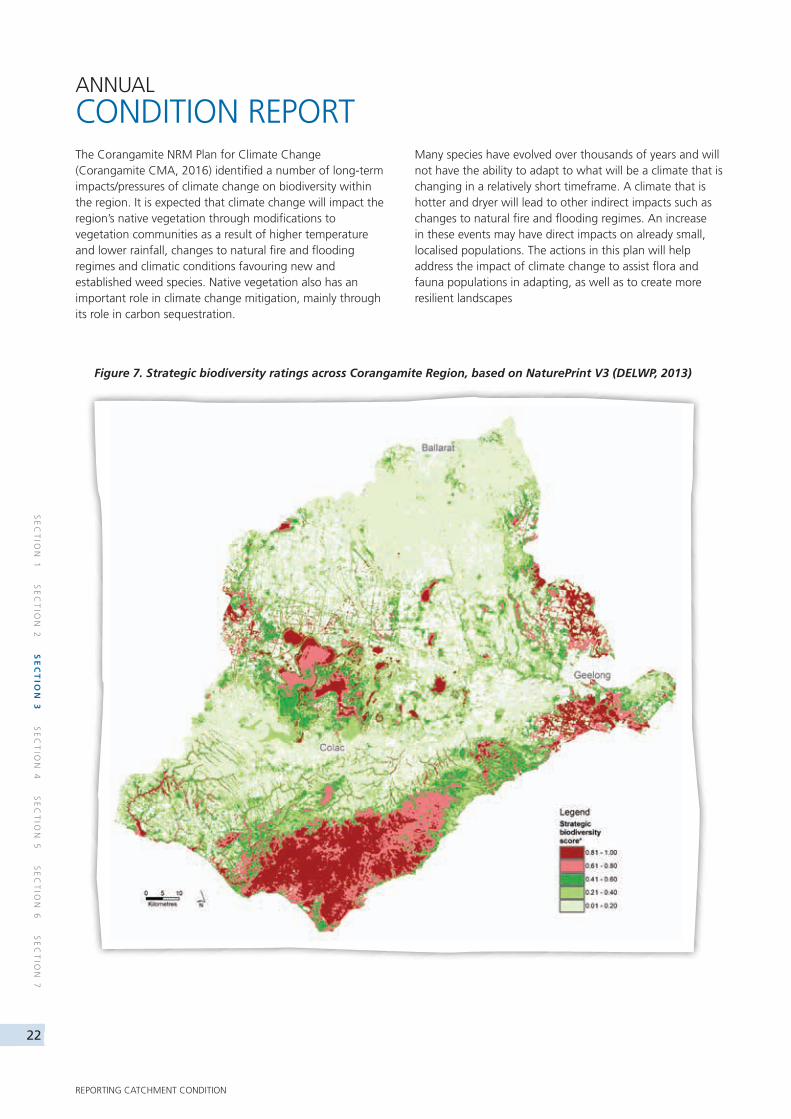
The Corangamite region has large areas of high biodiversity value (Figure 7). While most of the high value areas are captured in existing parks and reserves, areas of high value occur in the region’s lakes and wetlands, illustrating the importance of these areas as habitat.
Factors affecting the condition of rivers, wetlands and estuaries
As well as changes to the extent of native vegetation, the quality of native vegetation has also declined, due to a history of introduced pest plants and animals, changes to flooding and fire regimes, as well as other human induced practices. The threats to the region’s flora and fauna are wide and varied, with clearing and fragmenting of existing habitat (e.g. native vegetation), draining of wetlands, changes to environmental flows, environmental weeds and introduced animals, all considered to be highly threatening processes.
More information on the region’s native vegetation can be found in VEAC’s state-wide investigation into remnant native vegetation at www.veac.vic.gov.au/investigation/remnant-native-vegetation-investigation/reports
CASE STUDY
ANNUAL
CONDITION REPORT
22
SE
CT
ION
1 S
EC
TIO
N 2
SE
CT
ION
3 S
EC
TIO
N 4
SE
CT
ION
5 S
EC
TIO
N 6
SE
CT
ION
7
REPORTING CATCHMENT CONDITION
Figure 7. Strategic biodiversity ratings across Corangamite Region, based on NaturePrint V3 (DELWP, 2013)
ANNUAL
CONDITION REPORTThe Corangamite NRM Plan for Climate Change (Corangamite CMA, 2016) identified a number of long-term impacts/pressures of climate change on biodiversity within the region. It is expected that climate change will impact the region’s native vegetation through modifications to vegetation communities as a result of higher temperature and lower rainfall, changes to natural fire and flooding regimes and climatic conditions favouring new and established weed species. Native vegetation also has an important role in climate change mitigation, mainly through its role in carbon sequestration.
Many species have evolved over thousands of years and will not have the ability to adapt to what will be a climate that is changing in a relatively short timeframe. A climate that is hotter and dryer will lead to other indirect impacts such as changes to natural fire and flooding regimes. An increase in these events may have direct impacts on already small, localised populations. The actions in this plan will help address the impact of climate change to assist flora and fauna populations in adapting, as well as to create more resilient landscapes
Corangamite CMA Annual Report 2016-2017
23
SE
CT
ION
1 S
EC
TIO
N 2
SE
CT
ION
3 S
EC
TIO
N 4
SE
CT
ION
5 S
EC
TIO
N 6
SE
CT
ION
7
Assessment of impacts to regional biodiversity in 2016-17
Neutral
There have been no extreme or unusual climatic or other events during the year that might have long-term consequences on the health of the region’s biodiversity. Continued small-scale management interventions aimed at protection or restoration are continuing to deliver localised biodiversity outcomes. This is against a broader background of processes continuing to threaten a range of species and communities, such as listed grassland and grassy woodland communities on the Victorian Volcanic Plain.
ANNUAL
CONDITION REPORT
Rationale for assessment:
• Management of a range nationally-listed species of flora and fauna has continued through various on-ground works as well as population monitoring. On-ground works typically include weed control and the implementation of ecological burns for flora and predator control and habitat management for fauna. Species have been prioritised for conservation works, including iconic species such as the Orange-bellied Parrot, Eastern Barred Bandicoot and the Dwarf Spider Orchid.
• The CMA partners with DELWP to coordinate the delivery of the threatened species program within the region. Critical to the successes of the program is the broader participation of numerous community-based volunteer organisations and individuals. Volunteers actively participate in on-ground works and population monitoring and provide a substantial leveraging of government investment. In 2016-17 the CMA provided $214,000 directly to threatened species program initiatives, in addition to the delivery of broader biodiversity investment, which will also benefit threatened species.
• As part of the Victorian Volcanic Plain Linear Reserves program, weed control works were undertaken on fourteen roads across the Corangamite CMA, on very high, high and medium quality native grasslands. A total of 410 ha were treated. The wet season limited the amount of burning that could be undertaken, which increased the time taken to treat unburned areas.
• The Conservation and Carbon Capture Project (CCCP) supported landholders in actively managing 1,209 ha of remnant native vegetation across the region through pest plant and animal management and ecological burning. The number of hectares of ecological burning was limited by the wet autumn experienced in 2017. The CCCP also led to the revegetation / supplementary planting across 81 ha using pre-1750 EVC benchmarks. Natural regeneration has been recorded across the entire project area following weed treatment and stock management. An outcome of the project was the protection and enhancement of four Environment Protection and Biodiversity Conservation Act 1999 listed threatened ecological communities including Natural Temperate Grassland of the Victorian Volcanic Plains (VVP), Grassy Eucalypt Woodland of the VVP, Seasonal Herbaceous Wetlands (Freshwater) of the Temperate Lowland Plains and Subtropical and Temperate Coastal Saltmarsh.
• The diversity of actions being undertaken as part of the Victorian Volcanic Plains and Western District Lakes Recovery project focus on the delivery of on-ground action and the building of community knowledge and capacity to act. In the last 12 months the projects delivered to support biodiversity conservation include: continued implementation by landholders of PlainsTender round 6, supporting volunteers assisting in monitoring projects to protect the Striped Legless Lizard and Eastern Barred Bandicoots, the development of a VVP species seed production area, the establishment of grassy woodland restoration demonstration sites, delivery of a VVP Natural Values course for natural resource management practitioners, VVP Biodiversity small grants, and a variety of targeted community engagement activities.
24
SE
CT
ION
1 S
EC
TIO
N 2
SE
CT
ION
3 S
EC
TIO
N 4
SE
CT
ION
5 S
EC
TIO
N 6
SE
CT
ION
7
REPORTING CATCHMENT CONDITION
ANNUAL
CONDITION REPORTLAND
Background condition
The management of environment and long-term productivity
The Corangamite region has rich and diverse landscapes, reflecting its geological, climatic and human history. The natural resources of our region are critical to sustaining the lifestyle of its residents and visitors, as well as providing important habitat for flora and fauna. They support valuable industries such as agriculture and nature-based tourism, and underpin the region’s urban water supply needs.
Soils underpin the health of all land-based natural resources in the region. Two-thirds of the region’s land is privately owned and used primarily for agricultural production. The management of soils and agricultural land influences environmental outcomes across the whole region.
Integrating the management of agricultural land with that of other natural resources – for instance, native vegetation, wetlands and rivers – is crucial for the region, including its estuaries and coasts. Actively engaging the many private landholders in the region and understanding their local priorities is important to the success of natural resource management in this region.
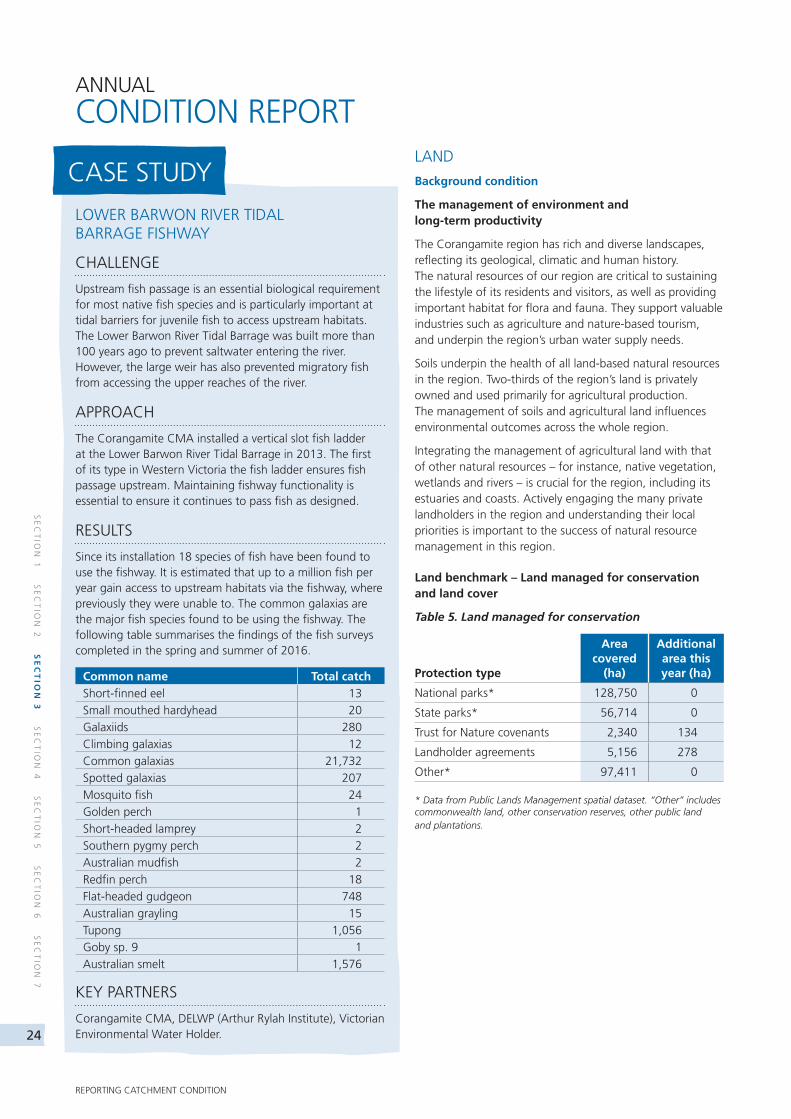
Land benchmark – Land managed for conservation and land cover
Table 5. Land managed for conservation
Protection type
Area covered
(ha)
Additional area this year (ha)
National parks* 128,750 0
State parks* 56,714 0
Trust for Nature covenants 2,340 134
Landholder agreements 5,156 278
Other* 97,411 0
* Data from Public Lands Management spatial dataset. “Other” includes commonwealth land, other conservation reserves, other public land and plantations.
LOWER BARWON RIVER TIDAL BARRAGE FISHWAY
CHALLENGE
Upstream fish passage is an essential biological requirement for most native fish species and is particularly important at tidal barriers for juvenile fish to access upstream habitats. The Lower Barwon River Tidal Barrage was built more than 100 years ago to prevent saltwater entering the river. However, the large weir has also prevented migratory fish from accessing the upper reaches of the river.
APPROACH
The Corangamite CMA installed a vertical slot fish ladder at the Lower Barwon River Tidal Barrage in 2013. The first of its type in Western Victoria the fish ladder ensures fish passage upstream. Maintaining fishway functionality is essential to ensure it continues to pass fish as designed.
RESULTS
Since its installation 18 species of fish have been found to use the fishway. It is estimated that up to a million fish per year gain access to upstream habitats via the fishway, where previously they were unable to. The common galaxias are the major fish species found to be using the fishway. The following table summarises the findings of the fish surveys completed in the spring and summer of 2016.
Common name Total catchShort-finned eel 13
Small mouthed hardyhead 20
Galaxiids 280
Climbing galaxias 12
Common galaxias 21,732
Spotted galaxias 207
Mosquito fish 24
Golden perch 1
Short-headed lamprey 2
Southern pygmy perch 2
Australian mudfish 2
Redfin perch 18
Flat-headed gudgeon 748
Australian grayling 15
Tupong 1,056
Goby sp. 9 1
Australian smelt 1,576
KEY PARTNERS
Corangamite CMA, DELWP (Arthur Rylah Institute), Victorian Environmental Water Holder.
CASE STUDY
Corangamite CMA Annual Report 2016-2017
25
SE
CT
ION
1 S
EC
TIO
N 2
SE
CT
ION
3 S
EC
TIO
N 4
SE
CT
ION
5 S
EC
TIO
N 6
SE
CT
ION
7
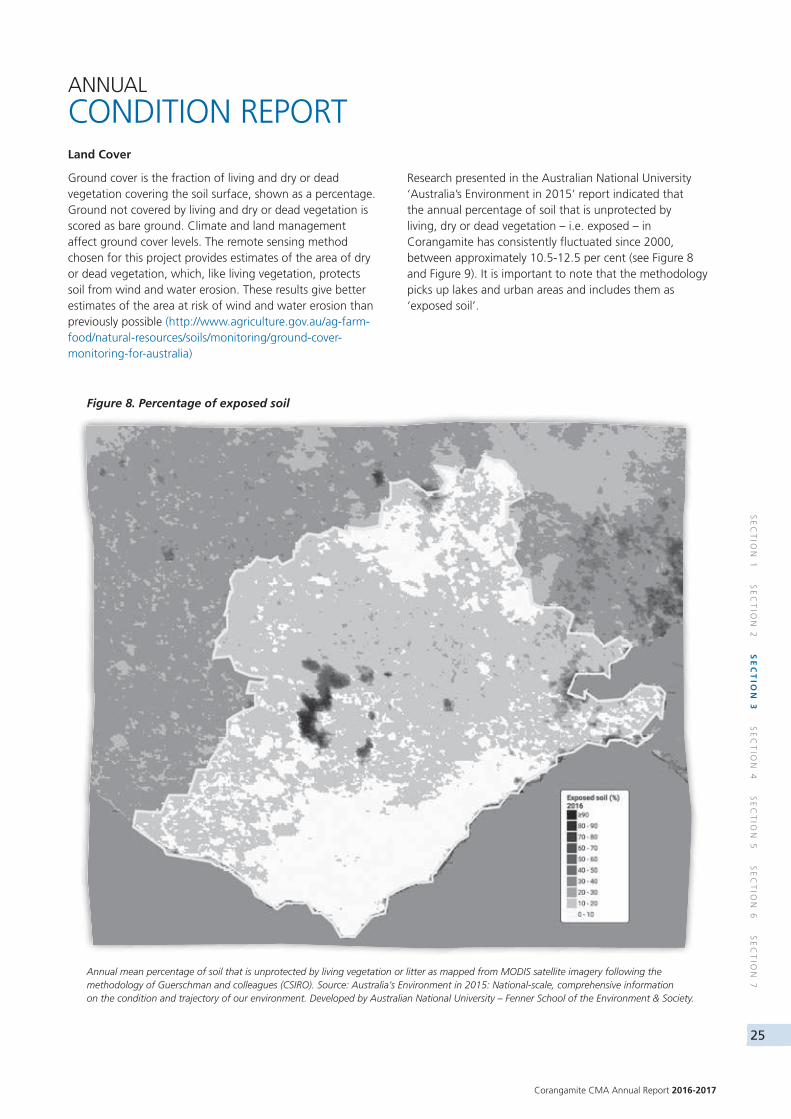
Land Cover
Ground cover is the fraction of living and dry or dead vegetation covering the soil surface, shown as a percentage. Ground not covered by living and dry or dead vegetation is scored as bare ground. Climate and land management affect ground cover levels. The remote sensing method chosen for this project provides estimates of the area of dry or dead vegetation, which, like living vegetation, protects soil from wind and water erosion. These results give better estimates of the area at risk of wind and water erosion than previously possible (http://www.agriculture.gov.au/ag-farm-food/natural-resources/soils/monitoring/ground-cover-monitoring-for-australia)
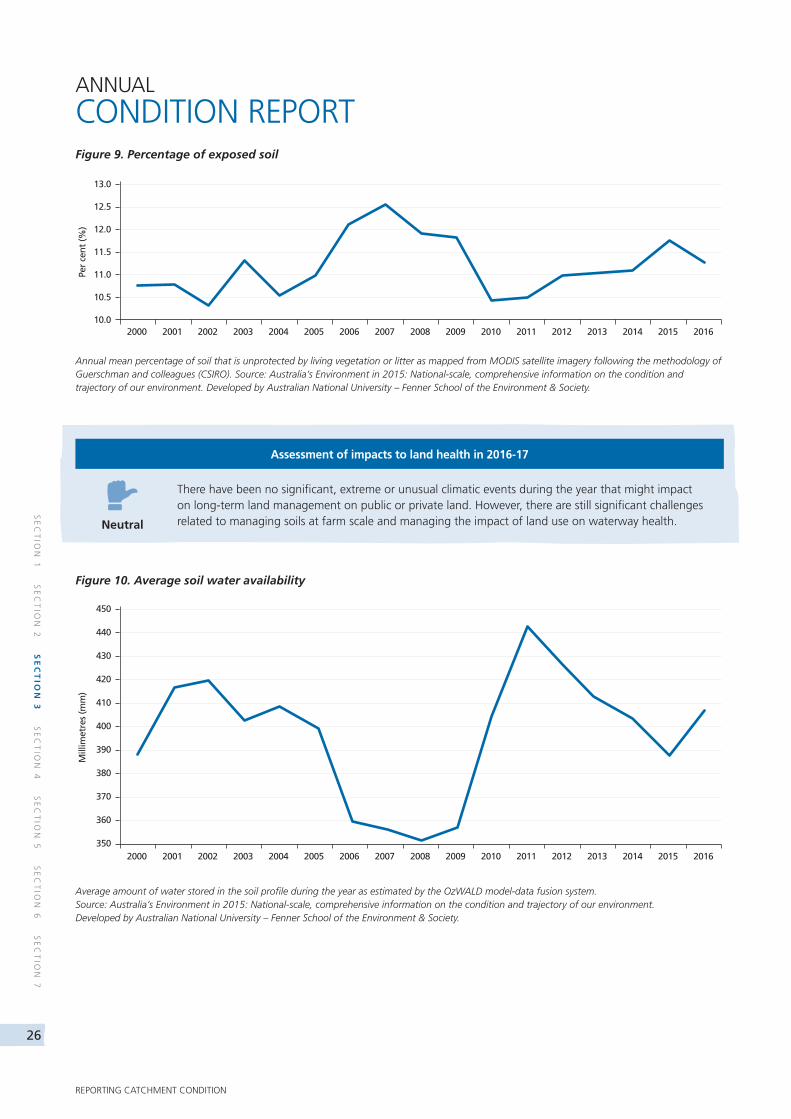
Research presented in the Australian National University ‘Australia’s Environment in 2015’ report indicated that the annual percentage of soil that is unprotected by living, dry or dead vegetation – i.e. exposed – in Corangamite has consistently fluctuated since 2000, between approximately 10.5-12.5 per cent (see Figure 8 and Figure 9). It is important to note that the methodology picks up lakes and urban areas and includes them as ‘exposed soil’.
Figure 8. Percentage of exposed soil
Annual mean percentage of soil that is unprotected by living vegetation or litter as mapped from MODIS satellite imagery following the methodology of Guerschman and colleagues (CSIRO). Source: Australia’s Environment in 2015: National-scale, comprehensive information on the condition and trajectory of our environment. Developed by Australian National University – Fenner School of the Environment & Society.
ANNUAL
CONDITION REPORT
26
SE
CT
ION
1 S
EC
TIO
N 2
SE
CT
ION
3 S
EC
TIO
N 4
SE
CT
ION
5 S
EC
TIO
N 6
SE
CT
ION
7
REPORTING CATCHMENT CONDITION
Assessment of impacts to land health in 2016-17
Neutral
There have been no significant, extreme or unusual climatic events during the year that might impact on long-term land management on public or private land. However, there are still significant challenges related to managing soils at farm scale and managing the impact of land use on waterway health.
ANNUAL
CONDITION REPORT
Figure 10. Average soil water availability
Average amount of water stored in the soil profile during the year as estimated by the OzWALD model-data fusion system. Source: Australia’s Environment in 2015: National-scale, comprehensive information on the condition and trajectory of our environment. Developed by Australian National University – Fenner School of the Environment & Society.
450
440
430
420
410
400
390
380
370
360
350
Mill
imet
res
(mm
)
2000 20022001 20042003 2005 2006 2007 2008 2009 2010 2011 2012 20142013 2015 2016
Figure 9. Percentage of exposed soil
13.0
12.5
12.0
11.5
11.0
10.5
10.0
Per
cen
t (%
)
2000 20022001 20042003 2005 2006 2007 2008 2009 2010 2011 2012 20142013 2015 2016
Annual mean percentage of soil that is unprotected by living vegetation or litter as mapped from MODIS satellite imagery following the methodology of Guerschman and colleagues (CSIRO). Source: Australia’s Environment in 2015: National-scale, comprehensive information on the condition and trajectory of our environment. Developed by Australian National University – Fenner School of the Environment & Society.
Corangamite CMA Annual Report 2016-2017
27
SE
CT
ION
1 S
EC
TIO
N 2
SE
CT
ION
3 S
EC
TIO
N 4
SE
CT
ION
5 S
EC
TIO
N 6
SE
CT
ION
7
Rationale for assessment:
• Soil moisture levels are relatively climate dependent (see Figure 10 previous page) with relatively low levels occurring during the dryer-than-average years of 2006 to 2009.
• The area of exposed soil within the Corangamite region (see Figure 9 previous page) is largely a function of climatic conditions rather than being caused by changed land practices.
• Corangamite CMA works in partnership with key stakeholders in the region (Landcare, Agriculture Victoria, WestVic Dairy and Southern Farming Systems (SFS)) with funding support by Agriculture Victoria, Grains Research Development Corporation and SFS to work with landholders to manage their land sustainably, and protect land and water resources in the catchment primarily from the threats of soil degradation processes.
• There have been no significant changes in land tenure through the designation of new parks or reserves.
• The Land Health Program has continued to grow in the area of management practice change with additional landholders this year indicating an intention to change practices due to participation in the program. Landholders have indicated changes in practices related to sub-soil amelioration, rotational and pasture cropping, and management of soil acidity and soil biology.
• The number of volunteers participating in project activities has climbed to 3,743 over 116 events producing 75,000 ha of farm land undergoing management practice change.
LAND HEALTH ENGAGEMENT OF ADDITIONAL GROUPS PROJECT
CHALLENGE
Work done through the Land Health Program has shown the willingness and availability of additional community and industry groups to be involved. The program needed to consider niche and topical issues to attract additional groups and participation.
APPROACH
The aim of the Engagement of Additional Groups project is to be open to a broad spectrum of groups involved in land management. The Corangamite CMA called for Expressions of Interest from groups and individuals, to capture project ideas that addressed the community needs relating to productive and sustainable farming, biodiversity and conservation, land management skills and knowledge.
The focus is on activities that improve the capacity of farmers, land managers, students, rural leaders and volunteers; along with the health of the landscape.
RESULTS
The Engagement of Additional Groups project has increased the number of farmers adopting practices that improve the quality of the natural resource base, and the area of land over which those practices are applied. Broadening the scope of the current program the project encompasses additional farmer support activities from a wide-ranging variety of groups involved in land management.
The first event was highly successful in numerous ways; the event attracted 60 farmers, it was sponsored by the industry proponent and ran in conjunction with an NLP Corangamite CMA Land Health Program event through a local Landcare group. Other events and activities such as the Otway Food and Fibre Showcase, collaborative industry and community cropping trials, new farmer groups modelling pasture growth, and a series of soil characteristic field days, have all succeeded in attracting new participants.
Critical to its success has been the project’s focus on building new partnerships and offering local landholders and farmers events and activities covering a broad range of topics.
KEY PARTNERS
Landcare networks and groups, Australian Grain and Fodder, Farm Care, Federation University, Rural Industries Skill Training, Agriculture consultants, Corporate Farms, Fertiliser, Grain and Seed Companies, and Soil Scientists, Agriculture Vic (DEDJTR).
ANNUAL
CONDITION REPORTCASE STUDY
28
SE
CT
ION
1 S
EC
TIO
N 2
SE
CT
ION
3 S
EC
TIO
N 4
SE
CT
ION
5 S
EC
TIO
N 6
SE
CT
ION
7
REPORTING CATCHMENT CONDITION
Coasts Assessment 2016-17
Neutral
There have been no extreme or unusual climatic or other events during the year that might have long-term consequences on the health of the region’s coasts. Continued small-scale management interventions aimed at coastal protection or restoration are continuing to deliver localised outcomes. This is against a broader background of processes continuing to threaten a range of species and communities, such coastal salt marsh being impacted by invasive species, altered hydrology, clearing and fragmentation.
ANNUAL
CONDITION REPORT
Rationale for assessment:
• Coastal settlements located in low-lying areas within the catchment are experiencing increases in occasional inundation (e.g. Point Lonsdale and Apollo Bay). The area near Point Lonsdale has been subject to erosion over many years and extensive improvements to existing sea walls have been undertaken in the last 12 months to protect residential properties and road infrastructure in this area.
• Coastal Tender and Coastal Stewardship incentives have been employed to ensure best practice management practices by a range of coastal landholders. An area of 1,645 ha of good quality remnant coastal habitat is being protected through five-year management agreements as of 30 June 2017.
• An additional 486 ha of remnant coastal habitat is being protected though on-title permanent protection by means of a conservation covenant (Trust for Nature).
COASTS
Background condition
The level of protection for coasts
The coastal zone encompasses a number of environmental assets, including estuaries, wetlands, native vegetation and threatened species. Within the coastal zone these assets are managed across public and private land and are the focus of efforts by government and the community to improve our environment.
Some parts of the coast are multiple use environments where community access to the rich environmental resource competes with urban development, industry and agriculture. Consequently, the quality of the environmental resources at these places is subject to continued pressure. However, much of Australia’s narrow coastline is in public ownership and an intricate public reserve system has grown to protect it.
The Corangamite region’s marine and coastal environment extends from Peterborough in the west to Limeburners Lagoon at Geelong in the east. It includes the Ramsar listed wetlands of Swan Bay, Limeburners Lagoon and the Barwon estuary, a number of marine protected areas and over 20 estuaries. The Ramsar wetlands are critical habitats for many vulnerable and threatened species.
The Corangamite Region’s coastline has areas at risk from flooding and coastal erosion. With a changing climate, flooding and coastal erosion are expected to be exacerbated by increases in wind speed, storm intensity and frequency, as well as changes in rainfall intensity and frequency.
A changing climate is also expected to have an effect on the health and functioning of coastal wetlands and estuaries. For example, loss of saltmarsh through greater erosion and increased saltwater intrusion through sea level rise. Salinity regimes can also be changed as a result of reduced freshwater flows into estuaries and more intense storms can create new estuary entrances or break through existing entrances.
Coasts Benchmark – Level of protection for coasts
While most of the region’s coastline is protected by a thin strip of coastal reserve, there are substantial marine reserves and a large area of coastline protected within Great Otway National Park. Critically, however, there are significant stretches of coast where agriculture and urban development are within close proximity to the coastal strip and to important lakes and estuaries. There are a number of urban areas in Geelong, on the Bellarine Peninsula and along the Great Ocean Road that are experiencing rapid development and urbanisation, placing pressure on the surrounding coastal environments.
Corangamite CMA Annual Report 2016-2017
29
SE
CT
ION
1 S
EC
TIO
N 2
SE
CT
ION
3 S
EC
TIO
N 4
SE
CT
ION
5 S
EC
TIO
N 6
SE
CT
ION
7
COMMUNITY
Background condition
The benefits that flow from community participation
The health and wellbeing of the Victorian community benefits not only from visiting and staying in Victoria’s many parks and reserves but from participation in direct environmental action. People in various communities in the Corangamite region are active participants in a range of environmental activities that help improve the condition of the region’s biodiversity and waterways and improve the way we manage land. The region’s parks and reserves also attract a large number of visitors each year.
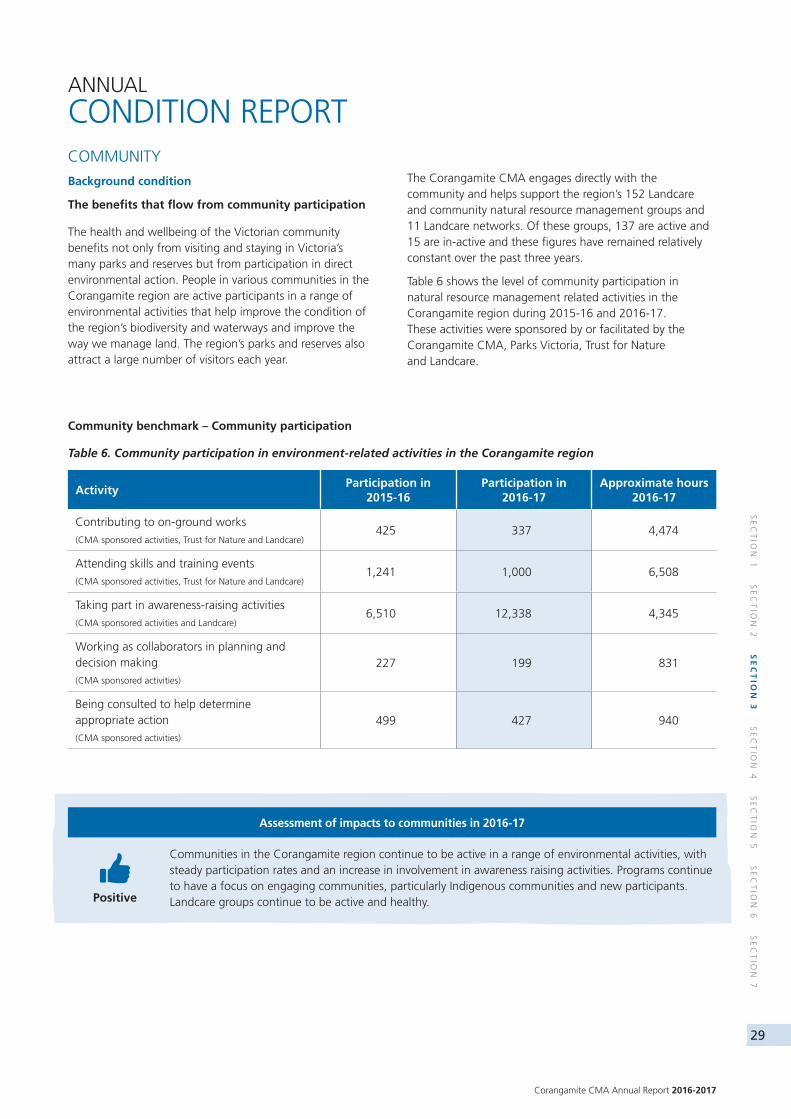
The Corangamite CMA engages directly with the community and helps support the region’s 152 Landcare and community natural resource management groups and 11 Landcare networks. Of these groups, 137 are active and 15 are in-active and these figures have remained relatively constant over the past three years.
Table 6 shows the level of community participation in natural resource management related activities in the Corangamite region during 2015-16 and 2016-17. These activities were sponsored by or facilitated by the Corangamite CMA, Parks Victoria, Trust for Nature and Landcare.
Community benchmark – Community participation
Table 6. Community participation in environment-related activities in the Corangamite region
ActivityParticipation in
2015-16Participation in
2016-17Approximate hours
2016-17
Contributing to on-ground works
(CMA sponsored activities, Trust for Nature and Landcare)425 337 4,474
Attending skills and training events
(CMA sponsored activities, Trust for Nature and Landcare)1,241 1,000 6,508
Taking part in awareness-raising activities
(CMA sponsored activities and Landcare)6,510 12,338 4,345
Working as collaborators in planning and decision making
(CMA sponsored activities)
227 199 831
Being consulted to help determine appropriate action
(CMA sponsored activities)
499 427 940
ANNUAL
CONDITION REPORT
Assessment of impacts to communities in 2016-17
Positive
Communities in the Corangamite region continue to be active in a range of environmental activities, with steady participation rates and an increase in involvement in awareness raising activities. Programs continue to have a focus on engaging communities, particularly Indigenous communities and new participants. Landcare groups continue to be active and healthy.
30
SE
CT
ION
1 S
EC
TIO
N 2
SE
CT
ION
3 S
EC
TIO
N 4
SE
CT
ION
5 S
EC
TIO
N 6
SE
CT
ION
7
REPORTING CATCHMENT CONDITION
ANNUAL
CONDITION REPORT
WIYN-MURRUP YANGARRAMELA – JOINT FIRE PROJECT
CHALLENGE
The Wadawurrung people of western Victoria expressed an aspiration to practice traditional burning, and reclaim their traditional fire knowledge and culture.
APPROACH
Working in partnership with Wadawurrung the Corangamite CMA assisted the Wadawurung people, broader Aboriginal community in the CCMA region and other partners to attend the Indigenous Fire Workshop in Cape York and undertake two traditional burns.
RESULTS
TThe Wadawurrung, Aboriginal community members, and other partners had the opportunity to develop their skills and knowledge in contemporary and traditional fire management practices through formal training in fire, flora identification, biodiversity monitoring techniques, experiential delivery of traditional burning practices and knowledge exchange between participants.
Two traditional burns were undertaken. One in 2015-16 at Wurdi Youang a property owned and managed by the Wathaurong Aboriginal Co-operative near the You Yangs, and one in 2016-17 at Bakers Lane Reserve a Golden Plains owned public grassland reserve in Teesdale. Both traditional burns were led by Ngarigo Elder Uncle Rod Mason, who shared his knowledge and skills in traditional fire practice.
The project recognises the strong socio-cultural needs of Traditional Owners and Aboriginal people in Victoria to connect with Country through fire practice. Such practice provides a means of fulfilling cultural obligations to manage Country, as well as a way of maintaining wellbeing through traditions associated to the cleansing and healing of Country through the appropriate use of fire.
KEY PARTNERS
Corangamite CMA, Wadawurrung, Wathaurong Aboriginal Co-operative, Golden Plains Shire, DELWP, CFA and Parks Victoria have worked together to enable Traditional Owner and Aboriginal community members to undertake traditional burns.
CASE STUDYRationale for assessment:
• Community participation rates in regional natural resource management engagement events has increased, with 14,301 participants reported in 2016-17, compared with 8,902 in 2015-16. Some of this increased participation was due to both the RCS midterm review and the Regional Floodplain management strategy requiring broad community consultation.
• A number of environmental issues have galvanised communities in the region such as rabbits, soil health and the use of groundwater. Where appropriate Corangamite CMA has worked with other partners to support the local communities in managing these issues.
• The launch of the Our Catchments, Our Communities strategy was a welcome boost as it clearly articulated the Government’s desire for community-driven, placed-based decision making in natural resource management and provided funding to support its implementation.
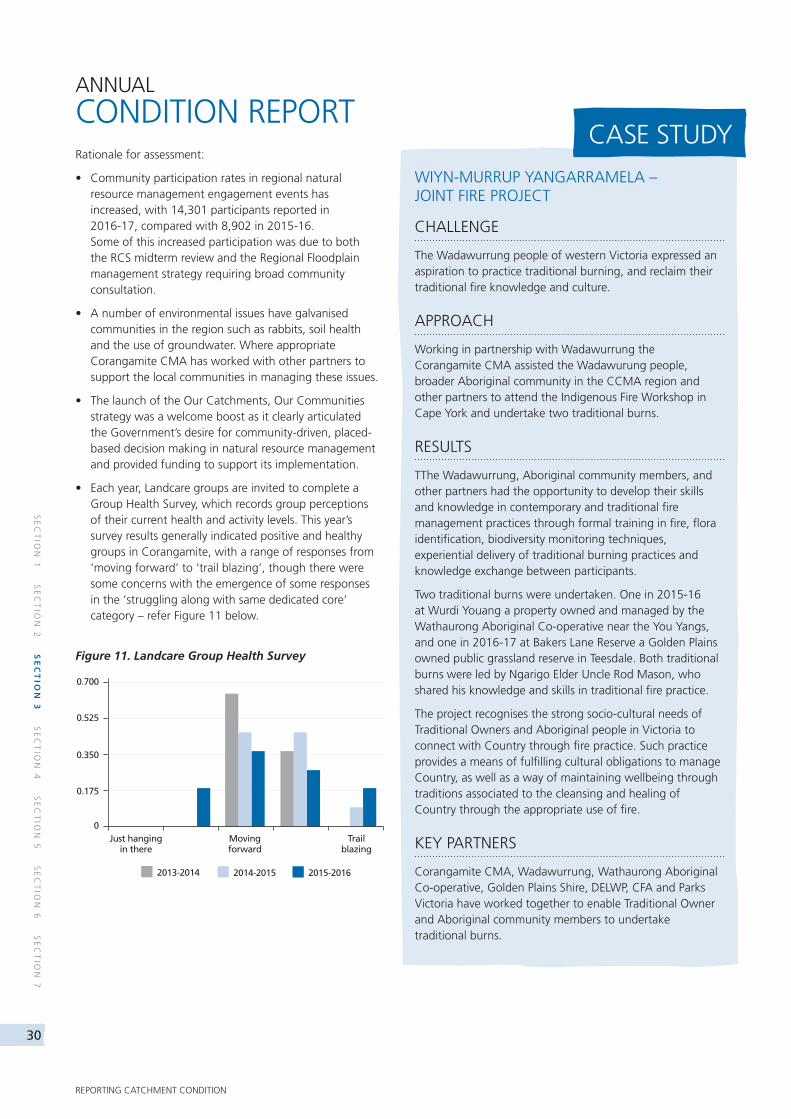
• Each year, Landcare groups are invited to complete a Group Health Survey, which records group perceptions of their current health and activity levels. This year’s survey results generally indicated positive and healthy groups in Corangamite, with a range of responses from ‘moving forward’ to ‘trail blazing’, though there were some concerns with the emergence of some responses in the ‘struggling along with same dedicated core’ category – refer Figure 11 below.
0.700
0.525
0.350
0.175
0Just hanging
in thereMovingforward
Trailblazing
2013-2014 2014-2015 2015-2016
Figure 11. Landcare Group Health Survey
Corangamite CMA Annual Report 2016-2017
31
SE
CT
ION
1 S
EC
TIO
N 2
SE
CT
ION
3 S
EC
TIO
N 4
SE
CT
ION
5 S
EC
TIO
N 6
SE
CT
ION
7
COMMUNITY
PARTICIPATION HISTORY OF PROGRAMS
Our Catchments, Our Communities
Our Catchments, Our Communities focuses on people working better together to coordinate planning, investment and on-ground activities as a more effective and efficient way to achieve a range of environmental, economic and social outcomes. In the Corangamite region more than two-thirds of the catchment is private land managed by rural landholders, their participation, investment and knowledge is essential in realising the vision in the Regional Catchment Strategy. Our Catchments, Our Communities provides the opportunity to achieve this through an integrated catchment management framework.
Projects will demonstrate all following requirements:
• Demonstrate multiple natural resource management outcomes delivering improved waterway health actions with sustainable land and water management practices and better biodiversity outcomes.
• Landscape-scale natural resource management project, or projects that contribute to broader landscape condition improvement.
• Target Regional Catchment Strategy priorities that are currently unfunded or expansion of existing large scale projects.
• Describe how the project will contribute to implementing the Regional Catchment Strategy: condition objectives, management measures, thematic priorities, catchment/landscape asset priorities).
• Be highly collaborative with catchment partners and the community.
• Facilitate leverage against other sources of funding.
• Multi-year approach to delivery.
• Inclusion of a monitoring and evaluation component.
• Use best management practices and principles in delivery of on-ground works.
Projects funded from 2016-20 are:
Connected Landscapes – Adapting Corangamite’s Natural Assets to Climate Change
The ‘Connected Landscapes - Adapting Corangamite’s Natural Assets to Climate Change’ project promotes integrated catchment management and will be delivered through engaging with a broad and diverse range of stakeholders and community NRM groups.
The project has two key components:
• An on ground works program supporting connectivity across the fragmented landscapes of the Woady Yaloak, Leigh and Moorabool River catchments.
• An adaptation pathways approach to planning for the unknown impacts of climate change on the Western District Lakes.
Protecting the Environment via On-farm Water Efficiency
Lead via a partnership between the Corangamite CMA, industry, government and community stakeholders the Protecting the Environment via on-farm water efficiency project is delivering a number of on farm pilot activities to test the viability and effectiveness of modernised on-farm water capture technologies that meet future farming need and achieve improved water efficiency.
This project is responding to the need for more secure water flows to high value environmental assets in the face of climate change.
Sustainable Dairy Management
Lead via a partnership between the Corangamite CMA, Agriculture Victoria, WestVic Dairy, and Landcare, the Sustainable Dairy Management project will engage dairy communities to support whole of farm management of nutrients in the Gellibrand and Curdies river catchments.
Through a combination of on farm extension works and an incentive program the project aims to deliver on-ground improvements to over 20 farms that support a reduction in nutrient runoff and improved farm productivity.
Corangamite Landcare Program
The program continues to support more than 152 community-based environmental volunteer groups, with over 4,200 members. These volunteers work to protect, enhance and restore the landscape on private and public land while connecting individuals to a common cause and social network.
The region’s 11 Landcare networks support and assist their communities with the help of locally-based coordinators. The Corangamite CMA works in partnership with the Landcare networks to strengthen community engagement and participation, delivering on action 3.8 of the Water for Victoria water plan.
Regional Landcare Facilitator Program
The Corangamite Regional Landcare Facilitator program works with community, industry and agricultural production groups to promote and support the uptake of sustainable farming and land management practices across the region.
The program provides opportunities for partnerships between dairy, cropping and grazing industry leaders, Landcare and the Corangamite CMA. The program also supports Landcare to engage with a broader audience including rural women, peri urban land managers, viticulture and horticulture producers.
It has a significant role in increasing the skills and confidence of land managers to adopt best practice and try innovative approaches by supporting peer learning among the farming community, connecting groups and industry leaders.
32
SE
CT
ION
1 S
EC
TIO
N 2
SE
CT
ION
3 S
EC
TIO
N 4
SE
CT
ION
5 S
EC
TIO
N 6
SE
CT
ION
7
REPORTING CATCHMENT CONDITION
COMMUNITY
PARTICIPATION Indigenous Participation Program
Corangamite CMA Indigenous Participation Program commenced in late 2013. The program is funded by the Australian Government National Landcare Programme. This program’s objectives are:
• to strengthen existing relationships and establish new relationships between Aboriginal communities, Indigenous people and natural resource management groups and/or practitioners
• provide support to Aboriginal communities and Indigenous people to participate in environment and agriculture management
• include capacity building and training programs for Aboriginal communities and Indigenous people
• encourage inclusion of Indigenous knowledge into NRM planning and delivery.
Waterwatch Program
Corangamite CMA’s Waterwatch program has been raising community understanding of water quality and catchment health issues through its volunteer water quality data collection program since 1995. A recent change in approach to Waterwatch’s freshwater education program has provided schools with hands-on education activities and exciting online resources. Waterwatch operates across the region with the support of Barwon Water and Central Highlands Water. Additional support is provided in Ballarat by the City of Ballarat, and around Corio Bay with the Bellarine Catchment Network.
EstuaryWatch Program
The EstuaryWatch monitoring program was established in 2006 and continues monthly monitoring at 17 estuaries across Victoria, 12 of which are in the Corangamite CMA region. EstuaryWatch volunteers conduct three types of monitoring – estuary mouth condition monitoring, physical and chemical monitoring and event based monitoring. There are currently 127 active EstuaryWatchers across the state, with 93 of these monitoring in the Corangamite CMA region. The program engages multiple agencies and the community to ensure a holistic approach to estuary management. The program also raises awareness and provides educational opportunities to the community in estuarine environments.
NRM planning for climate change
The Corangamite CMA has worked in consultation with a wide range of stakeholders to develop the Corangamite Natural Resource Management (NRM) Plan for Climate Change. The plan has enabled the Corangamite CMA to incorporate climate change mitigation and adaptation into future regional NRM plans e.g. the Corangamite Regional Catchment Strategy. The plan is an enabling document with a key target audience being the region’s NRM planners and those working directly with the region’s NRM groups.
To achieve this, the plan:
• Provides regional information on the projected changes in climate and its likely impact on the region’s natural assets.
• Provides guidance to the Corangamite CMA and other regional NRM agencies in developing adaptation and mitigation actions to address the impact of climate change on our region’s natural ecosystems.
• Identifies priority landscapes for carbon plantings and other carbon sequestration methods, as well as strategies to build landscape integrity.
• Provides guidance for regional decision-making, community engagement and research needs to improve understanding of the impact of climate change, and how we can manage those impacts.
The plan complements the South West Climate Change Portal, which was developed in partnership with the Glenelg Hopkins CMA and all local government authorities in the south west. The portal can be accessed at www.swclimatechange.com.au. The portal incorporates all relevant climate change data and information, with the ability to include new information as it becomes available.
The plan was developed through funding provided by the Australian Government through the Department of the Environment.
Natural Resources Management (NRM) Planning Portal
The NRM Planning Portal promotes the sharing of local knowledge/information relevant to natural resource management to inform the priorities of key stakeholder groups in the region. More specifically, the project:
• provides information on natural assets spatially, as well as the priorities from both a regional and local perspective
• provides standardised templates to help guide groups and individuals develop on-ground action plans and/or funding proposals
• allows users to add quality controlled data, such as project data and field observations, for the benefit of all users.
Corangamite CMA Annual Report 2016-2017
33
SE
CT
ION
1 S
EC
TIO
N 2
SE
CT
ION
3 S
EC
TIO
N 4
SE
CT
ION
5 S
EC
TIO
N 6
SE
CT
ION
7
COMMUNITY
PARTICIPATION The information can be arranged to allow filtering by geographic areas or topics and is designed to assist in developing on-ground actions for integrated catchment management.
After two Landscape Zones were developed in 2015 (Thompsons in partnership with Surf Coast and Inland Plains Network and Woady in partnership with the Woady Yaloak Catchment group). Two additional Landscape Zones – Bellarine and Leigh, in partnership with the Bellarine Landcare Network and Leigh Catchment Network respectively, were completed in June 2016. More Landscape Zones will be developed in the remainder of 2016, with all landscape zones expected to be completed by 2017.
The NRM Planning Portal can be accessed at www.ccmaknowledgebase.vic.gov.au/nrmpp/
Individual Landholders
The Corangamite CMA also implements a riparian incentive program in partnership with Landcare networks and Barwon Water through its waterway protection program (refer to Water chapter for further details).
HIGHLIGHTS AND ACHIEVEMENTS
Our Catchments Our Communities
• The On Farm Water Efficiency project (OFWE) advisory group has been established to provide strategic guidance and advice along with additional skills and experience to the project design, review and enhancement over the four year life of the OCOC program, delivering on action 3.3 of the Water for Victoria water plan.
• Sustainable Dairy Project advisory group has been established with community, industry and agency stakeholders (Landcare, Corangamite CMA, WestVic Dairy, DEDJTR South West Dairy Team), delivering on action 3.3 of the Water for Victoria water plan.
• Connected Landscapes – Adapting Corangamite’s Natural Assets to Climate Change has developed connections with local government, catchment groups, Trust For Nature, industry partners and the recently established alliance of community groups focussing on biodiversity connectivity in the north of the Corangamite Catchment. These stakeholders are all looking to work together to deliver increased biodiversity and catchment health on ground improvements, delivering on action 3.3 of the Water for Victoria water plan.
• Through a partnership with RMIT University the Adaptation Pathways for the Western District Lakes project has commenced bringing together a diverse group of stakeholders to test a new approach to strategic planning for climate change impacts on our natural assets, delivering on action 3.3 of the Water for Victoria water plan.
Landcare Program
• Recognition of the contributions of volunteers and capturing their stories through the Faces of Landcare project celebrating the regions 30 years of Landcare.
• Showcasing the Corangamite region at the National Landcare Conference through presentations and three field trips to the region.
• 458 participants involved in 26 community learning events.
• Distributed the 2016-17 Victorian Landcare Grants in Corangamite program through 14 project grants and 30 support grants.
• Promoting the achievements of Landcare in over 140 articles, posts and tweets on YouTube, e-news, and traditional and social media.
Regional Landcare Facilitation Program
• Women on Farms workshop series delivered in partnership with Southern Farming Systems with 55 participants.
• Otway Food and Fibre Showcase event delivered in partnership with Central Otway Landcare Network with over 2,000 attendees, 50 local producers and 14 guest speakers.
• Farm business workshops delivered with Landcare networks to support the sustainable farm family aspect of sustainable farming.
• Horses for Clean Water USA study tour to exchange knowledge on best practice horse property management.
• The RLF program continues to attract new participants with over 50 per cent of participants not members of Landcare.
34
SE
CT
ION
1 S
EC
TIO
N 2
SE
CT
ION
3 S
EC
TIO
N 4
SE
CT
ION
5 S
EC
TIO
N 6
SE
CT
ION
7
REPORTING CATCHMENT CONDITION
COMMUNITY
PARTICIPATION Indigenous Participation Program
• Two Aboriginal Trainees employed with the Corangamite CMA have moved into fulltime employment in personally preferred positions.
• Two Aboriginal community members completed Certificate IV in Aboriginal Cultural Heritage Management through La Trobe University.
• Corangamite CMA works with all Traditional Owner groups and two Co-operatives within the region.
• More than 150 people have attended the Wiyn-murrup Yangarramela joint fire project field days.
• Over 60 Aboriginal youth have attended cultural session to connect with Country.
• Approx 50 Aboriginal people have completed skills development activities/courses.
Waterwatch Program
• The development of the Victorian Waterwatch web portal has provided unprecedented access to the valuable data collected by Waterwatch monitors in the 24 years of the Waterwatch program. Visit www.vic.waterwatch.org.au to discover current and long term water quality data in easy to read maps and charts.
• 77 community citizen scientists have been provided with training to collect water quality data and conduct photopoint monitoring for 180 sites, delivering on action 3.8 of the Water for Victoria water plan, strengthen community engagement and participation.
• River Detectives, a pilot freshwater education program inititated by State Government and the North Central CMA, supported 20 schools in Corangamite. With additional support of stakeholders including City of Ballarat, River Detectives has been extended to additional schools resulting in 40 registered schools in 2017.
• The Corangamite Waterwatch program has engaged with 4,467 people in a variety of presentations and field days providing greater awareness of local waterway issues.
• Waterwatch and EstuaryWatch data has been included in the EPA’s new Yarra and Bay Report Card recognising the valuable contribution of the region’s citizen scientists’ data.
EstuaryWatch Program
• Barwon River EstuaryWatch have established physical and chemical monitoring sites on Reedy Lake to inform the environmental watering regime of the Lower Barwon Wetlands.
• The “Little Wild Kids River Walk” in Peterborough was a new event connecting young families to their local environment. There were 18 adults and 20 children from Peterborough, Warrnambool, Simpson and Timboon in attendance.
• The EstuaryWatch Victoria web portal was launched www.estuarywatch.org.au. All active Corangamite CMA EstuaryWatch groups are uploading their monthly EstuaryWatch data to the new portal.
• EstuaryWatch was incorporated into the Diploma of Conservation and Land Management at The Gordon. Students participate in workshops and monitor Spring Creek Estuary once a month.
• 90 community citizen scientists have been provided with training to collect water quality data, mouth condition and conduct photopoint monitoring for 12 estuaries in the Corangamite region, delivering on Action 3.8 of the Water for Victoria water plan, strengthen community engagement and participation.
Planning for Climate Change
• The regional NRM Plan for Climate Change released, and the development of an internal decision support tool that is based on resilience, landscape connectivity, priority locations for carbon biosequestration and other adaptation priorities, to guide investment for projects that address priorities of the plan.
• Launch of an external web based portal that incorporates the key components of the plan and decision support tool.
• Partnership project with Deakin University and Corangamite CMA addressing blue carbon opportunities at a regional level.
• A NRM planning process, called ‘adaptation pathways’, that enables multiple possible future outcomes and addresses the uncertainty of climate change.
Natural Resource Management Planning Portal
• Continual development of an external web based portal that spatially displays regional and local NRM priorities, historic NRM onground works and other relevant spatial information to assist NRM planning.
• Search tools have been integrated to improve reporting on existing NRM spatial information.
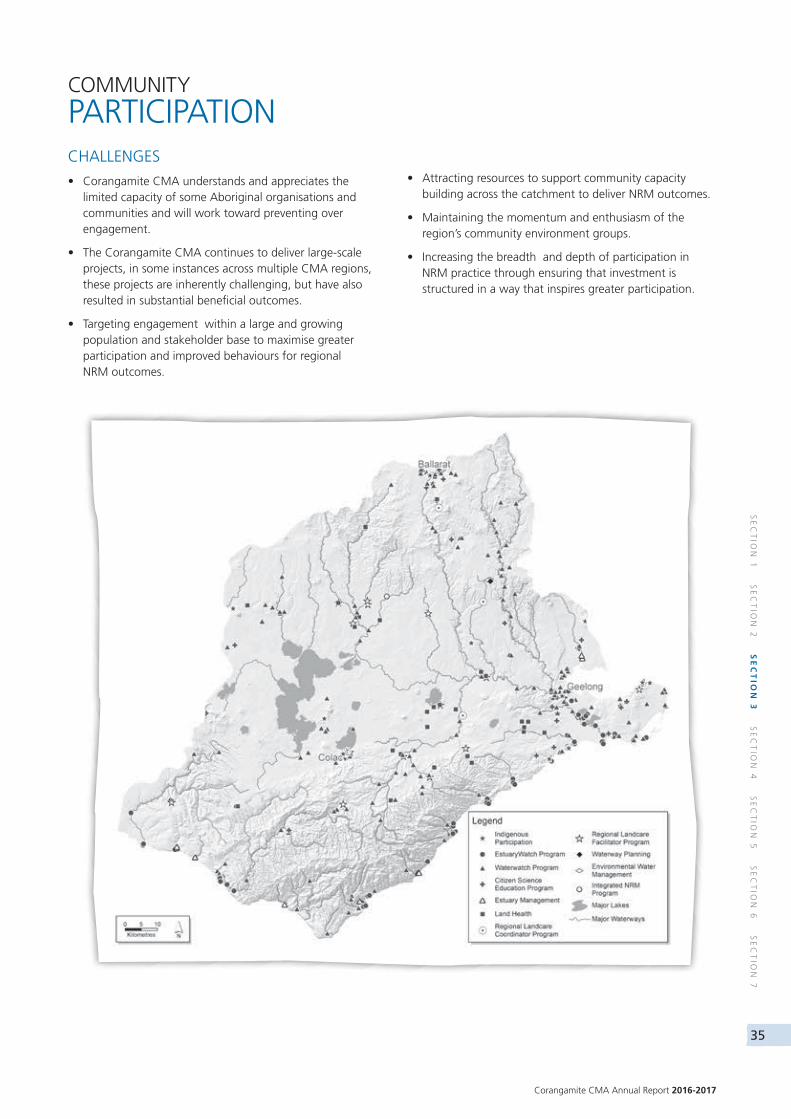
Corangamite CMA Annual Report 2016-2017
35
SE
CT
ION
1 S
EC
TIO
N 2
SE
CT
ION
3 S
EC
TIO
N 4
SE
CT
ION
5 S
EC
TIO
N 6
SE
CT
ION
7
COMMUNITY
PARTICIPATION CHALLENGES
• Corangamite CMA understands and appreciates the limited capacity of some Aboriginal organisations and communities and will work toward preventing over engagement.
• The Corangamite CMA continues to deliver large-scale projects, in some instances across multiple CMA regions, these projects are inherently challenging, but have also resulted in substantial beneficial outcomes.
• Targeting engagement within a large and growing population and stakeholder base to maximise greater participation and improved behaviours for regional NRM outcomes.
• Attracting resources to support community capacity building across the catchment to deliver NRM outcomes.
• Maintaining the momentum and enthusiasm of the region’s community environment groups.
• Increasing the breadth and depth of participation in NRM practice through ensuring that investment is structured in a way that inspires greater participation.
36
SE
CT
ION
1 S
EC
TIO
N 2
SE
CT
ION
3 S
EC
TIO
N 4
SE
CT
ION
5 S
EC
TIO
N 6
SE
CT
ION
7
REPORTING CATCHMENT CONDITION
BIODIVERSITYHISTORY OF PROGRAMS
Victorian Volcanic Plains and Western District Lakes Recovery Program
The Victorian Volcanic Plains (VVP) and Western District Lakes Recovery Program uses financial incentives combined with community engagement and capacity building programs to deliver conservation outcomes in high priority asset areas.
These assets include:
• EPBC listed species and EPBC listed ecological communities, including wetlands, woodlands and grasslands.
• Western District Lakes Ramsar sites.
The project is funded through the Australian Government National Landcare Programme and has been broken into four sub-projects:
• The VVP Stewardship Project: This project will utilise a market-based incentive, PlainsTender, to enable the delivery of on-ground actions.
• VVP EPBC, Ramsar and Living Landscapes: This project aims to reduce critical threats to, and enhance the condition, connectivity, resilience and knowledge of, EPBC listed threatened species and communities.
• VVP Extension Officer: The role incorporates flexibility in approach by working with the EPBC Compliance Unit and has a strong link with the linear reserve management project in association with DELWP.
• VVP community grants: A community grants program to protect ecological communities and threatened species on the VVP in the Corangamite CMA region.
Conservation and Carbon Capture Project
The six-year Conservation and Carbon Capture Project was designed to implement a range of remnant protection works and establish revegetation with an emphasis on carbon sequestration, coupled with multiple environmental benefits. It further utilises DELWP Full-CAM EnSym modelling allowing the assessment of impacts of revegetation and vegetation enhancement activities on other ecosystem services.
The first round of contracts are in place until 2018. The second round of the project funding was combined with further Australian Government money and incorporated into PlainsTender round 6 and Coastal Tender round 3.
HIGHLIGHTS AND ACHIEVEMENTS
The Victorian Volcanic Plains (VVP) and Western District Lakes Recovery Program
• 267 people attended a variety of workshops and forums aimed at building community capacity in appreciating and managing the unique volcanic landscape.
• 1,328 ha of native vegetation is being actively managed by landholders, including 983 ha of Plains Grassland.
• VVP seed production area at the Geelong Botanic Gardens was launched.
• Three Most Significant Change videos were produced promoting the works of participating landholders and the influence the PlainsTender project has had on their life.
Conservation and Carbon Capture Project management
• 32 landholders attended two field days facilitating networking and knowledge exchange between participating landholders.
• 890 ha of remnant and revegetation sites actively managed.
• Tile surveys for grassland fauna were completed.
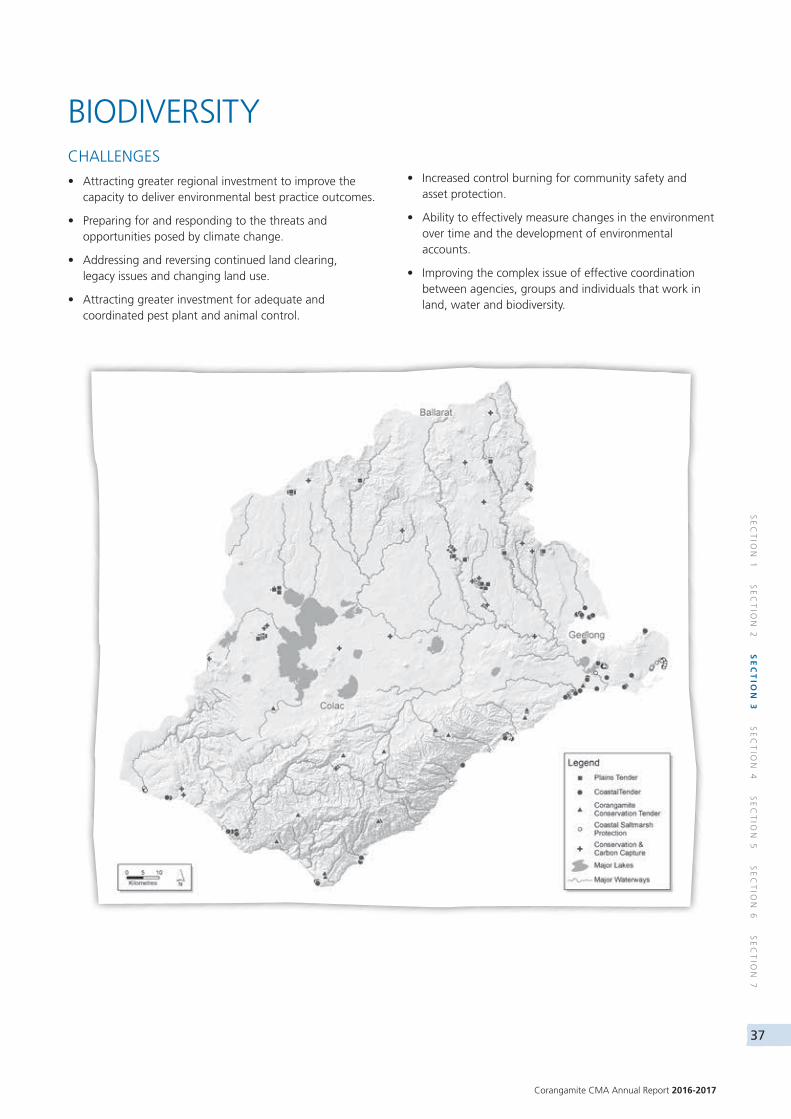
Corangamite CMA Annual Report 2016-2017
37
SE
CT
ION
1 S
EC
TIO
N 2
SE
CT
ION
3 S
EC
TIO
N 4
SE
CT
ION
5 S
EC
TIO
N 6
SE
CT
ION
7
BIODIVERSITYCHALLENGES
• Attracting greater regional investment to improve the capacity to deliver environmental best practice outcomes.
• Preparing for and responding to the threats and opportunities posed by climate change.
• Addressing and reversing continued land clearing, legacy issues and changing land use.
• Attracting greater investment for adequate and coordinated pest plant and animal control.
• Increased control burning for community safety and asset protection.
• Ability to effectively measure changes in the environment over time and the development of environmental accounts.
• Improving the complex issue of effective coordination between agencies, groups and individuals that work in land, water and biodiversity.
38
SE
CT
ION
1 S
EC
TIO
N 2
SE
CT
ION
3 S
EC
TIO
N 4
SE
CT
ION
5 S
EC
TIO
N 6
SE
CT
ION
7
REPORTING CATCHMENT CONDITION
WATER HISTORY OF PROGRAMS
Waterway Restoration Program
The Corangamite CMA as the regional caretaker of waterway health, is responsible for coordinating the development and implementation of management actions across the Corangamite region, to conserve and enhance its waterways (rivers, streams, estuaries and wetlands). Priority waterways for action have been identified within the Corangamite Waterway Strategy 2014-2022, with the aim of protecting key social, economic, environmental and cultural assets across the Corangamite region to benefit the broader community.
Water Statutory Functions
This program delivers the river health statutory functions for floodplain, drainage and waterway management under the Water Act 1989 and corresponding CMA Statement of Obligations.
The Floodplain Statutory team delivers the CMA’s floodplain management responsibilities, including flood response activities, provision of flood and coastal inundation advice, development of flood studies and floodplain management plans, flood awareness and responding to local government planning scheme and building regulation referrals; works on waterways permits, and rural drainage management.
Drainage Scheme Management
The Woady Yaloak Diversion Scheme, constructed in 1959, is part of a flood protection scheme for agriculture properties on the shores of Lake Corangamite and Lake Gnarpurt.
The scheme diverts flows from the Woady Yaloak River just south of Cressy via an earthen channel to Warrambine Creek, a Barwon River tributary.
The Lough Calvert drainage Scheme protects rural properties in the lower, middle and upper Loughs from flooding from Lake Colac.
The Corangamite CMA region experienced significant rainfall and flooding in September, 2016. This was the most significant rain the region had received for about five years. As a result, Cundare Pool filled and water flowed through the Cundare Barrage culverts and into Lake Corangamite. Given recent history of drainage scheme operation that Lake Corangamite was so low (1.7m below trigger level), it was decided not to operate the scheme.
Mitigation of priority assets in the Woady Yaloak Diversion and Lough Calvert Drainage Schemes Project
The aim of this project is to minimise risk to the Corangamite CMA, its staff and the public regarding the management of the Woady Yaloak Diversion Scheme (WYDS)and Lough Calvert Drainage Scheme (LCDS).
This will be achieved via a detailed planning phase followed by significant OHS and operational infrastructure upgrades. Once the project is completed the CMA proposes to extend the boundary of the Western District Lakes Ramsar site to include Cundare Pool/Lake Martin and manage the scheme for its environmental values.
Barwon River through Geelong
This program is responsible for managing public space along 20 kilometres of the Barwon River through Geelong, between Queens Park Bridge and the lower breakwater.
The area provides popular recreation facilities, including a shared walking and bike path, fishing platforms, boat ramps, a rowing landing, and picnic areas.
The Corangamite CMA’s objective is to protect and restore the environmental, cultural and social values along the river and its adjoining parkland.
Environmental Water Management
The Corangamite CMA currently manages two formal environmental entitlements in the Moorabool and lower Barwon Wetlands on behalf of the Victorian Environmental Water Holder. The management of these entitlements includes the development, implementation, and monitoring of annual Seasonal Watering Proposals delivered in partnership with water corporations, the Victorian Environmental Water Holder, community groups, local government, public land managers, government agencies and industry.
In addition Corangamite CMA have been progressing the following priority projects in partnership with Government and community stakeholders:
• Implementation of action 7.3 of the Western Sustainable Water Strategy – returning summer flows to the Gellibrand River.
• Improving the community’s understanding of environmental water and environmental water actions and progress in the Barwon and Moorabool systems.
• Lowering of water levels at Reedy Lake in 2016-17 and communicating the outcomes of the changed management arrangements.
• Development of the new Upper Barwon Environmental Entitlement (action 4.17b in the Central Sustainable Water Strategy).
• Consultation associated with working with Barwon Water on releasing water from Painkalac Reservoir.
The Corangamite CMA also has a role in the assessment of referred applications from Southern Rural Water for take and use of water under section 51 of the Water Act 1989.
Corangamite CMA Annual Report 2016-2017
39
SE
CT
ION
1 S
EC
TIO
N 2
SE
CT
ION
3 S
EC
TIO
N 4
SE
CT
ION
5 S
EC
TIO
N 6
SE
CT
ION
7
WATER HIGHLIGHTS AND ACHIEVEMENTS
Waterway Restoration Program
• In total 132 sites were registered under the expressions of interest, covering a total river frontage length of 108 km and an area of 745 ha.
• Each of these sites was examined during a site assessment and management plans were developed for each site by the CMA.
• Following the evaluation of proposals, 37 landholders were awarded contracts, many with multiple project sites. In total a river frontage length of 108 km and area of 473 ha has been under active management under the program, delivering on action 3.4 of the Water for Victoria water plan, investment to improve waterway health.
• Management activity varies depending on the site, but typically includes; pest plant and animal control (weeds and rabbits), fencing for stock exclusion and revegetation.
Water Statutory Functions
• Launch of the Corangamite Floodplain Portal. Developed in partnership with Federation University Ballarat Campus the portal provides the community with access to the latest flood data and preliminary floodplain advice.
• Corangamite CMA has supported the preparation of State wide floodplain development guidelines.
• Delivery of the Regional Floodplain Management Strategy is well underway with key stakeholder and broader community engagement including Traditional Owners to inform the development of the strategy completed.
• The Corangamite CMA receives and processes high volumes of planning referrals, flood advice requests and Works on Waterways applications, in the past 12 months 377 flood advice requests, 474 planning referrals, and 92 Works on Waterway applications were received.
• Two new MOUs have been signed off to return Special Building Overlays related planning applications and flood advice requests to the City of Greater Geelong.
• The Lower Barwon River and Lower Moorabool River flood risk management study is running to schedule with the second hold point for hydrology currently underway. This study will provide valuable flood information to help define flood related controls, land use planning decisions, emergency response planning, flood advice, and update the Municipal Emergency Management Plan Flood Sub-plan.
Drainage Scheme Program
• Lower Barwon Tidal Barrage Condition Assessment and Concept Design completed.
• Mitigation of priority asset risks in the Woady Yaloak Diversion and Lough Calvert Drainage Schemes project was instigated.
• The upgrade of the Cundare Barrage Fishway now allows thousands of native fish to leave the hypersaline waters of Lake Corangamite to obtain refuge in Cundare Pool and the Woady Yaloak River.
• Lake Colac Literature Review completed as recommended by the Lake Colac Coordinating Committee.
Mitigation of priority assets in the Woady Yaloak Diversion and Lough Calvert Drainage Schemes Project
• The development of Project Management and Community Engagement Plans.
• Legal advice has been obtained to clarify numerous issues.
• Cultural Heritage and Biodiversity due diligence has been completed for works at some essential drainage infrastructure.
• The condition of the two WYDS siphons have been assessed.
• The CMA has begun the process to work with local government and landowners to rationalise crossings over the channels.
• The purpose and outcomes of the project are regularly communicated at the Lake Colac Coordinating Committee Meeting and to landowners that are members of the Woady Yaloak Advisory Committee.
Barwon River Through Geelong
• Construction of a 180 m long rowing landing to support the social and economic benefits provided by rowing to the Geelong community.
Environmental Water Management
• The Corangamite CMA has successfully completed a 12 month wetting and drying regime at Reedy Lake. This is the first time this has occurred since the entitlement was established in 2011. This milestone represents a significant environmental achievement in restoring an important area of Victoria’s biodiversity.
• Increased water availability has allowed substantial environmental flows to be delivered to the Moorabool River, delivering on action 3.5 of the Water for Victoria water plan, improved environmental water management. While the river is still significantly flow stressed, this has resulted in improved environmental and community outcomes.
• Work has been undertaken to improve environmental flows in a number of unregulated systems including the Anglesea River, Painkalac Creek, and the Gellibrand River.
• Planning has commenced for the Upper Barwon entitlement, delivering on action 3.5 of the Water for Victoria water plan, improved environmental water management.
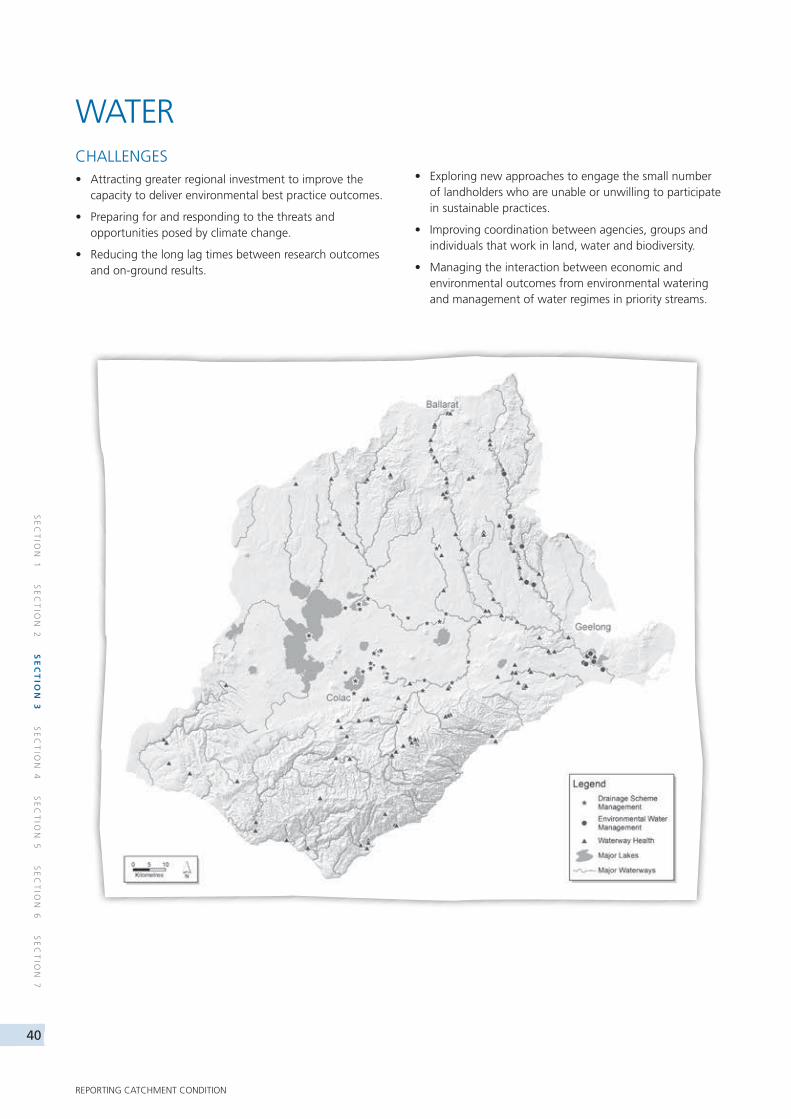
40
SE
CT
ION
1 S
EC
TIO
N 2
SE
CT
ION
3 S
EC
TIO
N 4
SE
CT
ION
5 S
EC
TIO
N 6
SE
CT
ION
7
REPORTING CATCHMENT CONDITION
CHALLENGES • Attracting greater regional investment to improve the
capacity to deliver environmental best practice outcomes.
• Preparing for and responding to the threats and opportunities posed by climate change.
• Reducing the long lag times between research outcomes and on-ground results.
• Exploring new approaches to engage the small number of landholders who are unable or unwilling to participate in sustainable practices.
• Improving coordination between agencies, groups and individuals that work in land, water and biodiversity.
• Managing the interaction between economic and environmental outcomes from environmental watering and management of water regimes in priority streams.
WATER

Corangamite CMA Annual Report 2016-2017
41
SE
CT
ION
1 S
EC
TIO
N 2
SE
CT
ION
3 S
EC
TIO
N 4
SE
CT
ION
5 S
EC
TIO
N 6
SE
CT
ION
7
LANDHISTORY OF PROGRAMS
Land Health Program
Land Health Program works with Corangamite’s dairy, grazing and cropping farmers to support practice changes for land health, sustainable farming and natural resource protection. Changes in soil management and sustainable farming practices have the potential to generate productivity grains and environmental improvements in the dairy, cropping and gracing industries.
This project aims to encourage a wider adoption of sustainable practice. Some practices are innovative, like pasture cropping, while others are more widely known. The project focuses on practices that affect groundcover, soil biology, soil erosion and nutrient loss, especially where they affect the regional high value natural assets. The project team has worked with the community and existing projects to identify and address barriers to adoption of these changes. This included developing information packages, economic analyses and demonstrations, tailored to issues, industries and locations across the region.
Pest Plants and Animals
Corangamite CMA’s pest plants and animals role is primarily strategic. The organisation provides guidance to agencies including the DEDJTR, DEWLP and Parks Victoria about the natural assets to protect against invasive plant and animal species. These priorities are listed in the Corangamite Invasive plant and Animal Management Strategy.
Pest plant and animal control is also an integrated part of the authority’s programs which deliver on ground works through contracted projects. This occurs in particular through the delivery of on ground programs within the waterways, biodiversity and coastal program areas.
HIGHLIGHTS AND ACHIEVEMENTS
Land Health Program
• The Land Health Team has produced an integrated EOI process referred to as “The 2017-2018 Corangamite Community Grants program”.
• The number of volunteers participating in project activities has climbed to 3,743 over 116 events producing 75,000 ha of farm land undergoing management practice change.
• The Upper Barwon Landcare Network produced the first regional edition of the “Farm Talk” magazine.
• The mid-program review of the Land Health Program was approved by the Australian Government acknowledging the thorough review and ongoing work to improve delivery.
Pest plan and animal control
• Integrated pest plant and animal control continued to be delivered as a key component of contracts works through a range of on ground projects.
• Land Health Team are providing strategic advice to the Victorian Serrated Tussock Working Party, Victorian Gorse Taskforce and Colac Otway Shire Weeds Consultative Committee.
• Funding of a local rabbit action network has brought together 115 landholders over 3,800 ha to coordinate control treatments with the national K5 Calici virus release.
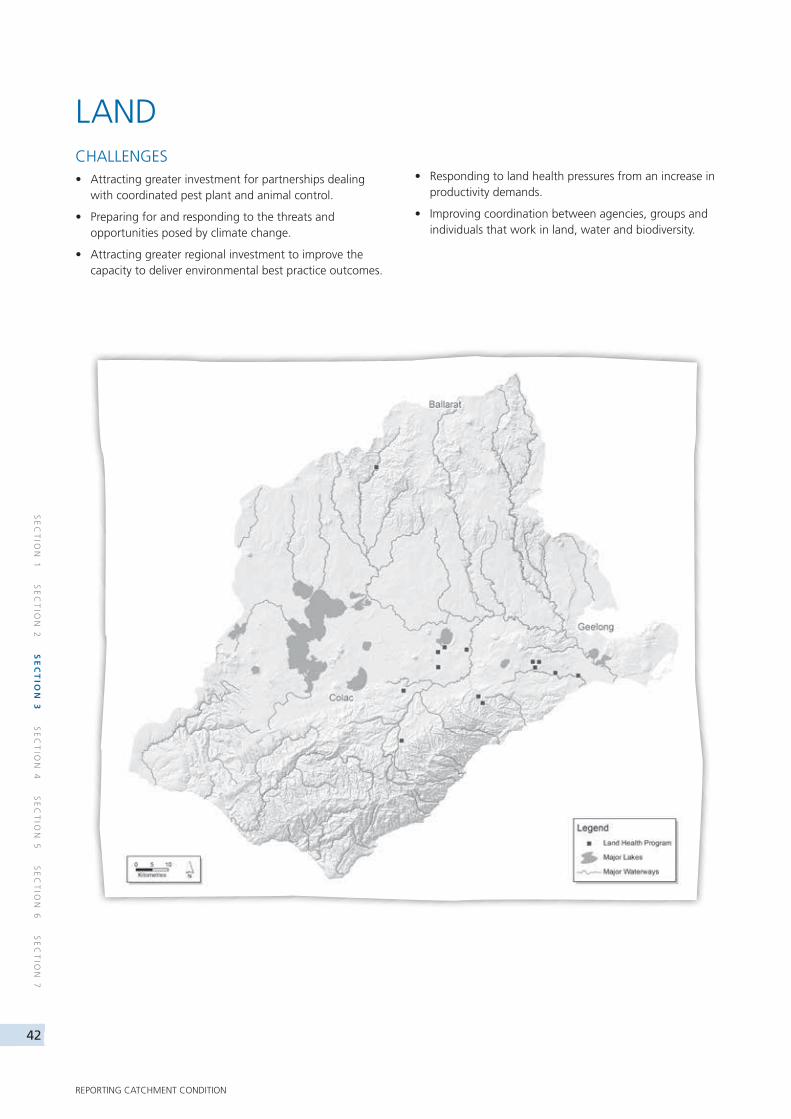
42
SE
CT
ION
1 S
EC
TIO
N 2
SE
CT
ION
3 S
EC
TIO
N 4
SE
CT
ION
5 S
EC
TIO
N 6
SE
CT
ION
7
REPORTING CATCHMENT CONDITION
LANDCHALLENGES• Attracting greater investment for partnerships dealing
with coordinated pest plant and animal control.
• Preparing for and responding to the threats and opportunities posed by climate change.
• Attracting greater regional investment to improve the capacity to deliver environmental best practice outcomes.
• Responding to land health pressures from an increase in productivity demands.
• Improving coordination between agencies, groups and individuals that work in land, water and biodiversity.
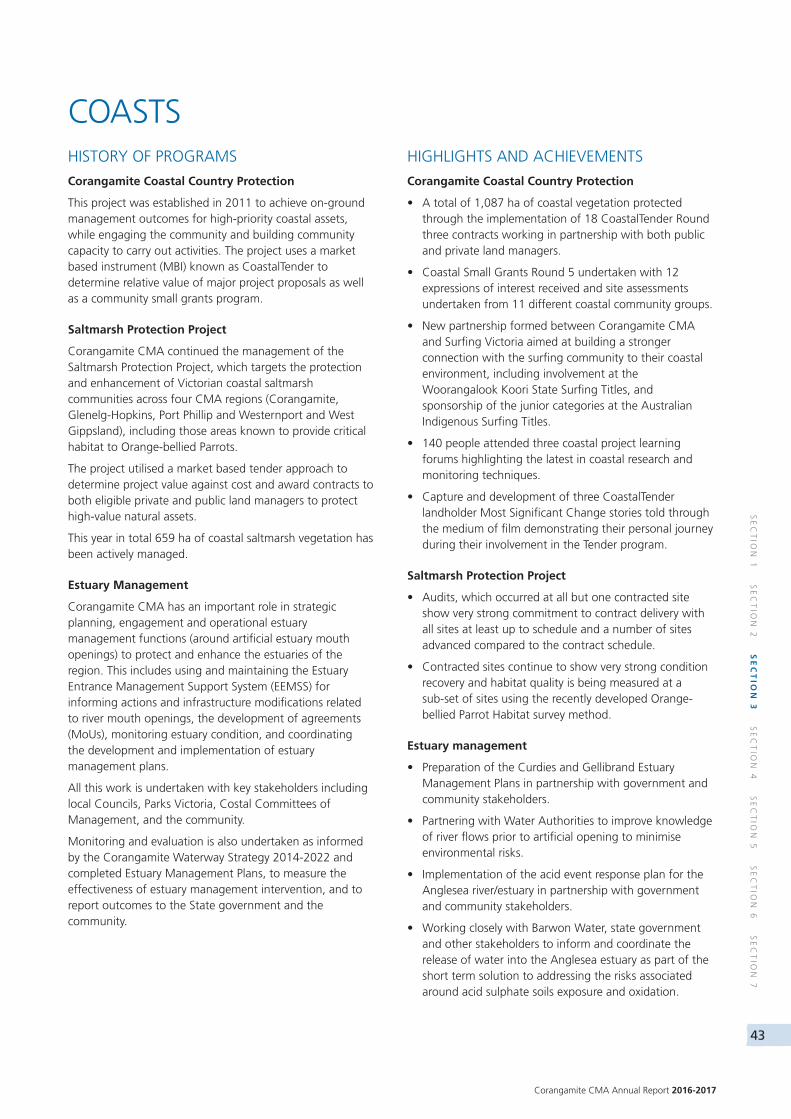
Corangamite CMA Annual Report 2016-2017
43
SE
CT
ION
1 S
EC
TIO
N 2
SE
CT
ION
3 S
EC
TIO
N 4
SE
CT
ION
5 S
EC
TIO
N 6
SE
CT
ION
7
COASTSHISTORY OF PROGRAMS
Corangamite Coastal Country Protection
This project was established in 2011 to achieve on-ground management outcomes for high-priority coastal assets, while engaging the community and building community capacity to carry out activities. The project uses a market based instrument (MBI) known as CoastalTender to determine relative value of major project proposals as well as a community small grants program.
Saltmarsh Protection Project
Corangamite CMA continued the management of the Saltmarsh Protection Project, which targets the protection and enhancement of Victorian coastal saltmarsh communities across four CMA regions (Corangamite, Glenelg-Hopkins, Port Phillip and Westernport and West Gippsland), including those areas known to provide critical habitat to Orange-bellied Parrots.
The project utilised a market based tender approach to determine project value against cost and award contracts to both eligible private and public land managers to protect high-value natural assets.
This year in total 659 ha of coastal saltmarsh vegetation has been actively managed.
Estuary Management
Corangamite CMA has an important role in strategic planning, engagement and operational estuary management functions (around artificial estuary mouth openings) to protect and enhance the estuaries of the region. This includes using and maintaining the Estuary Entrance Management Support System (EEMSS) for informing actions and infrastructure modifications related to river mouth openings, the development of agreements (MoUs), monitoring estuary condition, and coordinating the development and implementation of estuary management plans.
All this work is undertaken with key stakeholders including local Councils, Parks Victoria, Costal Committees of Management, and the community.
Monitoring and evaluation is also undertaken as informed by the Corangamite Waterway Strategy 2014-2022 and completed Estuary Management Plans, to measure the effectiveness of estuary management intervention, and to report outcomes to the State government and the community.
HIGHLIGHTS AND ACHIEVEMENTS
Corangamite Coastal Country Protection
• A total of 1,087 ha of coastal vegetation protected through the implementation of 18 CoastalTender Round three contracts working in partnership with both public and private land managers.
• Coastal Small Grants Round 5 undertaken with 12 expressions of interest received and site assessments undertaken from 11 different coastal community groups.
• New partnership formed between Corangamite CMA and Surfing Victoria aimed at building a stronger connection with the surfing community to their coastal environment, including involvement at the Woorangalook Koori State Surfing Titles, and sponsorship of the junior categories at the Australian Indigenous Surfing Titles.
• 140 people attended three coastal project learning forums highlighting the latest in coastal research and monitoring techniques.
• Capture and development of three CoastalTender landholder Most Significant Change stories told through the medium of film demonstrating their personal journey during their involvement in the Tender program.
Saltmarsh Protection Project
• Audits, which occurred at all but one contracted site show very strong commitment to contract delivery with all sites at least up to schedule and a number of sites advanced compared to the contract schedule.
• Contracted sites continue to show very strong condition recovery and habitat quality is being measured at a sub-set of sites using the recently developed Orange-bellied Parrot Habitat survey method.
Estuary management
• Preparation of the Curdies and Gellibrand Estuary Management Plans in partnership with government and community stakeholders.
• Partnering with Water Authorities to improve knowledge of river flows prior to artificial opening to minimise environmental risks.
• Implementation of the acid event response plan for the Anglesea river/estuary in partnership with government and community stakeholders.
• Working closely with Barwon Water, state government and other stakeholders to inform and coordinate the release of water into the Anglesea estuary as part of the short term solution to addressing the risks associated around acid sulphate soils exposure and oxidation.
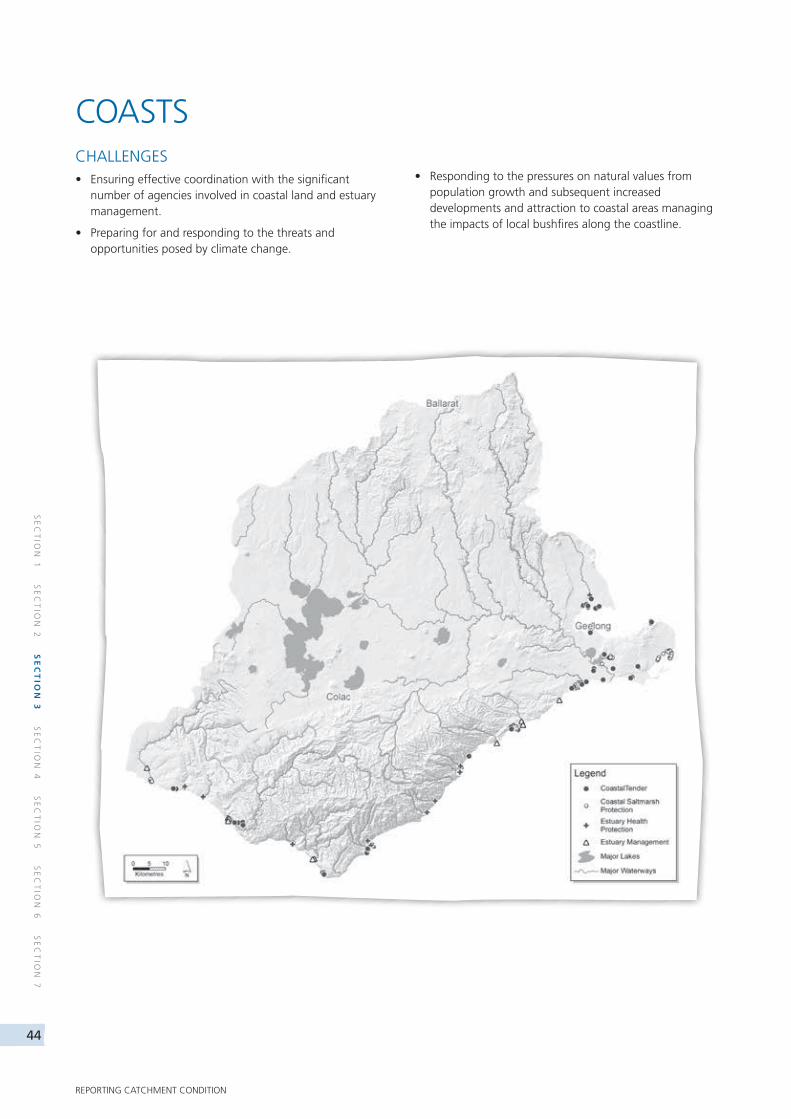
44
SE
CT
ION
1 S
EC
TIO
N 2
SE
CT
ION
3 S
EC
TIO
N 4
SE
CT
ION
5 S
EC
TIO
N 6
SE
CT
ION
7
REPORTING CATCHMENT CONDITION
COASTSCHALLENGES• Ensuring effective coordination with the significant
number of agencies involved in coastal land and estuary management.
• Preparing for and responding to the threats and opportunities posed by climate change.
• Responding to the pressures on natural values from population growth and subsequent increased developments and attraction to coastal areas managing the impacts of local bushfires along the coastline.
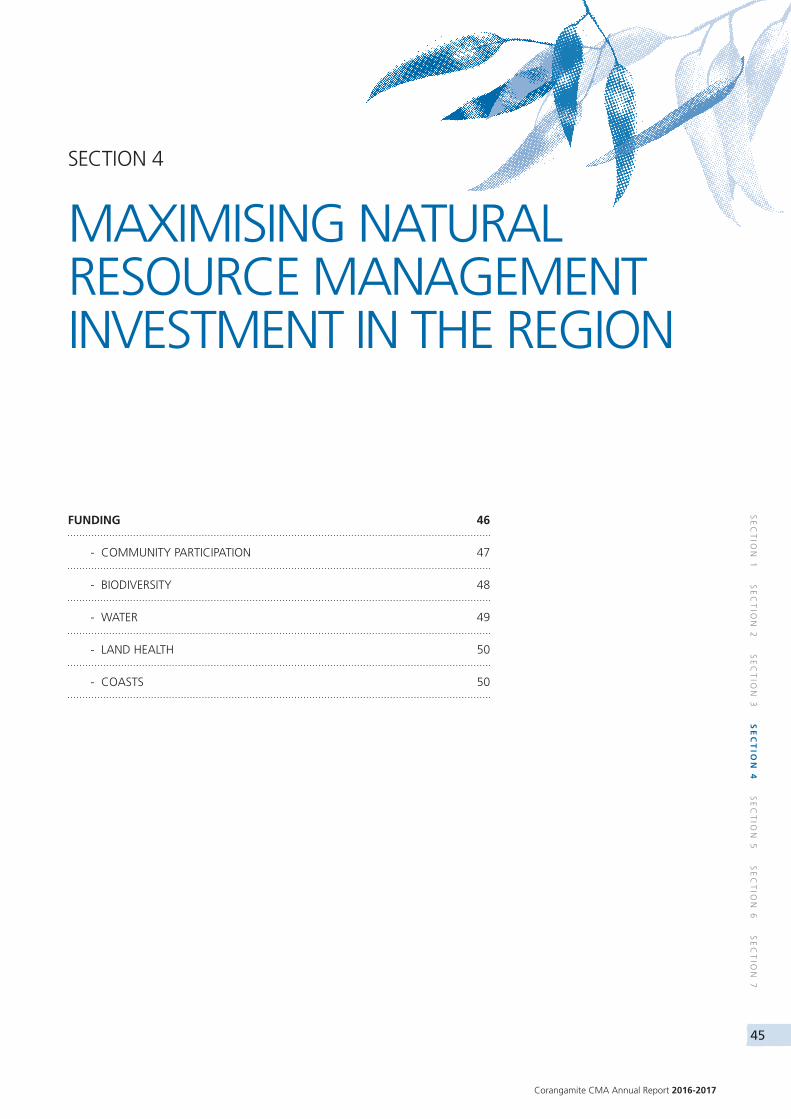
Corangamite CMA Annual Report 2016-2017
45
SE
CT
ION
1 S
EC
TIO
N 2
SE
CT
ION
3 S
EC
TIO
N 4
SE
CT
ION
5 S
EC
TIO
N 6
SE
CT
ION
7
FUNDING 46
- COMMUNITY PARTICIPATION 47
- BIODIVERSITY 48
- WATER 49
- LAND HEALTH 50
- COASTS 50
SECTION 4
MAXIMISING NATURAL RESOURCE MANAGEMENT INVESTMENT IN THE REGION
46
SE
CT
ION
1 S
EC
TIO
N 2
SE
CT
ION
3 S
EC
TIO
N 4
SE
CT
ION
5 S
EC
TIO
N 6
SE
CT
ION
7
MAXIMISING NATURAL RESOURCE MANAGEMENT INVESTMENT IN THE REGION
The authority develops and submits funding applications primarily to the Victorian and Australian governments.
The Corangamite CMA also submits applications to secure additional funding for the region as the opportunities arise throughout the year.
VICTORIAN GOVERNMENT
The Victorian Government provides funding under the Water Act 1989 and the Catchment and Land Protection Act (CaLP) 1994. The main funding sources from the Victorian Government include:
• Victorian River and Wetland Management Program
• Victorian Landcare Program
• Our Catchments our Communities.
The Corangamite CMA received project funding totalling $7,341,352 through the Victorian Government in 2016-17.
AUSTRALIAN GOVERNMENT
Australian Government’s funding initiative to invest in the conservation and management of Australia’s natural resource assets which is primarily achieved through the Regional Delivery Fund. The goal of Australian Government Regional Delivery Fund is to have an environment that is healthy, better protected, well managed and resilient, and provides essential ecosystem services in a changing climate.
In 2011-12 funding was secured for five years from the Biodiversity fund which continues to be delivered through to 2016-17. Funding was also secured for NRM planning for Climate Change.
The Corangamite CMA received $2,632,205 in project funding from the Federal Government in 2016-17.
FUNDING
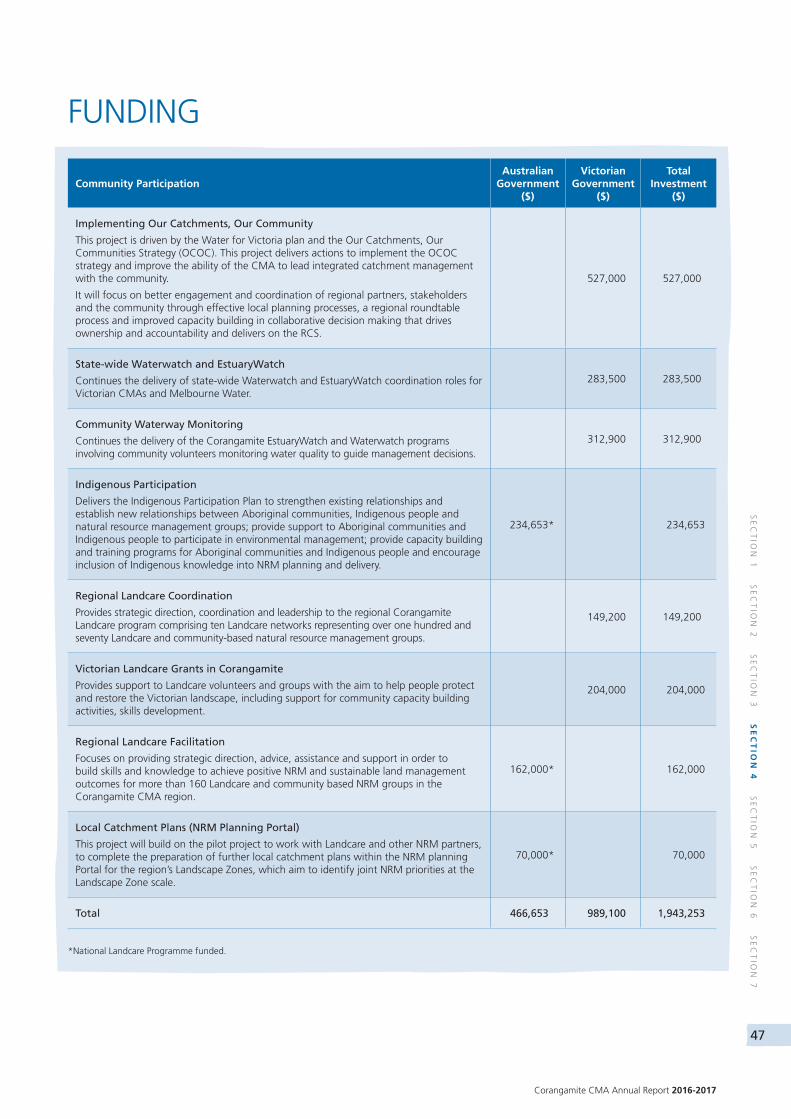
Corangamite CMA Annual Report 2016-2017
47
SE
CT
ION
1 S
EC
TIO
N 2
SE
CT
ION
3 S
EC
TIO
N 4
SE
CT
ION
5 S
EC
TIO
N 6
SE
CT
ION
7
FUNDING
Community Participation Australian
Government ($)
Victorian Government
($)
Total Investment
($)
Implementing Our Catchments, Our Community
This project is driven by the Water for Victoria plan and the Our Catchments, Our Communities Strategy (OCOC). This project delivers actions to implement the OCOC strategy and improve the ability of the CMA to lead integrated catchment management with the community.
It will focus on better engagement and coordination of regional partners, stakeholders and the community through effective local planning processes, a regional roundtable process and improved capacity building in collaborative decision making that drives ownership and accountability and delivers on the RCS.
527,000 527,000
State-wide Waterwatch and EstuaryWatch
Continues the delivery of state-wide Waterwatch and EstuaryWatch coordination roles for Victorian CMAs and Melbourne Water.
283,500 283,500
Community Waterway Monitoring
Continues the delivery of the Corangamite EstuaryWatch and Waterwatch programs involving community volunteers monitoring water quality to guide management decisions.
312,900 312,900
Indigenous Participation
Delivers the Indigenous Participation Plan to strengthen existing relationships and establish new relationships between Aboriginal communities, Indigenous people and natural resource management groups; provide support to Aboriginal communities and Indigenous people to participate in environmental management; provide capacity building and training programs for Aboriginal communities and Indigenous people and encourage inclusion of Indigenous knowledge into NRM planning and delivery.
234,653* 234,653
Regional Landcare Coordination
Provides strategic direction, coordination and leadership to the regional Corangamite Landcare program comprising ten Landcare networks representing over one hundred and seventy Landcare and community-based natural resource management groups.
149,200 149,200
Victorian Landcare Grants in Corangamite
Provides support to Landcare volunteers and groups with the aim to help people protect and restore the Victorian landscape, including support for community capacity building activities, skills development.
204,000 204,000
Regional Landcare Facilitation
Focuses on providing strategic direction, advice, assistance and support in order to build skills and knowledge to achieve positive NRM and sustainable land management outcomes for more than 160 Landcare and community based NRM groups in the Corangamite CMA region.
162,000* 162,000
Local Catchment Plans (NRM Planning Portal)
This project will build on the pilot project to work with Landcare and other NRM partners, to complete the preparation of further local catchment plans within the NRM planning Portal for the region’s Landscape Zones, which aim to identify joint NRM priorities at the Landscape Zone scale.
70,000* 70,000
Total 466,653 989,100 1,943,253
*National Landcare Programme funded.
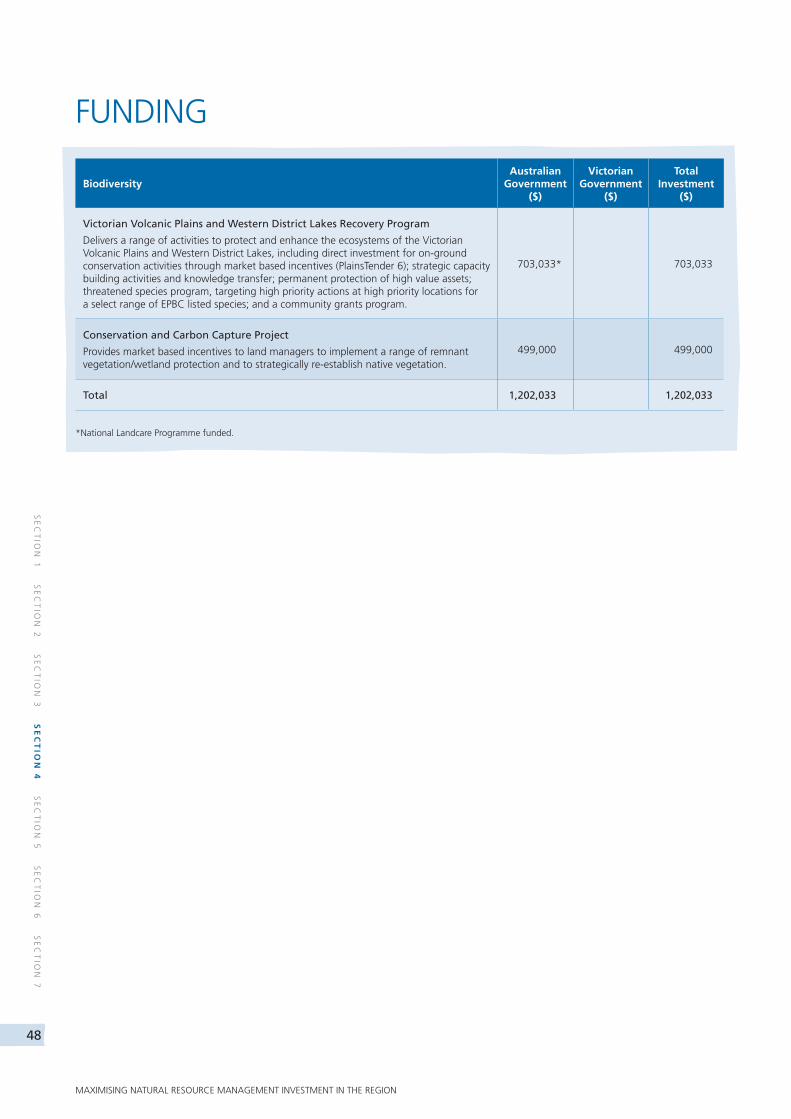
48
SE
CT
ION
1 S
EC
TIO
N 2
SE
CT
ION
3 S
EC
TIO
N 4
SE
CT
ION
5 S
EC
TIO
N 6
SE
CT
ION
7
MAXIMISING NATURAL RESOURCE MANAGEMENT INVESTMENT IN THE REGION
FUNDING
BiodiversityAustralian
Government ($)
Victorian Government
($)
Total Investment
($)
Victorian Volcanic Plains and Western District Lakes Recovery Program
Delivers a range of activities to protect and enhance the ecosystems of the Victorian Volcanic Plains and Western District Lakes, including direct investment for on-ground conservation activities through market based incentives (PlainsTender 6); strategic capacity building activities and knowledge transfer; permanent protection of high value assets; threatened species program, targeting high priority actions at high priority locations for a select range of EPBC listed species; and a community grants program.
703,033* 703,033
Conservation and Carbon Capture Project
Provides market based incentives to land managers to implement a range of remnant vegetation/wetland protection and to strategically re-establish native vegetation.
499,000 499,000
Total 1,202,033 1,202,033
*National Landcare Programme funded.
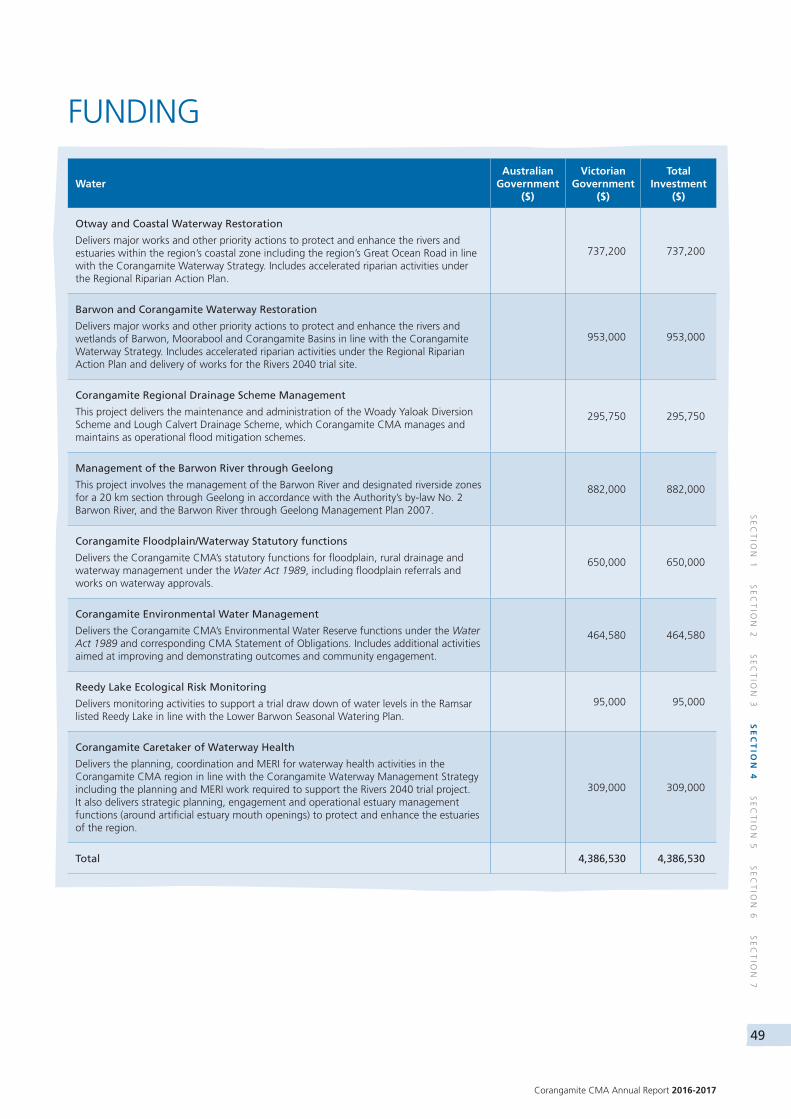
Corangamite CMA Annual Report 2016-2017
49
SE
CT
ION
1 S
EC
TIO
N 2
SE
CT
ION
3 S
EC
TIO
N 4
SE
CT
ION
5 S
EC
TIO
N 6
SE
CT
ION
7
WaterAustralian
Government ($)
Victorian Government
($)
Total Investment
($)
Otway and Coastal Waterway Restoration
Delivers major works and other priority actions to protect and enhance the rivers and estuaries within the region’s coastal zone including the region’s Great Ocean Road in line with the Corangamite Waterway Strategy. Includes accelerated riparian activities under the Regional Riparian Action Plan.
737,200 737,200
Barwon and Corangamite Waterway Restoration
Delivers major works and other priority actions to protect and enhance the rivers and wetlands of Barwon, Moorabool and Corangamite Basins in line with the Corangamite Waterway Strategy. Includes accelerated riparian activities under the Regional Riparian Action Plan and delivery of works for the Rivers 2040 trial site.
953,000 953,000
Corangamite Regional Drainage Scheme Management
This project delivers the maintenance and administration of the Woady Yaloak Diversion Scheme and Lough Calvert Drainage Scheme, which Corangamite CMA manages and maintains as operational flood mitigation schemes.
295,750 295,750
Management of the Barwon River through Geelong
This project involves the management of the Barwon River and designated riverside zones for a 20 km section through Geelong in accordance with the Authority’s by-law No. 2 Barwon River, and the Barwon River through Geelong Management Plan 2007.
882,000 882,000
Corangamite Floodplain/Waterway Statutory functions
Delivers the Corangamite CMA’s statutory functions for floodplain, rural drainage and waterway management under the Water Act 1989, including floodplain referrals and works on waterway approvals.
650,000 650,000
Corangamite Environmental Water Management
Delivers the Corangamite CMA’s Environmental Water Reserve functions under the Water Act 1989 and corresponding CMA Statement of Obligations. Includes additional activities aimed at improving and demonstrating outcomes and community engagement.
464,580 464,580
Reedy Lake Ecological Risk Monitoring
Delivers monitoring activities to support a trial draw down of water levels in the Ramsar listed Reedy Lake in line with the Lower Barwon Seasonal Watering Plan.
95,000 95,000
Corangamite Caretaker of Waterway Health
Delivers the planning, coordination and MERI for waterway health activities in the Corangamite CMA region in line with the Corangamite Waterway Management Strategy including the planning and MERI work required to support the Rivers 2040 trial project. It also delivers strategic planning, engagement and operational estuary management functions (around artificial estuary mouth openings) to protect and enhance the estuaries of the region.
309,000 309,000
Total 4,386,530 4,386,530
FUNDING
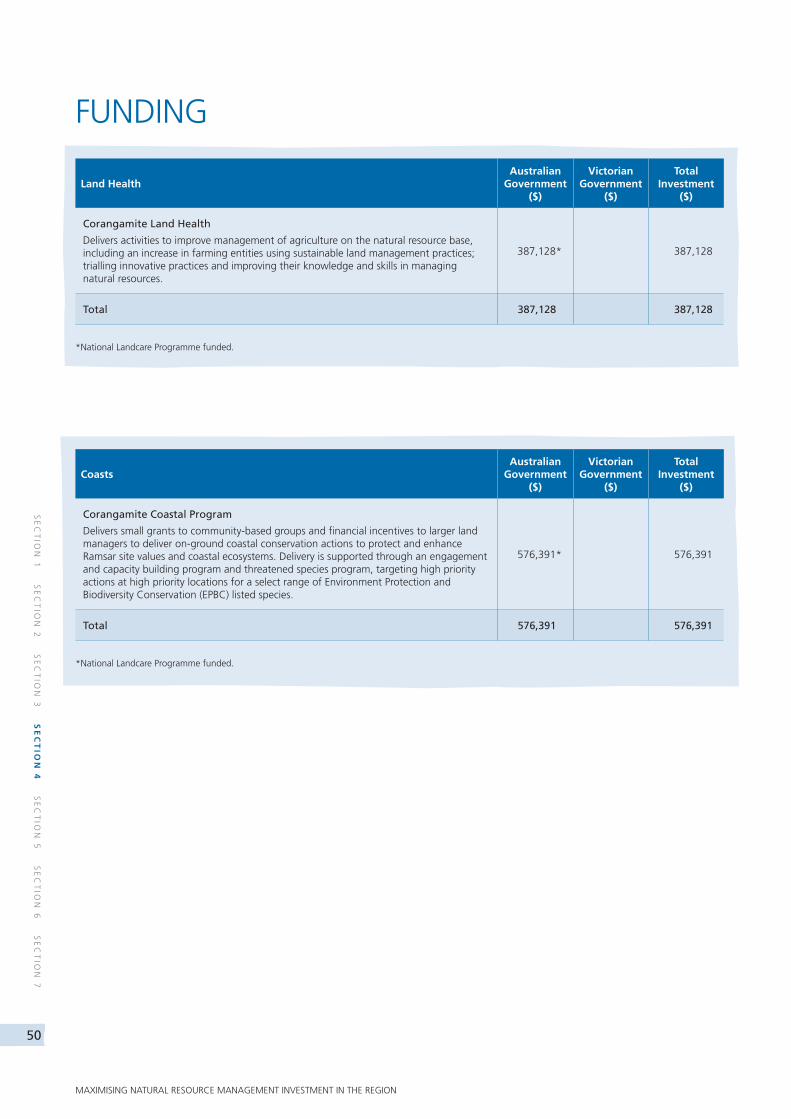
50
SE
CT
ION
1 S
EC
TIO
N 2
SE
CT
ION
3 S
EC
TIO
N 4
SE
CT
ION
5 S
EC
TIO
N 6
SE
CT
ION
7
MAXIMISING NATURAL RESOURCE MANAGEMENT INVESTMENT IN THE REGION
Land HealthAustralian
Government ($)
Victorian Government
($)
Total Investment
($)
Corangamite Land Health
Delivers activities to improve management of agriculture on the natural resource base, including an increase in farming entities using sustainable land management practices; trialling innovative practices and improving their knowledge and skills in managing natural resources.
387,128* 387,128
Total 387,128 387,128
*National Landcare Programme funded.
CoastsAustralian
Government ($)
Victorian Government
($)
Total Investment
($)
Corangamite Coastal Program
Delivers small grants to community-based groups and financial incentives to larger land managers to deliver on-ground coastal conservation actions to protect and enhance Ramsar site values and coastal ecosystems. Delivery is supported through an engagement and capacity building program and threatened species program, targeting high priority actions at high priority locations for a select range of Environment Protection and Biodiversity Conservation (EPBC) listed species.
576,391* 576,391
Total 576,391 576,391
*National Landcare Programme funded.
FUNDING
Corangamite CMA Annual Report 2016-2017
51
SE
CT
ION
1 S
EC
TIO
N 2
SE
CT
ION
3 S
EC
TIO
N 4
SE
CT
ION
5 S
EC
TIO
N 6
SE
CT
ION
7
CORANGAMITE CMA – OUR ORGANISATION 52
COMPLIANCE AND DISCLOSURES 56
SECTION 5
CORANGAMITE CMA – OUR ORGANISATION, COMPLIANCE AND DISCLOSURES
52
SE
CT
ION
1 S
EC
TIO
N 2
SE
CT
ION
3 S
EC
TIO
N 4
SE
CT
ION
5 S
EC
TIO
N 6
SE
CT
ION
7
CORANGAMITE CMA - OUR ORGANISATION, COMPLIANCE AND DISCLOSURES
THE BOARD
Corangamite Catchment Management Authority Boards includes Alice Knight, Chairperson, Hugh Stewart, Deputy Chairperson, Marie Thornton, Nick Reynard, Tamara Boyd, Catherine Jenkins and Fiona Cumming (appointed September 2016).
The Board is accountable for the overall performance of the authority. Its role is to guide and govern the organisation to ensure it meets its responsibilities as determined in the Water Act and CaLP Act.
CHAIRPERSON - ALICE KNIGHT, OAM
Alice Knight is a primary producer and director of a 1,700 ha fine wool pastoral property at Pittong. She is a recipient of an Order of Australia Medal (OAM) for her services to the community, Landcare, environment, the Country Fire Authority and the Anglican church.
This is her second term on the Corangamite CMA Board and was previously a Board member for six years from 2000 to 2006. She is also the Beaufort and Skipton Health Service Board chairman, where she has been a Board member since 1990.
Alice’s passion is Landcare and the Woady Yaloak Catchment Group and she spends many hours working with and encouraging others involvement in landscape change.
Alice and her brother Kevin have received the prestigious national award, the McKell Medal, for conservation farming and community involvement in natural resource management.
During 2016-17 Alice was Chairperson of the Staff and Remuneration Committee, a member of the Community Advisory Group and also an ex-officio to all other Board standing committees.
DEPUTY CHAIRPERSON - HUGH STEWART
Dr Hugh Stewart works in natural resource management, specialising in sustainable management of forest resources, integrated land-use and social dimensions of forestry.
He has worked in the public and private sectors in Australia and overseas, including two years in Zimbabwe on a social forestry project. He is now a forestry consultant, and part of a community forestry project in Indonesia through the Australian Centre for International Agricultural Research.
Since 1992 Hugh has worked with family members to re-develop the 229 ha Stewart family farm at Deans Marsh to achieve sustainable land-use by integrating agroforestry with prime lamb production.
Hugh is a member of the Otway Agroforestry Network and a director of the Natural Resources Conservation League of Victoria.
During 2016-17, Hugh has served as Deputy Chairperson and as a member of the Staff and Remuneration Committee and the Audit and Risk Committee.
MARIE THORNTON
Marie trained as a teacher-librarian and has taught in metropolitan and rural schools on Victoria and New South Wales. She served 12 years as a Board member of Ballarat and Queen’s Anglican Grammar School.
Marie’s interest in the local and regional community includes 11 years on the local council with a term as Shire President. A further two years at the new Colac Otway Shire Council was followed by 12 years as a Board member of South West Water and Wannon Water and recently Barwon Health at Geelong.
Marie and husband Jock have a beef and sheep enterprise near Camperdown. Marie is a member of the newly created Great South Coast Food and Fibre Council and is passionate about Sustainable Agriculture and its potential in this Region.
During 2016-17 Marie has served as the chair of the Business Planning Committee (until October 2016), as a member of the Audit and Risk Committee (until October 2016) and a member of the Staff and Remuneration Committee.
NICK RENYARD
Nick Renyard operates a 400 ha, 550 cow dairy farm with his family near Timboon. He has served as a director of DemoDairy for three years, eight years as a United Dairyfarmers of Victoria Central Councillor and five years as an Australian Dairy Farmers Limited director. He has again taken up a role on the UDV policy council.
As part of his involvement in the dairy industry he has been on numerous committees particularly relating to animal health, animal welfare and farm systems.
He has an Advanced Diploma of Agriculture.
During 2016-17, Nick served on the Business Planning Committee and the Audit and Risk Committee.
CORANGAMITE CMA
– OUR ORGANISATION
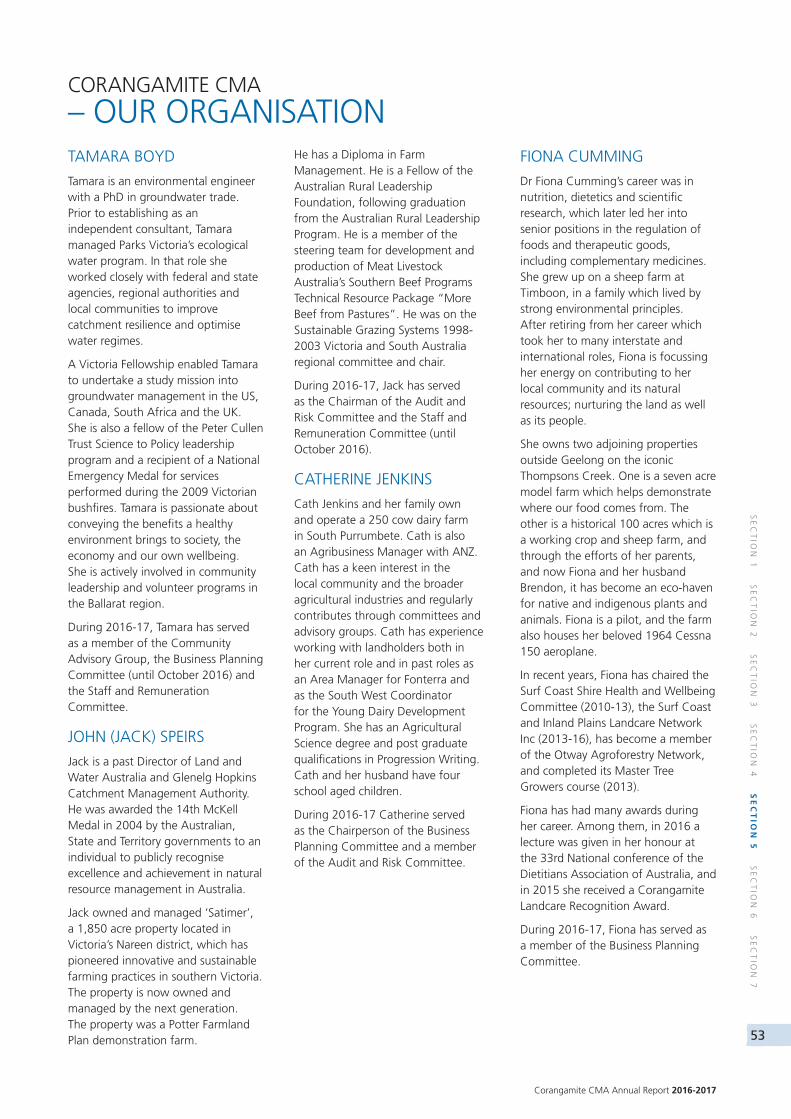
Corangamite CMA Annual Report 2016-2017
53
SE
CT
ION
1 S
EC
TIO
N 2
SE
CT
ION
3 S
EC
TIO
N 4
SE
CT
ION
5 S
EC
TIO
N 6
SE
CT
ION
7
CORANGAMITE CMA
– OUR ORGANISATIONTAMARA BOYD
Tamara is an environmental engineer with a PhD in groundwater trade. Prior to establishing as an independent consultant, Tamara managed Parks Victoria’s ecological water program. In that role she worked closely with federal and state agencies, regional authorities and local communities to improve catchment resilience and optimise water regimes.
A Victoria Fellowship enabled Tamara to undertake a study mission into groundwater management in the US, Canada, South Africa and the UK. She is also a fellow of the Peter Cullen Trust Science to Policy leadership program and a recipient of a National Emergency Medal for services performed during the 2009 Victorian bushfires. Tamara is passionate about conveying the benefits a healthy environment brings to society, the economy and our own wellbeing. She is actively involved in community leadership and volunteer programs in the Ballarat region.
During 2016-17, Tamara has served as a member of the Community Advisory Group, the Business Planning Committee (until October 2016) and the Staff and Remuneration Committee.
JOHN (JACK) SPEIRS
Jack is a past Director of Land and Water Australia and Glenelg Hopkins Catchment Management Authority. He was awarded the 14th McKell Medal in 2004 by the Australian, State and Territory governments to an individual to publicly recognise excellence and achievement in natural resource management in Australia.
Jack owned and managed ‘Satimer’, a 1,850 acre property located in Victoria’s Nareen district, which has pioneered innovative and sustainable farming practices in southern Victoria. The property is now owned and managed by the next generation. The property was a Potter Farmland Plan demonstration farm.
He has a Diploma in Farm Management. He is a Fellow of the Australian Rural Leadership Foundation, following graduation from the Australian Rural Leadership Program. He is a member of the steering team for development and production of Meat Livestock Australia’s Southern Beef Programs Technical Resource Package “More Beef from Pastures”. He was on the Sustainable Grazing Systems 1998-2003 Victoria and South Australia regional committee and chair.
During 2016-17, Jack has served as the Chairman of the Audit and Risk Committee and the Staff and Remuneration Committee (until October 2016).
CATHERINE JENKINS
Cath Jenkins and her family own and operate a 250 cow dairy farm in South Purrumbete. Cath is also an Agribusiness Manager with ANZ. Cath has a keen interest in the local community and the broader agricultural industries and regularly contributes through committees and advisory groups. Cath has experience working with landholders both in her current role and in past roles as an Area Manager for Fonterra and as the South West Coordinator for the Young Dairy Development Program. She has an Agricultural Science degree and post graduate qualifications in Progression Writing. Cath and her husband have four school aged children.
During 2016-17 Catherine served as the Chairperson of the Business Planning Committee and a member of the Audit and Risk Committee.
FIONA CUMMING
Dr Fiona Cumming’s career was in nutrition, dietetics and scientific research, which later led her into senior positions in the regulation of foods and therapeutic goods, including complementary medicines. She grew up on a sheep farm at Timboon, in a family which lived by strong environmental principles. After retiring from her career which took her to many interstate and international roles, Fiona is focussing her energy on contributing to her local community and its natural resources; nurturing the land as well as its people.
She owns two adjoining properties outside Geelong on the iconic Thompsons Creek. One is a seven acre model farm which helps demonstrate where our food comes from. The other is a historical 100 acres which is a working crop and sheep farm, and through the efforts of her parents, and now Fiona and her husband Brendon, it has become an eco-haven for native and indigenous plants and animals. Fiona is a pilot, and the farm also houses her beloved 1964 Cessna 150 aeroplane.
In recent years, Fiona has chaired the Surf Coast Shire Health and Wellbeing Committee (2010-13), the Surf Coast and Inland Plains Landcare Network Inc (2013-16), has become a member of the Otway Agroforestry Network, and completed its Master Tree Growers course (2013).
Fiona has had many awards during her career. Among them, in 2016 a lecture was given in her honour at the 33rd National conference of the Dietitians Association of Australia, and in 2015 she received a Corangamite Landcare Recognition Award.
During 2016-17, Fiona has served as a member of the Business Planning Committee.
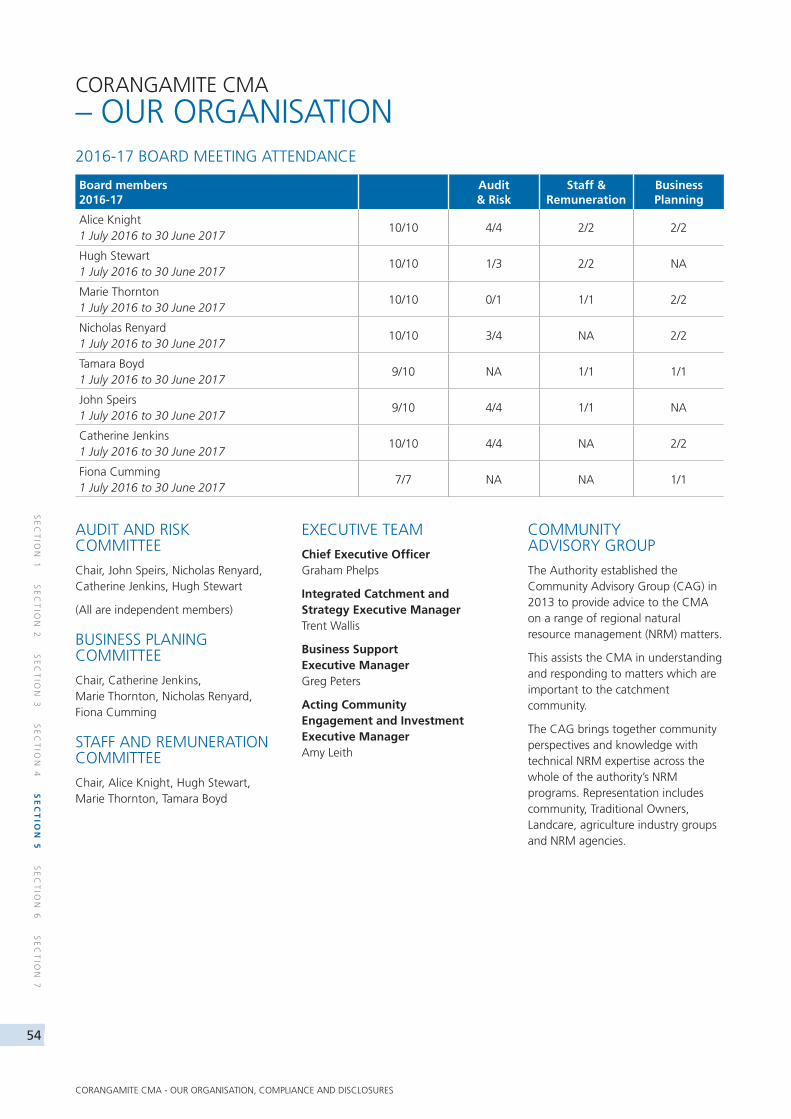
54
SE
CT
ION
1 S
EC
TIO
N 2
SE
CT
ION
3 S
EC
TIO
N 4
SE
CT
ION
5 S
EC
TIO
N 6
SE
CT
ION
7
CORANGAMITE CMA - OUR ORGANISATION, COMPLIANCE AND DISCLOSURES
CORANGAMITE CMA
– OUR ORGANISATION2016-17 BOARD MEETING ATTENDANCE
Board members 2016-17
Audit & Risk
Staff & Remuneration
Business Planning
Alice Knight 1 July 2016 to 30 June 2017
10/10 4/4 2/2 2/2
Hugh Stewart 1 July 2016 to 30 June 2017
10/10 1/3 2/2 NA
Marie Thornton 1 July 2016 to 30 June 2017
10/10 0/1 1/1 2/2
Nicholas Renyard 1 July 2016 to 30 June 2017
10/10 3/4 NA 2/2
Tamara Boyd 1 July 2016 to 30 June 2017
9/10 NA 1/1 1/1
John Speirs 1 July 2016 to 30 June 2017
9/10 4/4 1/1 NA
Catherine Jenkins 1 July 2016 to 30 June 2017
10/10 4/4 NA 2/2
Fiona Cumming 1 July 2016 to 30 June 2017
7/7 NA NA 1/1
AUDIT AND RISK COMMITTEE
Chair, John Speirs, Nicholas Renyard, Catherine Jenkins, Hugh Stewart
(All are independent members)
BUSINESS PLANING COMMITTEE
Chair, Catherine Jenkins, Marie Thornton, Nicholas Renyard, Fiona Cumming
STAFF AND REMUNERATION COMMITTEE
Chair, Alice Knight, Hugh Stewart, Marie Thornton, Tamara Boyd
EXECUTIVE TEAM
Chief Executive Officer Graham Phelps
Integrated Catchment and Strategy Executive Manager Trent Wallis
Business Support Executive Manager Greg Peters
Acting Community Engagement and Investment Executive Manager Amy Leith
COMMUNITY ADVISORY GROUP
The Authority established the Community Advisory Group (CAG) in 2013 to provide advice to the CMA on a range of regional natural resource management (NRM) matters.
This assists the CMA in understanding and responding to matters which are important to the catchment community.
The CAG brings together community perspectives and knowledge with technical NRM expertise across the whole of the authority’s NRM programs. Representation includes community, Traditional Owners, Landcare, agriculture industry groups and NRM agencies.
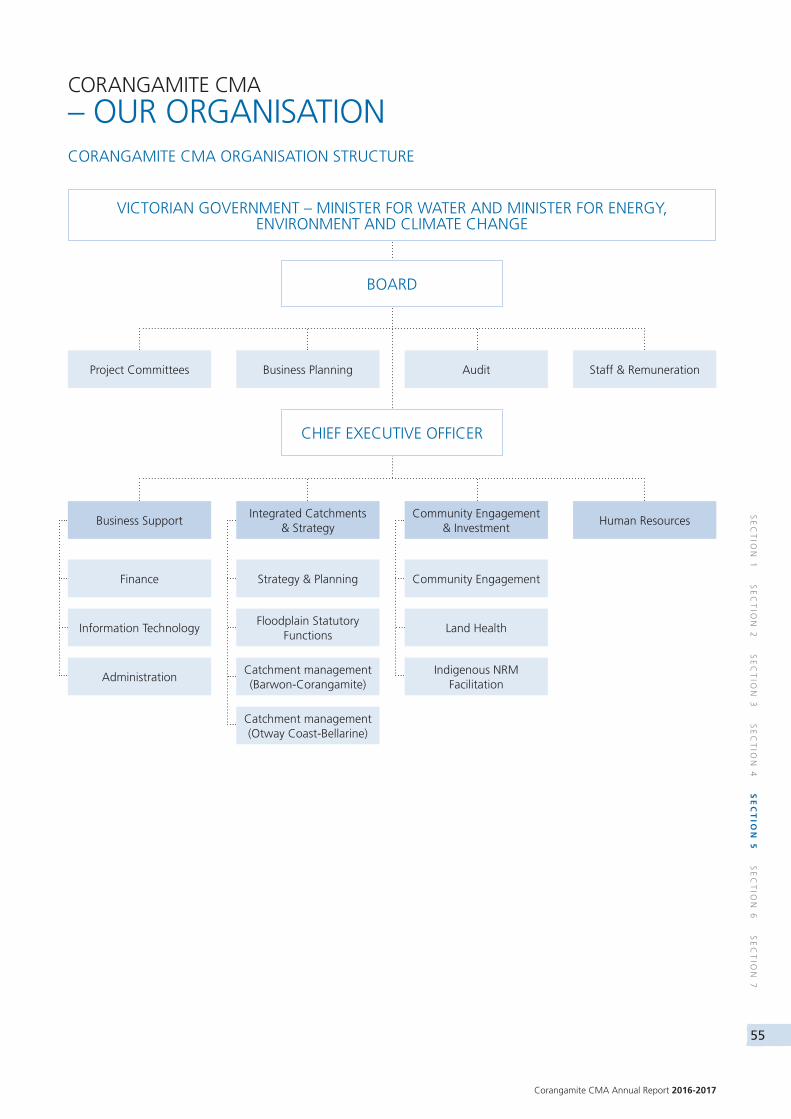
Corangamite CMA Annual Report 2016-2017
55
SE
CT
ION
1 S
EC
TIO
N 2
SE
CT
ION
3 S
EC
TIO
N 4
SE
CT
ION
5 S
EC
TIO
N 6
SE
CT
ION
7
CORANGAMITE CMA
– OUR ORGANISATIONCORANGAMITE CMA ORGANISATION STRUCTURE
Catchment management (Otway Coast-Bellarine)
Catchment management (Barwon-Corangamite)
Floodplain Statutory Functions
Strategy & Planning
BOARD
VICTORIAN GOVERNMENT – MINISTER FOR WATER AND MINISTER FOR ENERGY, ENVIRONMENT AND CLIMATE CHANGE
CHIEF EXECUTIVE OFFICER
Project Committees
Finance
Information Technology
Administration
Business Support
Business Planning
Integrated Catchments & Strategy
Audit
Community Engagement
Land Health
Indigenous NRM Facilitation
Community Engagement & Investment
Staff & Remuneration
Human Resources

56
SE
CT
ION
1 S
EC
TIO
N 2
SE
CT
ION
3 S
EC
TIO
N 4
SE
CT
ION
5 S
EC
TIO
N 6
SE
CT
ION
7
CORANGAMITE CMA - OUR ORGANISATION, COMPLIANCE AND DISCLOSURES
COMPLIANCE AND
DISCLOSURESPEOPLE AND CULTURE
Corangamite CMA Culture Development Program
The Culture Development Program supports the organisation’s leadership and performance goals, and guides our values and behaviours. During 2016-17, the Corangamite CMA reviewed the Purpose, Values and Behaviours of the Corangamite CMA and developed a forward plan to improve professional relationships and enhance the culture.
Staff participated in an internal targeted survey during July and provided feedback against four key themes: Change Management, Effective Communication, Organisational Culture and Workplace Health. The survey attracted a 62 per cent response rate and the results indicated a positive outcome in the areas of communication methods, culture development, professional relationships and building a positive work environment. Some improvement opportunities were also identified within the areas of change management, and workplace health.
Staff Achievements
Corangamite CMA values the contribution, dedication and loyalty of its long service staff members. Service milestones are recognised and celebrated at staff meetings throughout the year.
The following staff reached service milestones during 2016-17:
15 Years:
• Mark Schirmer, Barwon Through Geelong Coordinator
10 Years:
• Greg Peters, Business Support Executive Manager
5 years:
• Jannes Demetrious, Catchment Coordinator
• Rose Herben, EstuaryWatch Coordinator
• Kelly Snell, Strategy Coordinator
• Bret Ryan, Land Health Manager
• Wayne McLaren, Catchment Officer
• Kristen Lees, Waterwatch Facilitator
• Janis Taylor, Financial Accountant
• Geoff Taylor, Floodplain Statutory Functions Manager
Individual staff and teams were also recognised by their peers for their positive contributions that supported the organisation’s achievement of its goals and objectives.
Diversity and Inclusion
Corangamite CMA recognise the positive benefits of diversity and inclusion within its workforce of 45 employees (see Workforce data table below).
Corangamite CMA is committed to equal opportunity and diversity in the workplace and to providing a workplace for staff that is free of all forms of discrimination, bullying and harassment. Our aim is to promote fairness and equity where the rights of individuals are supported and staff are treated with respect and dignity. The Corangamite CMA attracts and recruits a diverse workforce and encourages applications from suitably qualified people. The staff turnover rate for 2016-17 was 6.6 per cent, five positions were advertised with 91 applications received.
Learning and Professional Development
The Corangamite CMA offers study assistance for staff undertaking relevant undergraduate and postgraduate courses and in the past year, three staff chose to pursue tertiary studies. Further learning and development opportunities were identified through the annual staff performance development reviews and the following courses were undertaken throughout the year to enhance knowledge and capabilities.
• Client Interaction and Conflict Management
• Mental Health First Aid
• OH&S for Managers and Supervisors
• Duty of Care for Victorian Employees
• Duty of Care for Victorian Managers and Supervisors
• Procurement
• First Aid and CPR Refresher Training
• Canoe and Kayak training
• Secondments into State government departments
• Work specific conferences and workshops.
Workforce data as at 30 June 2017:
2014-15%
2015-16 %
2016-17 %
Aboriginal Victorians NA 6.6 4.4
Gender profile (male / female) 50 / 50 51 / 49 51 / 49
Youth profile (35 and under) NA 36 33
Mature profile (55 and over) NA 6 18
Gender profile (male / female) of Executive Leadership
100 / 0 100 / 0 75 / 25
Full-time / Part-time / Casual profile NA 78 / 22 / 2 76 / 22 / 2
Total Employees 42 45 45
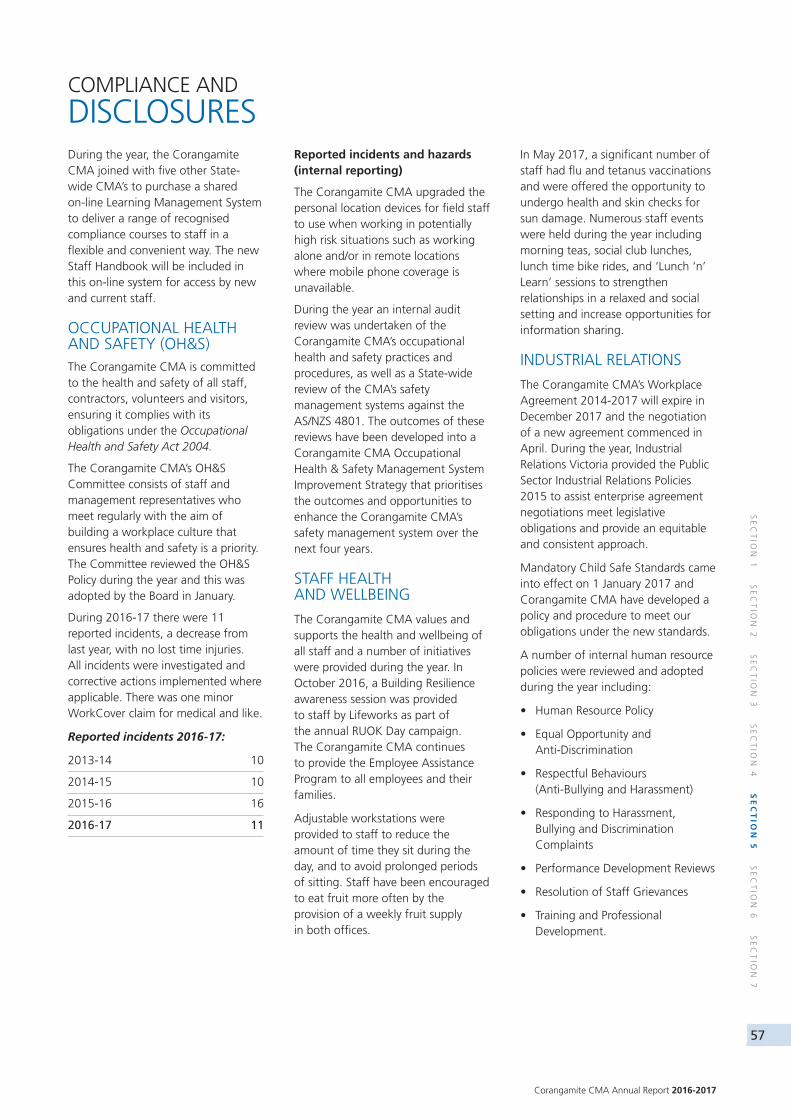
Corangamite CMA Annual Report 2016-2017
57
SE
CT
ION
1 S
EC
TIO
N 2
SE
CT
ION
3 S
EC
TIO
N 4
SE
CT
ION
5 S
EC
TIO
N 6
SE
CT
ION
7
COMPLIANCE AND
DISCLOSURESDuring the year, the Corangamite CMA joined with five other State-wide CMA’s to purchase a shared on-line Learning Management System to deliver a range of recognised compliance courses to staff in a flexible and convenient way. The new Staff Handbook will be included in this on-line system for access by new and current staff.
OCCUPATIONAL HEALTH AND SAFETY (OH&S)The Corangamite CMA is committed to the health and safety of all staff, contractors, volunteers and visitors, ensuring it complies with its obligations under the Occupational Health and Safety Act 2004.
The Corangamite CMA’s OH&S Committee consists of staff and management representatives who meet regularly with the aim of building a workplace culture that ensures health and safety is a priority. The Committee reviewed the OH&S Policy during the year and this was adopted by the Board in January.
During 2016-17 there were 11 reported incidents, a decrease from last year, with no lost time injuries. All incidents were investigated and corrective actions implemented where applicable. There was one minor WorkCover claim for medical and like.
Reported incidents 2016-17:
2013-14 10
2014-15 10
2015-16 16
2016-17 11
Reported incidents and hazards (internal reporting)
The Corangamite CMA upgraded the personal location devices for field staff to use when working in potentially high risk situations such as working alone and/or in remote locations where mobile phone coverage is unavailable.
During the year an internal audit review was undertaken of the Corangamite CMA’s occupational health and safety practices and procedures, as well as a State-wide review of the CMA’s safety management systems against the AS/NZS 4801. The outcomes of these reviews have been developed into a Corangamite CMA Occupational Health & Safety Management System Improvement Strategy that prioritises the outcomes and opportunities to enhance the Corangamite CMA’s safety management system over the next four years.
STAFF HEALTH AND WELLBEING
The Corangamite CMA values and supports the health and wellbeing of all staff and a number of initiatives were provided during the year. In October 2016, a Building Resilience awareness session was provided to staff by Lifeworks as part of the annual RUOK Day campaign. The Corangamite CMA continues to provide the Employee Assistance Program to all employees and their families.
Adjustable workstations were provided to staff to reduce the amount of time they sit during the day, and to avoid prolonged periods of sitting. Staff have been encouraged to eat fruit more often by the provision of a weekly fruit supply in both offices.
In May 2017, a significant number of staff had flu and tetanus vaccinations and were offered the opportunity to undergo health and skin checks for sun damage. Numerous staff events were held during the year including morning teas, social club lunches, lunch time bike rides, and ‘Lunch ‘n’ Learn’ sessions to strengthen relationships in a relaxed and social setting and increase opportunities for information sharing.
INDUSTRIAL RELATIONS
The Corangamite CMA’s Workplace Agreement 2014-2017 will expire in December 2017 and the negotiation of a new agreement commenced in April. During the year, Industrial Relations Victoria provided the Public Sector Industrial Relations Policies 2015 to assist enterprise agreement negotiations meet legislative obligations and provide an equitable and consistent approach.
Mandatory Child Safe Standards came into effect on 1 January 2017 and Corangamite CMA have developed a policy and procedure to meet our obligations under the new standards.
A number of internal human resource policies were reviewed and adopted during the year including:
• Human Resource Policy
• Equal Opportunity and Anti-Discrimination
• Respectful Behaviours (Anti-Bullying and Harassment)
• Responding to Harassment, Bullying and Discrimination Complaints
• Performance Development Reviews
• Resolution of Staff Grievances
• Training and Professional Development.
58
SE
CT
ION
1 S
EC
TIO
N 2
SE
CT
ION
3 S
EC
TIO
N 4
SE
CT
ION
5 S
EC
TIO
N 6
SE
CT
ION
7
CORANGAMITE CMA - OUR ORGANISATION, COMPLIANCE AND DISCLOSURES
COMPLIANCE AND
DISCLOSURESCOMPLIANCE WITH RELEVANT LEGISLATION
Competition policy
Competitive neutrality seeks to enable fair competition between government and private sector businesses.
Any advantages or disadvantages that government businesses may experience, simply as a result of government ownership, should be neutralised.
The Corangamite CMA continues to implement and apply this principle in its business undertakings.
Information available for inspection
Information relevant to the headings listed in Financial Reporting direction 22B of the Financial Management Act 1994 is available on request at the Corangamite CMA’s office, subject to the Freedom of Information Act 1982.
Information includes:
• statements that declarations of pecuniary interests have been completed by all relevant officers
• details of publications produced by the Corangamite CMA and how these can be obtained
• a list of major committees sponsored by the entity, the purposes of each committee and their achievements
• details of assessments and measures undertaken to improve the OH&S of employees.
Building Act
The Corangamite CMA complied with the building and maintenance provisions of the Building Act 1993 in its building and maintenance activities.
Financing costs and lease liabilities
The Corangamite CMA has two properties it leases. Full details of each are available in the Financial Statements (see page 85).
Disclosure index
An index identifying the Corangamite CMA’s compliance with statutory disclosure requirements is contained in Appendix 1 (see page 101).
Victorian industry participation policy implementation
The Victorian Industry Participation Policy Act 2003 requires public bodies and departments to report on implementation of the Victorian Industry Participation Policy (VIPP).
Public bodies are required to apply VIPP in all tenders over $1 million in regional Victoria. No tenders were issued by the Corangamite CMA greater than $1 million for the year ending June 2016.
Government advertising expenditure
Corangamite CMA’s expenditure in the 2016-17 reporting period on government campaign expenditure did not exceed $100,000.
Bank loans, bills payable, promissory notes, debentures and other loans
The Corangamite CMA did not have any bank loans, bills payable, promissory notes, debentures or any other loans during the year.
Inventories by class N/A
Intangible asset N/A
Overdrafts N/A
Authorised and issued capital N/A
Ex-gratia payments N/A
Amounts written off N/A
Charges against assets N/A
Assets received without adequate consideration N/A
Motor vehicle lease commitments N/A
Subsequent events
There were no subsequent events between 30 June 2017 and the date this report went to print that had a material impact on Corangamite CMA’s financial position.
Freedom of information
The Corangamite CMA has determined that its authorised officer is the Department of Environment, Land, Water and Planning Freedom of Information Manager, who may be contact on the details below
Freedom of Information Manager
Legal Services Branch Corporate Services division Department of Environment, Land, Water and Planning
Level 10, 8 Nicholson Street, East Melbourne, Victoria 3002
Ph: (03) 9637 9730
Applications must clearly identify the relevant documents.
The current fee for applications is $27.90.
Significant changes in financial position
The Corporate Plan for 2016-2021, submitted to the Ministers in April 2016, had projected revenue of $10.8 million for the 2016-17 financial year. This figure was based on investment submissions to the Australian and Victorian governments and other investment sources.
In September 2016, the authority updated the income projection to $10.4 million based on advice at the time, actual revenue for 2016-17 was $10.5 million.
Disclosure of major contracts
In accordance with the requirements of the directors of the Minister for Finance, the Annual Report must include a statement about compliance with the disclosure of major contracts greater than $10 million. The Corangamite CMA did not have any contracts greater than $10 million.
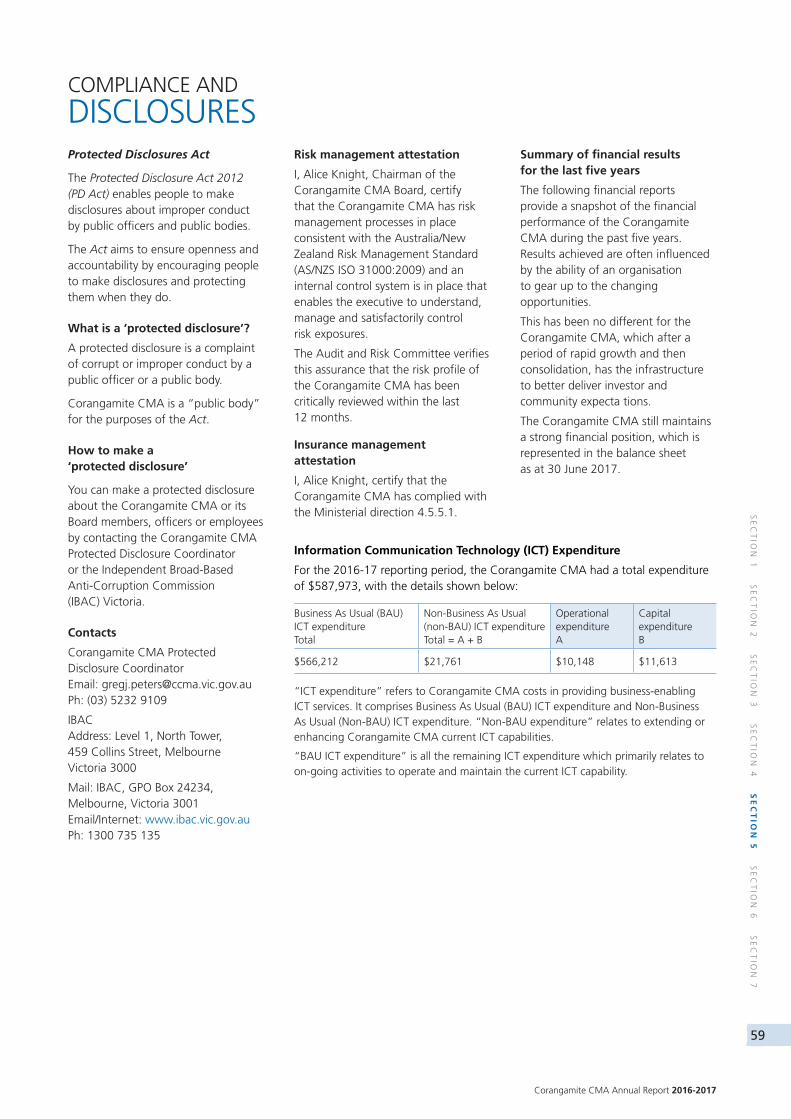
Corangamite CMA Annual Report 2016-2017
59
SE
CT
ION
1 S
EC
TIO
N 2
SE
CT
ION
3 S
EC
TIO
N 4
SE
CT
ION
5 S
EC
TIO
N 6
SE
CT
ION
7
COMPLIANCE AND
DISCLOSURESProtected Disclosures Act
The Protected Disclosure Act 2012 (PD Act) enables people to make disclosures about improper conduct by public officers and public bodies.
The Act aims to ensure openness and accountability by encouraging people to make disclosures and protecting them when they do.
What is a ‘protected disclosure’?
A protected disclosure is a complaint of corrupt or improper conduct by a public officer or a public body.
Corangamite CMA is a “public body” for the purposes of the Act.
How to make a ‘protected disclosure’
You can make a protected disclosure about the Corangamite CMA or its Board members, officers or employees by contacting the Corangamite CMA Protected Disclosure Coordinator or the Independent Broad-Based Anti-Corruption Commission (IBAC) Victoria.
Contacts
Corangamite CMA Protected Disclosure CoordinatorEmail: [email protected] Ph: (03) 5232 9109
IBAC Address: Level 1, North Tower, 459 Collins Street, Melbourne Victoria 3000
Mail: IBAC, GPO Box 24234, Melbourne, Victoria 3001 Email/Internet: www.ibac.vic.gov.auPh: 1300 735 135
Risk management attestation
I, Alice Knight, Chairman of the Corangamite CMA Board, certify that the Corangamite CMA has risk management processes in place consistent with the Australia/New Zealand Risk Management Standard (AS/NZS ISO 31000:2009) and an internal control system is in place that enables the executive to understand, manage and satisfactorily control risk exposures.
The Audit and Risk Committee verifies this assurance that the risk profile of the Corangamite CMA has been critically reviewed within the last 12 months.
Insurance management attestation
I, Alice Knight, certify that the Corangamite CMA has complied with the Ministerial direction 4.5.5.1.
Summary of financial results for the last five years
The following financial reports provide a snapshot of the financial performance of the Corangamite CMA during the past five years. Results achieved are often influenced by the ability of an organisation to gear up to the changing opportunities.
This has been no different for the Corangamite CMA, which after a period of rapid growth and then consolidation, has the infrastructure to better deliver investor and community expecta tions.
The Corangamite CMA still maintains a strong financial position, which is represented in the balance sheet as at 30 June 2017.
Information Communication Technology (ICT) Expenditure
For the 2016-17 reporting period, the Corangamite CMA had a total expenditure of $587,973, with the details shown below:
Business As Usual (BAU) ICT expenditureTotal
Non-Business As Usual (non-BAU) ICT expenditure Total = A + B
Operational expenditureA
Capital expenditureB
$566,212 $21,761 $10,148 $11,613
“ICT expenditure” refers to Corangamite CMA costs in providing business-enabling ICT services. It comprises Business As Usual (BAU) ICT expenditure and Non-Business As Usual (Non-BAU) ICT expenditure. “Non-BAU expenditure” relates to extending or enhancing Corangamite CMA current ICT capabilities.
“BAU ICT expenditure” is all the remaining ICT expenditure which primarily relates to on-going activities to operate and maintain the current ICT capability.
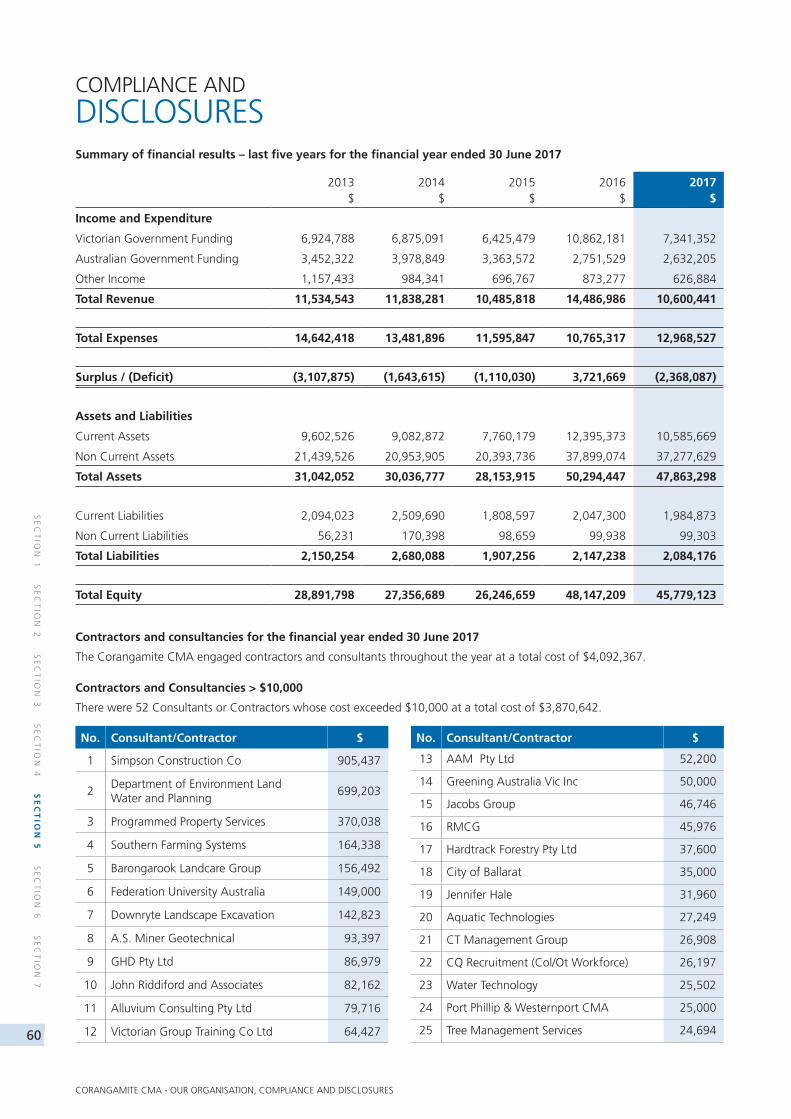
60
SE
CT
ION
1 S
EC
TIO
N 2
SE
CT
ION
3 S
EC
TIO
N 4
SE
CT
ION
5 S
EC
TIO
N 6
SE
CT
ION
7
CORANGAMITE CMA - OUR ORGANISATION, COMPLIANCE AND DISCLOSURES
COMPLIANCE AND
DISCLOSURES
2013 $
2014 $
2015 $
2016 $
2017 $
Income and Expenditure
Victorian Government Funding 6,924,788 6,875,091 6,425,479 10,862,181 7,341,352
Australian Government Funding 3,452,322 3,978,849 3,363,572 2,751,529 2,632,205
Other Income 1,157,433 984,341 696,767 873,277 626,884
Total Revenue 11,534,543 11,838,281 10,485,818 14,486,986 10,600,441
Total Expenses 14,642,418 13,481,896 11,595,847 10,765,317 12,968,527
Surplus / (Deficit) (3,107,875) (1,643,615) (1,110,030) 3,721,669 (2,368,087)
Assets and Liabilities
Current Assets 9,602,526 9,082,872 7,760,179 12,395,373 10,585,669
Non Current Assets 21,439,526 20,953,905 20,393,736 37,899,074 37,277,629
Total Assets 31,042,052 30,036,777 28,153,915 50,294,447 47,863,298
Current Liabilities 2,094,023 2,509,690 1,808,597 2,047,300 1,984,873
Non Current Liabilities 56,231 170,398 98,659 99,938 99,303
Total Liabilities 2,150,254 2,680,088 1,907,256 2,147,238 2,084,176
Total Equity 28,891,798 27,356,689 26,246,659 48,147,209 45,779,123
Summary of financial results – last five years for the financial year ended 30 June 2017
Contractors and consultancies for the financial year ended 30 June 2017
The Corangamite CMA engaged contractors and consultants throughout the year at a total cost of $4,092,367.
Contractors and Consultancies > $10,000
There were 52 Consultants or Contractors whose cost exceeded $10,000 at a total cost of $3,870,642.
No. Consultant/Contractor $
1 Simpson Construction Co 905,437
2Department of Environment Land Water and Planning
699,203
3 Programmed Property Services 370,038
4 Southern Farming Systems 164,338
5 Barongarook Landcare Group 156,492
6 Federation University Australia 149,000
7 Downryte Landscape Excavation 142,823
8 A.S. Miner Geotechnical 93,397
9 GHD Pty Ltd 86,979
10 John Riddiford and Associates 82,162
11 Alluvium Consulting Pty Ltd 79,716
12 Victorian Group Training Co Ltd 64,427
No. Consultant/Contractor $
13 AAM Pty Ltd 52,200
14 Greening Australia Vic Inc 50,000
15 Jacobs Group 46,746
16 RMCG 45,976
17 Hardtrack Forestry Pty Ltd 37,600
18 City of Ballarat 35,000
19 Jennifer Hale 31,960
20 Aquatic Technologies 27,249
21 CT Management Group 26,908
22 CQ Recruitment (Col/Ot Workforce) 26,197
23 Water Technology 25,502
24 Port Phillip & Westernport CMA 25,000
25 Tree Management Services 24,694
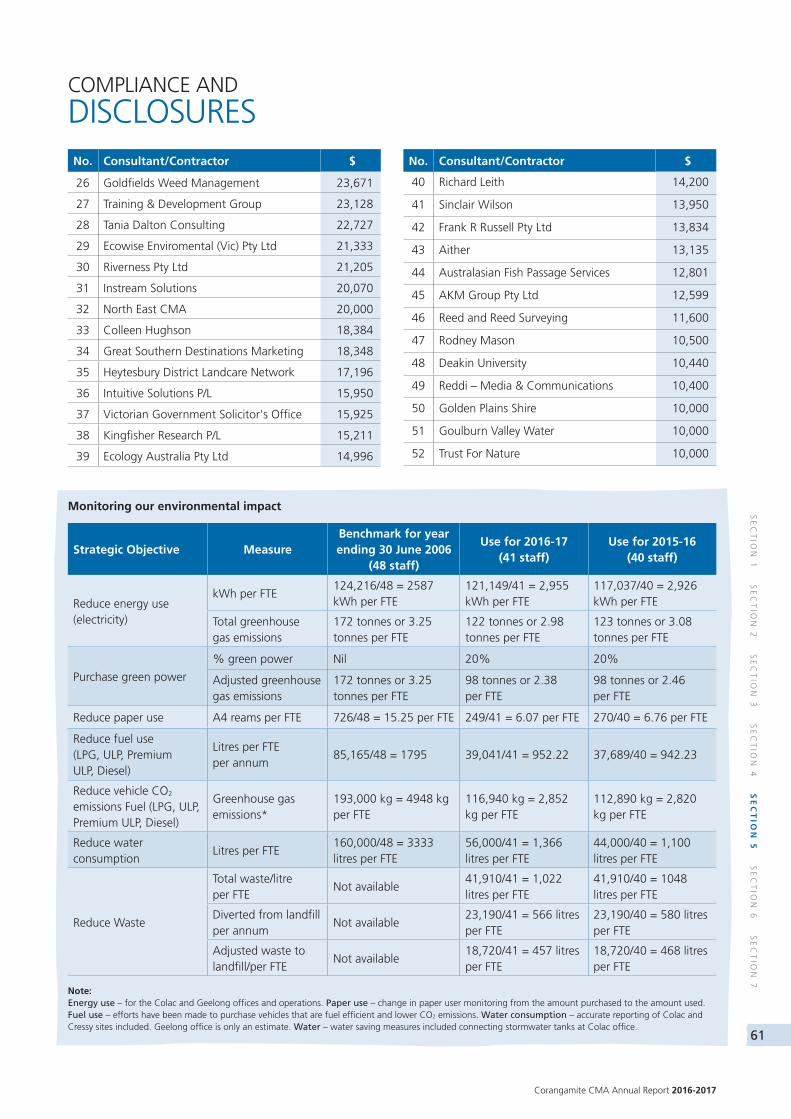
Corangamite CMA Annual Report 2016-2017
61
SE
CT
ION
1 S
EC
TIO
N 2
SE
CT
ION
3 S
EC
TIO
N 4
SE
CT
ION
5 S
EC
TIO
N 6
SE
CT
ION
7
COMPLIANCE AND
DISCLOSURESNo. Consultant/Contractor $
26 Goldfields Weed Management 23,671
27 Training & Development Group 23,128
28 Tania Dalton Consulting 22,727
29 Ecowise Enviromental (Vic) Pty Ltd 21,333
30 Riverness Pty Ltd 21,205
31 Instream Solutions 20,070
32 North East CMA 20,000
33 Colleen Hughson 18,384
34 Great Southern Destinations Marketing 18,348
35 Heytesbury District Landcare Network 17,196
36 Intuitive Solutions P/L 15,950
37 Victorian Government Solicitor's Office 15,925
38 Kingfisher Research P/L 15,211
39 Ecology Australia Pty Ltd 14,996
No. Consultant/Contractor $
40 Richard Leith 14,200
41 Sinclair Wilson 13,950
42 Frank R Russell Pty Ltd 13,834
43 Aither 13,135
44 Australasian Fish Passage Services 12,801
45 AKM Group Pty Ltd 12,599
46 Reed and Reed Surveying 11,600
47 Rodney Mason 10,500
48 Deakin University 10,440
49 Reddi – Media & Communications 10,400
50 Golden Plains Shire 10,000
51 Goulburn Valley Water 10,000
52 Trust For Nature 10,000
Monitoring our environmental impact
Strategic Objective MeasureBenchmark for year ending 30 June 2006
(48 staff)
Use for 2016-17 (41 staff)
Use for 2015-16 (40 staff)
Reduce energy use (electricity)
kWh per FTE 124,216/48 = 2587 kWh per FTE
121,149/41 = 2,955 kWh per FTE
117,037/40 = 2,926 kWh per FTE
Total greenhouse gas emissions
172 tonnes or 3.25 tonnes per FTE
122 tonnes or 2.98 tonnes per FTE
123 tonnes or 3.08 tonnes per FTE
Purchase green power
% green power Nil 20% 20%
Adjusted greenhouse gas emissions
172 tonnes or 3.25 tonnes per FTE
98 tonnes or 2.38 per FTE
98 tonnes or 2.46 per FTE
Reduce paper use A4 reams per FTE 726/48 = 15.25 per FTE 249/41 = 6.07 per FTE 270/40 = 6.76 per FTE
Reduce fuel use (LPG, ULP, Premium ULP, Diesel)
Litres per FTE per annum
85,165/48 = 1795 39,041/41 = 952.22 37,689/40 = 942.23
Reduce vehicle CO2 emissions Fuel (LPG, ULP, Premium ULP, Diesel)
Greenhouse gas emissions*
193,000 kg = 4948 kg per FTE
116,940 kg = 2,852 kg per FTE
112,890 kg = 2,820 kg per FTE
Reduce water consumption
Litres per FTE160,000/48 = 3333 litres per FTE
56,000/41 = 1,366 litres per FTE
44,000/40 = 1,100 litres per FTE
Reduce Waste
Total waste/litre per FTE
Not available41,910/41 = 1,022 litres per FTE
41,910/40 = 1048 litres per FTE
Diverted from landfill per annum
Not available23,190/41 = 566 litres per FTE
23,190/40 = 580 litres per FTE
Adjusted waste to landfill/per FTE
Not available18,720/41 = 457 litres per FTE
18,720/40 = 468 litres per FTE
Note: Energy use – for the Colac and Geelong offices and operations. Paper use – change in paper user monitoring from the amount purchased to the amount used.Fuel use – efforts have been made to purchase vehicles that are fuel efficient and lower CO2 emissions. Water consumption – accurate reporting of Colac and Cressy sites included. Geelong office is only an estimate. Water – water saving measures included connecting stormwater tanks at Colac office.
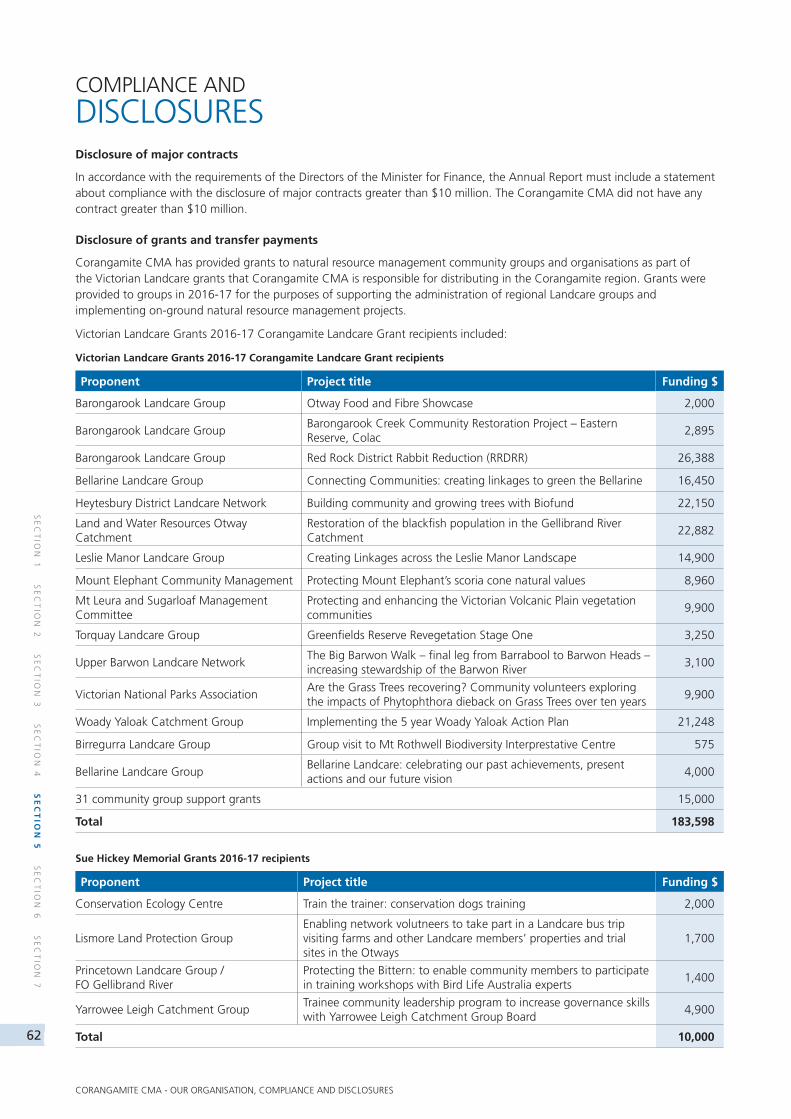
62
SE
CT
ION
1 S
EC
TIO
N 2
SE
CT
ION
3 S
EC
TIO
N 4
SE
CT
ION
5 S
EC
TIO
N 6
SE
CT
ION
7
CORANGAMITE CMA - OUR ORGANISATION, COMPLIANCE AND DISCLOSURES
COMPLIANCE AND
DISCLOSURESDisclosure of major contracts
In accordance with the requirements of the Directors of the Minister for Finance, the Annual Report must include a statement about compliance with the disclosure of major contracts greater than $10 million. The Corangamite CMA did not have any contract greater than $10 million.
Disclosure of grants and transfer payments
Corangamite CMA has provided grants to natural resource management community groups and organisations as part of the Victorian Landcare grants that Corangamite CMA is responsible for distributing in the Corangamite region. Grants were provided to groups in 2016-17 for the purposes of supporting the administration of regional Landcare groups and implementing on-ground natural resource management projects.
Victorian Landcare Grants 2016-17 Corangamite Landcare Grant recipients included:
Victorian Landcare Grants 2016-17 Corangamite Landcare Grant recipients
Proponent Project title Funding $
Barongarook Landcare Group Otway Food and Fibre Showcase 2,000
Barongarook Landcare GroupBarongarook Creek Community Restoration Project – Eastern Reserve, Colac
2,895
Barongarook Landcare Group Red Rock District Rabbit Reduction (RRDRR) 26,388
Bellarine Landcare Group Connecting Communities: creating linkages to green the Bellarine 16,450
Heytesbury District Landcare Network Building community and growing trees with Biofund 22,150
Land and Water Resources Otway Catchment
Restoration of the blackfish population in the Gellibrand River Catchment
22,882
Leslie Manor Landcare Group Creating Linkages across the Leslie Manor Landscape 14,900
Mount Elephant Community Management Protecting Mount Elephant’s scoria cone natural values 8,960
Mt Leura and Sugarloaf Management Committee
Protecting and enhancing the Victorian Volcanic Plain vegetation communities
9,900
Torquay Landcare Group Greenfields Reserve Revegetation Stage One 3,250
Upper Barwon Landcare NetworkThe Big Barwon Walk – final leg from Barrabool to Barwon Heads – increasing stewardship of the Barwon River
3,100
Victorian National Parks AssociationAre the Grass Trees recovering? Community volunteers exploring the impacts of Phytophthora dieback on Grass Trees over ten years
9,900
Woady Yaloak Catchment Group Implementing the 5 year Woady Yaloak Action Plan 21,248
Birregurra Landcare Group Group visit to Mt Rothwell Biodiversity Interprestative Centre 575
Bellarine Landcare GroupBellarine Landcare: celebrating our past achievements, present actions and our future vision
4,000
31 community group support grants 15,000
Total 183,598
Sue Hickey Memorial Grants 2016-17 recipients
Proponent Project title Funding $
Conservation Ecology Centre Train the trainer: conservation dogs training 2,000
Lismore Land Protection GroupEnabling network volutneers to take part in a Landcare bus trip visiting farms and other Landcare members’ properties and trial sites in the Otways
1,700
Princetown Landcare Group / FO Gellibrand River
Protecting the Bittern: to enable community members to participate in training workshops with Bird Life Australia experts
1,400
Yarrowee Leigh Catchment GroupTrainee community leadership program to increase governance skills with Yarrowee Leigh Catchment Group Board
4,900
Total 10,000
Corangamite CMA Annual Report 2016-2017
63
SE
CT
ION
1 S
EC
TIO
N 2
SE
CT
ION
3 S
EC
TIO
N 4
SE
CT
ION
5 S
EC
TIO
N 6
SE
CT
ION
7
HOW THIS REPORT IS STRUCTURED 66
DECLARATION IN THE FINANCIAL STATEMENTS 68
COMPREHENSIVE OPERATING STATEMENT 69
BALANCE SHEET 70
CASH FLOW STATEMENT 71
STATEMENT OF CHANGES IN EQUITY 72
NOTES TO THE FINANCIAL STATEMENTS 73
SECTION 6
FINANCIAL STATEMENTS
64
SE
CT
ION
1 S
EC
TIO
N 2
SE
CT
ION
3 S
EC
TIO
N 4
SE
CT
ION
5 S
EC
TIO
N 6
SE
CT
ION
7
FINANCIAL STATEMENTS
Independent Auditor’s Report To the Board of the Corangamite Catchment Management Authority
Opinion I have audited the financial report of the Corangamite Catchment Management Authority (the authority) which comprises the:
balance sheet as at 30 June 2017 comprehensive operating statement for the year then ended statement of changes in equity for the year then ended cash flow statement for the year then ended notes to the financial statements declaration in the financial statements.
In my opinion the financial report presents fairly, in all material respects, the financial position of the authority as at 30 June 2017 and their financial performance and cash flows for the year then ended in accordance with the financial reporting requirements of Part 7 of the Financial Management Act 1994 and applicable Australian Accounting Standards.
Basis for Opinion
I have conducted my audit in accordance with the Audit Act 1994 which incorporates the Australian Auditing Standards. My responsibilities under the Act are further described in the Auditor’s Responsibilities for the Audit of the Financial Report section of my report.
My independence is established by the Constitution Act 1975. My staff and I are independent of the authority in accordance with the ethical requirements of the Accounting Professional and Ethical Standards Board’s APES 110 Code of Ethics for Professional Accountants (the Code) that are relevant to my audit of the financial report in Australia. My staff and I have also fulfilled our other ethical responsibilities in accordance with the Code.
I believe that the audit evidence I have obtained is sufficient and appropriate to provide a basis for my opinion.
Board’s responsibilities for the financial report
The Board of the authority is responsible for the preparation and fair presentation of the financial report in accordance with Australian Accounting Standards and the Financial Management Act 1994, and for such internal control as the Board determines is necessary to enable the preparation and fair presentation of a financial report that is free from material misstatement, whether due to fraud or error.
In preparing the financial report, the Board is responsible for assessing the authority’s ability to continue as a going concern, and using the going concern basis of accounting unless it is inappropriate to do so.
Corangamite CMA Annual Report 2016-2017
65
SE
CT
ION
1 S
EC
TIO
N 2
SE
CT
ION
3 S
EC
TIO
N 4
SE
CT
ION
5 S
EC
TIO
N 6
SE
CT
ION
7
2
Auditor’s responsibilities for the audit of the financial report
As required by the Audit Act 1994, my responsibility is to express an opinion on the financial report based on the audit. My objectives for the audit are to obtain reasonable assurance about whether the financial report as a whole is free from material misstatement, whether due to fraud or error, and to issue an auditor’s report that includes my opinion. Reasonable assurance is a high level of assurance, but is not a guarantee that an audit conducted in accordance with the Australian Auditing Standards will always detect a material misstatement when it exists. Misstatements can arise from fraud or error and are considered material if, individually or in the aggregate, they could reasonably be expected to influence the economic decisions of users taken on the basis of this financial report.
As part of an audit in accordance with the Australian Auditing Standards, I exercise professional judgement and maintain professional scepticism throughout the audit. I also:
identify and assess the risks of material misstatement of the financial report, whether due to fraud or error, design and perform audit procedures responsive to those risks, and obtain audit evidence that is sufficient and appropriate to provide a basis for our opinion. The risk of not detecting a material misstatement resulting from fraud is higher than for one resulting from error, as fraud may involve collusion, forgery, intentional omissions, misrepresentations, or the override of internal control
obtain an understanding of internal control relevant to the audit in order to design audit procedures that are appropriate in the circumstances, but not for the purpose of expressing an opinion on the effectiveness of the authority’s internal control
evaluate the appropriateness of accounting policies used and the reasonableness of accounting estimates and related disclosures made by the Board
conclude on the appropriateness of the Board’s use of the going concern basis of accounting and, based on the audit evidence obtained, whether a material uncertainty exists related to events or conditions that may cast significant doubt on the authority’s ability to continue as a going concern. If I conclude that a material uncertainty exists, I am required to draw attention in my auditor’s report to the related disclosures in the financial report or, if such disclosures are inadequate, to modify my opinion. My conclusions are based on the audit evidence obtained up to the date of my auditor’s report. However, future events or conditions may cause the authority to cease to continue as a going concern
evaluate the overall presentation, structure and content of the financial report, including the disclosures, and whether the financial report represents the underlying transactions and events in a manner that achieves fair presentation.
I communicate with the Board regarding, among other matters, the planned scope and timing of the audit and significant audit findings, including any significant deficiencies in internal control that I identify during my audit.
MELBOURNE 31 August 2017
Roberta Skliros as delegate for the Auditor-General of Victoria
66
SE
CT
ION
1 S
EC
TIO
N 2
SE
CT
ION
3 S
EC
TIO
N 4
SE
CT
ION
5 S
EC
TIO
N 6
SE
CT
ION
7
FINANCIAL STATEMENTS
The Corangamite Catchment Management Authority has presented its audited general purpose financial statements for the financial year ended 30 June 2017 in the following structure to provide users with the information about the Authority’s stewardship of resources entrusted to it.
FINANCIAL STATEMENTS
Comprehensive operating statement
Balance sheet
Cash flow statement
Statement of changes in equity
NOTES TO THE FINANCIAL STATEMENTS
1. Notes to the report
The basis on which the financial statements have been prepared and compliance with reporting regulations
2. Funding delivery of our services
Revenue recognised in respect of Government contributions and other income sources
2.1 Summary of income that funds the delivery of our service
2.2 Income from transactions
3. The cost of delivering services
Operating expenses of the Authority
3.1 Expenses incurred in delivery of services
3.2 Materials, maintenance, grants, contracts and consultancies
3.3 Lease expenses
3.4 Other operating expenses
4. Key assets available to support output delivery
Land, buildings, works assets, plant and equipment, office furniture and equipment, motor vehicles, and intangible assets
4.1 Property, plant and equipment
5. Other assets and liabilities
Other key assets and liabilities
5.1 Receivables
5.2 Payables
5.3 Other non-financial assets
HOW THIS REPORT IS
STRUCTURED
Corangamite CMA Annual Report 2016-2017
67
SE
CT
ION
1 S
EC
TIO
N 2
SE
CT
ION
3 S
EC
TIO
N 4
SE
CT
ION
5 S
EC
TIO
N 6
SE
CT
ION
7
6. Financing our operations
Cash flow information, commitments for expenditure
6.1 Cash flow information and balances
6.2 Commitments for expenditure
6.3 Carry forward project funding
7. Risks, contingencies and valuation judgements
Financial risk management, contingent assets and liabilities as well as fair value determination
7.1 Financial instruments specific disclosures
7.2 Contingent assets and contingent liabilities
7.3 Fair value determination
8. Other disclosures
8.1 Ex-gratia expenses
8.2 Other economic flows included in net result
8.3 Reserves
8.4 Responsible persons
8.5 Remuneration of executive officers
8.6 Related parties
8.7 Remuneration of auditors
8.8 Subsequent events
8.9 Australian Accounting Standards issued that are not yet effect
HOW THIS REPORT IS
STRUCTURED
68
SE
CT
ION
1 S
EC
TIO
N 2
SE
CT
ION
3 S
EC
TIO
N 4
SE
CT
ION
5 S
EC
TIO
N 6
SE
CT
ION
7
FINANCIAL STATEMENTS
DECLARATION IN THE
FINANCIAL STATEMENTSThe attached financial statements for the Corangamite Catchment Management Authority have been prepared in accordance with Direction 5.2 of the Standing Directions of the Minister for Finance under the Financial Management Act 1994, applicable Financial Reporting Directions, Australian Accounting Standards including Interpretations, and other mandatory professional reporting requirements.
We further state that, in our opinion, the information set out in the comprehensive operating statement, balance sheet, statement of changes in equity, cash flow statement and accompanying notes, presents fairly the financial transactions during the year ended 30 June 2017 and financial position of the Authority at 30 June 2017.
At the time of signing, we are not aware of any circumstances which would render any particulars included in the financial statements to be misleading or inaccurate.
We authorise the attached financial statements for issue on 24 August 2017.
A. Knight Chairperson
G. Phelps CEO and Accountable Officer
G. J. Peters Chief Finance and Accounting Officer
Dated this 24th day of August 2017.
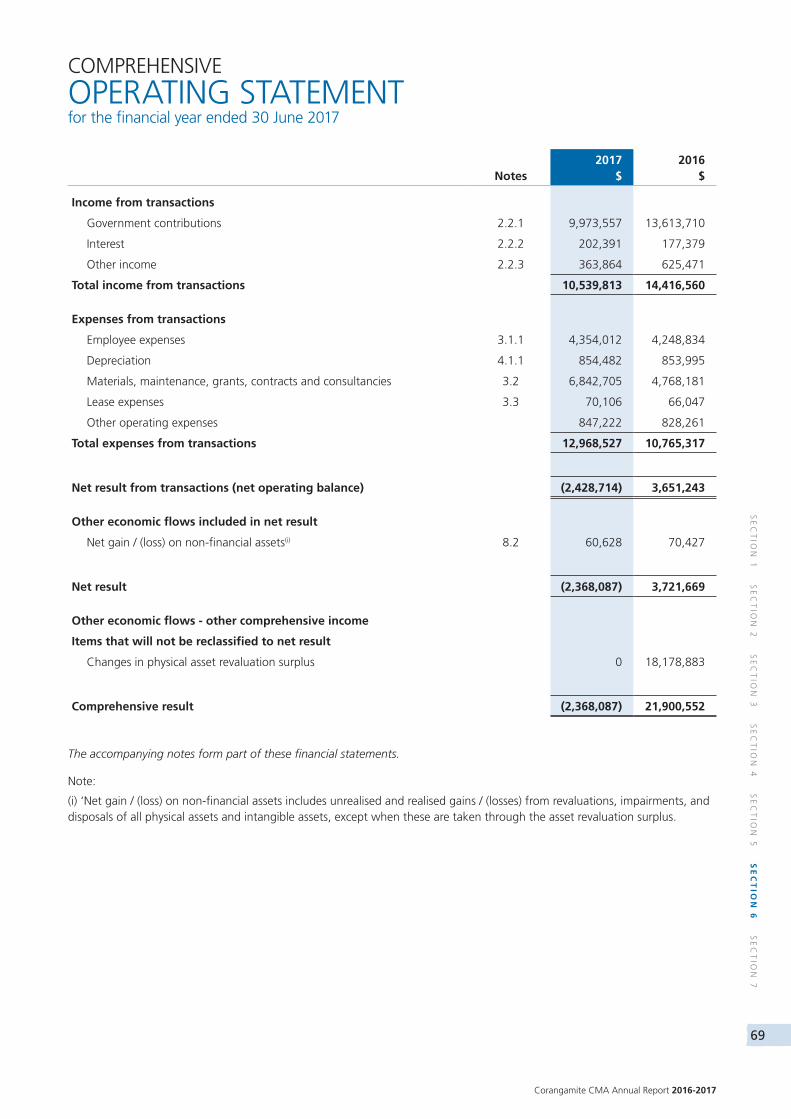
Corangamite CMA Annual Report 2016-2017
69
SE
CT
ION
1 S
EC
TIO
N 2
SE
CT
ION
3 S
EC
TIO
N 4
SE
CT
ION
5 S
EC
TIO
N 6
SE
CT
ION
7
Notes2017
$2016
$
Income from transactions
Government contributions 2.2.1 9,973,557 13,613,710
Interest 2.2.2 202,391 177,379
Other income 2.2.3 363,864 625,471
Total income from transactions 10,539,813 14,416,560
Expenses from transactions
Employee expenses 3.1.1 4,354,012 4,248,834
Depreciation 4.1.1 854,482 853,995
Materials, maintenance, grants, contracts and consultancies 3.2 6,842,705 4,768,181
Lease expenses 3.3 70,106 66,047
Other operating expenses 847,222 828,261
Total expenses from transactions 12,968,527 10,765,317
Net result from transactions (net operating balance) (2,428,714) 3,651,243
Other economic flows included in net result
Net gain / (loss) on non-financial assets(i) 8.2 60,628 70,427
Net result (2,368,087) 3,721,669
Other economic flows - other comprehensive income
Items that will not be reclassified to net result
Changes in physical asset revaluation surplus 0 18,178,883
Comprehensive result (2,368,087) 21,900,552
The accompanying notes form part of these financial statements.
Note:
(i) ‘Net gain / (loss) on non-financial assets includes unrealised and realised gains / (losses) from revaluations, impairments, and disposals of all physical assets and intangible assets, except when these are taken through the asset revaluation surplus.
COMPREHENSIVE
OPERATING STATEMENT for the financial year ended 30 June 2017
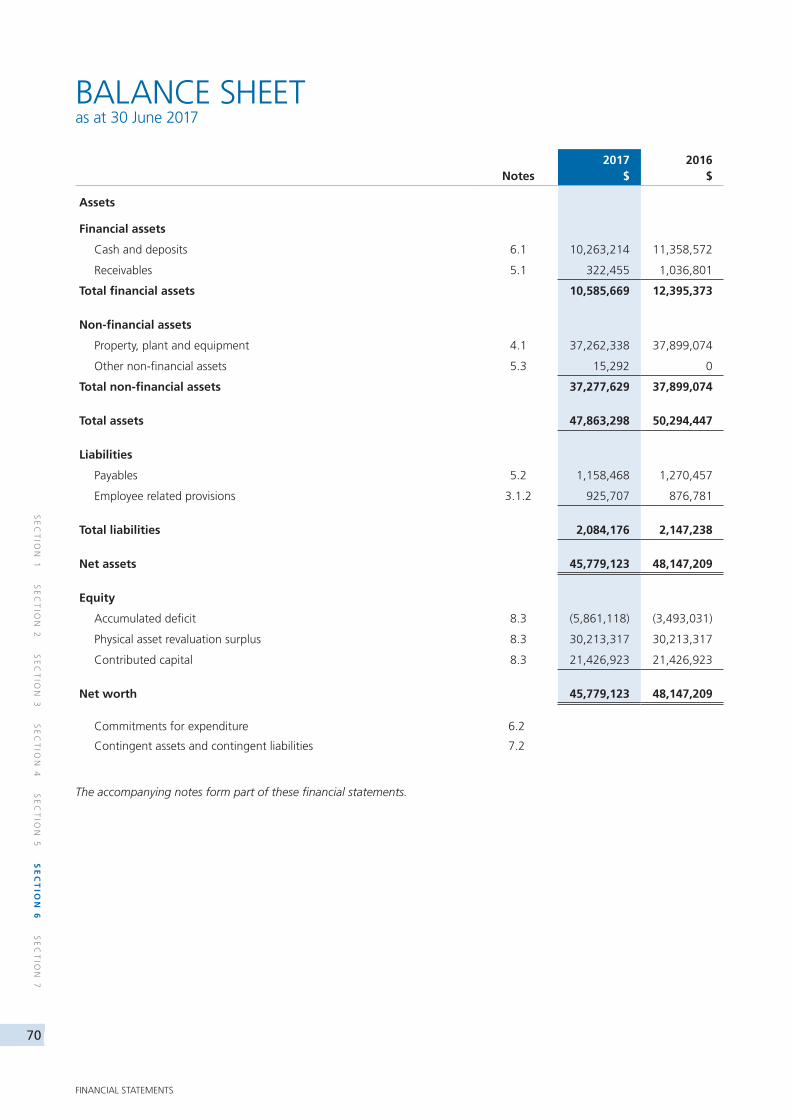
70
SE
CT
ION
1 S
EC
TIO
N 2
SE
CT
ION
3 S
EC
TIO
N 4
SE
CT
ION
5 S
EC
TIO
N 6
SE
CT
ION
7
FINANCIAL STATEMENTS
BALANCE SHEET as at 30 June 2017
Notes2017
$2016
$
Assets
Financial assets
Cash and deposits 6.1 10,263,214 11,358,572
Receivables 5.1 322,455 1,036,801
Total financial assets 10,585,669 12,395,373
Non-financial assets
Property, plant and equipment 4.1 37,262,338 37,899,074
Other non-financial assets 5.3 15,292 0
Total non-financial assets 37,277,629 37,899,074
Total assets 47,863,298 50,294,447
Liabilities
Payables 5.2 1,158,468 1,270,457
Employee related provisions 3.1.2 925,707 876,781
Total liabilities 2,084,176 2,147,238
Net assets 45,779,123 48,147,209
Equity
Accumulated deficit 8.3 (5,861,118) (3,493,031)
Physical asset revaluation surplus 8.3 30,213,317 30,213,317
Contributed capital 8.3 21,426,923 21,426,923
Net worth 45,779,123 48,147,209
Commitments for expenditure 6.2
Contingent assets and contingent liabilities 7.2
The accompanying notes form part of these financial statements.
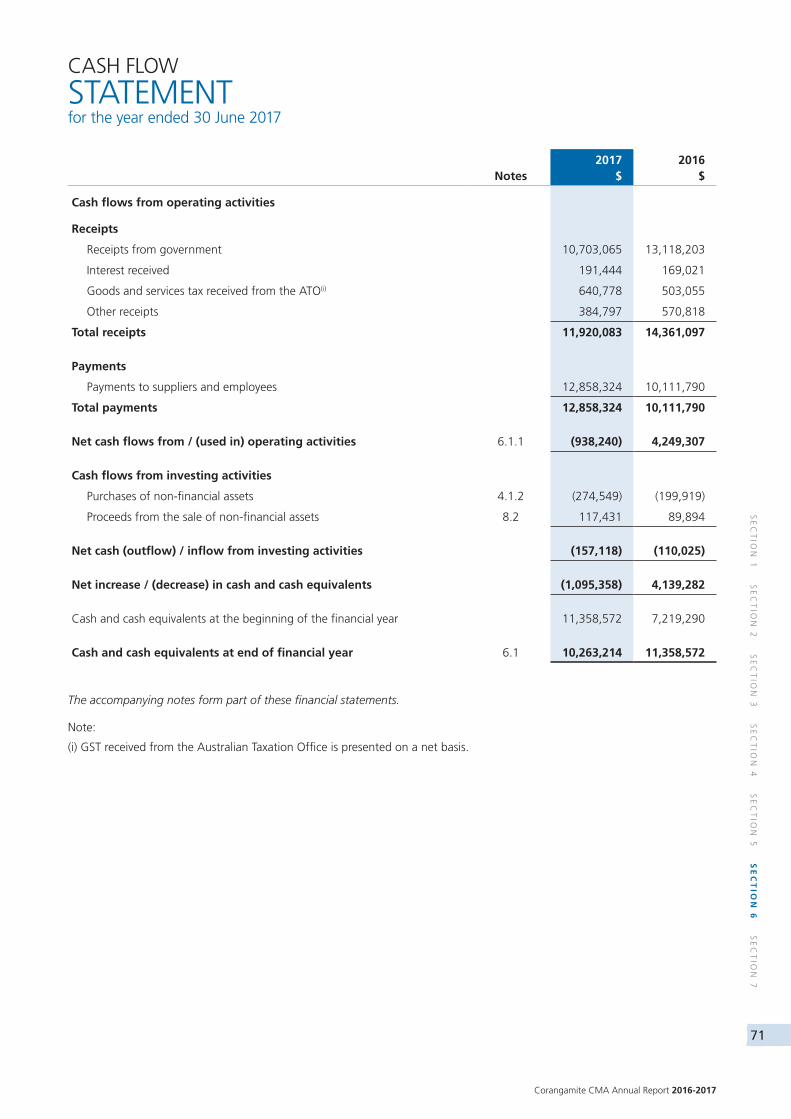
Corangamite CMA Annual Report 2016-2017
71
SE
CT
ION
1 S
EC
TIO
N 2
SE
CT
ION
3 S
EC
TIO
N 4
SE
CT
ION
5 S
EC
TIO
N 6
SE
CT
ION
7
CASH FLOW
STATEMENT for the year ended 30 June 2017
Notes2017
$2016
$
Cash flows from operating activities
Receipts
Receipts from government 10,703,065 13,118,203
Interest received 191,444 169,021
Goods and services tax received from the ATO(i) 640,778 503,055
Other receipts 384,797 570,818
Total receipts 11,920,083 14,361,097
Payments
Payments to suppliers and employees 12,858,324 10,111,790
Total payments 12,858,324 10,111,790
Net cash flows from / (used in) operating activities 6.1.1 (938,240) 4,249,307
Cash flows from investing activities
Purchases of non-financial assets 4.1.2 (274,549) (199,919)
Proceeds from the sale of non-financial assets 8.2 117,431 89,894
Net cash (outflow) / inflow from investing activities (157,118) (110,025)
Net increase / (decrease) in cash and cash equivalents (1,095,358) 4,139,282
Cash and cash equivalents at the beginning of the financial year 11,358,572 7,219,290
Cash and cash equivalents at end of financial year 6.1 10,263,214 11,358,572
The accompanying notes form part of these financial statements.
Note:
(i) GST received from the Australian Taxation Office is presented on a net basis.
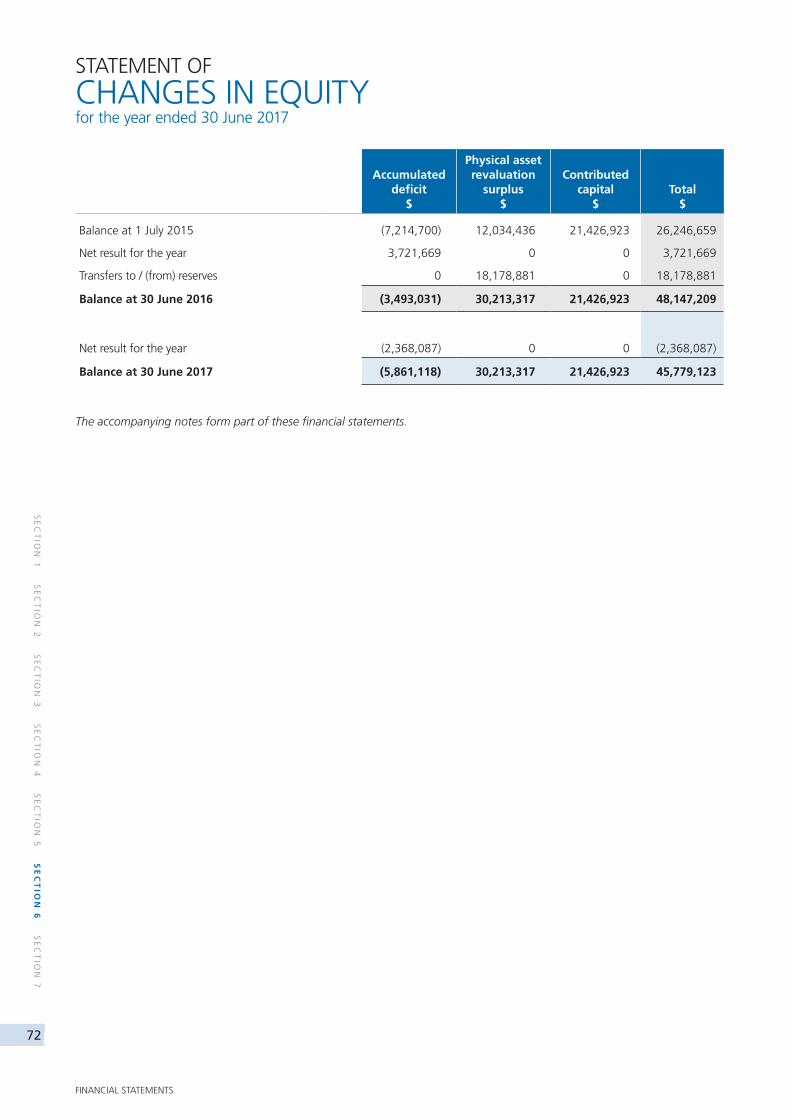
72
SE
CT
ION
1 S
EC
TIO
N 2
SE
CT
ION
3 S
EC
TIO
N 4
SE
CT
ION
5 S
EC
TIO
N 6
SE
CT
ION
7
FINANCIAL STATEMENTS
STATEMENT OF
CHANGES IN EQUITY for the year ended 30 June 2017
Accumulateddeficit
$
Physical asset revaluation
surplus$
Contributedcapital
$Total
$
Balance at 1 July 2015 (7,214,700) 12,034,436 21,426,923 26,246,659
Net result for the year 3,721,669 0 0 3,721,669
Transfers to / (from) reserves 0 18,178,881 0 18,178,881
Balance at 30 June 2016 (3,493,031) 30,213,317 21,426,923 48,147,209
Net result for the year (2,368,087) 0 0 (2,368,087)
Balance at 30 June 2017 (5,861,118) 30,213,317 21,426,923 45,779,123
The accompanying notes form part of these financial statements.
Corangamite CMA Annual Report 2016-2017
73
SE
CT
ION
1 S
EC
TIO
N 2
SE
CT
ION
3 S
EC
TIO
N 4
SE
CT
ION
5 S
EC
TIO
N 6
SE
CT
ION
7
1. NOTES TO THE REPORT
The Corangamite Catchment Management Authority is a government authority of the State of Victoria, established on 1 July 1997.
Its principal address is: Corangamite Catchment Management Authority 64 Dennis Street Colac, Victoria, 3250
A description of the nature of its operations and its principal activities is included in the Report of operations, which does not form part of these financial statements.
Basis of preparation
These financial statements are in Australian dollars and the historical cost convention is used unless a different measurement basis is specifically disclosed in the note associated with the item measured on a different basis.
The accrual basis of accounting has been applied in preparing these financial statements, whereby assets, liabilities, equity, income and expenses are recognised in the reporting period to which they relate, regardless of when cash is received or paid.
Judgements, estimates and assumptions are required to be made about financial information being presented. The significant judgements made in the preparation of these financial statements are disclosed in the notes where amounts affected by those judgements are disclosed. Estimates and associated assumptions based on professional judgements are disclosed. Estimates and associated assumptions are based on professional judgements derived from historical experience and various other factors that are believed to be reasonable under the circumstances. Actual results may differ from these estimates.
Revisions to accounting estimates are recognised in the period in which the estimate is revised and also in future periods that are affected by the revision. Judgements and assumptions made by management in the application of Australian Accounting Standards that have significant effects on the financial statements and estimates are disclosed in the notes under the heading: ‘Significant judgement or estimates’, and relate to:
• fair value measurements of assets and liabilities (note 7.3.1);
• employee benefit provisions (note 3.1.2);
• accrued revenue/expenses (note 5.1, 5.2)
• estimation of useful life (note 4.1.1)
Compliance Information
These general purpose financial statements have been prepared in accordance with the Financial Management Act 1994 (FMA) and applicable Australian Accounting Standards which include Interpretations, issued by the Australian Accounting Standards Board (AASB). In particular, they are presented in a manner consistent with the requirements of AASB 101 Presentation of Financial Statements.
Where appropriate, those Australian Accounting Standards paragraphs applicable to not-for-profit entities have been applied. Accounting policies selected and applied in these financial statements ensure that the resulting financial information satisfies the concepts of relevance and reliability, thereby ensuring that the substance of the underlying transactions or other events is reported.
NOTES TO THE
FINANCIAL STATEMENTS for the year ended 30 June 2017
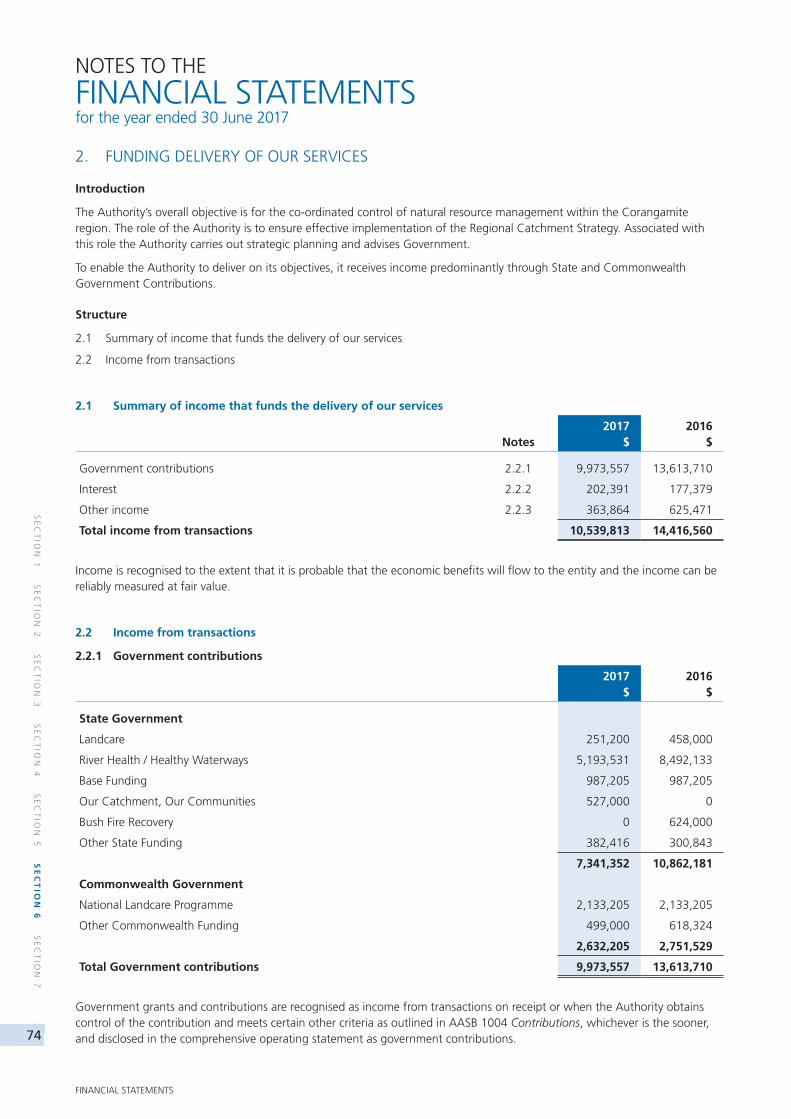
74
SE
CT
ION
1 S
EC
TIO
N 2
SE
CT
ION
3 S
EC
TIO
N 4
SE
CT
ION
5 S
EC
TIO
N 6
SE
CT
ION
7
FINANCIAL STATEMENTS
NOTES TO THE
FINANCIAL STATEMENTS for the year ended 30 June 2017
2. FUNDING DELIVERY OF OUR SERVICES
Introduction
The Authority’s overall objective is for the co-ordinated control of natural resource management within the Corangamite region. The role of the Authority is to ensure effective implementation of the Regional Catchment Strategy. Associated with this role the Authority carries out strategic planning and advises Government.
To enable the Authority to deliver on its objectives, it receives income predominantly through State and Commonwealth Government Contributions.
Structure
2.1 Summary of income that funds the delivery of our services
2.2 Income from transactions
2.1 Summary of income that funds the delivery of our services
Notes2017
$2016
$
Government contributions 2.2.1 9,973,557 13,613,710
Interest 2.2.2 202,391 177,379
Other income 2.2.3 363,864 625,471
Total income from transactions 10,539,813 14,416,560
Income is recognised to the extent that it is probable that the economic benefits will flow to the entity and the income can be reliably measured at fair value.
2.2 Income from transactions
2.2.1 Government contributions
2017$
2016$
State Government
Landcare 251,200 458,000
River Health / Healthy Waterways 5,193,531 8,492,133
Base Funding 987,205 987,205
Our Catchment, Our Communities 527,000 0
Bush Fire Recovery 0 624,000
Other State Funding 382,416 300,843
7,341,352 10,862,181
Commonwealth Government
National Landcare Programme 2,133,205 2,133,205
Other Commonwealth Funding 499,000 618,324
2,632,205 2,751,529
Total Government contributions 9,973,557 13,613,710
Government grants and contributions are recognised as income from transactions on receipt or when the Authority obtains control of the contribution and meets certain other criteria as outlined in AASB 1004 Contributions, whichever is the sooner, and disclosed in the comprehensive operating statement as government contributions.
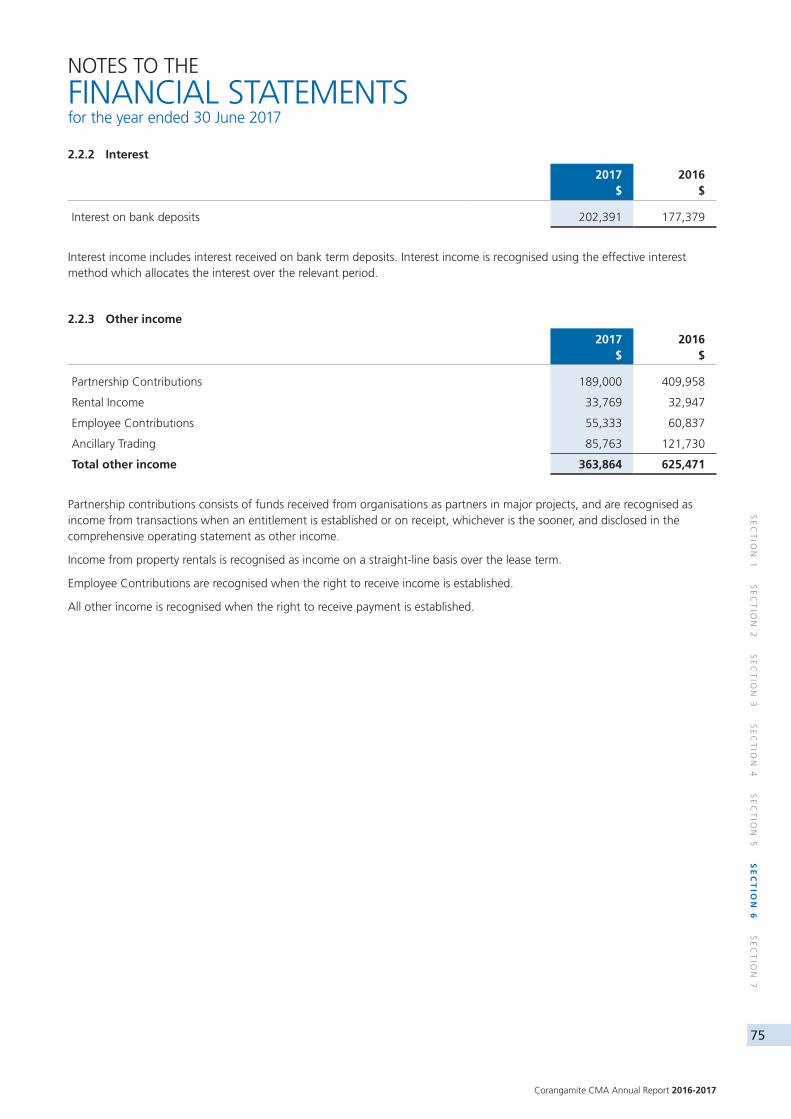
Corangamite CMA Annual Report 2016-2017
75
SE
CT
ION
1 S
EC
TIO
N 2
SE
CT
ION
3 S
EC
TIO
N 4
SE
CT
ION
5 S
EC
TIO
N 6
SE
CT
ION
7
NOTES TO THE
FINANCIAL STATEMENTS for the year ended 30 June 2017
2.2.2 Interest
2017$
2016$
Interest on bank deposits 202,391 177,379
Interest income includes interest received on bank term deposits. Interest income is recognised using the effective interest method which allocates the interest over the relevant period.
2.2.3 Other income
2017$
2016$
Partnership Contributions 189,000 409,958
Rental Income 33,769 32,947
Employee Contributions 55,333 60,837
Ancillary Trading 85,763 121,730
Total other income 363,864 625,471
Partnership contributions consists of funds received from organisations as partners in major projects, and are recognised as income from transactions when an entitlement is established or on receipt, whichever is the sooner, and disclosed in the comprehensive operating statement as other income.
Income from property rentals is recognised as income on a straight-line basis over the lease term.
Employee Contributions are recognised when the right to receive income is established.
All other income is recognised when the right to receive payment is established.
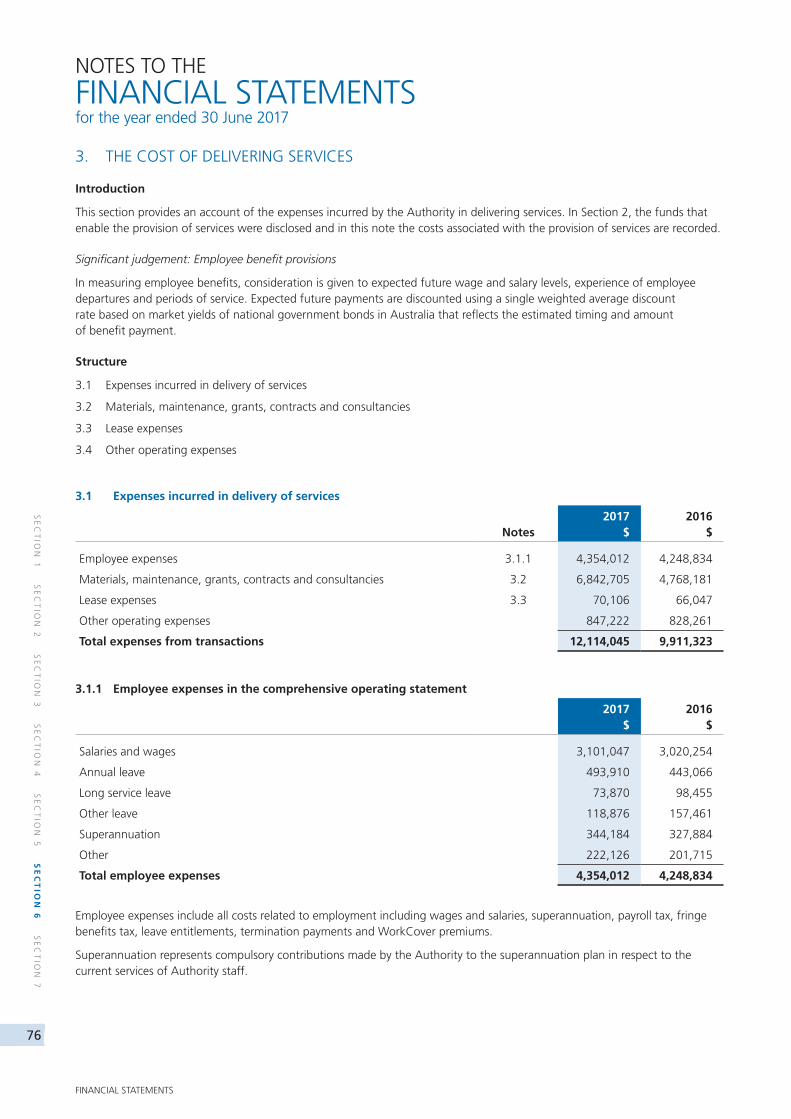
76
SE
CT
ION
1 S
EC
TIO
N 2
SE
CT
ION
3 S
EC
TIO
N 4
SE
CT
ION
5 S
EC
TIO
N 6
SE
CT
ION
7
FINANCIAL STATEMENTS
NOTES TO THE
FINANCIAL STATEMENTS for the year ended 30 June 2017
3. THE COST OF DELIVERING SERVICES
Introduction
This section provides an account of the expenses incurred by the Authority in delivering services. In Section 2, the funds that enable the provision of services were disclosed and in this note the costs associated with the provision of services are recorded.
Significant judgement: Employee benefit provisions
In measuring employee benefits, consideration is given to expected future wage and salary levels, experience of employee departures and periods of service. Expected future payments are discounted using a single weighted average discount rate based on market yields of national government bonds in Australia that reflects the estimated timing and amount of benefit payment.
Structure
3.1 Expenses incurred in delivery of services
3.2 Materials, maintenance, grants, contracts and consultancies
3.3 Lease expenses
3.4 Other operating expenses
3.1 Expenses incurred in delivery of services
Notes2017
$2016
$
Employee expenses 3.1.1 4,354,012 4,248,834
Materials, maintenance, grants, contracts and consultancies 3.2 6,842,705 4,768,181
Lease expenses 3.3 70,106 66,047
Other operating expenses 847,222 828,261
Total expenses from transactions 12,114,045 9,911,323
3.1.1 Employee expenses in the comprehensive operating statement
2017$
2016$
Salaries and wages 3,101,047 3,020,254
Annual leave 493,910 443,066
Long service leave 73,870 98,455
Other leave 118,876 157,461
Superannuation 344,184 327,884
Other 222,126 201,715
Total employee expenses 4,354,012 4,248,834
Employee expenses include all costs related to employment including wages and salaries, superannuation, payroll tax, fringe benefits tax, leave entitlements, termination payments and WorkCover premiums.
Superannuation represents compulsory contributions made by the Authority to the superannuation plan in respect to the current services of Authority staff.
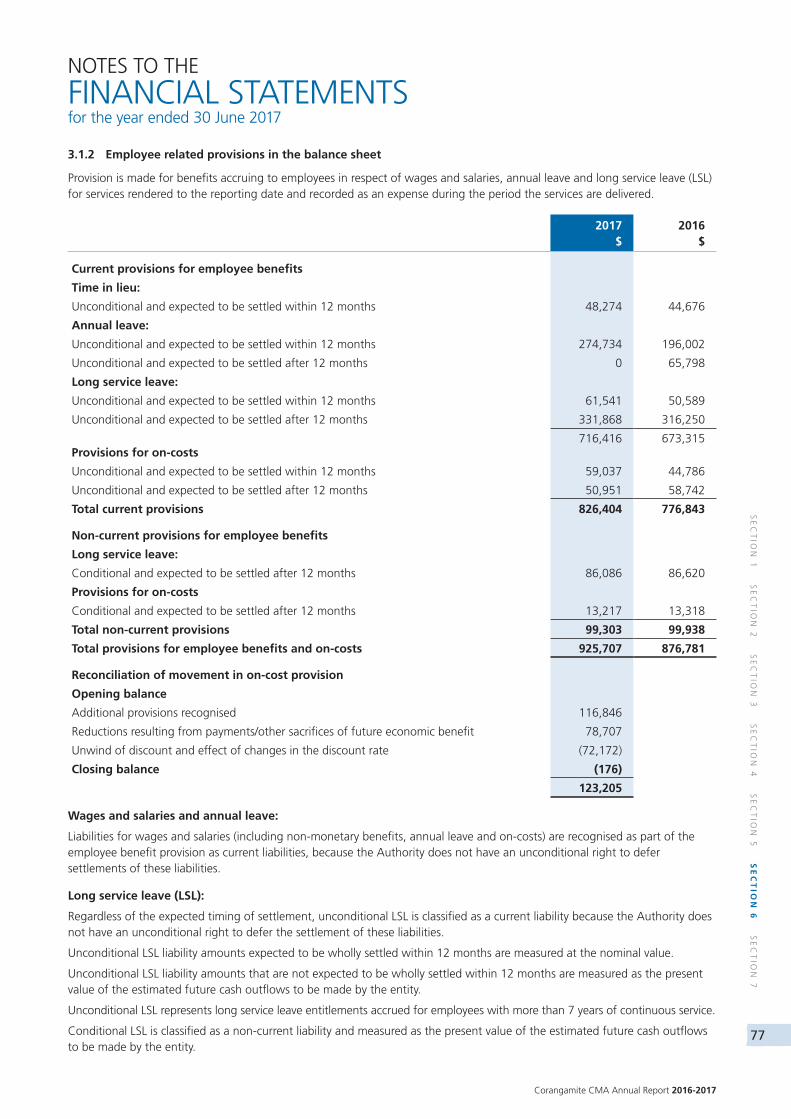
Corangamite CMA Annual Report 2016-2017
77
SE
CT
ION
1 S
EC
TIO
N 2
SE
CT
ION
3 S
EC
TIO
N 4
SE
CT
ION
5 S
EC
TIO
N 6
SE
CT
ION
7
NOTES TO THE
FINANCIAL STATEMENTS for the year ended 30 June 2017
3.1.2 Employee related provisions in the balance sheet
Provision is made for benefits accruing to employees in respect of wages and salaries, annual leave and long service leave (LSL) for services rendered to the reporting date and recorded as an expense during the period the services are delivered.
2017$
2016$
Current provisions for employee benefits
Time in lieu:
Unconditional and expected to be settled within 12 months 48,274 44,676
Annual leave:
Unconditional and expected to be settled within 12 months 274,734 196,002
Unconditional and expected to be settled after 12 months 0 65,798
Long service leave:
Unconditional and expected to be settled within 12 months 61,541 50,589
Unconditional and expected to be settled after 12 months 331,868 316,250
716,416 673,315Provisions for on-costs
Unconditional and expected to be settled within 12 months 59,037 44,786
Unconditional and expected to be settled after 12 months 50,951 58,742
Total current provisions 826,404 776,843
Non-current provisions for employee benefits
Long service leave:
Conditional and expected to be settled after 12 months 86,086 86,620
Provisions for on-costs
Conditional and expected to be settled after 12 months 13,217 13,318
Total non-current provisions 99,303 99,938
Total provisions for employee benefits and on-costs 925,707 876,781
Reconciliation of movement in on-cost provision
Opening balance
Additional provisions recognised 116,846
Reductions resulting from payments/other sacrifices of future economic benefit 78,707
Unwind of discount and effect of changes in the discount rate (72,172)
Closing balance (176)
123,205
Wages and salaries and annual leave:
Liabilities for wages and salaries (including non-monetary benefits, annual leave and on-costs) are recognised as part of the employee benefit provision as current liabilities, because the Authority does not have an unconditional right to defer settlements of these liabilities.
Long service leave (LSL):
Regardless of the expected timing of settlement, unconditional LSL is classified as a current liability because the Authority does not have an unconditional right to defer the settlement of these liabilities.
Unconditional LSL liability amounts expected to be wholly settled within 12 months are measured at the nominal value.
Unconditional LSL liability amounts that are not expected to be wholly settled within 12 months are measured as the present value of the estimated future cash outflows to be made by the entity.
Unconditional LSL represents long service leave entitlements accrued for employees with more than 7 years of continuous service.
Conditional LSL is classified as a non-current liability and measured as the present value of the estimated future cash outflows to be made by the entity.
78
SE
CT
ION
1 S
EC
TIO
N 2
SE
CT
ION
3 S
EC
TIO
N 4
SE
CT
ION
5 S
EC
TIO
N 6
SE
CT
ION
7
FINANCIAL STATEMENTS
NOTES TO THE
FINANCIAL STATEMENTS for the year ended 30 June 2017
3.1.3 Superannuation contributions
Employees of the Authority are entitled to receive superannuation benefits and the Authority contributes defined contribution plans. The defined benefit plans provide benefits based on year of service and final average salary.
The Authority does not recognise any defined benefit liability because it has no legal or constructive obligation to pay future benefits relating to its employees.
The amount recognised in the comprehensive operating statement in relation to Superannuation is employer contributions for members that are paid or payable during the reporting period.
The name, details and amounts expensed in relation to the major employee superannuation funds and contributions made by the Authority are as follows:
2017$
2016$
Contribution plans:
Vision super 139,056 124,941
Other private schemes 205,002 202,674
Total 344,058 327,615
There was $38,112 in contributions outstanding to the above schemes as at 30 June 2017 (2016: $126).
3.2 Materials, maintenance, grants, contracts and consultancies
2017$
2016$
Materials 77,955 40,939
Repairs and maintenance 64,147 41,156
Grants paid 2,344,500 1,619,160
Contractors 2,913,098 923,747
Consultants 1,183,221 1,846,301
IT Software and Support 259,783 296,877
Total materials, maintenance, grants, contracts and consultancies 6,842,705 4,768,181
Materials, maintenance, grants, contracts and consultancies are recognised as an expense in the reporting period in which they are paid or payable.
3.3 Lease expenses
2017$
2016$
Operating lease payments 70,106 66,047
Total Lease expenses 70,106 66,047
Operating lease payments are recognised as an expense in the comprehensive operating statement on a straight-line basis over the lease term. The leased asset is not recognised in the balance sheet.
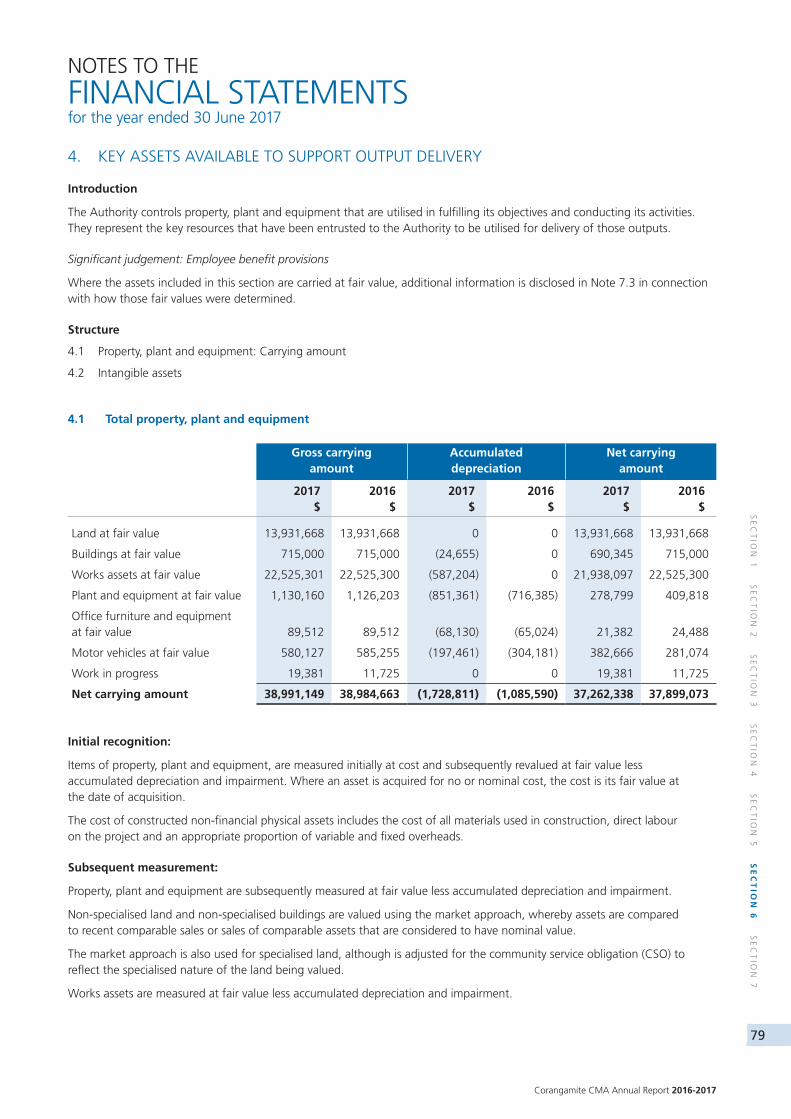
Corangamite CMA Annual Report 2016-2017
79
SE
CT
ION
1 S
EC
TIO
N 2
SE
CT
ION
3 S
EC
TIO
N 4
SE
CT
ION
5 S
EC
TIO
N 6
SE
CT
ION
7
NOTES TO THE
FINANCIAL STATEMENTS for the year ended 30 June 2017
4. KEY ASSETS AVAILABLE TO SUPPORT OUTPUT DELIVERY
Introduction
The Authority controls property, plant and equipment that are utilised in fulfilling its objectives and conducting its activities. They represent the key resources that have been entrusted to the Authority to be utilised for delivery of those outputs.
Significant judgement: Employee benefit provisions
Where the assets included in this section are carried at fair value, additional information is disclosed in Note 7.3 in connection with how those fair values were determined.
Structure
4.1 Property, plant and equipment: Carrying amount
4.2 Intangible assets
4.1 Total property, plant and equipment
Gross carrying amount
Accumulated depreciation
Net carrying amount
2017$
2016$
2017$
2016$
2017$
2016$
Land at fair value 13,931,668 13,931,668 0 0 13,931,668 13,931,668
Buildings at fair value 715,000 715,000 (24,655) 0 690,345 715,000
Works assets at fair value 22,525,301 22,525,300 (587,204) 0 21,938,097 22,525,300
Plant and equipment at fair value 1,130,160 1,126,203 (851,361) (716,385) 278,799 409,818
Office furniture and equipment at fair value 89,512 89,512 (68,130) (65,024) 21,382 24,488
Motor vehicles at fair value 580,127 585,255 (197,461) (304,181) 382,666 281,074
Work in progress 19,381 11,725 0 0 19,381 11,725
Net carrying amount 38,991,149 38,984,663 (1,728,811) (1,085,590) 37,262,338 37,899,073
Initial recognition:
Items of property, plant and equipment, are measured initially at cost and subsequently revalued at fair value less accumulated depreciation and impairment. Where an asset is acquired for no or nominal cost, the cost is its fair value at the date of acquisition.
The cost of constructed non-financial physical assets includes the cost of all materials used in construction, direct labour on the project and an appropriate proportion of variable and fixed overheads.
Subsequent measurement:
Property, plant and equipment are subsequently measured at fair value less accumulated depreciation and impairment.
Non-specialised land and non-specialised buildings are valued using the market approach, whereby assets are compared to recent comparable sales or sales of comparable assets that are considered to have nominal value.
The market approach is also used for specialised land, although is adjusted for the community service obligation (CSO) to reflect the specialised nature of the land being valued.
Works assets are measured at fair value less accumulated depreciation and impairment.
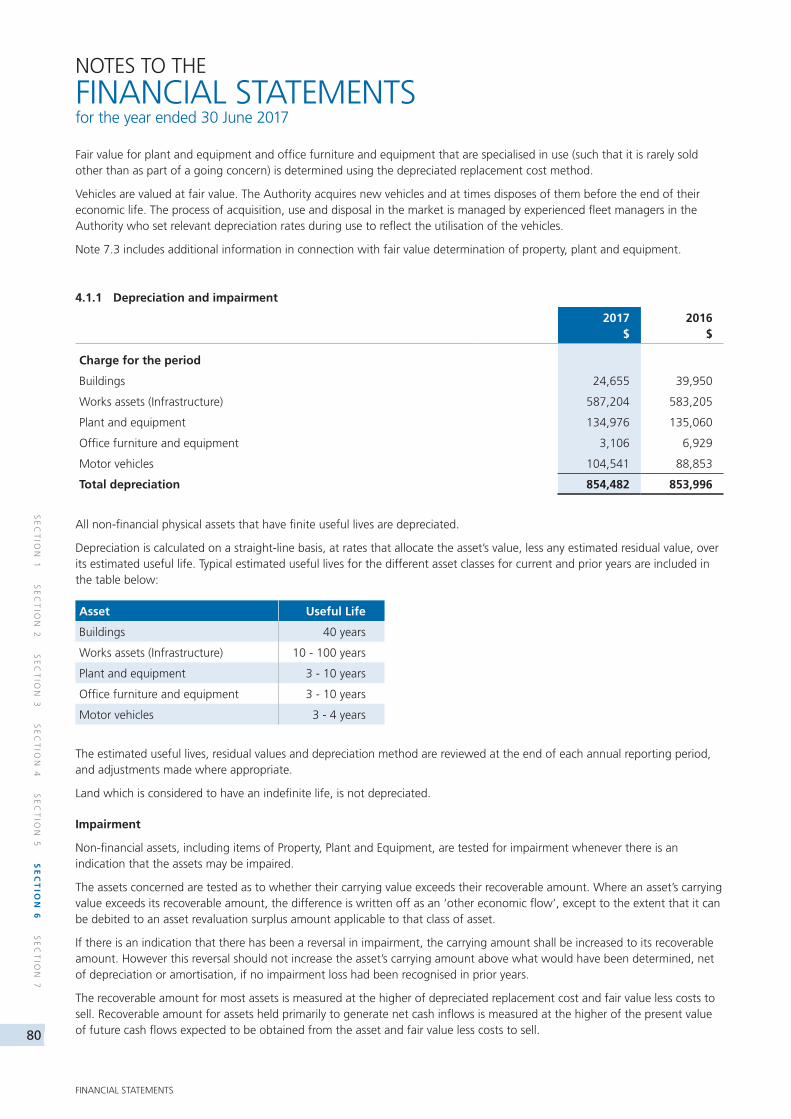
80
SE
CT
ION
1 S
EC
TIO
N 2
SE
CT
ION
3 S
EC
TIO
N 4
SE
CT
ION
5 S
EC
TIO
N 6
SE
CT
ION
7
FINANCIAL STATEMENTS
NOTES TO THE
FINANCIAL STATEMENTS for the year ended 30 June 2017
4.1.1 Depreciation and impairment
2017$
2016$
Charge for the period
Buildings 24,655 39,950
Works assets (Infrastructure) 587,204 583,205
Plant and equipment 134,976 135,060
Office furniture and equipment 3,106 6,929
Motor vehicles 104,541 88,853
Total depreciation 854,482 853,996
All non-financial physical assets that have finite useful lives are depreciated.
Depreciation is calculated on a straight-line basis, at rates that allocate the asset’s value, less any estimated residual value, over its estimated useful life. Typical estimated useful lives for the different asset classes for current and prior years are included in the table below:
Asset Useful Life
Buildings 40 years
Works assets (Infrastructure) 10 - 100 years
Plant and equipment 3 - 10 years
Office furniture and equipment 3 - 10 years
Motor vehicles 3 - 4 years
The estimated useful lives, residual values and depreciation method are reviewed at the end of each annual reporting period, and adjustments made where appropriate.
Land which is considered to have an indefinite life, is not depreciated.
Impairment
Non-financial assets, including items of Property, Plant and Equipment, are tested for impairment whenever there is an indication that the assets may be impaired.
The assets concerned are tested as to whether their carrying value exceeds their recoverable amount. Where an asset’s carrying value exceeds its recoverable amount, the difference is written off as an ‘other economic flow’, except to the extent that it can be debited to an asset revaluation surplus amount applicable to that class of asset.
If there is an indication that there has been a reversal in impairment, the carrying amount shall be increased to its recoverable amount. However this reversal should not increase the asset’s carrying amount above what would have been determined, net of depreciation or amortisation, if no impairment loss had been recognised in prior years.
The recoverable amount for most assets is measured at the higher of depreciated replacement cost and fair value less costs to sell. Recoverable amount for assets held primarily to generate net cash inflows is measured at the higher of the present value of future cash flows expected to be obtained from the asset and fair value less costs to sell.
Fair value for plant and equipment and office furniture and equipment that are specialised in use (such that it is rarely sold other than as part of a going concern) is determined using the depreciated replacement cost method.
Vehicles are valued at fair value. The Authority acquires new vehicles and at times disposes of them before the end of their economic life. The process of acquisition, use and disposal in the market is managed by experienced fleet managers in the Authority who set relevant depreciation rates during use to reflect the utilisation of the vehicles.
Note 7.3 includes additional information in connection with fair value determination of property, plant and equipment.
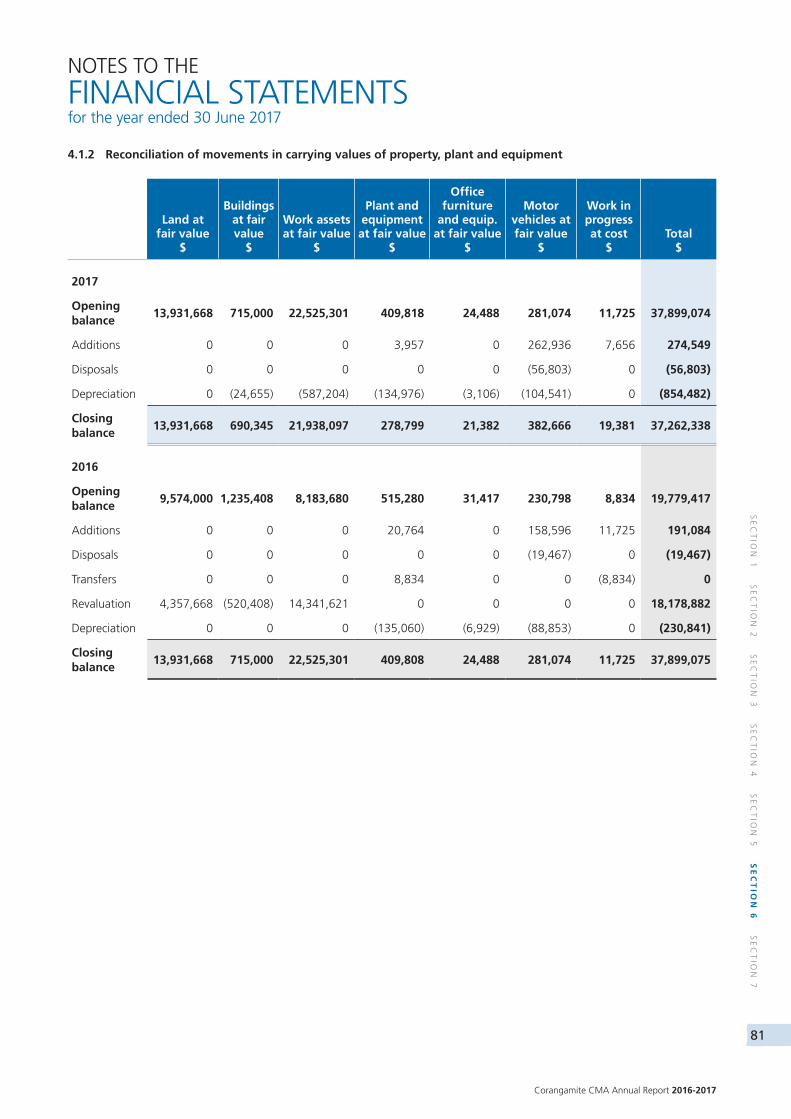
Corangamite CMA Annual Report 2016-2017
81
SE
CT
ION
1 S
EC
TIO
N 2
SE
CT
ION
3 S
EC
TIO
N 4
SE
CT
ION
5 S
EC
TIO
N 6
SE
CT
ION
7
NOTES TO THE
FINANCIAL STATEMENTS for the year ended 30 June 2017
4.1.2 Reconciliation of movements in carrying values of property, plant and equipment
Land at fair value
$
Buildings at fair value
$
Work assets at fair value
$
Plant and equipment
at fair value$
Office furniture
and equip. at fair value
$
Motor vehicles at fair value
$
Work in progress at cost
$Total
$
2017
Opening balance
13,931,668 715,000 22,525,301 409,818 24,488 281,074 11,725 37,899,074
Additions 0 0 0 3,957 0 262,936 7,656 274,549
Disposals 0 0 0 0 0 (56,803) 0 (56,803)
Depreciation 0 (24,655) (587,204) (134,976) (3,106) (104,541) 0 (854,482)
Closing balance
13,931,668 690,345 21,938,097 278,799 21,382 382,666 19,381 37,262,338
2016
Opening balance
9,574,000 1,235,408 8,183,680 515,280 31,417 230,798 8,834 19,779,417
Additions 0 0 0 20,764 0 158,596 11,725 191,084
Disposals 0 0 0 0 0 (19,467) 0 (19,467)
Transfers 0 0 0 8,834 0 0 (8,834) 0
Revaluation 4,357,668 (520,408) 14,341,621 0 0 0 0 18,178,882
Depreciation 0 0 0 (135,060) (6,929) (88,853) 0 (230,841)
Closing balance
13,931,668 715,000 22,525,301 409,808 24,488 281,074 11,725 37,899,075
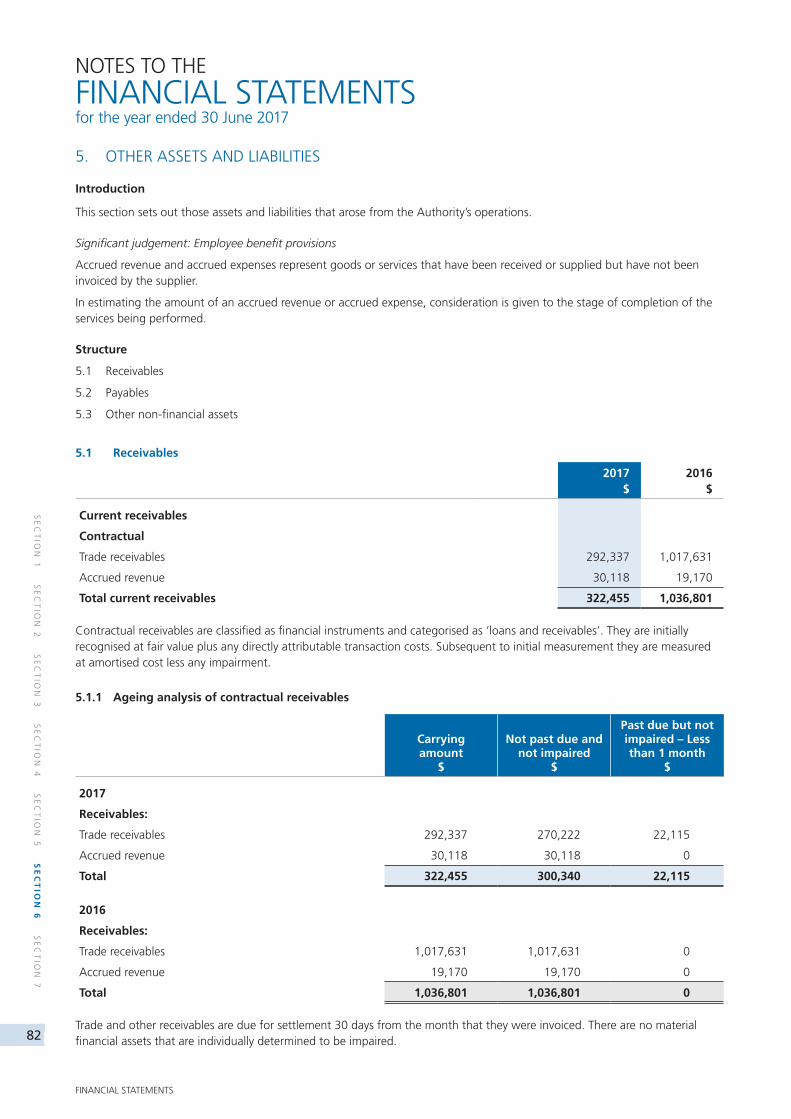
82
SE
CT
ION
1 S
EC
TIO
N 2
SE
CT
ION
3 S
EC
TIO
N 4
SE
CT
ION
5 S
EC
TIO
N 6
SE
CT
ION
7
FINANCIAL STATEMENTS
NOTES TO THE
FINANCIAL STATEMENTS for the year ended 30 June 2017
5. OTHER ASSETS AND LIABILITIES
Introduction
This section sets out those assets and liabilities that arose from the Authority’s operations.
Significant judgement: Employee benefit provisions
Accrued revenue and accrued expenses represent goods or services that have been received or supplied but have not been invoiced by the supplier.
In estimating the amount of an accrued revenue or accrued expense, consideration is given to the stage of completion of the services being performed.
Structure
5.1 Receivables
5.2 Payables
5.3 Other non-financial assets
5.1 Receivables
2017$
2016$
Current receivables
Contractual
Trade receivables 292,337 1,017,631
Accrued revenue 30,118 19,170
Total current receivables 322,455 1,036,801
Contractual receivables are classified as financial instruments and categorised as ‘loans and receivables’. They are initially recognised at fair value plus any directly attributable transaction costs. Subsequent to initial measurement they are measured at amortised cost less any impairment.
5.1.1 Ageing analysis of contractual receivables
Carrying amount
$
Not past due and not impaired
$
Past due but not impaired – Less than 1 month
$
2017
Receivables:
Trade receivables 292,337 270,222 22,115
Accrued revenue 30,118 30,118 0
Total 322,455 300,340 22,115
2016
Receivables:
Trade receivables 1,017,631 1,017,631 0
Accrued revenue 19,170 19,170 0
Total 1,036,801 1,036,801 0
Trade and other receivables are due for settlement 30 days from the month that they were invoiced. There are no material financial assets that are individually determined to be impaired.
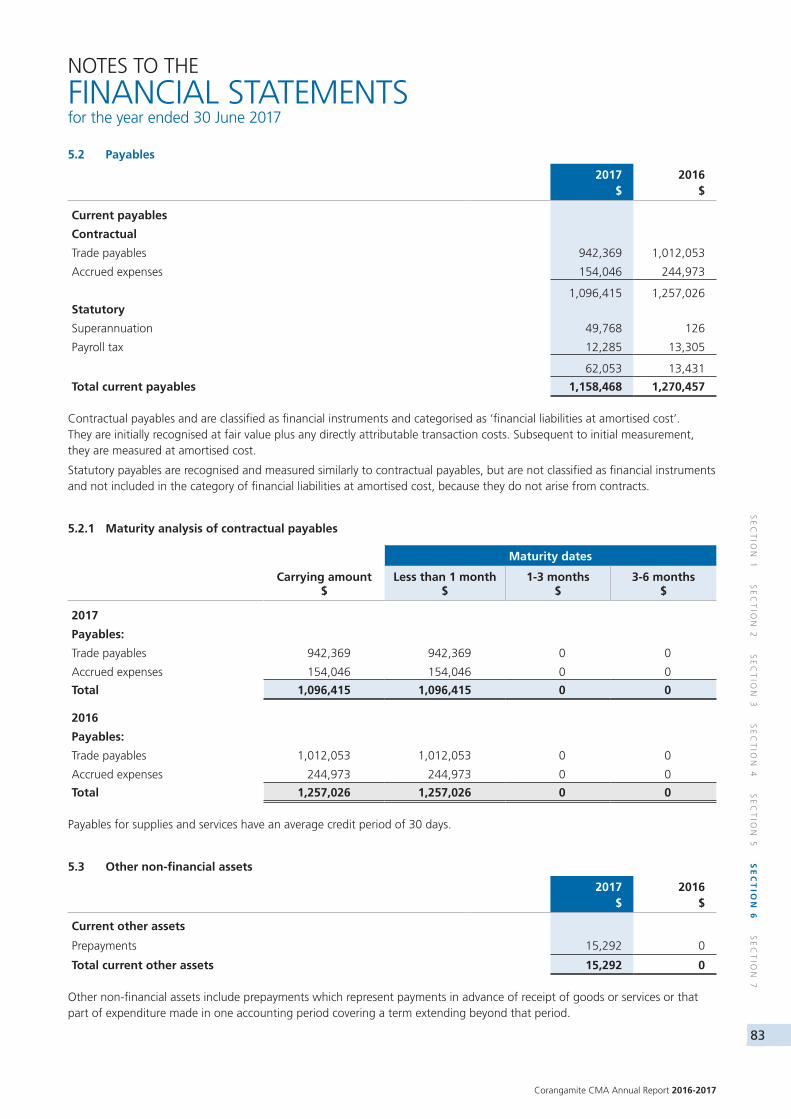
Corangamite CMA Annual Report 2016-2017
83
SE
CT
ION
1 S
EC
TIO
N 2
SE
CT
ION
3 S
EC
TIO
N 4
SE
CT
ION
5 S
EC
TIO
N 6
SE
CT
ION
7
NOTES TO THE
FINANCIAL STATEMENTS for the year ended 30 June 2017
5.2 Payables
2017$
2016$
Current payables
Contractual
Trade payables 942,369 1,012,053
Accrued expenses 154,046 244,973
1,096,415 1,257,026Statutory
Superannuation 49,768 126
Payroll tax 12,285 13,305
62,053 13,431
Total current payables 1,158,468 1,270,457
Contractual payables and are classified as financial instruments and categorised as ‘financial liabilities at amortised cost’. They are initially recognised at fair value plus any directly attributable transaction costs. Subsequent to initial measurement, they are measured at amortised cost.
Statutory payables are recognised and measured similarly to contractual payables, but are not classified as financial instruments and not included in the category of financial liabilities at amortised cost, because they do not arise from contracts.
5.2.1 Maturity analysis of contractual payables
Maturity dates Maturity dates
Carrying amount$
Less than 1 month$
1-3 months$
3-6 months$
2017
Payables:
Trade payables 942,369 942,369 0 0
Accrued expenses 154,046 154,046 0 0
Total 1,096,415 1,096,415 0 0
2016
Payables:
Trade payables 1,012,053 1,012,053 0 0
Accrued expenses 244,973 244,973 0 0
Total 1,257,026 1,257,026 0 0
Payables for supplies and services have an average credit period of 30 days.
5.3 Other non-financial assets
2017$
2016$
Current other assets
Prepayments 15,292 0
Total current other assets 15,292 0
Other non-financial assets include prepayments which represent payments in advance of receipt of goods or services or that part of expenditure made in one accounting period covering a term extending beyond that period.
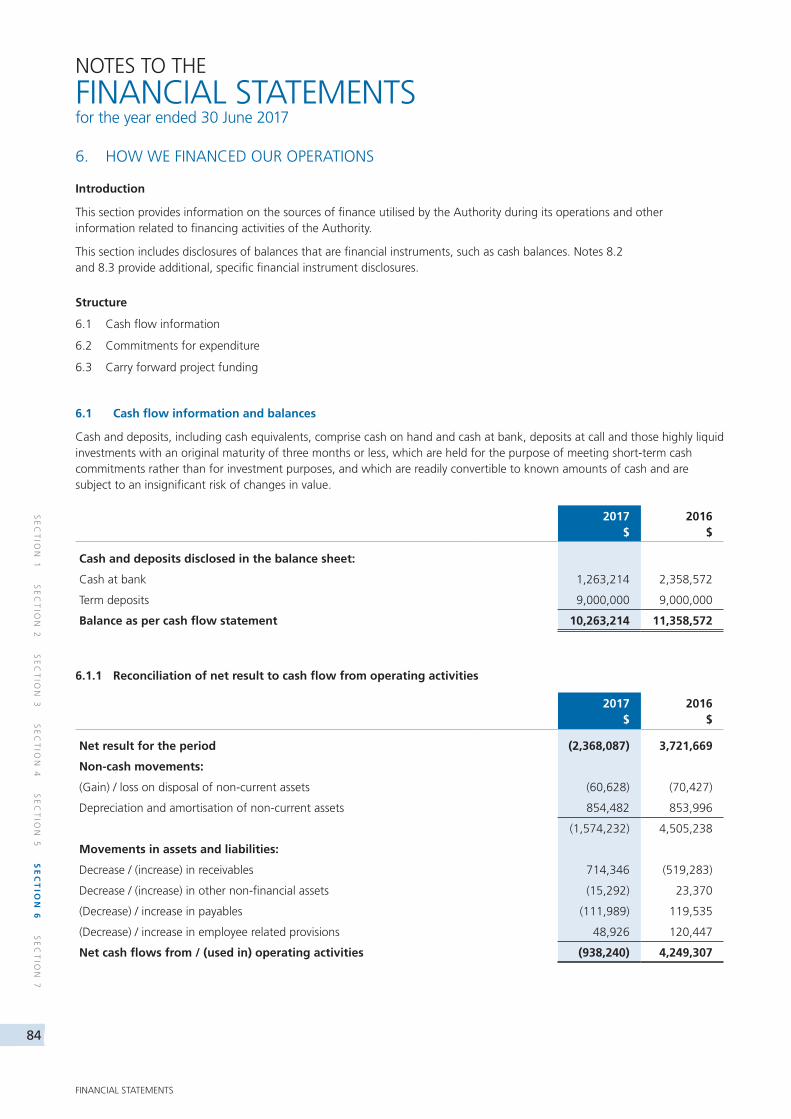
84
SE
CT
ION
1 S
EC
TIO
N 2
SE
CT
ION
3 S
EC
TIO
N 4
SE
CT
ION
5 S
EC
TIO
N 6
SE
CT
ION
7
FINANCIAL STATEMENTS
NOTES TO THE
FINANCIAL STATEMENTS for the year ended 30 June 2017
6. HOW WE FINANCED OUR OPERATIONS
Introduction
This section provides information on the sources of finance utilised by the Authority during its operations and other information related to financing activities of the Authority.
This section includes disclosures of balances that are financial instruments, such as cash balances. Notes 8.2 and 8.3 provide additional, specific financial instrument disclosures.
Structure
6.1 Cash flow information
6.2 Commitments for expenditure
6.3 Carry forward project funding
6.1 Cash flow information and balances
Cash and deposits, including cash equivalents, comprise cash on hand and cash at bank, deposits at call and those highly liquid investments with an original maturity of three months or less, which are held for the purpose of meeting short-term cash commitments rather than for investment purposes, and which are readily convertible to known amounts of cash and are subject to an insignificant risk of changes in value.
2017$
2016$
Cash and deposits disclosed in the balance sheet:
Cash at bank 1,263,214 2,358,572
Term deposits 9,000,000 9,000,000
Balance as per cash flow statement 10,263,214 11,358,572
6.1.1 Reconciliation of net result to cash flow from operating activities
2017$
2016$
Net result for the period (2,368,087) 3,721,669
Non-cash movements:
(Gain) / loss on disposal of non-current assets (60,628) (70,427)
Depreciation and amortisation of non-current assets 854,482 853,996
(1,574,232) 4,505,238
Movements in assets and liabilities:
Decrease / (increase) in receivables 714,346 (519,283)
Decrease / (increase) in other non-financial assets (15,292) 23,370
(Decrease) / increase in payables (111,989) 119,535
(Decrease) / increase in employee related provisions 48,926 120,447
Net cash flows from / (used in) operating activities (938,240) 4,249,307
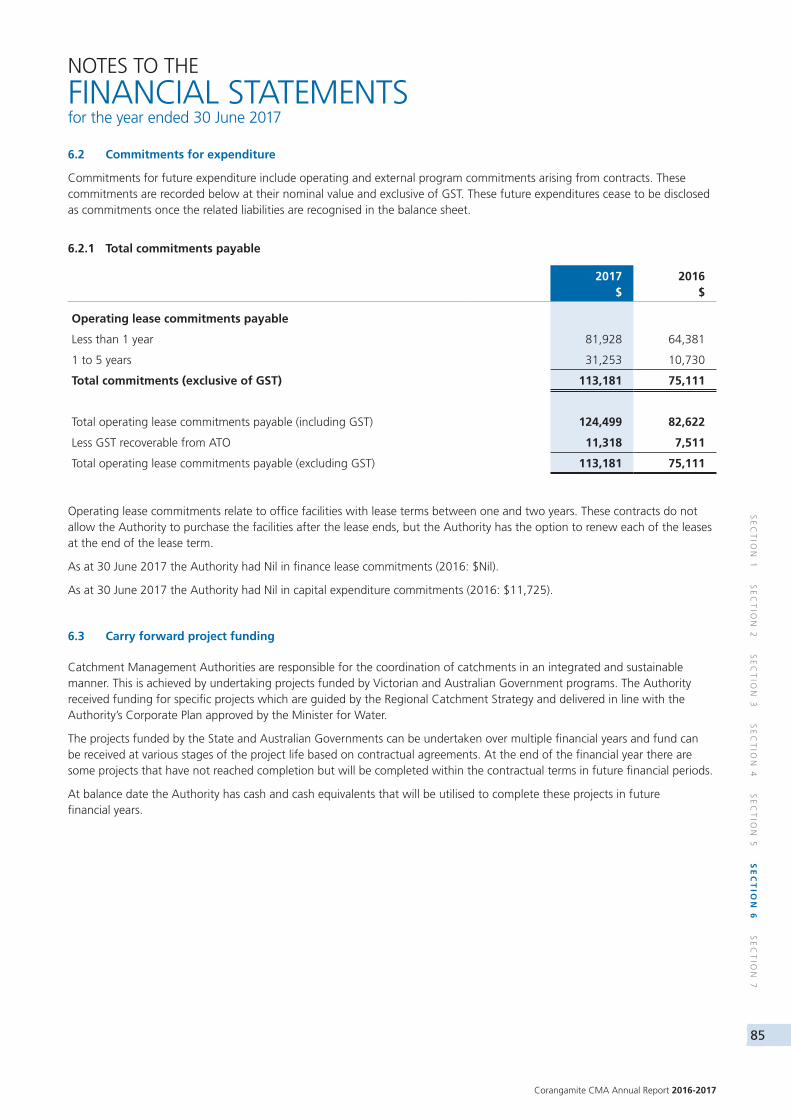
Corangamite CMA Annual Report 2016-2017
85
SE
CT
ION
1 S
EC
TIO
N 2
SE
CT
ION
3 S
EC
TIO
N 4
SE
CT
ION
5 S
EC
TIO
N 6
SE
CT
ION
7
NOTES TO THE
FINANCIAL STATEMENTS for the year ended 30 June 2017
6.2 Commitments for expenditure
Commitments for future expenditure include operating and external program commitments arising from contracts. These commitments are recorded below at their nominal value and exclusive of GST. These future expenditures cease to be disclosed as commitments once the related liabilities are recognised in the balance sheet.
6.2.1 Total commitments payable
2017$
2016$
Operating lease commitments payable
Less than 1 year 81,928 64,381
1 to 5 years 31,253 10,730
Total commitments (exclusive of GST) 113,181 75,111
Total operating lease commitments payable (including GST) 124,499 82,622
Less GST recoverable from ATO 11,318 7,511
Total operating lease commitments payable (excluding GST) 113,181 75,111
Operating lease commitments relate to office facilities with lease terms between one and two years. These contracts do not allow the Authority to purchase the facilities after the lease ends, but the Authority has the option to renew each of the leases at the end of the lease term.
As at 30 June 2017 the Authority had Nil in finance lease commitments (2016: $Nil).
As at 30 June 2017 the Authority had Nil in capital expenditure commitments (2016: $11,725).
6.3 Carry forward project funding
Catchment Management Authorities are responsible for the coordination of catchments in an integrated and sustainable manner. This is achieved by undertaking projects funded by Victorian and Australian Government programs. The Authority received funding for specific projects which are guided by the Regional Catchment Strategy and delivered in line with the Authority’s Corporate Plan approved by the Minister for Water.
The projects funded by the State and Australian Governments can be undertaken over multiple financial years and fund can be received at various stages of the project life based on contractual agreements. At the end of the financial year there are some projects that have not reached completion but will be completed within the contractual terms in future financial periods.
At balance date the Authority has cash and cash equivalents that will be utilised to complete these projects in future financial years.
86
SE
CT
ION
1 S
EC
TIO
N 2
SE
CT
ION
3 S
EC
TIO
N 4
SE
CT
ION
5 S
EC
TIO
N 6
SE
CT
ION
7
FINANCIAL STATEMENTS
NOTES TO THE
FINANCIAL STATEMENTS for the year ended 30 June 2017
7. RISKS, CONTINGENCIES AND VALUATION JUDGEMENTS
Introduction
The Authority is exposed to risk from its activities and outside factors. In addition, it is often necessary to make judgements and estimates associated with recognition and measurement of items in the financial statements. This section sets out financial instrument specific information, (including exposures to financial risks) as well as those items that are contingent in nature or require a higher level of judgement to be applied, which for the Authority relate mainly to fair value determination.
Structure
7.1 Financial instruments specific disclosures
7.2 Contingent assets and contingent liabilities
7.3 Fair value determination
7.1 Financial instruments specific disclosures
Introduction
Financial instruments arise out of contractual agreements that give rise to a financial asset of one entity and a financial liability of equity instrument of another entity.
Categories of financial instruments
Loans and receivables are financial instrument assets with fixed and determinable payments that are not quoted in an active market. These assets are initially recognised at fair value plus any directly attributable transaction costs. Subsequent to initial measurement, loans and receivables are measured at amortised cost less any impairment. Loans and receivables category includes cash and deposits, trade and other receivables, but excludes statutory receivables.
Collectability of trade receivables is reviewed on an ongoing basis. Bad debts which are known to be uncollectible are written off, and classified as a transaction expense. A provision for impaired receivables is established when there is objective evidence that the Authority will not be able to collect all amounts due according to the original terms of receivables.
Financial liabilities at amortised cost are initially recognised on the date they originated. They are initially measured at fair value plus any directly attributable transaction costs. Subsequent to initial recognition, these financial instruments are measured at amortised cost. Financial instrument liabilities measured at amortised cost include all of the Authority’s contractual payables.
A financial liability is no longer recognised when the obligation under the liability is discharged, cancelled or expires.
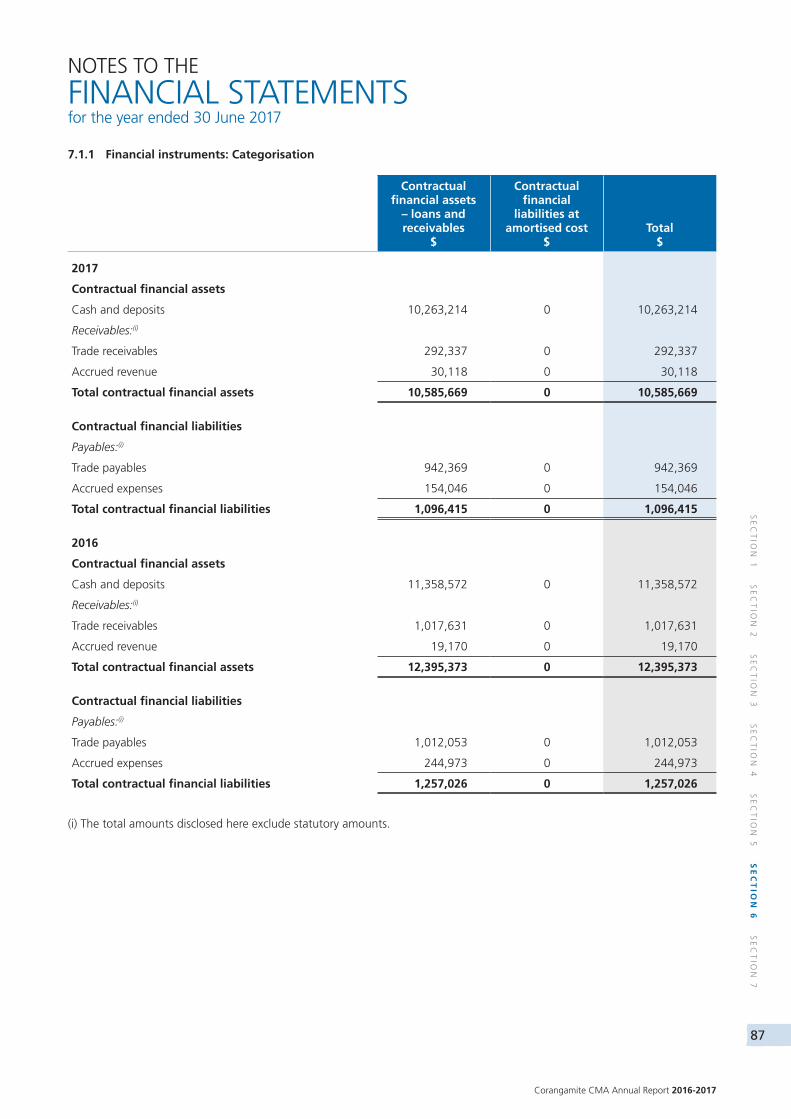
Corangamite CMA Annual Report 2016-2017
87
SE
CT
ION
1 S
EC
TIO
N 2
SE
CT
ION
3 S
EC
TIO
N 4
SE
CT
ION
5 S
EC
TIO
N 6
SE
CT
ION
7
NOTES TO THE
FINANCIAL STATEMENTS for the year ended 30 June 2017
7.1.1 Financial instruments: Categorisation
Contractual financial assets
– loans and receivables
$
Contractual financial
liabilities at amortised cost
$Total
$
2017
Contractual financial assets
Cash and deposits 10,263,214 0 10,263,214
Receivables:(i)
Trade receivables 292,337 0 292,337
Accrued revenue 30,118 0 30,118
Total contractual financial assets 10,585,669 0 10,585,669
Contractual financial liabilities
Payables:(i)
Trade payables 942,369 0 942,369
Accrued expenses 154,046 0 154,046
Total contractual financial liabilities 1,096,415 0 1,096,415
2016
Contractual financial assets
Cash and deposits 11,358,572 0 11,358,572
Receivables:(i)
Trade receivables 1,017,631 0 1,017,631
Accrued revenue 19,170 0 19,170
Total contractual financial assets 12,395,373 0 12,395,373
Contractual financial liabilities
Payables:(i)
Trade payables 1,012,053 0 1,012,053
Accrued expenses 244,973 0 244,973
Total contractual financial liabilities 1,257,026 0 1,257,026
(i) The total amounts disclosed here exclude statutory amounts.
88
SE
CT
ION
1 S
EC
TIO
N 2
SE
CT
ION
3 S
EC
TIO
N 4
SE
CT
ION
5 S
EC
TIO
N 6
SE
CT
ION
7
FINANCIAL STATEMENTS
NOTES TO THE
FINANCIAL STATEMENTS for the year ended 30 June 2017
7.1.2 Financial risk management objectives and policies
The Authority’s main financial risks include credit risk, liquidity risk and interest rate risk. The Authority manages these financial risks in accordance with its financial risk management policy.
The Authority uses different methods to measure and manage the different risks to which it is exposed. Primary responsibility for the identification and management of financial risks rests with the Audit and Risk Committee of the Authority.
Financial instruments: Credit risk
Credit risk refers to the possibility that a borrower will default on its financial obligations as and when they fall due. The Authority’s exposure to credit risk arises from the potential default of a counter party on their contractual obligations resulting in financial loss to the Authority. Credit risk is measured at fair value and is monitored on a regular basis.
Credit risk associated with the Authority’s contractual financial assets is minimal because the main debtor is the Victorian Government. For debtors other than the Government, the Authority has adopted a policy of only dealing with creditworthy counterparties and obtaining sufficient collateral where appropriate. For cash assets, the Authority’s policy is to only deal with banks with high credit-ratings assigned by international credit-rating agencies. All cash and deposits are held with the Treasury Corporation of Victoria and National Australia Bank.
Financial instruments: Liquidity risk
Liquidity risk arises from being unable to meet financial obligations as they fall due. The Authority operates under the Government fair payments policy of settling financial obligations within 30 days and in the event of a dispute, making payments within 30 days from the date of resolution.
The Authority’s exposure to liquidity risk is deemed insignificant based on prior periods’ data and current assessment of risk. The Authority does not have any borrowings, and maintains high levels of cash and deposits readily available to meet its financial obligations. The Authority manages its liquidity risk by maintaining adequate cash reserves and continually monitoring the Authority’s expenditure commitments and cash flow needs.
Financial instruments: Market risk
The Authority’s exposure to market risk is primarily through interest rate risk with significant funds held in term deposits and deposits at a call. The Authority has no exposure to foreign exchange risk or other price risk.
Cash flow interest rate risk is the risk that the future cash flows of a financial instrument will fluctuate because of changes in market interest rates. The Authority manages its cash flow interest rate risks by investing surplus funds into fixed rate financial instruments. Management has concluded for cash at bank and deposits at call as financial assets that can be left at floating rate without necessarily exposing the Authority to significant risk. Management monitors movements in interest rates on a daily basis.
The carrying amounts of financial assets and financial liabilities that are exposed to interest rates and the Authority’s sensitivity to interest rate risk are set out in the table that follows.
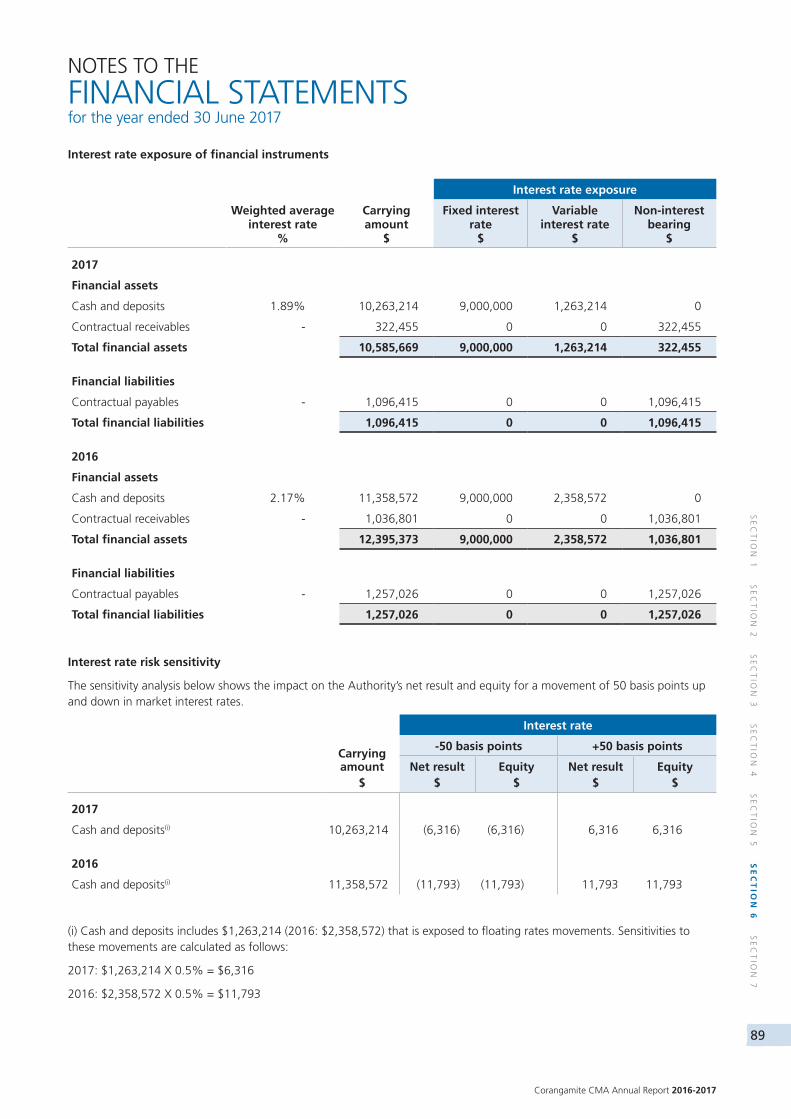
Corangamite CMA Annual Report 2016-2017
89
SE
CT
ION
1 S
EC
TIO
N 2
SE
CT
ION
3 S
EC
TIO
N 4
SE
CT
ION
5 S
EC
TIO
N 6
SE
CT
ION
7
NOTES TO THE
FINANCIAL STATEMENTS for the year ended 30 June 2017
Interest rate exposure of financial instruments
Maturity dates Maturity dates Interest rate exposure
Weighted average interest rate
%
Carrying amount
$
Fixed interest rate
$
Variable interest rate
$
Non-interest bearing
$
2017
Financial assets
Cash and deposits 1.89% 10,263,214 9,000,000 1,263,214 0
Contractual receivables - 322,455 0 0 322,455
Total financial assets 10,585,669 9,000,000 1,263,214 322,455
Financial liabilities
Contractual payables - 1,096,415 0 0 1,096,415
Total financial liabilities 1,096,415 0 0 1,096,415
2016
Financial assets
Cash and deposits 2.17% 11,358,572 9,000,000 2,358,572 0
Contractual receivables - 1,036,801 0 0 1,036,801
Total financial assets 12,395,373 9,000,000 2,358,572 1,036,801
Financial liabilities
Contractual payables - 1,257,026 0 0 1,257,026
Total financial liabilities 1,257,026 0 0 1,257,026
Interest rate risk sensitivity
The sensitivity analysis below shows the impact on the Authority’s net result and equity for a movement of 50 basis points up and down in market interest rates.
Carrying amount
$
Interest rate
-50 basis points +50 basis points
Net result$
Equity$
Net result$
Equity$
2017
Cash and deposits(i) 10,263,214 (6,316) (6,316) 6,316 6,316
2016
Cash and deposits(i) 11,358,572 (11,793) (11,793) 11,793 11,793
(i) Cash and deposits includes $1,263,214 (2016: $2,358,572) that is exposed to floating rates movements. Sensitivities to these movements are calculated as follows:
2017: $1,263,214 X 0.5% = $6,316
2016: $2,358,572 X 0.5% = $11,793
90
SE
CT
ION
1 S
EC
TIO
N 2
SE
CT
ION
3 S
EC
TIO
N 4
SE
CT
ION
5 S
EC
TIO
N 6
SE
CT
ION
7
FINANCIAL STATEMENTS
NOTES TO THE
FINANCIAL STATEMENTS for the year ended 30 June 2017
7.2 Contingent assets and contingent liabilities
Contingent assets and contingent liabilities are not recognised in the balance sheet but are disclosed and, if quantifiable, are measured at nominal value.
Contingent assets
As at 30 June 2017, the Authority has no known contingent assets. (2016: Nil)
Contingent liabilities
Guarantees for loans to other entities(i)
(i) The amount disclosed is the nominal amount of the underlying loan that is guaranteed by the Authority. The Authority has reviewed its financial guarantees and determined that there is no material liability to be recognised for financial guarantee contracts at 30 June 2017.
7.3 Fair value determination
Significant judgement: Fair value measurements of assets and liabilities
Fair value determination requires judgement and the use of assumptions. This section discloses the most significant assumptions used in determining fair values. Changes to assumptions could have a material impact on the results and financial position of the Authority.
The Authority’s property, plant and equipment are carried at fair value.
In addition, the fair values of other assets and liabilities which are carried at amortised cost, also need to be determined for disclosure purposes.
The Authority determines the policies and procedures for determining fair values for both financial and non-financial assets and liabilities as required.
Fair value hierarchy
In determining fair values a number of inputs are used. To increase consistency and comparability in the financial statements, these inputs are categorised into three levels, also known as the fair value hierarchy.
The levels are as follows:
Level 1 – Quoted (unadjusted) market prices in active markets for identical assets or liabilities;
Level 2 – Valuation techniques for which the lowest level input that is significant to the fair value measurement is directly or indirectly observable; and
Level 3 – Valuation techniques for which the lowest level input that is significant to the fair value measurement is unobservable.
The Authority determines whether transfers have occurred between levels in the hierarchy by reassessing categorisation (based on the lowest level input that is significant to the fair value measurement as a whole) at the end of each reporting period.
7.3.1 Fair value determination of financial assets and liabilities
The Authority currently holds a range of financial instruments that are recorded in the financial statements where the carrying amounts are a reasonable approximation of fair value, either due to their short-term nature or with the expectation that they will be paid in full by the end of the 2016-17 reporting period.
These financial instruments include:
Financial assets Financial liabilities
Cash and deposits Payables:
Receivables: • Trade payables
• Trade receivables • Accrued expenses
• Accrued revenue
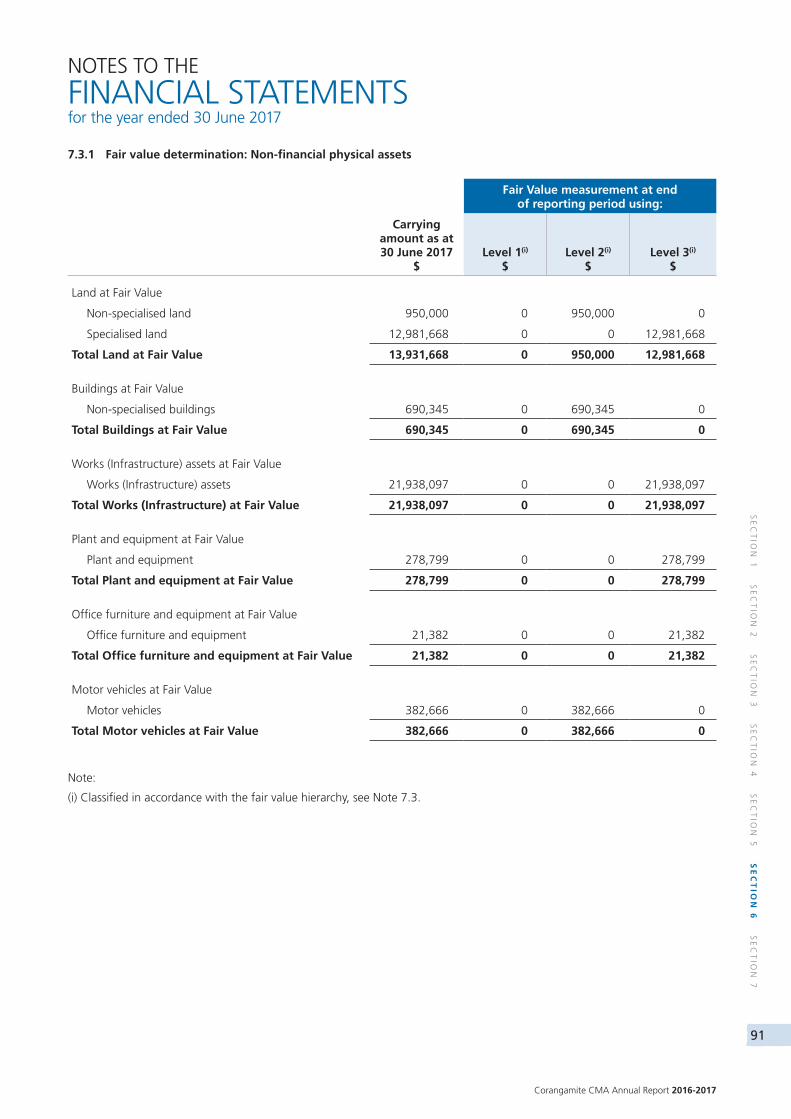
Corangamite CMA Annual Report 2016-2017
91
SE
CT
ION
1 S
EC
TIO
N 2
SE
CT
ION
3 S
EC
TIO
N 4
SE
CT
ION
5 S
EC
TIO
N 6
SE
CT
ION
7
NOTES TO THE
FINANCIAL STATEMENTS for the year ended 30 June 2017
7.3.1 Fair value determination: Non-financial physical assets
Maturity datesFair Value measurement at end
of reporting period using:
Carryingamount as at30 June 2017
$Level 1(i)
$Level 2(i)
$Level 3(i)
$
Land at Fair Value
Non-specialised land 950,000 0 950,000 0
Specialised land 12,981,668 0 0 12,981,668
Total Land at Fair Value 13,931,668 0 950,000 12,981,668
Buildings at Fair Value
Non-specialised buildings 690,345 0 690,345 0
Total Buildings at Fair Value 690,345 0 690,345 0
Works (Infrastructure) assets at Fair Value
Works (Infrastructure) assets 21,938,097 0 0 21,938,097
Total Works (Infrastructure) at Fair Value 21,938,097 0 0 21,938,097
Plant and equipment at Fair Value
Plant and equipment 278,799 0 0 278,799
Total Plant and equipment at Fair Value 278,799 0 0 278,799
Office furniture and equipment at Fair Value
Office furniture and equipment 21,382 0 0 21,382
Total Office furniture and equipment at Fair Value 21,382 0 0 21,382
Motor vehicles at Fair Value
Motor vehicles 382,666 0 382,666 0
Total Motor vehicles at Fair Value 382,666 0 382,666 0
Note:
(i) Classified in accordance with the fair value hierarchy, see Note 7.3.
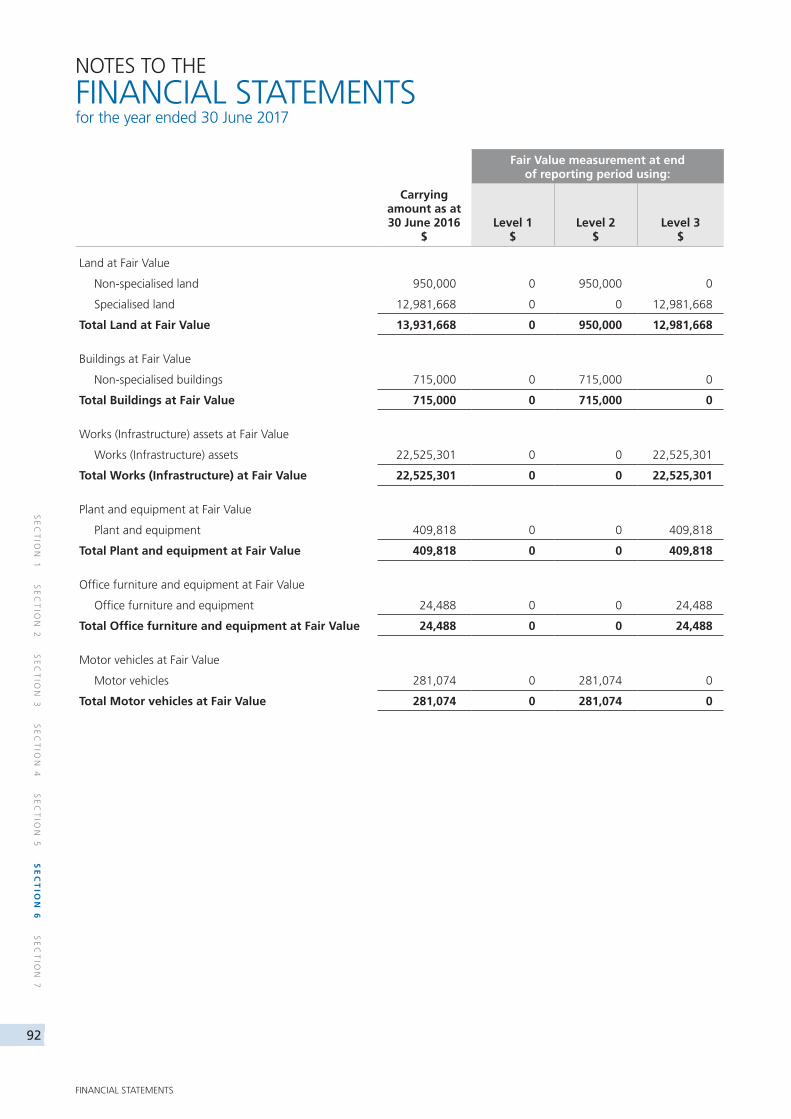
92
SE
CT
ION
1 S
EC
TIO
N 2
SE
CT
ION
3 S
EC
TIO
N 4
SE
CT
ION
5 S
EC
TIO
N 6
SE
CT
ION
7
FINANCIAL STATEMENTS
NOTES TO THE
FINANCIAL STATEMENTS for the year ended 30 June 2017
Maturity datesFair Value measurement at end
of reporting period using:
Carryingamount as at30 June 2016
$Level 1
$Level 2
$Level 3
$
Land at Fair Value
Non-specialised land 950,000 0 950,000 0
Specialised land 12,981,668 0 0 12,981,668
Total Land at Fair Value 13,931,668 0 950,000 12,981,668
Buildings at Fair Value
Non-specialised buildings 715,000 0 715,000 0
Total Buildings at Fair Value 715,000 0 715,000 0
Works (Infrastructure) assets at Fair Value
Works (Infrastructure) assets 22,525,301 0 0 22,525,301
Total Works (Infrastructure) at Fair Value 22,525,301 0 0 22,525,301
Plant and equipment at Fair Value
Plant and equipment 409,818 0 0 409,818
Total Plant and equipment at Fair Value 409,818 0 0 409,818
Office furniture and equipment at Fair Value
Office furniture and equipment 24,488 0 0 24,488
Total Office furniture and equipment at Fair Value 24,488 0 0 24,488
Motor vehicles at Fair Value
Motor vehicles 281,074 0 281,074 0
Total Motor vehicles at Fair Value 281,074 0 281,074 0
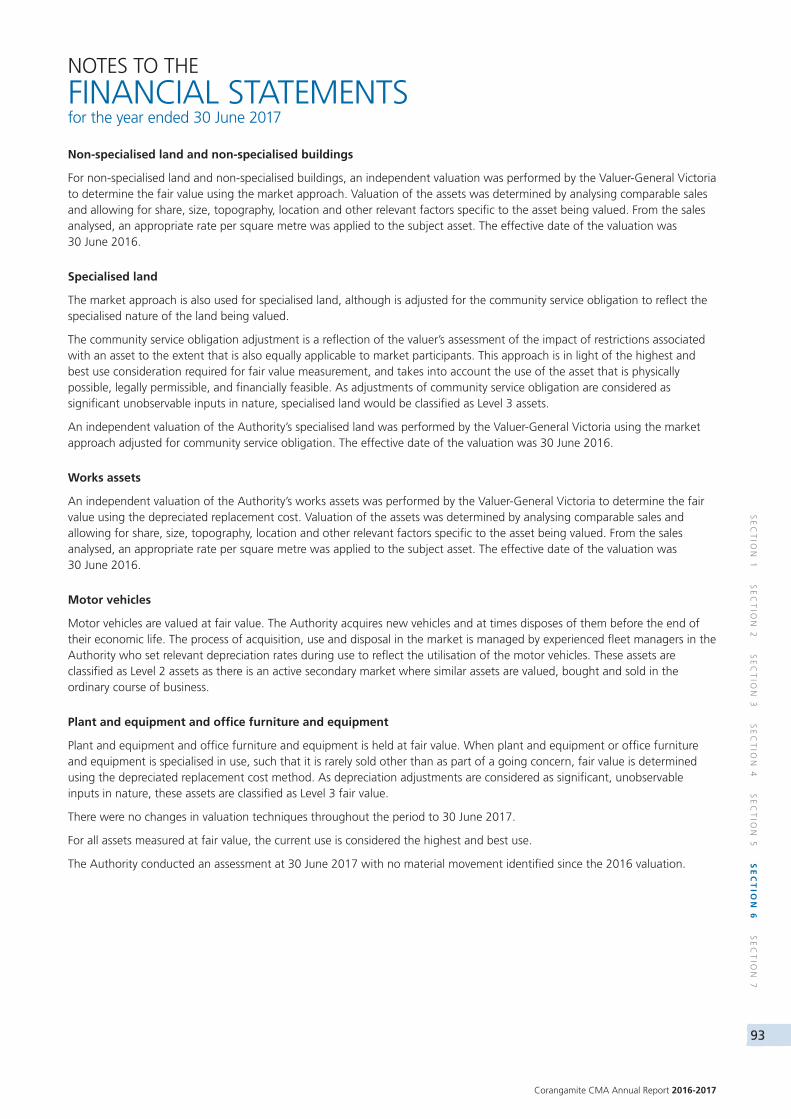
Corangamite CMA Annual Report 2016-2017
93
SE
CT
ION
1 S
EC
TIO
N 2
SE
CT
ION
3 S
EC
TIO
N 4
SE
CT
ION
5 S
EC
TIO
N 6
SE
CT
ION
7
NOTES TO THE
FINANCIAL STATEMENTS for the year ended 30 June 2017
Non-specialised land and non-specialised buildings
For non-specialised land and non-specialised buildings, an independent valuation was performed by the Valuer-General Victoria to determine the fair value using the market approach. Valuation of the assets was determined by analysing comparable sales and allowing for share, size, topography, location and other relevant factors specific to the asset being valued. From the sales analysed, an appropriate rate per square metre was applied to the subject asset. The effective date of the valuation was 30 June 2016.
Specialised land
The market approach is also used for specialised land, although is adjusted for the community service obligation to reflect the specialised nature of the land being valued.
The community service obligation adjustment is a reflection of the valuer’s assessment of the impact of restrictions associated with an asset to the extent that is also equally applicable to market participants. This approach is in light of the highest and best use consideration required for fair value measurement, and takes into account the use of the asset that is physically possible, legally permissible, and financially feasible. As adjustments of community service obligation are considered as significant unobservable inputs in nature, specialised land would be classified as Level 3 assets.
An independent valuation of the Authority’s specialised land was performed by the Valuer-General Victoria using the market approach adjusted for community service obligation. The effective date of the valuation was 30 June 2016.
Works assets
An independent valuation of the Authority’s works assets was performed by the Valuer-General Victoria to determine the fair value using the depreciated replacement cost. Valuation of the assets was determined by analysing comparable sales and allowing for share, size, topography, location and other relevant factors specific to the asset being valued. From the sales analysed, an appropriate rate per square metre was applied to the subject asset. The effective date of the valuation was 30 June 2016.
Motor vehicles
Motor vehicles are valued at fair value. The Authority acquires new vehicles and at times disposes of them before the end of their economic life. The process of acquisition, use and disposal in the market is managed by experienced fleet managers in the Authority who set relevant depreciation rates during use to reflect the utilisation of the motor vehicles. These assets are classified as Level 2 assets as there is an active secondary market where similar assets are valued, bought and sold in the ordinary course of business.
Plant and equipment and office furniture and equipment
Plant and equipment and office furniture and equipment is held at fair value. When plant and equipment or office furniture and equipment is specialised in use, such that it is rarely sold other than as part of a going concern, fair value is determined using the depreciated replacement cost method. As depreciation adjustments are considered as significant, unobservable inputs in nature, these assets are classified as Level 3 fair value.
There were no changes in valuation techniques throughout the period to 30 June 2017.
For all assets measured at fair value, the current use is considered the highest and best use.
The Authority conducted an assessment at 30 June 2017 with no material movement identified since the 2016 valuation.
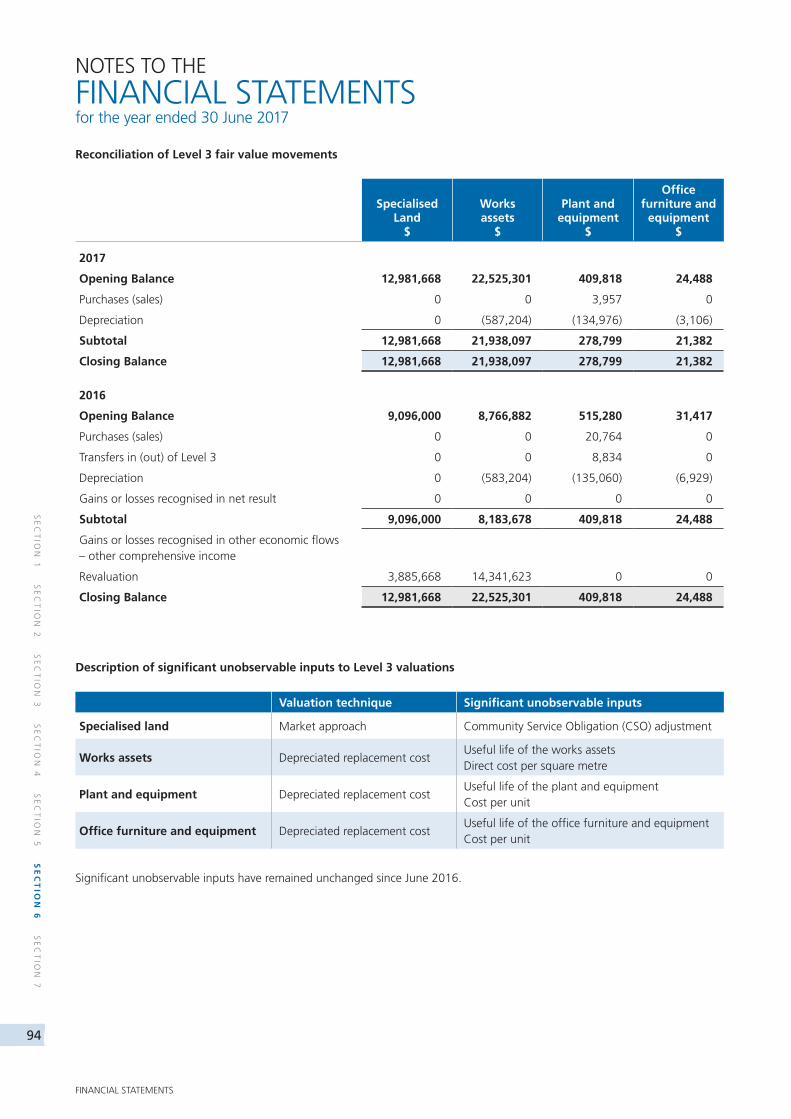
94
SE
CT
ION
1 S
EC
TIO
N 2
SE
CT
ION
3 S
EC
TIO
N 4
SE
CT
ION
5 S
EC
TIO
N 6
SE
CT
ION
7
FINANCIAL STATEMENTS
NOTES TO THE
FINANCIAL STATEMENTS for the year ended 30 June 2017
Reconciliation of Level 3 fair value movements
Specialised Land
$
Works assets
$
Plant and equipment
$
Office furniture and
equipment$
2017
Opening Balance 12,981,668 22,525,301 409,818 24,488
Purchases (sales) 0 0 3,957 0
Depreciation 0 (587,204) (134,976) (3,106)
Subtotal 12,981,668 21,938,097 278,799 21,382
Closing Balance 12,981,668 21,938,097 278,799 21,382
2016
Opening Balance 9,096,000 8,766,882 515,280 31,417
Purchases (sales) 0 0 20,764 0
Transfers in (out) of Level 3 0 0 8,834 0
Depreciation 0 (583,204) (135,060) (6,929)
Gains or losses recognised in net result 0 0 0 0
Subtotal 9,096,000 8,183,678 409,818 24,488
Gains or losses recognised in other economic flows – other comprehensive income
Revaluation 3,885,668 14,341,623 0 0
Closing Balance 12,981,668 22,525,301 409,818 24,488
Description of significant unobservable inputs to Level 3 valuations
Valuation technique Significant unobservable inputs
Specialised land Market approach Community Service Obligation (CSO) adjustment
Works assets Depreciated replacement cost Useful life of the works assetsDirect cost per square metre
Plant and equipment Depreciated replacement cost Useful life of the plant and equipmentCost per unit
Office furniture and equipment Depreciated replacement cost Useful life of the office furniture and equipmentCost per unit
Significant unobservable inputs have remained unchanged since June 2016.
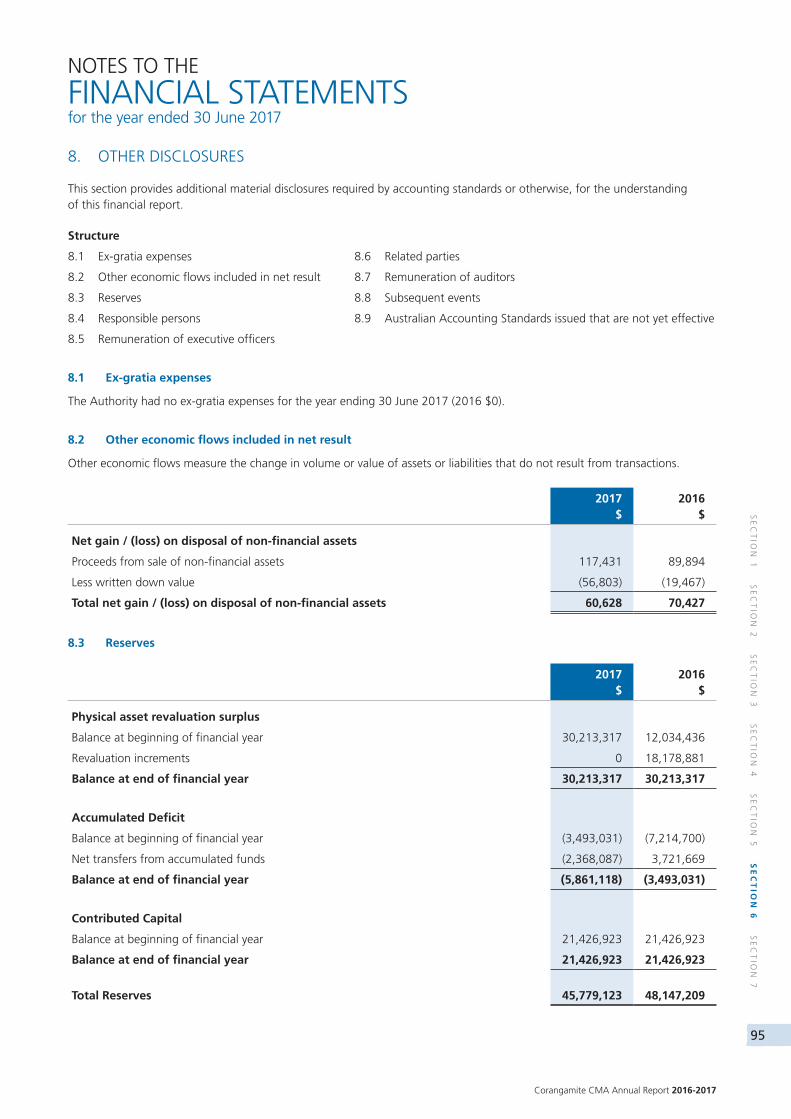
Corangamite CMA Annual Report 2016-2017
95
SE
CT
ION
1 S
EC
TIO
N 2
SE
CT
ION
3 S
EC
TIO
N 4
SE
CT
ION
5 S
EC
TIO
N 6
SE
CT
ION
7
NOTES TO THE
FINANCIAL STATEMENTS for the year ended 30 June 2017
8. OTHER DISCLOSURES
This section provides additional material disclosures required by accounting standards or otherwise, for the understanding of this financial report.
Structure
8.1 Ex-gratia expenses 8.6 Related parties
8.2 Other economic flows included in net result 8.7 Remuneration of auditors
8.3 Reserves 8.8 Subsequent events
8.4 Responsible persons 8.9 Australian Accounting Standards issued that are not yet effective
8.5 Remuneration of executive officers
8.1 Ex-gratia expenses
The Authority had no ex-gratia expenses for the year ending 30 June 2017 (2016 $0).
8.2 Other economic flows included in net result
Other economic flows measure the change in volume or value of assets or liabilities that do not result from transactions.
2017$
2016$
Net gain / (loss) on disposal of non-financial assets
Proceeds from sale of non-financial assets 117,431 89,894
Less written down value (56,803) (19,467)
Total net gain / (loss) on disposal of non-financial assets 60,628 70,427
8.3 Reserves
2017$
2016$
Physical asset revaluation surplus
Balance at beginning of financial year 30,213,317 12,034,436
Revaluation increments 0 18,178,881
Balance at end of financial year 30,213,317 30,213,317
Accumulated Deficit
Balance at beginning of financial year (3,493,031) (7,214,700)
Net transfers from accumulated funds (2,368,087) 3,721,669
Balance at end of financial year (5,861,118) (3,493,031)
Contributed Capital
Balance at beginning of financial year 21,426,923 21,426,923
Balance at end of financial year 21,426,923 21,426,923
Total Reserves 45,779,123 48,147,209
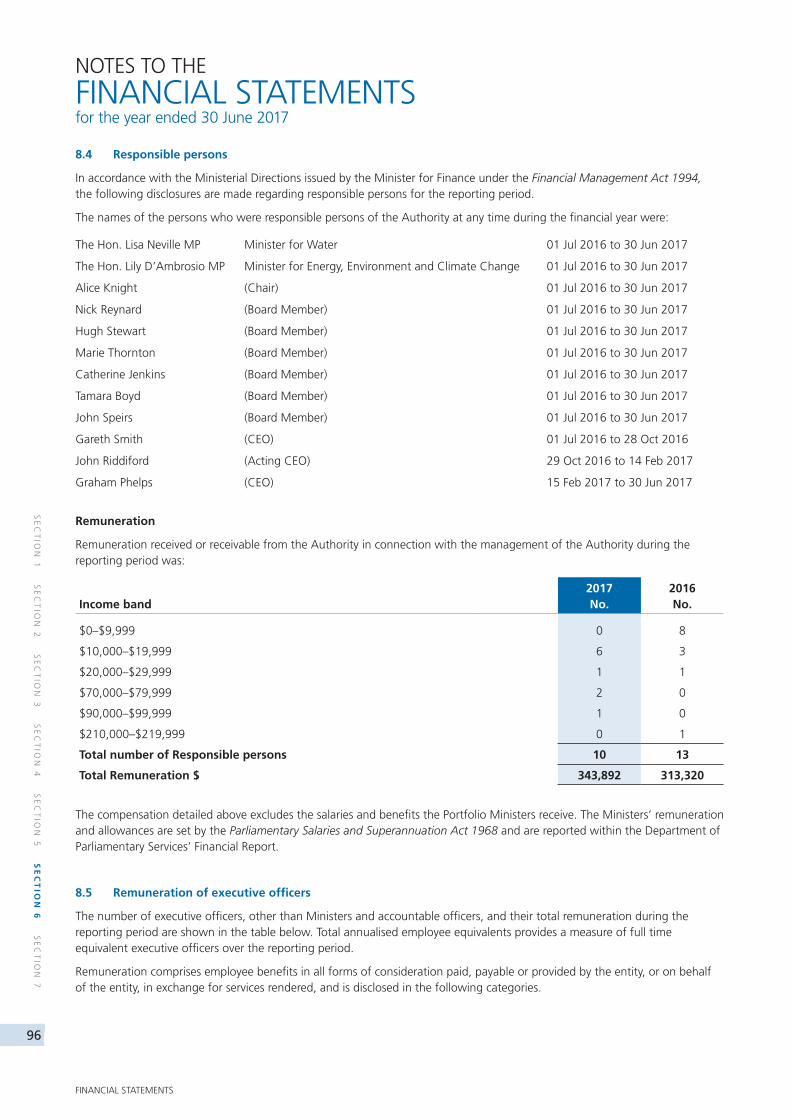
96
SE
CT
ION
1 S
EC
TIO
N 2
SE
CT
ION
3 S
EC
TIO
N 4
SE
CT
ION
5 S
EC
TIO
N 6
SE
CT
ION
7
FINANCIAL STATEMENTS
NOTES TO THE
FINANCIAL STATEMENTS for the year ended 30 June 2017
8.4 Responsible persons
In accordance with the Ministerial Directions issued by the Minister for Finance under the Financial Management Act 1994, the following disclosures are made regarding responsible persons for the reporting period.
The names of the persons who were responsible persons of the Authority at any time during the financial year were:
The Hon. Lisa Neville MP Minister for Water 01 Jul 2016 to 30 Jun 2017
The Hon. Lily D’Ambrosio MP Minister for Energy, Environment and Climate Change 01 Jul 2016 to 30 Jun 2017
Alice Knight (Chair) 01 Jul 2016 to 30 Jun 2017
Nick Reynard (Board Member) 01 Jul 2016 to 30 Jun 2017
Hugh Stewart (Board Member) 01 Jul 2016 to 30 Jun 2017
Marie Thornton (Board Member) 01 Jul 2016 to 30 Jun 2017
Catherine Jenkins (Board Member) 01 Jul 2016 to 30 Jun 2017
Tamara Boyd (Board Member) 01 Jul 2016 to 30 Jun 2017
John Speirs (Board Member) 01 Jul 2016 to 30 Jun 2017
Gareth Smith (CEO) 01 Jul 2016 to 28 Oct 2016
John Riddiford (Acting CEO) 29 Oct 2016 to 14 Feb 2017
Graham Phelps (CEO) 15 Feb 2017 to 30 Jun 2017
Remuneration
Remuneration received or receivable from the Authority in connection with the management of the Authority during the reporting period was:
Income band2017No.
2016No.
$0–$9,999 0 8
$10,000–$19,999 6 3
$20,000–$29,999 1 1
$70,000–$79,999 2 0
$90,000–$99,999 1 0
$210,000–$219,999 0 1
Total number of Responsible persons 10 13
Total Remuneration $ 343,892 313,320
The compensation detailed above excludes the salaries and benefits the Portfolio Ministers receive. The Ministers’ remuneration and allowances are set by the Parliamentary Salaries and Superannuation Act 1968 and are reported within the Department of Parliamentary Services’ Financial Report.
8.5 Remuneration of executive officers
The number of executive officers, other than Ministers and accountable officers, and their total remuneration during the reporting period are shown in the table below. Total annualised employee equivalents provides a measure of full time equivalent executive officers over the reporting period.
Remuneration comprises employee benefits in all forms of consideration paid, payable or provided by the entity, or on behalf of the entity, in exchange for services rendered, and is disclosed in the following categories.
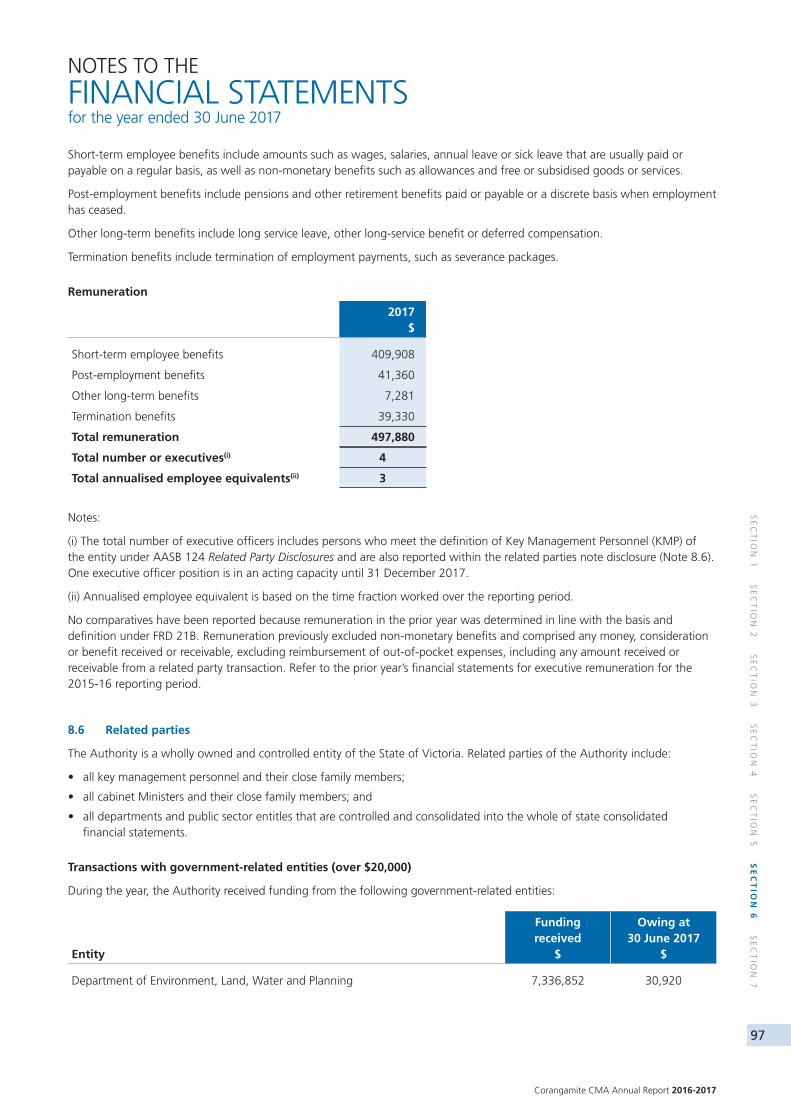
Corangamite CMA Annual Report 2016-2017
97
SE
CT
ION
1 S
EC
TIO
N 2
SE
CT
ION
3 S
EC
TIO
N 4
SE
CT
ION
5 S
EC
TIO
N 6
SE
CT
ION
7
NOTES TO THE
FINANCIAL STATEMENTS for the year ended 30 June 2017
Short-term employee benefits include amounts such as wages, salaries, annual leave or sick leave that are usually paid or payable on a regular basis, as well as non-monetary benefits such as allowances and free or subsidised goods or services.
Post-employment benefits include pensions and other retirement benefits paid or payable or a discrete basis when employment has ceased.
Other long-term benefits include long service leave, other long-service benefit or deferred compensation.
Termination benefits include termination of employment payments, such as severance packages.
Remuneration
2017$
Short-term employee benefits 409,908
Post-employment benefits 41,360
Other long-term benefits 7,281
Termination benefits 39,330
Total remuneration 497,880
Total number or executives(i) 4
Total annualised employee equivalents(ii) 3
Notes:
(i) The total number of executive officers includes persons who meet the definition of Key Management Personnel (KMP) of the entity under AASB 124 Related Party Disclosures and are also reported within the related parties note disclosure (Note 8.6). One executive officer position is in an acting capacity until 31 December 2017.
(ii) Annualised employee equivalent is based on the time fraction worked over the reporting period.
No comparatives have been reported because remuneration in the prior year was determined in line with the basis and definition under FRD 21B. Remuneration previously excluded non-monetary benefits and comprised any money, consideration or benefit received or receivable, excluding reimbursement of out-of-pocket expenses, including any amount received or receivable from a related party transaction. Refer to the prior year’s financial statements for executive remuneration for the 2015-16 reporting period.
8.6 Related parties
The Authority is a wholly owned and controlled entity of the State of Victoria. Related parties of the Authority include:
• all key management personnel and their close family members;
• all cabinet Ministers and their close family members; and
• all departments and public sector entitles that are controlled and consolidated into the whole of state consolidated financial statements.
Transactions with government-related entities (over $20,000)
During the year, the Authority received funding from the following government-related entities:
Entity
Funding received
$
Owing at 30 June 2017
$
Department of Environment, Land, Water and Planning 7,336,852 30,920
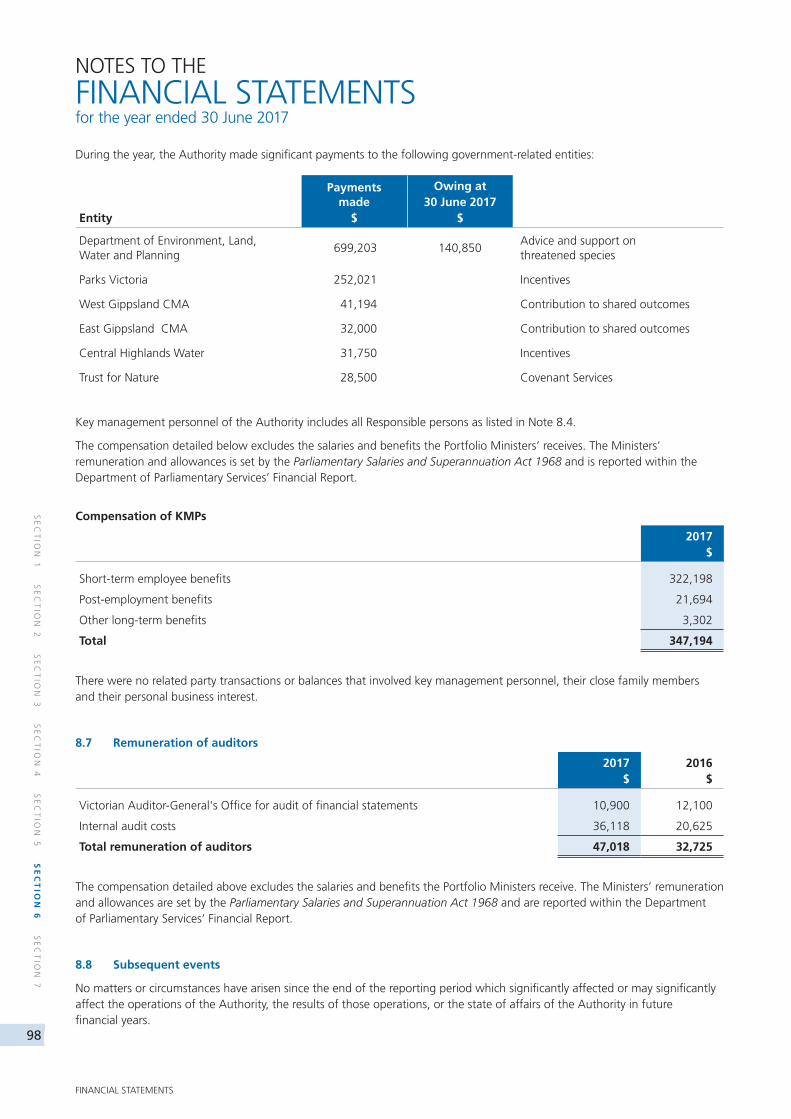
98
SE
CT
ION
1 S
EC
TIO
N 2
SE
CT
ION
3 S
EC
TIO
N 4
SE
CT
ION
5 S
EC
TIO
N 6
SE
CT
ION
7
FINANCIAL STATEMENTS
During the year, the Authority made significant payments to the following government-related entities:
Entity
Payments made
$
Owing at 30 June 2017
$
Department of Environment, Land, Water and Planning
699,203 140,850Advice and support on threatened species
Parks Victoria 252,021 Incentives
West Gippsland CMA 41,194 Contribution to shared outcomes
East Gippsland CMA 32,000 Contribution to shared outcomes
Central Highlands Water 31,750 Incentives
Trust for Nature 28,500 Covenant Services
Key management personnel of the Authority includes all Responsible persons as listed in Note 8.4.
The compensation detailed below excludes the salaries and benefits the Portfolio Ministers’ receives. The Ministers’ remuneration and allowances is set by the Parliamentary Salaries and Superannuation Act 1968 and is reported within the Department of Parliamentary Services’ Financial Report.
Compensation of KMPs
2017$
Short-term employee benefits 322,198
Post-employment benefits 21,694
Other long-term benefits 3,302
Total 347,194
There were no related party transactions or balances that involved key management personnel, their close family members and their personal business interest.
8.7 Remuneration of auditors
2017$
2016$
Victorian Auditor-General's Office for audit of financial statements 10,900 12,100
Internal audit costs 36,118 20,625
Total remuneration of auditors 47,018 32,725
The compensation detailed above excludes the salaries and benefits the Portfolio Ministers receive. The Ministers’ remuneration and allowances are set by the Parliamentary Salaries and Superannuation Act 1968 and are reported within the Department of Parliamentary Services’ Financial Report.
8.8 Subsequent events
No matters or circumstances have arisen since the end of the reporting period which significantly affected or may significantly affect the operations of the Authority, the results of those operations, or the state of affairs of the Authority in future financial years.
NOTES TO THE
FINANCIAL STATEMENTS for the year ended 30 June 2017
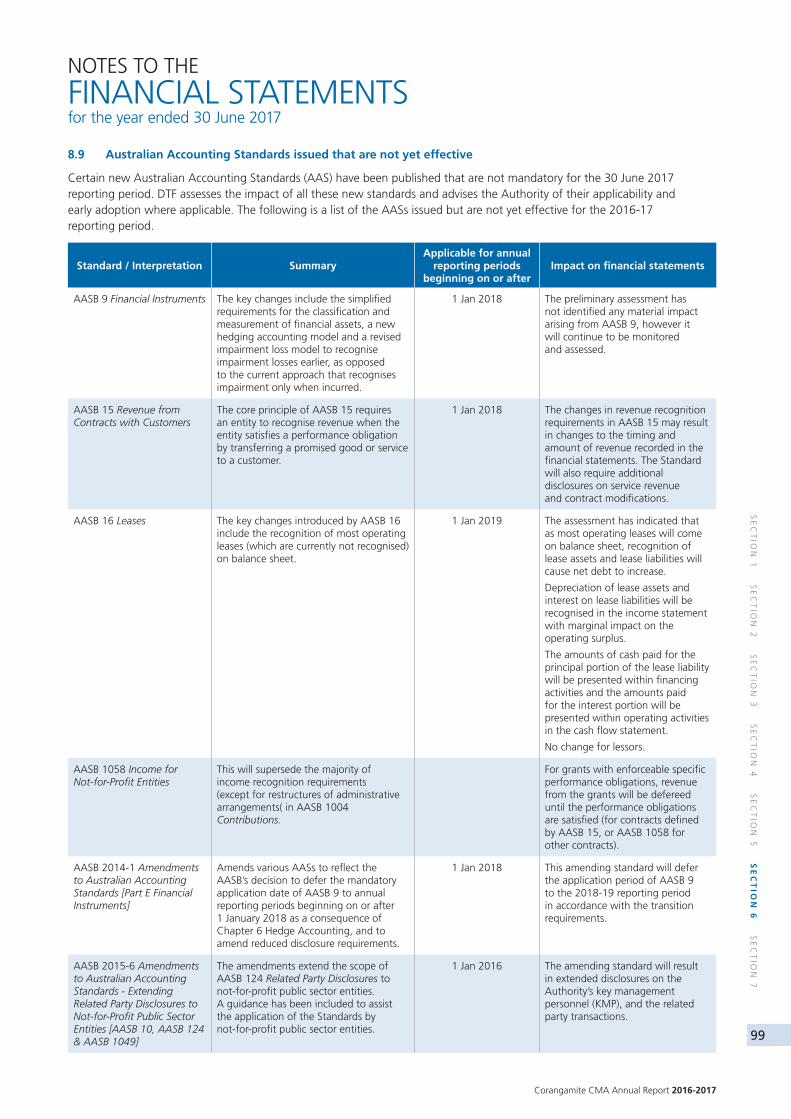
Corangamite CMA Annual Report 2016-2017
99
SE
CT
ION
1 S
EC
TIO
N 2
SE
CT
ION
3 S
EC
TIO
N 4
SE
CT
ION
5 S
EC
TIO
N 6
SE
CT
ION
7
NOTES TO THE
FINANCIAL STATEMENTS for the year ended 30 June 2017
8.9 Australian Accounting Standards issued that are not yet effective
Certain new Australian Accounting Standards (AAS) have been published that are not mandatory for the 30 June 2017 reporting period. DTF assesses the impact of all these new standards and advises the Authority of their applicability and early adoption where applicable. The following is a list of the AASs issued but are not yet effective for the 2016-17 reporting period.
Standard / Interpretation SummaryApplicable for annual
reporting periods beginning on or after
Impact on financial statements
AASB 9 Financial Instruments The key changes include the simplified requirements for the classification and measurement of financial assets, a new hedging accounting model and a revised impairment loss model to recognise impairment losses earlier, as opposed to the current approach that recognises impairment only when incurred.
1 Jan 2018 The preliminary assessment has not identified any material impact arising from AASB 9, however it will continue to be monitored and assessed.
AASB 15 Revenue from Contracts with Customers
The core principle of AASB 15 requires an entity to recognise revenue when the entity satisfies a performance obligation by transferring a promised good or service to a customer.
1 Jan 2018 The changes in revenue recognition requirements in AASB 15 may result in changes to the timing and amount of revenue recorded in the financial statements. The Standard will also require additional disclosures on service revenue and contract modifications.
AASB 16 Leases The key changes introduced by AASB 16 include the recognition of most operating leases (which are currently not recognised) on balance sheet.
1 Jan 2019 The assessment has indicated that as most operating leases will come on balance sheet, recognition of lease assets and lease liabilities will cause net debt to increase.
Depreciation of lease assets and interest on lease liabilities will be recognised in the income statement with marginal impact on the operating surplus.
The amounts of cash paid for the principal portion of the lease liability will be presented within financing activities and the amounts paid for the interest portion will be presented within operating activities in the cash flow statement.
No change for lessors.
AASB 1058 Income for Not-for-Profit Entities
This will supersede the majority of income recognition requirements (except for restructures of administrative arrangements( in AASB 1004 Contributions.
For grants with enforceable specific performance obligations, revenue from the grants will be defereed until the performance obligations are satisfied (for contracts defined by AASB 15, or AASB 1058 for other contracts).
AASB 2014-1 Amendments to Australian Accounting Standards [Part E Financial Instruments]
Amends various AASs to reflect the AASB’s decision to defer the mandatory application date of AASB 9 to annual reporting periods beginning on or after 1 January 2018 as a consequence of Chapter 6 Hedge Accounting, and to amend reduced disclosure requirements.
1 Jan 2018 This amending standard will defer the application period of AASB 9 to the 2018-19 reporting period in accordance with the transition requirements.
AASB 2015-6 Amendments to Australian Accounting Standards - Extending Related Party Disclosures to Not-for-Profit Public Sector Entities [AASB 10, AASB 124 & AASB 1049]
The amendments extend the scope of AASB 124 Related Party Disclosures to not-for-profit public sector entities. A guidance has been included to assist the application of the Standards by not-for-profit public sector entities.
1 Jan 2016 The amending standard will result in extended disclosures on the Authority’s key management personnel (KMP), and the related party transactions.
100
SE
CT
ION
1 S
EC
TIO
N 2
SE
CT
ION
3 S
EC
TIO
N 4
SE
CT
ION
5 S
EC
TIO
N 6
SE
CT
ION
7
APPENDICES - KEY PERFORMANCE INDICATORS
APPENDIX NO 1 PERFORMANCE TARGETS 101
APPENDIX NO 2 DISCLOSURE INDEX 102
ACRONYMS AND TERMS 103
SECTION 7
APPENDICES – KEY PERFORMANCE INDICATORS
The Victorian Government set the following performance indicators and targets for all CMAs to report against annually.
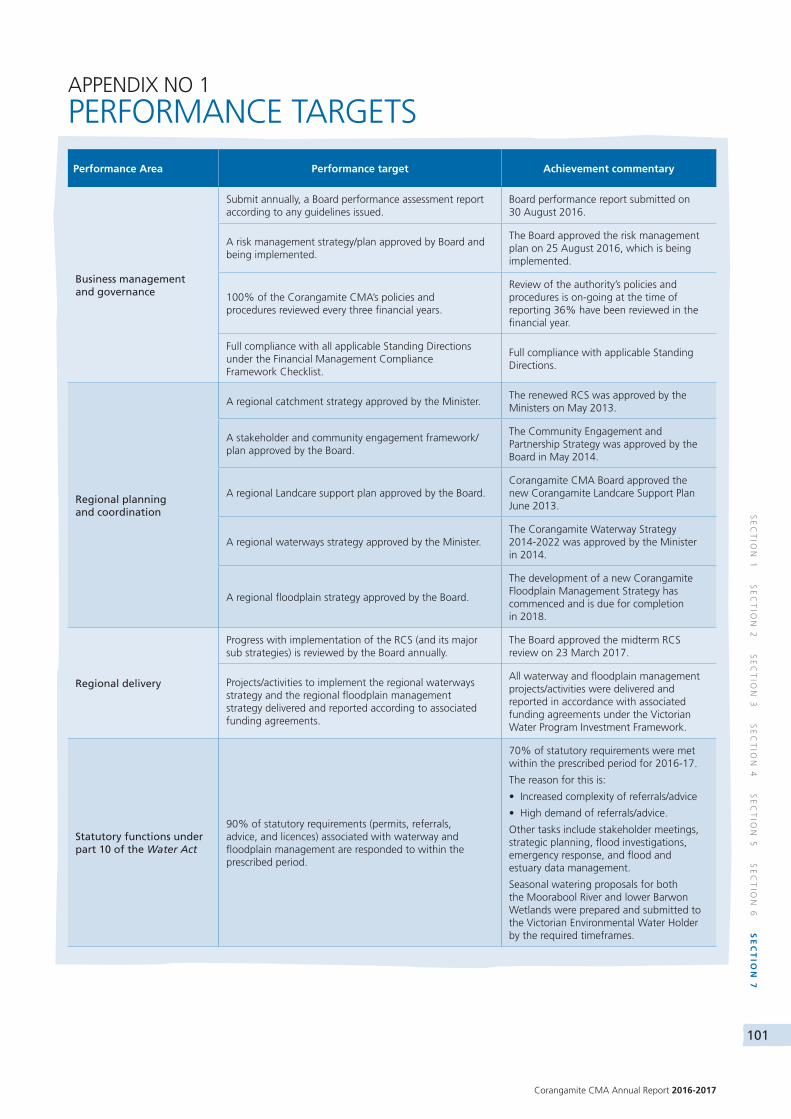
Corangamite CMA Annual Report 2016-2017
101
SE
CT
ION
1 S
EC
TIO
N 2
SE
CT
ION
3 S
EC
TIO
N 4
SE
CT
ION
5 S
EC
TIO
N 6
SE
CT
ION
7
APPENDIX NO 1
PERFORMANCE TARGETS
Performance Area Performance target Achievement commentary
Business management and governance
Submit annually, a Board performance assessment report according to any guidelines issued.
Board performance report submitted on 30 August 2016.
A risk management strategy/plan approved by Board and being implemented.
The Board approved the risk management plan on 25 August 2016, which is being implemented.
100% of the Corangamite CMA’s policies and procedures reviewed every three financial years.
Review of the authority’s policies and procedures is on-going at the time of reporting 36% have been reviewed in the financial year.
Full compliance with all applicable Standing Directions under the Financial Management Compliance Framework Checklist.
Full compliance with applicable Standing Directions.
Regional planning and coordination
A regional catchment strategy approved by the Minister.The renewed RCS was approved by the Ministers on May 2013.
A stakeholder and community engagement framework/plan approved by the Board.
The Community Engagement and Partnership Strategy was approved by the Board in May 2014.
A regional Landcare support plan approved by the Board.Corangamite CMA Board approved the new Corangamite Landcare Support Plan June 2013.
A regional waterways strategy approved by the Minister.The Corangamite Waterway Strategy 2014-2022 was approved by the Minister in 2014.
A regional floodplain strategy approved by the Board.
The development of a new Corangamite Floodplain Management Strategy has commenced and is due for completion in 2018.
Regional delivery
Progress with implementation of the RCS (and its major sub strategies) is reviewed by the Board annually.
The Board approved the midterm RCS review on 23 March 2017.
Projects/activities to implement the regional waterways strategy and the regional floodplain management strategy delivered and reported according to associated funding agreements.
All waterway and floodplain management projects/activities were delivered and reported in accordance with associated funding agreements under the Victorian Water Program Investment Framework.
Statutory functions under part 10 of the Water Act
90% of statutory requirements (permits, referrals, advice, and licences) associated with waterway and floodplain management are responded to within the prescribed period.
70% of statutory requirements were met within the prescribed period for 2016-17.
The reason for this is:
• Increased complexity of referrals/advice
• High demand of referrals/advice.
Other tasks include stakeholder meetings, strategic planning, flood investigations, emergency response, and flood and estuary data management.
Seasonal watering proposals for both the Moorabool River and lower Barwon Wetlands were prepared and submitted to the Victorian Environmental Water Holder by the required timeframes.
102
SE
CT
ION
1 S
EC
TIO
N 2
SE
CT
ION
3 S
EC
TIO
N 4
SE
CT
ION
5 S
EC
TIO
N 6
SE
CT
ION
7
APPENDICES - KEY PERFORMANCE INDICATORS
FRD Disclosure Page
Report of operations
Charter and purpose
FRD 22G Manner of establishment and the relevant Ministers 6
FRD 22G Objectives, functions, powers and duties 6
FRD 22G Nature and range of services provided 6
Management and structure
FRD 22G Organisational structure 55
Financial and other information
FRD 22G Operational and budgetary objectives SD 4.2(k) and performance against objectives 101
FRD 22G Employment and conduct principles 56-57
FRD 29A Statement of workforce data for current and previous 56
FRD 15C Executive officer disclosures 96-97
FRD 22G Summary of the financial results for the year 60
FRD 22G Significant changes in financial position during the year 59
FRD 22G Major changes or factors affecting performance 7
FRD 22G Subsequent events 58
FRD 22G Application and operation of Freedom of Information Act 1982 58
FRD 22G Compliance with building and maintenance provisions of Building Act 1993 58
FRD 22G Statement on National Competition Policy 58
FRD 25B Victorian Industry Participation Policy disclosures 58
FRD 22G Details of consultancies over $10,000 60-61
FRD 12B Disclosure of major contracts 58
FRD 24C Reporting of office-based environmental impacts 61
FRD 22G Statement of availability of other information 58
FRD 10A Disclosure index 102
FRD 22G Government advertising expenditure 58
FRD 22G ICT Expenditure 59
FRD Disclosure Page
Financial Statements
Financial statements required under Part 7 of the FMA
SD4.2(b) Comprehensive income statement 69
SD4.2(b) Balance sheet 70
SD4.2(a) Statement of changes in equity 72
SD4.2(b) Cash flow statement 71
SD4.2(c) Compliance with Australian accounting standards and other authoritative pronouncements 73-99
SD4.2(c) Compliance with Ministerial Directions 56-62
SD4.2(c) Accountable officer’s declaration 68
Other disclosures in notes to the financial statements
FRD 11A Disclosure of ex-gratia payments 58, 95
FRD 21B Responsible person and executive officer disclosures 96
Legislation
Freedom of Information Act 1982 58
Building Act 1993 58
Victorian Industry Participation Policy Act 2003 58
Financial Management Act 1994 64-65, 68
The Annual Report of the Corangamite Catchment Management Authority is prepared in accordance with all relevant Victorian legislation. This index has been prepared to facilitate identification of the Corangamite CMA’s compliance with statutory disclosure requirements.
APPENDIX NO 2
DISCLOSURE INDEX
Corangamite CMA Annual Report 2016-2017
103
SE
CT
ION
1 S
EC
TIO
N 2
SE
CT
ION
3 S
EC
TIO
N 4
SE
CT
ION
5 S
EC
TIO
N 6
SE
CT
ION
7
ABC Actions for Biodiversity Conservation
AHD Australian Height Datum
A-IFRS Australian equivalents to International Financial Reporting Standards
AVIRA Asset Value Identification and Risk Assessment
Corangamite CMA Corangamite Catchment Management Authority
CaLP Catchment and Land Protection Act
CEO Chief Executive Officer
CFI Carbon Farming Initiative
CLP Corangamite Landcare Program
CPA Certified Practising Accountant
CWS Corangamite Wetlands Strategy
DEDJTR Department of Economic Development, Jobs, Transport and Resources
DELWP Department of Environment, Land, Water and Planning
EBA Enterprise Bargaining Agreement
EEMSS Estuary Entrance Management Support System
EnSym Environment Systems Modelling
EPA Environment Protection Authority
EPBC Environment Protection and Biodiversity Conservation Act
EVC Ecological Vegetation Class
EW EstuaryWatch
EWH Environmental Water Holder
FTE Full-time equivalent
FMCF Financial Management Compliance Framework
ha Hectare
IBAC Independent Broad-based Anti-corruption Committee
ISC Index of Stream Condition
IWC Index of Wetland Condition
km Kilometre
LAS Local Authorities Super
MBI Market-based instrument
ME&R Monitoring, Evaluation and Reporting
MP Member of Parliament
NLP National Landcare Programme
No. Number
NRIP Natural Resource Investment Program
NRM Natural Resource Management
OBP Orange-bellied Parrot
OH&S Occupational Health and Safety
PV Parks Victoria
RAP Registered Aboriginal Party
RCS Regional Catchment Strategy
RIP Regional Investment Program
RLC Regional Landcare Coordinators
VAGO Victorian Auditor General’s Office
VCMC Victorian Catchment Management Council
VECCI Victorian Employers’ Chamber of Commerce and Industry
VIF Victorian Investment framework
VLN Victorian Landcare Network
VROT Victorian Rare or Threatened species
VSB Victorian Super Board
VVP Victorian Volcanic Plain
Borrell-a-Kandelop Protection, enhancement and restoration of waterways and wetlands in the Western District Lakes (listed under the Ramsar Convention on Wetlands)
Ramsar Iranian town, location of the first convention (1971) where the Wetland Conservation Treaty was signed
ACRONYMS
AND TERMS
64 Dennis Street, Colac, Victoria 3250 T. 03 5232 9100 F. 03 5232 2759
[email protected] www.ccma.vic.gov.au
COPYRIGHT STATEMENT© State of Victoria, Corangamite Catchment Management Authority, 2017. This publication is copyright. No part may be reproduced by any process except in accordance with the provisions of the Copyright Act 1968.
GSDM_13010