Embed Size (px)
Citation preview

SANDIA REPORT SAND89-0710 • UC-92a
,' Unlimited Release r
Printed April 1989
CM/
Core Analysis in a Low Permeability Sandstone Reservoir: Results From the Multiwell Experiment
8232-2//068956 8232-2//068956
00000001 - Allan R. Sattler 00000001 -
Prepared by Sandia National Laboratories Albuquerque, New Mexico 87185 and Livermore, California 94550 for the United States Department of Energy under Contract DE-AC04-760P00789
SF2900Q(8-81)

Issued by Sandia National Laboratories, operated for the United States Department of Energy by Sandia Corporation. NOTICE: This report was prepared as an account of work sponsored by an agency of the United States Government. Neither the United States Govern¬ ment nor any agency thereof, nor any of their employees, nor any of their contractors, subcontractors, or their employees, makes any warranty, express or implied, or assumes any legal liability or responsibility for the accuracy, completeness, or usefulness of any information, apparatus, product or process disclosed, or represents that its use would not infringe privately owned rights. Reference herein to any specific commercial product, process, or service by trade name, trademark, manufacturer, or otherwise, does not necessarily constitute or imply its endorsement, recommendation, or favoring by the United States Government, any agency thereof or any of their contractors or subcontractors. The views and opinions expressed herein do not necessarily state or reflect those of the United States Government, any agency thereof or any of their contractors.
Printed in the United States of America. This report has been reproduced directly from the best available copy.
Available to DOE and DOE contractors from Office of Scientific and Technical Information PO Box 62 Oak Ridge, TN 37831
Prices available from (615) 576-8401, FTS 626-8401
Available to the public from National Technical Information Service US Department of Commerce 5285 Port Royal Rd Springfield, VA 22161
NTIS price codes Printed copy: A04 Microfiche copy: A01

SAND89-0710
Unlimited Release UC-92a
CORE ANALYSIS IN A LOW PERMEABILITY SANDSTONE RESERVOIR: RESULTS FROM THE MULTIWELL EXPERIMENT
by
ALLAN R. SATTLER
Geotechnology Research Division 6253
Sandia National Laboratories Albuquerque, NM 87185
Printed April, 1989
ABSTRACT
Over 4100 ft (1100 ft oriented) of Mesaverde core was taken during the drilling of the three Multiwell Experiment (MWX) wells, for study in a
comprehensive core analysis program. This core traversed five separate depositional environments (shoreline/marine, coastal, paludal, fluvial, and paralic) , and almost every major sand in the Mesaverde at the site was sampled. This paper summarizes MWX core analysis and describes the petrophysical properties at the MWX site; reservoir parameters, including permeabilities of naturally fractured core; and mechanical rock properties including stress-related measurements. Some correlations are made between reservoir properties and mineralogy/petrology data. Comparisons are made
between the properties of lenticular and blanket sandstone morphologies existing at the site. This paper provides an overview of a complete core analysis in a low-permeability sandstone reservoir.
-i-

ACKNOWLEDGMENTS
I thank N. R. Warpinski for many discussions and suggestions, especially about mechanical rock properties. J. C. Lorenz and S. J. Finley are acknowledged for many discussions about depositional environments and natural fracture systems at the MWX site. D. A. Northrop is thanked for many technical discussions about all aspects of MWX and for suggestions of organization and preparation of this paper. I commend M. L. Brugler, S. H. Leeds, F. J. Duplessis, R. Gallop, J. D. Walls, P. L. Randolph, D. J. Soeder, P. J. Hudson, N. R. Morrow, Jill S. (Ward) Buckley, and P. E. Senseny for their key roles in helping to plan and execute the MWX
core analysis, for their interpretations of the data, and for our many detailed discussions about the MWX core data. I thank G. C. Kukal for many discussions about the core analyses and the electrical parameters. The Multiwell Experiment is part of the Western Gas Sands Sub Project managed by K.-H. Frohne at the Morgantown Energy Technology Center under contract number DE-ACC4-76DP00789.
•ii-

INTRODUCTION
The U.S. Department of Energy's Multiwell Experiment (MWX) is a
research-oriented field laboratory. Its objectives are to thoroughly
characterize lenticular tight gas sands occurring in the western United
States and to develop technology for their production. Three closely
spaced, straight, vertical wells, designated MWX 1, MWX 2, and MWX 3, which
are less than 225 ft. apart at depth, were drilled through the Mesaverde
formation in the Piceance basin near Rifle, Colorado. The Mesaverde
formation at the MWX site contains five diverse depositional environments
(Figure I): shoreline/marine, delta plain (lower-paludal and upper-
coastal), fluvial, and paralic (Lorenz, 1983, 1986). Most of the
shoreline/marine sandstones and shales in the Mesaverde are blanket-like in
the area of the Piceance basin around the MWX site. This is in contrast to
the more heterogeneous strata including the lenticular sandstones, those of
the paludal, coastal, and fluvial zones. The paralic formation shows signs
of marine influence. Because of high water saturations, the paralic zone
is thought to contain little produceable gas. Our estimates of the gas in
place at the MWX site are:
Zone BCF/mi2
marine 35
paludal 35
coastal 31
fluvial 55
The objectives of this paper are to summarize and to interpret MWX
core analysis. This paper constitutes an overview of a complete core
analysis in a low-permeability sandstone reservoir. Results from the core
program provided inputs for well test and stimulation activities, for information of the earth stresses, and for data to correlate with log
studies to improve their reliability in tight sands. These results also
provided a thorough characterization of the Mesaverde formation because
core was taken from all depositional environments. The primary efforts of
-1-

GAMMA RAY
PARALIC
FLUVIAL
Figure 1. The Mesaverde Formation at the MWX Site.

the MWX centered in the lenticular sands. Comparisons are made between the
core properties of heterogeneous strata that incorporate lenticular sandstones and those of the more uniform blanket formations occurring at
the bottom of the Mesaverde formation (Figure 1).
Core analysis is discussed in terms of the existing depositional
environments. Sedimentology/depositional environments and mineralogy/
petrology data themselves are not emphasized in this paper. This was
published elsewhere (Lorenz, June 1983, 1987; Bendix 1982 to 1984; and
Pitman and Spencer, 1984; Sandia/CER MWX Final Report Series, I to IV). Further, correlations are frequently made between core reservoir properties
and the mineralogy/petrology data.
Production tests were conducted in MWX 1 in the Corcoran and Cozzette
sands, in paludal zone 2, and the coastal red sand (Figure 1). Production
tests and stimulations were conducted in MWX 1 in paludal zone 3 and 4
(combined), the coastal yellow sand, and the fluvial B, C, and E sands
(Branagan, 1984, 1985, 1987; Warpinski, Dec 1987; Sandia/CER MWX Final
Report Series I to IV). Emphasis was on the particular sands tested, although core measurements were made throughout the entire Mesaverde
column; Data from all depositional environments are presented. The Sand¬
stones chosen as the focus for this paper are the upper Corcoran (MWX 2),
upper Cozzette (MWX 1 and MWX 2), paludal zone 3 (MWX 2), coastal yellow,
fluvial B and E and paralic, MWX 1. Geologic features of these sandstones
are shown in Table I.
CORE PROGRAM
Over 4100 ft of 4-inch-dia core was taken during the drilling of these
three wells (Figure 2). About 1150 ft of the core was oriented. MWX 1 was
cored continuously from 4170 ft above the paralic zone to just below the
top of paludal zone at 6830 ft. Some core was also taken from the Cozzette
sand. Only selected intervals were cored in the other two wells. Among
the three wells, almost every major sand in the Mesaverde formation at the MWX site was cored.
-3-

Table I
Sands Chosen as Focus for Discussions
Sand/Depositional (Well) Environmental (Depth, ft)
Description
Upper Corcoran, Marine/Shoreline
Upper Cozzette, Marine/Shoreline
Paludal zone 3
Coastal yellow
Fluvial B
Fluvial E sand
(2) (8107-8124)
(1 or 2) (7831-7894)
(2) (7118-7140)
(1) (6430-6462)
(1) (5825-5841)
(1) (5532-5565)
Considered a blanket sandstone in the Mesaverde in the region near the MWX
site, but at the MWX site itself, a discontinuous channel sandstone (Lorenz, 1987).
A blanket sandstone near the MWX site, and at the MWX site itself, displays good shallow marine/shoreline characteristics. Upper portion of the sand contains a
bitumen zone (Lorenz, 1987).
A channel sandstone that shows a good sequence of crossbedded and rippled sands, with few mudstones. Estimated to be around 350 ft wide (Lorenz, 1983).
A composite channel sand separated by 3-4 ft of mudstone. Minimum widths of the two channel sands estimated to be 200-300 ft (Lorenz, 1984).
A meander-belt sandstone composed of point bars. Appears to be one of the more uniform of the fluvial sands at the MWX site, but it is really heterogeneous in detail. Estimated minimum meander-belt width around 1000 ft (Lorenz, 1986). Relatively few fractures were seen in this sandstone, but this and the E sand is in a highly fractured portion of the Mesaverde at the MWX site (Finley, Sep. 1986).
A composite sandstone. Upper part is a meander-belt sandstone with a fining upward
trend. Lower part is a meander-belt width is about 1800 ft (Lorenz, 1986). Upper
part is a splay-type deposit a few hundred feet wide. Three fracture sets were seen in this sandstone (Finley, January 1986.).
Paralic sand (1) (4295-4361)
A marine-influenced blanket-like sandstone (Lorenz, 1987). high water saturation at site, is not well studied.
Paralic zone, which has

k/VASATCH
3A'
M^FtC CUA 1 C
MARINE
FLUVIAL
fERDE
COASTAL
PALUDAL
ROLLINS
MANCOS
COZZETTE MANCOS
CORCORAN
MWX-1 MWX-2 MWX-3
•4000
H5000
J-6000
-7000
.8000
^NDS CORE
.,
: :.•..-
.:.;
^
:::•:••::
S:£
i^^
•
•;;:•;;;
iaa
—
||
|
-
T.D.-8350'-
LOG CORE LOG CORE
i i ,
,„.:,.
•
ill
ill •
•
- T.D.-8300'~
1
H
•
T.D.-7565'—
LOG
, i
Figure 2. Coring and Logging Intervals at the MWX Site
-5-

Two earlier papers were written about the MWX core program (Sattler, 1983, 1984). Detailed presentations of the core data by depositional
environment are to be found in the Sandia/CER MWX Final Report Series, I to
IV.
The MWX core program includes the following analyses:
• Routine screening. Routine reservoir parameter core analysis
(porosities, water saturations), along with the data from the open-
hole logs, to determine which regions of the core body require
special study.
• Special reservoir parameter core analyses. These include restored-
pressure-state permeabilities, pressure core, capillary pressures,
caprock analyses, electrical properties, and permeabilities of
naturally fractured core.
• Mechanical rock properties. These include Young's modulus,
compressive strengths, Poisson's ratio, and fracture toughness.
They also includes the correlation of these properties with the - core gamma and sonic logs, and stress related core measurements
such as anelastic strain recovery (ASR) and differential strain
curve analysis (DSCA).
Core plugs were taken for routine core analyses every foot across sand
lenses and a few feet into the rock abutting the sands. Over 1500 core
plugs were taken. About 500 of them were reused for additional special
core analyses. Much of the routine and special core analysis was performed
on plugs. This allowed most of the whole core to be available for studies
of sedimentology and depositional environments, mechanical rock properties, and natural fractures. After examination of the routine core analysis
data, restored state permeability and cation exchange capacity (CEC)
measurements were made every 1 to 3 ft using many of the same plugs. These
two successive stages of core analysis provided much of the necessary
reservoir data across a sand lens.
-6-

Thin-sections were taken subsequently by facing off the ends of these
same core plugs. Preference for thin-section analyses was given to the
plug ends corresponding to the plugs selected for measurements of restored-
state permeabilities. This allowed correlations between sandstone
reservoir properties and mineralogy/petrology data. It is necessary to
make correlations from the same interval because properties can often vary
rapidly in a lenticular sequence.
The more time-consuming and expensive core analyses were conducted at
less frequent intervals. These analyses included determining mechanical
rock properties, capillary pressure, relative permeabilities, specific
permeabilities to brine, formation factors, and resistivity indexes.
Samples for these further studies were chosen after examining routine core
analysis and restored state permeability measurements.
There is interest not only in the sandstone lenses and the reservoir
rock, but also in the rock abutting the sand (usually siltstones, mudstones, and shales). Mechanical rock properties of these abutting
formations (and those of the sandstone reservoir) are inputs for hydraulic
fracture containment analyses. Caprock analyses provide some idea about
the extent of the reservoir and indicate how adequate these abutting
formations are as stratigraphic barriers between sandstone units. CEC
measurements, in addition to being used with the electrical measurements,
in the Archie, Waxman, Smits formalisms (Waxman and Smits, 1968, Waxman and
Thomas, 1974), allow an approximate, rapid estimate of clay between the
sand and the formations abutting the sand. These measurements also give an
indication of how shaly the abutting formations are. Very limited analysis
of mineralogy was done on the rock abutting the sandstones (Dowell
Schlumberger, August 1985).
CORE HANDLING
Special core-processing and storage facilities were constructed near
the MWX site. The core-processing facility was set up in a building at
-7-

Department of Energy's Anvil Points complex across the Colorado River and
about 15 mi by road from the MWX site.
When the core came to the surface, it was removed from the core barrel by project geologists and placed in trays. After a quick preliminary
inspection and removal of samples for special measurements, such as ASR,
the core was covered with plastic to prevent evaporation and then with
thick canvas to protect it from the elements. The core was then
transported to Anvil Points for processing. Field processing of the core
entailed many nonstandard core-processing procedures that included the
following:
• (Construction and) use of a six-detector core gamma assembly. The
core gamma assembly provided for well control during drilling and
for core log depth correlation after logging. The core gamma
assembly also has better spatial resolution than the open-hole
gamma-ray log.
• Marking the positions and magnitude of scribe-line deviation and
locations of connections and other breaks in core.
• Photographing the entire amount of core in color.
• Taking of core plugs.
• Preserving core.
• Making a visual core log followed by construction of a detailed
lithology/sedimentology log from slabbed core.
• Using special no-freeze freight service in the winter to ship
samples selected for measurements of reservoir parameter or
mechanical rock properties.
-8-

MWX used a dedicated core library, constructed at the DOE/Grand
Junction facility, from 1981 through 1986. This facility is about 60 mi
from the MWX site. From mid-1986 to the present, the core facility has
been located at Sandia National Laboratories in Albuquerque, New Mexico.
ROUTINE CORE ANALYSES
Routine core analysis was performed on all the plugs taken (Core
Laboratories Routine Core Analyses Reports, 1981, 1982, 1983). The routine
core analyses included water saturation and porosity (Table II). Porosities of sands were usually in range of 5 to 10 percent and do not
exceed 15 percent. Water saturations averaged around 65 percent at the top
of the Mesaverde and 30 to 35 percent in some of the productive sands.
Table II Routine Core Analysis
Sand <f>W S,,(%) Comments
Corcoran, MWX 2 5.0 -49 <f>, S^ tend to be uniform over sand.
Upper Cozzette, MWX 1,2 (Production zone) 7.3
(Bitumen zone) 3.2
Paludal zone 3, MWX 2 10.5
~36 <f>, S^ uniform vertically and horizontally.
-79 4>, S^ uniform across zone.
-27 <f>, Sy uniform across lens center. ^ lower, S,, higher, at edges of lens.
-38 (f>, S„ uniform across lens center. Coastal yellow, MWX 1 7.0
Fluvial B, MWX 1
Fluvial E, MWX 1
Paralic, MWX 1
(f> lower, S,, higher, at edges of lens.
6.7 -46 4> lower, Qy higher, at edges of lens.
5.0 -60 Sand Fines Upward. <f> high, S,, low at bottom of lens. <j> low, S,, high at top of lens.
5.5 -65 <f>, Sy fairly uniform.
-9-

An accurate determination of water saturation is important because
permeability depends strongly upon water saturation. At realistic confining pressures, permeabilities of dry core and core at realistic water
saturations can differ by two orders of magnitude.
The drilling and coring of the MWX wells was usually done "at or near balanced" conditions which means that the weight of the column of drilling fluid is about the same as formation gas pressure. This balance would
minimize invasion of the core and formation by drilling fluid. Oil-based drilling fluid was used in the drilling of MWX 1 and MWX 2, in part to further prevent invasion of core and formation by water-based drilling fluids. These steps would result in more accurate water saturation values. (However after subsequent determination of reservoir pressures it appeared that the mud weights were a few hundred psi lower than the measured
reservoir pressure.)
Water-based drilling fluid was used in MWX 3 so that a more thorough
suite of electric logs could be run. An ammonium nitrate tag was used in the drilling of MWX 3 to try to differentiate the water saturations from
invasion fluids. Differences in nitrate concentrations reported by the mud
logger and Core Laboratories, plus the rapid variation of properties in these sandstone lenses over short distances, made a determination of correction factors impossible (Core Labs Report, P83012, 1984). Each
saturation value of the MWX 3 plugs (Core Labs Routine Analysis Report, 1983) may be 5 percent to 15 percent (of porosity) high because of invasion in MWX 3.
Water saturation values were determined by the Dean Stark method in the
core from MWX 1 and MWX 2 and by the summation of fluids method in the core from MWX 3. We chose the latter method because MWX pressure core data suggested that the Dean Stark method may not be the most efficient way of extracting water from tight sandstone core (see the Pressure Core section, Sattler, 1984).
-10-

Boyle's law porosity measurements were made on the core plugs with
helium because equilibration of the helium pressure in these tight sands
would occur faster with a core plug than with whole core. During
determination of the porosity, additional equilibration time was allowed.
The porosity of MWX core seems to change very little with confining
pressure (Table III) (Core Labs SCAL Reports, March 82, February 83, June
24, 83). This is unlike the dependence of permeability on confining
pressure (see Special Core Analysis).
Table III Porosity (%) as a Function of Confining Pressure
Overburden Pressure (psi)
Depth (ft) 200 1000 2000 3000 200
8117 7.2
Corcoran, MWX 2
7.0 7.0
Cozzette, MWX 2
6.8
7885 7864
8.2 7.2
8.0 7.0
8.0 7.0
7.9 6.8
Paludal, MWX 2
7366 7121
11.1 4.1
11.0 4.0
11.0 3.9
11.0 3.8
11.0 4.0
Coastal, MWX 1
6550 6537
6.8 8.2
6.7 8.0
6.7 8.0
6.7 7.9
Fluvial, MWX 1
5730 5133
6.1 9.1
6.0 9.0
5.9 8.9
5.9 8.9
6.1 9.0
-11-

SPECIAL CORE ANALYSES
Measurements of Dry Restored Pressure State Permeabilities
Dry Klinkenberg permeability measurements were performed to obtain information of the variation of permeability over a sand lens (Core Labs SCAL Reports, February 1982 to August 1987; Institute of Gas Technology (IGT) Dry Core Reports, July, August, October 1982, June 1984; Wei, 1986).
It has been well known for some time that the permeability of these tight sands depends on confining pressure (Jones and Owen, 1980). Apparently temperature has very little effect on permeability (Wei, 1986).
Dry Klinkenberg permeability range from microdarcies to tens of microdarcies. The average values for the sands studied are summarized in Table IV. Also included in Table IV are measured pore-pressure values and
estimated net confining pressures. Vertical permeabilities appear to be
about the same as horizontal permeabilities (Core Labs SCAL Reports, February 1982 to August 1987; Wei, 1986).
In the Corcoran sand, the effects of carbonaceous stringers and/or narrow fractures is apparent in Table IV as shown by the higher average dry
permeability over that of the matrix rock.
In the lower part of the fluvial zone, there are some narrow, "permeability streaks," where the permeabilities are much larger than in the surrounding sandstone. In some cases these streaks may be continuous between wells. Figure 3 shows one such streak in the B sand. The
corresponding thin-section data show a tendency toward low clay content and
larger maximum grain sizes (Bendix, October 1982, May 1983, July 1984).
Also, there is a greater spread in the proportions of illite and mixed
layered clays in the fluvial zone than in the other lenticular zones (New
Mexico Petroleum Research Recovery Center (PRRC) 1987). Perhaps these
contrasts in amounts of layered clays translate into permeability
contrasts.
-12-

Table IV
Estimated Dry and Saturated Klinkenberg Permeability Values and Related Reservoir Characteristics
Sand k(dry) k(S,,) (microdarcies)
P(pore) P(conf) - P(pore) (psi) (psi)
Comments on k(dry)
Corcoran, MWX 2
^
Cozzette MWX 1, 2
(Production Zone)
Paludal Zone 3, MWX 2
-4
-10
-0.4
-0.4
6700
6300
5400
1000-1500 Uniform W/0 Effects of Carb Stringers and Natural Fractures.
Value Includes Effects of Carb
Stringers and Natural Fractures.
1000-1500 Uniform Vertically and
Horizontally.
-1300 -20 Microdarcies at Center of Lens. -1-2 Microdarcies at Edge. Generally, Highest of Zones Tested.
Coastal Yellow, MWX 1 -4 -0.6
Fluvial B ~5 -0.2
4400
3450
-2000
-2000
Tends to be Uniform Except Near Edge of Lens and Near Shale Stringers.
Permeability Streaks Present in Lens. k Values >30 microdarcies.
Fluvial E < 2 -0.1 3200 -2000 Permeability Streaks Present. K Values >10 microdarcies.

C SAND MWX-1
w
•s50 w
> U
!5
?40 hr 0
jl ^30 t
5
l520 s oc LU
''•lO
1
^
- .^ T / / /
- ./• /
/ ^
i^, | 1
^ 1'! | 1
• ' •^ * ^
»\ 1 ^ A I '' I
. 1
• I 1
• 1 ^
^—•.- nS9
•• • • A
,• •,
5710 5720 5730 5740 DEPTH (ft)
Figure 3. Permeability Streak in Fluvial Zone
-14-

These horizontal permeability streaks would create conduits to a
vertical fracture system occurring at the MWX site. The permeability
streaks might recharge the natural fracture system during gas production
(Figure 4). There appear to be permeability streaks in both the B and E
sands.
The permeabilities of the few measured paralic sandstone samples are in
the range 70 to 80 microdarcies and these are among the highest values
found in the Mesaverde at the MWX site (Core Labs SCAL Report, June 1984).
At the top of the Mesaverde (high fluvial/paralic zones), thin-section data
indicate relatively coarse-grained sands and well-connected porosity. In
one paralic sample where permeability measurements were made (4331.2 ft) the description even suggests primary porosity (Bendix, April, July 1983).
Figure 5 shows the dry Klinkenberg permeabilities as a function of
confining pressure for each of two paludal and fluvial samples. The
permeability of the fluvial sample decreases about tenfold over a pressure
range of 1000 to 7000 psi, whereas the permeability of the paludal samples
decreases only twofold over the range. The permeabilities of samples from
the paralic and fluvial zones, the coastal zone, the Cozzette, and the
paludal zone generally seem decreasingly dependent on pressure, in that
respective order (using kiooo Psi/^:•300o psi) . Their pressure dependence on
permeability appears to vary with grain size and the amount of dolomitic
cement (Bendix, July 1982, August, December 1982, January, April, May
1983). Large grain sizes and/or relatively small to no amounts of
dolomitic cement may imply a larger pressure dependence on permeability.
However, there is a large scatter and overlap in these mineralogic
parameters from one depositional environment to the next. There may not be
any simple correlation of mineral properties. Other authors have discussed
this problem (Kilmer, 1987; New Mexico Tech, 1987; IGT, June 1984; Soeder
and Randolf, 1987).
-15-

Figure 4. Schematic of Proposed Interaction Between Permeability Streaks and Extension Fractures
PERMEABILITY STREAKS
IN MATRIX

PE
RM
EA
BIL
ITY
AT
20
0 P
SIA
PO
RE
PR
ES
SU
RE
(M
ICR
OD
AR
CIE
S)
o
•M
•M
h)
(n
bi
•TI -l
o
• o
?9
!
!
^ $
^ ^
x x
x x
11
11
M
M
M
N
)
•o
•o
•n
-n
> >
r-
r
r-
r-
c c
c S
^
^ o
o
>
> >
> r~
r
cn
en
oo
s
i •f
r u
o
>
^ M
S
b
<o
3
3

Measurements of the Effects of Water Saturation on Permeability
Effects of water saturation can reduce dry-core permeabilities an
order of magnitude or more (Figure 6) (IGT Relative Permeability Reports,
October, November, 1982, 1985; Core Labs. SCAL Reports, March 15, 1984,
June 1986; Wei, 1986; Walls, April, November 1982). For example, water
saturations at 15 percent, 30 percent, 40 percent, and 50 percent reduced
the permeabilities of a fluvial core sample by multipliers of 0.53, 0.24,
0.11, and 0.02, respectively, at a confining pressure of 3000 psi.
The relative permeabilities at realistic water saturations range from
about a tenth of a microdarcy to a few microdarcies. Table IV summarizes
the estimated permeabilities resulting from saturation of the core. The
estimates were made by decreasing the abundant dry-permeability values by
the same ratio as that of the water saturated to dry-permeability values taken from the few relative permeability measurements made in each zone.
Generally, the less permeable the core, the more dependent the
permeability is on water saturation. Also, at higher saturations the
permeabilities seem more dependent on confining pressures (Walls, April 1982). The very strong dependence of restored-pressure-state permeability on water saturation (Figure 6) demonstrates the need for accurate measurements of water saturation.
Permeability measurements on preserved core samples may give
considerably lower values than those from oven-dried core. Brine and
relative permeability measurements have been made on preserved core from
the coastal and fluvial zones to determine the differences between oven-
dried and preserved tight sandstone core (New Mexico PRRC, 1987). There
were several highlights of this work:
• The water saturations of four preserved core specimens were
81.5 percent (at 4916 ft, MWX 1), 70.9 percent (at 4923 ft, MWX 3), 40.2 percent (at 4900 ft, MWX 3), and 22.1 percent (at
-18-

w a 100 o oc < Q 0 IX 0 5 10 J5
UJ QC D 05 0) LU
.
OC 1 0- UJ Q: 0 Q. < 3 .1 0. ——
0 0 CM
1- <
> .01 h° 15 ffl < UJ S
£ .001 S 0 1000 2000 3000 4000 5000 NET STRESS (PSI)
•w '•
Figure 6. Permeability as a Function of Net Stress for Given Values of Water Saturation
-19-
— 1 l 1 —
: MWX-2 FLUVIAL (5842.0 FT) E
—
—— '
V--1-1
•^ ~
•^SN^^ ——— ^ ^^^^^^^. ———
: )<s^ '''•-^^^^^ ::
: ^-^ •'^^7^'^ o: S. ^v ^•L. -
A^. ^^ — »
» \ ^ "^ 15 \ ^ '^. \ ^ •'-x 30 —————ki ^L ^^ ^ ^W •^y ———^——
- ^ >^ ' ~
\— • ^f, —
<^ : 4 ^ ^^ :
\ \ ^0 40- - » '
- \ -
\ \ \ ^
~
= \ \ --
: \ -50 t :
* TSi
\ ^ -
-
^ °. -
z \ ^ z \ CO :
1 60 co -
: S ~-
^
^ ^

5968 ft MWX 3). Some water loss is assumed from the last sample
and some water loss may be indicated from the next-to-last sample.
MWX 1 and MWX 2 samples were sealed with seal peel, and the samples
from MWX 3 were preserved with Core Seal from Core Laboratories.
Preserved samples from the three wells had been stored for 5 yrs
and, based on earlier routine analyses, they still seemed to retain
their moisture.
• At low (500 psi) confining pressures the brine permeability of the
preserved-co're is only about one half that of the resaturated oven-
dried core (Figure 7).
• At confining pressures characteristic of the coastal and fluvial zones (2000 psi), the permeabilities of the preserved core are
about 25 to 30 percent less than the permeability of the
resaturated core. At higher confining pressures this difference
lessens.
• Gas permeabilities of the preserved core were usually less than the
permeability of the resaturated dried core at all water
saturations. As water saturations becomes less, the differences
become less (Figure 8).
Pressure Core Measurements
A pressure core operation was performed in the E and F fluvial sands,
at 5485 to 5500 and 5551 to 5581 ft, during the drilling of MWX 2 (Sattler, 1984). The goals of this operation were (1) to obtain accurate water
saturation data, (2) to measure the amount and composition of gas on a
foot-by-foot basis, and (3) to recover fluids for water-chemistry analyses. This was felt to be a novel approach for accurate water saturation measurements in tight sandstone core.
Several changes in usual pressure coring procedures were adopted,
including the development of an organic, noninvasive coring fluid to help
-20-

1.0
0.9
0.8
S>°-7
lo.6 < ^ n 5 o QC
Oo.4 2
^ o-3
0.2
0.1
n
-• iii i i i | i i i
MWX-3 COASTAL 0 PRESERVED
• OVEN-DRIED —
-
T -
\ - \ -
^ - \\ \\ -
\^ - \\
\\ <^
^-^ - '^^-^rr^-^ -
1.1.1.. 0 2000 4000 6000 CONFINING PRESSURE (PSI)
Figure 7. Comparison of Brine Permeabilities of Preserved Core and Resaturated Oven Dried Core.
-21-

100
10
0.1
0.01
1 1 1 1111 PRESERVED
CORE
F MWX-3 COASTAL : (6546-6547 ft)
;
-
$ : A
: A ^
^ -\
9
r ft A T
:
: ® A A
.
:
: •
D
'• 0 • ~-
D
i i
^5 1 9
.. :
A V
A A
•
• 0
i
0
v
A
0
a
i i i i i 11 [
DRIED -
CORE ^W X 0% V 15% ~L
A 30% :
• 45% : • 60%
.
" X v X
'», A A A
A
• :
o*
100 1000 10000 CONFINING PRESSURE (PSI)
Figure 8. Comparison of Relative Gas Permeabilities of Preserved Core Resaturated and Oven Dried Core.
-22-

preserve the water saturation. The pressure core barrel was modified so
that gas, not trapped during the freezing process, would not be lost. During the operation, three 15-ft-long pressure core barrels were taken;
they were filled with reservoir rock.
Water saturation data were obtained on the pressure core first by Dean
Sark distillation and later by vacuum oven-drying. The Dean Stark
distillation lasted 8 days, and the vacuum oven-drying (at 240°F) lasted
three more weeks. Not only was there core weight loss from the Dean Stark
distillation but additional weight loss occurred from the vacuum oven-
drying. Analyses of the data (Sattler, 1984) suggests the added weight
loss is due mainly to removal of additional connate water from tight core. The additional weight loss (Figure 9) was not considered to be due to water
from invasion of core, to clay-bound water, or to water from decomposition
of some of the organic matter in the rock during the vacuum oven-drying. The analysis suggests that water extraction should be carried on for a long
time, and that the Dean Stark procedure may not be the most efficient way
to extract water from tight sandstone core.
No water was recovered during the thawing of the pressure core prior to
the Dean Stark analyses, probably because permeabilities of the samples
were too low. Gas was recovered during the thawing process and the gas was
analyzed on a foot-by-foot basis (Sattler, 1984).
The failure of one pressure core barrel, coring from 5551 to 5566 ft, to hold pressure during retrieval of the core was a bonus, because it allowed identical analyses to be made on both pressurized and unpressurized
core from the same sandstone lens. These analyses showed no water
saturation differences on rock with the same porosities. Under the
conditions described here pressure core and the more routine water
extraction methods can give the same results if the extraction methods are
carried on long enough. The newer noninvasive techniques (Wellington and
Vinegar 1987, Abrams and Vinegar 1987) hold promise for unambiguous water
saturation determination.
-23-

GAMMA RAY
API UNITS
PERMEABILITY
MILLIDARCIES
1.0 0.1 0.01
WATER SATURATION
POROSITY TOTAL ——— HELIUM DEAN STARK •
PERCENT PERCENT 10 0 0 20 40 60 80100
Figure 9. Presentation of Pressure Core Data

Capillary Pressure Measurements
High capillary pressures values were obtained from MWX core samples
(Core Labs., SCAL Reports, February 1983, March 15, 1984, May, June 1986;
IGT Dry Core Reports, October 1982, 1984; Ward, 1987) because the rock is
tight and permeabilities are low. The meaning of an "average or effective"
capillary pressure in some of the lower permeability core is uncertain
because the (brine) capillary pressure measurements could be performed only
on the most "open" core in the zones tested. The pore capillary pressures
are useful in considering invasion from drilling and formation damage
during completions.
In most cases, the measured capillary pressures at realistic water
saturations (Table V), range in the hundreds of psi. Thus, these sands are
Table V
Capillary Pressures to Brine at Estimated Water Saturations
Depth (ft) PC (Psi)
7883 7873
7138 7128
6426 6433
5829 5837
Cozzette, MWX 2
-36 -36
Paludal 3, MWX 2
-27 -27
Coastal yellow, MWX 1
-38 -38
Fluvial B, MWX 1
-46 -46
-25-
-800 -800
>l000 >1000
>1300 >1300
-200 -900

prone to invasion by drilling fluids and to inhibition from stimulation
with water-based fluids. However, these pore capillary forces may actually
assist in gas production from natural fractures (see section on Geologic
Features Enhancing Permeability).
When mercury-injection capillary pressure curves are superimposed on
the air-brine capillary pressure curves at the high-wetting-phase
saturations (Figure 10), the air-brine curves are lower even with the use
of the theoretical scaling factor of 5:1. At the lower saturations, the
mercury-injection data suggest lower pressures. Different threshold entry
pressures appear to result from the two methods. A careful examination of
Purcell's data for his lower-permeability sample shows the same difference
at high-wetting-phase saturations (Purcell, 1949; Walls and Amafule, 1985).
The different measurements were usually performed within a couple of feet of each other.
In the region of low-wetting-phase saturations, recent work (Walls and
Amafule, 1985; New Mexico PRRC, April 1988) shows fairly good agreement
between the two techniques. This may have to do with a slower injection
rate (Wardlow and Tayior, 1976). Even in this recent work (Walls and
Amafule, 1985), the mercury curves tend to become lower as the saturation becomes low. Differences between these measurement techniques are to be
expected because of complex interactions of adsorption, permeabilities, and
capillary forces with brine in these narrow, clay-lined pores.
These low-permeability MWX sandstones are hydroscopic. Totally dry MWX
core placed in a chamber at 90 percent humidity will attain saturation values around 25 percent (Ward and Morrow, 1987). Capillary pressures have
been extended in tight sands lower water saturation values by generating
desorption isotherms.
Recent attempts have been made to measure low-permeability sandstone
capillary pressures at confining stress (IGT, 1987). These attempts were
made in a pressurized core holder with a capillary barrier (porous plate)
-26-

0 10 20 30 40 50 60 70 80 90 100 WETTING SATURATION, PERCENT PORE SPACE
Figure 10. Air Brine, Mercury Injection, and Confined Porous Plate Capillary Pressure Data

of formation caprock. A comparison of the data from the confined sample
with that from air-brine, centrifuge method (Figure 10) shows the same, to
slightly higher, capillary pressures for the confined sample at the higher
brine saturations. This is expected since permeabilities decrease with
increased confining pressure. Measurements involving water flow from this
low-porosity, low-permeability rock are very difficult. Further, the water
distributions at a given saturation in the core could differ for the two
techniques and from the distribution existing in situ.
Caprock Analysis
Caprock analysis was made on samples of rock abutting the sandstone
(IGT Caprock Reports, June, September 1982, 1984; Core Labs SCAL Report, March 27, 1984). The measurements included permeability to brine and the
minimum gas-threshold pressure necessary to displace water. A combination
of very low permeability plus a large threshold displacement pressure
implies good caprock/stratigraphic barriers. Permeabilities of these
materials are generally in the subnanodarcy range with threshold pressures
of at least 1000 psi.
Core samples from MWX 1 were chosen at what was thought to be the
boundaries of the reservoir. Core samples from MWX 2 and MWX 3 were chosen
with the aid of the core gamma assembly. The samples chosen had some of
the highest gamma-ray log traces seen in the abutting material and may be
among the more "shaly" material between the sand lenses.
Almost all the samples tested turned out to be good caprock, at least within the limits of the test. However, the caprock testers used could
only go to 1000 psi for threshold pressures, well below measured sandstone
pore pressures. These measurements can therefore serve only as a
qualitative indicator of caprock quality.
-28-

Electrical Measurements
CEC measurements were made on many core samples (Table VI) (Core Labs
SCAL Reports, February 1982 to June 1983, March 27, 1984, May 1984).
Values range from less than 1 meq/100 gm for marine/shoreline sands to
around 5 meq/100 gm for some coastal/fluvial zone sandstones. These values
are >10 meq/100 gm for some of the materials abutting the sandstone lenses.
When the boundaries of the sandstone lenses are reached the CEC values rise
(usually markedly) because of increase in clay content. Also, when
normalized, the CEC values often overlie the core gamma-ray curve for some
sandstone lenses. Most CEC measurements were performed by the adsorbed-
water method. Some measurements were made by using the more expensive wet-
chemistry method. Results from both methods were within 30 percent (Core
Labs SCAL Report, June 1983).
Formation factor and resistivity index measurements were made on
selected core samples Table VII (Core Labs SCAL Reports, July 1982, August
1984, May 1986, November 1987). The values of the cementation exponents m
and m*, derived from a display of formation factor vs porosity, do not seem
to vary greatly with depositional environment. These cementation
exponents, m and m*, differ from each other by about 10 percent. The value
of m is around 1.8 and m* is around 2. There is a greater variation in the
values of the saturation exponents, n (1.08 to 1.85) and n* (1.47 to 2.55)
which were derived from a display of resistivity index vs water saturation. These "starred" shaly sand values (Waxman and Smits, 1968, Waxman and
Thomas, 1974) were obtained from the appropriate core CEC values. Water
was removed from core plugs used in the determination of the resistivity indexes and associated saturation exponent by using a centrifuge. As
mentioned, measurements of the removal of small amounts of water from this
low-permeability core are very difficult. Also the distribution of the
brine remaining in the plug may not be that distribution that characterizes
in situ conditions. This may result in different measured values for the
electrical characteristics. It is difficult to judge the reliability of the saturation exponent values.
-29-

Table VI
CEC Values for MWX Sands (meq/100 g)
Sand Average
Value for Sand
Typical Value for Material Abutting Sand
Comments
Corcoran, MWX 2 1.1 CECs Low and Moderately Uniform Through Center of Sand.
Cozzette, MWX 1, MWX 2
(Production Zone) 0.5
(Bitumen Zone) 1.5
Paludal Zone 3, MWX 2 1.7
Coastal Yellow, MWX 1 2.7
Fluvial B, MWX 1 2.1
Fluvial E, MWX 2 2.2
Paralic 0.9
17
12
10
12
CECs Low and Uniform Vertically and Horizontally.
CECs Uniform Across Zone.
CECs Relatively Low for Lenticular Sand.
CECs Among Highest of Sandstone Studied and Are Not Uniform Across Sand.
CECs Relatively High and Not Uniform Across Sand.
CECs Relatively High and Not Uniform Across Sand.
CECs Lower Than Lenticular Zones Comparable to Those of Marine Blanket Sands.
Table VII
Cementation and Saturation Exponents From Formation Resistivity Factor and Resistivity Index Determinations
Effective Overburden Cementation Exponent Saturation Exponent
Pressure, psi m M* n n*
MWX
Paludal Zone
MWX
Coastal Zone
MWX
Fluvial Zone
2
1
1
0
200 3600
0
200 3000
0
200 3000
1. 1. 1.
1. 1. 1.
1. 1. 1.
82 92 95
74 79 88
72 79 89
2
2
2
1
1
2
1
2
2
.03
.12
.17
.96
.98
.09
.92
.00
.08
1.08
1.85
1.37
1.47
2.55
1.83
Additional formation factors have been measured at pressures from 1000
to 5000 psi (New Mexico PRRC, 1987). Estimated cementation exponents, m,
from formation factors around 3000 psi are, very roughly, 20 percent higher
than the values in Table VII. The values of m and n in Table VII are
comparable with other measurements made in tight sands (Rosepiler, 1981).
Geologic Features Enhancing Permeability: Filled Natural Fractures and Carbonaceous Stringers
Natural fractures appear to dominate unstimulated production, since the
formation permeabilities exceed matrix permeabilities by a least an order
of magnitude in the two blanket and eight lenticular sands tested
(Figure 11) (Branagan, 1984, 1985, 1987; Sandia/CER Final MWX Final Report
Series I to IV). Permeability measurements were made in naturally fractured core to help explain this discrepancy.
Dry permeabilities of core plugs containing filled, narrow, natural
fractures were measured and compared with permeabilities derived from
-31-

5400
5800 [FLUVIAL B
6200
£ 6600
COASTAL YELLOW
COASTAL RED
• LAB TESTS "
(CORRECTED FOR STRESS AND WATER
_
SATURATION) • WELL TESTS
h- & 7000 Q PALUDAL 3&4
PALUDAL 2
7400
7800 (ANISOTROPIC)
UPPER COZZETTE LOWER COZZETTE
CORCORAN 8200
lO-WlO^O'lO'lO'lO5 ZONE PERMEABILITY(MICRODARCYS)
Figure 11. Formation Permeability From Production Testing vs Permeability From Core
-32-

adjacent matrix rock (Core Labs SCAL Reports, August 1984, December 1985,
and June 1986; Lorenz, 1986). On the average, the dry permeabilities of
the fractured-core plugs along the fractures were significantly higher than
those from the unfractured plugs, sometimes by over an order of magnitude
(Figure 12) (Lorenz, 1986). Even core plugs with narrow calcite-filled fractures provide, on the average, some permeability enhancement.
Measurements were also made perpendicular to the filled fractures (Core
Labs SCAL Report, March 15, 1984; New Mexico Tech, 1985, 1986, 1987).
There usually appears to be some permeability enhancement, although the
greatest enhancement was found along the fractures. Moreover, only well-
cemented core plugs survived the coring and machining process; core with
more open fractures often did not.
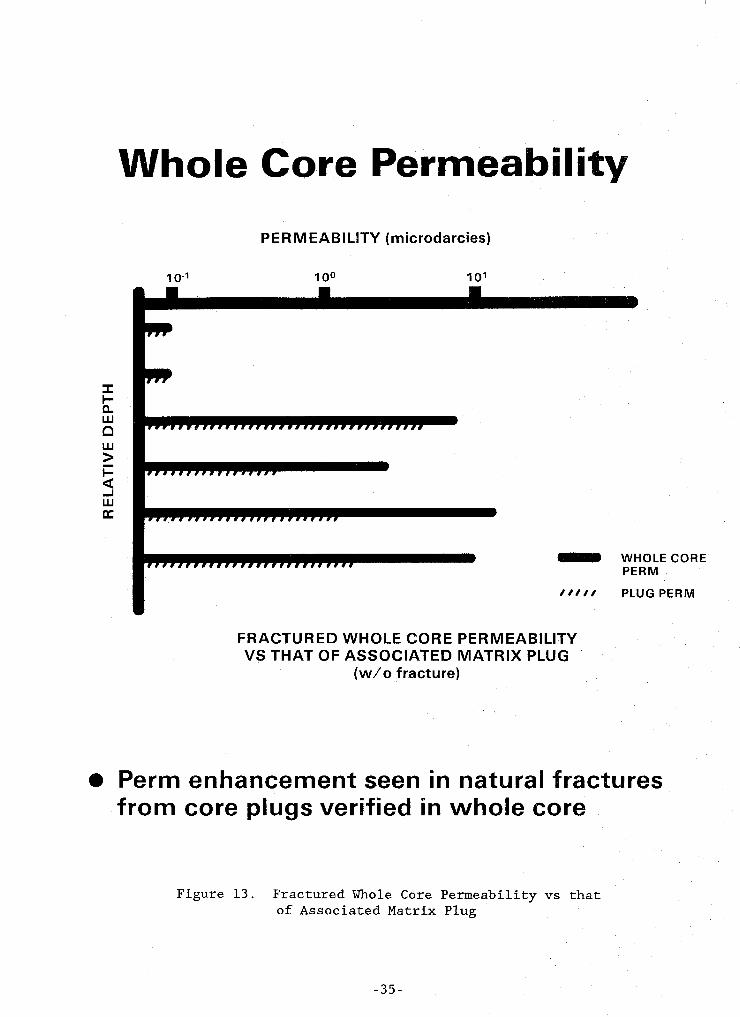
Dry permeabilities of whole core containing natural fractures were
measured and compared with permeabilities derived from adjacent matrix
(Litton, April 1987). There was significant increase in the permeabilities
of fractured core along the fracture direction over the permeabilities of
the matrix plugs in four of the six whole core samples. Both the fractured
core and associated matrix plugs had extremely low permeability in the
other two cases (Figure 13).
Permeabilities of fractured whole core were measured at various water
saturations and compared with matrix permeabilities from adjacent plugs at the same water saturations (Figure 14) (Litton, July 1987; New Mexico Tech,
1987). The measurements, made along the fracture direction, revealed the
following:
• The permeability of the core with natural fractures is much greater
than that from the matrix rock alone at zero percent water
saturation.
• As expected, the permeability of the associated matrix plug is
strongly dependent on water saturation, and decreases rapidly with
an increase of water saturation.
-33-
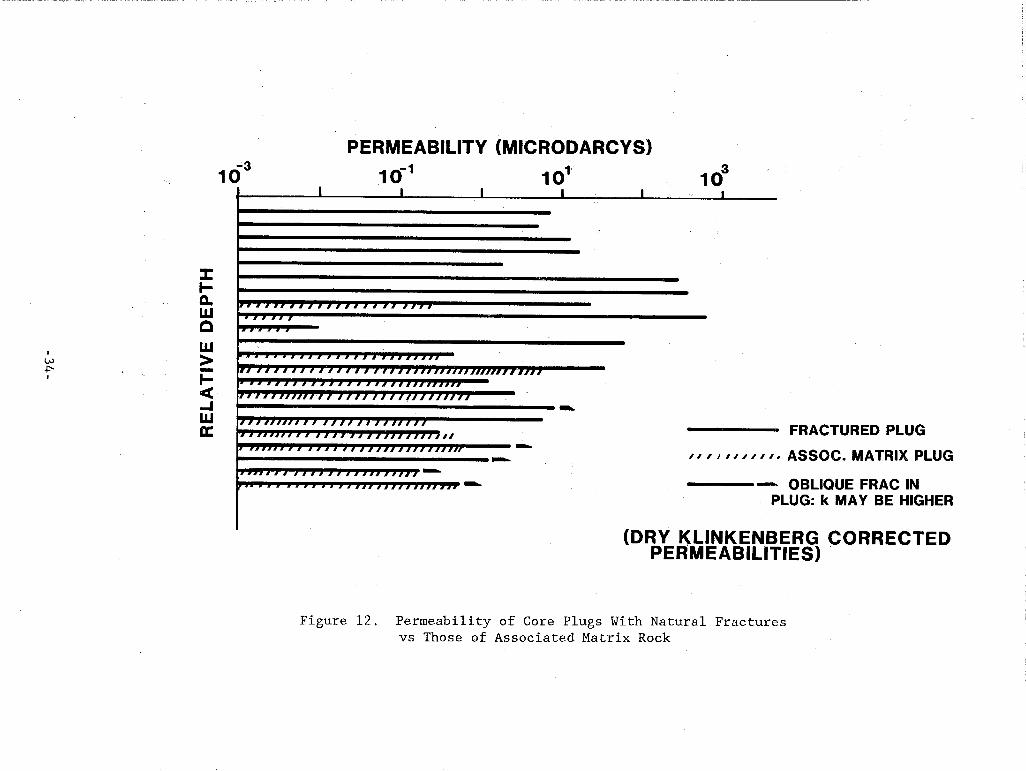
PERMEABILITY (MICRODARCYS)
103 10-1 101 103
_i_____i_____i_____i_____L-
alffffffifftlflltl Hit ^"ryy^y
11 11111111)1111 HUH)) 11 n mi i) in /i ^nn)f}n}nnniffni}it I UHHtfIfffI 1 If fllUlflflI
\fni))))i)))f nn nn}}mffii //////}/>/} nn))))»))» FRACTURED PLUG fium//f iif}//f/}}f/f/})// i iini) i f i n i / / / f ffi )n) ufii) ,/,/,///,,. ASSOC. MATRIX PLUG
inn 11 11 n i > > miDifi Miiiii 11 f i n n m inniiiim OBLIQUE FRAC IN
PLUG: k MAY BE HIGHER
(DRY KLINKENBERG CORRECTED PERMEABILITIES)
Figure 12. Permeability of Core Plugs With Natural Fractures vs Those of Associated Matrix Rock
Whole Core Permeability
PERMEABILITY (microdarcies)
0. Q ^^^W LU >
<
LU cc
FRACTURED WHOLE CORE PERMEABILITY VS THAT OF ASSOCIATED MATRIX PLUG
(w/o fracture)
Perm enhancement seen in natural fractures from core plugs verified in whole core
Figure 13. Fractured Whole Core Permeability vs that of Associated Matrix Plug
-35-

10 20 30 40 WATER SATURATION (%)
MARINE SANDSTONE 8113 ft COASTAL SANDSTONE 6458 ft WHOLE CORE (4 inch diameter) CORE PLUG (1 inch diameter)
CONFINING PRESSURE 6000 psi PORE PRESSURE 4000 psi
Figure 14. Comparison of Fractured Whole Core Permeabilities vs that of the Associated Matrix Rock as a Function of Water Saturation
-36-

• The permeability of the core with fractures has a different dependence on water saturation than that of the matrix alone.
Water saturation does not decrease permeabilities in fractured core
to the degree it decreases the permeabilities of the matrix rock.
(The capillary pressures of the matrix rock are high, and these
forces may tend to keep the narrow natural fractures free of
water.)
Permeabilities of core plugs containing carbonaceous stringers were
also measured to determine if these stringers provide any permeability
enhancement (Core Labs. SCAL Reports May and June 1986, April 1987). There
is no clear-cut pattern in these results but there is some permeability
enhancement from several of the stringers. These carbonaceous stringers
may intersect some of the predominantly vertical fractures in the
formation.
MECHANICAL ROCK PROPERTIES
Tests of Mechanical Rock Properties
Mechanical rock properties have been conducted on a large number of MWX
core samples MWX (RE/SPEC, September, October, November 1983, February,
July 1984, 1985.). The greatest number of these measurements were
conducted in the regions where formation testing and stimulation have taken
place. Measurements were made of Young's modulus, of compressive
strengths, and of Poisson's ratio at confining pressures of zero, 1,450,
2,900, 4,350 and 7,260 psi. For sandstones, Young's modulus ranges from
about 2.17 x 10⁶ to 5.8 x 10⁶ psi, and compressive strength ranges from
2.3 x 10⁴ to 3.8 x 10⁴ psi. For the material abutting the sandstone
(siltstones, mudstones, and shales), Young's modulus ranges from 2.1 x 10⁶
to 6.5 x 10⁶ psi, and compressive strengths range from around 1.3 x 10⁴ to
5.6 x 10⁴ psi at realistic confining pressures. Poisson's ratio varies from about 0.2 to 0.3 for sandstones, siltstones, mudstones, and shales.
Tensile strength and fracture toughness measurements were also made
-37-

(Senseny, 1984). Fracture toughness ranges from 0.6 x 10³ to 2.1 x 10³
psiYin for sandstones and from 0.15 x 10³ to 2.3 x 10³ psi,/in for the
material abutting the sandstones. Tensile strengths range from 0.7 x 10⁴
to 2.3 x 10⁴ psi for sandstones and from 0.4 x 10⁴ to 3.1 x 10⁴ psi for
siltstones, mudstones, and shales. The plugs for the above sample
measurements were cut vertically.
There appear to be differences in some measurements between sandstones
and the abutting material. For sandstones, compressive strengths and
Young's modulus increase linearly with confining pressure. Young's modulus
for abutting rock is generally independent of confining pressures or
decreases slightly with increasing confining pressure. Poisson's ratio for both types of materials shows no trend with changes in confining pressure.
There appears to be an additional difference in the stress-strain curves for the sandstones and the abutting rock. The sandstone stress-
strain curve is nonlinear at both low and high stresses and the volumetric
strain curve shows that the specimen dilates substantially before reaching
its failure strength. In contrast, the stress-strain curve of the abutting
material trends to be linear throughout the test, and the volumetric strain curve shows that the specimen dilates only slightly, if at all, before
failure (Figure 15).
There are also some differences in the fundamental behavior in the
load-crack displacement curves (Figure 16) that were generated in the
fracture toughness tests (RE/SPEC, February 1984; Senseny and Pfeifle, June
1984). For sandstones, the load rises with crack-opening displacement
until after reaching the load that is used to calculate the toughness.
However, for the abutting rock the peak load is reached early in the test, and the load that is used to calculate the toughness is found on the
declining part of the curve. The initial part of the sandstone curve also
tends to be more nonlinear than the initial part of the curves from the
abutting rock. Finally, the curves in Figure 16 show that the slopes of the unload/reload parts of the crack load-vs-crack opening displacement
-38-

(0 Q.
W w 01 oc 1- 0)
10.0 -7.5 -5.0 -2.5 0.0 2.5 5.0 7.5 10.0 STRAIN (x10-3)
10.0 -7.5 -5.0 -2.5 0.0 2.5 5.0 7.5 10.0 STRAIN (x10"3)
Figure 15. Stress-Strain Curves for Typical MWX Sandstone (Top) and Mudstone/Siltstone (Bottom)
-39-

U.*f
0.4
S 0.3 Q < 0
-i 0.2
0.1
n n
II •
MWX-1 SANDSTONE (4300 ft) K(IC)= CRIT. LOAD = 0.23 KN PLAST. FACT. = 0.64
~ / :7 :••
/'••' •'••'' -:/
^ ••
1.40MPa-M**0.5
-
^^': ^^'/ ,' .'
.M^^ •' •T .•; •'
.•' ,' .•' ,-'
UNL/REL CYCLE
1
2
3
4
5
LOAD (KN)
0.06 0.10 0.19 0.23 0.25
PLAST. FACTOR
0.00 0.69 0.67 0.64 0.64
-
—,
0.00 0.08 0.16 0.24 0.32 0.40 CRACK OPENING DISPLACEMENT (COD) - mm
Z ^
Q < 0
1.0
0.8
0.6 \-
0.4 h
0.2
MWX-1 SHALE (5816 ft) K(IC)=1.98 MPa-M**0.5
- CRIT. LOAD=0.5KN PLAST. FACT. = 0.33
V- / /r^- /••.'•' /••' /•'' .•••/~
- /.•:' /w/w i i///;
/ •'•' .•/••• / •'.' •' •'•• .•' •
/• •',','.'. / •'••" ^ :'••'///
i/"^\ , i i
••' .••' ..•'',:;'' ..••'
UNL/REL CYCLE
1
2
3
4
5
LOAD (KN)
0.58 0.59 0.56 0.52 0.48
PLAST. FACTOR
0.00 0.35 0.32 0.33 0.33
-
0.0 0.00 0.06 0.12 0.18 0.24 0.30
CRACK OPENING DISPLACEMENT (COD) - mm
Crack Load-vs-Crack Opening Displacement Curves for Typical MWX Sandstone (Top) and Mudstone/Siltstone (Bottom)
-40-

curve decrease more rapidly for these abutting rocks than for sandstone.
This means that a greater plasticity correction factor must be used for the
sandstone when calculating fracture toughness. The correction factor for
sandstones is about 0.5, whereas for shale it is about 0.35.
These observations of the stress-strain curve and load-crack opening
displacement curves may relate to the ease with which microcracks nucleate
and grow in these materials. The nonlinearity of the sandstone stress-
strain curve and the relatively large plasticity correction factor used to
calculate fracture toughness of sandstone may indicate that microcracks
nucleate and grow more easily in sandstones than in the materials abutting
the sands. This is consistent with ASR measurements (see the section on
Stress-Related Measurements of Rock Properties) which show somewhat more
strain in sandstones than in the abutting materials. However, the effects
of rock fabric itself in these measurements cannot be ruled out.
A limited number of comparisons were made more recently on Young's
modulus values from core samples of the same depth that were cut both
vertically and horizontally (Dowell Schlumberger, August 1985, October
1986). Although there were often some differences in these values of
Young's modulus on a sample-by-sample basis that were probably caused by
bedding structures, the differences showed no systematic trend with respect
to lithology. These measurements and the earlier group of measurements
(RE/SPEC, September, October, November 1983, February, July 1984, 1985)
showed that some siltstones are among the stiffest rocks in the formation.
Sandstones were next in stiffness, and most mudstones and shales were to be
found among the least stiff rock (Table VIII).
Correlation of Mechanical Rock Properties with the Core Gamma and Sonic Logs
There appears to be correlation between some mechanical properties and
lithology in formations of blanket morphology. For example, high moduli
and compressive strength (along with low-gamma-ray and high-velocity log
-41-

signatures) are found in the Cozzette blanket sand. The marine Mancos
tongue (interfingering into the Mesaverde above the Corcoran and Cozzette
sands at the MWX site) is characterized by low moduli and compressive
strengths (along with high-gamma ray and low-velocity log signatures), Table VIII. The mechanical properties in these blanket sands or shales
appear uniform. In the Cozzette sand this uniformity is seen both
vertically and horizontally (RE/SPEC, September, October 1983).
Table VIII
Correlation of Rock Property Data in Blanket and Lenticular Regions of the Mesaverde at the MWX Site
Well/Interval Depth (ft)
Gamma Ray Number
(arbitrary)
Young's Modulus
(psi x 106)
Compressive Strength
(psi x 104)
Inverse Velocity
/iS/ft
Blanket and Blanket Like Sands
MWX 2 Cozzette MWX 2 Corcoran MWX 1 Cozzette MWX 1 Paralic
7955-7956 7882-7883 7849-7850 4300-4301
3.5 4.5 3.0 3.4
5.1 5.8 5.1 5.4
2.9 3.8 2.6 2.3
66 66 68 65
Blanket Like Shales
MWX 2 Marine MWX 2 Marine
MWX 2 Coastal MWX 1 Coastal MWX 1 Coastal MWX 2 Coastal
8100-8101 7821-7822
6520-6521 6517-6518 6451-6452 6440-6441
12.5 2.9 13.0 2.7
Lenticular Sands
4.0 3.3 5.0 4.1 5.5 4.1 4.0 4.6
1.6 1.5
2.7 2.6 2.5 3.1
82 83
72 67 72 69
Siltstones/Mudstones Abutting Lenticular Sands
MWX 1 Coastal MWX 2 Coastal MWX 2 Coastal MWX 2 Coastal MWX 1 Coastal MWX 1 Coastal MWX 2 Coastal
6564-6565 6561-6562 6493-6494 6462-6463 6428-6429 6422-6423 6418-6419
7.5 16.0 11.0 4.0
12.0 5.5 4.5
5.8 2.2 2.5 5.2 2.3 6.5 5.2
4.5 1.3 1.2 3.5 1.5 5.5 3.7
63 82 83 67 84 66 66
-42-
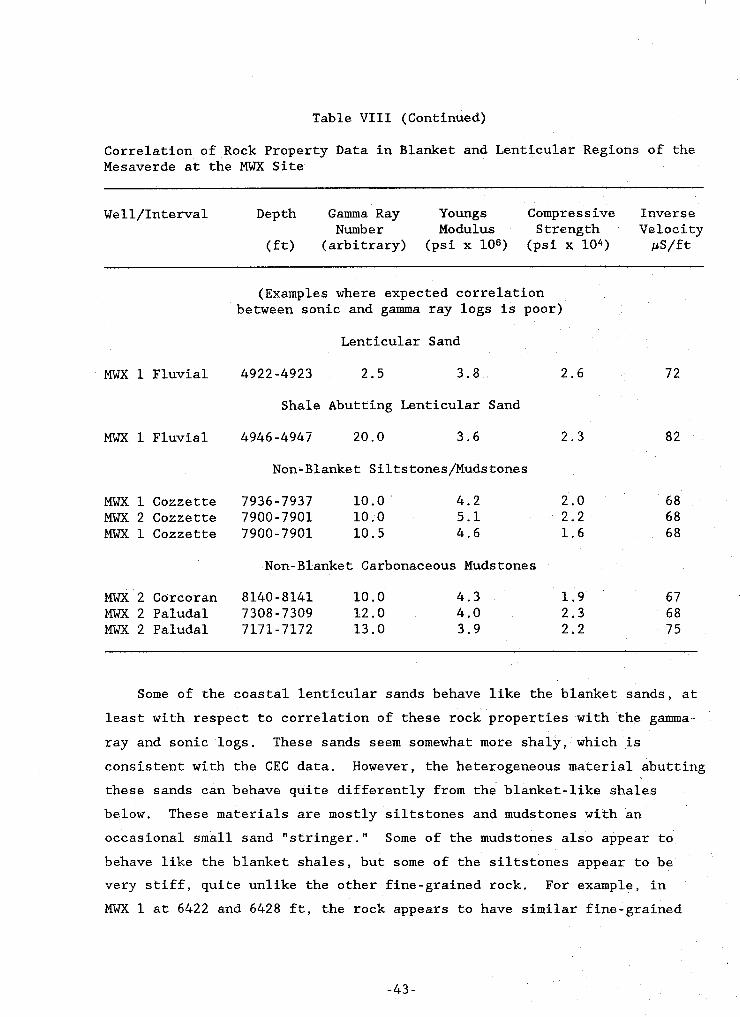
Table VIII (Continued)
Correlation of Rock Property Data in Blanket and Lenticular Regions of the Mesaverde at the MWX Site
Well/Interval Depth Gamma Ray Youngs Compressive Inverse Number Modulus Strength Velocity
(ft) (arbitrary) (psi x IQS) (psi x 10*) ^S/ft
MWX 1 Fluvial
MWX 1 Fluvial
(Examples where expected correlation between sonic and gamma ray logs is poor)
Lenticular Sand
4922-4923 2.5 3.8 2.6
Shale Abutting Lenticular Sand
4946-4947 20.0 3.6 2.3
Non-Blanket Siltstones/Mudstones
72
82
MWX 1 Cozzette MWX 2 Cozzette MWX 1 Cozzette
Non-Blanket
MWX 2 Corcoran MWX 2 Paludal MWX 2 Paludal
7936 7900 7900-7901 10.5
8140 7308 7171
-7937 -7901
-8141 -7309 -7172
10.0 10.0
Carbonaceous
10.0 12.0 13.0
4.2 5.1 4.6
Muds tones
4.3 4.0 3.9
2.0 2.2 1.6
1.9 2.3 2.2
68 68 68
67 68 75
Some of the coastal lenticular sands behave like the blanket sands, at
least with respect to correlation of these rock properties with the gannna-
ray and sonic logs. These sands seem somewhat more shaly, which is
consistent with the CEC data. However, the heterogeneous material abutting
these sands can behave quite differently from the blanket-like shales
below. These materials are mostly siltstones and mudstones with an
occasional small sand "stringer." Some of the mudstones also appear to
behave like the blanket shales, but some of the siltstones appear to be
very stiff, quite unlike the other fine-grained rock. For example, in MWX 1 at 6422 and 6428 ft, the rock appears to have similar fine-grained
-43-

lithology. However, rock property data indicate very stiff rock and
compliant rocks, respectively, only 7 ft apart. Both the gamma-ray and
sonic logs corroborate this: compliant rock--high gamma-ray and low-
velocity signature; stiff rock--low gamma-ray and relatively high-velocity
signature (Table VIII). In these lenticular formations, properties vary
rapidly over very short distances.
Usually, the gamma-ray log and the sonic log will give the same
interpretation of the material type. However, there are instances in these
heterogeneous Mesaverde strata that include the lenticular sandstones where
the gamma-ray and sonic logs suggest different rock properties. The gamma-
ray log suggests soft shales; the sonic log suggests stiffer sands or
siltstones. Some of the high fluvial, paludal, and nonblanket layers below
the upper Cozzette sand are examples (Table VIII).
It was thought that a large number of measurements would be needed to
characterize core from lenticular formations. However, the use of a core
gamma assembly provided an additional tool for sample selection. It usually gave a good indication of whether the material was a "clean" or
"dirty" sand, or a stiff or compliant siltstone or mudstone, before the
sample.was sent for analysis. The sonic log should also be a very useful
tool for sample selection of core in formations such as these.
Stress-Related Measurements of Rock Properties
Data for hydraulic fracture design has been obtained from core by means
of (1) ASR measurements (Warpinski and Teufel, May 1987); (2) DSCA
(Strickland and Ren, 1980, Ren and Rogiers, 1983); and (3) a relatively new
form of measurement called differential waveform analysis (DWVA) (Ren and
Hudson, 1985). Its use on MWX demonstrated the Capabilities of ASR for predicting hydraulic fracture azimuth from these core measurements (Teufel, September 1984; Hart, 1987; Thorne and Morris, 1987). Many improvements to
ASR were developed during its extensive use on MWX (Teufel, 1983; Warpinski
and Teufel, 1987). The capabilities of DSCA and DWVA for predicting
-44-

hydraulic fracture azimuth were also shown on MWX (Dowell Schlumberger,
August 1985, October 1986), because the predicted fracture azimuth from
core and that measured by borehole geophones were fairly consistent (Thorne
and Morris, 1987).
ASR measurements on MWX sandstones show horizontal strain anisotropy
(Teufel, 1983, Warpinski and Teufel, May 1987). Analyses of ASR data to
date on MWX core do not indicate if this degree of horizontal anisotropy is
greater over particular regions of the Mesaverde, although such analyses
are presently under way. The most recent MWX ASR measurements, those made
on some MWX 3 nonmarine MWX mudstones, show horizontal strain isotropy,
with the vertical strains being just slightly larger. The stresses are
nearly isotropic. The same data show that strains in sands usually appear
to be somewhat larger than in mudstones. In the nonmarine zones the
vertical strain appears to be the largest; whereas in the marine blanket
sands a horizontal rather than vertical stress component appears to be the
largest.
Models under development (Blanton, 1983, Warpinski and Teufel, May
1987) allow the determination of stress magnitudes from the ASR results. These models supplement earlier models of the DSCA measurements (Strickland
and Ren, 1980, Ren and Rogiers, 1983). It appears that the stress
estimates modeled from ASR and DSCA data give fair agreement with the
measured minimum principal stress data from in situ stress measurements.
There are little measured data on the maximum principal stress. It is not
known how effective these models are for actual hydraulic fracture design
and containment considerations, especially in lenticular formations.
Permeability measurements were made on oriented paludal, coastal, and
fluvial core at N80°W and N10°E (IGT, September 1984). These directions
are close to the maximum and minimum horizontal stresses, respectively, at the site for these zones (Table IX) (Teufel, 1983; Hart, 1987; Thorne and
Morris, 1987; Warpinski and Teufel, May 1987). The following observations
are made from Table IX.
-45-

Table IX Directional Permeability, MMX-3*
Dry Permeability to Gas (K°o)
Depth (ft) N 80°W
.
N 10°E % Greater Than Vertical (fid) (/Ki) N 80°W Perms (/^d)
Paludal
7131 9.2 11.3 23 7.0
7090 1.40 1.95 39 0.56
Coastal
6514 0.89 1.20 35 0.74
6446 1.77 1.88 6 1.16
Fluvial
5830 2.51 3.75 49 4.93
5737 1.22 2.16 77 1.88
*Permeabilities were measured at the following values of net confining stress: Fluvial cores, 3800 psi; coastal cores, 4000 psi; Paludal cores, 4200 psi.
In all cases, the permeabilities orthogonal to the maximum
principal horizontal stresses (N10°E) are greater than those along
the maximum stress direction (N80°W). These laboratory
permeabilities may be influenced by microcracks from stress relief which in turn are influenced by the in situ stress. The amount of
microcracking might be greatest along the minimum rather than along
the maximum horizontal stress, and thus, the permeability might be
influenced by the residual microcracks.
-46-

® If indeed the permeabilities, as measured, are influenced by
microcracking, then we might expect the vertical permeabilities to
be the smallest because the vertical stresses are the predominant
ones in these zones. The permeabilities are indeed the smallest
for the paludal and coastal sandstone samples, but not for the
fluvial samples. Effects of bedding on permeability may be
important in the vertical direction. Unfortunately it is not known
for sure whether or how much the microcracking is caused by stress
relief from the coring process. This could add some systematic
uncertainty of some tens of percent in estimating the true in situ
permeability.
e The differences in the horizontal permeabilities are greatest for
the fluvial zone, suggesting that the degree of horizontal
anisotropy may be greater there.
Importance of Net Stress in Permeability Measurements
The permeability of one coastal and fluvial zone core plug was measured
as a function of constant net overburden stress (2900 psi). This stress is
simulated by constant laboratory confining pressure minus laboratory pore
pressure for various pore pressure/confining pressure combinations (Walls,
September 1982; Litton, July 1986, April 1987). At the time these
measurements were made, the net overburden stress in the coastal/fluvial
region was estimated to be around 2900 psi. The estimates of net confining
stresses were made from (1) the measured pore pressure, (2) the measured
minimum horizontal stress from in situ stress tests (Warpinski, 1988),
(3) the maximum horizontal stress, which was estimated as about 800 psi
higher than the minimum horizontal stress from open-hole stress measurement
(Teufel, June 1984) and the modeling of ASR data, and (4) an estimate of 1 psi/ft for vertical stresses. Five pore pressures were chosen with the
initial pore pressure 4300 psi chosen to be close to those existing in the
coastal zone. The results are given in Figure 17. For both samples it
-47-

D MWX-1 FLUVIAL (5727 FT) 0 MWX-3 COASTAL (6458 FT)
D
0
D
0
D
D
0 0
D
0
0 1000 2000 3000 4000 5000
PORE PRESSURE (PSI)
Figure 17. Permeability at Constant Net Confining Stress vs Pore Pressure

appears that gas permeability is constant at a pore pressure of 1500 psi
and above. Presumably, the increase in gas permeability at low pore
pressures is due to reduction in Klinkenberg slippage effects. This figure
suggests that permeability in these tight sands depends more on the value
of the net stress rather than on the individual values of pore or confining
pressure. It further verifies some earlier work suggesting this (Walls,
April, November 1982).
SUMMARY AND CONCLUSIONS
A comprehensive analysis of the 4100 ft of core from the low-
permeability sandstone reservoir at the DOE'S Multiwell Experiment site is
virtually complete. This paper contains references to over 100 documents
with most pertaining to some aspect of MWX core analyses.
Reservoir parameters have been determined for the five Mesaverde
depositional environments at the site. Porosities are in the range of 5 to
10 percent. Measured water saturations range from 30 to 65 percent.
Matrix rock permeabilities at realistic water saturations are no greater
than a few microdarcies, often less. Capillary pressures are in the range
of hundreds of psi at realistic water saturations.
The average porosity in the paludal zone is somewhat higher than that
of the sands in the other zones discussed. The porosities of those
sandstones in other depositional environments are within one or two percent
of each other. Measured water saturations are lowest in the paludal zone,
the Cozzette and coastal zone have somewhat higher saturation values with
the Corcoran and fluvial sands having even higher values. Above the
coastal zone, the water saturation increases with decreasing depth and the
paralic sand has the highest average water saturation value of the sands
examined here. The permeability of the paralic sand is relatively high.
In the sands tested, permeabilities are generally higher in the paludal zone and lowest in the fluvial zone. The marine blanket sands and the
coastal sands have about the same permeabilities.
-49-

It appears as if the matrix rock would be susceptible to inhibition from water-based drilling fluids or water-based fracture fluids. Based on
both core and production data, it appears that natural fractures dominate
production but at reservoir conditions, the natural fractures may be
expected to be fairly dry.
Additional conclusions are:
• Differences in the petrophysical properties between the blanket and
lenticular sandstones are often distinct and more pronounced than
differences between the petrophysical properties of the different lenticular depositional environments.
• Fair-to-limited success was achieved in correlating some aspects of
reservoir parameters with mineralogy-petrology data.
• Accurate water saturation data were determined for tight sandstone
under a limited set of conditions.
• Brine and mercury capillary pressures are similar in spite of the
, complexities of the interactions between the narrow pores and the
brine.
• The brine and relative permeabilities of preserved core are less
than those of resaturated core. At realistic confining pressures
this decrease is in range of 25 to 30 percent for brine
permeabilities.
• The permeabilities of a pair of tight sandstone core plugs appear
to depend more on the net stress (confining stress minus pore
pressures) than on the individual values of either the confining
pressures or the pore pressures.
-50-

• The behavior of moduli and of fracture toughness for sands and for
siltstones/mudstones/shales are distinctly different.
• ASR/DSCA data appear to be adequate at least for fracture azimuth
(stress orientation) predictions. It was not possible to assess
the value of modeling ASR/DSCA data for hydraulic fracture design.
-51-

REFERENCES
Abrams, A. and Vinegar, H. J., "Impaired Mechanisms in Vidksburg Tight Gas
Sands," SPE 13883, Proceedings of the SPE/DOE Low Permeability Gas
Reservoirs, Denver, May, 1987.
Bendix Field Engineering (Grand Junction) Reports on Mineralogic and Petrographic Analyses of All of the Major Intervals of the Mesaverde at MWX, July 2, 1982, July 20, 1982, August, October, December 1982, March, April, May, July, August, September, October, December 1982, January, March 11, March 29, May, July, August, September, November, December 1983, January, February, May, July, August 1984.
Blanton, T. L., "The Relation Between Recovery Deformation and In Situ Stress Magnitudes," SPE 11624, Proceedings of the 1@83 SPE/DOE
Symposium on Low Permeability Gas Reservoirs, Denver, Colorado, March 1983.
Branagan, P. T., "Interference Testing of the Naturally Fractured Cozzette Sandstone: A Case Study at the DOE MWX Site," SPB/DOE/GRI 12869, Proceedings of the Unconventional Gas Symposium, Pittsburgh, Pennsylvania, May 1984.
Branagan, P. T.-et al., "Comprehensive Well Testing and Modeling of Pre and Post Well Performance of the MWX Lenticular Tight Gas Sands," SPE/DOE 16387 Proceedings of the 1985 SPE/DOE/Joint Symposium on Low
Permeability Reservoirs, Denver, Colorado, May 1985.
Branagan, P. T. et al., "Case History of Hydraulic Fracture Performance in the Naturally Fractured Paludal Zone: The Transitory Effects of Damage," SPE/DOE 16398, Proceedings of the 1.987 SPE/DOE Joint Symposium
on Low Permeability Reservoirs," Denver, Colorado, May 1987.
Core Laboratories Routine Analyses Reports, RP-2-6714 November 1981, RP-2- 6806 March 1982, 3806-7119 July 1983.
Core Laboratories Special Core Analysis (SCAL) Reports, 203-820007 February 1982, 203-820022 March 1982, 203-82023 July 1982, 203-820044 September 3, 1982, 203-820027 September 14, 1982, 203-820088 January 1983 (CEC
only), 203-820108 February 1983, 203-820075 February 1983, 203-82104 June 20, 1983, 203-830019 June 24, 1983, 203-830070 November 1983, 203- 830024 March 15, 1984, 203-840055 March 27, 1984, 203-840016 May 1984, 203-840026 August 1984, 203-840077 November 1984, 203-850062 December 1985. 203-860019 May 1986, 203-860024 June 1986, 203-86053 September 1986. 203-87005 April 1987, 203-87050 November 1987,
Core Laboratories Report, P83012, January 1984.
Dowell Research Laboratory (Tulsa) Report, "Differential Strain Curve Analysis on MWX 1 Cores," August 1982.
-53-

Dowell Schlumberger Formation Analysis Laboratory (Tulsa) Reports, "Multiwell Experiment Core Analyses of the MWX 1, MWX 2, and MWX 3
Wells," Interim Report, August 1985; "Multiwell Core and Fluid Analyses of MWX 1, MWX 2, and MWX 3 (wells)," supplemental report, February 1986; "Formation Evaluation of MWX-1, MWX-2 and MWX 3 (Fluvial Interval)," October 1986.
Finley, S. J., internal Sandia memos describing the fractures of the fluvial E and B sands, January and September 1986, respectively.
Hart, C. M. et al., "Fracture Diagnostics Results for the First Multiwell Paludal Zone Stimulation," SPE Formation Evaluation, September 1987.
Institute of Gas Technology, Project 65056 Reports, "Sandstone Permeability and Porosity Measurements," July, August, October 1982.
Institute of Gas Technology, Project 65056 Report, "Special Dry Core Analysis of the Mesaverde Formation--U.S. DOE Multiwell Experiment, Garfield County, Colorado," submitted to DOE June 1984.
Institute of Gas Technology, Project 65056 Reports, "Sandstone Permeability and Porosity Measurements: Relative Permeability Data," October, November 1982.
Institute of Gas Technology, Project 61071 Report, "Effects of Water and Stress Upon Permeability to Gas of Paludal and Coastal Sands--U.S. DOE
Multiwell Experiment, Garfield County, Colorado," April 1985.
Institute of Gas Technology Project 65056 Reports, "Caprock Analysis," June, September 1982.
Institute of Gas Technology Project 61071 Report, "Analysis of Strati- graphic Barriers, (Caprock) Between Sands in the Cretaceous Mesaverde Formation--U.S. Doe Multiwell Experiment, Garfield County, Colorado," June 1984.
Institute of Gas Technology, Project 61071 Report, "Directional Core Analysis of the Mesaverde Formation, U.S. DOE Multiwell Experiment, Garfield County, Colorado," September 1984.
Institute of Gas Technology Project 30568-02 Report, "Measurement and Analysis of Two-Phase Flow Through Low Permeability Media, 2_ (Final Report)," March 1987.
Jones, F. 0. and Owen, W. W., "A Laboratory Study in Low Permeability Gas
Sands," J. Petroleum Technology, September 1980.
Kilmer, N. H. et al., "Pressure Sensitivity of Low Permeability Sandstones," Journal of Petroleum Science and Engineering I, 1987.
Litton Core Research (Petrophysical Services/Core Laboratories) Report, "Gas Permeability of Sandstone Samples," Contract No. 04-4594, July 1986.
-54-

Litton Core Research (Petrophysical Services/Core Laboratories) Report, 38B, "Gas Permeability of Fractured Whole Core and Matrix Plugs at Reservoir Pressures," April 1987.
Litton Core Research (Core Laboratories) Report 308-87609, July 1987.
Lorenz, J. C., "Reservoir Sedimentology in Mesaverde Rocks at the Multiwell Experiment Site," SAND83-1078.UC 92, June 1983.
Lorenz, J. C., series of internal Sandia memos describing in detail the geology of the paludal, coastal and fluvial zones at the MWX site, January 1983, 1985, January 1986, respectively.
Lorenz, J. C. et al., "Fracture Characteristics and Reservoir Behavior of Stress Sensitive Fracture Systems in Flat-Lying Lenticular Formations," SPE/DOE/GRI 15224, Proceedings of Unconventional Gas Technology Symposium, Louisville, Kentucky, May 1986.
Lorenz, John C., "Reservoir Sedimentology of Mesaverde Rocks at the Multiwell Experiment Site and East Central Piceance Creek Basin," Sandia Report SAND87-0040.UC-92a, January 1987.
New Mexico Petroleum Research Recovery Center, New Mexico Institute of Mining and Technology, Project 2-75-7339 Reports for the Department of Energy's Morgantown Energy Technology Center, (Annual) 1985, 1986, 1987, 1988 (to be published) (First quarter) April 1988 (to be published).
Pitman, J. K. and Spencer, C. W., "Petrology of Selected Sandstones in the MWX Wells (northwest Colorado) and Its Relationship to Borehole Geophysical Log Analysis and Reservoir Quality," in "Geologic Studies in Support of the U.S. Department of Energy Multiwell Experiment, Garfield County, Colorado," C. W. Keighin and C. W. Spencer, eds., USGS
Open File Report, 84-757, 1984.
Purcell, W. R., "Capillary Pressures--Their Measurement Using Mercury and the Calculation of Permeability Therefrom," Petroleum Transaction, AIME, February 49.
Ren, N. K. and Hudson, P. J., "Predicting the In Situ Stress State Using Differential Wave Velocity Analysis," Proceedings of the 26th US Rock Mechanics Symposium on Rock Mechanics, Rapid City, South Dakota, June 1985.
Ren, N. K. and Roegiers, J. C., "Differential Strain Curve Analyses—A New
Method for Determining the Preexisting In Situ Stress State From Rock Core Measurements," presented at the 5th ISRM Congress, Melbourne, April 1983.
RE/SPEC Data Reports, "Triaxial Compression and Brazillian Test Results for Samples From MWX 1, 2, and 3," RSI 0226 September 1982, RSI 0234 October 1982, RSI 0238 November 1982.
-55-

RE/SPEC Inc. Progress Reports to Sandia National Laboratories, RSI(RCO)- 046/2-84/227, February 1984, RSI(RCO)-046/7-84/214, July, 1984 RSI(RCO)-046/5-85/200, May 1985.
Rosepiler, J. M., "Calculation and Significance of Water Saturation in Low
Porosity Shaly Gas Sands," Proceedings of SPWLA Twenty Second Annual Logging Symposium, June 23-26, 1981.
Sandia/CER Report Series, Written by the Multiwell Project Group at Sandia National Laboratories and CER Corporation, "Multiwell Experiment Final Report," 1. "The Marine Interval of the Mesaverde Formation," SAND87-
0327.UC-92a, April 1987; 2. "The Paludal Interval of the Mesaverde Formation," to be published in 1988; 3, "The Coastal Interval of the Mesaverde Formation," to be published in 1988, 4. "The Fluvial Interval of the Mesaverde Formation," to be published in 1988.
Sattler, A. R., "The Multiwell Experiment Core Program," SPE/DOE 11763, Proceedings of the 1983 SPE/DOE Symposium on Low Permeability Gas
Reservoirs, Denver, Colorado, March 1983.
Sattler, A. R. et al., Pressure Core Measurements in Tight Sandstone Lenses During the Multiwell Experiment, SPE/DOE/GRI 12853, Proceedings of the SPE/DOE/GRI Unconventional Gas Recovery Symposium, Pittsburgh, Pennsylvania, May 1984.
Sattler, A. R., "The Multiwell Experiment Core Program, II," SPE/DOE/GRI 12584, ibid.
Sattler, A. R. et al., "Integration of Laboratory and Field Data for Insight on the Multiwell Experiment Paludal Stimulation," SPE/DOE 13891, Proceedings of the SPE/DOE 1985 Low Permeability Gas Reservoirs, Denver, Colorado, May 1985.
Senseny, P. E. and Pfeifle, T. W., "Fracture Toughness of Sandstones and Shales," Proceedings of the 25th Symposium in Rock Mechanics, Evanston, Illinois, June 1984.
Soeder, D. J. and Randolph, P. L., "Porosity Permeability and Permeability in Tight Mesaverde Sandstone, Piceance Basin, Colorado," SPE Formation Evaluation, June 1987.
Strickland, F. and Ren, N., "Predicting the In Situ Stress for Deep Wells Using the Differential Strain Curve Analyses," SPE 8954, Proceedings of the SPE/DOE Symposium on Unconventional Gas Recovery, Pittsburgh, Pennsylvania, May 1980.
Strickland, F. and Ren, N., "Predicting the In Situ Stress for Deep Wells Using Differential Strain Curve Analysis," presented at the 31st Annual Tech. Meeting of the Pet. Soc. of CIM, Calgary, May 1980.
-56-

Teufel, L. W., "Determination of In Situ Stress From Anelastic Strain Recovery Measurements of Oriented Core," SPE/DOE 11649, Proceedings of 1983 SPE/DOE Joint Symposium on Low Permeability Gas Reservoirs, Denver, Colorado, March 1983.
Teufel, L. W. and Warpinski, N. R., "Determination of In Situ Stress From Anelastic Strain Recovery Measurements of Oriented Core: Comparison to Hydraulic Fracture Stress Measurements," Proceedings of the 25th U.S. Symposium on Rock Mechanics, Northwestern University, Evanston, Illinois, June 1984.
Teufel, L. W., "Determination of Hydraulic Fracture Aximuth by Geophysical, Geologic and Oriented-Core Methods at the Multiwell Experiment site, Rifle, Colorado," SPE 13226, 59th Annual SPE Technical Conference and Exhibition, Houston, Texas, September 1984.
Thorne, B. J. and Morris, H. E., "Advances in Borehole Seismic Fracture Diagnostics," SPE/DOE, 16405, SPE/DOE 16402, Proceedings of the 1987 SPE/DOE Joint Symposium on Low Permeability Reservoirs, Denver, Colorado, May 1987.
Walls, J. D. et al., "Effects of Pressure and Partial Water Saturation on Gas Permeability in Tight Sands," JPT, April 1982.
Walls, J. D., "Measurement of Fluid Salinity Effects on Tight Gas Sands With a Computer Controlled Parameter," SPE 11092, 57th Annual SPE
Technical Conference and Exhibition, New Orleans, September 1982.
Walls, J. D., "Tight Gas Sands-Permeability, Pore Structure and Clay," JPT
November 1982.
Walls, J. D. and Amaefule, J. 0., "Capillary Pressure and Permeability Relationships in Tight Gas Sands," SPE/DOE 13879, Proceedings of the 1985 SPE/DOE Joint Symposium On Low Permeability Reservoirs, May 1985.
Ward (Buckley) J. S. and Morrow, N. R., "Capillary Pressures and Gas
Relative Permeabilities of Low Permeability Sandstone," SPE Formation Evaluation, September 1987.
Wardlow, N. C. and Taylor, R. P., "Mercury Capillary Pressure Curves and Interpretation of Pore Structure and Capillary Behavior in Reservoir Rock," Bull. Can. Pet. Geol., 24, 1976.
Warpinski, N. R. et al., "In Situ Stress Measurements at DOE'S Multiwell Experiment Site, Mesaverde Group, Rifle, Colorado," JPT, March 1985.
Warpinski, N. R., et al., "Fracture and Testing Case Study of Paludal, Tight, Lenticular Gas Sands," SPE Formation Evaluation, Dec. 1977.
Warpinski, N. R. and Teufel, L. W., "In Situ Stresses in Low Permeability, Nonmarine Rocks," Proceedings of the 1987 SPE/DOE Joint Symposium on Low Permeability Reservoirs, Denver, Colorado, SPE/DOE 16402, May 1987.
-57-

Warpinski, N. R., "Determining the Minimum In Situ Stresses from Hydraulic Fracturing Through Perforations," Proceedings of the 2nd International Workshop on Hydraulic Fracture Stress Measurements, Minneapolis, Minnesota, June 1988.
Waxman, M. H. and Smits, L. J. M., "Electrical Conductivities in Oil Bearing Shaly Sands," SPEJ, June 1968, in Petroleum Transactions, AIME, 1968.
Waxman, M. H. and Thomas, E. C., "Electrical Conductivities in Shaly Sands
I. The Relation Between Hydrocarbon Saturation and Resistivity Index:
II. The Temperature Coefficient of Electrical Conductivity," JPT, February 1974, in Petroleum Transactions, AIME, 1974.
Wei, K. K. et al., "Effect of Fluid, Confining Pressure, and Temperature on Absolute Permeabilities of Low Permeability Sandstones," SPE Formation Evaluation, August 1986.
Wellington, S. L. and Vinegar, H. J., "X-Ray Computerized Tomography," JPT, August 1987.
Western Atlas International (Core Laboratories) Report (Addition to Litton Core Laboratories) Report 308-87609, December 1987.
-58-

DISTRIBUTION:
M. J. Singer Deputy Assistant Secretary for Oil,
Gas, Shale, and Special Technologies
US Department of Energy D-121, FE/33 (GTN)
Washington, DC 20545
J. D. Batchelor Office of Oil, Gas, and Shale
Technologies US Department of Energy FE/25 (GTN)
Washington, DC 20545
J. R. White Office of Oil, Gas and Shale
Technologies US Department of Energy D-127 FE/33 (GTN)
Washington, DC 20545
US Department of Energy (9) Morgantown Energy Technology Center Box 880 Collins Ferry Road Morgantown, WV 26505 Attn: A. A. Pitrolo
H. D. Guthrie C. A. Komar K-H. Frohne (3) G. Latham
A. Layne J. K. Westhusing
US Department of Energy (3) Bartlesville Project Office PO Box 1398
Bartlesville, OK 74005
Attn: T. C. Wesson
F. Heuze Lawrence Livermore National
Laboratory MS L200
Livermore, CA 94550
Los Alamos National Laboratory (3) Earth and Space Science Division Los Alamos, NM 87545 Attn: C. W. Myers
R. J. Hanold J. A. Albright
US Geological Survey (3) Box 25046
Denver Federal Center Denver, CO 80225
Attn: B. E. Law, MS 971
C. W. Spencer, MS 940
R. Johnson, MS 971
CER Corporation (30) PO Box 94977 Las Vegas, NV 89193-4977 Attn: R. L. Mann (25)
F. R. Myal P. T. Branagan G. C. Kukal W. H. Mathis C. Cipolla
L. F. Elkins 2615 Oak Drive, #28 Lakewood, CO 80215
J. L. Fitch 6034 Walnut Hill Circle Dallas, TX 75230
Mobil Oil Corp. (2) 1225 17th Street Denver, CO, 80202
Attn: T. C. Vogt T. Kirst
F. G. Martin 907 Glendell Drive Irving, TX 75061
D. E. Nierode Exxon Production Research Co. PO Box 2189
Houston, TX 77001
R. J. Saucier Shell Western E&P
Suite No. 7560 PO Box 576
Houston, TX 77001
DIST.-59

Mobil Research and Development Corp. (4)
PO Box 819047
Dallas, TX 75381
Attn: M. Strubhar L. Medlin E. Sprunt
I. Abou-Sayed
R. W. Veatch Amoco Production Co. Research Department PO Box 3385
Tulsa, OK 74102
Chandler & Associates Suite 1400 1860 Lincoln Street Denver, CO 80203
Attn: R. Veghte
National Institute for Petroleum and Energy Research (3)
PO Box 2128
Bartlesville, OK 74005
Attn: H. B. Carroll C. J. Raible B. L. Gall
Smith Energy Services (2) R. D. Timberline Building Junction Hwys 58 & 93
Golden, CO 80403
Attn: D. Holcomb W. Holcomb
L. Harrington The Western Company PO Box 186
Fort Worth, TX 76101
Dowell Schlumberger Research Center (4)
PO Box 2710
Tulsa, OK 74101
Attn: J. Elbel J. McClennan B. Ainley K. Nimerick
P. Warembourg Dowell Sehlumberger PO Box 5818
Denver, CO 80217
M. Brugler Western Atlas International Core Laboratories 7304 E 38th Street Tulsa, OK 74145
S. Leeds Western Atlas International Core Laboratories 10703 E. Bethany Drive Aurora, CO 80014
Western Atlas International (4) Core Laboratories 1300 East Rochelle Blvd. Irving, TX 75062
Attn: J. Walls R. Jenkins H. Hunt E. York
P. Senseny RE/SPEC, INC. PO Box 725 Rapid City, SD 57701
United Nuclear Services (2) PO Box 1569 Grand Junction, CO 81501 Attn: L. Fukui
R. Dayvault
Institute of Gas Technology (2) 3424S. State Street Chicago, IL 60616 Attn: P. L. Randolph
D. J. Soeder
Petroleum Recovery Research Center (2) NM Institute of Mining and
Technology Socorro, NM 87801 Attn: F. D. Martin
N. R. Morrow
DIST.-60

Gas Research Institute (4) 8600 West Bryn Mawr Avenue Chicago, IL 60631
Attn: P. A. O'Shea
I. A. Salehi C. F. Brandenberg L. A. Rogers
S. A. Holditch S. A. Holditch and Assoc. Inc. 900 Southwest Parkway East College Station, TX 77840
C. Ossian ARCO Oil & Gas PRC Gil 8
Research & Technical Services 2300 West Piano Parkway Piano, TX 75075
B. McGlothlin Chevron Geosciences Co. PO Box 42832
Houston, TX 77242
T. L. Reeves CNG Producing Co. PO Box 2115
Tulsa, OK 74101-2115
B. Coffin CNG Producing Company Canal Place 1
Suite 3100 New Orleans, LA 70130-9990
D. Pellatz Conoco Inc. 907 N. Poplar Casper, WY 82601
D. Munson David Munson Inc. 1525 Elm Street, Suite 1900
Dallas, TX 75201
M. Smith NSI Technologies, Inc. 7030 Yale, Suite 502
Tulsa, OK 74136
J. Schwoebel Resource Enterprises, Inc. 400 Wakara Way Salt Lake City, UT 84108
T. Juranek Mobil Exploration and Producing U.S.
Inc. 12450 Greenspoint Drive Houston, TX 77060-1991
D. L. Luffel ResTech Houston 14411 Cornerstone Village Drive Houston, TX 77014
R. E. Barba Schlumberger
'
1031 Andrews Highway Midland, TX 79701
R. A. Plumb Schlumberger-Doll Research Old Quarry Road PO Box 307
Ridgefield, CT 06877
Shell Development Co. (3) Bellaire Research Center PO Box 481 Houston, TX 77001 Attn: D. C. Schultze
K. Hansen
J. Shiyapobersky
M. Conway
Stim-Lab, Inc. 3445 N. Hwy 81
Duncan, OK 73534
G. R. Coulter Sun Exploration and Production
Company
Four NorthPark East PO Box 2880
Dallas, TX 75221-2880
A. Jones Terra Tek Inc. 420 Wakara Way
Salt Lake City, UT 84108
DIST.-61

Union Oil Co. of California (4) Research Department PO Box 76
Brea, CA 92621
Attn: C. Alien J. Smith J. Cameron W. Minner
W. Stoner Universal Well Services, Inc. 159 Northwood Dr. Box 1456
Meadville, PA 16335
R. E. Wyman
Canadian Hunter Exploration, Ltd. 435 4th Avenue SW
Calgary, Alberta T2P 3A8
Canada
R. Kry Esso Resources Canada Limited Research Department 339 50th Avenue SE
Calgary, Alberta T2G 2B3
Canada
L. Roodhart Shell Candada Ltd. PO Box 2506
Calgary, Alberta T2P 3S6 Canada
W. Hansen Amoco Production Co. 1670 Broadway Denver, CO 80202
S. Stone Amoco Production Company PO Box 800
Denver, CO 80201
D. 0. Cox Angus Petroleum 350 Indiana, Ste #600 Golden, CO 80401-5050
Barrett Energy Company (2) 1125 17th Street, Suite 2100 Denver, CO 80202 Attn: W. J. Barrett
K. Reinecke
J. N. Burkhalter Burkhalter Engineering Inc. 715 Horizon Drive Suite 330 Grand Junction, CO 81506
R. Martin Coors Energy Company PO Box 467 Golden, CO 80402
E. L. Sampson Coseka Resources (USA) Ltd. 200 Writer Square 1512 Larimer Street Denver, CO 80202-1602
Exxon Company USA (2) PO Box 120
Denver, CO 80201 Attn: R. Moore
S. Barker
F. M. Moore Pancanadian Petroleum Co. 600 17th Street, Suite 1800 Denver, CO 80202
W. H. Pease, Jr. Willard Pease Oil and Gas Company PO Box 1874 Grand Junction, CO 81502
R. Poppe Poppe Engineering 6066 E. Long Place Englewood, CO 80112
T. Logan Resource Enterprises 2516 Foresight Circle #7 Grand Junction, CO 81505
DIST.-62

R. E. Chancellor Rio Blanco Natural Gas Company 621 17th Street, Suite 1255
Denver, CO 80293
S. M. Struna Tenneco Oil Company PO Box 3249
Englewood, CO 80293
T. Barrett Terred Oil Company 518 17th Street, Suite 770
Denver, CO 80202
J. D. Haley Van Pollen and Haley, Inc. 5601 S. Broadway, Suite 400
Littleton, CO 80121
M. Krey 133 N. 8th Street Grand Junction, CO 81505
J. A. Morel Consultant 2792 S. Fillmore Street Denver, CO 80210
R. Hunter Bureau of Land Management Horizon Drive Grand Junction, CO 81505
B. Kelso Colorado Geological Survey Department of Natural Resources 1313 Sherman Street Rm 715
Denver, CO 80203
Colorado Oil & Gas Commission 1580 Logan Street, Suite 380
Denver, CO 80203
Petroleum Information Services PO Box 2610
Denver, CO 80201-2612
J. W. Crafton Petroleum Engineering Dept. Colorado School of Mines Golden, CO 80401
J. Johnson Department of Geology Mesa College Grand Junction, CO 81501
A. H. Harvey Petroleum Engineering Dept. University of Missouri at Rolla Rolla, MO 65401
R. Desbrandes Petroleum Engineering Department Louisiana State University Baton Rouge, LA 70803-6417
Department of Geology (2) University of New Mexico Albuquerque, NM 87131
Attn: L. Crossey R. Wright
C. T. Luiskutty Engineering and Physics Dept. Oral Roberts University Tulsa, OK 74171
N. Tyier Bureau of Economic Geology University of Texas at Austin Austin, TX 78713
C. G. Guffey Texas Tech University PO Box 4099 Lubbock, TX 79409
E. Rybicki Mechanical Engineering Dept. University of Tulsa Tulsa, OK 74104
K. Aminian West Virginia University PO Box 6070, 213 White Hall Morgantown, WV 26506
DIST.-63

D. Hambley Argonne National Laboratory EES-362, 9700 S. Cass Avenue Argonne, IL 60439
P. L. Archer Battelle 505 King Avenue Columbus, OH 43201
W. K. Overby BDM Corporation 1199 Van VoorhisRoad, Suite 4
Morgantown, WV 26505
V. A. Kuuskraa ICF-Lewin Energy Division 9300 Lee Highway Fairfax, VA 22031-1207
6000 D. L. Hartley 6010 D. E. Arvizu 6200 V. L. Dugan 6210 B. W. Marshall 6213 D. Engi 6230 W. C. Luth 6232 W. R. Wawersik 6232 L. W. Teufel 6250 R. K. Traeger 6252 J. C. Dunn 6253 D. A. Northrop (30) 6253 J. C. Lorenz (5) 6253 A. R. Sattler (5) 6253 N. R. Warpinski (5) 6253 MWX File 6257 J. K. Linn 6258 P. J. Hommert 6258 B. J. Thorne 6258 H. E. Morris 6322 S. J. Finley 9114 C. A. Searls 3141 S. A. Landenberger (5) 3151 W. I. Klein (3) 3154-1 C. L. Ward (8) for DOE/OSTI 8524 J. R. Wackerly
DIST.-64
8232-2/068956 8232-2/068956
•• ^ ^ ^ 00000001 -
JHHU ^ ^ 8232-2/068956
•H ^ ^ 1059958455358616 00000001 -
•••• ^ ^ ^ 8232-2/068956
•• 00000001 - 00000001 -
^
^

Org. BIdg. Name Rec'd by jOrg. BIdg. Name
^7