Embed Size (px)
Citation preview
IngenIería e InvestIgacIón vol. 35 sup n.° 1 sIcel, november - 2015 (110-117)
110
How to cite: Alvarez, D.L., Rosero, J.A., & Mombello, E.E. (2015). Core influ-ence on the frequency response analysis (FRA) of power transformers through the finite element method. Ingeniería e Investigación, 35(Sup1), 110 - 117. DOI: http://dx.doi.org/10.15446/ing.investig.v35n1Sup.53771
DOI: http://dx.doi.org/10.15446/ing.investig.v35n1Sup.53771
1 David L. Alvarez: Electrical Engineer, M.Sc., Universidad Nacional, Colombia. Affiliation: Ph.D, Student, Universidad Nacional de Colombia, Bogotá. Re-search Group: Electrical Machines & Drives Group, EM&D. E-mail: [email protected]
2 Javier A. Rosero: Electrical Engineer, Universidad del Valle, Cali, Colombia. Ph.D., Universidad Politécnica de Cataluña (UPC), Spain. Affiliation: Associa-te Professor, Universidad Nacional de Colombia, Colombia. Research Group: Electrical Machines & Drives Group, EM&D. E-mail: [email protected]
3 Enrique E. Mombello: Electrical Engineer, Ph.D., CONICET, Argentina. Affilia-tion: Lecturer and Researcher, Instituto de Energía Eléctrica, CONICET - Uni-versidad Nacional de San Juan, Argentina.E-mail: [email protected]
Core influence on the frequency response analysis (FRA) of power transformers through
the finite element method
Influencia del núcleo en el análisis de respuesta en frecuencia (FRA) en transformadores de potencia mediante el método
de elementos finitos
D.L. Alvarez1, J.A. Rosero2, and E.E. Mombello3
ABSTRACT
In this paper the influence of core parameters in Frequency Response Analysis is analyzed through the equivalent circuit impedance matrix of the transformer winding; the parameters of the circuit have been computed using the Finite Element Method. In order to appreciate the behavior of the iron core in comparison to the air core, the frequency dependence of resonances is calculated to show how the air core only influences the results at low frequencies. The core is modeled using a complex permeability, and the parameters of conductivity and permeability are varied to show their influence in the resonances, which turned out to be negligible. In order to explain this behavior, the eigenvalues of the inverse impedance matrix are calculated showing that they are similar for different values of conductivity and permeability. Finally, the magnetic flux inside and outside the core and i ts influence in the frequency response is studied.
Keywords: Frequency response analysis (FRA), magnetic core, finite element method (FEM), transformer windings, complex per-meability.
RESUMEN
En este artículo se analiza la influencia de los parámetros del núcleo en el Análisis de Respuesta en Frecuencia, a través de la matriz de impedancias del circuito equivalente de devanados de trasformadores, donde el cálculo de parámetros del circuito se realiza mediante el método de elementos finitos. Con el fin de analizar el comportamiento entre núcleos de aire y núcleos magnéticos, se calcula la dependencia en la frecuencia de las resonancias, mostrando que el núcleo de aire solo influencia las resonancias a bajas frecuencias. El núcleo del transformador se modela por medio de permeabilidades complejas, donde se varían la conductividad y permeabilidad, obteniendo como resultado una influencia despreciable de estos parámetros sobre las resonancias. Con el fin de explicar este fenómeno, los eigenvalores de la matriz inversa de impedancias son calculados, obteniendo una matriz similar para los diferentes valores de conductividad y permeabilidad. Finalmente, se estudia el flujo magnético dentro y fuera del núcleo, y su influencia en la respuesta en frecuencia.
Palabras clave: Análisis de respuesta en frecuencia (FRA), núcleos magnéticos, método de elementos finitos (MEF), devanado de transformadores, permeabilidad compleja.
Received: September 14th 2015Accepted: October 6th 2015
IntroductionIn recent years, due to the need to improve the reliability of power and distribution transformers as critical components of power systems, new advanced techniques for transformer diagnostics have emerged (Fuhr, 2009). Frequency Response Analysis (FRA) is one of these techniques, and it is an off-line or online (Gomez Luna, 2015)it can be considered that the DFT is not the most suitable tool for (CWT diagnostic preventive methodology used to detect mechanical deformations or shape changes in windings, iron core and insulation (Dick & Erven, 1978), which could be a consequence of transportation, short circuits, aging, etc., and are usually difficult to detect by means of other tests. This technique is based on comparing and analyzing the transfer function (TF) measured or computed between two terminal pairs of the transformer. This TF depends on
IngenIería e InvestIgacIón vol. 35 sup n.° 1 sIcel, november - 2015 (110-117)
ALVAREZ, ROSERO, AND MOMBELLO
111
the geometrical structure and the material properties of the transformer which can be represented by means of an equivalent circuit; any change in the parameters of the circuit is reflected on the frequency response, and the transformer can be diagnosed comparing the present measurement with a reference, (made on different phases, sister transformers or previous measurements records) (international des grands réseaux électriques. Comité d’études A2, 2008). Different standards have been developed in order to standardize the measurements and the equipment used for FRA tests (IEC 60076-18, 2012; IEEE Std C57.149-2012, 2013).
Anomalies observed at the lowest frequencies of the measured frequency range have been associated with iron core faults, usually encountered in a specific bandwidth from 20 [Hz] to 10 [kHz] (Ghani, Thayoob, Ghazali, Khiar, & Chairul, 2013; Herrera Portilla, Aponte Mayor, Pleite Guerra, & Gonzalez-Garcia, 2014), where it is possible to diagnose shorted core laminations, faulty grounding, core damage, etc. For low frequency analysis, a specific magnetic core model that does not cover higher frequencies in detail has been used; this model has been validated through experiments (Badgujar, Baghel, & Kulkarni, 2013; Firoozi, Kharezi, Mahmoodi, & Ghiyasi, 2010) showing a clear core influence at low frequencies but without a clear analysis about the core influence on parameters of a full equivalent circuit over the whole frequency range.
In this research work, the behavior of an experimental transformer winding with magnetic core is modeled by means of an equivalent circuit, and the calculated impedances and resonances are compared with the measured ones with the aim of analyzing the influence of the core properties along the whole frequency range used for FRA tests. This winding has 12 coils, each one with 10 turns. The conductor dimensions are 2.5 x 7.5 [mm], made of copper; the core diameter is 90 [mm]. Due to the small size of the transformer it was necessary to connect capacitors between each coil and ground in order to generate resonances falling in the range of power transformer resonances. (For more details about the characteristics of the transformer, see (E. E. Mombello & Moller, 2000)).
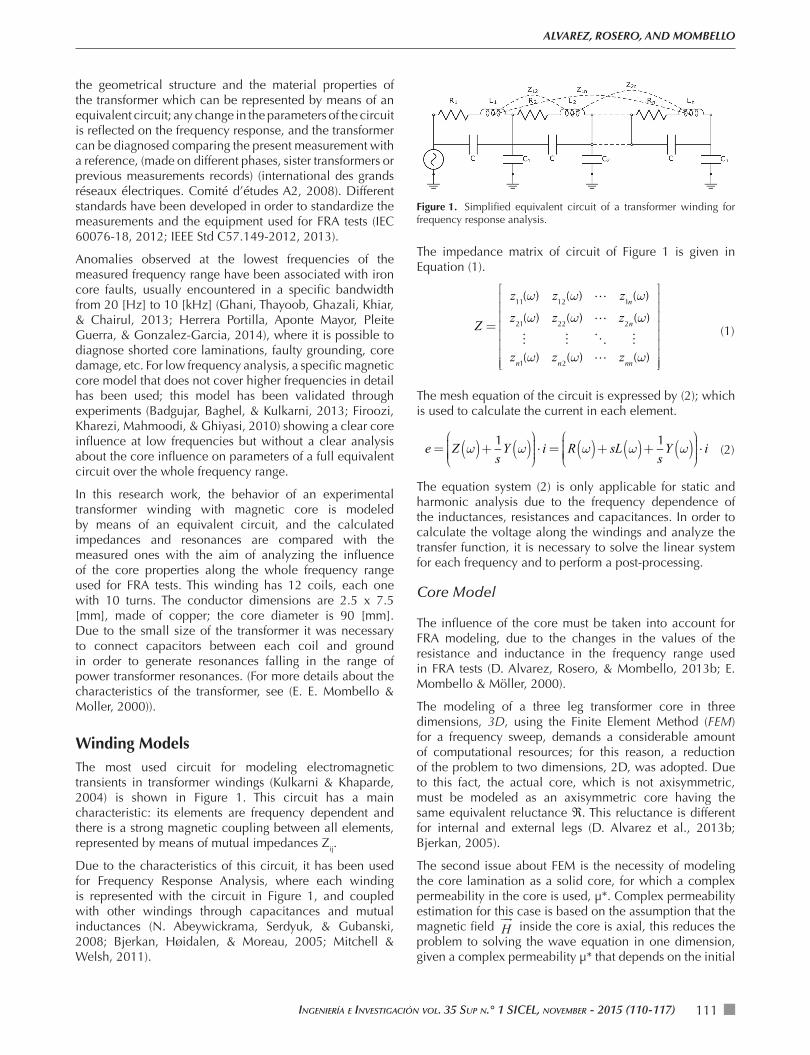
Winding ModelsThe most used circuit for modeling electromagnetic transients in transformer windings (Kulkarni & Khaparde, 2004) is shown in Figure 1. This circuit has a main characteristic: its elements are frequency dependent and there is a strong magnetic coupling between all elements, represented by means of mutual impedances Zij.
Due to the characteristics of this circuit, it has been used for Frequency Response Analysis, where each winding is represented with the circuit in Figure 1, and coupled with other windings through capacitances and mutual inductances (N. Abeywickrama, Serdyuk, & Gubanski, 2008; Bjerkan, Høidalen, & Moreau, 2005; Mitchell & Welsh, 2011).
Figure 1. Simplified equivalent circuit of a transformer winding for frequency response analysis.
The impedance matrix of circuit of Figure 1 is given in Equation (1).
Z =
z11(ω) z
12(ω) ! z
1n(ω)
z21(ω) z
22(ω) ! z
2n(ω)
! ! " !zn1(ω) zn2(ω) ! znn(ω)
⎡
⎣
⎢⎢⎢⎢⎢⎢⎢⎢
⎤
⎦
⎥⎥⎥⎥⎥⎥⎥⎥
(1)
The mesh equation of the circuit is expressed by (2); which is used to calculate the current in each element.
e= Z ω( )+ 1sY ω( )
⎛
⎝⎜⎜⎜⎜
⎞
⎠⎟⎟⎟⎟⋅ i= R ω( )+ sL ω( )+ 1
sY ω( )
⎛
⎝⎜⎜⎜⎜
⎞
⎠⎟⎟⎟⎟⋅ i (2)
The equation system (2) is only applicable for static and harmonic analysis due to the frequency dependence of the inductances, resistances and capacitances. In order to calculate the voltage along the windings and analyze the transfer function, it is necessary to solve the linear system for each frequency and to perform a post-processing.
Core Model
The influence of the core must be taken into account for FRA modeling, due to the changes in the values of the resistance and inductance in the frequency range used in FRA tests (D. Alvarez, Rosero, & Mombello, 2013b; E. Mombello & Möller, 2000).
The modeling of a three leg transformer core in three dimensions, 3D, using the Finite Element Method (FEM) for a frequency sweep, demands a considerable amount of computational resources; for this reason, a reduction of the problem to two dimensions, 2D, was adopted. Due to this fact, the actual core, which is not axisymmetric, must be modeled as an axisymmetric core having the same equivalent reluctance ℜ. This reluctance is different for internal and external legs (D. Alvarez et al., 2013b; Bjerkan, 2005).
The second issue about FEM is the necessity of modeling the core lamination as a solid core, for which a complex permeability in the core is used, μ*. Complex permeability estimation for this case is based on the assumption that the magnetic field
���H inside the core is axial, this reduces the
problem to solving the wave equation in one dimension, given a complex permeability μ* that depends on the initial

Core influenCe on the frequenCy response analysis (fra) of power transformers through the finite element method
IngenIería e InvestIgacIón vol. 35 sup n.° 1 sIcel, november - 2015 (110-117)112
permeability μr, core conductivity σ and sheet thickness L
Equation (3), where δ
=+k j1 and δ is the skin depth.
µ* = µrµ0tanh kz( )kL
= µ0µ'− jµ"( ) (3)
In transformer models for FRA, the hysteresis losses are not taken into account due to the fact that the tests are made using small voltage sources compared with transformer rated voltages. Due to this, the hysteresis losses in the core
are negligible at low magnetic field intensity ��B .
Impedance Calculation
The impedances of the equivalent circuit have been calculated by solving the electromagnetic field problem with the aid of the finite element analysis software Comsol™ Multiphysics, module AC/DC /, Magnetic-Fields (Ab, 2010). The mutual impedance Zij is calculated by applying superposition as shown in Equation (4), where vij is obtained directly as a FEM output and ii is the current source that excites the coil i. In this case, it is necessary to make twelve simulations with a logarithmic sweep of 50 frequencies for each one. The meshing task requires to make a manual distribution of nodes in the edges of the core and the conductors, in order to correctly take the skin effect and proximity effect into account. The highest density of nodes are located at the inner edges of the core and conductors boundaries. To optimize the meshing algorithm, one conductor is meshed first and then its mesh is copied for the other conductors. The number of nodes is determined through an iterative process until the impedance behavior does not change along the analyzed frequency range.
Zij =vijii
(4)
The magnetic flux intensity ���H is shown in Figure 2, where
the first coil is exited with a current source; here, it can be appreciated that the magnetic field lines cross the coils that are not excited, which induces magnetic fields modeled through mutual inductances and resistances. The distribution of the magnetic field is shown in Figure 2.
Figure 2. Transformer modeled in FEM, magnetic field intensity distri-bution at 1 [kHz].
The behaviors of resistance R1j and inductance L1j measured (E. E. Mombello & Moller, 2000) and calculated with FEM (D. Alvarez et al., 2013b) of the transformer being studied, are shown in Figure 3 and Figure 4.
Figure 3. Measured and calculated resistance R1j.
Figure 4. Measured and calculated resistance L1j.
In Figure 5 the measured and simulated voltage in node 2 is shown, where it is possible to observe the corresponding resonances along the frequency range. The simulated voltage is calculated using Equation (2), where Z is obtained from FEM and Y is calculated from the capacitances of the winding.
Core Influence
Magnetic Core vs. Air Core
In this section, the frequency response of the experimental transformer is modeled using FEM, alternatively considering a magnetic core and an air core, and these results are compared with measurements (E. E. Mombello & Moller, 2000). This analysis has been done with the aim of showing the influence of the high permeability of the core. The values of the permeability and conductivity at low magnetic flux densities in Equation (3) are μ* = 350
and σ= 3,5×10⁶ Sm⎡
⎣⎢⎢⎤
⎦⎥⎥.
IngenIería e InvestIgacIón vol. 35 sup n.° 1 sIcel, november - 2015 (110-117)
ALVAREZ, ROSERO, AND MOMBELLO
113
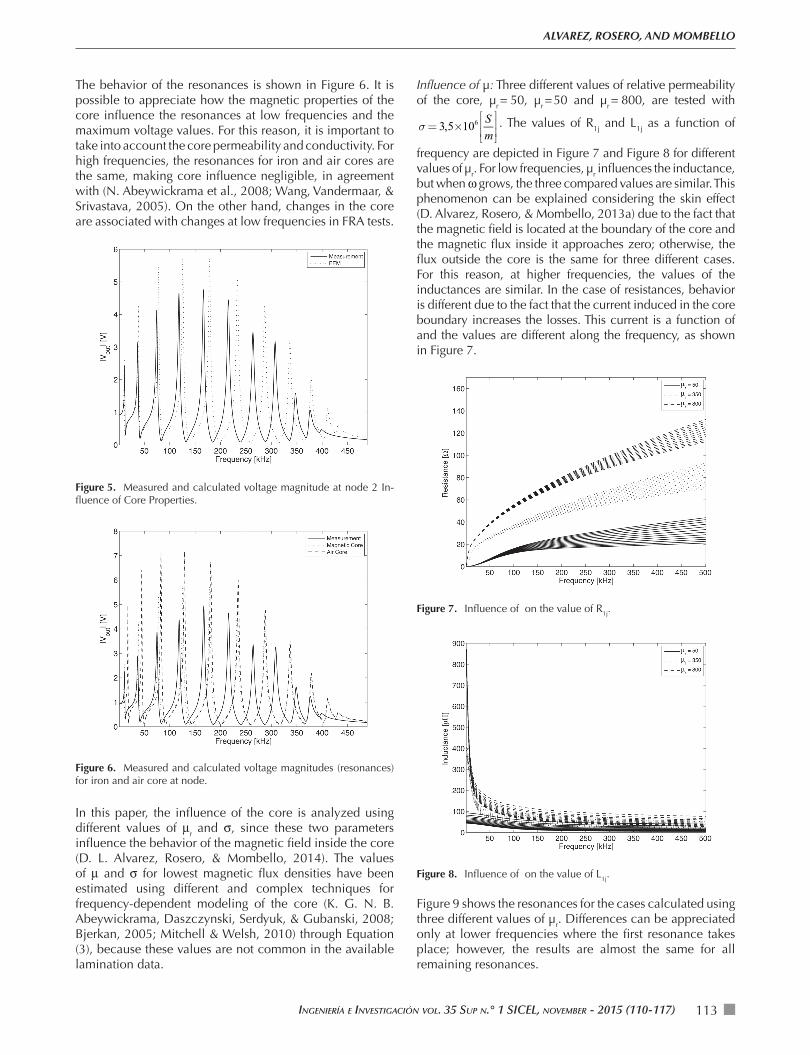
The behavior of the resonances is shown in Figure 6. It is possible to appreciate how the magnetic properties of the core influence the resonances at low frequencies and the maximum voltage values. For this reason, it is important to take into account the core permeability and conductivity. For high frequencies, the resonances for iron and air cores are the same, making core influence negligible, in agreement with (N. Abeywickrama et al., 2008; Wang, Vandermaar, & Srivastava, 2005). On the other hand, changes in the core are associated with changes at low frequencies in FRA tests.
Figure 5. Measured and calculated voltage magnitude at node 2 In-fluence of Core Properties.
Figure 6. Measured and calculated voltage magnitudes (resonances) for iron and air core at node.
In this paper, the influence of the core is analyzed using different values of μr and σ, since these two parameters influence the behavior of the magnetic field inside the core (D. L. Alvarez, Rosero, & Mombello, 2014). The values of μ and σ for lowest magnetic flux densities have been estimated using different and complex techniques for frequency-dependent modeling of the core (K. G. N. B. Abeywickrama, Daszczynski, Serdyuk, & Gubanski, 2008; Bjerkan, 2005; Mitchell & Welsh, 2010) through Equation (3), because these values are not common in the available lamination data.
Influence of μ: Three different values of relative permeability of the core, μr = 50, μr = 50 and μr = 800, are tested with
σ= 3,5×10⁶ Sm⎡
⎣⎢⎢⎤
⎦⎥⎥. The values of R1j and L1j as a function of
frequency are depicted in Figure 7 and Figure 8 for different values of μr. For low frequencies, μr influences the inductance, but when ω grows, the three compared values are similar. This phenomenon can be explained considering the skin effect (D. Alvarez, Rosero, & Mombello, 2013a) due to the fact that the magnetic field is located at the boundary of the core and the magnetic flux inside it approaches zero; otherwise, the flux outside the core is the same for three different cases. For this reason, at higher frequencies, the values of the inductances are similar. In the case of resistances, behavior is different due to the fact that the current induced in the core boundary increases the losses. This current is a function of and the values are different along the frequency, as shown in Figure 7.
Figure 7. Influence of on the value of R1j.
Figure 8. Influence of on the value of L1j.
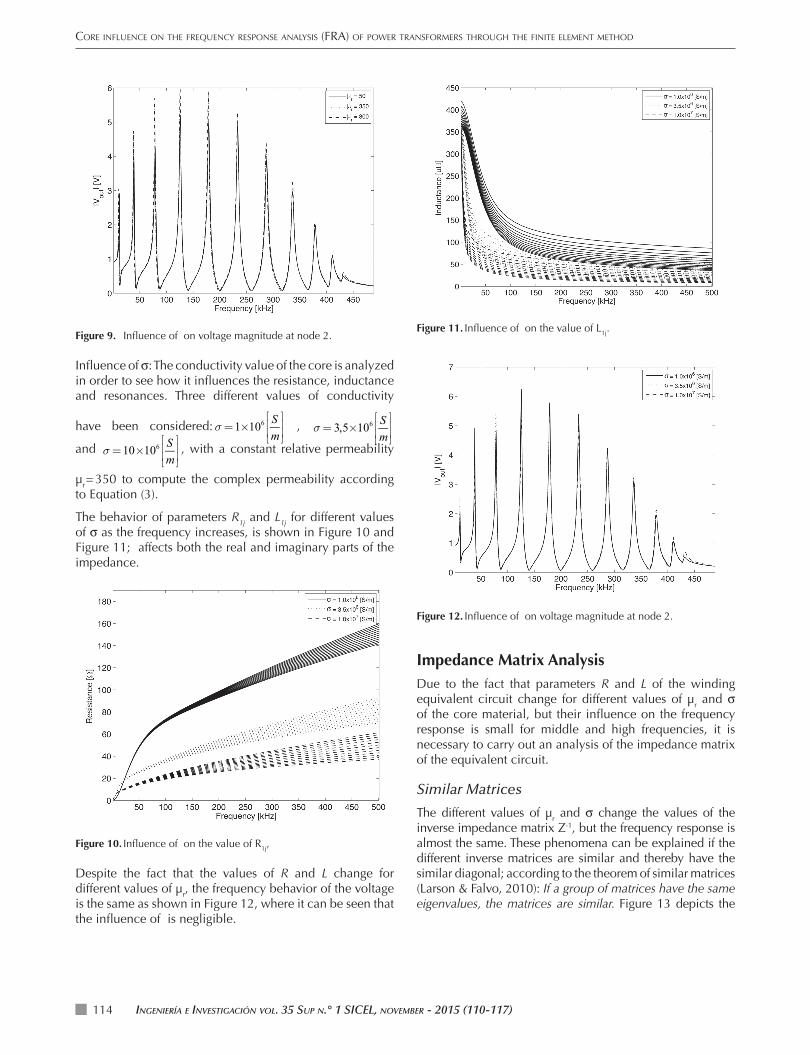
Figure 9 shows the resonances for the cases calculated using three different values of μr. Differences can be appreciated only at lower frequencies where the first resonance takes place; however, the results are almost the same for all remaining resonances.
Core influenCe on the frequenCy response analysis (fra) of power transformers through the finite element method
IngenIería e InvestIgacIón vol. 35 sup n.° 1 sIcel, november - 2015 (110-117)114
Figure 9. Influence of on voltage magnitude at node 2.
Influence of σ: The conductivity value of the core is analyzed in order to see how it influences the resistance, inductance and resonances. Three different values of conductivity
have been considered:σ=1×10⁶ Sm⎡
⎣⎢⎢⎤
⎦⎥⎥ , σ= 3,5×10⁶ S
m⎡
⎣⎢⎢⎤
⎦⎥⎥
and σ=10×106 Sm⎡
⎣⎢⎢⎤
⎦⎥⎥, with a constant relative permeability
μr = 350 to compute the complex permeability according to Equation (3).
The behavior of parameters R1j and L1j for different values of σ as the frequency increases, is shown in Figure 10 and Figure 11; affects both the real and imaginary parts of the impedance.
Figure 10. Influence of on the value of R1j,
Despite the fact that the values of R and L change for different values of μr, the frequency behavior of the voltage is the same as shown in Figure 12, where it can be seen that the influence of is negligible.
Figure 11. Influence of on the value of L1j.
Figure 12. Influence of on voltage magnitude at node 2.
Impedance Matrix AnalysisDue to the fact that parameters R and L of the winding equivalent circuit change for different values of μr and σ of the core material, but their influence on the frequency response is small for middle and high frequencies, it is necessary to carry out an analysis of the impedance matrix of the equivalent circuit.
Similar Matrices
The different values of μr and σ change the values of the inverse impedance matrix Z-1, but the frequency response is almost the same. These phenomena can be explained if the different inverse matrices are similar and thereby have the similar diagonal; according to the theorem of similar matrices (Larson & Falvo, 2010): If a group of matrices have the same eigenvalues, the matrices are similar. Figure 13 depicts the
IngenIería e InvestIgacIón vol. 35 sup n.° 1 sIcel, november - 2015 (110-117)
ALVAREZ, ROSERO, AND MOMBELLO
115
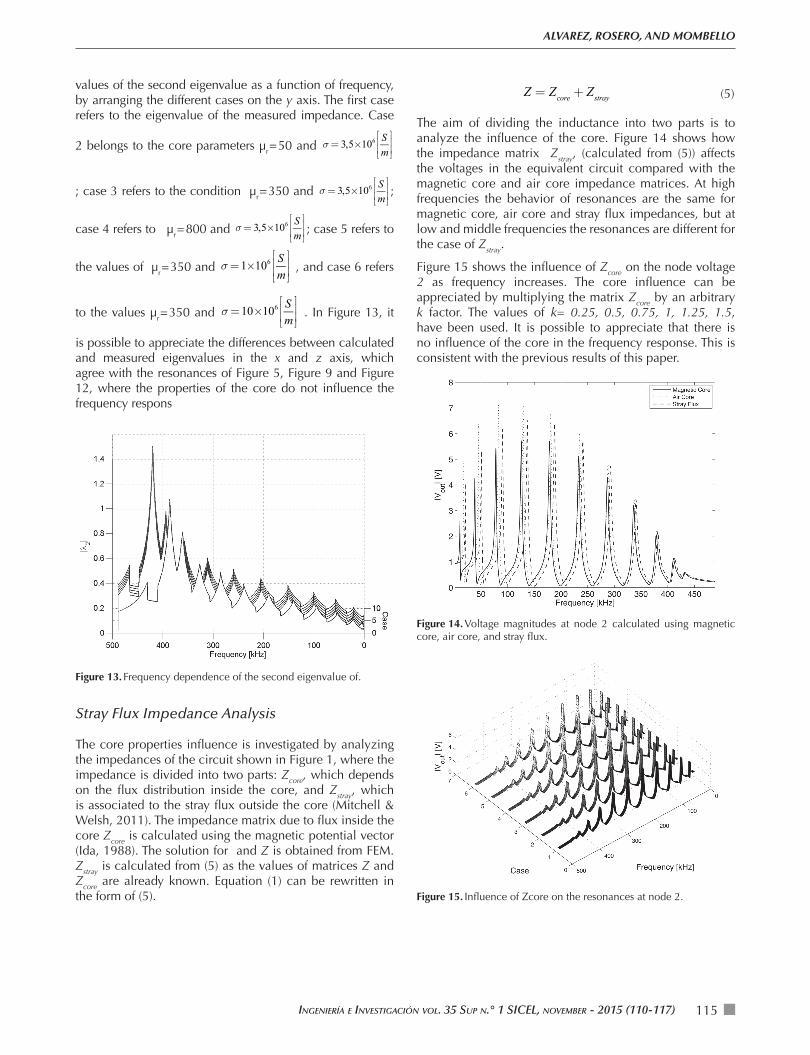
values of the second eigenvalue as a function of frequency, by arranging the different cases on the y axis. The first case refers to the eigenvalue of the measured impedance. Case
2 belongs to the core parameters μr = 50 and σ= 3,5×10⁶Sm⎡
⎣⎢⎢⎤
⎦⎥⎥
; case 3 refers to the condition μr = 350 and σ= 3,5×10⁶Sm⎡
⎣⎢⎢⎤
⎦⎥⎥ ;
case 4 refers to μr = 800 and σ= 3,5×10⁶Sm⎡
⎣⎢⎢⎤
⎦⎥⎥ ; case 5 refers to
the values of μr = 350 and σ=1×10⁶Sm⎡
⎣⎢⎢⎤
⎦⎥⎥ , and case 6 refers
to the values μr = 350 and σ=10×106Sm⎡
⎣⎢⎢⎤
⎦⎥⎥ . In Figure 13, it
is possible to appreciate the differences between calculated and measured eigenvalues in the x and z axis, which agree with the resonances of Figure 5, Figure 9 and Figure 12, where the properties of the core do not influence the frequency respons
Figure 13. Frequency dependence of the second eigenvalue of.
Stray Flux Impedance Analysis
The core properties influence is investigated by analyzing the impedances of the circuit shown in Figure 1, where the impedance is divided into two parts: Zcore, which depends on the flux distribution inside the core, and Zstray, which is associated to the stray flux outside the core (Mitchell & Welsh, 2011). The impedance matrix due to flux inside the core Zcore is calculated using the magnetic potential vector (Ida, 1988). The solution for and Z is obtained from FEM. Zstray is calculated from (5) as the values of matrices Z and Zcore are already known. Equation (1) can be rewritten in the form of (5).
Z = Zcore + Zstray (5)
The aim of dividing the inductance into two parts is to analyze the influence of the core. Figure 14 shows how the impedance matrix Zstray, (calculated from (5)) affects the voltages in the equivalent circuit compared with the magnetic core and air core impedance matrices. At high frequencies the behavior of resonances are the same for magnetic core, air core and stray flux impedances, but at low and middle frequencies the resonances are different for the case of Zstray.
Figure 15 shows the influence of Zcore on the node voltage 2 as frequency increases. The core influence can be appreciated by multiplying the matrix Zcore by an arbitrary k factor. The values of k= 0.25, 0.5, 0.75, 1, 1.25, 1.5, have been used. It is possible to appreciate that there is no influence of the core in the frequency response. This is consistent with the previous results of this paper.
Figure 14. Voltage magnitudes at node 2 calculated using magnetic core, air core, and stray flux.
Figure 15. Influence of Zcore on the resonances at node 2.
Core influenCe on the frequenCy response analysis (fra) of power transformers through the finite element method
IngenIería e InvestIgacIón vol. 35 sup n.° 1 sIcel, november - 2015 (110-117)116
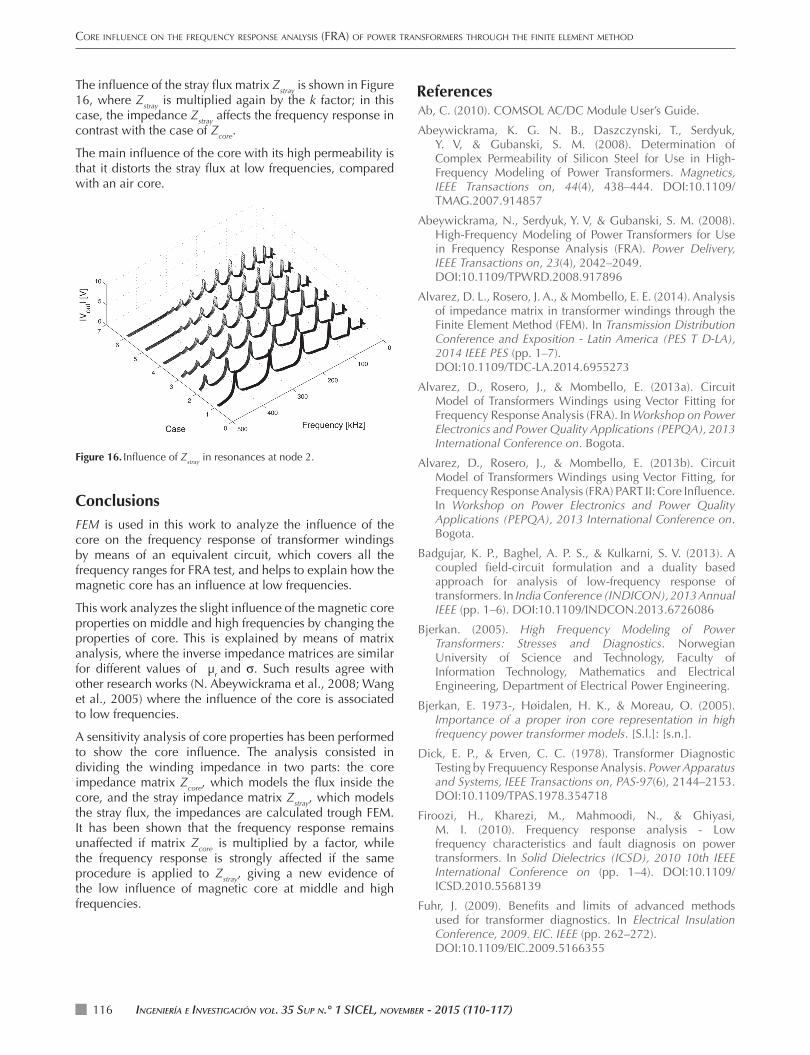
The influence of the stray flux matrix Zstray is shown in Figure 16, where Zstray is multiplied again by the k factor; in this case, the impedance Zstray affects the frequency response in contrast with the case of Zcore.
The main influence of the core with its high permeability is that it distorts the stray flux at low frequencies, compared with an air core.
Figure 16. Influence of Zstray in resonances at node 2.
ConclusionsFEM is used in this work to analyze the influence of the core on the frequency response of transformer windings by means of an equivalent circuit, which covers all the frequency ranges for FRA test, and helps to explain how the magnetic core has an influence at low frequencies.
This work analyzes the slight influence of the magnetic core properties on middle and high frequencies by changing the properties of core. This is explained by means of matrix analysis, where the inverse impedance matrices are similar for different values of μr and σ. Such results agree with other research works (N. Abeywickrama et al., 2008; Wang et al., 2005) where the influence of the core is associated to low frequencies.
A sensitivity analysis of core properties has been performed to show the core influence. The analysis consisted in dividing the winding impedance in two parts: the core impedance matrix Zcore, which models the flux inside the core, and the stray impedance matrix Zstray, which models the stray flux, the impedances are calculated trough FEM. It has been shown that the frequency response remains unaffected if matrix Zcore is multiplied by a factor, while the frequency response is strongly affected if the same procedure is applied to Zstray, giving a new evidence of the low influence of magnetic core at middle and high frequencies.
ReferencesAb, C. (2010). COMSOL AC/DC Module User’s Guide.
Abeywickrama, K. G. N. B., Daszczynski, T., Serdyuk, Y. V, & Gubanski, S. M. (2008). Determination of Complex Permeability of Silicon Steel for Use in High-Frequency Modeling of Power Transformers. Magnetics, IEEE Transactions on, 44(4), 438–444. DOI:10.1109/TMAG.2007.914857
Abeywickrama, N., Serdyuk, Y. V, & Gubanski, S. M. (2008). High-Frequency Modeling of Power Transformers for Use in Frequency Response Analysis (FRA). Power Delivery, IEEE Transactions on, 23(4), 2042–2049.
DOI:10.1109/TPWRD.2008.917896
Alvarez, D. L., Rosero, J. A., & Mombello, E. E. (2014). Analysis of impedance matrix in transformer windings through the Finite Element Method (FEM). In Transmission Distribution Conference and Exposition - Latin America (PES T D-LA), 2014 IEEE PES (pp. 1–7).
DOI:10.1109/TDC-LA.2014.6955273
Alvarez, D., Rosero, J., & Mombello, E. (2013a). Circuit Model of Transformers Windings using Vector Fitting for Frequency Response Analysis (FRA). In Workshop on Power Electronics and Power Quality Applications (PEPQA), 2013 International Conference on. Bogota.
Alvarez, D., Rosero, J., & Mombello, E. (2013b). Circuit Model of Transformers Windings using Vector Fitting, for Frequency Response Analysis (FRA) PART II: Core Influence. In Workshop on Power Electronics and Power Quality Applications (PEPQA), 2013 International Conference on. Bogota.
Badgujar, K. P., Baghel, A. P. S., & Kulkarni, S. V. (2013). A coupled field-circuit formulation and a duality based approach for analysis of low-frequency response of transformers. In India Conference (INDICON), 2013 Annual IEEE (pp. 1–6). DOI:10.1109/INDCON.2013.6726086
Bjerkan. (2005). High Frequency Modeling of Power Transformers: Stresses and Diagnostics. Norwegian University of Science and Technology, Faculty of Information Technology, Mathematics and Electrical Engineering, Department of Electrical Power Engineering.
Bjerkan, E. 1973-, Høidalen, H. K., & Moreau, O. (2005). Importance of a proper iron core representation in high frequency power transformer models. [S.l.]: [s.n.].
Dick, E. P., & Erven, C. C. (1978). Transformer Diagnostic Testing by Frequuency Response Analysis. Power Apparatus and Systems, IEEE Transactions on, PAS-97(6), 2144–2153. DOI:10.1109/TPAS.1978.354718
Firoozi, H., Kharezi, M., Mahmoodi, N., & Ghiyasi, M. I. (2010). Frequency response analysis - Low frequency characteristics and fault diagnosis on power transformers. In Solid Dielectrics (ICSD), 2010 10th IEEE International Conference on (pp. 1–4). DOI:10.1109/ICSD.2010.5568139
Fuhr, J. (2009). Benefits and limits of advanced methods used for transformer diagnostics. In Electrical Insulation Conference, 2009. EIC. IEEE (pp. 262–272).
DOI:10.1109/EIC.2009.5166355
IngenIería e InvestIgacIón vol. 35 sup n.° 1 sIcel, november - 2015 (110-117)
ALVAREZ, ROSERO, AND MOMBELLO
117
Ghani, S. A., Thayoob, Y. H. M., Ghazali, Y. Z. Y., Khiar, M. S. A., & Chairul, I. S. (2013). Condition Monitoring of Distribution Transformer’s Mechanical Parts Using Sweep Frequency Response Analysis (SFRA). Procedia Engineering, 68(0), 469–476. DOI: 0.1016/j.proeng.2013.12.208
Gomez Luna, E. (2015). Experiences with non-intrusive monitoring of distribution transformers based on the on-line frequency response. Ingeniería E Investigación, 35(1), 55–59. DOI:10.15446/ing.investig.v35n1.47363
Herrera Portilla, W., Aponte Mayor, G., Pleite Guerra, J., & Gonzalez-Garcia, C. (2014). Detection of Transformer Faults Using Frequency-Response Traces in the Low-Frequency Bandwidth. Industrial Electronics, IEEE Transactions on, 61(9), 4971–4978. DOI:10.1109/TIE.2013.2282605
Ida, N. (1988). Alternative approaches to the numerical calculation of impedance. {NDT} International, 21(1), 27–35. DOI: 10.1016/0308-9126(88)90381-1
IEC 60076-18. (2012). Power transformers – Part 18: Measurement of frequency response.
IEEE Std C57.149-2012. (2013). IEEE Guide for the Application and Interpretation of Frequency Response Analysis for Oil-Immersed Transformers. IEEE Std C57.149-2012. DOI:10.1109/IEEESTD.2013.6475950
international des grands réseaux électriques. Comité d’études A2, C. (2008). Mechanical Condition Assessment of Transformer Windings Using Frequency Response Analysis, FRA. CIGR{É}.
Kulkarni, S. V, & Khaparde, S. A. (2004). Transformer Engineering: Design and Practice. Marcel Dekker,
Incorporated.
Larson, R., & Falvo, D. C. (2010). Elementary Linear Algebra (Sixth Edit). New York: John Wiley & Sons.
Mitchell, S. D., & Welsh, J. S. (2010). The Influence of Complex Permeability on the Broadband Frequency Response of a Power Transformer. Power Delivery, IEEE Transactions on, 25(2), 803–813. DOI:10.1109/TPWRD.2009.2036358
Mitchell, S. D., & Welsh, J. S. (2011). Modeling Power Transformers to Support the Interpretation of Frequency-Response Analysis. Power Delivery, IEEE Transactions on, 26(4), 2705–2717. DOI:10.1109/TPWRD.2011.2164424
Mombello, E. E., & Moller, K. (2000). New power transformer model for the calculation of electromagnetic resonant transient phenomena including frequency-dependent losses. Power Delivery, IEEE Transactions on, 15(1), 167–174. DOI:10.1109/61.847246
Mombello, E., & Möller, K. (2000). Impedances for the calculation of electromagnetic transient phenomena and resonance in transformer windings. Electric Power Systems Research, 54(2), 131–138. DOI: 10.1016/S0378-7796(99)00081-4
Wang, M., Vandermaar, A. J., & Srivastava, K. D. (2005). Improved detection of power transformer winding movement by extending the FRA high frequency range. Power Delivery, IEEE Transactions on, 20(3), 1930–1938. DOI:10.1109/TPWRD.2005.848674