Embed Size (px)
Citation preview

Core Results ReportingInvestor Update, October 2010Ian Bishop
2
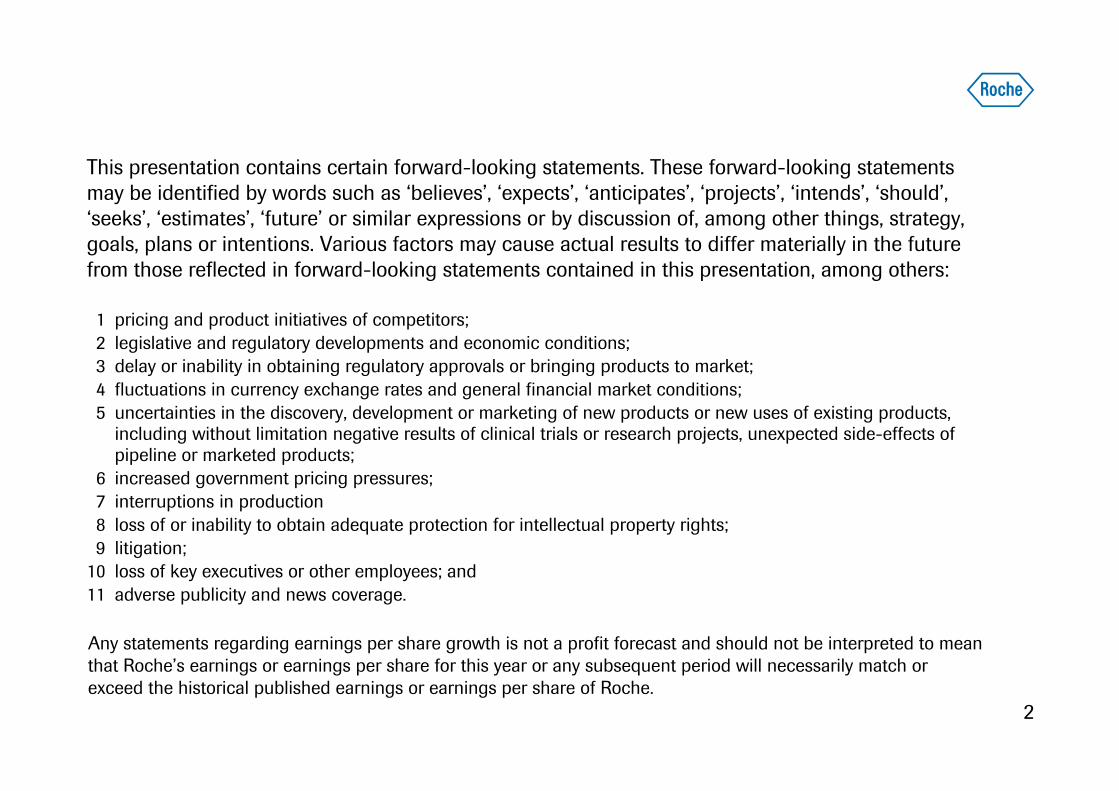
This presentation contains certain forward-looking statements. These forward-looking statements may be identified by words such as ‘believes’, ‘expects’, ‘anticipates’, ‘projects’, ‘intends’, ‘should’, ‘seeks’, ‘estimates’, ‘future’ or similar expressions or by discussion of, among other things, strategy, goals, plans or intentions. Various factors may cause actual results to differ materially in the future from those reflected in forward-looking statements contained in this presentation, among others:
1 pricing and product initiatives of competitors;2 legislative and regulatory developments and economic conditions;3 delay or inability in obtaining regulatory approvals or bringing products to market; 4 fluctuations in currency exchange rates and general financial market conditions; 5 uncertainties in the discovery, development or marketing of new products or new uses of existing products,
including without limitation negative results of clinical trials or research projects, unexpected side-effects of pipeline or marketed products;
6 increased government pricing pressures; 7 interruptions in production 8 loss of or inability to obtain adequate protection for intellectual property rights; 9 litigation;
10 loss of key executives or other employees; and11 adverse publicity and news coverage.
Any statements regarding earnings per share growth is not a profit forecast and should not be interpreted to mean that Roche’s earnings or earnings per share for this year or any subsequent period will necessarily match or exceed the historical published earnings or earnings per share of Roche.

3
Overview
IFRS income statement presentation
Core Results concept
Appendix 1: Equity Compensation Plans - tax effects
Appendix 2: Draft Core Results FY 2009 and HY 2010

4
Core EPS• Core EPS was pioneered by Roche in the Healthcare sector in 2004. • Consistently applied since then, with clear linkage to the audited IFRS financial statements. • We will be expanding the disclosures for 2010 in light of current international and industry
practice and taking into account the latest regulatory guidance.
Presentational changes• Income statement in audited financials simplified, removing “Exceptional Items”.• Internal and external earnings metrics aligned. “Operating Profit before Exceptional Items”
will be replaced by “Core Operating Profit”. • No significant changes to the definition of Core EPS. Operational Excellence costs will be
excluded from the Core Results.• For 2010, Core Results will be given externally for full Divisional and Roche Group income
statements, with a fully transparent reconciliation to the audited IFRS results.
Core Results reportingOverview

5
Core Results reportingNew Income Statement Presentation
From ToSalesOperating CostsOperating Profit before exceptional items
Operating Profit
Financial Income/Financing Costs
Income Taxes
Net Income before exceptional items
Net Income
SalesOperating CostsOperating ProfitFinancial Income/CostsIncome TaxesNet Income
SalesOperating CostsCore Operating ProfitFinancial Income/CostsIncome TaxesCore Net Income
Non-CoreItems
Exceptional Financing Costs
Income Taxes on Exceptional Items
Exceptional operating items
IFRS
IFRS Core Results
• Change from a one-column IFRS income statement to a two column presentation of IFRS and Core Results with clearly defined Non-Core items and a transparent reconciliation.
• Core Results will be presented by Group and Division.
6
Overview
IFRS income statement presentation
Core Results concept
Appendix 1: Equity Compensation Plans - tax effects
Appendix 2: Draft Core Results FY 2009 and HY 2010

7
Ever tighter technical requirements• Increasingly focus from standard setters, regulators and auditors.
• Standard setters may at some point change income statement presentation rules.
• Peers do not present it this way.
Drop “Exceptional items” in audited financials• Reclassify “Major Legal Cases” and “Changes in Group Organisation” to G&A.
• Reclassify “Exceptional Financing Costs” to “Financial Income” and “Financing Costs”.
• Reclassify “Income Taxes on Exceptional Items” to “Income Taxes”.
• Operational Excellence costs are part of regular function items (and not all booked to G&A). Will be considered as Non-Core for targets in 2010 and beyond.
IFRS income statement presentationAlign IFRS presentation to industry practice

8
IFRS Income statement presentation2009 – bridge between published and restated

9
IFRS Income statement presentationRevised (2009 - restated)
10
Overview
IFRS income statement presentation
Core Results concept
Appendix 1: Equity Compensation Plans - tax effects
Appendix 2: Draft Core Results FY 2009 and HY 2010
11
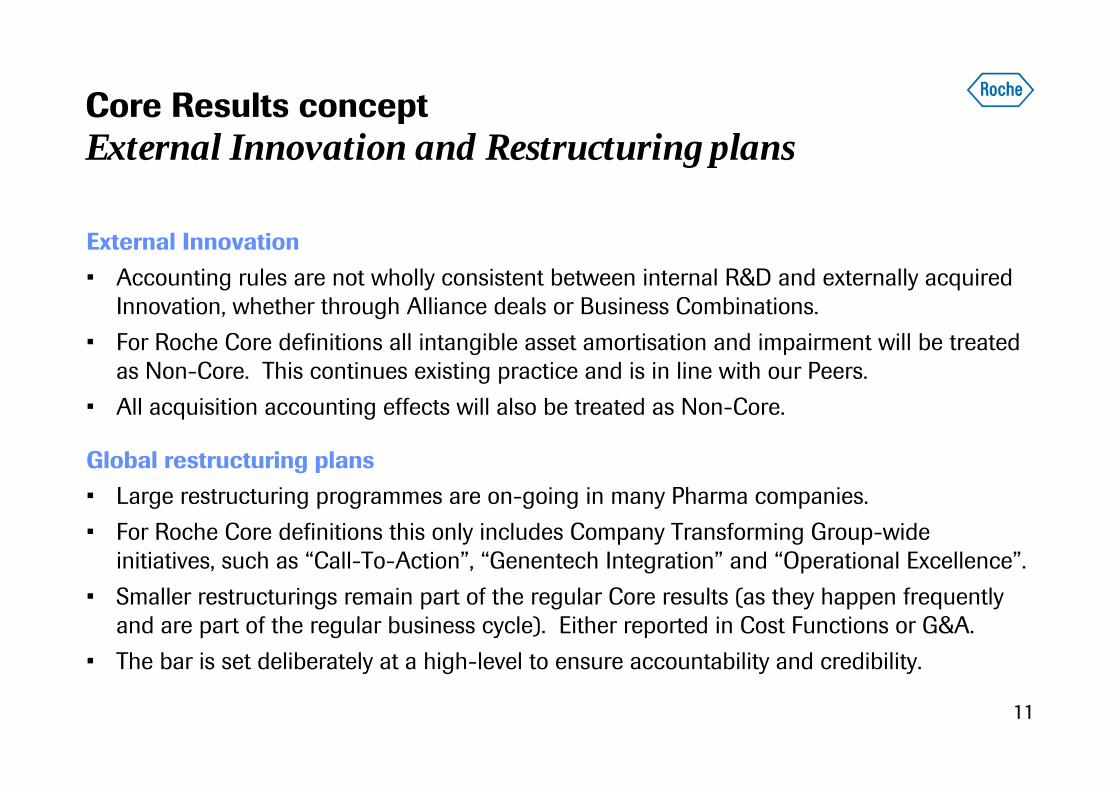
External Innovation• Accounting rules are not wholly consistent between internal R&D and externally acquired
Innovation, whether through Alliance deals or Business Combinations.
• For Roche Core definitions all intangible asset amortisation and impairment will be treated as Non-Core. This continues existing practice and is in line with our Peers.
• All acquisition accounting effects will also be treated as Non-Core.
Global restructuring plans• Large restructuring programmes are on-going in many Pharma companies.
• For Roche Core definitions this only includes Company Transforming Group-wide initiatives, such as “Call-To-Action”, “Genentech Integration” and “Operational Excellence”.
• Smaller restructurings remain part of the regular Core results (as they happen frequently and are part of the regular business cycle). Either reported in Cost Functions or G&A.
• The bar is set deliberately at a high-level to ensure accountability and credibility.
Core Results conceptExternal Innovation and Restructuring plans

12
Legal and environmental• Well accepted as an adjustment item, with most Peers adjusting out all such items. • Such matters at Roche are mostly historic legacy matters not related to current products
and operations.
Discontinued businesses• Results prior to divestments and gain/loss on divestments.• Past examples at Roche include Vitamins and Fine Chemicals and OTC.
Treasury and Tax• Settlement of pension plans.• Major debt restructuring.• Normalisation of tax charge on stock options.
Global issues outside the Healthcare Sector beyond the Group’s control• Placeholder for issues such as natural disasters and government actions. • Regulatory (e.g. FDA decisions) or business (e.g. Greece) issues are treated as Core.
Core Results conceptOther matters treated as Non-Core
13
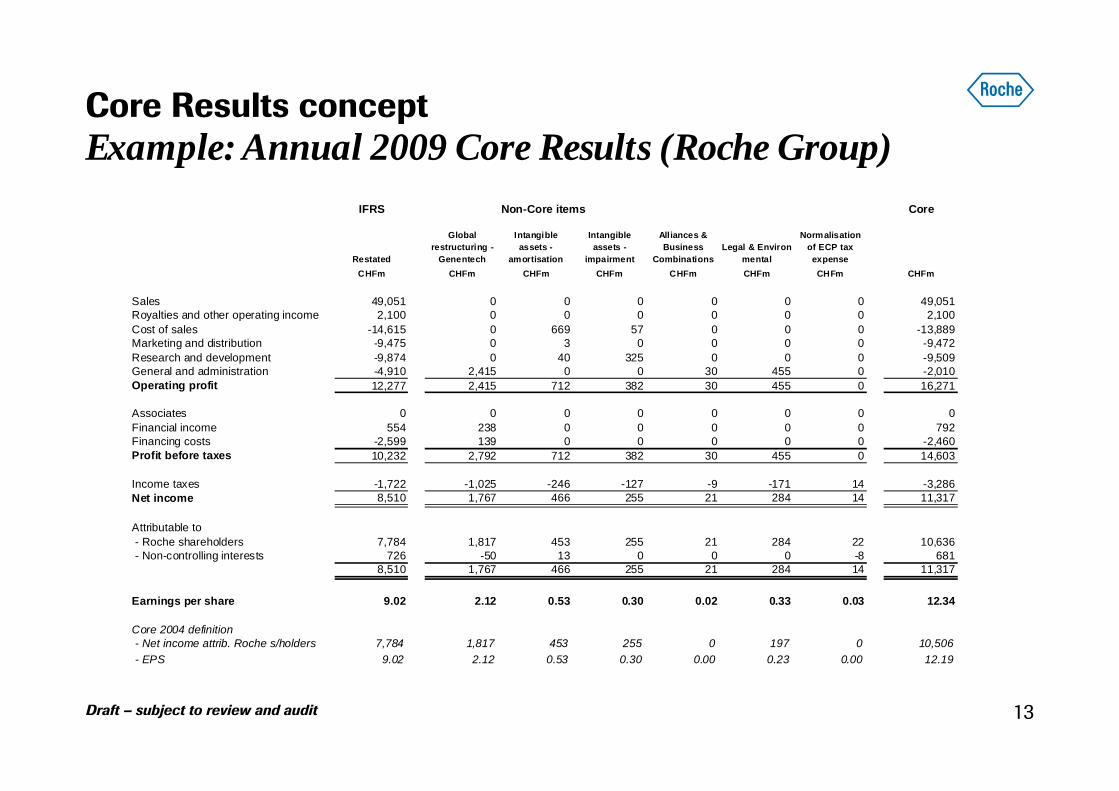
Core Results concept Example: Annual 2009 Core Results (Roche Group)
Draft – subject to review and audit
IFRS Non-Core items Core
Restated
Global restructuring -
Genentech
Intangible assets -
amortisation
Intangible assets -
impairment
Alliances & Business
CombinationsLegal & Environ-
mental
Normalisation of ECP tax expense
CHFm CHFm CHFm CHFm CHFm CHFm CHFm CHFm
Sales 49,051 0 0 0 0 0 0 49,051Royalties and other operating income 2,100 0 0 0 0 0 0 2,100Cost of sales -14,615 0 669 57 0 0 0 -13,889Marketing and distribution -9,475 0 3 0 0 0 0 -9,472Research and development -9,874 0 40 325 0 0 0 -9,509General and administration -4,910 2,415 0 0 30 455 0 -2,010Operating profit 12,277 2,415 712 382 30 455 0 16,271
Associates 0 0 0 0 0 0 0 0Financial income 554 238 0 0 0 0 0 792Financing costs -2,599 139 0 0 0 0 0 -2,460Profit before taxes 10,232 2,792 712 382 30 455 0 14,603
Income taxes -1,722 -1,025 -246 -127 -9 -171 14 -3,286Net income 8,510 1,767 466 255 21 284 14 11,317
Attributable to - Roche shareholders 7,784 1,817 453 255 21 284 22 10,636 - Non-controlling interests 726 -50 13 0 0 0 -8 681
8,510 1,767 466 255 21 284 14 11,317
Earnings per share 9.02 2.12 0.53 0.30 0.02 0.33 0.03 12.34
Core 2004 definition - Net income attrib. Roche s/holders 7,784 1,817 453 255 0 197 0 10,506 - EPS 9.02 2.12 0.53 0.30 0.00 0.23 0.00 12.19

14
Overview
IFRS income statement presentation
Core Results concept
Appendix 1: Equity Compensation Plans - tax effects
Appendix 2: Draft Core Results FY 2009 and HY 2010

15
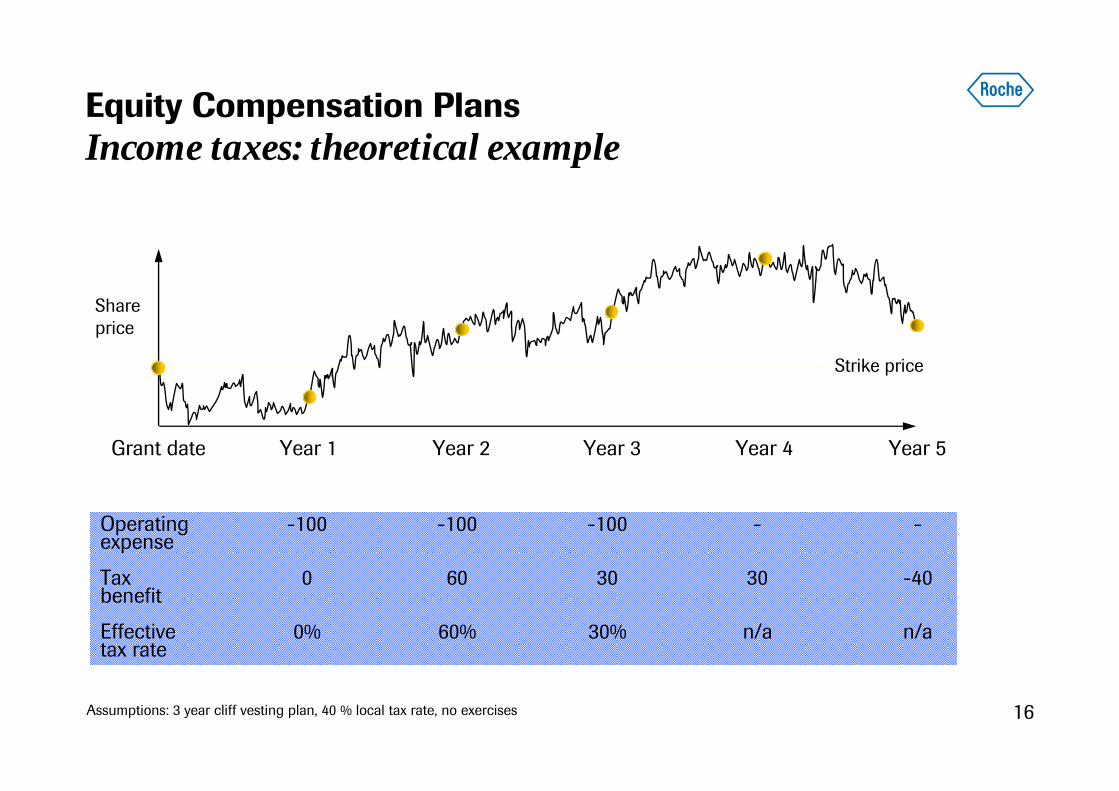
Operating expense is fixed
• Operating expense is fixed at grant date and spread over vesting period, but …
Tax benefit is variable
• Tax benefit variable (depending on market price) and booked until exercise
- Tax benefit can be zero (if option out-of-money)
- Tax benefit can include catch-up from prior periods
- Overall cap on tax benefit (operating expense multiplied by tax rate)
- Tax impacts last beyond vesting until exercise
Equity Compensation PlansIncome taxes: main principles
16
Shareprice
Grant date Year 1 Year 2 Year 3 Year 4 Year 5
Operating -100 -100 -100 - -expense
Tax 0 60 30 30 -40benefit
Effective 0% 60% 30% n/a n/atax rate
Strike price
Equity Compensation PlansIncome taxes: theoretical example
Assumptions: 3 year cliff vesting plan, 40 % local tax rate, no exercises

17
Genentech equity compensation plans: tax effects
4%
8
(198)
HY ’07USD m
10%
41
(407)
FY '06USD m
-2%11%40%58%Effective tax rate
(9)239961Tax benefit
(387)(208)(245)(105)Operating profit
FY '07USD m
HY ‘06USD m
FY ‘05USD m
HY ‘05USD m
Equity Compensation Plans Income taxes: Example from 2007 results

18
Major Roche Group equity compensation plans: tax effects
-31%30%33%Normalised tax rate
-499157Normalised tax benefit
-
-
-
FY ‘10CHF m
4%25%28%Effective tax rate
67849Reported tax benefit
(157)(308)(174)Operating profit
HY ‘10CHF m
FY ‘09CHF m
HY ‘09CHF m
Equity Compensation Plans Income taxes: current situation 2009-2010
Draft – subject to review and audit
19
Overview
IFRS income statement presentation
Core Results concept
Appendix 1: Equity Compensation Plans - tax effects
Appendix 2: Draft Core Results FY 2009 and HY 2010

20
Draft Core Results Annual 2009 Core Results (Roche Group)
Draft – subject to review and audit
IFRS Non-Core items Core
Restated
Global restructuring -
Genentech
Intangible assets -
amortisation
Intangible assets -
impairment
Alliances & Business
CombinationsLegal & Environ-
mental
Normalisation of ECP tax expense
CHFm CHFm CHFm CHFm CHFm CHFm CHFm CHFm
Sales 49,051 0 0 0 0 0 0 49,051Royalties and other operating income 2,100 0 0 0 0 0 0 2,100Cost of sales -14,615 0 669 57 0 0 0 -13,889Marketing and distribution -9,475 0 3 0 0 0 0 -9,472Research and development -9,874 0 40 325 0 0 0 -9,509General and administration -4,910 2,415 0 0 30 455 0 -2,010Operating profit 12,277 2,415 712 382 30 455 0 16,271
Associates 0 0 0 0 0 0 0 0Financial income 554 238 0 0 0 0 0 792Financing costs -2,599 139 0 0 0 0 0 -2,460Profit before taxes 10,232 2,792 712 382 30 455 0 14,603
Income taxes -1,722 -1,025 -246 -127 -9 -171 14 -3,286Net income 8,510 1,767 466 255 21 284 14 11,317
Attributable to - Roche shareholders 7,784 1,817 453 255 21 284 22 10,636 - Non-controlling interests 726 -50 13 0 0 0 -8 681
8,510 1,767 466 255 21 284 14 11,317
Earnings per share 9.02 2.12 0.53 0.30 0.02 0.33 0.03 12.34
Core 2004 definition - Net income attrib. Roche s/holders 7,784 1,817 453 255 0 197 0 10,506 - EPS 9.02 2.12 0.53 0.30 0.00 0.23 0.00 12.19
21
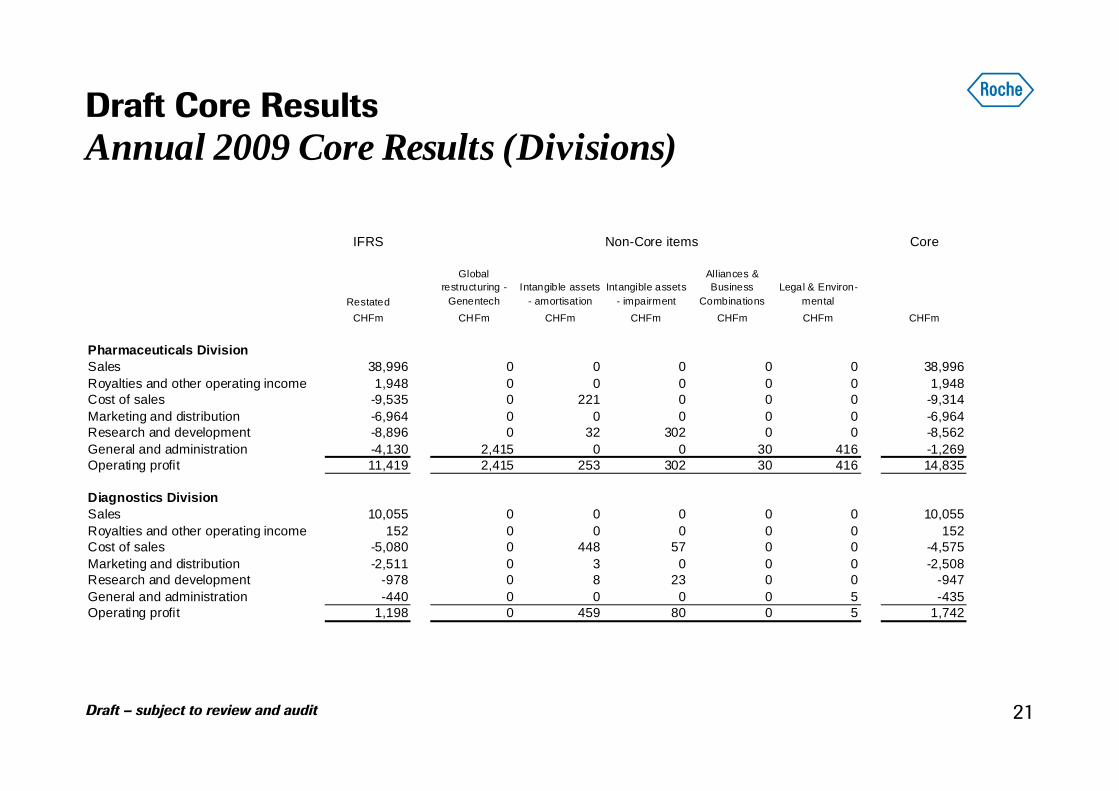
Draft Core Results Annual 2009 Core Results (Divisions)
Draft – subject to review and audit
IFRS Non-Core items Core
Restated
Global restructuring -
GenentechIntangible assets
- amortisationIntangible assets
- impairment
Alliances & Business
CombinationsLegal & Environ-
mentalCHFm CHFm CHFm CHFm CHFm CHFm CHFm
Pharmaceuticals DivisionSales 38,996 0 0 0 0 0 38,996Royalties and other operating income 1,948 0 0 0 0 0 1,948Cost of sales -9,535 0 221 0 0 0 -9,314Marketing and distribution -6,964 0 0 0 0 0 -6,964Research and development -8,896 0 32 302 0 0 -8,562General and administration -4,130 2,415 0 0 30 416 -1,269Operating profit 11,419 2,415 253 302 30 416 14,835
Diagnostics DivisionSales 10,055 0 0 0 0 0 10,055Royalties and other operating income 152 0 0 0 0 0 152Cost of sales -5,080 0 448 57 0 0 -4,575Marketing and distribution -2,511 0 3 0 0 0 -2,508Research and development -978 0 8 23 0 0 -947General and administration -440 0 0 0 0 5 -435Operating profit 1,198 0 459 80 0 5 1,742

22
Draft Core Results Interim 2010 Core Results (Roche Group)
Draft – subject to review and audit
IFRS Non-Core items Core
Restated
Global restructuring -
Genentech
Intangible assets -
amortisation
Intangible assets -
impairment
Alliances & Business
CombinationsLegal & Environ-
mental
Normalisation of ECP tax expense
CHFm CHFm CHFm CHFm CHFm CHFm CHFm CHFm
Sales 24,636 0 0 0 0 0 0 24,636Royalties and other operating income 878 0 0 0 0 0 0 878Cost of sales -6,870 0 297 0 0 0 0 -6,573Marketing and distribution -4,546 0 2 0 0 0 0 -4,544Research and development -4,471 0 12 102 0 0 0 -4,357General and administration -1,149 278 0 0 3 -13 0 -881Operating profit 8,478 278 311 102 3 -13 0 9,159
Associates 0 0 0 0 0 0 0 0Financial income 302 0 0 0 0 0 0 302Financing costs -1,508 0 0 0 0 0 0 -1,508Profit before taxes 7,272 278 311 102 3 -13 0 7,953
Income taxes -1,707 -93 -102 -33 -1 4 43 -1,889Net income 5,565 185 209 69 2 -9 43 6,064
Attributable to - Roche shareholders 5,468 185 209 69 2 -9 43 5,967 - Non-controlling interests 97 0 0 0 0 0 0 97
5,565 185 209 69 2 -9 43 6,064
Earnings per share 6.37 0.22 0.24 0.08 0.00 -0.01 0.05 6.95
Core 2004 definition - Net income attrib. Roche s/holders 5,468 185 209 69 0 0 0 5,931 - EPS 6.37 0.22 0.24 0.08 0.00 0.00 0.00 6.91

23
Draft Core Results Interim 2010 Core Results (Divisions)
Draft – subject to review and audit
IFRS Non-Core items Core
Restated
Global restructuring -
GenentechIntangible assets
- amortisationIntangible assets
- impairment
Alliances & Business
CombinationsLegal & Environ-
mentalCHFm CHFm CHFm CHFm CHFm CHFm CHFm
Pharmaceuticals DivisionSales 19,386 0 0 0 0 0 19,386Royalties and other operating income 784 0 0 0 0 0 784Cost of sales -4,369 0 80 0 0 0 -4,289Marketing and distribution -3,292 0 0 0 0 0 -3,292Research and development -4,036 0 10 102 0 0 -3,924General and administration -742 278 0 0 0 -13 -477Operating profit 7,731 278 90 102 0 -13 8,188
Diagnostics DivisionSales 5,250 0 0 0 0 0 5,250Royalties and other operating income 94 0 0 0 0 0 94Cost of sales -2,501 0 217 0 0 0 -2,284Marketing and distribution -1,254 0 2 0 0 0 -1,252Research and development -435 0 2 0 0 0 -433General and administration -207 0 0 0 3 0 -204Operating profit 947 0 221 0 3 0 1,171

24
We Innovate Healthcare