Embed Size (px)
Citation preview
CORE STRATEGY SUSTAINABILITY APPRAISAL -
SCOPING REPORT
(Revised to reflect consultation responses)
JULY 2008

Cheltenham Core Strategy Sustainability Appraisal Scoping report - January 2008 1
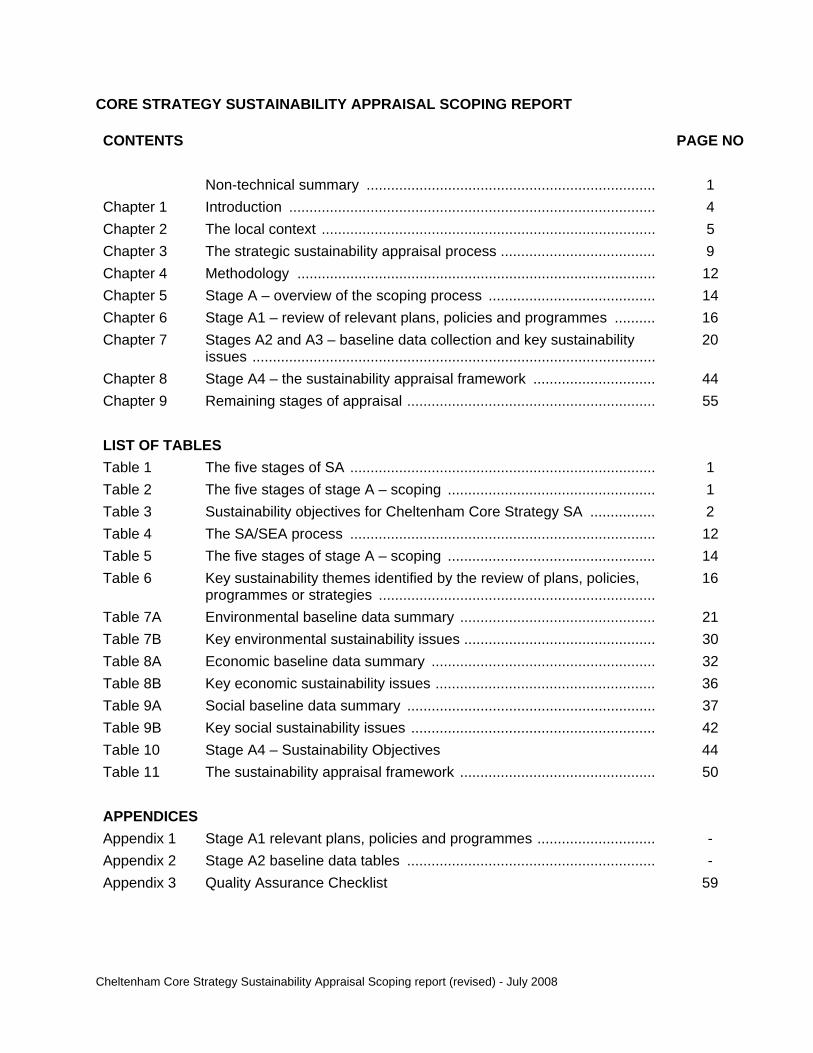
CORE STRATEGY SUSTAINABILITY APPRAISAL SCOPING REPORT CONTENTS PAGE NO Non-technical summary ....................................................................... 1 Chapter 1 Introduction .......................................................................................... 4 Chapter 2 The local context .................................................................................. 5 Chapter 3 The strategic sustainability appraisal process ...................................... 9 Chapter 4 Methodology ........................................................................................ 12 Chapter 5 Stage A – overview of the scoping process ......................................... 14 Chapter 6 Stage A1 – review of relevant plans, policies and programmes .......... 16 Chapter 7 Stages A2 and A3 – baseline data collection and key sustainability
issues ...................................................................................................20
Chapter 8 Stage A4 – the sustainability appraisal framework .............................. 44 Chapter 9 Remaining stages of appraisal ............................................................. 55 LIST OF TABLES Table 1 The five stages of SA ........................................................................... 1 Table 2 The five stages of stage A – scoping ................................................... 1 Table 3 Sustainability objectives for Cheltenham Core Strategy SA ................ 2 Table 4 The SA/SEA process ........................................................................... 12 Table 5 The five stages of stage A – scoping ................................................... 14 Table 6 Key sustainability themes identified by the review of plans, policies,
programmes or strategies ....................................................................16
Table 7A Environmental baseline data summary ................................................ 21 Table 7B Key environmental sustainability issues ............................................... 30 Table 8A Economic baseline data summary ....................................................... 32 Table 8B Key economic sustainability issues ...................................................... 36 Table 9A Social baseline data summary ............................................................. 37 Table 9B Key social sustainability issues ............................................................ 42 Table 10 Stage A4 – Sustainability Objectives 44 Table 11 The sustainability appraisal framework ................................................ 50 APPENDICES Appendix 1 Stage A1 relevant plans, policies and programmes ............................. - Appendix 2 Stage A2 baseline data tables ............................................................. - Appendix 3 Quality Assurance Checklist 59
Cheltenham Core Strategy Sustainability Appraisal Scoping report (revised) - July 2008

Cheltenham Core Strategy Sustainability Appraisal Scoping report (revised) - July 2008
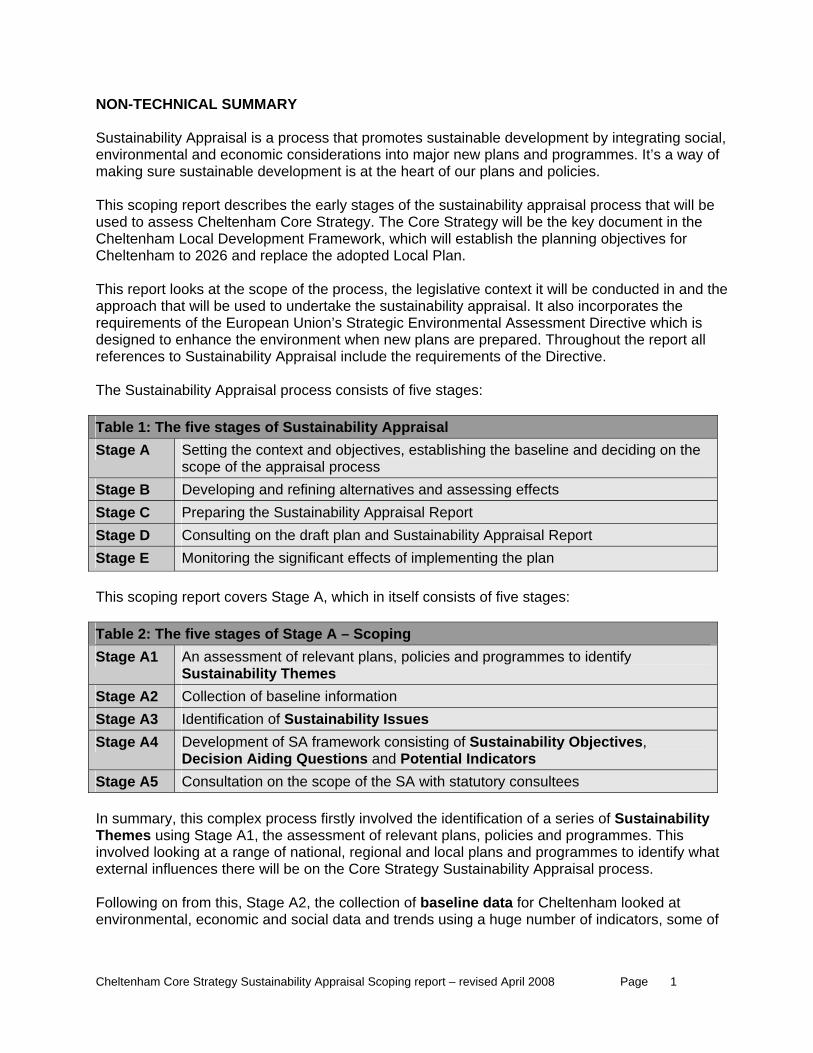
NON-TECHNICAL SUMMARY Sustainability Appraisal is a process that promotes sustainable development by integrating social, environmental and economic considerations into major new plans and programmes. It’s a way of making sure sustainable development is at the heart of our plans and policies. This scoping report describes the early stages of the sustainability appraisal process that will be used to assess Cheltenham Core Strategy. The Core Strategy will be the key document in the Cheltenham Local Development Framework, which will establish the planning objectives for Cheltenham to 2026 and replace the adopted Local Plan. This report looks at the scope of the process, the legislative context it will be conducted in and the approach that will be used to undertake the sustainability appraisal. It also incorporates the requirements of the European Union’s Strategic Environmental Assessment Directive which is designed to enhance the environment when new plans are prepared. Throughout the report all references to Sustainability Appraisal include the requirements of the Directive. The Sustainability Appraisal process consists of five stages: Table 1: The five stages of Sustainability Appraisal
Setting the context and objectives, establishing the baseline and deciding on the Stage A scope of the appraisal process Developing and refining alternatives and assessing effects Stage B Preparing the Sustainability Appraisal Report Stage C Consulting on the draft plan and Sustainability Appraisal Report Stage D Monitoring the significant effects of implementing the plan Stage E
This scoping report covers Stage A, which in itself consists of five stages: Table 2: The five stages of Stage A – Scoping
An assessment of relevant plans, policies and programmes to identify Stage A1 Sustainability Themes Collection of baseline information Stage A2 Identification of Sustainability Issues Stage A3 Development of SA framework consisting of Sustainability Objectives, Stage A4 Decision Aiding Questions and Potential Indicators Consultation on the scope of the SA with statutory consultees Stage A5
In summary, this complex process firstly involved the identification of a series of Sustainability Themes using Stage A1, the assessment of relevant plans, policies and programmes. This involved looking at a range of national, regional and local plans and programmes to identify what external influences there will be on the Core Strategy Sustainability Appraisal process. Following on from this, Stage A2, the collection of baseline data for Cheltenham looked at environmental, economic and social data and trends using a huge number of indicators, some of
Cheltenham Core Strategy Sustainability Appraisal Scoping report – revised April 2008 Page 1
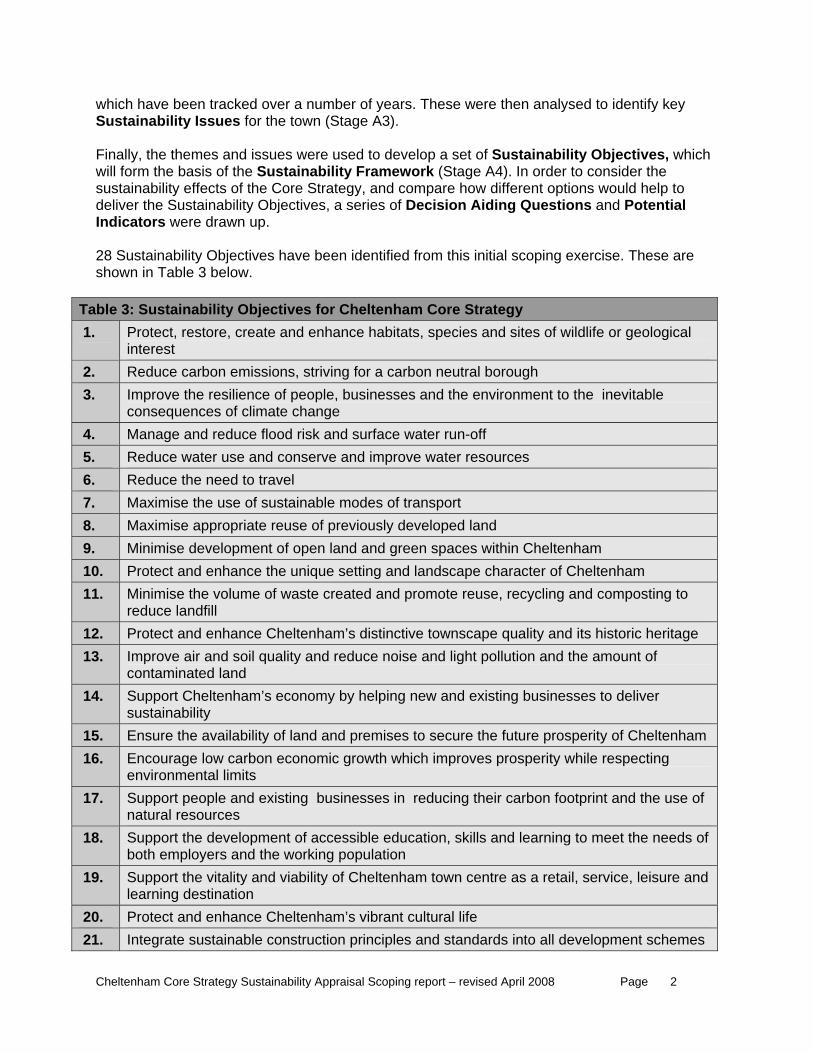
which have been tracked over a number of years. These were then analysed to identify key ustainability Issues for the town (Stage A3).
ider the ustainability effects of the Core Strategy, and compare how different options would help to
initial scoping exercise. These are hown in Table 3 below.
S Finally, the themes and issues were used to develop a set of Sustainability Objectives, which will form the basis of the Sustainability Framework (Stage A4). In order to conssdeliver the Sustainability Objectives, a series of Decision Aiding Questions and Potential Indicators were drawn up. 28 Sustainability Objectives have been identified from this s
Table 3: Sustainability Objectives for Cheltenham Core Strategy Protect, restore, create and enhance habitats, species and sites of wildlife or geological
interest 1.
Reduce carbon emissions, striving for a carbon neutral borough 2. Improve the resilience of people, businesses and the environment to the inevitable 3.
consequences of climate change 4. Manage and reduce flood risk and surface water run-off 5. Reduce water use and conserve and improve water resources 6. Reduce the need to travel 7. Maximise the use of sustainable modes of transport 8. Maximise appropriate reuse of previously developed land 9. Minimise nham development of open land and green spaces within Chelte
Protect and enhance the unique setting and landscape character of Cheltenham 10. 11. Minimise the volume of waste created and promote reuse, recycling and composting to
reduce landfill 12. Protect and enhance Cheltenham’s distinctive townscape quality and its historic heritage 13. Improve of air and soil quality and reduce noise and light pollution and the amount
contaminated land 14. Support new and existing businesses to deliver Cheltenham’s economy by helping
sustainability 15. Ensure ltenham the availability of land and premises to secure the future prosperity of Che
Encoura ity while respecting ge low carbon economic growth which improves prosperenviro
16. nmental limits
Support people and existing businesses in reducing their carbon footprint and the use of 17. natural resources
18. Support the development of accessible education, skills and learning to meet the needs of both employers and the working population
Support the vitality and viability of Cheltenham town centre as a retail, service, leisure and 19.learning destination
20. Protect and enhance Cheltenham’s vibrant cultural life Integrate sustainable construction principles and standards into all development schemes 21.
Cheltenham Core Strategy Sustainability Appraisal Scoping report – revised April 2008 Page 2
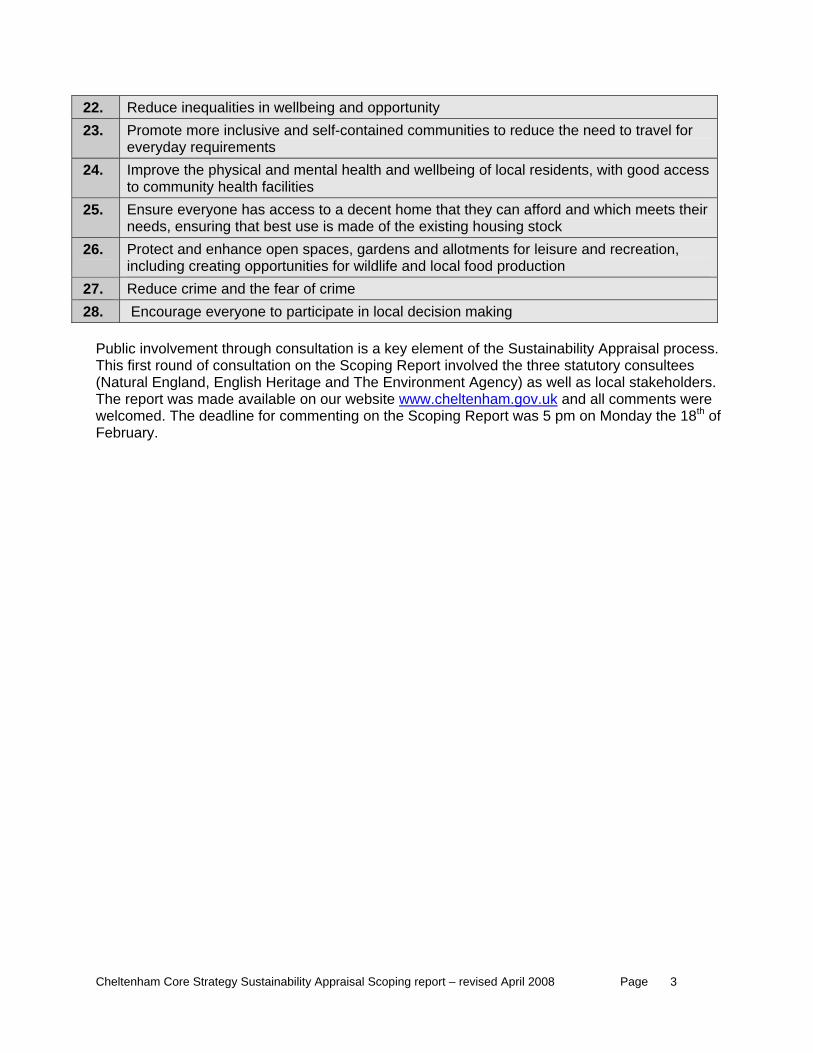
22. Reduce inequalities in wellbeing and opportunity Promote more inclusive and self-contained communities to reduce the need to travel for 23.
everyday requirements 24. Improve the physical and mental health and wellbeing of local residents, with good access
to community health facilities 25. Ensure everyone has access to a decent home that they can afford and which meets their
needs, ensuring that best use is made of the existing housing stock 26. Protect and enhance open spaces, gardens and allotments for leisure and recreation,
including creating opportunities for wildlife and local food production Reduce crime and the fear of crime 27.
28. Encourage everyone to participate in local decision making Public involvement through consultation is a key element of the Sustainability Appraisal process.
e statutory consultees
This(Nat
first round of consultation on the Scoping Report involved the threural England, English Heritage and The Environment Agency) as well as local stakeholders.report was made available on our website The www.cheltenham.gov.uk and all commentsomed. The deadline for commentin
were welc g on the Scoping Report was 5 pm on Monday the 18th of February.
Cheltenham Core Strategy Sustainability Appraisal Scoping report – revised April 2008 Page 3
CHA
gh Sustainability Appraisal of the Cheltenham’s Core Strategy
Cheltenham.
es
l Assessment have inability Appraisal.
ion with the three
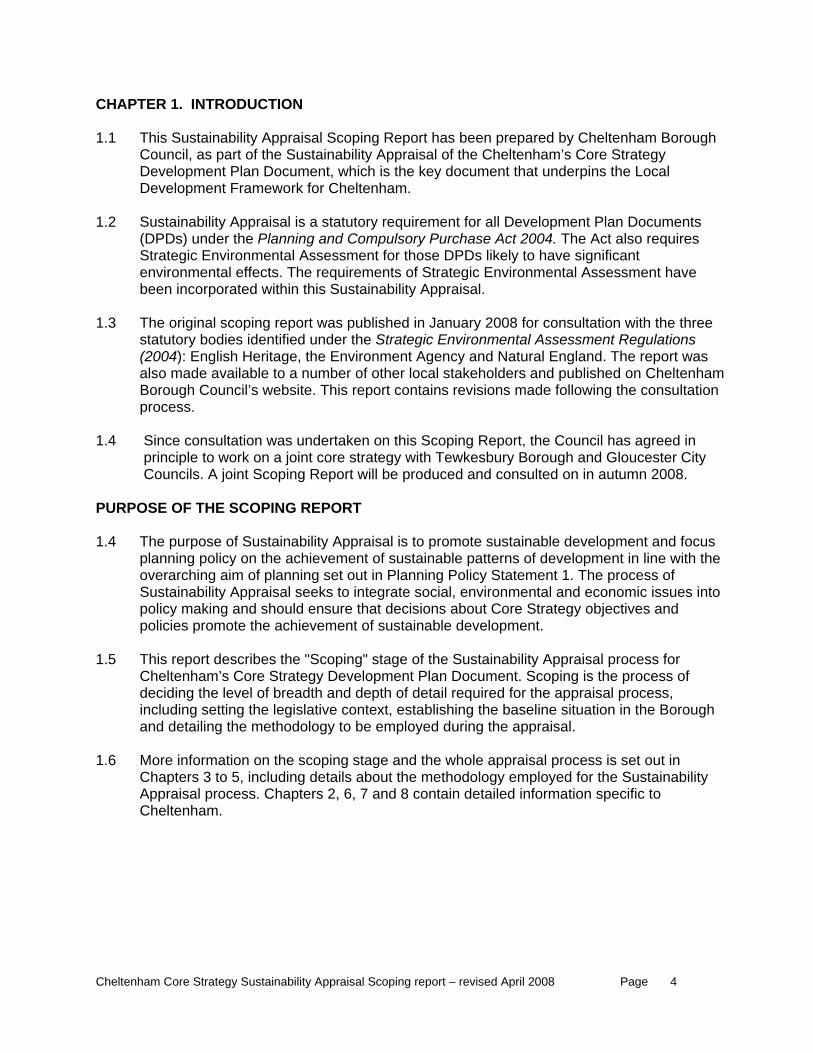
e consultation was undertaken on this Scoping Report, the Council has agreed in principle to work on a joint core strategy with Tewkesbury Borough and Gloucester City Councils. A joint Scoping Report will be produced and consulted on in autumn 2008. PURPOSE OF THE SCOPING REPORT 1.4 The purpose of Sustainability Appraisal is to promote sustainable development and focus
planning policy on the achievement of sustainable patterns of development in line with the overarching aim of planning set out in Planning Policy Statement 1. The process of Sustainability Appraisal seeks to integrate social, environmental and economic issues into policy making and should ensure that decisions about Core Strategy objectives and policies promote the achievement of sustainable development.
1.5 This report describes the "Scoping" stage of the Sustainability Appraisal process for
Cheltenham’s Core Strategy Development Plan Document. Scoping is the process of deciding the level of breadth and depth of detail required for the appraisal process, including setting the legislative context, establishing the baseline situation in the Borough and detailing the methodology to be employed during the appraisal.
1.6 More information on the scoping stage and the whole appraisal process is set out in
Chapters 3 to 5, including details about the methodology employed for the Sustainability Appraisal process. Chapters 2, 6, 7 and 8 contain detailed information specific to Cheltenham.
PTER 1. INTRODUCTION 1.1 This Sustainability Appraisal Scoping Report has been prepared by Cheltenham Borou
Council, as part of the Development Plan Document, which is the key document that underpins the Local Development Framework for
1.2 Sustainability Appraisal is a statutory requirement for all Development Plan Documents
(DPDs) under the Planning and Compulsory Purchase Act 2004. The Act also requirStrategic Environmental Assessment for those DPDs likely to have significant environmental effects. The requirements of Strategic Environmentabeen incorporated within this Susta
.31 The original scoping report was published in January 2008 for consultat
statutory bodies identified under the Strategic Environmental Assessment Regulations (2004): English Heritage, the Environment Agency and Natural England. The report was also made available to a number of other local stakeholders and published on CheltenhamBorough Council’s website. This report contains revisions made following the consultation process.
1.4 Sinc
Cheltenham Core Strategy Sustainability Appraisal Scoping report – revised April 2008 Page 4
CHAPTER 2. THE LOCAL CONTEXT
on of
.2 Cheltenham is well connected to national and regional transport infrastructure. The M5 es
rally
signation covers some 22% of the Borough, while 17% of land is designated as green belt. The town itself nestles against the Cotswold’s escarpment and serves as a
.4 C examples of Regency architecture and is justly famous for its public squares and gardens.
vation areas and has over 2,600 listed buildings.
raft
egy w homes and 10,000 new
jobs in the period to 2026. Such expansion is not going to be possible within the ration
d Gloucester City Councils.
.6 Cheltenham Borough Council signed the Nottingham Declaration in 2002 to express its commitment to tackling climate change. Working with a broad stakeholder board, the Council published Climate Change – A Strategy for Cheltenham in 2005. The overarching aim of the strategy is to make Cheltenham a carbon neutral Borough. This aspiration has been embedded in successive community strategies and the Council’s corporate strategic framework.
2.1 Cheltenham Borough is a predominately urban local authority nestling in the foothills of the
Cotswolds in the north east of the South West Region. The Borough has a populatijust over 110,000, the majority of whom live within the urban area of Cheltenham.
2
passes directly to the west of the Borough while a mainline station provides direct servicto London, Bristol and Birmingham. Cheltenham and neighbouring Gloucester are, as a result, attractive areas for business locations. Consequentially, the area is geneaffluent - although there are pockets of deprivation and housing can be extremely expensive.
NATURAL AND BUILT ENVIRONMENT 2.3 Cheltenham has an attractive and distinctive natural and built environment. It is encircled
by designated protected land with the Cotswolds Area of Outstanding Natural Beauty to the east and south, and green belt to the west and north. The Area of Outstanding Natural Beauty de
gateway and service centre. 2 heltenham’s built environment is highly regarded. The town centre contains many fine
The town contains 7 distinct conser PLANNING CONTEXT 2.5 Cheltenham is one of 21 Strategically Significant Cities and Towns identified in the d
Regional Spatial Strategy (RSS) for the South West and acts as a centre for tourism and retailing within Gloucestershire and the wider region. The draft Regional Spatial Stratoutlines future growth for Cheltenham in the region of 13,800 ne
administrative boundary of the Borough and is likely to require cross-boundary coopewith Tewkesbury Borough Council and other local authorities.
2.6 Since consultation was undertaken on this Scoping Report, the Council has agreed in principle to work on a joint core strategy with Tewkesbury Borough an CLIMATE CHANGE AND SUSTAINABILITY 2
Cheltenham Core Strategy Sustainability Appraisal Scoping report – revised April 2008 Page 5
2.7 Our Future, Our Choice - Cheltenham’s Sustainable Community Strategy 2008-11 is based on the principles of community engagement and participation, tackling inequalities and
‘deliver a sustainable quality of life, where people, families, their communities and es
for nd coordinated action over the next 20 years, through both partnership working
and implementing the Local Development Framework:
• Promoting community safety;
transport;
Development Plan Document will be the key document that underpins ment Framework for Cheltenham. It will establish a long term vision for
ing to the Borough’s future
is "land-use" planning brought about by the Planning and Compulsory
Purchase Act of 2004. In line with government guidance, and in light of its wider remit, the and comprehensive evidence base and therefore a ommissioned.
promoting cohesion, and tackling climate change. The Sustainable Community Strategy contains a vision for Cheltenham to:
businesses thrive; and in a way which cherishes our cultural and natural heritage, reducour impact on climate change and does not compromise the quality of life of present and future generations.’
2.8 Having consulted widely with the community, the following priorities were identified
concerted a
• Promoting sustainable living; • Promoting a strong and sustainable economy; • Building healthy communities and supporting older people; • Building stronger communities and supporting housing choice; • A focus on children and young people; Investing in environmental quality; • Investing in travel and • Investing in arts and culture.
THE CORE STRATEGY 2.9 The Core Strategy
the Local Developthe development of the Borough to 2026, reflecting the vision and aims of the SustainableCommunities Strategy. It will also define a set of clear strategic objectives and the spatial arrangement of planned development to deliver the vision.
2.10 The Core Strategy will include a spatial strategy, strategic planning policies and an
implementation framework with clear objectives for achieving delivery of the vision. The Core Strategy will also integrate with national and regional plans as well as local non-planning strategies to ensure that it can address all issues relatand not be constrained to issues of land-use.
2.11 The Core Strategy will be a "spatial" planning document, reflecting the change in emphas
away from merely
Strategy will be based on an up to date number of technical studies have been c
2.12 Since consultation was undertaken on this Scoping Report, the Council has agreed in principle to work on a joint core strategy with Tewkesbury Borough and Gloucester City Councils.
Cheltenham Core Strategy Sustainability Appraisal Scoping report – revised April 2008 Page 6
EVIDENCE BASE 2.12 A significant part of the evidence base for the Core Strategy and for this Sustainability
Appraisal process has been and will be generated by topic specific studies that have been ugh Council and its partners. These studies include:
•
o assessment of the leisure and entertainment facilities of Cheltenham
within the context of the sub regional role of Cheltenham as a Strategically Significant City
rtners were appointed to take forward a review of employment land in terms of policy, existing sites and the likely
pulled together work already undertaken by the ly commissioned research into a coherent
and its Sustainability Appraisal.
t of the aration of the Core Strategy. The review was
ndscape Character Assessment. The Gloucestershire Landscape haracter assessment of the Severn Vale,
ary 2006.
en e
ssments are expected to be completed in mid 2008.
re Strategy. The 2007 survey was completed in August 2007.
• in house. It seeks to identify and assess all potential sources of housing
supply, including Greenfield sites, within Cheltenham Borough to ensure that Cheltenham has a potential supply of appropriate land for housing over the Local Development Framework period. The Housing Land Availability Assessment is expected to be completed by winter 2007/08.
commissioned by Cheltenham Boro
Retail and Leisure Study. Undertaken on behalf of the Borough Council by consultants DPDS. The study assess comparison and convenience retail floorspace requirements up t2016 and includes an
and Town. The study was completed in December 2006.
• Employment Land Review. Nathaniel Lichfield and Pa
requirements for new sites. The reviewBorough and County Councils and newdocument that can be used to inform the Core StrategyThe review was completed in 2007.
• Green Belt Review. AERC were appointed to provide an independent assessmenCheltenham Green Belt to inform the prepcompleted in March 2007.
• Gloucestershire La
Character Assessment comprises a landscape cthe Upper Thames Valley area and the land on the northern fringe of the Cotswolds AONBwithin the Vale of Moreton and Vale of Evesham and completes a detailed review of Gloucestershire's landscape character. The purpose of the Gloucestershire Landscape Character Assessment is to observe, analyse, describe and classify these variations and distinctive patterns. The assessment was completed in Janu
• Comparative Site Assessment. The Comparative Site Assessment process has be
undertaken in house. It will inform the Sustainability Appraisal process as well as the CorStrategy and future documents within the Local Development Framework. The assessments are based upon a standard methodology to ensure that a consistent approach is adopted across all sites. The asse
• Residential Land Availability Survey. The Residential Land Availability Survey is
undertaken annually in-house and monitors the availability of land for residential development within Cheltenham Borough. The survey monitors the delivery of housing against the strategic requirement and will inform the Co
Housing Land Availability Assessment. The Housing Land Availability Assessment is being undertaken
Cheltenham Core Strategy Sustainability Appraisal Scoping report – revised April 2008 Page 7
• Housing Market Assessment. Fordham Research Group has been commissioned to
rive
to develop a good understanding of housing markets, particularly in terms of their
sport modelling work is ongoing.
City o
police,
s of Cheltenham in consultation work undertaken ummer 2006. The project will also consider the requirements of adjacent areas and
bility Appraisal of future Local Development Documents. The study is expected to be completed winter 08/09.
tain a ide
s f the key areas and
wildlife corridors and recommendations for prioritised sites within the Council’s ownership. in
ta and mapping for the Borough and will inform the Comparative Site Assessment process and the Core Strategy. The assessment will also address some
l. ailable, gaps have been identified in this Scoping Report to
enable future updates.
ring
produce a Housing Market Assessment for Gloucestershire. Its purpose is to seek to defigures for housing need and demand within local authority areas and determine what this might mean in terms of market and affordable housing provision. It also allows authorities
characteristics and the drivers of market change. The Housing Market Assessment is expected to be completed winter 2007/08
• Transport Modelling. Strategic sites identified via the Comparative Site Assessment will be subject to further analysis via transport modelling. Tran
• Development and Community Planning Research Project. A joint research project funded by Cheltenham Borough Council, Tewkesbury Borough Council, Gloucester Council, Gloucestershire Housing Association and Gloucestershire Primary Care Trust tresearch the broader requirements of new developments, including health, leisure,community, allotments, green infrastructure, economic and social facilities, reflecting the issues highlighted by the communitiesexisting communities. This will inform Cheltenham and Tewkesbury’s Local Development Framework to support new growth over the next 20 years. It will also provide useful information for the Sustaina
• Green Space Strategy. The Green Space Strategy will provide an assessment of green
spaces and outdoor recreational and sporting facilities in the Borough, in accordance withthe guidelines set out in Planning Policy Guidance Note 17. It will also conbiodiversity audit carried out by Middlemarch Environmental Ltd. which will provguidance on the potential distribution of, protected species, UK priority habitats & specieand habitats & species identified within the Borough, the function o
The strategy will also look at play space provision. The strategy should be completed2008.
• Strategic Flood Risk Assessment. A Gloucestershire wide Strategic Flood Risk Assessment is being undertaken by Halcrow. The assessment will provide much needed flooding da
evidence gaps within the Sustainability Appraisal process. The Strategic Flood Risk Assessment is expected to be completed spring 2008.
2.13 All of these reports will inform the Core Strategy and its associated Sustainability Appraisa
Where this data is not yet av
2.14 The Core Strategy will also draw on evidence gathered as a result of community
consultation conducted in parallel with consultation on the Sustainable Community Strategy. This consultation – under the title Cheltenham 2020 – was undertaken du2006 and its results are available on the Council’s website.
Cheltenham Core Strategy Sustainability Appraisal Scoping report – revised April 2008 Page 8
CHAP R 3. THE SUSTAINABILITY APPRAISAL PROCESS
hodology
thodology will also incorporate Equalities Impact ssessment, Health Impact Assessment and a screening judgement on the need for
THE S RATEGIC ENVIRONMENTAL ASSESSMENT DIRECTIVE
C tal
t out in Planning Policy Statement 1 – Delivering Sustainable Development and Planning Policy Statement 12 – Local
pment Frameworks (Office of the Deputy Prime Minister, November 2005) – mends that the requirements of the Strategic Environmental Assessment Directive
all Local
as in
scope to cover social and
ssessment as recommended by government
TE 3.1 In order to ensure that the core strategy promotes sustainable development and does not
encourage harmful impacts on the environment, it will be subject to a Sustainability Appraisal, incorporating Strategic Environmental Assessment. To ensure that these processes are conducted as efficiently as possible, an Integrated Assessment methas been developed that addresses the level of depth and breadth required by the twoprocesses. The integrated assessment meAHabitats Regulation Assessment.
T
3.2 The Strategic Environmental Assessment process is designed to evaluate the potential
environmental consequences of proposed policies, plans or programmes and ensure that environmental issues are fully integrated into the policy making process. Strategic Environmental Assessments were introduced by the European Union Directive 2001/42/Eand transposed into English law by Statutory Instrument 1633 of 2004 - the EnvironmenAssessment of Plans and Programmes Regulations.
SUSTAINABILITY APPRAISAL 3.3 The requirement for Sustainability Appraisal is se
Development Frameworks. The requirement is formalised in Statutory Instrument 2204 of 2004 - The Town and Country Planning (Local Development) (England) Regulations 2004, which states that a Sustainability Appraisal Report must accompany all Local Development Documents at adoption.
INTEGRATED ASSESSMENT 3.4 Government guidance Sustainability Appraisal of Regional Spatial Strategies and Local
Develocomre
be combined with Sustainability Appraisal to allow for a single appraisal process ofDevelopment Documents.
3.5 The integrated process that has been established for the Cheltenham’s Core Strategy,
described in this report, is intended to fulfil the requirements of the Directive by lookingdepth at the effect on the environment of implementing the Core Strategy and the requirement for Sustainability Appraisal by expanding its economic issues.
3.6 It is also intended that the appraisal process for the Core Strategy includes an Equality
Impact Assessment and a Health Impact Aguidance.
Cheltenham Core Strategy Sustainability Appraisal Scoping report – revised April 2008 Page 9

EQUALITY IMPACT ASSESSMENT 3.7 Equality Impact Assessments are a specific requirement of the Race Relations
(Amendment) Act 2000 and the Equality Standard for Local Government, which placgeneral and specific duties on public authorities to promote race equality and prevenunlawful discrimination. The requirement to promote equality of opportunity is also promoted through the Disability Discrimination Act 2005.
3.8 An Equality Impact Assessment is a way of systematically and thoroughly assessing,
consulting on, the effects that a pro
e t
and posed policy is likely to have on people, depending on
ethnicity, age, gender, sexual orientation, disability and religion.
.9 Although we have a legal duty to conduct Equality Impact Assessment, they can also be an
llect information to give us feedback on policies and monitor their impact.
ore
role of Equality Impact Assessment is to test whether the objectives derived within the Sustainability Appraisal Framework will apply equally to all
not prejudice any groups or single out any sections of society. The Scoping Report has been subject to consultation with a variety of local stakeholders
t a
lity Impact Assessment, it is considered that an integrated Health Impact Assessment incorporated within the Sustainability Appraisal process can be used
3.13 At the scoping stage, the role of Health Impact Assessment is to test whether the objectives derived within the Sustainability Appraisal Framework are not prejudicial to improving the health of the community and will assist in maximising potential health benefits arising from the implementation of the Core Strategy.
3
improvement tool that can have many benefits, including:
• ensuring policies and services have the best possible impact on our communities;
• providing evidence to show that policies and services do not have any adverse impact on different groups within the community and are not discriminating in any way;
• making sure that policies do not overlook or exclude any groups; and
• setting out the way to co
3.10 We intend to use Equality Impact Assessment to ensure that the policies of the C
Strategy will not discriminate and do all they can to promote equality and good relations between different groups.
3.11 At the scoping stage, the
sections of society and do
and the Council’s internal equalities assessor. The Core Strategy will be assessed usingthe Council’s adopted Equality Impact Assessment Toolkit and the result of this assessment will be reported in the Sustainability Appraisal Report.
HEALTH IMPACT ASSESSMENT 3.12 Health Impact Assessment is a non-statutory process that uses a range of methods and
approaches to help identify and consider the likely health impacts of a proposed policy on the population. As yet, there is no statutory requirement to conduct a Health ImpacAssessment of the Core Strategy, although further guidance is awaited. However, insimilar way to Equa
as a tool in ensuring that the Core Strategy maximises its potential in terms of improvingthe health and well-being of the community.
Cheltenham Core Strategy Sustainability Appraisal Scoping report – revised April 2008 Page 10
HABITATS REGULATION ASSESSMENT
ality o
.15 It is a requirement of the European Habitats Directive 92/43 that any plan or project that is
3.14 In addition to Sustainability Appraisal, Strategic Environmental Assessment, Equ
Impact Assessment and Health Impact Assessment, the Core Strategy is also subject tHabitats Regulations Assessment under the European Union Habitats Directive with respect to its potential effect on European designated Natura 2000 sites.
3
likely to have a significant effect on a European designated site, such as a Special Area of Conservation, must be subject to an Appropriate Assessment.
3.16 Cheltenham Borough does not contain any European designated sites and the closest sites
to the Borough are over 5 Km away. It is considered that the Core Strategy would not have a significant effect on these designated sites and that the need for Appropriate Assessment can be screened out at the scoping stage.
3.17 Since consultation was undertaken on this Scoping Report, the Council has agreed in
principle to work on a joint core strategy with Tewkesbury Borough and Gloucester City Councils. A joint Scoping Report will be produced and this will include a revised screening judgement on the need for Appropriate Assessment of the Joint Core Strategy.
Cheltenham Core Strategy Sustainability Appraisal Scoping report – revised April 2008 Page 11
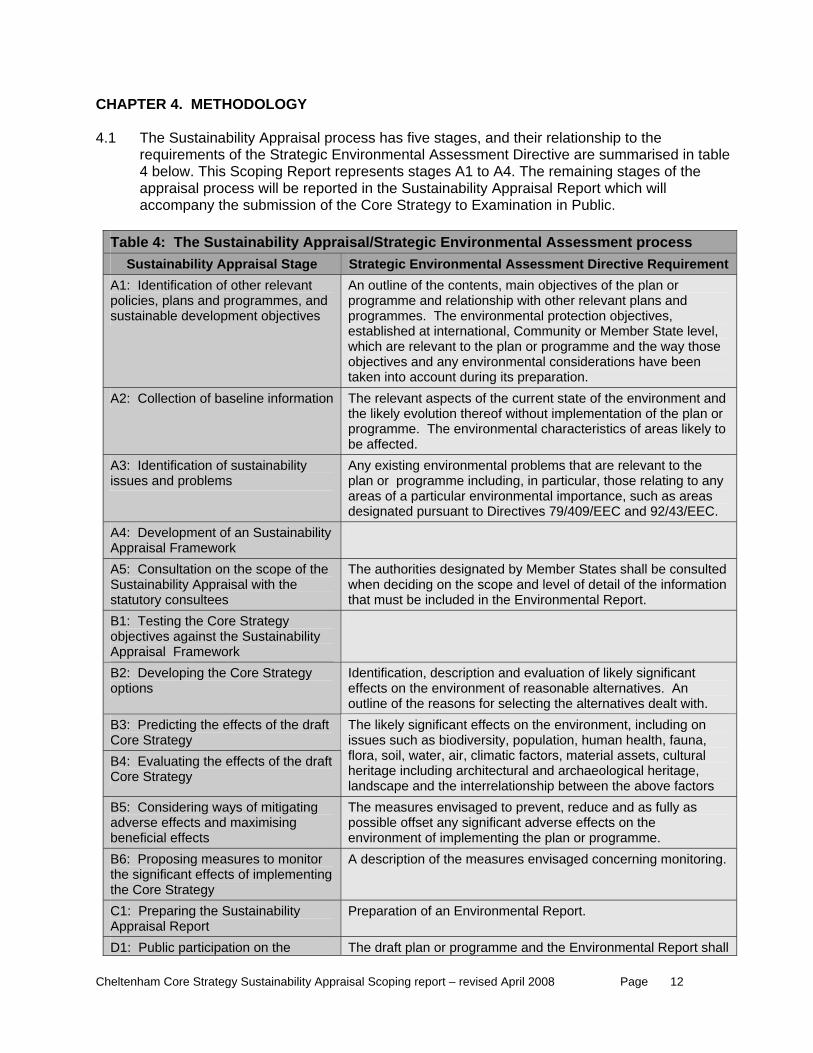
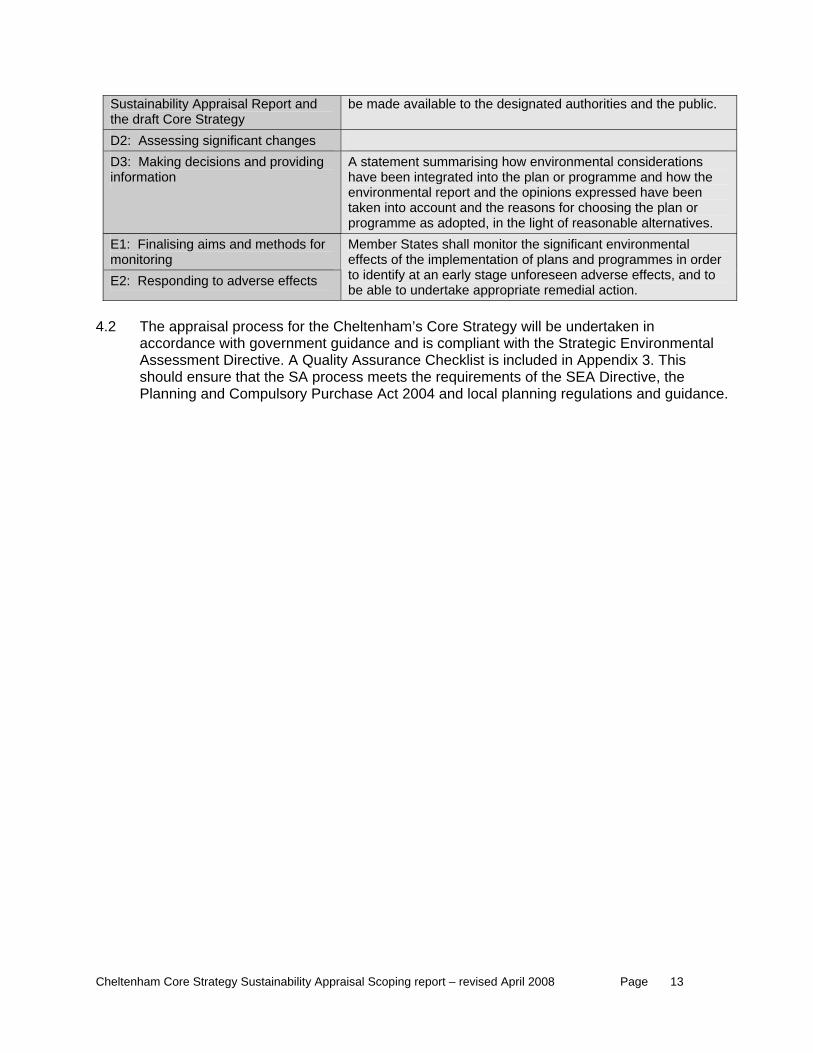
CHAPTER 4. METHODOLOGY 4.1 The Sustainability Appraisal process has five stages, and their relationship to the
requirements of the Strategic Environmental Assessment Directive are summarised in tab4 below. This Scoping Report represents stages A1 to A4. The remaining stages of thappraisal process will be reported in the Sustainability Appraisal Report wh
le e
ich will accompany the submission of the Core Strategy to Examination in Public.
Table 4: The Sustainability Appraisal/Strategic Environmental Assessment process
stainability Appraisal Stage Strategic Environmental AssessSu ment Directive Requirement A1: Identification of other relevant policies, plans and programmes, and sustainable development objectives
An outline of the contents, main objectives of the plan or programme and relationship with other relevant plans and programmes. The environmental protection objectives, established at international, Community or Member State level, which are relevant to the plan or programme and the way those objectives and any environmental considerations have been taken into account during its preparation.
Collection of baseline information The relevant aspects of the current state of the environment and the likely evolution thereof without implementation of the plan or programme. The environmental characteristics of ar
A2:
eas likely to be affected.
A3: Identification of sustainability Any existing environmental problems that are relevant to the issues and problems plan or programme including, in particular, those relating to any
areas of a particular environmental importance, such as areas designated pursuant to Directives 79/409/EEC and 92/43/EEC.
A4: Development of an Sustainability Appraisal Framework A5: Consultation on the scope of the The authorities designated by Member States shall be consulted Sustainability Appraisal with the when deciding on the scope and level of detail of the information statutory consultees that must be included in the Environmental Report. B1: Testing the Core Strategy objectives against the Sustainability Appraisal Framework B2: Developing the Core Strategy Identification, description and evaluation of likely significant options effects on the environment of reasonable alternatives. An
outline of the reasons for selecting the alternatives dealt with. B3: Predicting the effects of the draft Core Strategy
The likely significant effects on the environment, including on issues such as biodiversity, population, human health, fauna, flora, soil, water, air, climatic factors, material assets, cultural B4: Evaluating the effects of the draft heritage including architectural and archaeological heritage, Core Strategy landscape and the interrelationship between the above factors
B5: Considering ways of mitigating The measures envisaged to prevent, reduce and as fully as adverse effects and maximising possible offset any significant adverse effects on the beneficial effects environment of implementing the plan or programme. B6: Proposing measures to monitor A description of the measures envisaged concerning monitoring. the significant effects of implementing the Core Strategy C1: Preparing the Sustainability Preparation of an Environmental Report. Appraisal Report D1: Public participation on the The draft plan or programme and the Environmental Report shall
Cheltenham Core Strategy Sustainability Appraisal Scoping report – revised April 2008 Page 12
Sustainability Appraisal Report and be made available to the designated authorities and the public. the draft Core Strategy D2: Assessing significant changes D3: Making decisions and providing information
A statement summarising how environmental considerations have been integrated into the plan or programme and how the environmental report and the opinions expressed have been taken into account and the reasons for choosing the plan or programme as adopted, in the light of reasonable alternatives.
E1: Finalising aims and methods for monitoring E2: Responding to adverse effects
Member States shall monitor the significant environmental effects of the implementation of plans and programmes in order to identify at an early stage unforeseen adverse effects, and to be able to undertake appropriate remedial action.
4.2 C
accordance with government guAssessment Directive. A Qualityshould ensure that the SA process meets the requirements of the SEA Directive, the
h
The appraisal process for the heltenham’s Core Strategy will be undertaken in idance and is compliant with the Strategic Environmental Assurance Checklist is included in Appendix 3. This
Planning and Compulsory Purc ase Act 2004 and local planning regulations and guidance.
Cheltenham Core Strategy Sustainability Appraisal Scoping report – revised April 2008 Page 13
C IEW 5. tage of the Core Strategy Sustainability Appraisal process,
re l ore
t of the appraisal fra 5.2 Table 5 (below) sets out the five ts
rle .
HAPTER 5. STAGE A – OVERV OF THE SCOPING PROCESS
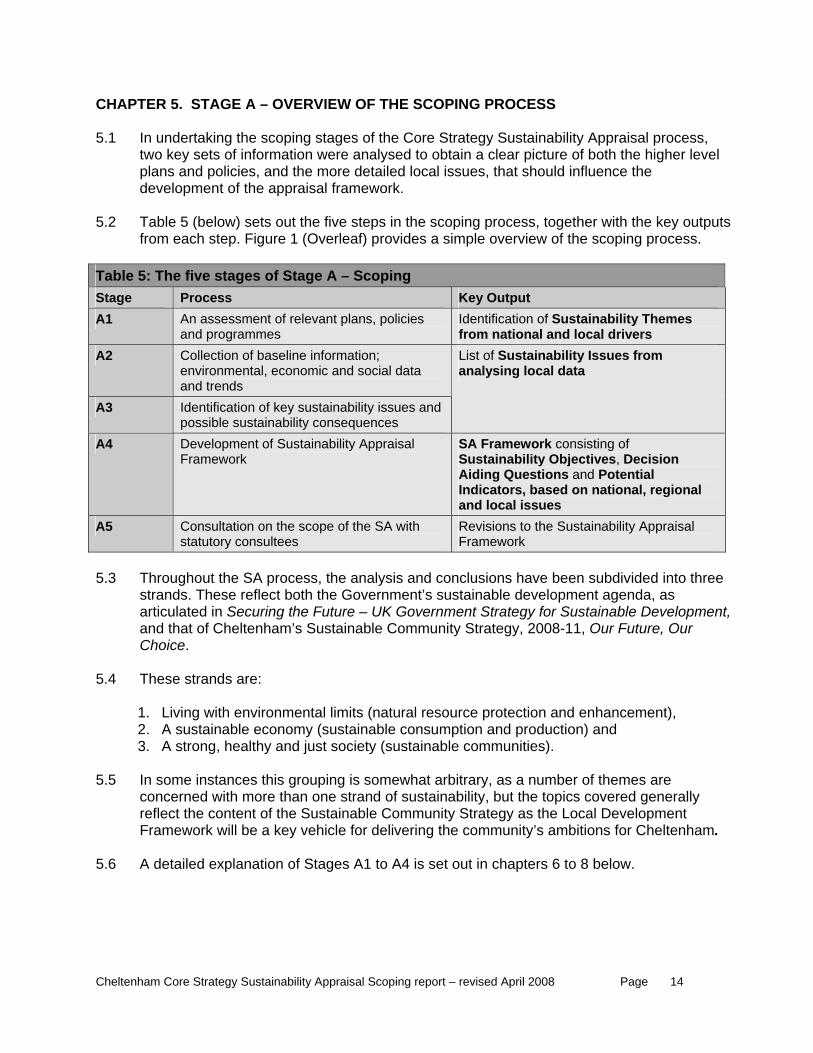
1 In undertaking the scoping s stwo key sets of information weplans and policies, and the mdevelopmen
analysed to obtain a clear picture of both the higher leve detailed local issues, that should influence the mework.
steps in the scoping process, together with the key outpufrom each step. Figure 1 (Ove af) provides a simple overview of the scoping process
Ta A –ble 5: The five stages of Stage Scoping Stage Process Key Output A1 An assessment of relevant plans, policies
and programmes Identification of Sustainability Themes from national and local drivers
A2 Collection of baseline information; environmental, economic and social data and trends
A3
List of Sustainability Issues from analysing local data
Identification of key sustainability issues and possible sustainability consequences
SA Framework consisting of Development of Sustainability Appraisal A4 Framework Sustainability Objectives, Decision
Aiding Questions and Potential Indicators, based on national, regional and local issues
Consultation on the scope of the SA with Revisions to the Sustainability Appraisal A5 statutory consultees Framework
5.3 Throughout the SA process, the analysis and conclusions have been subdivided into three
strands. These reflect both the Government’s sustainable development agenda, as articulated in Securing the Future – UK Government Strategy for Sustainable Development, and that of Cheltenham’s Sustainable Community Strategy, 2008-11, Our Future, Our Choice.
5.4 These strands are:
1. Living with environmental limits (natural resource protection and enhancement), 2. A sustainable economy (sustainable consumption and production) and 3. A strong, healthy and just society (sustainable communities).
5.5 In some instances this grouping is somewhat arbitrary, as a number of themes are
concerned with more than one strand of sustainability, but the topics covered generally reflect the content of the Sustainable Community Strategy as the Local Development Framework will be a key vehicle for delivering the community’s ambitions for Cheltenham.
5.6 A detailed explanation of Stages A1 to A4 is set out in chapters 6 to 8 below.
Cheltenham Core Strategy Sustainability Appraisal Scoping report – revised April 2008 Page 14
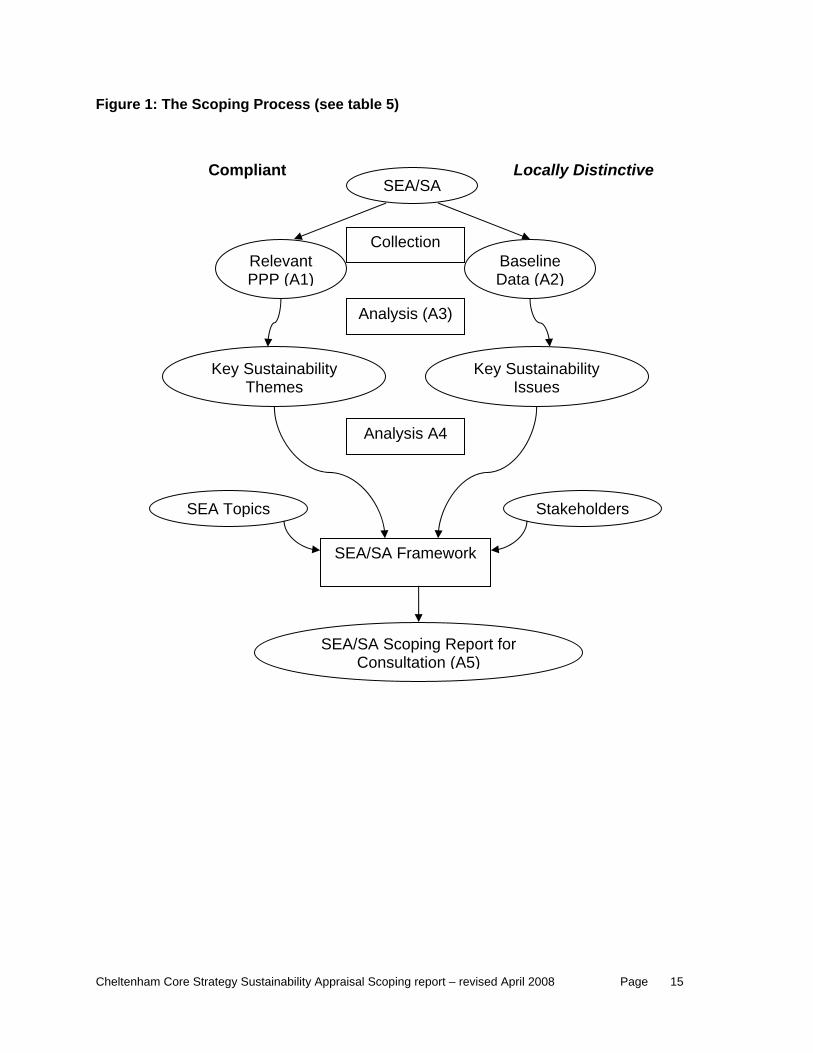
Figure 1: The Scoping Process (see table 5)
SEA/SA Compliant Locally Distinctive
Relevant PPP (A1)
Baseline Data (A2)
Analysis (A3)
Key Sustainability Themes
Key Sustainability Issues
SEA Topics Stakeholders
SEA/SA Framework
Analysis A4
Collection
SEA/SA Scoping Report for Consultation (A5)
Cheltenham Core Strategy Sustainability Appraisal Scoping report – revised April 2008 Page 15
CHAPTER 6. STAGE A1 - REVIEW OF RELEVANT PLANS, POLICIES AND PROGRAMMES
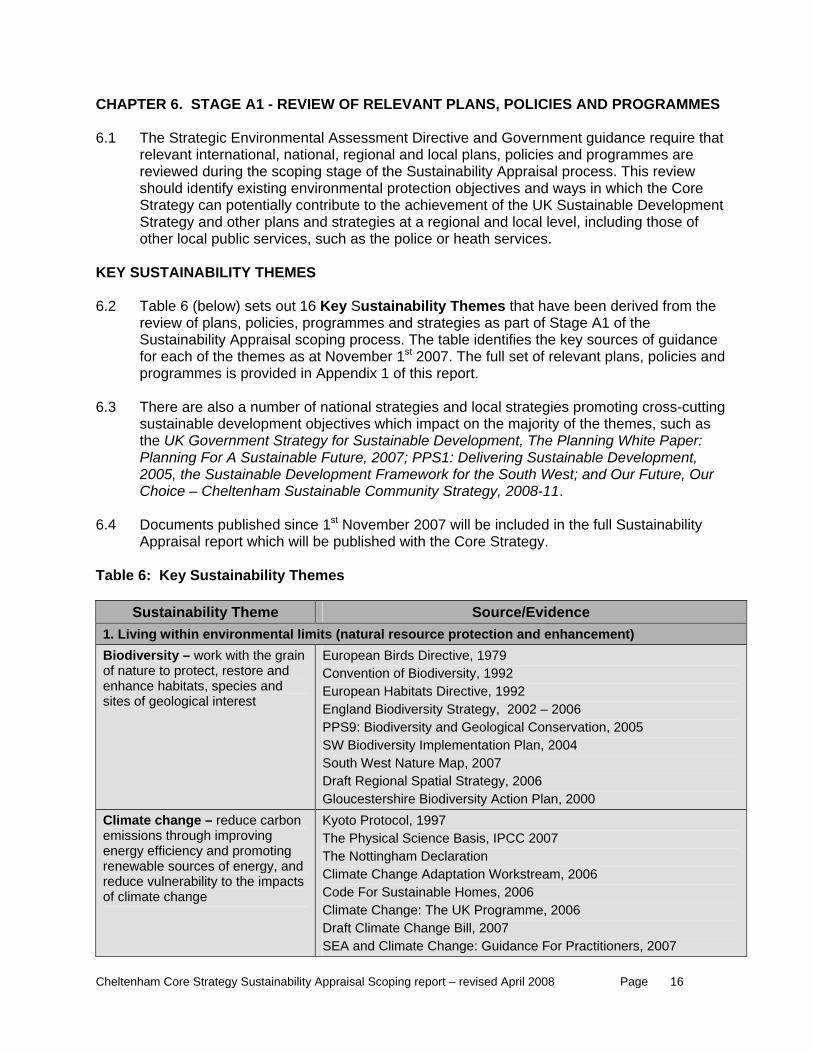
6.1 The Strategic Environmental Assessment Directive and Government guidance require that relevant international, national, regional and local plans, policies and programmes are r f the Sustainability Ap view should identify existing environmenta n objectives and ways in which the Core Strategy can potentially contribute to the achievement of the UK Sustainable Development Strategy and other plans and strategies at a regional and local level, including those of other local public services, such as the police or heath services.
KEY SUSTAINABILITY 6.2 Table 6 (below) sets out 16 Key S hemes that have been derived from the
review of plans, policies, program ies as part of Stage A1 of the Sustainability Appraisal scoping process. The table identifies the key sources of guidance for each of t st 2007. The full set s and programm ndix 1 of this repor
6.3 There are also a number of national strategies and local strategies promoting cross-cutting
sustainable development objective t on the majority of the themes, such as the UK Government Strategy for S ent, The Planning White Paper: Planning For A Sustainable Future, 2007; PPS1: Delivering Sustainable Development, 2005, the Sustainable Development Framework for the South West; and Our Future, Our Choice – Cheltenha Sustainable Community Strategy, 2008-11.
6.4 Documents published since 1st November 2007 will be included in the full Sustainability
Appraisal report which will be publ Table 6: Key Sustainability Themes
eviewed during the scoping stage o praisal process. This rel protectio
THEMES
ustainability Tmes and strateg
he themes as at November 1es is provided in Appe
of relevant plans, policiet.
s which impacustainable Developm
m
ished with the Core Strategy.
Sustainability Theme Source/Evidence 1. Living within environmental lim nd enhancement) its (natural resource protection aBiodiversity – work with the grain European Birds Directive, 1979 of nature to protect, restore and Conv 1992 ention of Biodiversity, enhance habitats, species and European Habitats Directive, 1992 sites of geological interest England Biodiversity Strategy, 2002 – 2006
PPS9: Biodiversity and Geological Conservation, 2005 SW Biodiversity Implementation Plan, 2004 South West Nature Map, 2007 Draft Regional Spatial Strategy, 2006 Gloucestershire Biodiversity Action Plan, 2000
Climate change – reduce carbon Kyoto Protocol, 1997 emissions through improving The Physical Science Basis, IPCC 2007 energy efficiency and promoting The Nottingham Declaration renewable sources of energy, and Climate Change Adaptation Workstream, 2006 reduce vulnerability to the impacts
Code For Sustainable Homes, 2006 of climate change Climate Change: The UK Programme, 2006 Draft Climate Change Bill, 2007 SEA and Climate Change: Guidance For Practitioners, 2007
Cheltenham Core Strategy Sustainability Appraisal Scoping report – revised April 2008 Page 16
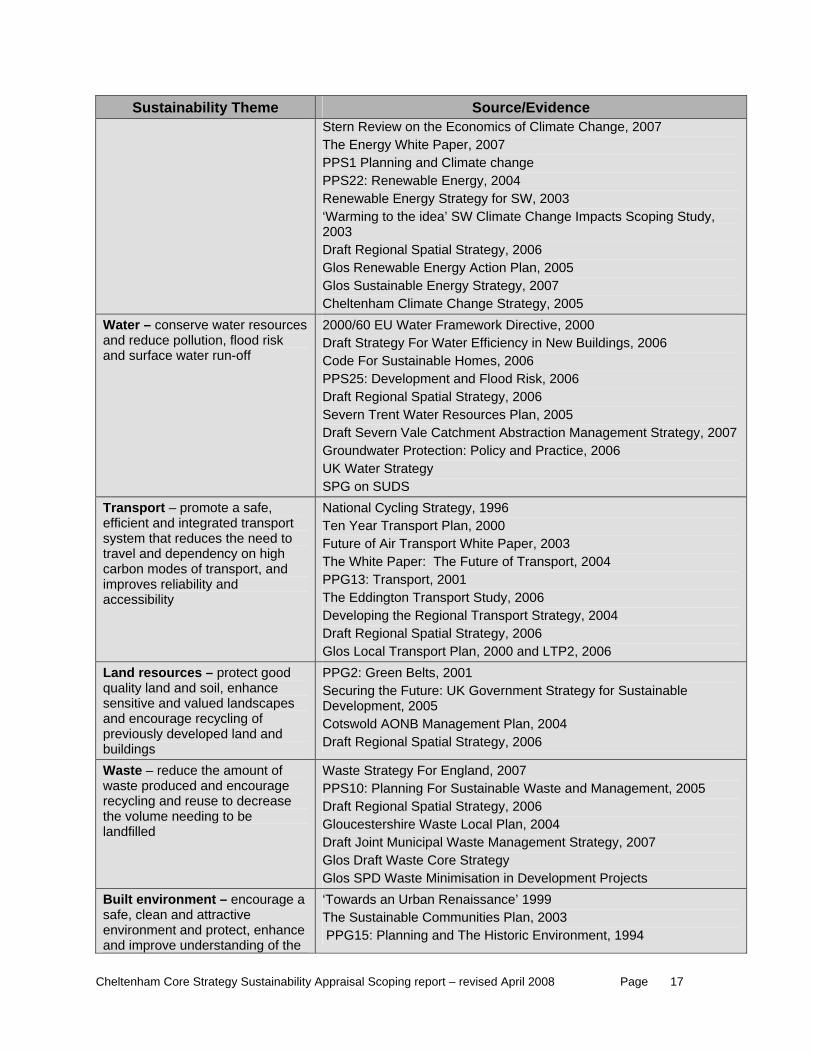
Sustainability Theme Source/Evidence Stern Review on the Economics of Climate Change, 2007 The Energy White Paper, 2007 PPS1 Planning and Climate change PPS22: Renewable Energy, 2004 Renewable Energy Strategy for SW, 2003 ‘Warming to the idea’ SW Climate Change Impacts Scoping Study, 2003 Draft Regional Spatial Strategy, 2006 Glos Renewable Energy Action Plan, 2005 Glos Sustainable Energy Strategy, 2007 Cheltenham Climate Change Strategy, 2005
Water – conserve water resources and reduce pollution, flood risk and surface water run-off
2000/60 EU Water Framework Directive, 2000 Draft Strategy For Water Efficiency in New Buildings, 2006 Code For Sustainable Homes, 2006 PPS25: Development and Flood Risk, 2006 Draft Regional Spatial Strategy, 2006 Severn Trent Water Resources Plan, 2005 Draft Severn Vale Catchment Abstraction Management Strategy, 2007 Groundwater Protection: Policy and Practice, 2006 UK Water Strategy SPG on SUDS
Transport – promote a safe, National Cycling Strategy, 1996 efficient and integrated transport system that reduces the need to travel and dependency on high
Ten Year Transport Plan, 2000 Future of Air Transport White Paper, 2003 The White Paper: The Future of Transport, 2004 carbon modes of transport, and
improves reliability and PPG13: Transport, 2001 The Eddington Transport Study, 2006 accessibility Developing the Regional 04 Transport Strategy, 20Draft Regional Spatial Strategy, 2006 Glos Local Transport Plan, 2000 and LTP2, 2006
Land resources – protect good quality land and soil, enhance sensitive and valued landsc
PPG2: Green Belts, 2001 Securing the Future: UK Government Strategy for Sustainable Development, 2005 Cotswold AONB Management Plan, 2004 Draft Regional Spatial Strategy, 2006
apes and encourage recycling of previously developed land and buildings Waste – reduce the amount of waste produced and encourage recycling and reuse to decrease the volume needing to be landfilled
Waste Strategy For England, 2007 PPS10: Planning For Sustainable Waste and Management, 2005 Draft Regional Spatial Strategy, 2006 Gloucestershire Waste Local Plan, 2004 Draft Joint Municipal Waste Management Strategy, 2007 Glos Draft Waste Core Strategy Glos SPD Waste Minimisation in Development Projects
Built environment – encourage a safe, clean and attractive environment and protect, enhance and improve understanding of the
‘Towards an Urban Renaissance’ 1999 The Sustainable Communities Plan, 2003 PPG15: Planning and The Historic Environment, 1994
Cheltenham Core Strategy Sustainability Appraisal Scoping report – revised April 2008 Page 17
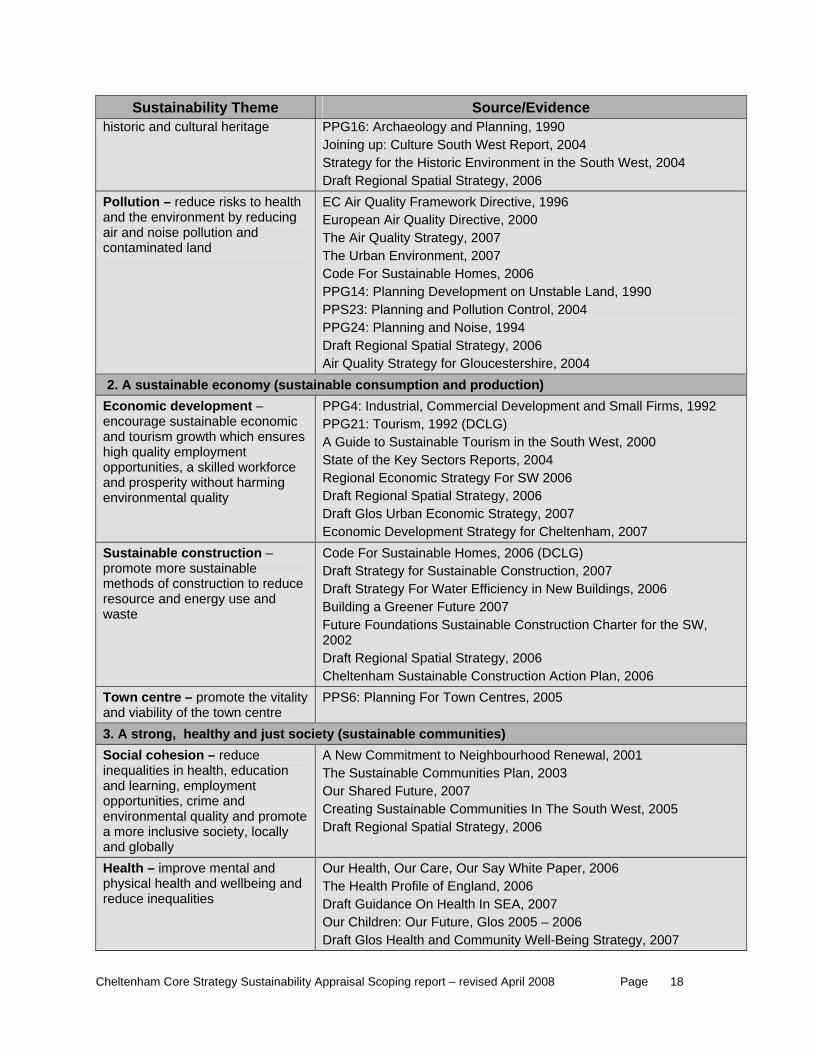
Sustainability Theme Source/Evidence historic and cultural heritage PPG16: Archaeology and Planning, 1990
Joining up: Culture South West Report, 2004 Strategy for the Historic Environment in the South West, 2004 Draft Regional Spatial Strategy, 2006
Pollution – reduce risks to health EC Air Quality Framework Directive, 1996 European Air Quality Directive, 2000 The Air
and the environment by reducing air and noise pollution and Quality Strategy, 2007
The Urban Environment, 2007 Code For Sustainable Homes, 2006 PPG14: Planning Development on Unstable L
contaminated land
and, 1990 PPS23: Planning and Pollution Control, 2004 PPG24: Planning and Noise, 1994 Draft Regional Spatial Strategy, 2006 Air Quality Strategy for Gloucestershire, 2004
2. A sustainable economy (sustainable consumption and production) Economic development – encourage sustainable economic and tourism growth which ensures high quality employment opportunities, a skilled workforce and prosperity without harming environmental quality
PPG4: Industrial, Commercial Development and Small Firms, 1992 PPG21: Tourism, 1992 (DCLG) A Guide to Sustainable Tourism in the South West, 2000 State of the Key Sectors Reports, 2004 Regional Economic Strategy For SW 2006 Draft Regional Spatial Strategy, 2006 Draft Glos Urban Economic Strategy, 2007 Economic Development Strategy for Cheltenham, 2007
Sustainable construction – promote more sustainable methods of construction
Code For Sustainable Homes, 2006 (DCLG) Draft Strategy for Sustainable Construction, 2007 Draft Strategy For Water Efficiency in N to reduce
resource andew Buildings, 2006
Building a Greener Future 2007 Future Foundations Sustainable Construction Charte
energy use and waste
r for the SW, 2002 Draft Regional Spatial Strategy, 2006 Cheltenham Sustainable Construction Action Plan, 2006
Town centre – promote the vitality and viability of the town centre
PPS6: Planning For Town Centres, 2005
3. A strong, healthy and just society (sustainable communities) Social cohesion – reduce inequalities in health, education and learning, employment opportunities, crime and environmental quality and
A New Commitment to Neighbourhood Renewal, 2001 The Sustainable Communities Plan, 2003 Our Shared Future, 2007 Creating Sustainable Communities In The South West, 2005 Draft Regional Spatial Strategy, 2006
promote a more inclusive society, locally and globally Health – improve mental and physical health and wellbeing and reduce inequalities
Our Health, Our Care, Our Say White Paper, 2006 The Health Profile of England, 2006 Draft Guidance On Health In SEA, 2007 Our Children: Our Future, Glos 2005 – 2006 Draft Glos Health and Community Well-Being Strategy, 2007
Cheltenham Core Strategy Sustainability Appraisal Scoping report – revised April 2008 Page 18
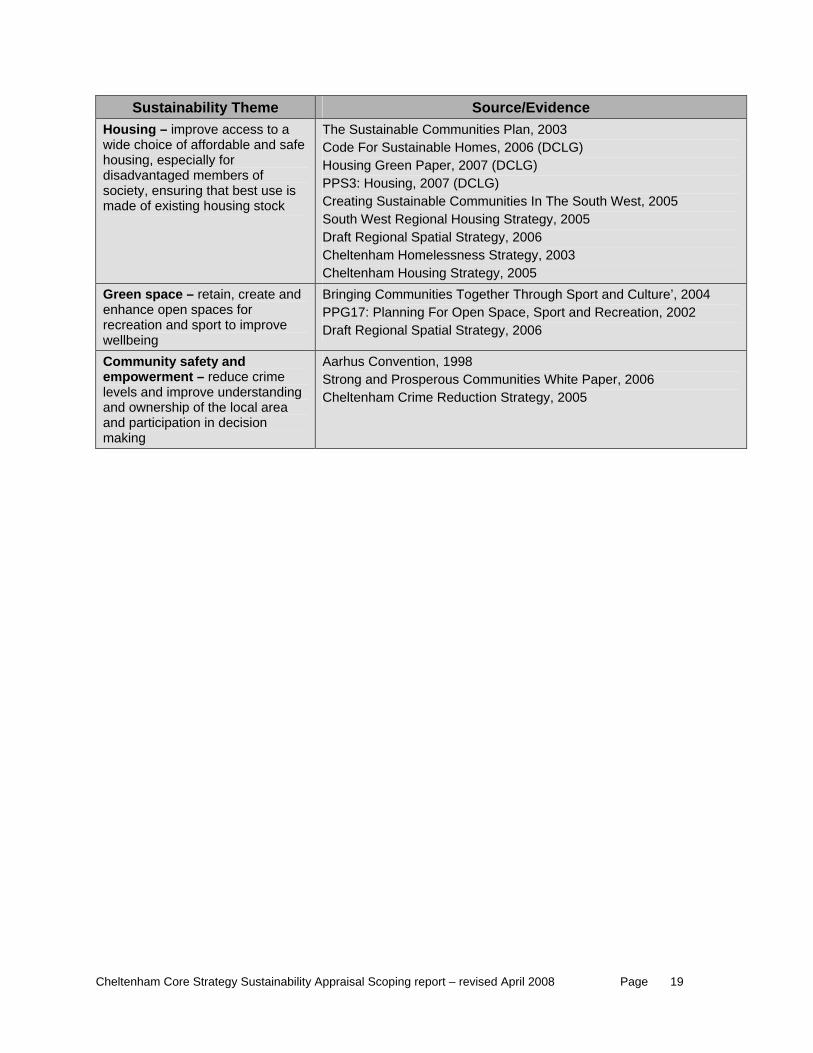
Sustainability Theme Source/Evidence Housing – improve access to a wide choice of affordable and safe housing, especially for disadvantaged members of society, ensuring that best use is made of existing housing stock
The Sustainable Communities Plan, 2003 Code For Sustainable Homes, 2006 (DCLG) Housing Green Paper, 2007 (DCLG) PPS3: Housing, 2007 (DCLG) Creating Sustainable Communities In The South West, 2005 South West Regional Housing Strategy, 2005 Draft Regional Spatial Strategy, 2006 Cheltenham Homelessness Strategy, 2003 Cheltenham Housing Strategy, 2005
Green space – retain, create and Bringing Communities Together Through Sport and Culture’, 2004 PPG17: Planning For Open Space, Sport and enhance open spaces for Recreation, 2002 Draft Regional Spatial Strategy, 200recreation and sport to improve 6
wellbeing Community safety and empowerment – reduce crime levels and improve understanding and ownership of the local area and participation in decision making
Aarhus Convention, 1998 Strong and Prosperous Communities White Paper, 2006 Cheltenham Crime Reduction Strategy, 2005
Cheltenham Core Strategy Sustainability Appraisal Scoping report – revised April 2008 Page 19
CHAPTER 7. STAGES A2 AND A3 - BASELINE DATA COLLECTION AND KEY S B 7 ide monitoring effects and helps
abilbaseline data used in this sc tenham that has been collected over a numb rformance Indicators, local quality of life indicators, and nal performance management system, TEN. nds have also been
7 most recent information that provides, ideally, bot
a comparison with othe tempt to define and distil eness of th vitably some information has been
k ove a used is a
7 icator set is likely to impact significantly on a number of these
icators and it may be difficult to continue using trend data in some instances as the criteria has altered. The full Sustainability Appraisal Report will include relevant National Indicators as well as updated data for those baseline indicators that are still appropriate.
KEY SUSTAINABILITY ISSUES (STAGE A3) 7.4 The baseline data is again subdivided into environmental, social and economic categories.
A summary of the datasets for each of these areas is included below, together with an assessment of the Key Sustainability Issues arising from the analysis. These issues have been derived from the analysis of quantifiable and, in some instances, qualitative indicators of local circumstances and highlight any specific characteristics of Cheltenham which should be addressed though the Sustainability Appraisal process because of the sustainability consequences or tensions that could result. These consequences, together with the key trends and evidence basis are detailed with each of the Key Sustainability Issues. Some gaps have been identified where data is scarce. Some of these gaps will be filled by ongoing evidence gathering such as the development of a county-wide Strategic Flood Risk Assessment.
7.5 The full datasets are provided in Appendix 2.
USTAINABILITY ISSUES
ASELINE DATA COLLECTION (
.1 Baseline information providentify potential sustain
STAGE A2)
s the basis for predicting andity issues and alternative ways of dealing with them. The oping report draws on information for Chel
er of years, including Best Value Pe measures included in the Council’s interAny future targets and predicted tre
included, where available.
.2 Wherever possible, the and
h a local trend r areas has been used, in order to at
the local distinctivdifficult to obtain or tracas up-to-date as possible,
.3 The new National Indind
e Borough, although iner time, and some gaps have been identified. The dat
sts at 1 November 2007.
Cheltenham Core Strategy Sustainability Appraisal Scoping report – revised April 2008 Page 20
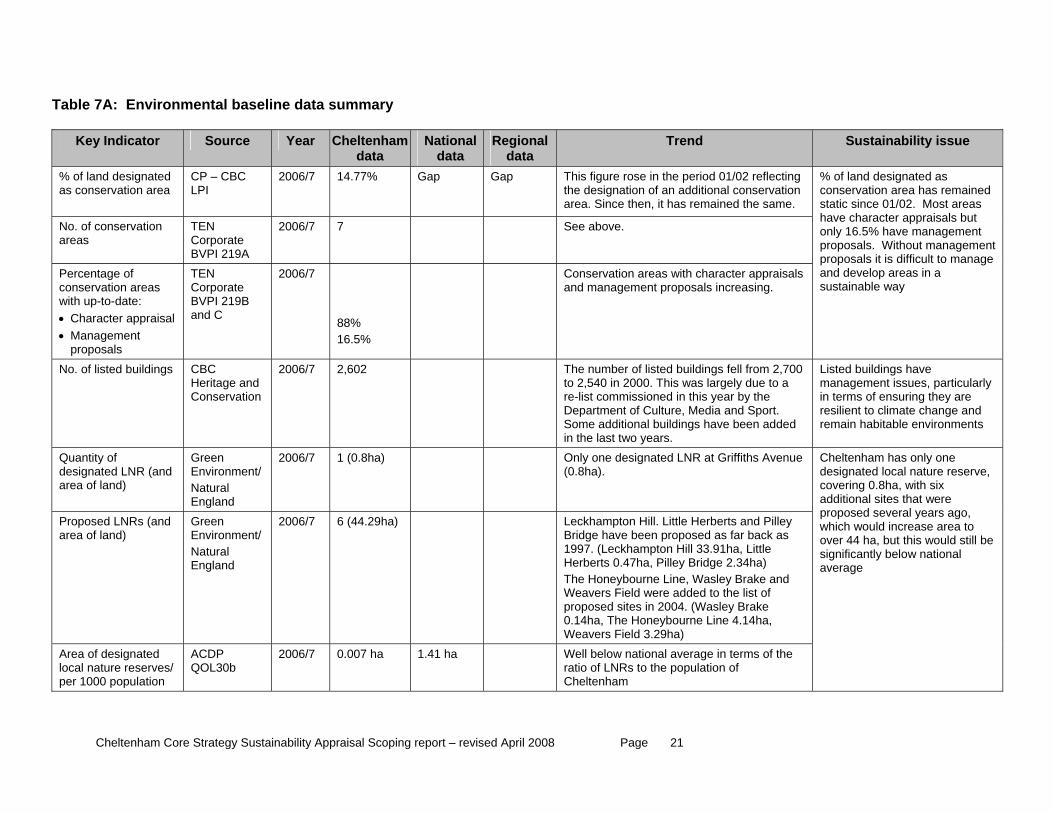
Table 7A: Environmental baseline data summary
Cheltenham data
National data
Regional Key Indicator Source Year Trend Sustai l e nabi ity issudata
% of land designated as conservation area
CP – CBC LPI
200 e 2 nn th
6/7 14.77% Gap Gap This figure rosthe designationarea. Since the
in the period 01/0of an additional co, it has remained
reflecting servation e same.
No. of conservation areas
TEN Corporate BVPI 219A
2006/7 7 See above.
Percentage of conservation areas with up-to-date: • Character appraisal • Management
proposals
TEN Corporate BVPI 219B and C
200
8816
r en as
e atn a ained . eas c p but m ent u ement t i anage p s
appraisals ing.
% of land dconservatiostatic sincehave charaonly 16.5%proposals. proposals iand develosustainable
sign are
01/02ter ahave Withois diff areaway
ed as has rem Most ar
praisals anagemt manag
cult to m in a Conservation a
and managemeas with charactert proposals incre
% .5%
6/7
No. of listed buildings CBC Heritage and Conservation
200 2, li from0 due io y theC Spoal en a
i ye
di ave n es, ularly e ng th re c e cha and itable envi ents
The number ofto 2,540 in 200re-list commissDepartment of Some additionn the last two
sted buildings fell . This was largely ned in this year bulture, Media and buildings have bears.
2,700 to a rt. dded
Listed builmanagemein terms of resilient to remain hab
ngs ht issunsurilimat
6/7 602 particey ange
ronm
Quantity of designated LNR (and area of land)
Green Environment/ Natural England
2006/7 1 n ths AOnly one desig(0.8ha).
ated LNR at Griffi venue (0.8ha)
Proposed LNRs (and area of land)
Green Environment/ Natural England
2006/7 6 Hill. L nd Pen p bac
mpto Littla, Pi 4ha)rne L rake were list o in 2 rake oney 14ha3.29
(44.29ha) Leckhampton Bridge have be1997. (LeckhaHerberts 0.47hThe HoneybouWeavers Field proposed sites0.14ha, The HWeavers Field
ittle Herberts aroposed as farn Hill 33.91ha,lley Bridge 2.3ine, Wasley B added to the
004. (Wasley Bbourne Line 4.ha)
illey k as e and f
,
Area of designated local nature reserves/ per 1000 population
ACDP QOL30b
2006/7 0. onal ms oo the
m has only local natur erve, 8ha, with sites that weveral yea o, d increase to , but this w still be y below nati l
f the
Cheltenhadesignatedcovering 0.additional sproposed swhich woulover 44 hasignificantlaverage
Well below natiratio of LNRs tCheltenham
average in ter population of
007 ha 1.41 ha
one e resix ere rs agareaould ona
Cheltenham Core Strategy Sustainability Appraisal Scoping report – revised April 2008 Page 21
Key Indicator Source Year Cheltenham data
National Regional Trend Sustainability issue data data
Ardesicondition that is:
Declining
• le bu
N 2
(4.67ha) 0%
48.93%
6.96%
% .34%
15.65%
1.18%
% .98%
14.94%
8.07%
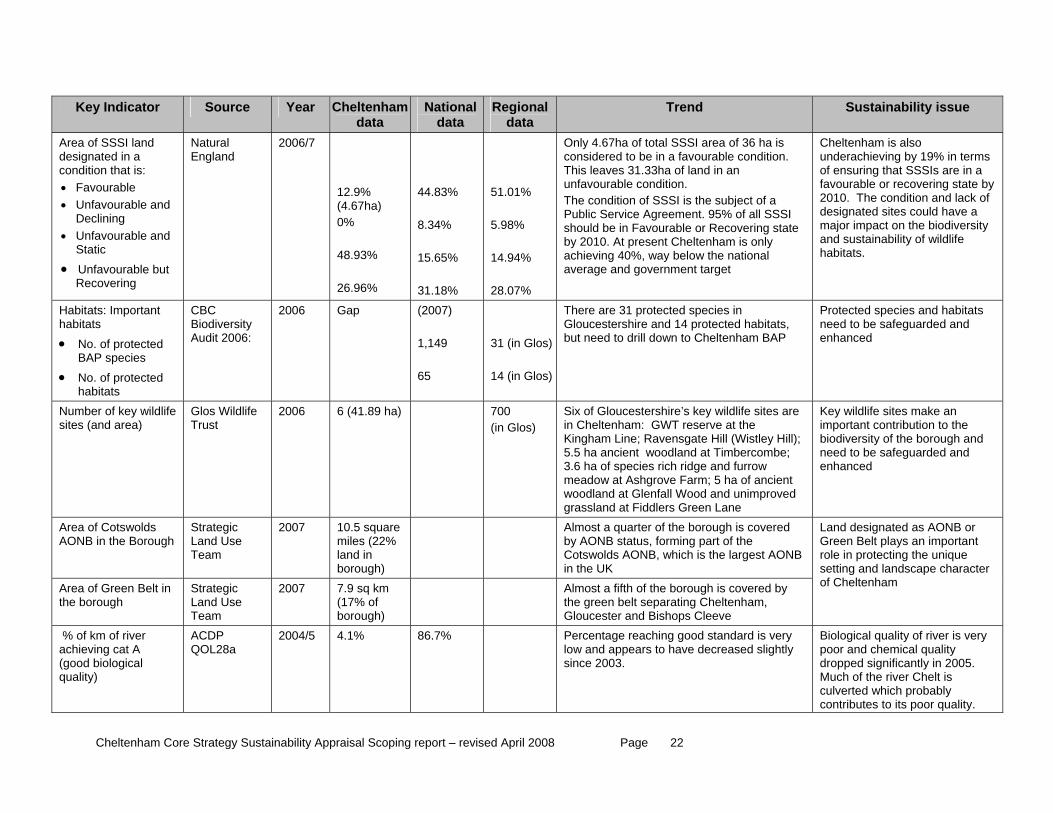
Only considered to be in a fav ble condition. This leaves 31.33ha of land in an
Favourable or Recovering state 0. At present Cheltenham is only
achieving 40%, way below the national
Cheund ms of ensuring that SSSIs are in a
ng state by
y
ea of SSSI land gnated in a
• Favourable • Unfavourable and
• Unfavourable and Static
UnfavourabRecovering
t
atural England
006/7 12.9%
2
44.83
8
3
51.01
5
2
4.67ha of total SSSI area of 36 ha is oura
unfavourable condition. The condition of SSSI is the subject of a Public Service Agreement. 95% of all SSSI should be in by 201
average and government target
ltenham is also erachieving by 19% in ter
favourable or recoveri2010. The condition and lack of designated sites could have a major impact on the biodiversitand sustainability of wildlife habitats.
Habitats: Important habitats
• No. of protectBAP spec
ed ies
habitats
iversity Audit 2006:
2006 Gap 2007) 1,149 5
31 (in Glos) 4 (in Glos)
There are 31 protected species in Gloucestershire and 14 protected habitats, but need to drill down to Cheltenham BAP
Protected species and habitats need to be safeguarded and enhanced
• No. of protected
CBC Biod
(
6
1
Number of key wildlife sites (and area) Trust
2006 6 (41.89 ha) 700 (in Glos)
re
land at Timbercombe;
at Ashgrove Farm; 5 ha of ancient woodland at Glenfall Wood and unimproved grassland at Fiddlers Green Lane
need to be safeguarded and
Glos Wildlife Six of Gloucestershire’s key wildlife sites ain Cheltenham: GWT reserve at the Kingham Line; Ravensgate Hill (Wistley Hill); 5.5 ha ancient wood3.6 ha of species rich ridge and furrow meadow
Key wildlife sites make an important contribution to the biodiversity of the borough and
enhanced
Area of Cotswolds AONB in the Borough miles (22%
land in borough)
ONB
Strategic Land Use Team
2007 10.5 square Almost a quarter of the borough is covered by AONB status, forming part of the Cotswolds AONB, which is the largest Ain the UK
Area of Green Belt in the borough
Strategic Land Use Team
2007 7.9 sq km (17% of borough)
acter
nham Almost a fifth of the borough is covered by the green belt separating Cheltenham, Gloucester and Bishops Cleeve
Land designated as AONB or Green Belt plays an important role in protecting the unique setting and landscape charof Chelte
% of km of river ACDP a
2004/5 4.1% 86.7% y Biological quality of river is very poor and chemical quality dropped significantly in 2005. Much of the river Chelt is culverted which probably contributes to its poor quality.
achieving cat A (good biological quality)
QOL28Percentage reaching good standard is verlow and appears to have decreased slightly since 2003.
Cheltenham Core Strategy Sustainability Appraisal Scoping report – revised April 2008 Page 22
Key Indicator Source Year Cheltenham National data
Regional Trend Sustainability issue data data
% of km of river achieving cat B (gochemical quality)
od ACDP QOL28b
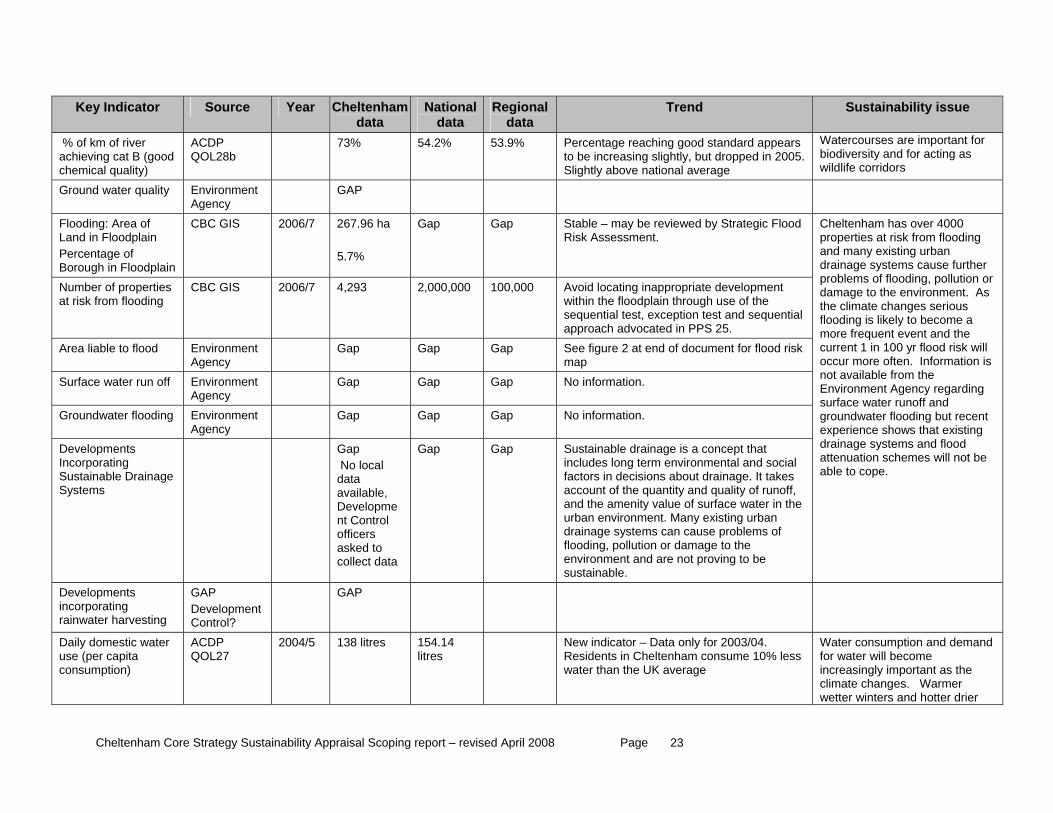
73% 4.2% 3.9% rs 5.
portant for 5 5 Percentage reaching good standard appeato be increasing slightly, but dropped in 200Slightly above national average
Watercourses are imbiodiversity and for acting as wildlife corridors
Ground water quality Environment Agency
GAP
Flo of Land in Floodplain
ercentage of
oding: Area
PBorough in Floodplain
CBC GIS 2006/7 96 ha 267. 5.7%
Gap Gap Stable – may be reviewed by Strategic Flood Risk Assessment.
Nat risk from flooding
CBC GIS 2006/7 0 velopment within the floodplain through use of the
sequential
umber of properties 4,293
2,000,00 100,000
Avoid locating inappropriate de
sequential test, exception test and approach advocated in PPS 25.
Ar a egency
Gap map
liable to flood Environment A
Gap Gap See figure 2 at end of document for flood risk
Surface water run off Environment Agency
Gap No information. Gap Gap
Groundwater flooding Environment Agency
Gap Gap Gap No information.
Developments Incorporating Sustainable Drainage Systems
Gap No local data available, Development Control
ata
Gap Gap
an
ystems cause further problems of flooding, pollution or damage to the environment. As
00 yr flood risk will occur more often. Information is not available from the Environment Agency regarding surface water runoff and
cent g
be e.
officers asked to collect d
Sustainable drainage is a concept that includes long term environmental and social factors in decisions about drainage. It takes account of the quantity and quality of runoff, and the amenity value of surface water in the urban environment. Many existing urbdrainage systems can cause problems of flooding, pollution or damage to the environment and are not proving to be sustainable.
Cheltenham has over 4000 properties at risk from flooding and many existing urban drainage s
the climate changes serious flooding is likely to become a more frequent event and the current 1 in 1
groundwater flooding but reexperience shows that existindrainage systems and flood attenuation schemes will not able to cop
Developments incorporating rainwater harvesting
ent l?
GAP DevelopmContro
GAP
Daily domestic wuse (per capita consumption)
ater es litres
e UK average
r drier
ACDP QOL27
2004/5 138 litr 154.14 New indicator – Data only for 2003/04. Residents in Cheltenham consume 10% lesswater than th
Water consumption and demandfor water will become increasingly important as the climate changes. Warmewetter winters and hotter
Cheltenham Core Strategy Sustainability Appraisal Scoping report – revised April 2008 Page 23
Key Indicator Source Year Cheltenham National Regional Trend Sustainability issue data data data
summers mean that a greater proportion of rain will fall within a shorter time period and probain more intens
bly e bursts. Storage
f water will be an issue, especially as demand is likely to
ells
o
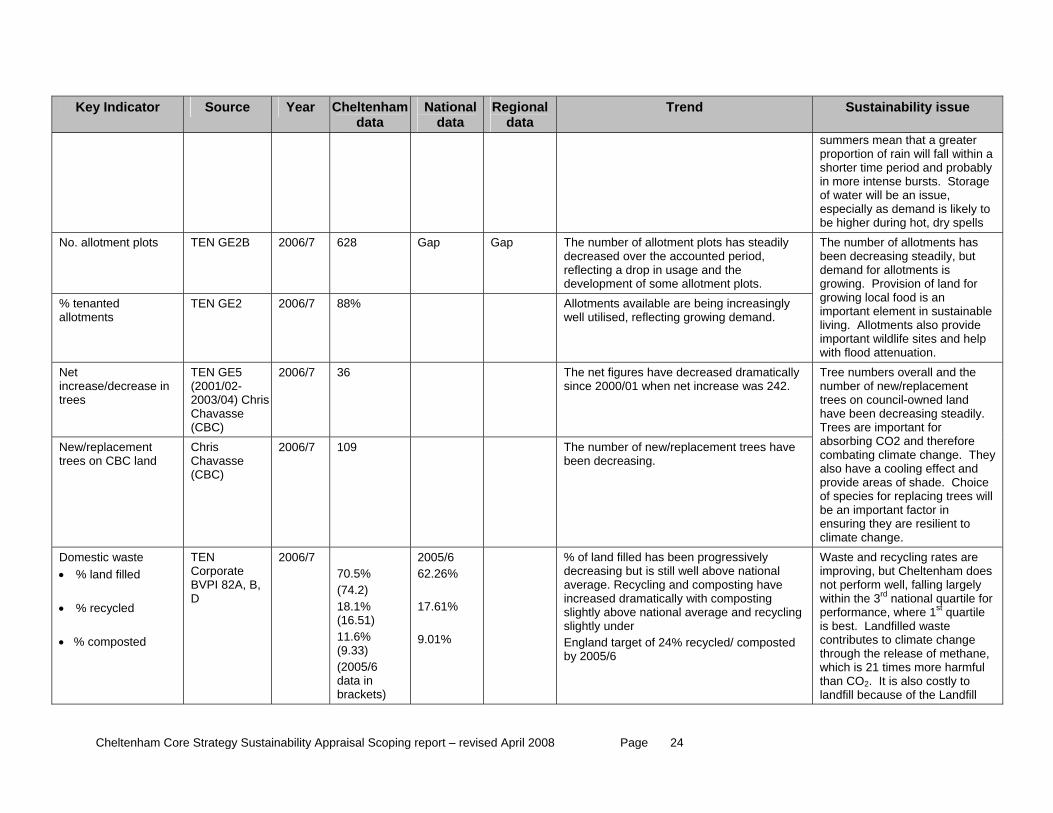
be higher during hot, dry spNo. allotment plots TEN GE2B 2006/7 28 Gap Gap tment plots has steadily
decreased over the accounted period, reflecting a drop in usage and the
6 The number of allo
development of some allotment plots. % tenanted allotments
TEN GE2 2006/7 88% Allotments available are being increasinglywell utilised, reflecting growing demand.
but
ble e lp
The number of allotments has been decreasing steadily,demand for allotments is growing. Provision of land for growing local food is an important element in sustainaliving. Allotments also providimportant wildlife sites and hewith flood attenuation.
Net 5
Chris
2006/7 36 he net figures have decreased dramatically hen net increase was 242. increase/decrease in
trees
TEN GE(2001/02-2003/04)Chavasse (CBC)
Tsince 2000/01 w
New/replacemetrees on CBC l
nt and
hris Chavasse (CBC)
00 ave y
s of shade. Choice of species for replacing trees will be an important factor in ensuring they are resilient to climate change.
C 2 6/7 109 The number of new/replacement trees hbeen decreasing.
Tree numbers overall and the number of new/replacement trees on council-owned land have been decreasing steadily. Trees are important for absorbing CO2 and therefore combating climate change. Thealso have a cooling effect and provide area
Domestic waste • % land filled
TEN Corporate BVPI 82A, B,
2006/7
)
(16.51) 11.6%
(2005/6 data in brackets)
2005/6 62.26%
17.61%
l
ycling and composting have creased dramatically with composting
slightly above national average and recycling slightly under
sted
Waste and recycling rates are improving, but Cheltenham does not perform well, falling largely
ithin the 3rd national quartile for performance, where 1st quartile is best. Landfilled waste
ul
• % recycled • % composted
D
70.5% (74.218.1%
(9.33)
9.01%
% of land filled has been progressively decreasing but is still well above nationaaverage. Recin
England target of 24% recycled/ compoby 2005/6
w
contributes to climate change through the release of methane, which is 21 times more harmfthan CO2. It is also costly to landfill because of the Landfill
Cheltenham Core Strategy Sustainability Appraisal Scoping report – revised April 2008 Page 24
Key Indicator Source Year Cheltenham National Regional Trend Sustainability issue data data data
Kg of waste collected per head p.a
TEN Corporate BVPI 84A
2006/7 455 kg (446.2kg 2005/6)
438.63 kg (2005/6)
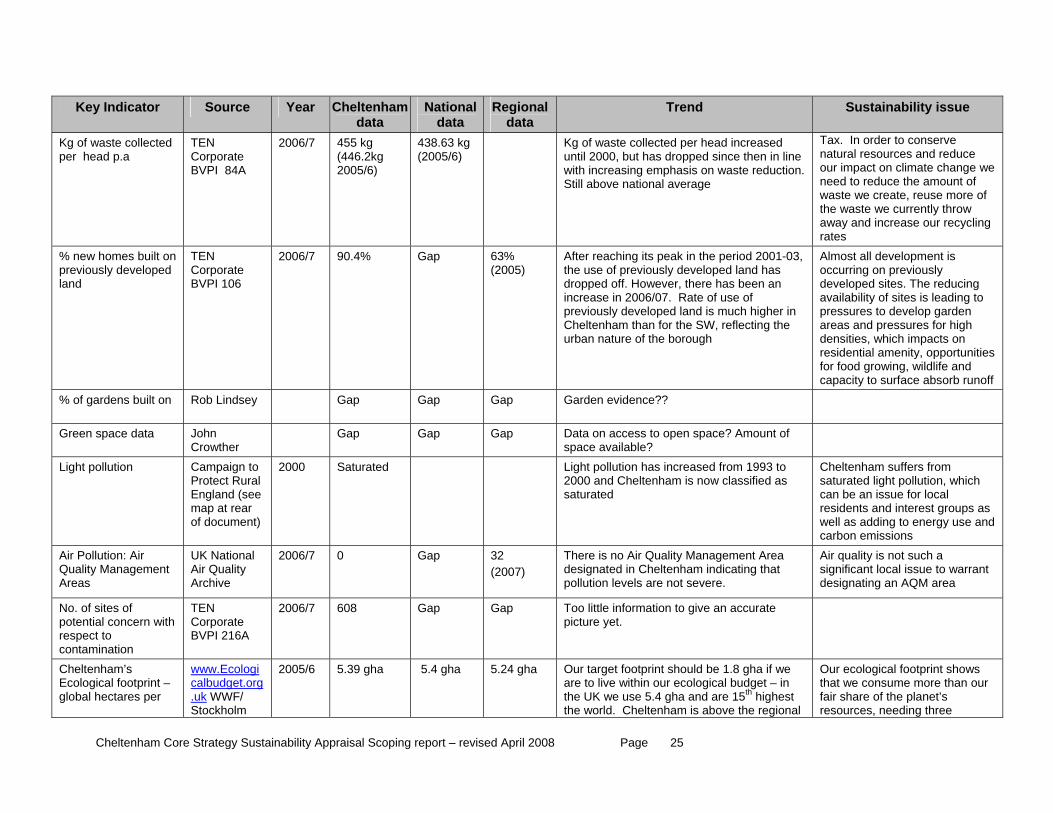
Kg of waste collected per head increased until 2000, but has dropped since then in line with increasing emphasis on waste reduction. Still above national average
Tax. In order to conserve natural resources and reduce our impact on climate change we need to reduce the amount of waste we create, reuse more of the waste we currently throw away and increase our recycling rates
% new homes built on previously developed land
Corporate BVPI 106
(2005) 3,
s an
e
urban nature of the borough
fe and off
TEN 2006/7 90.4% Gap 63% After reaching its peak in the period 2001-0the use of previously developed land hadropped off. However, there has been increase in 2006/07. Rate of use of previously developed land is much higher inCheltenham than for the SW, reflecting th
Almost all development is occurring on previously developed sites. The reducing availability of sites is leading to pressures to develop garden areas and pressures for high densities, which impacts on residential amenity, opportunities for food growing, wildlicapacity to surface absorb run
% of gardens built on Rob Lindsey Gap Gap Gap Garden evidence??
Green space data her
Gap Gap Gap Data on access to open space? Amount of John Crowt space available?
Light pollution Campaign Protect
to Rural
England (see map at rear of document)
2000 Saturated increased from 1993 to 2000 and Cheltenham is now classified as saturated
and
Light pollution has Cheltenham suffers from saturated light pollution, which can be an issue for local residents and interest groups as well as adding to energy use carbon emissions
Air Pollution: Air Quality Management
ational 2 (2007)
a
Areas
UK NAir Quality Archive
2006/7 0 Gap 3 There is no Air Quality Management Aredesignated in Cheltenham indicating that pollution levels are not severe.
Air quality is not such a significant local issue to warrant designating an AQM area
No. of sites of potential concern with
N Corporate BVPI 216A
200 Gap
r spe ect to contamination
TE 6/7 608 Gap Too little information to give an accurate picture yet.
Cheltenham’s Ecological footprint – global hectares per
www.Ecologicalbudget.org.uk WWF/ Stockholm
2005/6 5.4 gha 5.24 gha Our target footprint should be 1.8 gha if we are to live within our ecological budget – in the UK we use 5.4 gha and are 15th highest the world. Cheltenham is above the regional
5.39 gha Our ecological footprint shows
that we consume more than ourfair share of the planet’s resources, needing three
Cheltenham Core Strategy Sustainability Appraisal Scoping report – revised April 2008 Page 25
Key Indicator Source Year Cheltenham National Regional Trend Sustainability issue data data data
person EnvirInstitute
onment to
y sources, reducing our ng our
average. planets’ worth of resourcessustain our current lifestyles. We need to move towards a more sustainable way of living, reducing and recycling waste, conserving energy and natural resources, reducing our dependency on carbon-based energneed to travel and supportilocal economy
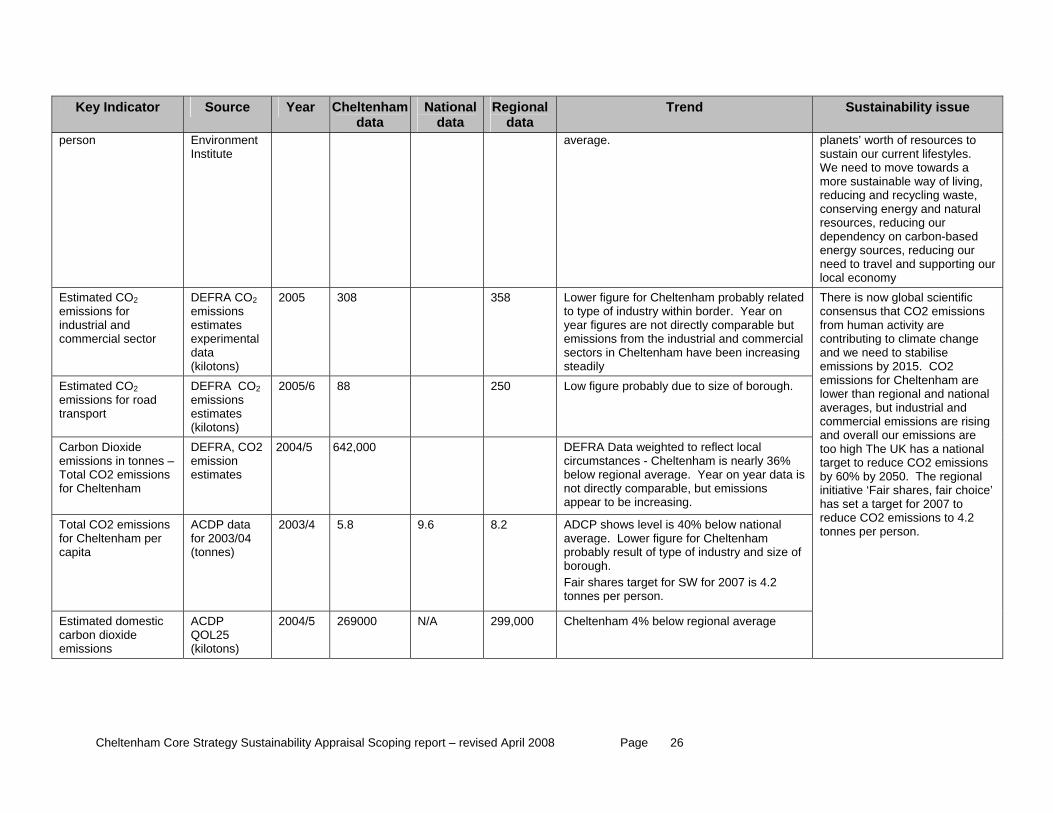
Estimated CO2 emissions for industrial and commercial sector
2 emissions estimates experimental data (kilotons)
2005 308 358 lated
ial een increasing
steadily
DEFRA CO Lower figure for Cheltenham probably reto type of industry within border. Year on year figures are not directly comparable but emissions from the industrial and commercsectors in Cheltenham have b
Estimated CO2 DEFRA CO2
(kilotons)
2005/6 88 250 Low figure probably due to size of borough. emissions for road transport
emissions estimates
Carbon Dioxide emissions in tonnes –
sions for Cheltenham
O2 2004/5 642,000
nham is nearly 36% is
be increasing.
Total CO2 emis
DEFRA, Cemission estimates
DEFRA Data weighted to reflect local circumstances - Cheltebelow regional average. Year on year datanot directly comparable, but emissions appear to
Total CO2 emissions for Cheltenham per
2003/4
5.8
9.6
8.2
ADCP shows level is 40% below national average. Lower figure for Cheltenham
of capita
ACDP data for 2003/04 (tonnes)
probably result of type of industry and sizeborough. Fair shares target for SW for 2007 is 4.2 tonnes per person.
Estimated domestic carbon dioxide emissions
ACDP QOL25 (kilotons)
2004/5 269000 00
verages, but industrial and commercial emissions are rising nd overall our emissions are
too high The UK has a national ssions
N/A 299,0 Cheltenham 4% below regional average
There is now global scientific consensus that CO2 emissions from human activity are contributing to climate changeand we need to stabilise emissions by 2015. CO2 emissions for Cheltenham are lower than regional and national a
a
target to reduce CO2 emiby 60% by 2050. The regional initiative ‘Fair shares, fair choice’ has set a target for 2007 to reduce CO2 emissions to 4.2 tonnes per person.
Cheltenham Core Strategy Sustainability Appraisal Scoping report – revised April 2008 Page 26
Key Indicator Source Year Cheltenham National Regional Trend Sustainability issue data data data
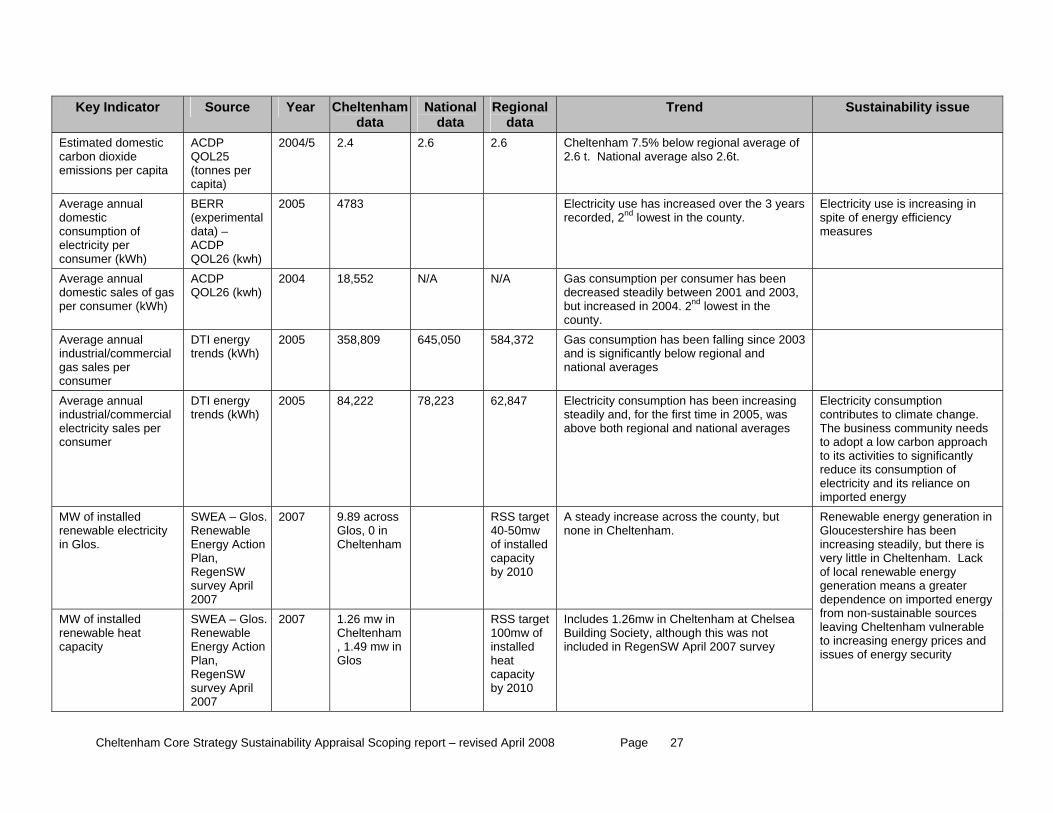
Estimatecarbon
d domestic dioxide
emissions per capita er capita)
2004/5 2.4 2.6 2.6 m 7.5% below regional average of average also 2.6t.
ACDP QOL25 (tonnes p
Cheltenha2.6 t. National
Average annual domestic consumption of electricity per consumer (kWh)
BERR (experimental data) – ACDP QOL26 (kwh)
2005 4783 Electricity use has increased over the 3 years recorded, 2nd lowest in the county.
Electricity use is increasing in spite of energy efficiency measures
Average annual domestic sales of gas
Wh)
ACDP QOL26 (kwh)
2004 18,552 N/A N/A Gas consumption per consumer has been decreased steadily between 2001 and 2003,
per consumer (k but increased in 2004. 2nd lowest in the county.
Average annual industrial/commercial gas sales per consumer
2005 358,809 645,050 584,372 DTI energy trends (kWh)
Gas consumption has been falling since 2003 and is significantly below regional and national averages
Average annual industrial/commercial electricity sales per consumer
h) 5 84,222 78,223 7
steadily and, for the first time in 2005, was above both regional and national averages
e. DTI energy trends (kW
200 62,84 Electricity consumption has been increasing Electricity consumption contributes to climate changThe business community needs to adopt a low carbon approach to its activities to significantly reduce its consumption of electricity and its reliance on imported energy
MW of installed SWEA – Glos.
n
egenSW urvey April 007
2007 9.89 across , 0 in
heltenham
RSS target 0mw
f installed capacity by 2010
county, but renewable electricity in Glos.
Renewable Energy ActioPlan, Rs2
GlosC
40-5o
A steady increase across the none in Cheltenham.
MW of installed renewable heat capacity
SWEA RenewaEnergy AcPlan,
– Glos. ble
tion
RegenSW survey April 2007
in am
, 1.49 mw in Glos
et
installed heat capacity by 2010
ea
included in RegenSW April 2007 survey
in
, but there is ery little in Cheltenham. Lack f local renewable energy
generation means a greater dependence on imported energy from non-sustainable sources leaving Cheltenham vulnerable to increasing energy prices and issues of energy security
2007 1.26 mwCheltenh
RSS targ100mw of
Includes 1.26mw in Cheltenham at ChelsBuilding Society, although this was not
Renewable energy generationGloucestershire has been increasing steadilyvo
Cheltenham Core Strategy Sustainability Appraisal Scoping report – revised April 2008 Page 27
Key Indicator Source Year Cheltenham National Regional Trend Sustainability issue data data data
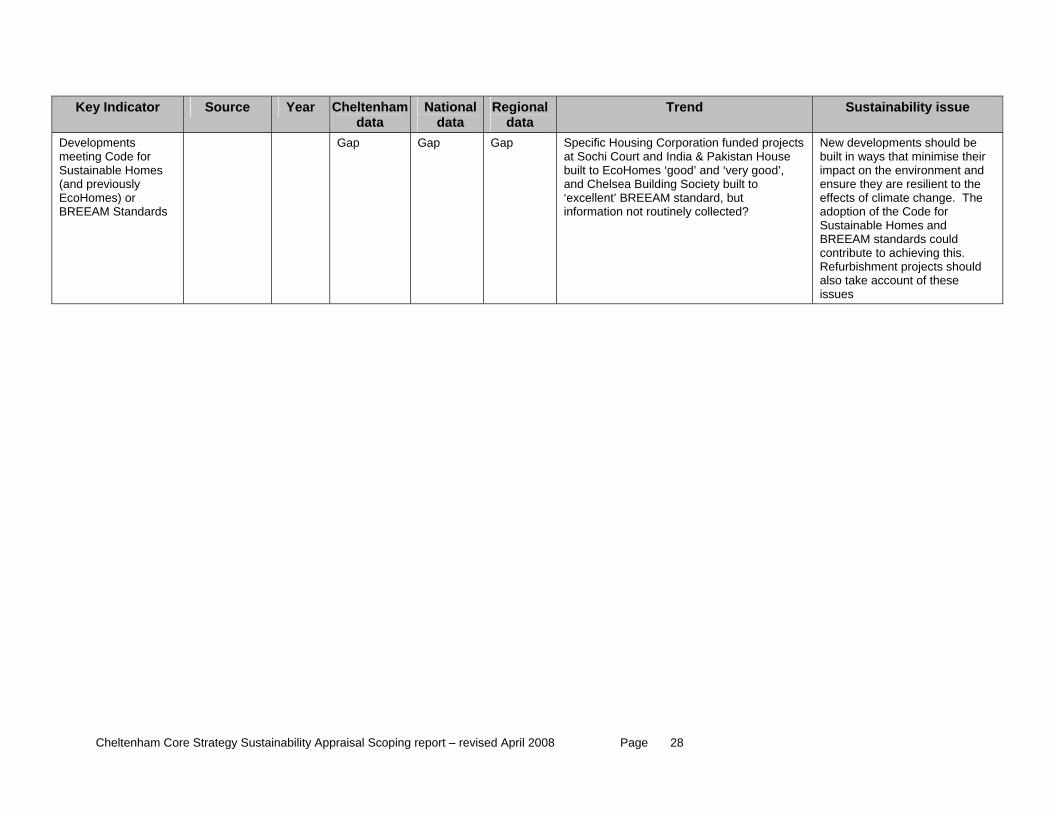
Developments meeting Code for Sustainable Homes (and previously EcoHomes) or
rds
good’, and Chelsea Building Society built to ‘excellent’ BREEAM standard, but
ew developments should be built in ways that minimise their impact on the environment and ensure they are resilient to the effects of climate change. The
tandards could contribute to achieving this. Refurbishment projects should lso take account of these
issues
BREEAM Standa
Gap Gap Gap Specific Housing Corporation funded projects at Sochi Court and India & Pakistan House built to EcoHomes ‘good’ and ‘very
information not routinely collected?
N
adoption of the Code for Sustainable Homes and BREEAM s
a
Cheltenham Core Strategy Sustainability Appraisal Scoping report – revised April 2008 Page 28
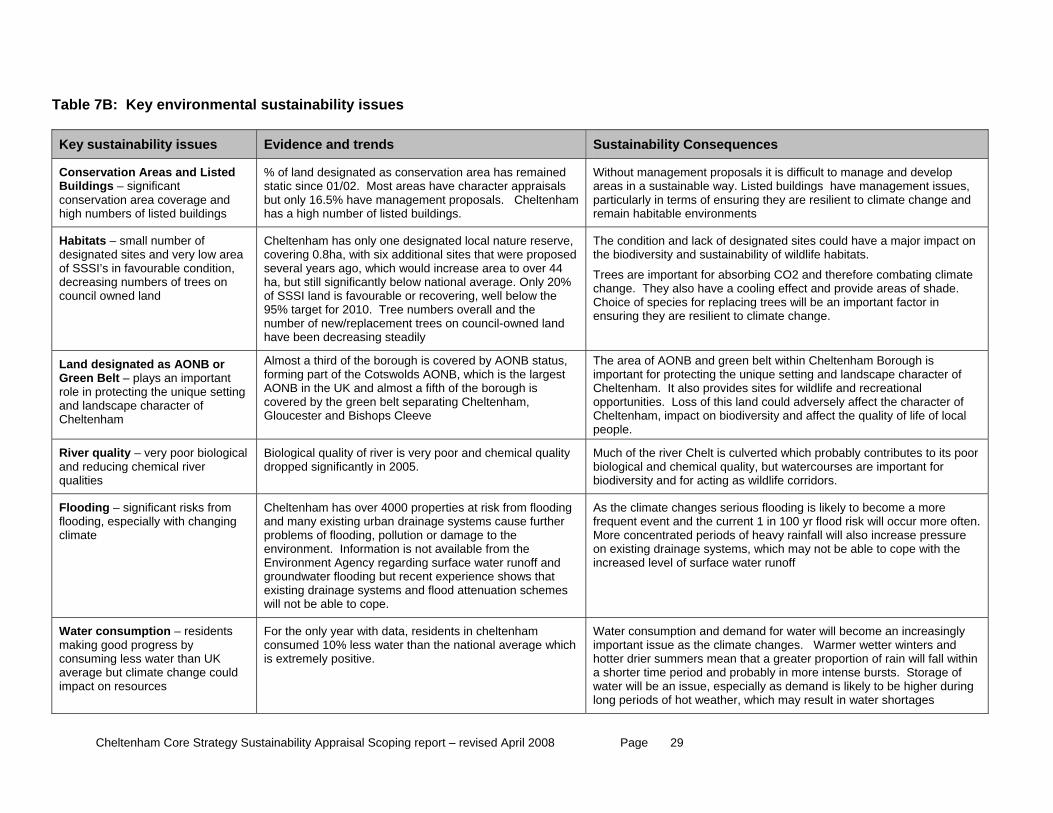
Table 7B: Key environmental sustainability issues Key sustainability issues Evidence and trends Sustainability Consequences
Conservation AreasBuildings – significconservation arhigh numbers of listed
and Listed ant
ea coverage and buildings
% of land designated as conservation area has remainestatic since 01/02. Most areas have character appraisalbut only 16.5% have management proposals. Cheltenhhas a high number of listed buildings.
ifficulding
ng they are res
d s am
Without management proposals it is dareas in a sustainable way. Listed buiparticularly in terms of ensuriremain habitable environment
lt to manage and develop s have management issues, silient to climate change and
Habitats – small number of designated sites and very low area of SSSI’s in favourable condition, decreasing numbers of trees on council owned land
Cheltenham has only one designated local nature reserve, covering 0.8ha, with six additional sites that were propos several years ago, which would increase area to over 44 ha, but still significantly below national average. Only 20% of SSSI land is favourable or recovering, well below the 95% target for 2010. Tree numbers overall and the number of new/replacement trees on council-owned land have been decreasing steadily
The condition and lack of designated sites on the biodiversity and sustainability of wildlif
Trees are important for absorbing CO2 anchange. They also have a cooling effect aChoice of species for replacing trees will b ortant factor in ensuring they are resilient to climate change.
ed could have a major impact e habitats.
d therefore combating climate nd provide areas of shade. e an imp
Land designated as AONB or Green Belt – plays an important role in protecting the unique setting and landscape character of Cheltenham
Almost a third of the borough is covered by AONB status, forming part of the Cotswolds AONB, which is the largest AONB in the UK and almost a fifth of the borough is covered by the green belt separating Cheltenham, Gloucester and Bishops Cleeve
The area of AONB and green belt within Cheltenham Borough is important for protecting the unique setting and landscape character of Cheltenham. It also provides sites for wildlife and recreational opportunities. Loss of this land could adversely affect the character of Cheltenham, impact on biodiversity and affect the quality of life of local people.
River quality – very poor biological and reducing chemical river qualities
Biological quality of river is very poor and chemical quality dropped significantly in 2005.
Much of the river Chelt is culverted which probably contributes to its poor biological and chemical quality, but watercourses are important for biodiversity and for acting as wildlife corridors.
Flooding – significant risks from flooding, especially with changing climate
Cheltenham has over 4000 properties at risk from flooding and many existing urban drainage systems cause further problems of flooding, pollution or damage to the environment. Information is not available from the Environment Agency regarding surface water runoff and groundwater flooding but recent experience shows that existing drainage systems and flood attenuation schemes will not be able to cope.
As the climate changes serious flooding is likely to become a more frequent event and the current 1 in 100 yr flood risk will occur more often. More concentrated periods of heavy rainfall will also increase pressure on existing drainage systems, which may not be able to cope with the increased level of surface water runoff
Water consumption – residents making good progress by consuming less water than UK average but climate change could impact on resources
For the only year with data, residents in cheltenham consumed 10% less water than the national average which is extremely positive.
Water consumption and demand for water will become an increasingly important issue as the climate changes. Warmer wetter winters and hotter drier summers mean that a greater proportion of rain will fall within a shorter time period and probably in more intense bursts. Storage of water will be an issue, especially as demand is likely to be higher during long periods of hot weather, which may result in water shortages
Cheltenham Core Strategy Sustainability Appraisal Scoping report – revised April 2008 Page 29
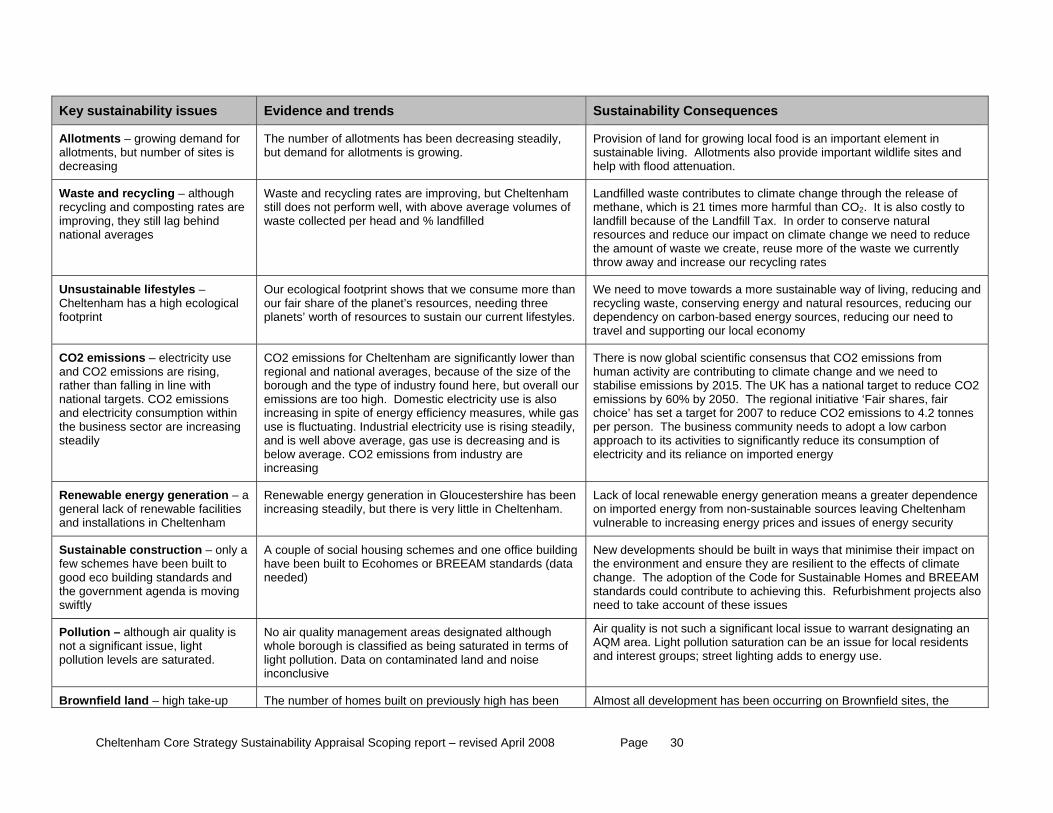
Key sustainability issues Evidence and trends Sustainability Consequences
Allotments – growing demandallotments, but number of sites
for is
decreasing
has been decreasing steadily, is growing.
od is an important element in ovide important wildlife sites and
help with flood attenuation.
The number of allotmentsbut demand for allotments
Provision of land for growing local fosustainable living. Allotments also pr
Waste and recyclingrecycling and composting rates arimproving, they still lag behind
– although e
national averages d ax. In order to conserve natural
resources and reduce our impact on climate change we need to reduce
Waste and recycling rates are improving, but Cheltenham still does not perform well, with above average volumes of waste collected per head and % landfille
Landfilled waste contributes to climate change through the release of methane, which is 21 times more harmful than CO2. It is also costly to landfill because of the Landfill T
the amount of waste we create, reuse more of the waste we currently throw away and increase our recycling rates
Unsustainable lifestyles – Cheltenham has a high ecological footprint yles.
Our ecological footprint shows that we consume more than our fair share of the planet’s resources, needing three planets’ worth of resources to sustain our current lifest
We need to move towards a more sustainable way of living, reducing andrecycling waste, conserving energy and natural resources, reducing our dependency on carbon-based energy sources, reducing our need to travel and supporting our local economy
CO2 emissions – electricity use
within sector are increasing
steadily
r so
hile gas ectricity use is rising steadily,
and is well above average, gas use is decreasing and is
oach to its activities to significantly reduce its consumption of
and CO2 emissions are rising, rather than falling in line with national targets. CO2 emissions and electricity consumption the business
CO2 emissions for Cheltenham are significantly lower thanregional and national averages, because of the size of the borough and the type of industry found here, but overall ouemissions are too high. Domestic electricity use is alincreasing in spite of energy efficiency measures, wuse is fluctuating. Industrial el
below average. CO2 emissions from industry are increasing
There is now global scientific consensus that CO2 emissions fromhuman activity are contributing to climate change and we need to stabilise emissions by 2015. The UK has a national target to reduce CO2 emissions by 60% by 2050. The regional initiative ‘Fair shares, fair choice’ has set a target for 2007 to reduce CO2 emissions to 4.2 tonnesper person. The business community needs to adopt a low carbon apprelectricity and its reliance on imported energy
Renewable energy generation – a s
Renewable energy generation in Gloucestershire has been eater dependence am general lack of renewable facilitie
and installations in Cheltenham increasing steadily, but there is very little in Cheltenham.
Lack of local renewable energy generation means a gron imported energy from non-sustainable sources leaving Cheltenhvulnerable to increasing energy prices and issues of energy security
Sustainable construction – only a few schemes have been built to good eco building standards and the government agenda is moving swiftly
building a
for Sustainable Homes and BREEAM standards could contribute to achieving this. Refurbishment projects also need to take account of these issues
A couple of social housing schemes and one office have been built to Ecohomes or BREEAM standards (datneeded)
New developments should be built in ways that minimise their impact onthe environment and ensure they are resilient to the effects of climate change. The adoption of the Code
Pollution – although air quality is not a significant issue, light pollution levels are saturated.
No air quality management areas designated althougwhole borough is classified as being saturated in terms of light pollution. Data on contaminated land and noise inconclusive
h Air quality is not such a significant local issue to warrant designating anAQM area. Light pollution saturation can be an issue for local residents and interest groups; street lighting adds to energy use.
Brownfield land – high take-up The number of homes built on previously high has been Almost all development has been occurring on Brownfield sites, the
Cheltenham Core Strategy Sustainability Appraisal Scoping report – revised April 2008 Page 30
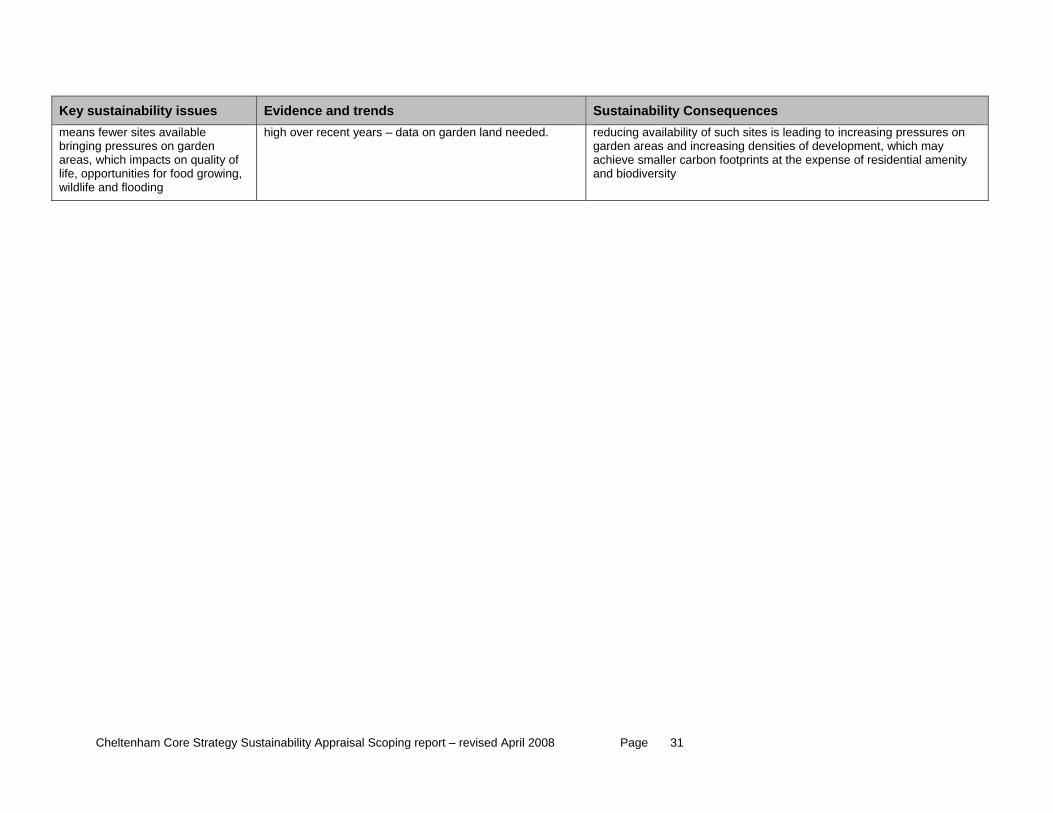
Key sustainability issues Evidence and trends Sustainability Consequences means fewer sites available
ities for food growing, wildlife and flooding
high over recent years – data on garden land needed. reducing availability of such sites is leading to increasing pressures on bringing pressures on garden areas, which impacts on quality of life, opportun
garden areas and increasing densities of development, which may achieve smaller carbon footprints at the expense of residential amenity and biodiversity
Cheltenham Core Strategy Sustainability Appraisal Scoping report – revised April 2008 Page 31
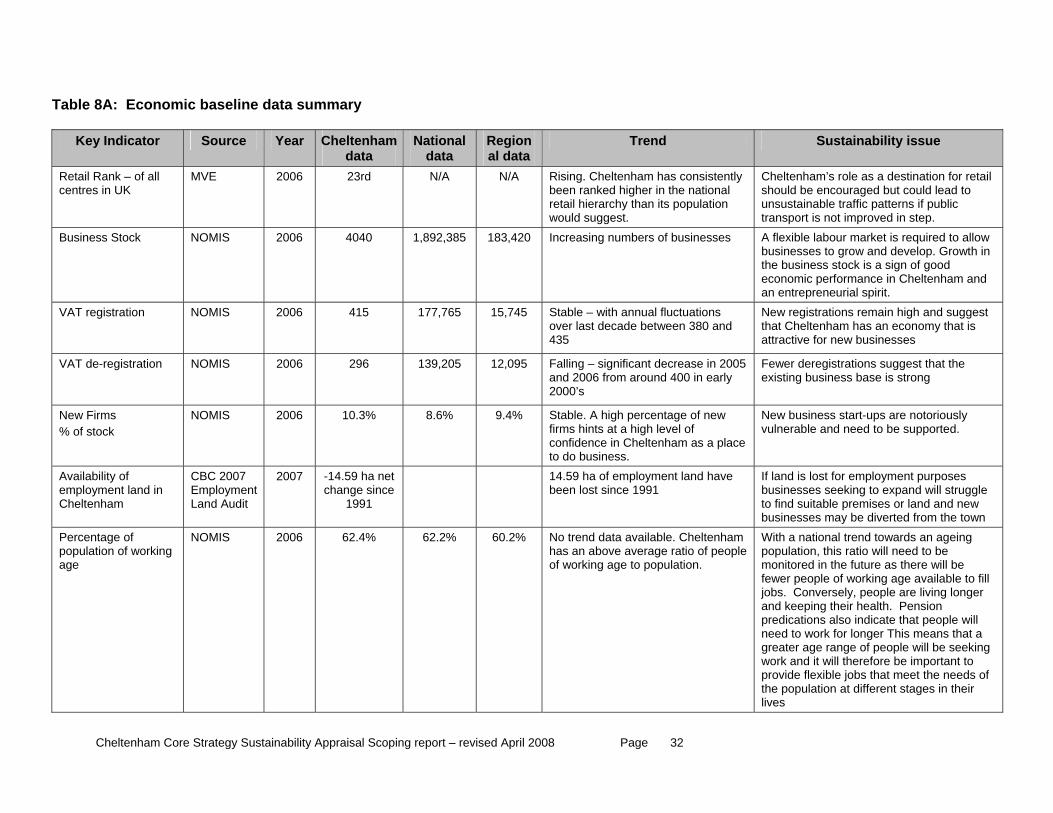
Table 8A: Economic baseline data summary
Key Indicator Source Year Cheltenham National Regiondata data al data
Trend Sustainability issue
Retail Rank – of all centres in UK
MVE 2006 23rd N/A N/A Rising. been rank the national retail hierarchy than its population would suggest.
l should be encouraged but could lead to unsustainable traffic patterns if public transport is not improved in step.
Cheltenham has consistently ed higher in
Cheltenham’s role as a destination for retai
Business Stock NOMIS 2006 4040 1,892,385 183,420 Increasing numbers of businesses A flexible labour market is required to allow businesses to grow and develop. Growth in the business stock is a sign of good economic performance in Cheltenham and an entrepreneurial spirit.
VAT registration NOMIS 2006 415 177,765 15,745 Stable – with annual fluctuations over last decade between 380 and 435
New registrations remain high and suggest that Cheltenham has an economy that is attractive for new businesses
VAT de-registration NOMIS 2006 296 139,205 12,095 Falling – significant decrease in 2005 and 2006 from around 400 in early 2000’s
Fewer deregistrations suggest that the existing business base is strong
New Firms % of stock
NOMIS 2006 10.3% 8.6% 9.4% Stable. A high percentage of new firms hints at a high level of confidence in Cheltenham as a place to do business.
New business start-ups are notoriously vulnerable and need to be supported.
Availability of employment land in Cheltenham
CBC 2007 Employment Land Audit
2007 -14.59 ha net change since
1991
14.59 ha of employment land have been lost since 1991
If land is lost for employment purposes businesses seeking to expand will struggle to find suitable premises or land and new businesses may be diverted from the town
Percentage of population of working age
NOMIS 2006 62.4% 62.2% 60.2% No trend data available. Cheltenham has an above average ratio of people of working age to population.
With a national trend towards an ageing population, this ratio will need to be monitored in the future as there will be fewer people of working age available to fill jobs. Conversely, people are living longer and keeping their health. Pension predications also indicate that people will need to work for longer This means that a greater age range of people will be seeking work and it will therefore be important to provide flexible jobs that meet the needs of the population at different stages in their lives
Cheltenham Core Strategy Sustainability Appraisal Scoping report – revised April 2008 Page 32
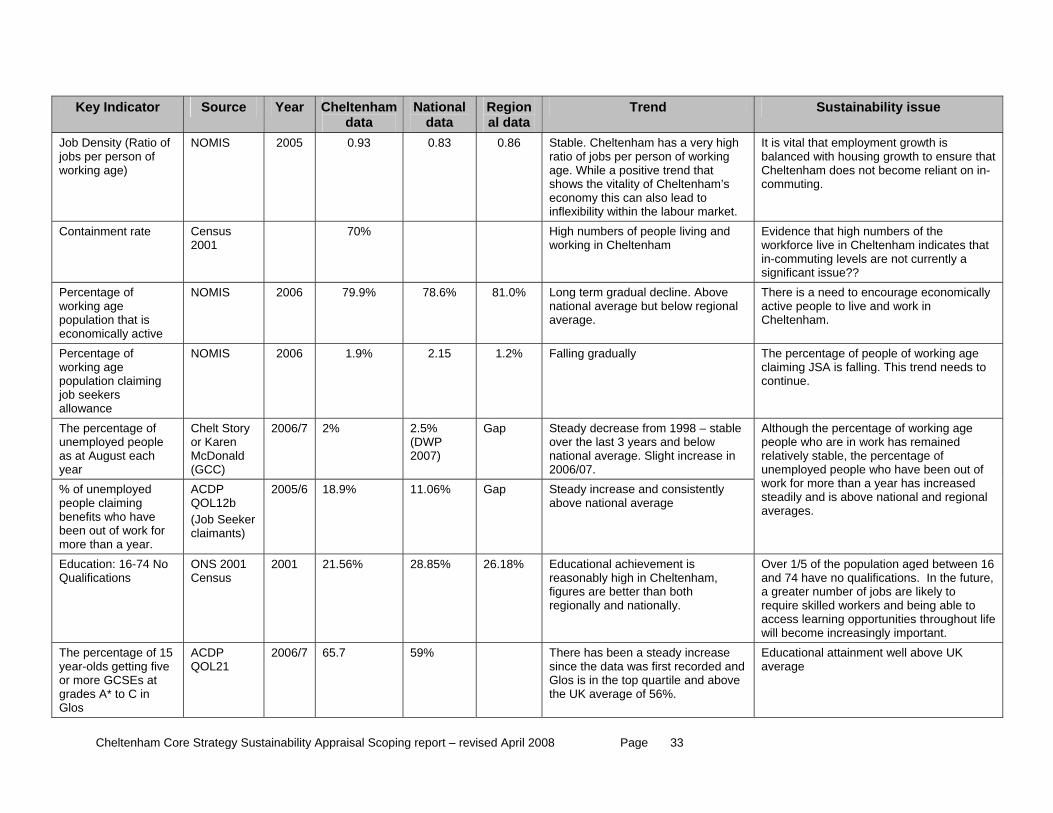
Key Indicator Source Year Cheltenham data
National Region Trend Sustainability issue data al data
Jo
working age)
N Stable. Chelte s a very high ratio of jobs pe working age. While a positive trend that
.
It is vital t balanced to ensure that Cheltenham does not become reliant on in-
b Density (Ratio ofjobs per person of
OMIS 2005 0.93 0.83 0.86 nham har person of
shows the vitality of Cheltenham’s economy this can also lead to inflexibility within the labour market
hat employment growth iswith housing growth
commuting.
Containment rate Census 70% rs of people living and 2001
High numbeworking in Cheltenham
Evidence that high numbers of the workforce live in Cheltenham indicates that in-commuting levels are not currently a significant issue??
Percentage of working age
economically active
NOMIS 2006 79.9% 78.6% 81.0% Long term gradual decline. Above national average but below regional work in
population that is average.
There is a need to encourage economically active people to live and Cheltenham.
Percentage of
job seekers allowance
NOMIS 2006 1.9% 2.15 1.2% Falling gradually orking age to working age
population claiming
The percentage of people of wclaiming JSA is falling. This trend needscontinue.
The percentage of people
as at August each year
y or Karen McDonald (GCC)
6/7 2% (DWP 2007)
unemployedChelt Stor 200 2.5% Gap Steady decrease from 1998 – stable
over the last 3 years and below national average. Slight increase in 2006/07.
% of unemployed people claiming benefits who have been out of work for
ar.
er s)
11.06% Gap ge
relatively stable, the percentage of unemployed people who have been out of
more than a ye
ACDP QOL12b (Job Seekclaimant
2005/6 18.9% Steady increase and consistently above national avera
Although the percentage of working agepeople who are in work has remained
work for more than a year has increased steadily and is above national and regional averages.
Education: 16-74 No Qualifications
ONS 2001 Census
2001 21.56% 28.85% 26.18% m,
figures are better than both regionally and nationally.
n 16
fe
Educational achievement is reasonably high in Cheltenha
Over 1/5 of the population aged betweeand 74 have no qualifications. In the future, a greater number of jobs are likely to require skilled workers and being able to access learning opportunities throughout liwill become increasingly important.
The percentage of 15 year-olds getting five or more GCSEs at grades A* to C in Glos
ACDP QOL21
2006/7 65.7 59% There has been a steady increase since the data was first recorded and Glos is in the top quartile and above the UK average of 56%.
Educational attainment well above UK average
Cheltenham Core Strategy Sustainability Appraisal Scoping report – revised April 2008 Page 33
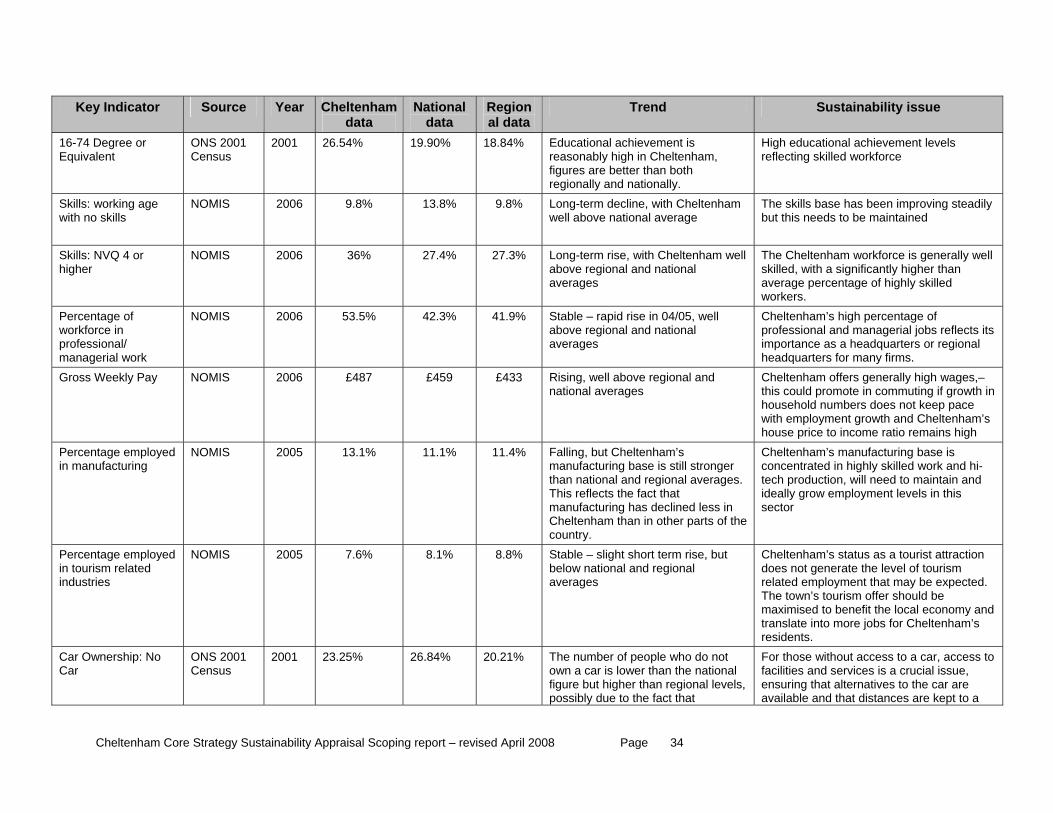
Cheltenham National RegionKey Indicator Source Year Trend Sustainability issue data data al data
1 26.5 19 18 2001 4% .90% .84% Educational achievement is reasonably high in Cheltenham, figures are better than both regionally and nationally.
High educational achievement levelsreflecting skilled workforce
16-74 Degree or Equivalent
ONS 200Census
Skills: working age with no skills
NOMIS 2006 9.8% 13.8% 9.8% enham The skills base has been improving steadily but this needs to be maintained
Long-term decline, with Cheltwell above national average
Skills: NVQ 4 or higher
NOMIS 2006 36% 27.4% 27.3% ltenham well above regional and national averages tage of highly skilled
Long-term rise, with Che The Cheltenham workforce is generally well skilled, with a significantly higher than average percenworkers.
Percentage of workforce in professional/ managerial work
NOMIS 2006 53.5% 42.3% 41.9% onal and national
averages d managerial jobs reflects its
importance as a headquarters or regional
Stable – rapid rise in 04/05, well above regi
Cheltenham’s high percentage of professional an
headquarters for many firms. Gross Weekly Pay NOMIS 2006 £487 £459 £433 Rising, well above regional and
national averages d promote in commuting if growth in household numbers does not keep pace with employment growth and Cheltenham’s
Cheltenham offers generally high wages,– this coul
house price to income ratio remains high Percentage employein manufacturing
d 2005 13.1% % 11.4%
nal and regional averages.
ed less in r parts of the
country.
NOMIS 11.1 Falling, but Cheltenham’s manufacturing base is still stronger than natioThis reflects the fact that manufacturing has declinCheltenham than in othe
Cheltenham’s manufacturing base is concentrated in highly skilled work and hi-tech production, will need to maintain and ideally grow employment levels in this sector
Percentage employed NOMIS 2005 7.6% 8.1% 8.8% Stable – slight short term rise, but Cheltenham’s status as a tourist attraction
nd
in tourism related industries
below national and regional averages
does not generate the level of tourism related employment that may be expected. The town’s tourism offer should be maximised to benefit the local economy atranslate into more jobs for Cheltenham’s residents.
Car Ownership: No Car
ONS 20Census
01 % % 0.21%
ss to and services is a crucial issue,
ensuring that alternatives to the car are available and that distances are kept to a
2001 23.25 26.84 2 The number of people who do not own a car is lower than the national figure but higher than regional levels,possibly due to the fact that
For those without access to a car, accefacilities
Cheltenham Core Strategy Sustainability Appraisal Scoping report – revised April 2008 Page 34
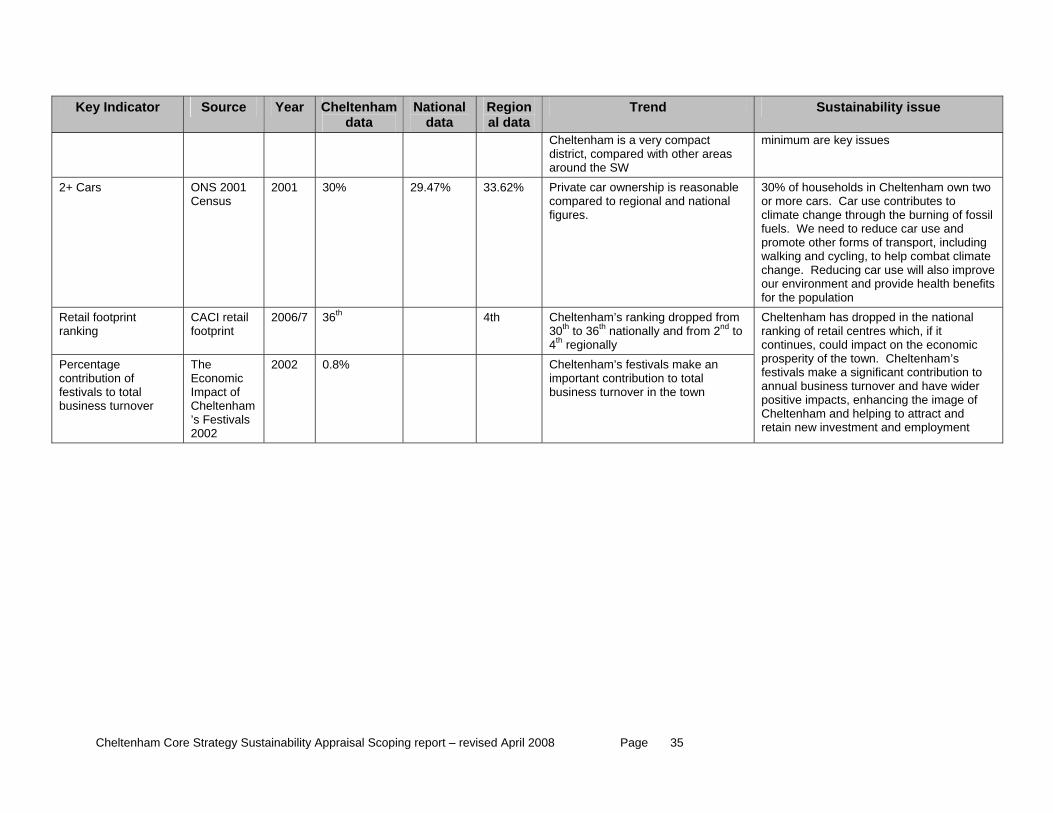
Cheltenham National RegionKey Indicator Source Year Trend Sustainability issue data data al data
Cheltenham is a very compadistrict, compared with other arearound the SW
ct as
minimum are key issues
2+ Cars ONS 2001 2001 30% 29.47% 33.62% sonable 30% of households in Cheltenham own two
use and promote other forms of transport, including
nefits
Census Private car ownership is reacompared to regional and national figures.
or more cars. Car use contributes to climate change through the burning of fossil fuels. We need to reduce car
walking and cycling, to help combat climate change. Reducing car use will also improve our environment and provide health befor the population
Retail footprint ranking
ail 36th 4 om to
CACI retfootprint
2006/7 th Cheltenham’s ranking dropped fr30th to 36th nationally and from 2nd
4th regionally Percentage contribution of festivals to total business turnover
The ic
Cheltenham’s Festivals 2002
2002 0.8% Cheltenham’s festivals make an
tional
ntribution to EconomImpact of
important contribution to total business turnover in the town
Cheltenham has dropped in the naranking of retail centres which, if it continues, could impact on the economic prosperity of the town. Cheltenham’s festivals make a significant coannual business turnover and have wider positive impacts, enhancing the image of Cheltenham and helping to attract and retain new investment and employment
Cheltenham Core Strategy Sustainability Appraisal Scoping report – revised April 2008 Page 35
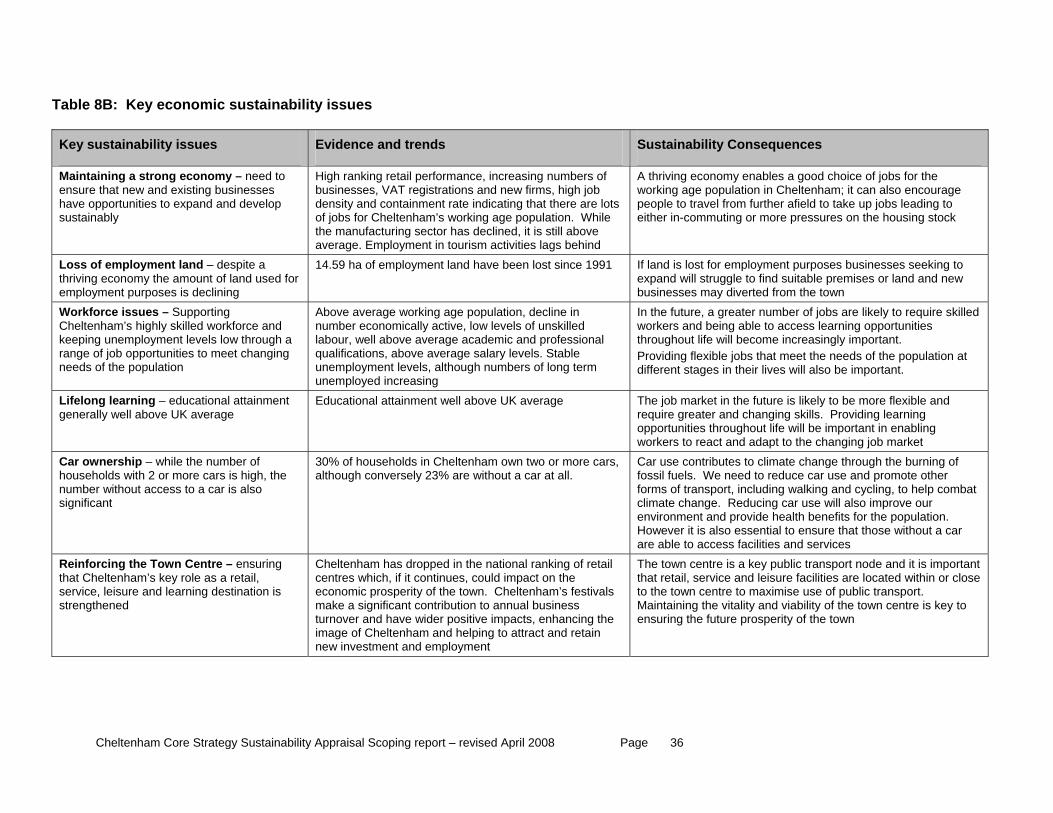
Table 8B: Key economic sustainability issues Key sustainability issues Evidence and trends Sustainability Consequences
Maintaining a strong economy – need to at new and exi sseortunities to ex ve
sustainably
High ranking retail performance, increasing b sses, VAT s rm
y and co indi hatof jobs for Cheltenham’s working age populthe manufacturing sector has declined, it is still abaverage. Employment in tourism activities lags behind
A thriving economy enables a good choice of jobs for the ion fu
g or
ensure thhave opp
sting businepand and de
s lop
numbers of usine
densit registration
ntainment rate and new fi
cating ts, high job there are lots ation. While
ove
working age populatpeople to travel fromeither in-commutin
in Cheltenham; it can also encourage rther afield to take up jobs leading to more pressures on the housing stock
Loss of employment land – despite a thriving economy the amount of land used for employment purposes is declining
14.59 ha of employment land have been lost since 1991 If land is lost for emploexpand will struggle to businesses may divert
yment purposes businesses seeking to find suitable premises or land and new ed from the town
Workforce issues – Supporting ghly skil a
unemployment leve through a range of job opportunities to meet changing
population
erage working age population, decline in n er econom y active, lo els of ulabour, well above average academic and pqualifications, above average salary levels. u oyment levels, although umbers of
yed increasing
In the future, a greater ely to require skilled blec
Providing flexible jobs tn their
Cheltenham’s hikeeping
led workforcels low
nd
needs of the
Above avumb icall w lev nskilled
rofessional Stable
workers and being athroughout life will be
nemplunemplo
n long term different stages i
number of jobs are lik to access learning opportunities
ome increasingly important. hat meet the needs of the population at lives will also be important.
Lifelong learnigenerally well abov
ng – edu nment e UK
Educational attainment well above UK avera t in the frequire greater and chaopportunities throughoworkers to react and ad
cational attai average
ge The job marke uture is likely to be more flexible and nging skills. Providing learning
ut life will be important in enabling apt to the changing job market
Car ownership – while the number of households with 2 or more cars is high, the number without access to a car is also significant
30% of households in Cheltenham own two or more cars, although conversely 23% are without a car at all.
Car use contributes to climate change through the burning of fossil fuels. We need to reduce car use and promote other forms of transport, including walking and cycling, to help combat climate change. Reducing car use will also improve our environment and provide health benefits for the population. However it is also essential to ensure that those without a car are able to access facilities and services
Reinforcing the Town Centre – ensuring that Cheltenham’s key role as a retail, service, leisure and learning destination is strengthened
Cheltenham has dropped in the national ranking of retail centres which, if it continues, could impact on the economic prosperity of the town. Cheltenham’s festivals make a significant contribution to annual business turnover and have wider positive impacts, enhancing the image of Cheltenham and helping to attract and retain new investment and employment
The town centre is a key public transport node and it is important that retail, service and leisure facilities are located within or close to the town centre to maximise use of public transport. Maintaining the vitality and viability of the town centre is key to ensuring the future prosperity of the town
Cheltenham Core Strategy Sustainability Appraisal Scoping report – revised April 2008 Page 36
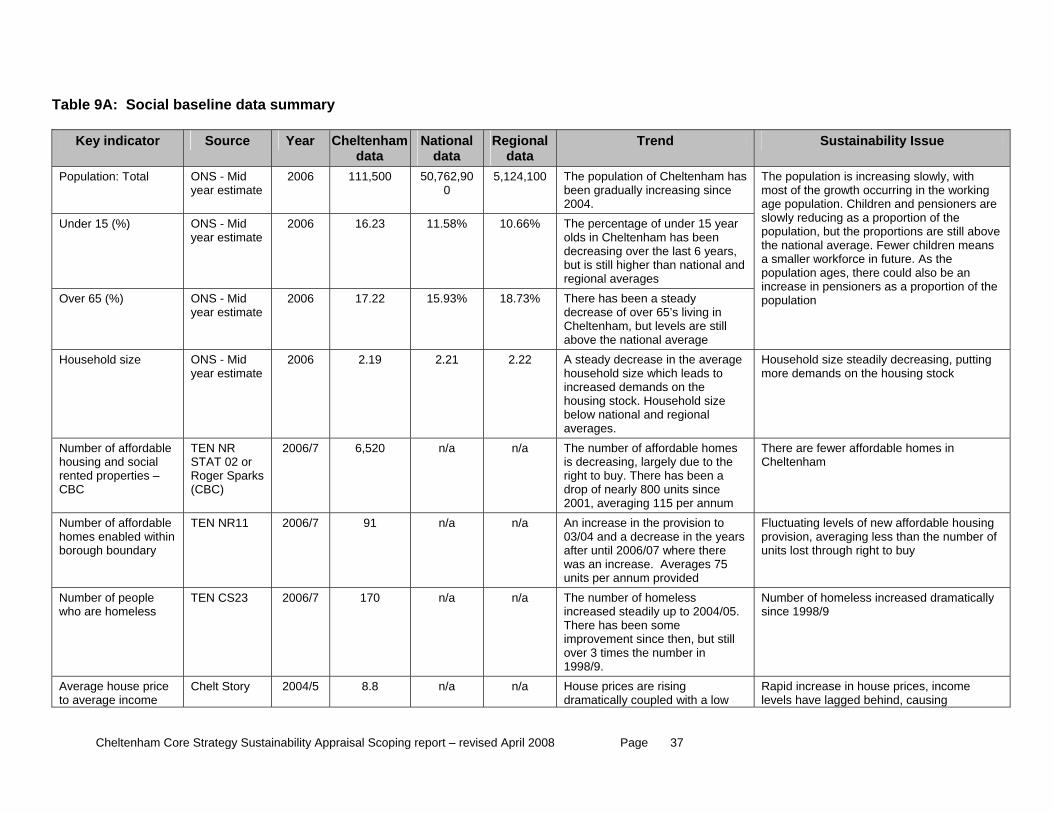
Table 9A: Social baseline data summary
Key indicator Source Year Cheltenham data
Nati Trend Sonal data
Regional data
ustainability Issue
Population: Total ONS - Mid year estimate
2006 latioduall
111,500 50,762,900
5,124,100 The popubeen gra2004.
n of Cheltenham has y increasing since
Under 15 (%) ONS - Mid year estimate
2006 ntaCheltenham has been
ng over the last 6 years, high
16.23 11.58% 10.66% The perceolds in decreasi
ge of under 15 year
but is still regional aver
er than national and ages
Over 65 (%) ONS - Mid mate
2006 17.22 15.93% 18.73% There has beease of oenham,
e na
, with rking rs are
ove the national average. Fewer children means a smaller workforce in future. As the
of the
year estien a steady
population ages, there could also be anincrease in pensioners as a proportion population
decrCheltabove th
ver 65’s living in but levels are still tional average
The population is increasing slowlymost of the growth occurring in the woage population. Children and pensioneslowly reducing as a proportion of the population, but the proportions are still ab
Household size ONS - Mid 2year estimate
006 eady decrold siz
increased deousing stock
below nationaaverages.
ting 2.19 2.21 2.22 A sthouseh
ease in the average e which leads to
mands on the
Household size steadily decreasing, putmore demands on the housing stock
h . Household size l and regional
Number of affordable TEN NR 2006/7 6,520 n/a n/a The number g
y. Tdrop of nearly2001, averag
es in housing and social rented properties – CBC
STAT 02 or Roger Sparks (CBC)
of affordable homes There are fewer affordable homis decreasinright to bu
, largely due to the here has been a 800 units since ing 115 per annum
Cheltenham
Number of affordable homes enabled within borough boundary
TEN NR11 2006/7 91 n/a n/a An increase i03/04 and a dafter until 200
reann
ousing ber of
ight to buy
n the provision to ecrease in the years 6/07 where there
Fluctuating levels of new affordable hprovision, averaging less than the numunits lost through r
was an incunits per a
se. Averages 75 um provided
Number of people who are homel
TEN CS23 ess
2006/ r ased ste
bement since then, but still
over 3 times the number in 1998/9.
ed dramatically 7 170 n/a n/a The numbeincreThere has improve
of homeless adily up to 2004/05. en some
Number of homeless increassince 1998/9
Average house price to average income
Chelt Story 2004/5 8.8 n/a n/a House prices are rising dramatically coupled with a low
Rapid increase in house prices, income levels have lagged behind, causing
Cheltenham Core Strategy Sustainability Appraisal Scoping report – revised April 2008 Page 37
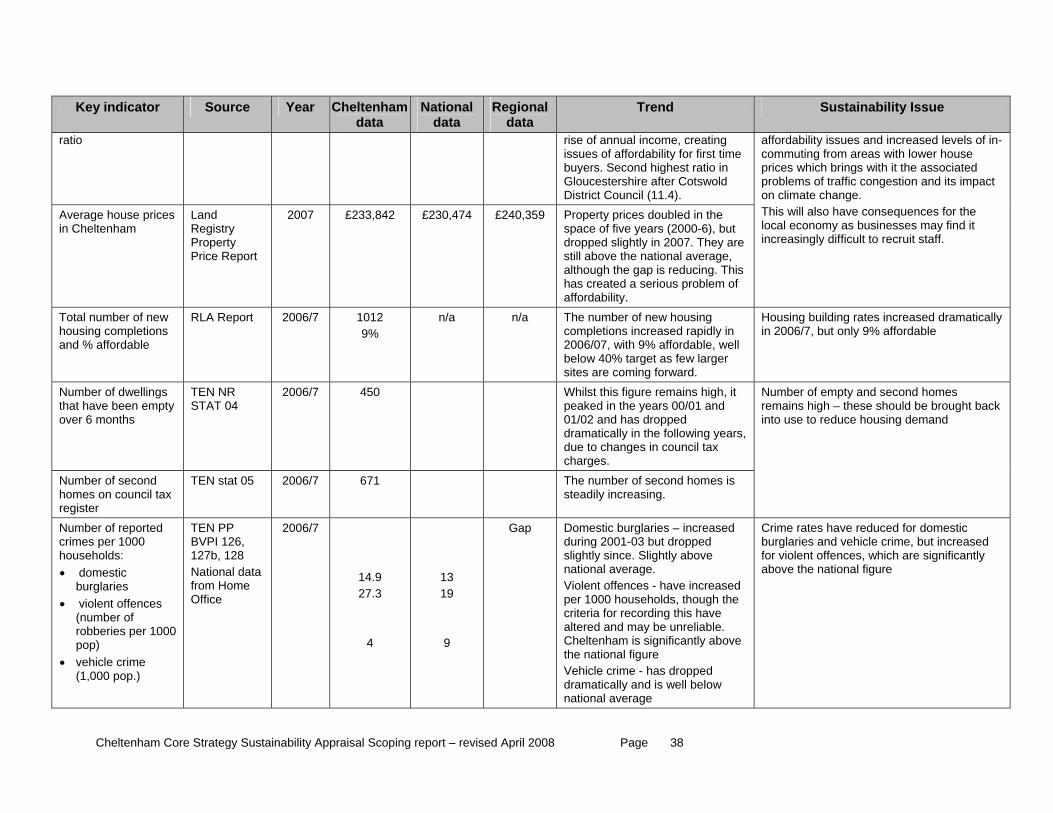
Key indicator Source Year Cheltenham National Regional Trend Sustainability Issue data data data
rat
rise of annua creating issues of afford for first time buyers. Second highest ratio in
io l income,ability
Gloucestershire after Cotswold District Council (11.4).
Average house prices
Land
Price Report
2007 £233,842 £230,474 £240,359 y prices doubled in the
are
us problem of
affordabilit vels of in-commuting use prices which brings with it the associated
act
it in Cheltenham Registry Property
Propertspace of five years (2000-6), but dropped slightly in 2007. They still above the national average, although the gap is reducing. This has created a serioaffordability.
y issues and increased le from areas with lower ho
problems of traffic congestion and its impon climate change. This will also have consequences for the local economy as businesses may findincreasingly difficult to recruit staff.
Total number of new housing completions and % affordable
2006/7 1012 9%
n/a n/a
well
ilding rates increased dramatically in 2006/7, but only 9% affordable
RLA Report The number of new housing completions increased rapidly in2006/07, with 9% affordable, below 40% target as few larger sites are coming forward.
Housing bu
Number of dwellings that have been empty over 6 months
TEN NR STAT 04
2006/7 450 gh, it
y in the following years,
Whilst this figure remains hipeaked in the years 00/01 and 01/02 and has dropped dramaticalldue to changes in council tax charges.
Number of second homes on council tax register
2006/7 671 s
Number of empty and second homes remains high – these should be brought back into use to reduce housing demand
TEN stat 05 The number of second homes isteadily increasing.
Number of reported crimes per 1000 households: • domestic
burglaries
robberies per 1000 pop)
• vehicle crime (1,000 pop.)
BVPI 126, 127b, 128 National data from Home
14.9
4
13
9
reased gh the
rime - has dropped below
significantly above the national figure
• violent offences(number of
TEN PP
Office
2006/7
27.3
19
Gap Domestic burglaries – increasedduring 2001-03 but dropped slightly since. Slightly above national average. Violent offences - have incper 1000 households, thoucriteria for recording this have altered and may be unreliable. Cheltenham is significantly abovethe national figure Vehicle cdramatically and is well national average
Crime rates have reduced for domestic burglaries and vehicle crime, but increased for violent offences, which are
Cheltenham Core Strategy Sustainability Appraisal Scoping report – revised April 2008 Page 38
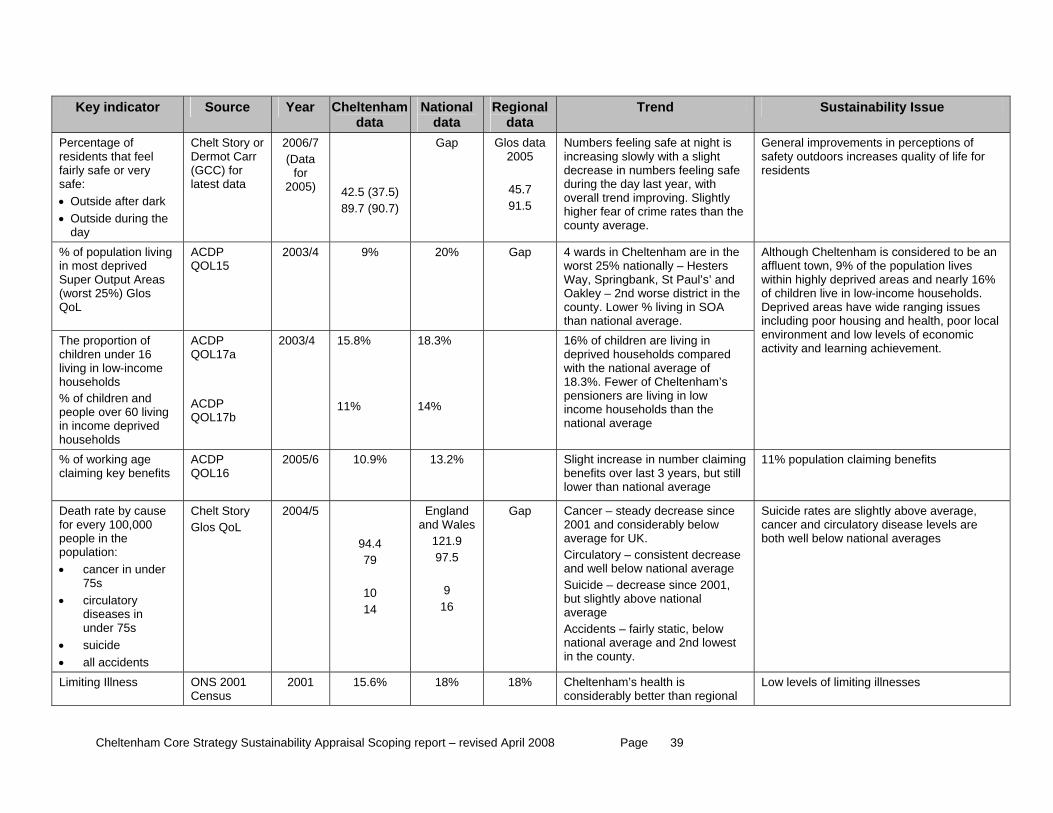
Source Year Cheltenham data
National data
Regional data
Key indicator Trend Sustainability Issue
Perceesid
ntage of ents that feel
fairly safe or very safe: • Outside after dark
Chelt Story or Dermot Carr (GCC) for latest data
2006/7 (Data
for 2005)
42.5 (37.5) 89.7 (90.7)
Gap Glos data 2005
45.7 91.5 the
r
• Outside during the day
Numbers feeling safe at night is increasing slowly with a slight decrease in numbers feeling safe during the day last year, with overall trend improving. Slightly higher fear of crime rates than county average.
General improvements in perceptions of safety outdoors increases quality of life for residents
% of population living in most deprived Super Output Areas (worst 25%) Glos QoL
2003/4 9% 20% Gap
r % living in SOA
ACDP QOL15
4 wards in Cheltenham are in the worst 25% nationally – Hesters Way, Springbank, St Paul’s’ and Oakley – 2nd worse district in the county. Lowethan national average.
The proportion of children under 16 living in low-income households
ved households
ACDP QOL17a
2003/4 15.8% 11%
18.3% 14%
am’s
to be an affluent town, 9% of the population lives within highly deprived areas and nearly 16% of children live in low-income households. Deprived areas have wide ranging issues
% of children and people over 60 living in income depri
ACDP QOL17b
16% of children are living in deprived households compared with the national average of 18.3%. Fewer of Cheltenhpensioners are living in low income households than the national average
Although Cheltenham is considered
including poor housing and health, poor local environment and low levels of economic activity and learning achievement.
% of working age claiming key benefits
ACDP QOL16
2005/6 10.9% 13.2% ming st 3 years, but still
11% population claiming benefits Slight increase in number claibenefits over lalower than national average
Death rate by cause for every 100,000 people in the population: • cancer in under
• y diseases in under 75s
suicide
75s circulator
•• all accidents
Chelt Story
2004/5 England and ales
Gap crease since
ase ge
Suicide rates are slightly above average, e Glos QoL
94.4 79
10 14
W121.9 97.5
9
16
Cancer – steady de2001 and considerably below average for UK. Circulatory – consistent decreand well below national averaSuicide – decrease since 2001, but slightly above national average Accidents – fairly static, below national average and 2nd lowest in the county.
cancer and circulatory disease levels arboth well below national averages
Li ONS 2001 Census
2001 15.6% 18% 18% nal
Low levels of limiting illnesses miting Illness Cheltenham’s health is considerably better than regio
Cheltenham Core Strategy Sustainability Appraisal Scoping report – revised April 2008 Page 39
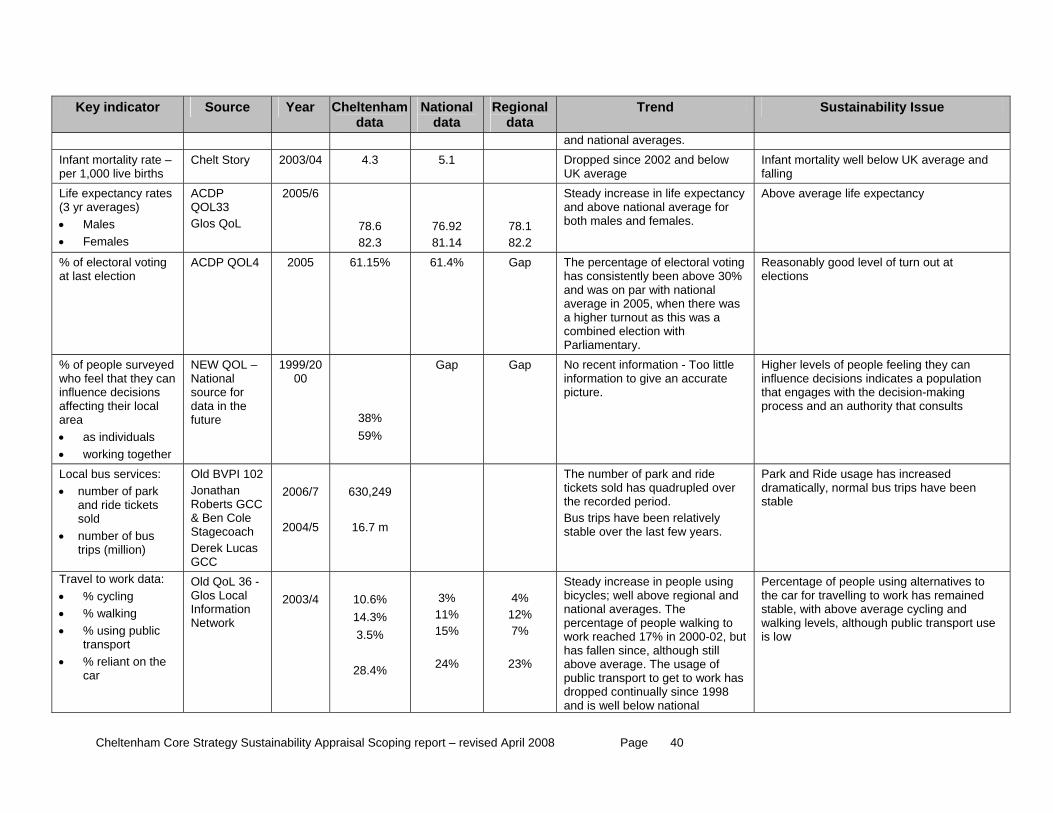
Key indicator Source Year Cheltenham National Regional Trend Sustainability Issue data data data
and national averages. Infant mortality rateper 1,000 live birth
– s
Chelt Story 2003/04 4.3 5.1 Dropped since 2002 and below UK average
Infant mortality well below UK average and falling
Life expectancy rates(3 yr averages)
• Males Fe• males
OL33 Glos QoL
82.3
76.92 81.14
78.1 82.2
cy Above average life expectancy ACDP Q
2005/6
78.6
Steady increase in life expectanand above national average for both males and females.
% of electoral voting at last election
ACDP QOL4 %
2005 61.15 61.4% Gap The percentage of electoral voting has consistently been above 30%and was on par with national average in 2005, when there was a higher turnout as this was a combined election with Parliamentary.
Reasonably good level of turn out at elections
% of people surveyewho feel that they can influence decis
d
ions
g together
L – ational ource for
the
1999/2000
38% 59%
Gap Gap can influence decisions indicates a population that engages with the decision-making process and an authority that consults affecting their local
area • as individuals • workin
NEW QONsdata in future
No recent information - Too little information to give an accurate picture.
Higher levels of people feeling they
Local bus services: • number of park
and ride tickets
I 102 an
Roberts GCC
h Derek Lucas GCC
2006/7 630,249 d
dramatically, normal bus trips have been stable
sold • number of bus
trips (million)
Old BVPJonath
& Ben Cole Stagecoac
2004/5
16.7 m
The number of park and ride tickets sold has quadrupled over the recorded period. Bus trips have been relatively stable over the last few years.
Park and Ride usage has increase
Tr vel to work data: % cya
• cling • % walking
% using pu• t
blic
• % reliant on the car
ransport
Old QoL 36 - Glos Local Information Network
2003/4
3.5%
28.4%
15%
24%
4% 12% 7%
23%
e of people walking to but
. The usage of o work has
Percentage of people using alternatives to the car for travelling to work has remained stable, with above average cycling and walking levels, although public transport use is low
10.6% 14.3%
3% 11%
Steady increase in people using bicycles; well above regional and national averages. The percentagwork reached 17% in 2000-02, has fallen since, although still above averagepublic transport to get tdropped continually since 1998 and is well below national
Cheltenham Core Strategy Sustainability Appraisal Scoping report – revised April 2008 Page 40
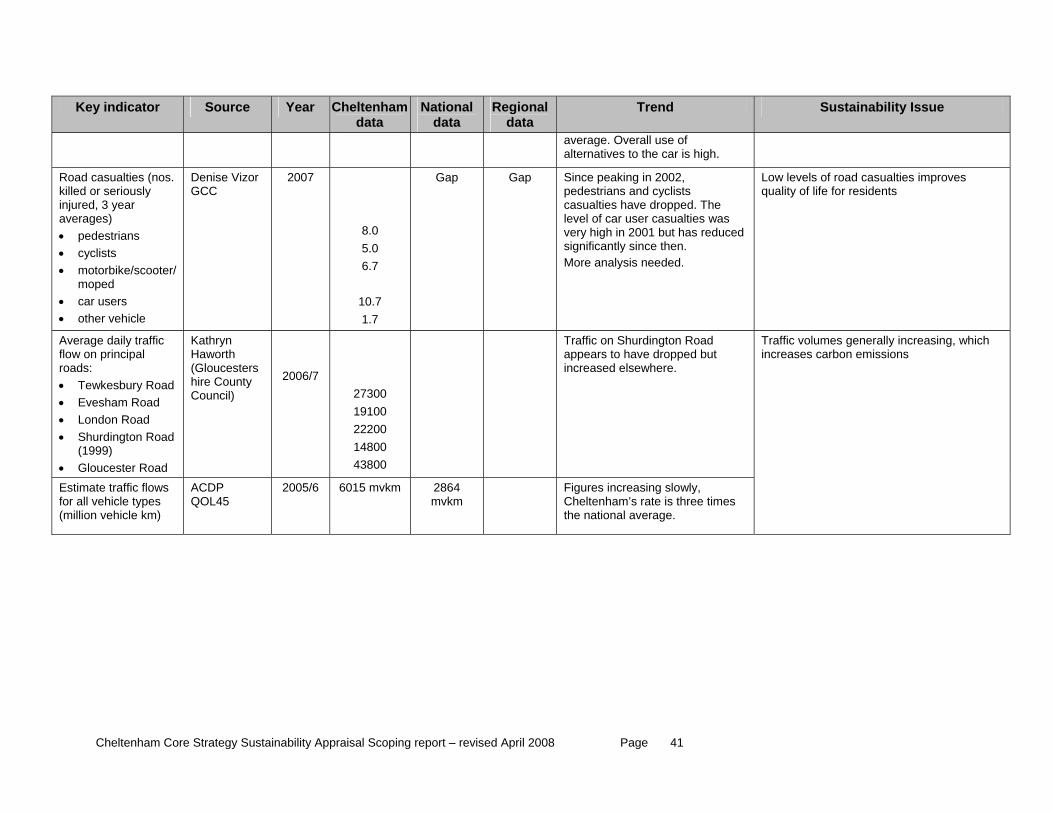
Key indicator Source Year Cheltenham National Regional Trend Sustainability Issue data data data
average. Overall use of alternatives to the car is high.
Road casualties (nos. killed or seriously injured, 3 year averages) • pedestrians • cyclists • motorbike/scooter
moped /
• car users • other vehicle
10.7 1.7
s reduced significantly since then.
Denise Vizor GCC
2007
8.0 5.0 6.7
Gap
Gap Since peaking in 2002, pedestrians and cyclists casualties have dropped. The level of car user casualties was very high in 2001 but ha
More analysis needed.
Low levels of road casualties improves quality of life for residents
Average daily traffic flow on principal
Kathryn Haworth
27 00 19 00
43800
oad e dropped but
roads: • Tewkesbury Road • Evesham Road • London Road • Shurdington Road
(1999) • Gloucester Road
(Gloucestershire County Council)
2006/7 31
22200 14800
Traffic on Shurdington Rappears to havincreased elsewhere.
Estimate traffic flows for
i
6 m 4 mvkm
Traffic volumes generally increasing, which increases carbon emissions
all vehicle types llion vehicle km) (m
ACDP QOL45
2005/6 01 mvk5 286 Figures increasing slowly, Cheltenham’s rate is three times the national average.
Cheltenham Core Strategy Sustainability Appraisal Scoping report – revised April 2008 Page 41
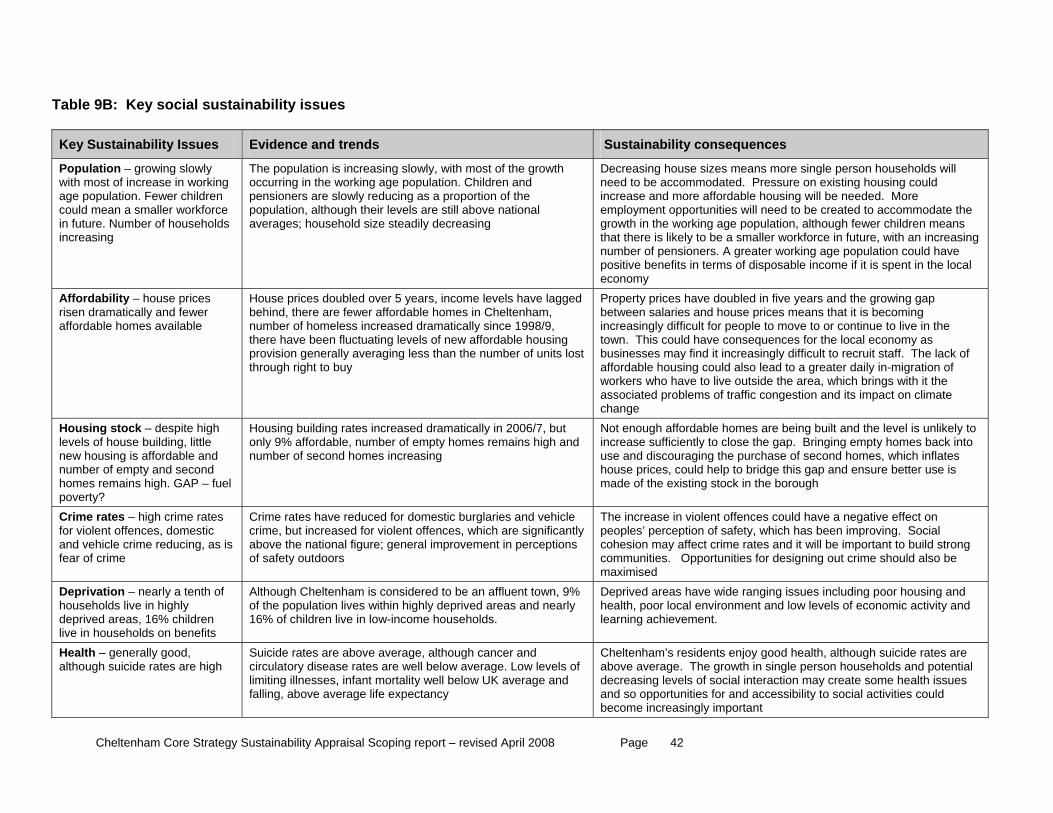
Table 9B: Key social sustainability issues
Key Sustainability Issues Evidence and trends Sustainability consequences
Population – growing slowly
wer c ller workforce
eholds
The population is increasing slowly, with most of the growcurri he working age popul Childre
pensione are slowly ducing as a proportion of the population, althoug evels ove national averages; household size steadily asing
ans more single person households will modated. P affordable ore
es will need to be created to accommodate the population, although fewer children means
aller workforce in future, with an increasing ers. A greater working age population could have
in terms of disposable income if it is spent in the local
with most of increase inage population. Fecould mean a sin future. Nu
working hildren
oc
mam er
increasing b of hous
th Decreasing house sizes meng in t ation. n and
rs reh their l are still ab
decre
need to be accomincrease and moreemployment opportunitigrowth in the working age that there is likely to be a smnumber of pension
ressure on existing housing could housing will be needed. M
positive benefits economy
Af –risen dramaticall
fordability house prices and fewer available
House prices double r 5 years, income levels have lagged behind, there are fe ordable homes in Cheltenham, number of homeless ased dramatically since 1998/9, there hav been fluctuating levels of new affordab ousinprovision enerally averaging less e nu its
ough r ht to buy
Property prices have doubled in five years and the growing gap between salaries and house prices means that it is becoming increasingly difficult for people to move to or continue to live in the
conseqncreas
uld also ation of ve to live outside the area, which brings with it the
associated problems of traffic ongestion and its impact on climate change
yaffordable homes
d vewer aff
o
incree g
le hmber of un
g lost
town. This could havebusinesses may find it iaffordable housing coworkers who ha
than ththr ig
uences for the local economy as ingly difficult to recruit staff. The lack of
lead to a greater daily in-migr
c
Housing stock – despilevels of house building,
w housin
te high little e and cond
A l
Housing building ra eased dramatically in 2006/7, but only 9% affordable r of empty homes remains high and number of second h creasing
Not enough affordable homes are being built and the level is unlikely to increase sufficiently to close the gap. Bringing empty homes back into use and discouraging the purchase of second homes, which inflates house prices, could help to bridge this gap and ensure better use is
stock in the borough
ne g is affordablnumber of empty and sehomes remains high. G P – fuepoverty?
tes incr, numbeomes in
made of the existing
Crime rates – high cfor violent offences, domestic
rime
and vehicle crime reducing, as is fear of crime
Crime rates have reduced for urglaries and vehicrime, but increased for violent offences, which are significabove the national figure; general improvement in perceptions of safety outdoors
es could have a negative effect on ption of safety, which has been improving. Social
cohesion may affect crime rates and it will be important to build strong communities. Opportunities for designing out crime should also be maximised
rates domestic b cle antly
The increase in violent offencpeoples’ perce
Deprivation – nearly a tenth of households live in highly deprived areas, 16% children live in households on benefits
Although Cheltenham is considered to be an affluent town, 9% of the population lives within highly deprived areas and nearly 16% of children live in low-income households.
Deprived areas have wide ranging issues including poor housing and health, poor local environment and low levels of economic activity and learning achievement.
Health – generally good, although suicide rates are high
Suicide rates are above average, although cancer and circulatory disease rates are well below average. Low levels of limiting illnesses, infant mortality well below UK average and falling, above average life expectancy
Cheltenham’s residents enjoy good health, although suicide rates are above average. The growth in single person households and potential decreasing levels of social interaction may create some health issues and so opportunities for and accessibility to social activities could become increasingly important
Cheltenham Core Strategy Sustainability Appraisal Scoping report – revised April 2008 Page 42
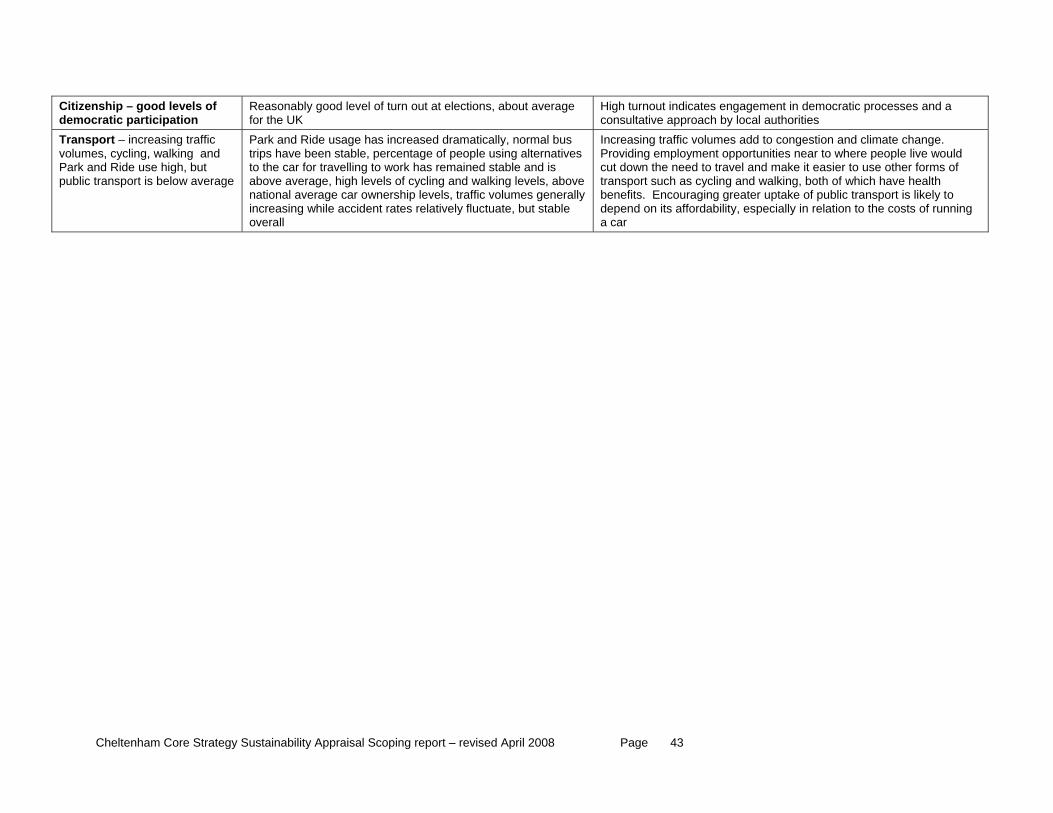
Citizenship – good levels of democratic participation
Reasonably good lefor the UK
vel of turn out at elections, about average High turnout indicates engagement in democratic processes and a consultative approach by local authorities
Transport – increasing traffic volumes, cycling, walking and Park and Ride use high, but public transport is below average
Park and Ride usage hastrips have been stable, pe
increased dramatically, normal bus rcentage of people using alternatives
ove generally
able
ngestion and climate change. near to where people live would
o
to the car for travelling to work has remained stable and is above average, high levels of cycling and walking levels, abnational average car ownership levels, traffic volumes increasing while accident rates relatively fluctuate, but stoverall
Increasing traffic volumes add to coProviding employment opportunities cut down the need to travel and make it easier to use other forms of transport such as cycling and walking, both of which have health benefits. Encouraging greater uptake of public transport is likely tdepend on its affordability, especially in relation to the costs of running a car
Cheltenham Core Strategy Sustainability Appraisal Scoping report – revised April 2008 Page 43
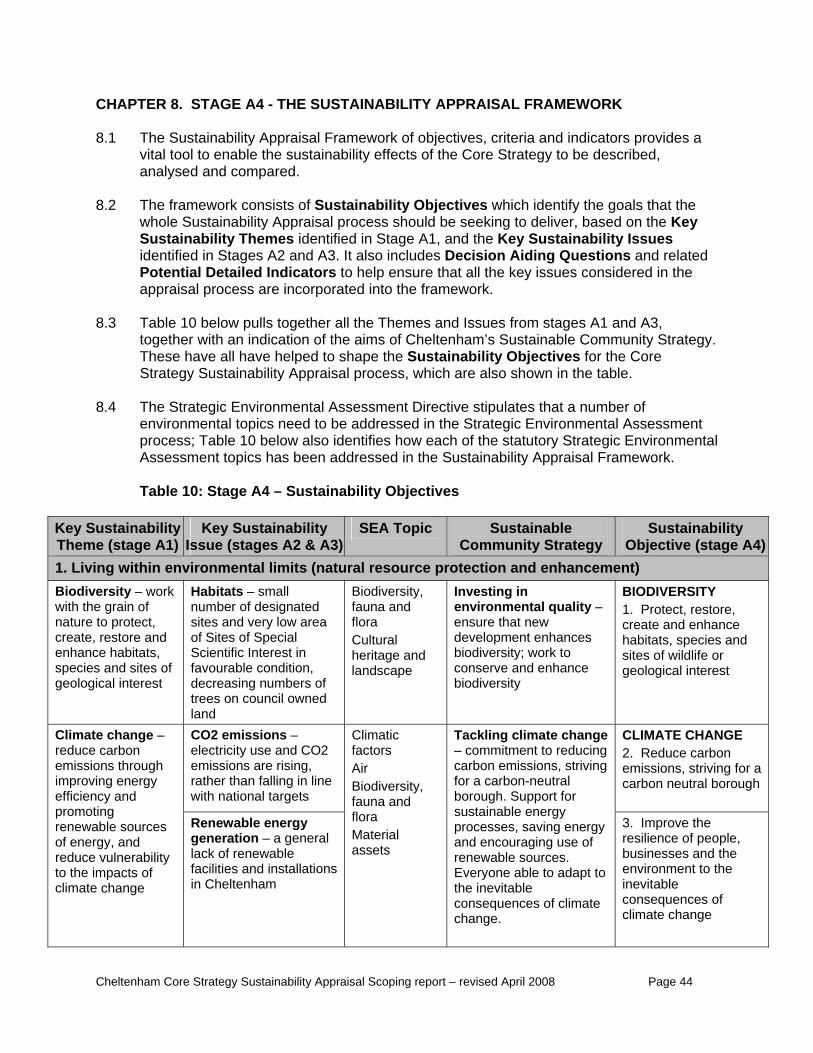
Cheltenham Core Strategy Sustainability Appraisal Scoping report – revised April 2008 Page 44
A . GE A4 - THE SUSTAINABILITY APPRAISAL FRAMEWORK
ives, criteria and indicators provides a nable the sustainability effects of the Core Strategy to be described, d compared.
rk consists of Sustainability Objectives which identify the goals that the inability Appraisal process should be seeking to deliver, based on the Key ty Themes identified in Stage A1, and the Key Sustainability Issues
Decision Aiding Questions and related tailed Indicators to help ensure that all the key issues considered in the
incorporated into the framework.
ow pulls together all the Themes and Issues from stages A1 and A3, an indication of the aims of Cheltenham’s Sustainable Community Strategy. all have helped to shape the Sustainability Objectives for the Core
ocess, which are also shown in the table.
c Environmental Assessment Directive stipulates that a number of topics need to be addressed in the Strategic Environmental Assessment 10 below also identifies how each of the statutory Strategic Environmental
Assessment topics has been addressed in the Sustainability Appraisal Framework.
age A4 – Sustainability Objectives
CH 8.1
8.2
8.3
8.4
PTER 8 STA
The Sustainability Appraisal Framework of objectvital tool to eanalysed an
The framewowhole SustaSustainabiliidentified in Stages A2 and A3. It also includes Potential Deappraisal process are
Table 10 beltogether withThese have Strategy Sustainability Appraisal pr
The Strategienvironmental process; Table
Table 10: St
Key S aiust nability Them tae (s ge A1)
Key Sustainability Issue (stages A2 & A3)
SEA Topic Sustainable Community Strategy
Sustainability Objective (stage A4)
1. Living w ental limits (natural resource protection and enhancement) ithin environmBiodiv tywith the grainature to procreate, toenhanc abspecie d geolog in
tats – small er of designated
and very low area es of Special tific Interest in rable condition, asing numbers of on council owned
Biodiversity, fauna and flora Cultural heritage and landscape
Investing in environmental quality – ensure that new development enhances biodiversity; work to conserve and enhance biodiversity
BIODIVERSITY 1. Protect, restore, create and enhance habitats, species and sites of wildlife or geological interest
ersi
rese h
s anical
– work n of tect, re and itats, sites of terest
Habinumbsitesof SitScienfavoudecretreesland CO2 electemissiorather twith na
emissions – ricity use and CO2
ns are rising, han falling in line tional targets
CLIMATE CHANGE 2. Reduce carbon emissions, striving for a carbon neutral borough
Climate chareduceemissioimprovefficienpromoting renewable sources of energy, anreduceto the iclimate
wable energy tion – a general
wable nstallations
nham
Climatic factors Air Biodiversity, fauna and flora Material assets
Tackling climate change – commitment to reducing carbon emissions, striving for a carbon-neutral borough. Support for sustainable energy processes, saving energy and encouraging use of renewable sources. Everyone able to adapt to the inevitable consequences of climate change.
3. Improve the resilience of people, businesses and the environment to the inevitable consequences of climate change
nge – n rough ergy d
carbons th
ing ency an
d rability s of ge
Renegeneralack of renefacilities and iin Chelte
vulnempact chan
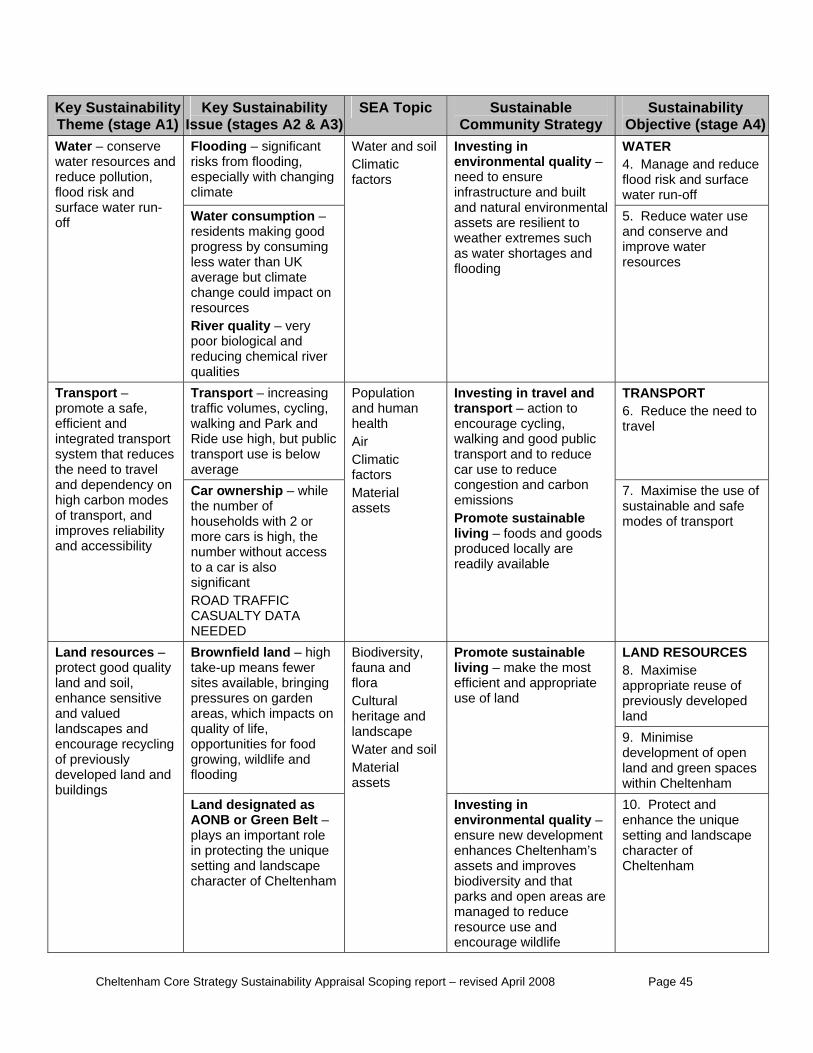
Key Sustainability Theme (stage A1)
Key Sustainability Issue (stages A2 & A3)
SEA Topic Sustainable Sustainability Community Strategy Objective (stage A4)
Flooding – significant risks from flooding, especially with chang
WATER 4. Man
ing climate
age and reduce flood risk and surface
water run-off
Water – conserve sources and ollution,
Water and soil Climatic
Investing in environmental quality – water re
reduce pflood risk and
off
resources
factors need to ensure infrastructure and built
ter use surface water run- Water consumption – residents making good progress by consuming less water than UK average but climate change could impact on
and natural environmental assets are resilient to weather extremes such as water shortages and flooding
5. Reduce waand conserve and improve water resources
River quality – very poor biological and reducing chemical river qualities Transport – increasing TRANSPORT traffic volumes, cycling, walking and Park and Ride use high, but public transport use is below average
6. Reduce the need to travel
Transp –
efficient and integratesystethe need to travel and de endenhigh carbon m the number of
h
Population
factors
assets
Investing in travel and
ngestion and carbon issions
Prom lip
7. Maximise the use of sustainable and safe mod
ortpromote a safe,
d transport m that reduces
and human health Air Climatic
transport – action to encourage cycling, walking and good public transport and to reduce car use to reduce
cy on odes
Car ownership – while Material coem
p
of transport, and improves reliability and accessibility
ouseholds with 2 or more cars is high, the number without access to a car is also readily available significant ROAD TRAFFIC CASUALTY DATA NEEDED
ote sustainableving – foods and goods roduced locally are
es of transport
LAND RESOURC8. Maximise
ES
appropriate reuse of previously developed land
Brownfield land – htake-up means fewer sites available, bringing pressures on garden areas
igh
, which impacts on
e
appropriate use of land
n
quality of life, opportunities for food growing, wildlife and flooding
Promote sustainablliving – make the most efficient and
9. Minimise development of opeland and green spaces within Cheltenham
Land resources – protect good quality land and soil, enhance sensitive and valued
t –
ique
ltenham
flora Cultural heritage and
e nd soil
erial
se and ncourage wildlife
0. Protect and que
landscapes and encourage recycling of previously developed land andbuildings
Land designated as AONB or Green Belplays an important role in protecting the unsetting and landscape character of Che
Biodiversity, fauna and
landscapWater aMatassets
Investing in environmental quality – ensure new development enhances Cheltenham’s assets and improves biodiversity and that parks and open areas are managed to reduce esource ur
e
1enhance the unisetting and landscapecharacter of Cheltenham
Cheltenham Core Strategy Sustainability Appraisal Scoping report – revised April 2008 Page 45
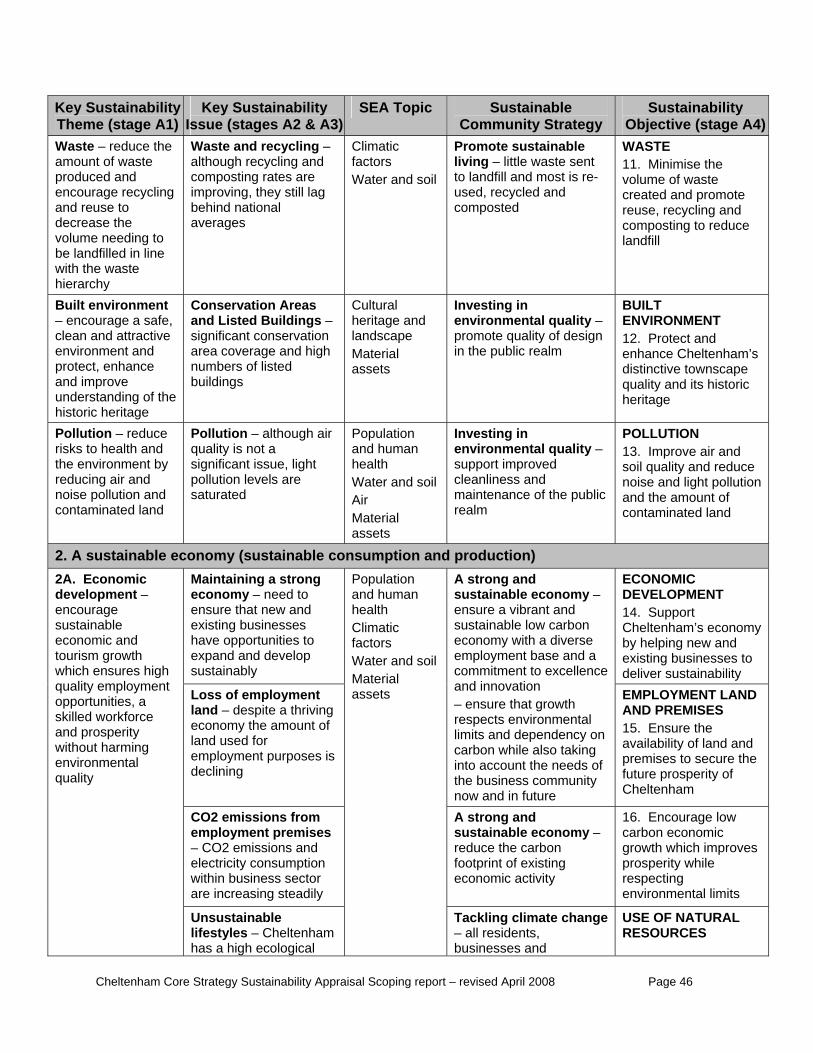
Key Sustainability Theme (stage A1)
Key Sustainability Issue (stages A2 & A3)
SEA Topic Sustainable Sustainability Community Strategy Objective (stage A4)
Waste – reduce theamount of waste produced and encourage recand reuse to dec
ycling
rease the volume needing to be landfilled in line with the waste hierarchy
nd
g, they still lag nd soil
tainable
st is re-omote
Waste and recycling –although recycling acomposting rates are improvinbehind national averages
Climatic factors Water a
Promote susliving – little waste sent to landfill and moused, recycled and composted
WASTE 11. Minimise the volume of waste created and prreuse, recycling and composting to reduce landfill
Built environment – encourage a safe, clean and attractive environment and protect, enhance
on Areas –
on
Cultural heritage and landscape Material assets
Investing in environmental quality – promote quality of design in the public realm
BUILT ENVIRONMENT 12. Protect and enhance Cheltenham’s distinctive townscape
istoric and improve understanding of the historic heritage
Conservatiand Listed Buildingssignificant conservatiarea coverage and high numbers of listed buildings quality and its h
heritage
Pollution – reduce risks to health and the environment by reducing air and noise pollution and contaminated land
Pollution – although air quality is not a significant issue, light pollution levels are saturated
Popand
ulation an
d soil
assets
lic
TION 13. Improve air and soil quality and reduce
humhealth Water anAir Material
Investing in environmental quality –support improved cleanliness and maintenance of the pubrealm
POLLU
noise and light pollution and the amount of contaminated land
2. A sustainable ec onsumption andonomy (sustainable c production) Maintaining a strong
to
ECONOMIC DEVELOPMENT 14. Support Cheltenham’s economy
economy – need ensure that new and existing businesseshave opportunities to expand and develop sustainably
by helping new and existing businesses to deliver sustainability
Loss of employment land – despite a thriving economy the amount of land used for employment purposesdeclining
is
A strong and sustainable economy – ensure a vibrant and sustainable low carbon
e
t growth respects environmental limits and dependency on carbon while also taking into account the needs of the business community
e
economy with a diverse employment base and acommitment to excellencand innovation – ensure tha
now and in future
EMPLOYMENT LANDAND PREMISES 15. Ensure thavailability of land andpremises to secure the future prosperity of Cheltenham
CO2 emissions from employment premises– CO2 emissions and electricity consumption within business sector
are increasing steadily
improves ile
respecting environmental limits
A strong and sustainable economy – reduce the carbon footprint of existing economic activity
16. Encourage low carbon economic growth whichprosperity wh
2A. Economic development – encourage sustainable
Unsustainable lifestyles – Cheltenham has a high ecological
Population and human health Climatic
il
ange USE OF NATURAL RESOURCES
economic and tourism growth which ensures high quality employment opportunities, a skilled workforce and prosperity without harming environmental quality
factors Water and soMaterial assets
Tackling climate ch– all residents, businesses and
Cheltenham Core Strategy Sustainability Appraisal Scoping report – revised April 2008 Page 46
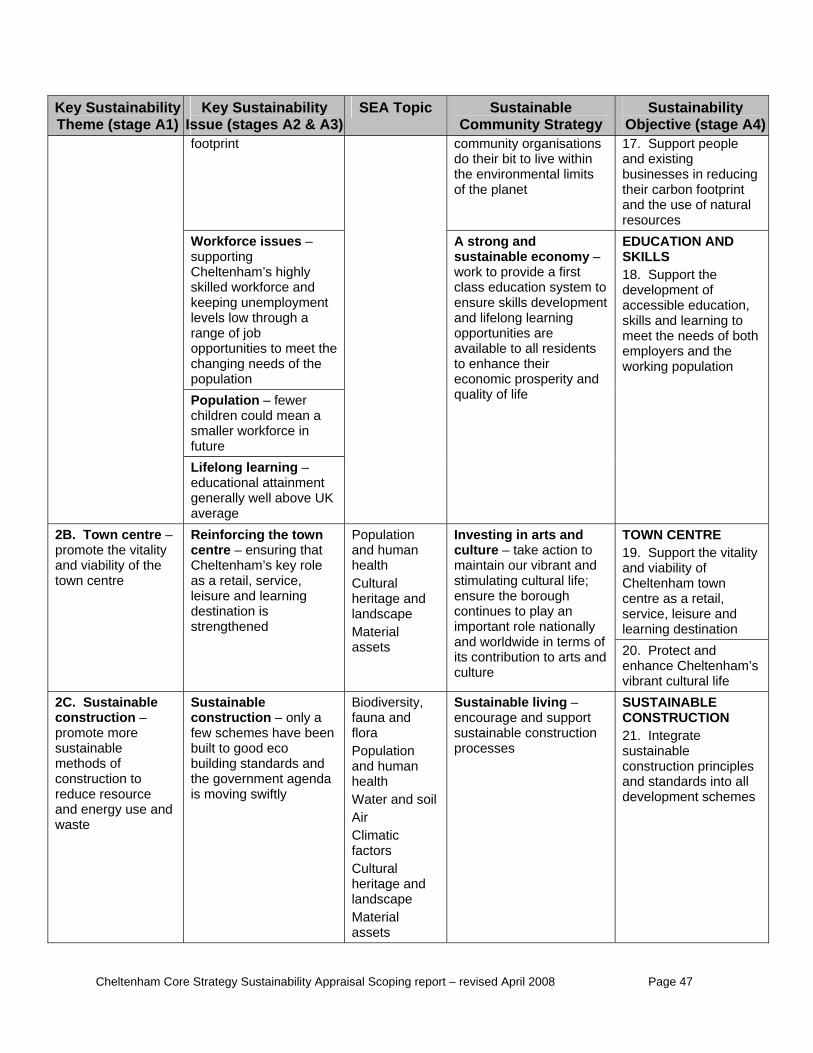
Key Sustainability Theme (stage A1)
Key Sustainability Issue (stages A2 & A3)
SEA Topic Sustainable Sustainability Community Strategy Objective (stage A4)
footprint community organisationdo their bit to live within the environmental limits of the planet
s ort people
cing
l
17. Suppand existing businesses in redutheir carbon footprint and the use of naturaresources
Workforce issues – supporting Cheltenham’s highly skilled workforce and
t
the
keeping unemploymenlevels low through a range of job opportunities to meet thechanging needs ofpopulationPopulation – fewer children could mean a smaller workforce in future
Lifelong learning – educational attainmegenerally w
nt ell above UK
average
A strong and sustainable economy – work to provide a first class education system to
evelopment
ents enhance their
nomic prosperity and quality of life
TION AND SKILLS 18. Support the development of
ucation, to f both
ensure skills dand lifelong learning opportunities are available to all residtoeco
EDUCA
accessible edskills and learningmeet the needs oemployers and the working population
TOWN CENTRE 19. Support the vitality
e and
and viability of Cheltenham town centre as a retail, service, leisurlearning destination
2B. Town centre – Reinforcing the town ion
pe
Investing in arts and action to rant and
ural life;
f
promote the vitality and viability of the
centre – ensuring that Cheltenham’s key role
and human health
culture – take maintain our vib
town centre as a retail, service, leisure and learning destination is strengthened
Populat
Cultural heritage andlandscaMaterial assets
stimulating cultensure the borough continues to play an important role nationallyand worldwide in terms oits contribution to arts and culture
20. Protect and enhance Cheltenham’svibrant cultural life
2C. Sustainableconstruction – promote more sustainable methods of construc
tion to reduce resource and energy use and waste
ment agenda is moving swiftly
sity, fauna and flora Population and human health Water and soil Air Climatic factors Cultural heritage and landscape Material assets
ll schemes
Sustainable construction – only a few schemes have been built to good eco building standards and the govern
Biodiver Sustainable living – encourage and support sustainable construction processes
SUSTAINABLE CONSTRUCTION21. Integrate sustainable construction principles and standards into adevelopment
Cheltenham Core Strategy Sustainability Appraisal Scoping report – revised April 2008 Page 47
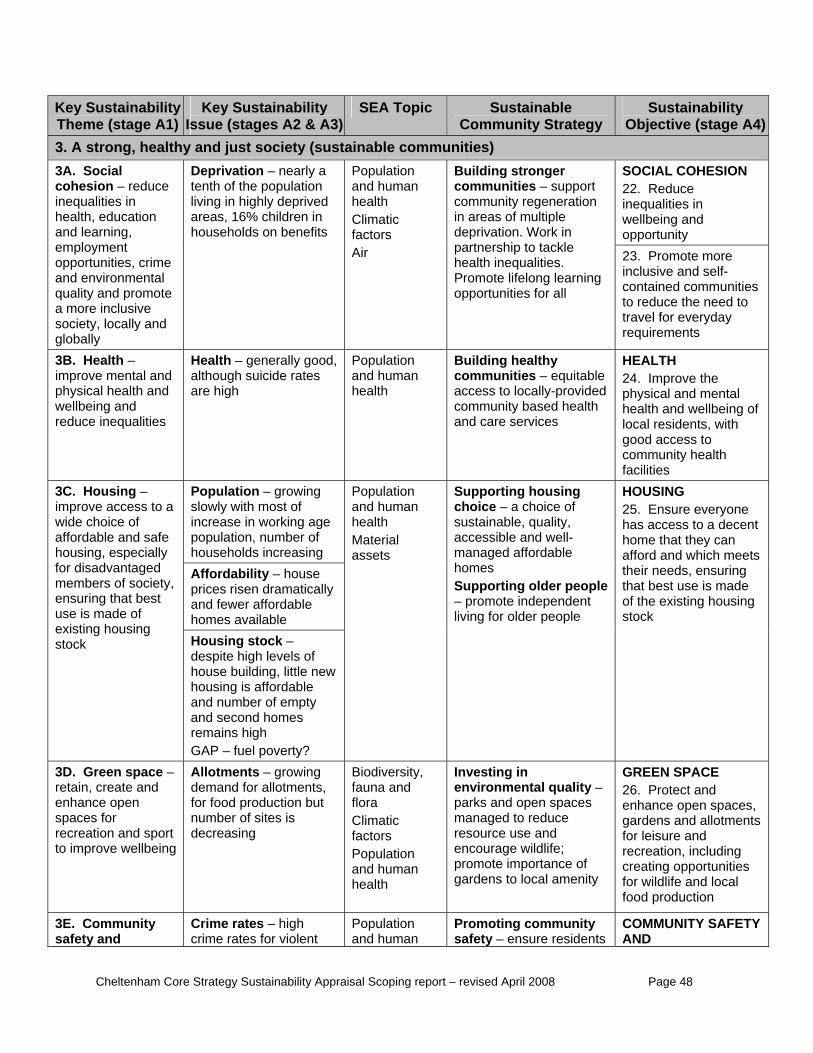
Key Sustainability Theme (stage A1)
Key Sustainability Issue (stages A2 & A3)
SEA Topic Sustainable Sustainability Community Strategy Objective (stage A4)
3. A strong, healthy t society (sustainable commu and jus nities) SOCIAL COHESION 22. Reduce inequalities in wellbeing and opportunity
3A. Social cohesion – reduce inequalities in health, education and learning, employment opportunities, crime and environmental quality and promote a more inclusive society, locally and globally
Deprivation – nearly a tenth of the population living in highly deprived areas, 16% children in
s
Population and human health Climatic factors Air
– support generation
in areas of multiple rk in
ote more -
unities
households on benefit
Building stronger communitiescommunity re
deprivation. Wopartnership to tackle health inequalities. Promote lifelong learning opportunities for all
23. Prominclusive and selfcontained commto reduce the need to travel for everyday requirements
3B. Health – improve mental and physical health and wellbeing and reduce inequalities
Population and human health
lly-provided d health
and care services
physical and mental health and wellbeing of local residents, with good access to community health facilities
Health – generally good, although suicide rates are high
Building healthycommunities – equitable access to locacommunity base
HEALTH 24. Improve the
Population – growing slowly with most of increase in working age population, number of households increasing Affordability – house prices risen dramaticand fewer affordable homes availab
ally
le
3C. Housing – improve access to a wide choice of
ensuring that best use is made of existing housing stock Housing stock –
despite high levels of house building, little new housing is affordable
f empty
y?
Population and human health
Supporting housing choice – a choice of sustainable, quality,
le nt
HOUSING 25. Ensure everyone
nt n
de sing
affordable and safe housing, especially for disadvantaged members of society,
and number oand second homes remains high GAP – fuel povert
Material assets
accessible and well-managed affordable homes Supporting older peop– promote independeliving for older people
has access to a decehome that they caafford and which meets their needs, ensuring that best use is maof the existing houstock
3D. Green sparetain, create andenhance open spaces for recreation an
ce –
d sport to improve wellbeing
n but number of sites is decreasing
atic
on an
Investing in environmental quality – parks and open spaces managed to reduce resource use and encourage wildlife; promote importance of gardens to local amenity
gardens and allotments for leisure and recreation, including creating opportunities for wildlife and local food production
Allotments – growing demand for allotments, for food productio
Biodiversity, fauna and flora Climfactors Populatiand humhealth
GREEN SPACE 26. Protect and enhance open spaces,
3E. Community safety and
Crime rates – high crime rates for violent
n an
Promoting community safety – ensure residents
COMMUNITY SAFETY AND
Populatioand hum
Cheltenham Core Strategy Sustainability Appraisal Scoping report – revised April 2008 Page 48
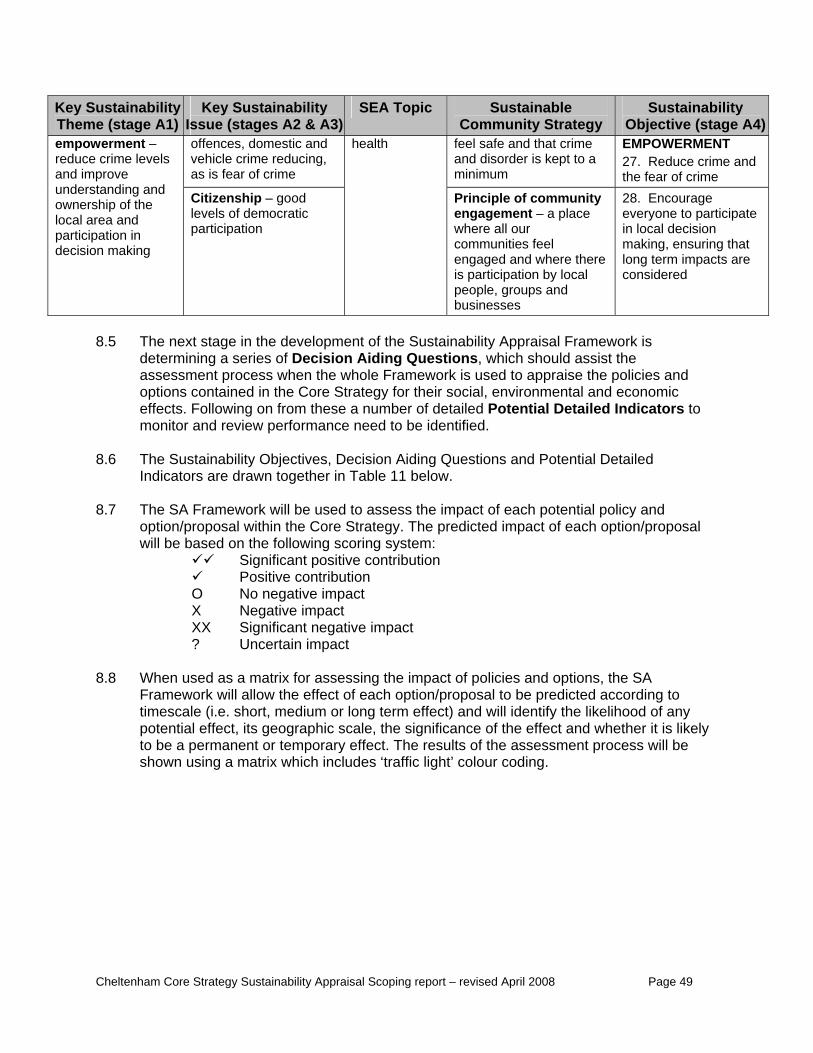
Key Sustainability Theme (stage A1)
Key Sustainability Issue (stages A2 & A3)
SEA Topic Sustainable Sustainability Community Strategy Objective (stage A4)
offences, domestic and feel safevehicle crime reducing, as is fear of crime
and that crime EMPOWERMENT and disorder is kept to a
minimum 27. Reduce crime andthe fear of crime
empowerment – levels
health reduce crime and improve understanding and ownership of the local area and participation indecision making
there
rticipate
re
Citizenship – good levels of democratic participation
Principle of community engagement – a place where all our communities feel engaged and whereis participation by local people, groups and businesses
28. Encourageeveryone to pain local decision making, ensuring that long term impacts aconsidered
8.5 The next stage in the development of the Sustainability Appraisal Framewo
etermi n esti assist tm e w work p
s d in the Core St or their s effects. Following on from these a number of det I
or and review performance need to be iden 8.6 The Sustainability Objectives, Decision Aiding Questions and Potential De
Indicators are drawn together in Table 11 below.
d e im al pol/p S . The pr ch opt b sc tem:
act act
nt negative impact
8.8 When u ssing the impact of policies and options, the SA
Framew ct of each option/proposal to be predicted according to timesca or long term effect) and will identify the likelihood of any potentia le, the significance of the effect and whether it is likely to be a permanent or temporary effect. The results of the assessment process will be
u clu ght g.
rk is dassessoptionemonit
ning a series of Decisioent process when th
containe
Aiding Quhole Framerategy f
ons, which should is used to appraise the ocial, environmental andailed Potential Detailedtified.
he olicies and conomic
ndicators to
tailed
8.7 The SA
optionwill be
Framework will be useroposal within the Coreased on the following
Significant positive contribution
to assess thtrategy
pact of each potentiedicted impact of ea
icy and ion/proposal
oring sys
Positive contribution O No negative impX Negative impXX Significa? Uncertain impact
sed as a matrix for asseork will allow the effele (i.e. short, mediuml effect, its geographic sca
shown
sing a matrix which in des ‘traffic li ’ colour codin
Cheltenham Core Strategy Sustainability Appraisal Scoping report – revised April 2008 Page 49
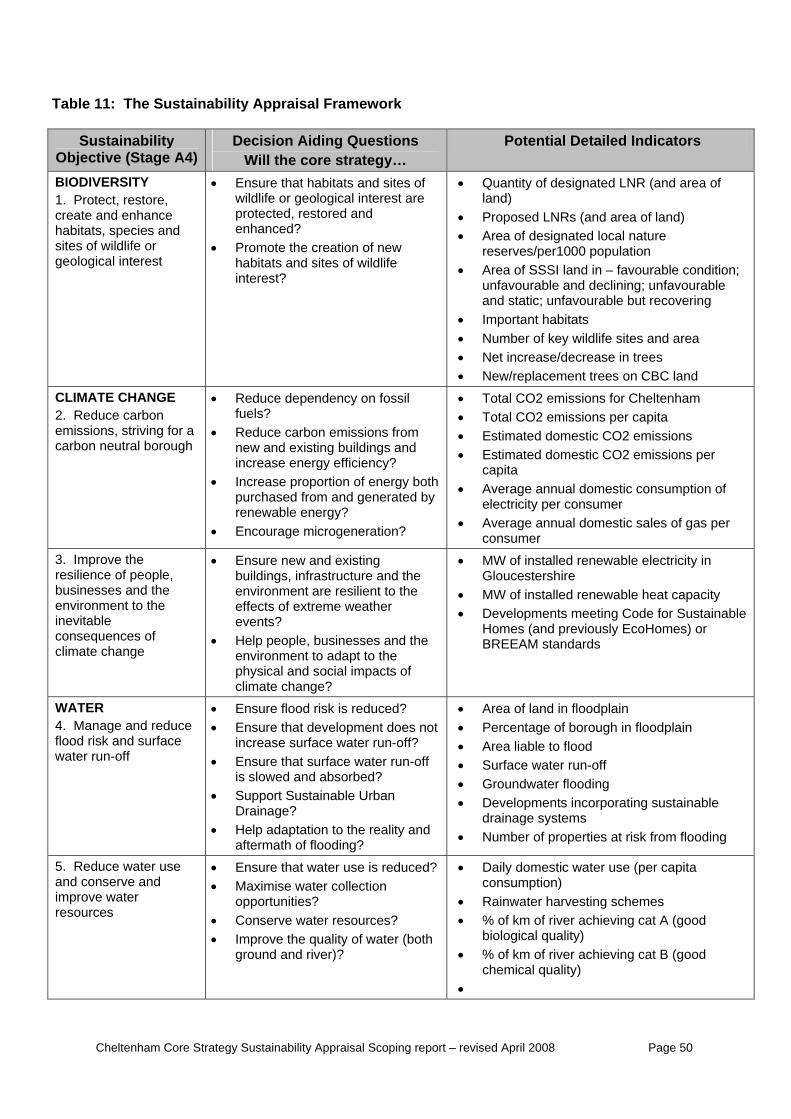
Table 11: The Sustainability Appraisal Framework
Sustainability Decision Aiding Questions Potential Detailed Indicators Objective (Stage A4) Will the core strategy… BIODIVERSITY 1. Protect, restore,
• Ensure that habitats and sites of wildlife or geologica st are
d
creation of new sites of wildlife
• Quantity of designated LNR (and area of land)
aca
s/per1000 popu f
eclinfavourable
life s crease in trees
lacement trees on CBC land
create and enhance habitats, species andsites of wildlife or geological interest
l intereand protected, restore
enhanced? • Promote the
habitats and interest?
• Proposed LNRs (and• Area of designated lo
reserve
rea of land) l nature lation
• Area of SSSI land in –unfavourable and dand static; un
• Important habitats • Number of key wild• Net increase/de• New/rep
avourable condition; ing; unfavourable but recovering
ites and area
CLIMATE CHANGE 2. Reduce carbon
s, striving for a eutral borough
• Reduce dependency on fossil fuels?
• Reduce carbon emissions from new and existing buildings and increase energy efficiency?
• Increase proportion of energy both purchased from and generated by
• Total CO2 emissions for Chelt• Total CO2 emissions per capit• Estimated domestic CO2 emissions • Estimated domestic CO2 emission
capita • Av
electri
emissioncarbon n
renewable energy?
enham a
s per
erage annual domestic consumption of city per consumer
s of gas per consumer • Encourage microgeneration? • Average annual domestic sale
3. Improve the
businenvironinevitable consequences of climate change
• Ensure new and existing
the
ts of
• MW of installed renewable electricity in
ity • Developments meeting Code for Sustainable
Homes (and previously EcoHomes) or BREEAM standards
resilience of people, esses and the
ment to the
buildings, infrastructure and the environment are resilient to the effects of extreme weather e
Gloucestershire • MW of installed renewable heat capac
vents? • Help people, businesses and
the environment to adapt tophysical and social impacclimate change?
WATER 4. Manage and reduce
d? • Ensure that development does not
aftermath of flooding?
• Area of land in floodplain • Percentage of borough in floodplain
roperties at risk from flooding
• Ensure flood risk is reduce
flood risk and surface water run-off
increase surface water run-off? • Ensure that surface water run-off
is slowed and absorbed? • Support Sustainable Urban
Drainage? • Help adaptation to the reality and
• Area liable to flood • Surface water run-off • Groundwater flooding • Developments incorporating sustainable
drainage systems • Number of p
5. Reduce water use and co erve and improve water resources
• Ensure that water use is reduced? • Maximise water collection
opportunities? • Conserve water resources? • Improve the quality of water (both
ground and river)?
• Daily domestic water use (per capita consumption)
• Rainwater harvesting schemes • % of km of river achieving cat A (good
biological quality) • % of km of river achieving cat B (good
chemical quality) •
ns
Cheltenham Core Strategy Sustainability Appraisal Scoping report – revised April 2008 Page 50
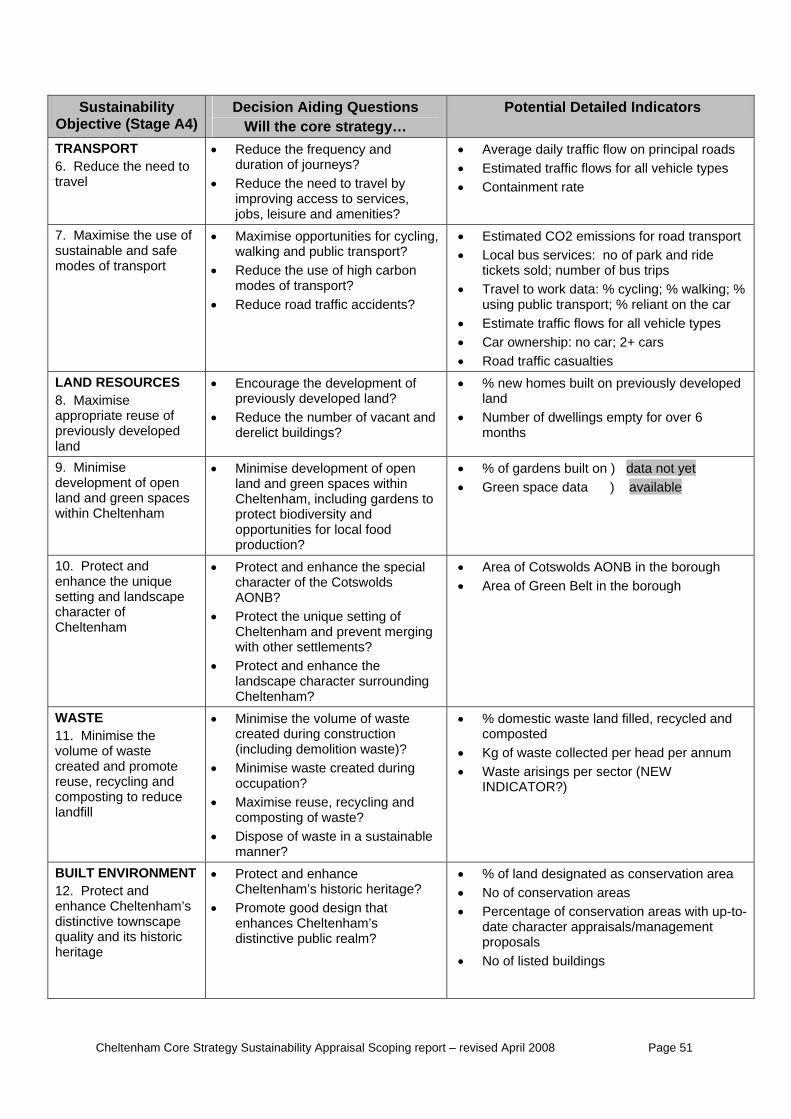
Sustainability Decision Aiding Questions Potential Detailed Indicators Objective (Stage A4) Will the core strategy… TRANSPORT 6. Reduce the need to travel
• d
s?
• Ave ads • Estimated traffic flows for all vehicle types
Reduce the frequency and uration of journeys?
• Reduce the need to travel by improving access to services, jobs, leisure and amenitie
rage daily traffic flow on principal ro
• Containment rate
7. Maximise the use osustainable and samodes of transport
f • Maximise opfe
portunities for cycling, walking and public transport?
• Reduce the use of high carbomodes of
transport? • Reduce road traffic accidents?
d transport and ride
% ar
or all vehicle types
n tickets sold; number of bus trips • Travel to work data: % cycling; % walking;
using public transport; % reliant on the c
• Estimated CO2 emissions for roa• Local bus services: no of park
• Estimate traffic flows f• Car ownership: no car; 2+ cars • Road traffic casualties
LAND RESOURCES
f
• Encourage the development of
the number of vacant and
loped
er 6 8. Maximise appropriate reuse opreviously developed land
previously developed land? • Reduce
derelict buildings?
• % new homes built on previously develand
• Number of dwellings empty for ovmonths
9. Minimise development of open land and green spacewithin Cheltenham
n
nd
production?
s land and green spaces within Cheltenham, including gardens to protect biodiversity a
• Minimise development of ope
opportunities for local food
• % of gardens built on ) data not yet • Green space data ) available
10. Protect and enhance the unique setting and landscapcharacter of Cheltenham
e
• Protect and enhance the special character of the Cotswolds AONB?
• Protect the unique setting of Cheltenham and prevent merging with other settlements?
• Protect and enhance the landscape character surrounding
Cheltenham?
• Area of Cotswolds AONB in the borough• Area of Green Belt in the borough
WASTE 11. Minimise the volume of waste created and promote reuse, recycling and composting to reduclandfill
d and
d per head per annum (NEW
e • Maximise reuse, recycling ancomposting
• Minimise the volume of waste created during construction (including demolition waste)?
• Minimise waste created during occupation?
d of waste?
• Dispose of waste in a sustainable manner?
• % domestic waste land filled, recyclecomposted
• Kg of waste collecte• Waste arisings per sector
INDICATOR?)
BUILT ENVIRONMEN12. Protect and enhance Cheltedistinctive t
T • Protect and enhance
nhamownscape
quality and its historiheritage
area
up-to-’s Cheltenham’s historic heritage
• Promote good d
c distinctive public realm?
? • No of conservation areas esign that
enhances Cheltenham’s
• % of land designated as conservation
• Percentage of conservation areas with date character appraisals/management proposals
• No of listed buildings
Cheltenham Core Strategy Sustainability Appraisal Scoping report – revised April 2008 Page 51
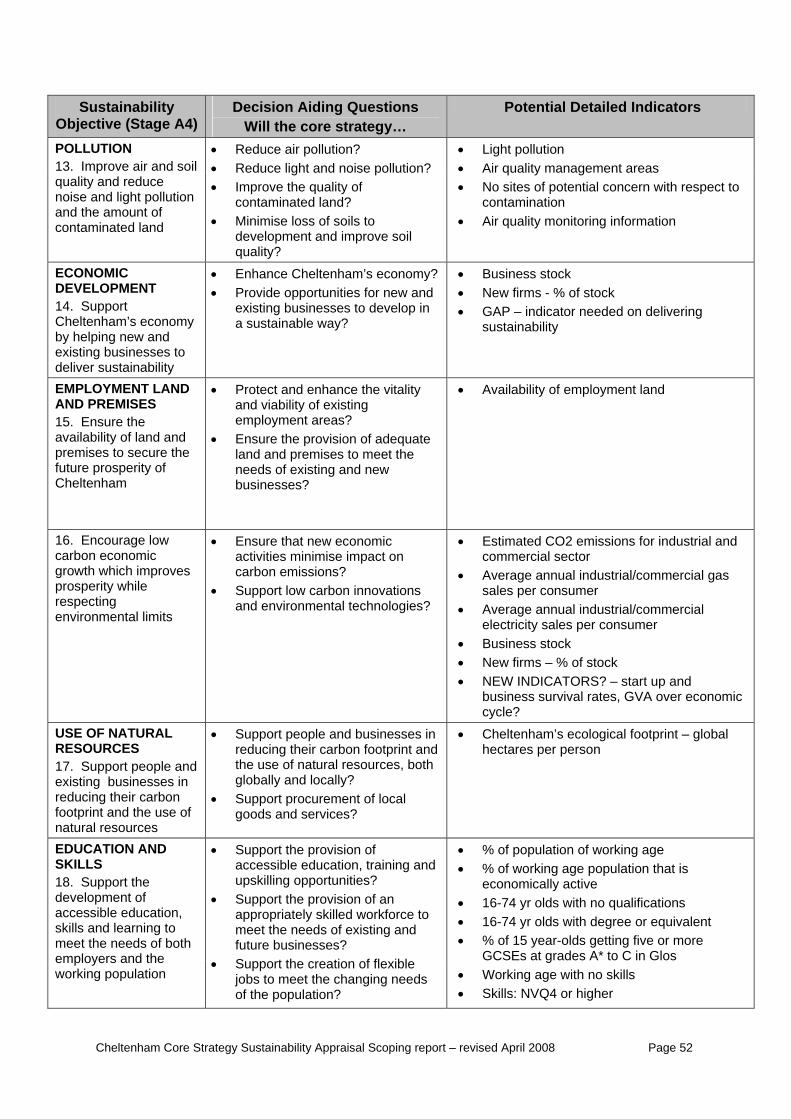
Sustainability Decision Aiding Questions Potential Detailed Indicators Objective (Stage A4) Will the core strategy… POLLUTION 13. Improve air and soilquality
and reduce
noise and light pollution and the amount of
pollution? oncern with respect to
contamination • Air quality monitoring information contaminated land
• Reduce air pollution? • Reduce light and noise• Improve the quality of
contaminated land? • Minimise loss of soils to
development and improve soil quality?
• Light pollution • Air quality management areas • No sites of potential c
ECONOMIC DEVELOPMENT 14. Support Cheltenham’s economy by helping new and existing businesses to deliver sustainability
y
n sustainable way?
• Enhance Cheltenham’s economProvide opportunities
? • Business stock • for new an
existing businesses to develop id
• New firms - % of stock • GAP – indicator needed on delivering
a sustainability
EMPLOYMENT LAND AND PREMISES 15. Ensure the availability of land and premises to secure the
rity
n of adequate land and premises to meet the
future prospeCheltenham
of needs of existing and new businesses?
• Protect and enhance the vitality and viability of existing employment areas?
• Ensure the provisio
• Availability of employment land
16. Encourage low
l limits s?
• Estimated CO2 emissions for industrial and
• Average annual industrial/commercial electricity sales per consumer
• Business stock • New firms – % of stock • NEW INDICATORS? – start up and
business survival rates, GVA over economic
carbon economic growth which improvprosperity while respecting environmenta
es activities minimise impact on carbon emissions?
• Support low carbon innovations and envir
• Ensure that new economic
onmental technologie
commercial sector • Average annual industrial/commercial gas
sales per consumer
cycle? USE OF NATURARESOURCES 17. Support people anexisting businesses ireducing their carbon footprin
L
t and the use of natural resources
’s ecological footprint – global
d n
the use of natural resources, boglobally and locally?
• Support people and businesses in reducing their carbon footprint and hectares per person
th
• Support procurement of local goods and services?
• Cheltenham
EDUCATION AND
s and the orking population
e provision of training and
rce to g and
• Support the creation of flexible jobs to meet the changing needs of the population?
• % of population of working age
r-olds getting five or more o C in Glos
• Working age with no skills • Skills: NVQ4 or higher
SKILLS 18. Support the development of accessible education, skills and learning to meet the needs of bothemployer
w
• Support thaccessible education, upskilling opportunities?
• Support the provision of anappropriately skilled workfomeet the needs of existinfuture businesses?
• % of working age population that is economically active
• 16-74 yr olds with no qualifications • 16-74 yr olds with degree or equivalent • % of 15 yea
GCSEs at grades A* t
Cheltenham Core Strategy Sustainability Appraisal Scoping report – revised April 2008 Page 52
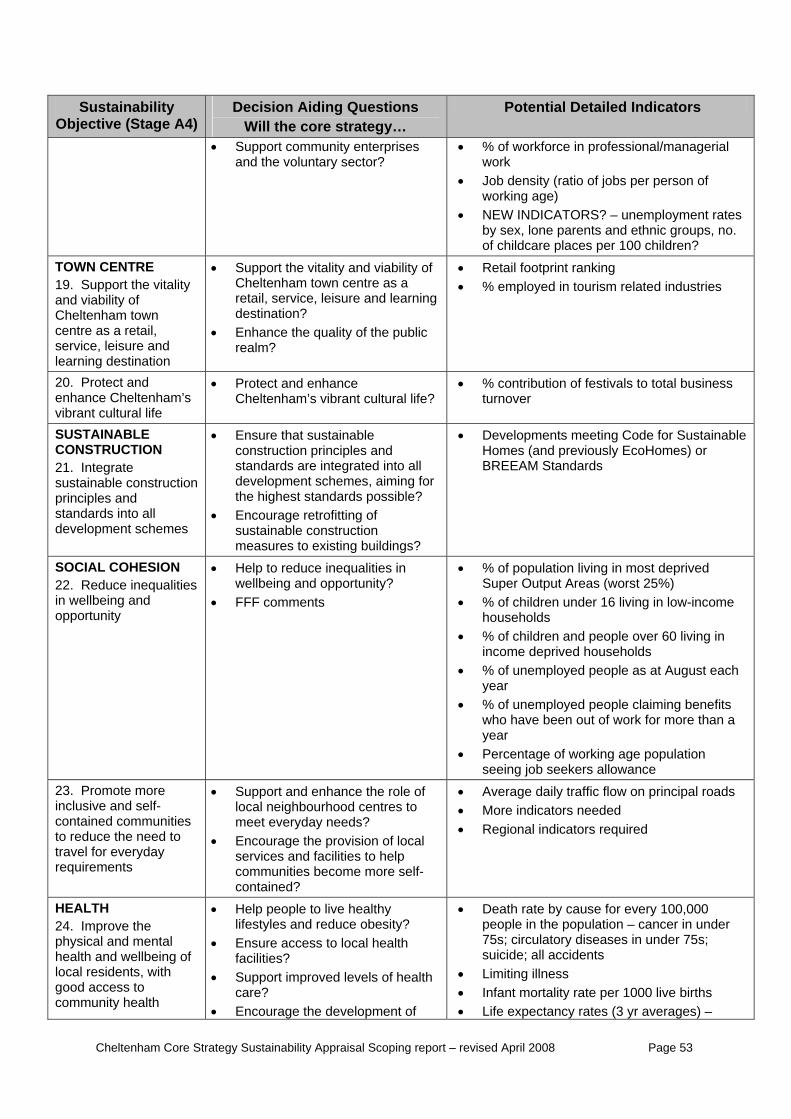
Sustainability Decision Aiding Questions Potential Detailed Indicators Objective (Stage A4) Will the core strategy… • Support community enterprise professional/managerial
ent rates oups, no.
of childcare places per 100 children?
s • % of workforce inand the voluntary sector? work
• Job density (ratio of jobs per person of working age)
• NEW INDICATORS? – unemploymby sex, lone parents and ethnic gr
TOWN CENT19. Support the vi
f
RE
f the publicrealm?
king related industries tality Cheltenham town centre as a
retail, service, leisure and learning destination?
• Enhance the quality o
and viability oCheltenham town centre as a retail, service, leisure and learning destination
• Support the vitality and viability of
• Retail footprint ran• % employed in tourism
20. Protect and enhance Cheltenham’s
ife vibrant cultural l
• Protect and enhance Cheltenham’s vibrant cultural life?
• % contribution of festivals to totaturnover
l business
SUSTAINABLE CONSTRUCTION 21. Integrate sustainable construct
rinciples and tandards into all
andards possible? • Encourage retrofitting of
• Developments meeting Code for Sustainable Homes (and previously EcoHomes) or BREEAM Standards
ion
• Ensure that sustainable construction principles and standards are integrated into all development schemes, aiming for the highest stp
sdevelopment schemes sustainable construction
measures to existing buildings? SOCIAL COHESION 22. Reduce ineqin wellbeingopportunity
ualities wellbeing and opportunity? • FFF comments and me
olds st each
en out of work for more than a
g age population seeing job seekers allowance
• Help to reduce inequalities in • % of population living in most deprived Super Output Areas (worst 25%)
• % of children under 16 living in low-incohouseholds
eople over 60 living in • % of children and pincome deprived househ
• % of unemployed people as at Auguyear
• % of unemployed people claiming benefits who have beyear
• Percentage of workin
23. Promote more inclusive and self-contained communities to reduce the need to
of
of local
• Average daily traffic flow on principal roads • More indicators needed • Regional indicators required
travel for everyday requirements
• Support and enhance the role local neighbourhood centres tomeet everyday needs?
• Encourage the provision services and facilities to help communities become more self-contained?
HEALTH 24. Improve the physical and mental health and wellbeinglocal residents, with
of facilities? • Support improved levels of health
care? good access to community health
al health
• Encourage the development of
er
1000 live births • Life expectancy rates (3 yr averages) –
• Help people to live healthy lifestyles and reduce obesity?
• Ensure access to loc
• Death rate by cause for every 100,000 people in the population – cancer in und75s; circulatory diseases in under 75s; suicide; all accidents
• Limiting illness • Infant mortality rate per
Cheltenham Core Strategy Sustainability Appraisal Scoping report – revised April 2008 Page 53
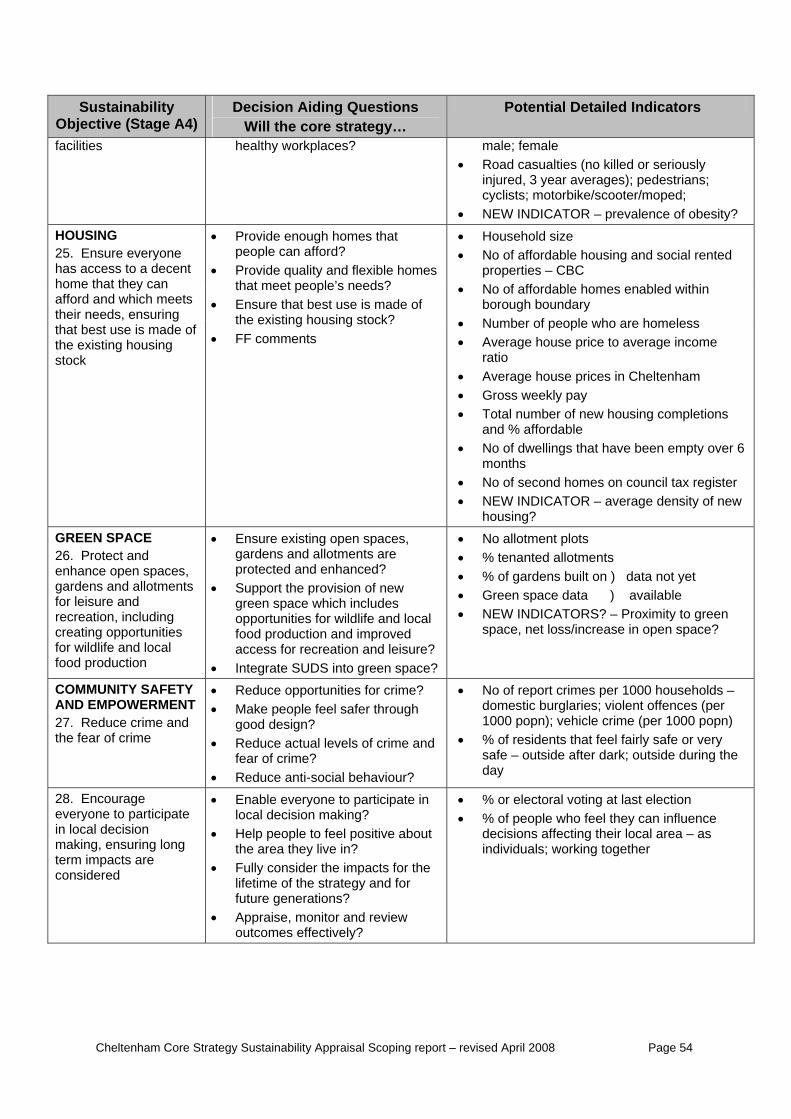
Sustainability Decision Aiding Questions Potential Detailed Indicators Objective (Stage A4) Will the core strategy… facilities
casualties (no killed or seriously
r/moped;
healthy workplaces? male; female • Road
injured, 3 year averages); pedestrians; cyclists; motorbike/scoote
• NEW INDICATOR – prevalence of obesity? HOUSING 25. Ensure everyone
h meeng
• Provide enough homes that people can afford?
ousing stock?
ed
orough boundary • Number of people who are homeless • Average house price to average income
ratio
• Total number of new housing completions
ver 6
• No of second homes on council tax register • NEW INDICATOR – average density of new
housing?
has access to a decent
ts
• Provide quality and flexible homes that meet people’s needs?
• Ensure that best use is made of the existing h
home that they can afford and whictheir needs, ensurithat best use is mathe existing housing stock
de of • FF comments
• Household size • No of affordable housing and social rent
properties – CBC • No of affordable homes enabled within
b
• Average house prices in Cheltenham • Gross weekly pay
and % affordable • No of dwellings that have been empty o
months
GREEN SPACE 26. Protect and enhance open spaces, gardens and allotments for leisure and recreation, including creating opportunities for wildlife and local food production
includes
opportunities for wildlife and local food production and improved access for recreation and leisure?
• Integrate SUDS into green spa
• No allotment plots
TORS? – Proximity to green
• Ensure existing open spaces, gardens and allotments are protected and enhanced?
• Support the provision of newgreen space which
ce?
• % tenanted allotments • % of gardens built on ) data not yet • Green space data ) available • NEW INDICA
space, net loss/increase in open space?
COMMUNITY SAFETY AND EMPOWERMENT 27. Reduce crime and the fear of crime
• Reduce opportunities for crime? • Make people feel safer through
good design? • Reduce actual levels of crime and
fear of crime? • Reduce anti-social behaviour?
report crimes per 1000 households –
esidents that feel fairly safe or very
• No ofdomestic burglaries; violent offences (per 1000 popn); vehicle crime (per 1000 popn)
• % of rsafe – outside after dark; outside during the day
28. Encourage everyone to participate in local decision making, ensuring long term impacts are considered
• Enable everyone to participate in local decision making?
• Help people to feel positive aboutthe area they live in?
• Fully consider the impacts for thelifetime of the strategy and for
nce area – as
individuals; working together
future generations? • Appraise, monitor and review
outcomes effectively?
• % or electoral voting at last election • % of people who feel they can influe
decisions affecting their local
Cheltenham Core Strategy Sustainability Appraisal Scoping report – revised April 2008 Page 54
CHAPTER 9. REMAINING STAGES OF APPRAISAL
1 Sustainabilit tive and o broken down into a numb h stagDevelopment Plan Document. This staged apprSustainability Appraisal Report helps to refine thobjectives and ensures that the preferrethese objectives and achieve sustainabl
ainabil
preparatioAssessment Directive specify that Scoping Report must be
prepared in consultation with:
• Natural England • The Environment Agency • English Heritage
9.4 Full consultation with the public is not required
although a number of stakeholders wereScoping Report was placed on the Council’s w
cal
ding questions, some hypothetical , resulting in some changes to the
9. y Appraisal is an iteraer of stages that coincide wit
ngoing process that isn evelopment anes i the d d adoption of a
oach to the production of a final e Development Plan Document
d policy options selected will both achieve e development objectives.
9.2 The rem
(overleaf STAGE A5 - CO 9.3 Governm
Strategic Environmental
aining stages of the Sust ity Appraisal process are shown in Figure 2 ort. ) and in Table 4 on page 12 of this rep
NSULTATION OF THE SCOPING REPORT (see Table 4)
ent guidance on the n of Sustainability Appraisals and the
by the government at this stage, given the opportunity to comment and the
ebsite and updated in light of consultat
ion responses as appropriate.
mber 2007 an informal workshopt Framework Programme B
9.5 In DeceDevelopmthematic worksparticuconsipo
was held with members of the Loen o
partnership of Cheltenham Strathop was to test the emerging Sustainablar the sustainability objectives, with loc
deration of the objectives and decision ai
ard and the Low Carbon Partnership (a egic Partnership). The purpose of the
ility Appraisal Framework, and in al stakeholders. As well as general
licy options were used to pilot the frameworkboth the pro
cess used and content of the objectives.
Cheltenham Core Strategy Sustainability Appraisal Scoping report – revised April 2008 Page 55
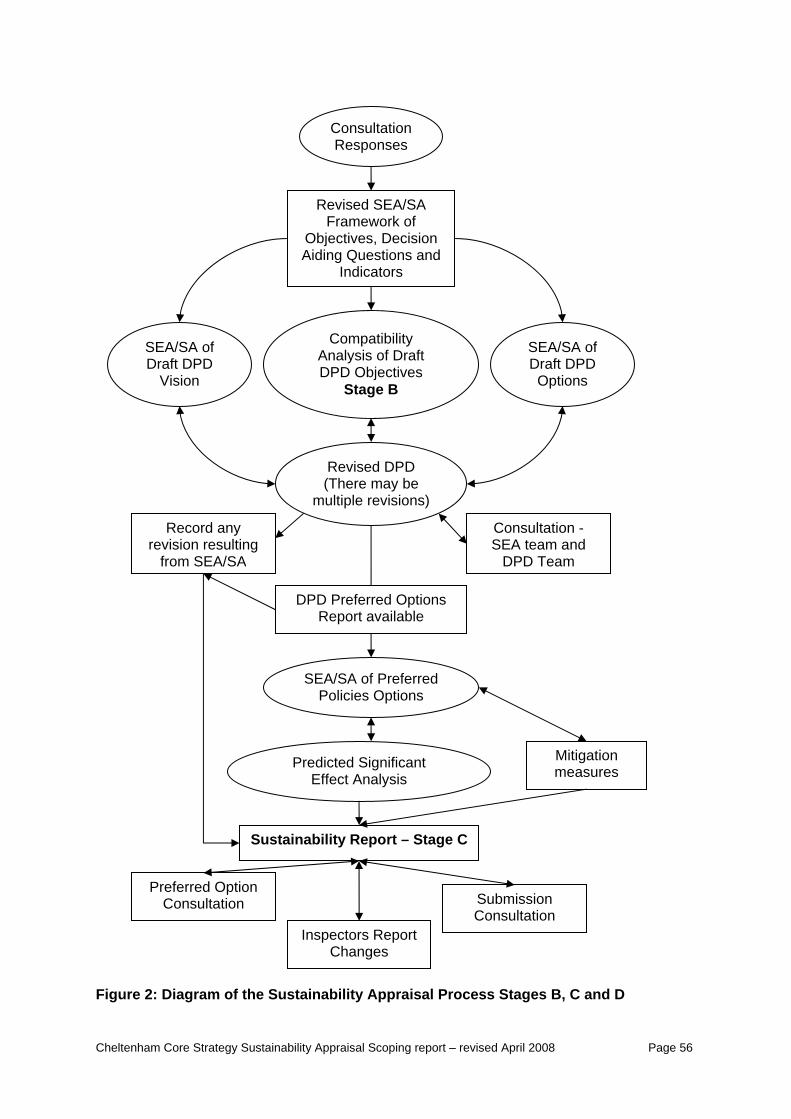
Consultation Responses
Revised SEA/SA Framework of
Objectives, Decision Aiding Questions and
Indicators
SEA/SA of Draft DPD
Vision
SEA/SA of Draft DPD
igure 2: Diagram of the Sustainability Appraisal Process Stages B, C and D F
Options
Revised DPD (There may be
multiple revisions)
Record any
Compatibility Analysis of Draft DPD Objectives
Stage B
Consultation - SEA team and
DPD Team
DPD Preferred Options Report available
revision resulting from SEA/SA
SEA/SA of Preferred Policies Options
Mitigation measures Predicted Significant
Effect Analysis
Sustainability Report – Stage C
Preferred Option Consultation Submission
Consultation Inspectors Report
Changes
Cheltenham Core Strategy Sustainability Appraisal Scoping report – revised April 2008 Page 56
REVISED SUSTAINABILITY APPRAISAL FRAMEWORK 9.6 The Sustainability Appraisal Framework has been revised to take account of any
representations received as a sultation with the three statutory consultees and other organisations and individuals. This revised Framework will form the framework against which the vision, objectives and policy options of the Core Strategy will be measured
CORE STRATEGY VISION AND NG 9.7 The Core Strategy should be a ocument that will form the strategic
framework for the Cheltenham Local Development Framework and the future development of the borough and its environs. To achieve its vision, the Core Strategy will develop a set of objectives that it will aspire to. Once these objectives are
ey will be tested stainability Appraisal Framework to are compatible ustainable de
9.8 If there is conflict between the Core Strategy objectives and
sustainable development a judgment will be made about which objectives are most important for the future development of the Cheltenham Borough and what mitigating measures are required to off set any adverse effects. If such decisions and judgments are necessary th ully documented in the final Sustainability Appraisal Report.
APPRAISAL OF CORE STRATE NS 9.9 ng the early stages of the Core Strategy’s development to
c nge of policy options. A Sustainability Appraisal of this range of policy option identify a wide range of implicationsustainable developme ation of the most sustainable policy option and possible mit et any adverse impacts. This will be reported in the Sustainability Appraisal Report.
APPRAISAL OF PREFERRED ICTED SIGNIFICANT EFFECT ANALYSIS 9.11 Once the preferred policy options for the Core Strategy have been agreed, the social,
economic and environmental effects of implementing these policieviable policy alternative hese Predicted Significant Effects will be reported in the Sus isal Report.
9.12 Once the Predicted Significant Effects of implementing a policy option have been
identified they then need to be subject to a ysis to ascertain the Ma obability, Reversibility and the Potential for Cumulative Effects of the effect. Mitigation measures should be outlined f ects of implementing the policy.
INSPECT AMENDMENTS 9.13 The Core Strategy will b Examination in Public presided over by a
planning inspector. The inspector will consider the Core Strategy and supporting documents, including the Sustainability Appraisal Report, and may insist that the
nability
result of con
.
OBJECTIVE TESTI
visionary d
available, thensure they
against the Su with the aims of s velopment.
the achievement of
en they will be f
GY POLICY OPTIO
It is necessary durionsider a wide ra
s should s for the achievement of nt and assist the identificigation measures to off s
OPTIONS AND PRED
s - and any other s - can be predicted. T
tainability Appra
Predicted Significant Effect Analgnitude, Significance, Duration, Pr
or any adverse eff
ORS REPORT
e the subject of an
Core Strategy be amended. Any amendments will also be subject to Sustai
Cheltenham Core Strategy Sustainability Appraisal Scoping report – revised April 2008 Page 57
Appraisal and the results will be recorded in a Final Sustainability Appraisal Report that will accompany the Core Strategy as it is adopted.
MITIGA 9.14
endations for any necessary mitigation measures to prevent, reduce or offset any predicted negative affects that implementation of the
uld include making changes to Core Strategy policies, developing additional planning policies, requiring additional
nges
MONIT
.15 This document has sets the baseline for the Sustainability Appraisal of the
.16 The results of this monitoring will be included in the Annual Monitoring Reports that
South West every December.
ibuting
ss ll
al Development Scheme.
– Relevant Plans, Policies and Programmes
APPEN
TION MEASURES
At each stage of the Core Strategy’s development the Sustainability Appraisal process will include recomm
Core Strategy may produce. Mitigation measures co
measures to be applied when implementing particular policies, suggesting chato other policies, plans or programmes and requiring an Environmental ImpactAssessments to accompany some planning applications.
ORING AND REVIEW
9Cheltenham Core Strategy. From the baseline data and review of relevant plans,policies and programmes a number of Sustainability Objectives have been developed. Progress towards these objectives will be monitored annually using the Decision Aiding Questions and Potential Detailed Indicators set out in the Sustainability Appraisal Framework.
9must be submitted to the Government Office for the
9.17 The purpose of this monitoring is to identify where planning policy is not contr
to sustainable development and to allow action to be taken before damage is doneto the local environment, economy or community. If monitoring shows that progreis not being made towards the achievement of Sustainability Objectives, changes wibe made to the way planning policy is being implemented or selected policy areas will be brought forward for review within the Loc
APPENDIX 1 APPENDIX 2 – Baseline Data Tables
DIX 3 – Quality Assurance Checklist
Cheltenham Core Strategy Sustainability Appraisal Scoping report – revised April 2008 Page 58
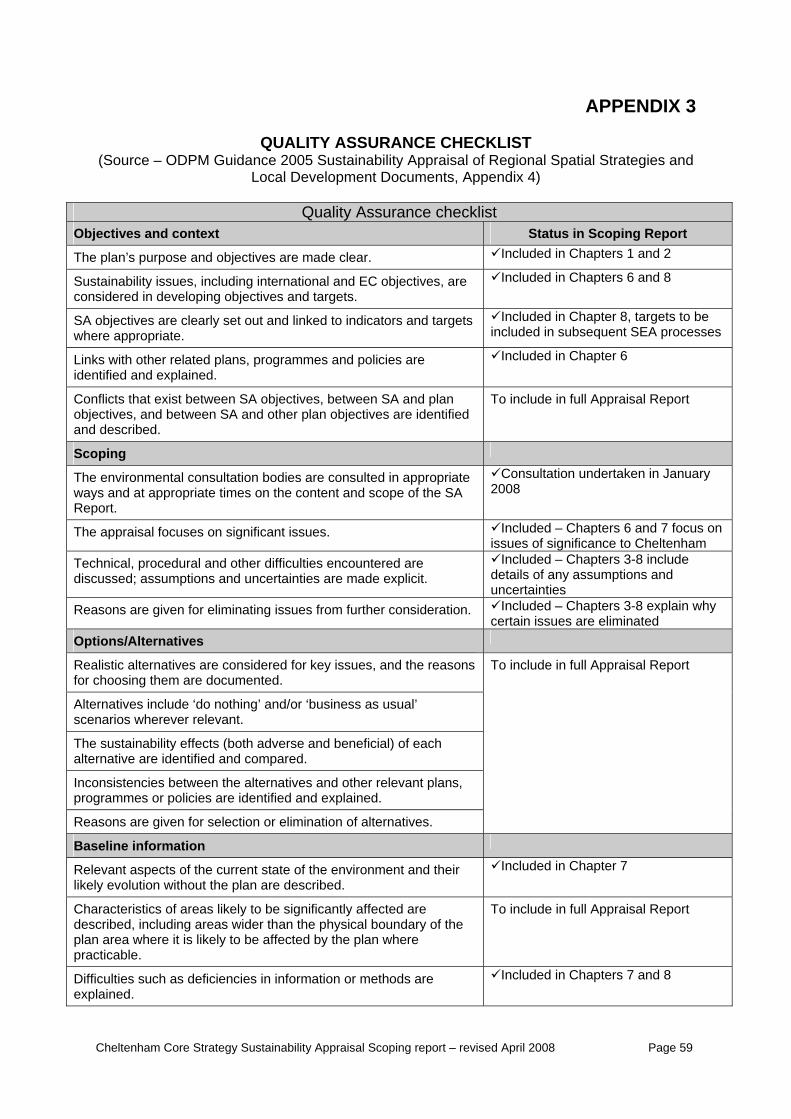
APPENDIX 3
URANCE CHECKLIST 2005 Sustainability Appraisal of Regional Spatial Strategies and
QUALITY ASSSource – ODPM Guidance (
Local Development Documents, Appendix 4)
Quality Assurance checklist Objectives and context Status in Scoping Report
The plan’s purpose and objectives are made clear. Included in Chapters 1 and 2
Sustainabiliconsidered
ty issues, including international and EC objectives, are in developing objectives and targets.
Included in Chapters 6 and 8
SA objectives are clearly set out and linked to indicators and targets whe
ed in Chapter 8, targets to be included in subsequent SEA processes
Includre appropriate.
Links with othiden an
Included in Chapter 6 er related plans, programmes and policies are tified d explained.
Conflicts thaobjectives, and describ
ort t exist between SA objectives, between SA and plan and between SA and other plan objectives are identified ed.
To include in full Appraisal Rep
Scoping
The environmental consultation bodies are consulted in appropriate wayReport.
Consultation undertaken in January s and at appropriate times on the content and scope of the SA 2008
The is Included – Chapters 6 and 7 focus on
appra al focuses on significant issues. issues of significance to Cheltenham
Technical, pdiscussed; a
rocedural and other difficulties encountered are ssumptions and uncertainties are made explicit.
Included – Chapters 3-8 includedetails of any assumptions and uncertainties
Reasons are n why given for eliminating issues from further consideration. Included – Chapters 3-8 explaicertain issues are eliminated Options/Alternatives
Realistic alternatives are considered for key issues, and the reasons for choosing them are documented.
Alternatives isce
nclude ‘do nothing’ and/or ‘business as usual’ narios wherever relevant.
The sustainability effects (both adverse and beneficial) of each alternative are identified and compared.
Inconsistencies between the alternatives and other relevant plans, programmes or policies are identified and explained.
Reasons are given for selection or elimination of alternatives.
To include in full Appraisal Report
Baseline information
Relevant aspects of the current state of the environment and their likely evolution without the plan are described.
Included in Chapter 7
Characteristics of areas likely to be significantly affected are described, including areas wider than the physical boundary of the plan area where it is likely to be affected by the plan where practicable.
To include in full Appraisal Report
Difficulties such as deficiencies in information or methods are explained.
Included in Chapters 7 and 8
Cheltenham Core Strategy Sustainability Appraisal Scoping report – revised April 2008 Page 59
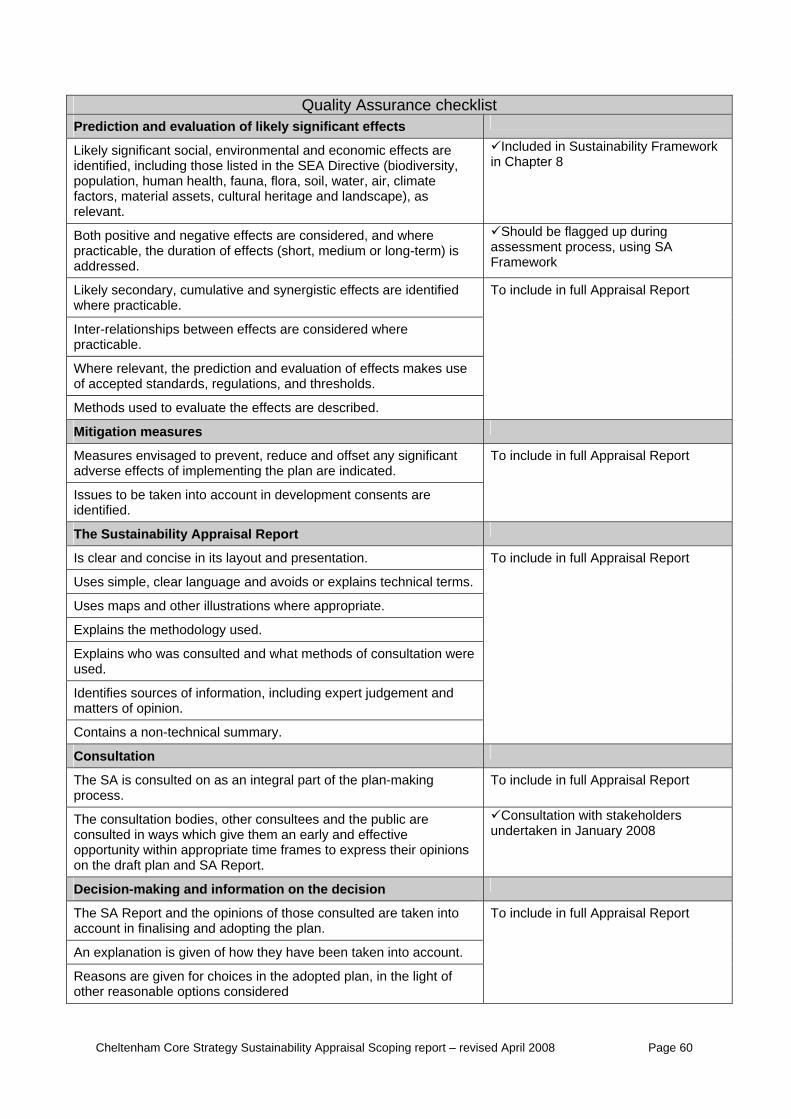
Quality Assurance checklist Prediction and evaluation of likely significant effects
Likeidenpopulation, human health, faufactors, material assets, cultural heritage and landscap ), as relevant.
d in Sustainability Framework ly significant social, environmental and economic effects are tified, including those listed in the SEA Directive (biodiversity,
na, flora, soil, water, air, climate in Chapter 8
Include
e
Both positive and negative effects are considered, and where long-term) is
Shopracticable, the duration of effects (short, medium oraddressed.
uld be flagged up during assessment process, using SA Framework
Likely secondary, cumulative and synergistic effects are identified where practicable.
Inter-relationships between effects are considered where practicable.
Where relevant, the prediction and evaluation of effects makeof accepted standards, re
s use gulations, and thresholds.
Methods used to evaluate the effects are described.
To include in full Appraisal Report
Mitigation mea sures
Measures envisaged to prevent, reduce and offset any significant adverse effects of implementing the plan are indicated.
Issues to be taken into account in development consents are identified.
o include in full Appraisal Report T
The Sustainability Appraisal Report
Is clear and concise in its layout and presentation.
Uses simple, clear language and avoids or explains technical terms.
Uses maps and other illustrations where appropriate.
Explains the methodology used.
Explains who was consulted and what methods of consultation were used.
Identifies sources of information, including expert judgement and matters of opinion.
Contains a non-technical summary.
To include in full Appraisal Report
Consultation
The SA is consulted on as an integral part of the plan-making process.
To include in full Appraisal Report
The consultation bodies, other consultees and the public are consulted in ways whicopportunity within appro
h give them an early and effective priate time frames to express their opinions
Consultation with stakeholders rtaken in January 2008
on the draft plan and SA Report.
unde
Decision-making and information on the dec ision
The SA Report and the opinions of those consulted are taken into account in finalising and adopting the plan.
An explanation is given of how they have been taken into account.
Reasons are given for choices in the adopted plan, in the light other reaso
of nable options considered
To include in full Appraisal Report
Cheltenham Core Strategy Sustainability Appraisal Scoping report – revised April 2008 Page 60
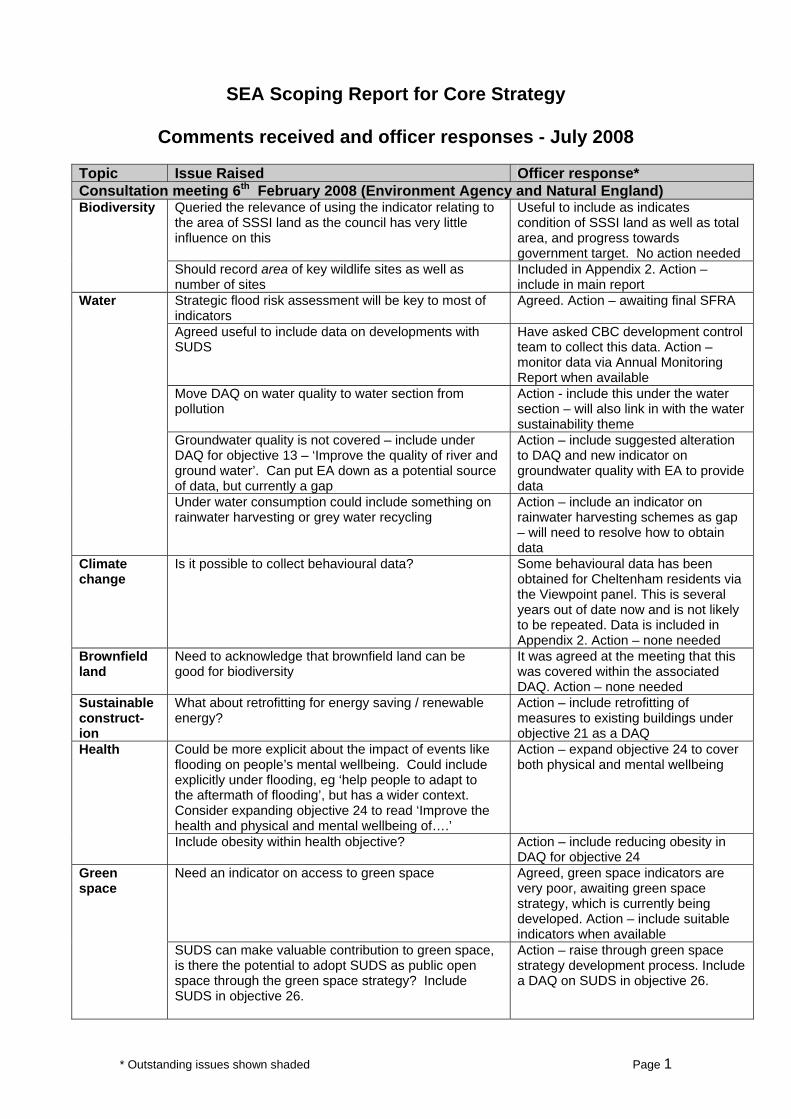
SEA Scoping Report for Core Strategy
Comments received and officer responses - July 2008
Topic Issue Raised Officer response* Consultation meeting 6th February 2008 (Environment Agency and Natural England)
Queried the relevance of using the indicator relating to the area of SSSI land as the council has very little influence on this
Useful to include as indicates condition of SSSI land as well as total area, and progress towards government target. No action needed
Biodiversity
Should record area of key wildlife sites as well as number of sites
Included in Appendix 2. Action – include in main report
Strategic flood risk assessment will be key to most of indicators
Agreed. Action – awaiting final SFRA
Agreed useful to include data on developments with SUDS
Have asked CBC development control team to collect this data. Action – monitor data via Annual Monitoring Report when available
Move DAQ on water quality to water section from pollution
Action - include this under the water section – will also link in with the water sustainability theme
Groundwater quality is not covered – include under DAQ for objective 13 – ‘Improve the quality of river and ground water’. Can put EA down as a potential source of data, but currently a gap
Action – include suggested alteration to DAQ and new indicator on groundwater quality with EA to provide data
Water
Under water consumption could include something on rainwater harvesting or grey water recycling
Action – include an indicator on rainwater harvesting schemes as gap – will need to resolve how to obtain data
Climate change
Is it possible to collect behavioural data? Some behavioural data has been obtained for Cheltenham residents via the Viewpoint panel. This is several years out of date now and is not likely to be repeated. Data is included in Appendix 2. Action – none needed
Brownfield land
Need to acknowledge that brownfield land can be good for biodiversity
It was agreed at the meeting that this was covered within the associated DAQ. Action – none needed
Sustainable construct-ion
What about retrofitting for energy saving / renewable energy?
Action – include retrofitting of measures to existing buildings under objective 21 as a DAQ
Could be more explicit about the impact of events like flooding on people’s mental wellbeing. Could include explicitly under flooding, eg ‘help people to adapt to the aftermath of flooding’, but has a wider context. Consider expanding objective 24 to read ‘Improve the health and physical and mental wellbeing of….’
Action – expand objective 24 to cover both physical and mental wellbeing
Health
Include obesity within health objective? Action – include reducing obesity in DAQ for objective 24
Need an indicator on access to green space Agreed, green space indicators are very poor, awaiting green space strategy, which is currently being developed. Action – include suitable indicators when available
Green space
SUDS can make valuable contribution to green space, is there the potential to adopt SUDS as public open space through the green space strategy? Include SUDS in objective 26.
Action – raise through green space strategy development process. Include a DAQ on SUDS in objective 26.
* Outstanding issues shown shaded Page 1
Topic Issue Raised Officer response* Although 10 mile distance from a site is used as a measure for screening out, would depend on abstraction levels
Although there is a site within 5 km of the borough boundary, impact on abstraction levels has not been flagged up as a local issue in the RSS, Severn Catchment Abstraction Management Strategy or Water Resource Management Plan. Action – ensure that appropriate screening is undertaken if a joint core strategy is pursued.
Habitats Regulations
Big developments/urban extensions will impact on the Severn Estuary and Cotswold escarpment, so Habitats Regulations Assessment will be necessary at some point. Contact Charlotte Padgenden at Natural England for advice on Appropriate Assessment.
See above.
Environment Agency – letter dated 18th February 2008 In the Biodiversity section, creating new habitats has been left out. We consider this should be worded as follows: Biodiversity – work with the grain of nature to protect, restore, create and enhance habitats, species and sites of geological interest. We are pleased that this theme/objective is not limited to just designated sites, but includes all areas of biodiversity interested.
Action – amend theme as suggested
We strongly support the climate change theme/objective, particularly as it includes both mitigation and adaptation. The final PPS1 was published on 17th December 2007, consider including the final version in the scoping report.
Action – include final version of PPS1 in Appendix 1
In the water section you should also include reference to your SPG on SuDS
Included in Appendix 1. Action – include SPG on SuDS in table 6
Sustainab-ility Themes
There is a typo in the Waste section – the word ‘encouraged’ should be ‘encourage’, which slightly alters the meaning so needs correcting. There is a further typo in the section 3 header (social themes) where the word ‘healthy’ appears as ‘heath’.
Action – correct two typing mistakes
As a general comment the trends are more in the form of comments. One trend comment that we don’t consider to be adequate is the comment for ‘number of properties at risk from flooding’. This comment could be enhanced to read: “Avoid locating inappropriate development in the floodplain through use of the Sequential Test, Exception Test and sequential approach advocated in PPS 25.”
Action – amend trend to include suggested text
Baseline Data Table 7a:
You have cited the EA as a source for data on surface water flooding and groundwater flooding. As discussed at the consultation meeting we have very limited information on this currently. The SFRA will help to inform this section of the report and fill in many of the gaps.
Action – awaiting SFRA, will attempt to fill gaps using data from this report, when available
Ground-water quality monitoring.
EA can provide information on the number of sites/ hectorage that has been remediated (cleaned up). We do have groundwater quality monitoring data however this is quite sparsely dispersed across our region. We are unlikely to have any data for Cheltenham as it is located mainly on a sands and gravels aquifer with limited bedrock (which is the type of geology where we conduct most of this monitoring.) If you pursue a Joint Core Strategy with Tewkesbury and Gloucester City this data may be relevant/available.
Although it sounds as if groundwater quality data for Cheltenham is not available it would still be useful to flag this up as a gap. Action – include as a gap in indicator data
* Outstanding issues shown shaded Page 2
Topic Issue Raised Officer response* Gloucestershire County Council – letter dated 18th February 2008
The County Council as Waste Planning Authority welcomes Objective 9 – ‘To minimise the volume of waste created and promote reuse, recycling and composting to reduce landfill’. Maybe the ‘waste hierarchy’ could be specifically referred to.
Action – include mention of the waste hierarchy in the waste theme
The County Council welcomes SA Objective 9, but maybe the waste hierarchy should be explicitly mentioned.
Mentioned in the theme and could make the objective over detailed.. No action needed
SA Objective 21 could potentially refer to reducing levels of construction and demolition waste.
The DAQ for objective 11 on waste specifically mentions minimising construction and demolition waste. No action needed
Page 17, under ‘Waste’ should refer to Gloucestershire’s emerging Draft Waste Core Strategy and Gloucestershire’s adopted Supplementary Planning Document Waste Minimisation in Development Projects (September 2006).
Action - include reference to these publications in Appendix 1 and Table 6
On Page 18, under ‘Sustainable construction’ Gloucestershire’s SPD Waste Minimisation in Development Projects (September 2006) should be listed and also included in Appendix 1.
Included in waste section, no need to duplicate in sustainable construction section. No action needed
Minerals and Waste
On page 29, it states that ‘Gloucestershire has a lack of landfill space’. This is not strictly accurate. There is significant void space at Wingmoor Farm. However it is Government policy through the Landfill Tax and the Landfill Allowance Trading Scheme (LATS) that is making landfilling increasingly expensive.
Action – amend Appendix 2 and Table 7A to reflect this comment
The SA Scoping report for the Core Strategy lists the sustainability objectives and themes. We are pleased to see that these include the conservation and enhancement of biodiversity and geodiversity. Reference to the forthcoming Green Space Strategy is made on page 8 and is an important evidence document for the Core Strategy and the SA.
Agree with these comments – no action needed
We note that the need for a Habitats Regulations Assessment (HRA) is screened. If a joint Core Strategy emerges as necessary for new development across Cheltenham, Gloucester and parts of Tewkesbury and Stroud Districts then a HRA would certainly be needed.
Action – ensure that appropriate screening is undertaken if a joint core strategy is pursued
Ecology
On page 11 it is stated that the nearest European Site to the Borough is Bredon Hill. This is incorrect. The closest European site is Dixton Wood SAC in Tewkesbury Borough (c.5km north west of the Cheltenham Borough boundary). The Cotswolds Beechwoods SAC are a similar distance to the south west. Natural England will be able to advise further on this matter, but it is likely that there will be no significant effects on these sites
Agreed, nearest site is within 5 km, however it is considered that the core strategy will have no significant effect on this designation. Action – amend text.
Meeting with Forum for the Future and follow-up email February 2008 General The tone of the purpose of SA can be expressed in a
more positive manner e.g: NTS ‘which is designed to protect the environment from harm’ could be changed to ‘which is designed to enhance the environment when new plans are prepared’; instead of 1.5 ‘…. Core strategy objectives and policies do not conflict with the achievement of sustainable development’, it could read ‘policies promote the achievement of sustainable development.’
Action – make suggested changes
* Outstanding issues shown shaded Page 3
Topic Issue Raised Officer response* There is some repetition, particularly in explaining the SA process that could be cut down further e.g. 9.9 to 9.12. This will be particularly important for the full SA, which experience elsewhere shows, is prone to producing very large and cumbersome reports. By keeping it to a minimum, it will ensure that the focus remains on the findings and impact of the SA.
Text amended and reduced.
It needs to include a quality assurance framework as specified in the ODPM guidance.
Action – include the framework (See appendix 4 of ODPM guidance – 82-84), as appendix 3
The diagram on p.52 needs to specify sustainability report, rather than environment report.
Action – amend diagram
Make the process as transparent as possible in the report e.g. by explaining that the themes were derived from national and regional drivers and objectives were developed to reflect the local, regional and national context.
Action – amend table 5 to reflect these suggestions
Consultat-ion
Paragraph 1.3 should include a reference to the workshop held in December. It reads as if the minimum is being adhered to. Outline what was covered at the workshop e.g. testing the objectives and decision aiding questions against policies but did not cover significant issues.
Action – include details of workshop in para 9.5
A steering group should be put in place to oversee the full SA, comprising representatives from across the organisation, including any key external partners to drive the process and share and apply knowledge with colleagues.
Action – on hold, pending discussions on Joint Core Strategy
Sustainab-ility themes, framework and objectives
Table 10 is not actually the proposed framework which will be used to assess policies e.g. It does not actually outline the way in which each theme will be assessed e.g. a scoring system for the appraisal criteria. Rather, it contains the information required for and the links to SEA. Whilst this was useful during the scoping process, it precludes feedback on the full assessment process and increases the risk that not all with agree with, or understand the final methodology. This aspect is crucial to interpreting the significance of impacts and it would benefit from further explanation about how the effect will be assessed. It simply lists the criteria taken from the directive in 9.12. The assessment framework should include a scoring mechanism (without prescribing what type) that triggers significance. This should not result a cumulative score. We also recommend the use of colour coding and matrices to illustrate results and conflict.
Agreed, a scoring methodology should be included. Action – include a scoring mechanism with an indication of how it would be applied during the assessment process in Chapter 8.
A diagram illustrating how the objectives were arrived at would be useful.
Action - New table setting out these stages to be included
A number of suggested revisions to the objectives and questions are listed in an attachment to the response.
Action – Amend Table 10 to reflect the majority of the suggestions
In addition, we would recommend merging all of the themes with the objectives ensuring that the final objective fully reflects the aspirations set out in the theme as this is not always the case e.g. transport.
Not convinced this accords with our methodology. Action – none needed
Restructure the economic section into economic development, employment, education and skills and reword accordingly.
Action – implement suggested restructuring
* Outstanding issues shown shaded Page 4
Topic Issue Raised Officer response* Add an extra objective on governance. Example
questions include: • To deliver objectives transparently over the long-
term, following sound science and in an integrated manner.
• Fully account for the implications of policy and practice on the lifetime of the development and future generations?
• Pursue a cross-sectoral partnership approach wherever appropriate?
• Ensure that relevant stakeholders and active organisations are involved in the development and implementation of decisions?
• Appraise, monitor and review outcomes effectively? These objectives can then form a vital resource for Cheltenham and all further appraisals should draw from these. This will ensure consistency and enable comparability within the council.
Action – build into objective 28 and incorporate some of suggested DAQs
Sustainab-ility issues
Present the information in the same categories as the sustainability objectives for ease of reference. Within this, group according to the existing sub-headings.
Not convinced this accords with our methodology. Action – none needed
Evidence base
Merge table 7a with 7b, extrapolating any pertinent information from 7a that is not already in 7b e.g. trends and presenting the rest of the information from 7a in an appendix. This then becomes one complete table containing all environmental, economic and social issues.
Not convinced this accords with our methodology. Action – none needed
Table 7a and 7b clearly extrapolates the issues from the trends identified.
Action – none needed
Links with other plans and programmes
The following additions would be useful: a reference to relevant targets from the specified plan or programme and a diagram illustrating the relationship to other categories of plans and programmes.
Action – include more targets when A1 is next reviewed
Make reference to the objective within the SA framework so it is clear where the link has been made.
Trying to keep SA framework as simple as possible. Action - none needed
* Outstanding issues shown shaded Page 5