Embed Size (px)
Citation preview
Media enquires contact: Michelle McKinnon or Jade Harling– 1300 472 767 or [email protected]
Hedonic Home Value Index
2.5%
2.1%
1.5%
0.8%
1.5%
2.5%
0.7%
1.9%
2.2%
2.6%
1.9%
2.0%
1.0%
2.7%
1.0%
2.0%
2.1%
2.1%
SydneyMelbourne
BrisbaneAdelaide
PerthHobartDarwin
Canberra
Regional NSWRegional VicRegional QldRegional SA
Regional WARegional TasRegional NT
Combined capitalsCombined regionals
Australia
1 March 2021
CoreLogic: Momentum builds across Australian housing markets as values rise at the fastest rate in seventeen yearsAustralian home values surged 2.1% higher in February; thelargest month-on-month change in CoreLogic’s national homevalue index since August 2003. Spurred on by a combinationof record low mortgage rates, improving economic conditions,government incentives and low advertised supply levels,Australia’s housing market is in the midst of a broad-basedboom.
Housing values are rising across each of the capital city andrest of state regions, demonstrating the diverse nature of thishousing upswing.
According to CoreLogic’s research director, Tim Lawless, asynchronised growth phase like this hasn’t been seen inAustralia for more than a decade. “The last time we saw asustained period where every capital city and rest of stateregion was rising in value was mid-2009 through to early 2010,as post-GFC stimulus fueled buyer demand.”
Sydney and Melbourne were among the strongest performingmarkets, recording a 2.5% and 2.1% lift in home values overthe month respectively, as Australia’s two largest cities caughtup from weaker performance through 2020. The quarterlytrend however, is still favouring the smaller cities; Darwinhousing values rose 5.5% over the past three months, Hobartvalues rose 4.8% and Perth was up 4.2%.
“Whether this new found growth in Sydney and Melbournecan be sustained is unclear. Both cities are still recordingvalues below their earlier peaks, however at this current rateof appreciation it won’t be long before Australia’s two mostexpensive capital city markets are moving through new recordhighs. With household incomes expected to remain subduedand stimulus winding down, it is likely affordability will onceagain become a challenge in these cities,” Mr Lawless said.
Regional markets (up +2.1% over the month) have continuedto show a higher rate of capital gain relative to the capitalcities (up +2.0%), however the performance gap has narrowedcompared with the earlier phase of the growth cycle. Regionalareas generally recorded less of a decline in housing valuesthrough the worst of the COVID period last year, while alsoshowing an earlier and stronger growth trend through thesecond half of last year. This regional preference is reflectedin the annual growth trend, where the combined regionalsindex is 9.4% higher while the combined capital city index is upa much smaller 2.6%.
A housing market trend that has persisted through the COVIDperiod to-date is the weaker performance of unit marketsrelative to detached housing. Across CoreLogic’s combinedcapitals index, house values (+4.4% over the past threemonths) have recorded a growth rate more than three timeshigher than that of its unit counterparts (+1.4%). There aresome tentative signs this trend could become less obvious,with Sydney unit values recording their first month of growthsince April last year and Melbourne unit values recording theirlargest gain since late 2019.
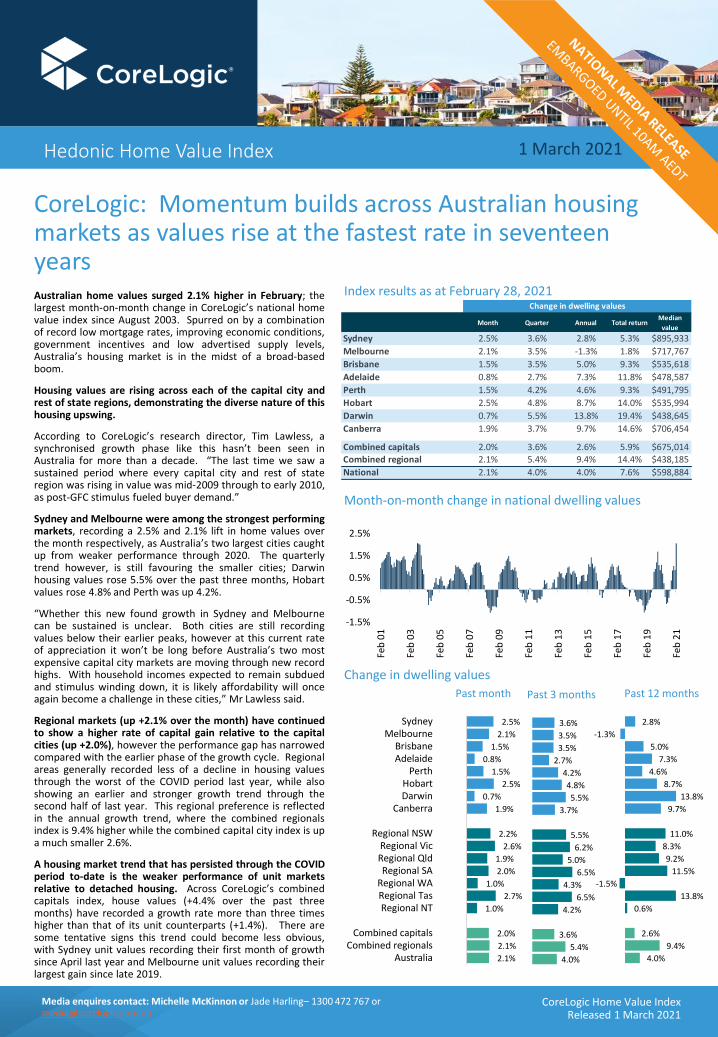
Index results as at February 28, 2021
Change in dwelling values
Month-on-month change in national dwelling values
Past 12 monthsPast 3 monthsPast month
CoreLogic Home Value IndexReleased 1 March 2021
3.6%
3.5%
3.5%
2.7%
4.2%
4.8%
5.5%
3.7%
5.5%
6.2%
5.0%
6.5%
4.3%
6.5%
4.2%
3.6%
5.4%
4.0%
2.8%
-1.3%
5.0%
7.3%
4.6%
8.7%
13.8%
9.7%
11.0%
8.3%
9.2%
11.5%
-1.5%
13.8%
0.6%
2.6%
9.4%
4.0%
-1.5%
-0.5%
0.5%
1.5%
2.5%
Feb
01
Feb
03
Feb
05
Feb
07
Feb
09
Feb
11
Feb
13
Feb
15
Feb
17
Feb
19
Feb
21
Month Quarter Annual Total returnMedian
value
Sydney 2.5% 3.6% 2.8% 5.3% $895,933
Melbourne 2.1% 3.5% -1.3% 1.8% $717,767
Brisbane 1.5% 3.5% 5.0% 9.3% $535,618
Adelaide 0.8% 2.7% 7.3% 11.8% $478,587
Perth 1.5% 4.2% 4.6% 9.3% $491,795
Hobart 2.5% 4.8% 8.7% 14.0% $535,994
Darwin 0.7% 5.5% 13.8% 19.4% $438,645
Canberra 1.9% 3.7% 9.7% 14.6% $706,454
Combined capitals 2.0% 3.6% 2.6% 5.9% $675,014
Combined regional 2.1% 5.4% 9.4% 14.4% $438,185
National 2.1% 4.0% 4.0% 7.6% $598,884
Change in dwelling values
Media enquires contact: Michelle McKinnon or Jade Harling– 1300 472 767 or [email protected] enquires contact: Michelle McKinnon or Jade Harling - 1300 472 767 or [email protected]
Hedonic Home Value Index
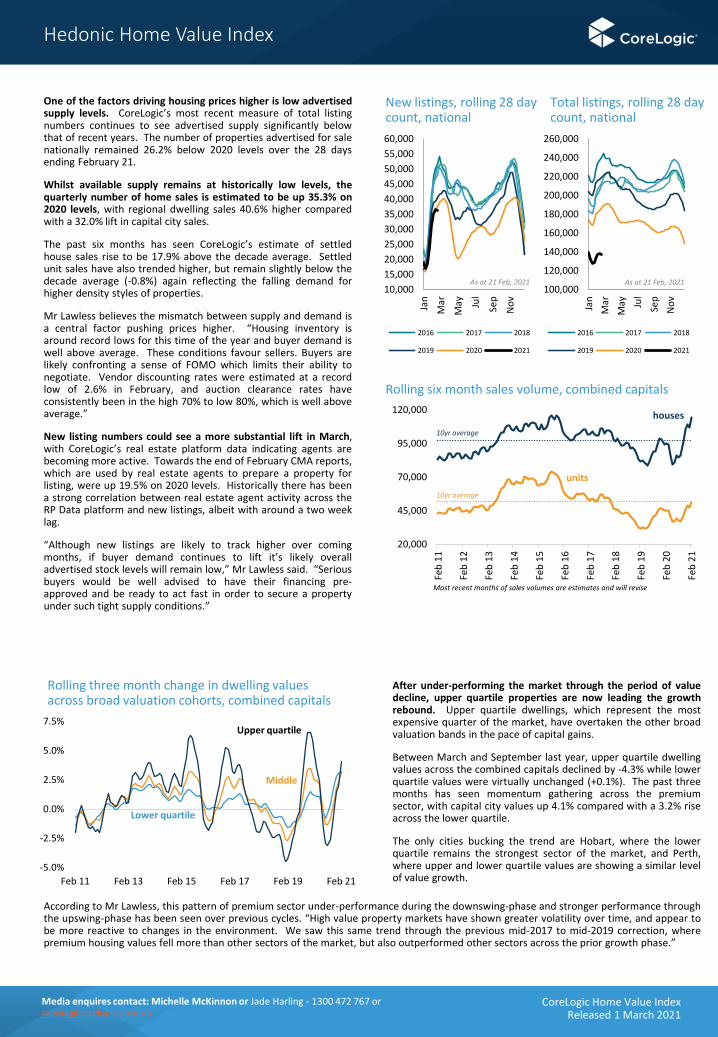
One of the factors driving housing prices higher is low advertisedsupply levels. CoreLogic’s most recent measure of total listingnumbers continues to see advertised supply significantly belowthat of recent years. The number of properties advertised for salenationally remained 26.2% below 2020 levels over the 28 daysending February 21.
Whilst available supply remains at historically low levels, thequarterly number of home sales is estimated to be up 35.3% on2020 levels, with regional dwelling sales 40.6% higher comparedwith a 32.0% lift in capital city sales.
The past six months has seen CoreLogic’s estimate of settledhouse sales rise to be 17.9% above the decade average. Settledunit sales have also trended higher, but remain slightly below thedecade average (-0.8%) again reflecting the falling demand forhigher density styles of properties.
Mr Lawless believes the mismatch between supply and demand isa central factor pushing prices higher. “Housing inventory isaround record lows for this time of the year and buyer demand iswell above average. These conditions favour sellers. Buyers arelikely confronting a sense of FOMO which limits their ability tonegotiate. Vendor discounting rates were estimated at a recordlow of 2.6% in February, and auction clearance rates haveconsistently been in the high 70% to low 80%, which is well aboveaverage.”
New listing numbers could see a more substantial lift in March,with CoreLogic’s real estate platform data indicating agents arebecoming more active. Towards the end of February CMA reports,which are used by real estate agents to prepare a property forlisting, were up 19.5% on 2020 levels. Historically there has beena strong correlation between real estate agent activity across theRP Data platform and new listings, albeit with around a two weeklag.
“Although new listings are likely to track higher over comingmonths, if buyer demand continues to lift it’s likely overalladvertised stock levels will remain low,” Mr Lawless said. “Seriousbuyers would be well advised to have their financing pre-approved and be ready to act fast in order to secure a propertyunder such tight supply conditions.”
New listings, rolling 28 day count, national
Total listings, rolling 28 day count, national
Rolling six month sales volume, combined capitals
Most recent months of sales volumes are estimates and will revise
CoreLogic Home Value IndexReleased 1 March 2021
10,000
15,000
20,000
25,000
30,000
35,000
40,000
45,000
50,000
55,000
60,000
Jan
Mar
May Ju
l
Sep
No
v
2016 2017 2018
2019 2020 2021
As at 21 Feb, 2021100,000
120,000
140,000
160,000
180,000
200,000
220,000
240,000
260,000
Jan
Mar
May Ju
l
Sep
No
v
2016 2017 2018
2019 2020 2021
As at 21 Feb, 2021
Rolling three month change in dwelling values across broad valuation cohorts, combined capitals
20,000
45,000
70,000
95,000
120,000
Feb
11
Feb
12
Feb
13
Feb
14
Feb
15
Feb
16
Feb
17
Feb
18
Feb
19
Feb
20
Feb
21
houses
units
10yr average
10yr average
-5.0%
-2.5%
0.0%
2.5%
5.0%
7.5%
Feb 11 Feb 13 Feb 15 Feb 17 Feb 19 Feb 21
Upper quartile
Lower quartile
Middle
After under-performing the market through the period of valuedecline, upper quartile properties are now leading the growthrebound. Upper quartile dwellings, which represent the mostexpensive quarter of the market, have overtaken the other broadvaluation bands in the pace of capital gains.
Between March and September last year, upper quartile dwellingvalues across the combined capitals declined by -4.3% while lowerquartile values were virtually unchanged (+0.1%). The past threemonths has seen momentum gathering across the premiumsector, with capital city values up 4.1% compared with a 3.2% riseacross the lower quartile.
The only cities bucking the trend are Hobart, where the lowerquartile remains the strongest sector of the market, and Perth,where upper and lower quartile values are showing a similar levelof value growth.
According to Mr Lawless, this pattern of premium sector under-performance during the downswing-phase and stronger performance throughthe upswing-phase has been seen over previous cycles. “High value property markets have shown greater volatility over time, and appear tobe more reactive to changes in the environment. We saw this same trend through the previous mid-2017 to mid-2019 correction, wherepremium housing values fell more than other sectors of the market, but also outperformed other sectors across the prior growth phase.”
Media enquires contact: Michelle McKinnon or Jade Harling– 1300 472 767 or [email protected]
Hedonic Home Value Index
Overall, Australia’s housing market is now well entrenched in oneof the strongest growth phases on record. For housing values andactivity to be surging during a global pandemic seems counterintuitive, however the factors driving this growth are significantand diverse.
Record low mortgage rates look set to remain in place for aprolonged period of time, providing confidence to buyers andhistorically low interest payment to income ratios.
Economic conditions are consistently beating forecasts, with theRBA acknowledging Australia’s economy is likely to recover six totwelve months earlier than originally expected. The economicrecovery is feeding into a solid rebound in consumer sentiment andencouraging households to reduce their savings buffer and spendmore.
Advertised supply remains around record low levels, at a timewhen buyer demand is rising swiftly to above average levels. Thismismatch between demand and supply looks set to remain afeature of the housing market for some time.
There are some headwinds ahead in the form of a reduction infiscal support from the federal government, home loan deferralarrangements expiring and migration remaining stalled. Theintensity of these headwinds have lessened over recent months.The economy navigated the earlier fiscal cliff relatively seamlessly,however the wind-up of JobKeeper and the COVID supplement forJobSeeker is likely to cause a temporary slowdown in the economicrecovery which could slow some of the housing marketexuberance.
Similarly, there has been a substantial drop in deferred homeloans. Down from $195 billion (11% of all home loans) in May lastyear, APRA reported that $32 billion or 1.8% of all mortgages werestill deferred at the end of January. As the deferral programexpires at the end of March we could progressively see a rise inforced sales across some sectors of the housing market.
Housing price momentum looks to be skewed towards the upside,with the tailwinds of low rates, improving economic conditions andconsumer confidence, low supply and high consumer demand likelyto outweigh the headwinds associated with the coming wind-downof fiscal support.
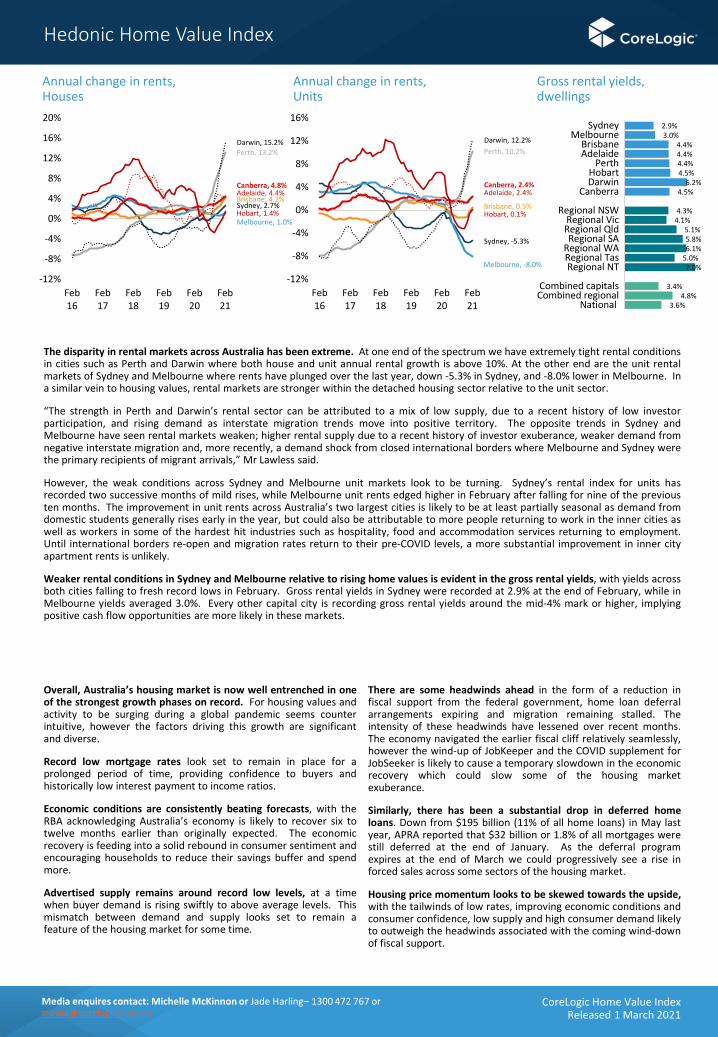
The disparity in rental markets across Australia has been extreme. At one end of the spectrum we have extremely tight rental conditionsin cities such as Perth and Darwin where both house and unit annual rental growth is above 10%. At the other end are the unit rentalmarkets of Sydney and Melbourne where rents have plunged over the last year, down -5.3% in Sydney, and -8.0% lower in Melbourne. Ina similar vein to housing values, rental markets are stronger within the detached housing sector relative to the unit sector.
“The strength in Perth and Darwin’s rental sector can be attributed to a mix of low supply, due to a recent history of low investorparticipation, and rising demand as interstate migration trends move into positive territory. The opposite trends in Sydney andMelbourne have seen rental markets weaken; higher rental supply due to a recent history of investor exuberance, weaker demand fromnegative interstate migration and, more recently, a demand shock from closed international borders where Melbourne and Sydney werethe primary recipients of migrant arrivals,” Mr Lawless said.
However, the weak conditions across Sydney and Melbourne unit markets look to be turning. Sydney’s rental index for units hasrecorded two successive months of mild rises, while Melbourne unit rents edged higher in February after falling for nine of the previousten months. The improvement in unit rents across Australia’s two largest cities is likely to be at least partially seasonal as demand fromdomestic students generally rises early in the year, but could also be attributable to more people returning to work in the inner cities aswell as workers in some of the hardest hit industries such as hospitality, food and accommodation services returning to employment.Until international borders re-open and migration rates return to their pre-COVID levels, a more substantial improvement in inner cityapartment rents is unlikely.
Weaker rental conditions in Sydney and Melbourne relative to rising home values is evident in the gross rental yields, with yields acrossboth cities falling to fresh record lows in February. Gross rental yields in Sydney were recorded at 2.9% at the end of February, while inMelbourne yields averaged 3.0%. Every other capital city is recording gross rental yields around the mid-4% mark or higher, implyingpositive cash flow opportunities are more likely in these markets.
Annual change in rents, Houses
Gross rental yields, dwellings
CoreLogic Home Value IndexReleased 1 March 2021
Annual change in rents, Units
Sydney, 2.7%
Melbourne, 1.0%
Brisbane, 4.2%Adelaide, 4.4%
Perth, 13.2%
Hobart, 1.4%
Darwin, 15.2%
Canberra, 4.8%
-12%
-8%
-4%
0%
4%
8%
12%
16%
20%
Feb16
Feb17
Feb18
Feb19
Feb20
Feb21
Sydney, -5.3%
Melbourne, -8.0%
Brisbane, 0.5%
Adelaide, 2.4%
Perth, 10.2%
Hobart, 0.1%
Darwin, 12.2%
Canberra, 2.4%
-12%
-8%
-4%
0%
4%
8%
12%
16%
Feb16
Feb17
Feb18
Feb19
Feb20
Feb21
2.9%3.0%
4.4%4.4%4.4%4.5%
6.2%4.5%
4.3%4.1%
5.1%5.8%6.1%
5.0%7.0%
3.4%4.8%
3.6%
SydneyMelbourne
BrisbaneAdelaide
PerthHobartDarwin
Canberra
Regional NSWRegional VicRegional QldRegional SA
Regional WARegional TasRegional NT
Combined capitalsCombined regional
National
Media enquires contact: Michelle McKinnon or Jade Harling– 1300 472 767 or [email protected]
Hedonic Home Value Index
MethodologyThe CoreLogic Hedonic Home Value Index is calculated using a hedonic regression methodology that addresses the issue of compositional bias associated with median price and other measures. In simple terms, the index is calculated using recent sales data combined with information about the attributes of individual properties such as the number of bedrooms and bathrooms, land area and geographical context of the dwelling. By separating each property into its various formational and locational attributes, observed sales values for each property can be distinguished between those attributed to the property’s attributes and those resulting from changes in the underlying residential property market. Additionally, by understanding the value associated with each attribute of a given property, this methodology can be used to estimate the value of dwellings with known characteristics for which there is no recent sales price by observing the
characteristics and sales prices of other dwellings which have recently transacted. It then follows that changes in the market value of the entire residential property stock can be accurately tracked through time. The detailed methodological information can be found at:
https://www.corelogic.com.au/research/rp-data-corelogic-home-value-index-methodology/
CoreLogic is able to produce a consistently accurate and robust Hedonic Index due to its extensive property related database, which includes transaction data for every home sale within every state and territory. CoreLogic augments this data with recent sales advice from real estate industry professionals, listings information and attribute data collected from a variety of sources.
CoreLogic is the largest independent provider of property information, analytics and property-related risk management services in Australia and New Zealand.
* The median value is the middle estimated value of all residential properties derived through the hedonic regression methodology that underlies the CoreLogic Hedonic Home Value Index.
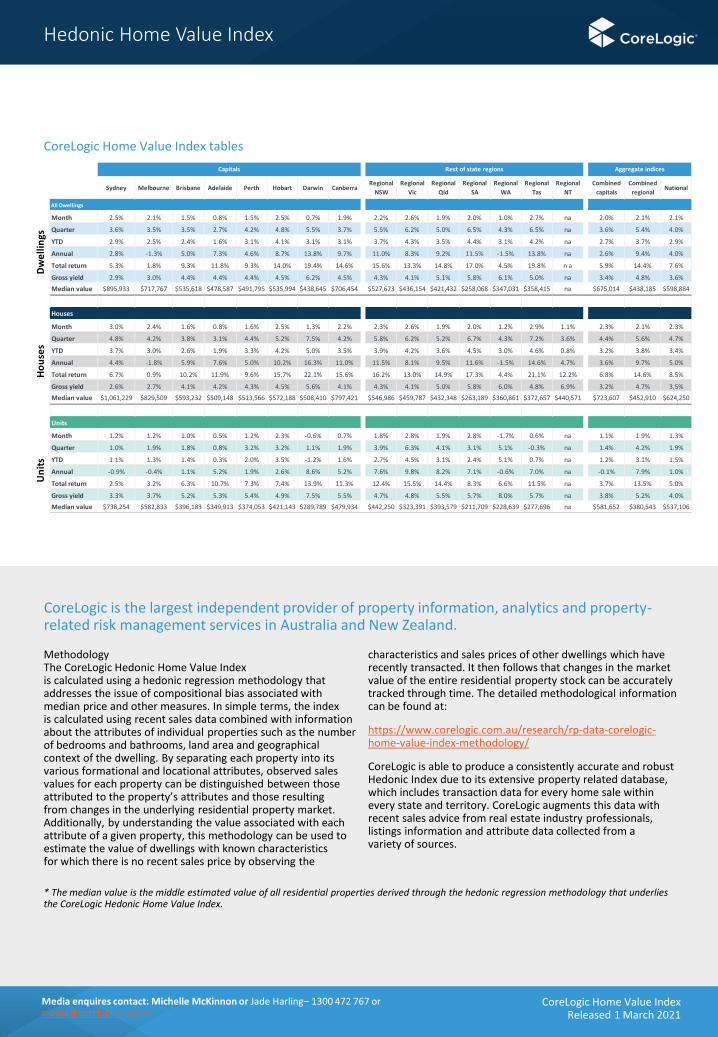
CoreLogic Home Value Index tables
CoreLogic Home Value IndexReleased 1 March 2021
Sydney Melbourne Brisbane Adelaide Perth Hobart Darwin CanberraRegional
NSW
Regional
Vic
Regional
Qld
Regional
SA
Regional
WA
Regional
Tas
Regional
NT
Combined
capitals
Combined
regionalNational
Month 2.5% 2.1% 1.5% 0.8% 1.5% 2.5% 0.7% 1.9% 2.2% 2.6% 1.9% 2.0% 1.0% 2.7% na 2.0% 2.1% 2.1%
Quarter 3.6% 3.5% 3.5% 2.7% 4.2% 4.8% 5.5% 3.7% 5.5% 6.2% 5.0% 6.5% 4.3% 6.5% na 3.6% 5.4% 4.0%
YTD 2.9% 2.5% 2.4% 1.6% 3.1% 4.1% 3.1% 3.1% 3.7% 4.3% 3.5% 4.4% 3.1% 4.2% na 2.7% 3.7% 2.9%
Annual 2.8% -1.3% 5.0% 7.3% 4.6% 8.7% 13.8% 9.7% 11.0% 8.3% 9.2% 11.5% -1.5% 13.8% na 2.6% 9.4% 4.0%
Total return 5.3% 1.8% 9.3% 11.8% 9.3% 14.0% 19.4% 14.6% 15.6% 13.3% 14.8% 17.0% 4.5% 19.8% n a 5.9% 14.4% 7.6%
Gross yield 2.9% 3.0% 4.4% 4.4% 4.4% 4.5% 6.2% 4.5% 4.3% 4.1% 5.1% 5.8% 6.1% 5.0% na 3.4% 4.8% 3.6%
Median value $895,933 $717,767 $535,618 $478,587 $491,795 $535,994 $438,645 $706,454 $527,673 $436,154 $421,432 $258,068 $347,031 $358,415 na $675,014 $438,185 $598,884
Houses
Month 3.0% 2.4% 1.6% 0.8% 1.6% 2.5% 1.3% 2.2% 2.3% 2.6% 1.9% 2.0% 1.2% 2.9% 1.1% 2.3% 2.1% 2.3%
Quarter 4.8% 4.2% 3.8% 3.1% 4.4% 5.2% 7.5% 4.2% 5.8% 6.2% 5.2% 6.7% 4.3% 7.2% 3.6% 4.4% 5.6% 4.7%
YTD 3.7% 3.0% 2.6% 1.9% 3.3% 4.2% 5.0% 3.5% 3.9% 4.2% 3.6% 4.5% 3.0% 4.6% 0.8% 3.2% 3.8% 3.4%
Annual 4.4% -1.8% 5.9% 7.6% 5.0% 10.2% 16.3% 11.0% 11.5% 8.1% 9.5% 11.6% -1.5% 14.6% 4.7% 3.6% 9.7% 5.0%
Total return 6.7% 0.9% 10.2% 11.9% 9.6% 15.7% 22.1% 15.6% 16.2% 13.0% 14.9% 17.3% 4.4% 21.1% 12.2% 6.8% 14.6% 8.5%
Gross yield 2.6% 2.7% 4.1% 4.2% 4.3% 4.5% 5.6% 4.1% 4.3% 4.1% 5.0% 5.8% 6.0% 4.8% 6.9% 3.2% 4.7% 3.5%
Median value $1,061,229 $829,509 $593,232 $509,148 $513,566 $572,188 $508,410 $797,421 $546,986 $459,787 $432,348 $263,189 $360,861 $372,657 $440,571 $723,607 $452,910 $624,250
Units
Month 1.2% 1.2% 1.0% 0.5% 1.2% 2.3% -0.6% 0.7% 1.8% 2.8% 1.9% 2.8% -1.7% 0.6% na 1.1% 1.9% 1.3%
Quarter 1.0% 1.9% 1.8% 0.8% 3.2% 3.2% 1.1% 1.9% 3.9% 6.3% 4.1% 3.1% 5.1% -0.3% na 1.4% 4.2% 1.9%
YTD 1.1% 1.3% 1.4% 0.3% 2.0% 3.5% -1.2% 1.6% 2.7% 4.5% 3.1% 2.4% 5.1% 0.7% na 1.2% 3.1% 1.5%
Annual -0.9% -0.4% 1.1% 5.2% 1.9% 2.6% 8.6% 5.2% 7.6% 9.8% 8.2% 7.1% -0.6% 7.0% na -0.1% 7.9% 1.0%
Total return 2.5% 3.2% 6.3% 10.7% 7.3% 7.4% 13.9% 11.3% 12.4% 15.5% 14.4% 8.3% 6.6% 11.5% na 3.7% 13.5% 5.0%
Gross yield 3.3% 3.7% 5.2% 5.3% 5.4% 4.9% 7.5% 5.5% 4.7% 4.8% 5.5% 5.7% 8.0% 5.7% na 3.8% 5.2% 4.0%
Median value $738,254 $582,833 $396,183 $349,913 $374,053 $421,143 $289,789 $479,934 $442,250 $323,391 $393,579 $211,709 $228,639 $277,696 na $581,652 $380,543 $537,106
Ho
use
sU
nit
s
All Dwellings
Capitals Rest of state regions Aggregate indices
Dw
ell
ings