Embed Size (px)
Citation preview

1 A P R I L 2 0 1 8
corospondent
AP
RIL
20
18
A
UT
UM
N E
DIT
ION 03 Notes from my inbox
06 Matters of land
09 Who guards the guards?
12 British American Tobacco
14 Adidas
17 South African economy
21 Bond outlook
24 South African flagship fund update
28 International outlook
32 A tale of two cities: Ho Chi Minh City vs. Cairo
34 Flagship fund range
38 Long-term investment track record
Land matters
The Personal Investments Quarterly

7th Floor, MontClare Place, Cnr Campground & Main Roads, Claremont 7708. PO Box 44684, Claremont 7735. Client service: 0800 22 11 77 E-mail: [email protected] www.coronation.com
All information and opinions provided are of a general nature and are not intended to address the circumstances of any particular individual or entity. As a result thereof, there may be limitations as to the appropriateness of any information given. It is therefore recommended that the reader first obtain the appropriate legal, tax, investment or other professional advice and formulate an appropriate investment strategy that would suit the risk profile of the reader prior to acting upon information. Neither Coronation Fund Managers Limited, Coronation Management Company (RF) (Pty) Ltd nor any other subsidiary of Coronation Fund Managers Limited (collectively “Coronation”) is acting, purporting to act and nor is it authorised to act in any way as an adviser. Coronation endeavours to provide accurate and timely information but we make no representation or warranty, express or implied, with respect to the correctness, accuracy or completeness of the information and opinions. Coronation does not undertake to update, modify or amend the information on a frequent basis or to advise any person if such information subsequently becomes inaccurate. Any representation or opinion is provided for information purposes only. Unit trusts should be considered a medium- to long-term investment. The value of units may go down as well as up, and is therefore not guaranteed. Past performance is not necessarily an indication of future performance. Unit trusts are allowed to engage in scrip lending and borrowing. Performance is calculated by Coronation for a lump sum investment with income distributions reinvested. All underlying price and distribution data is sourced from Morningstar. Performance figures are quoted after the deduction of all costs (including manager fees and trading costs) incurred within the fund. Note that individual investor performance may differ as a result of the actual investment date, the date of reinvestment of distributions and dividend withholding tax, where applicable. Annualised performance figures represent the geometric average return earned by the fund over the given time period. Where foreign securities are included in a fund it may be exposed to macroeconomic, settlement, political, tax, reporting or illiquidity risk factors that may be different to similar investments in the South African markets. Fluctuations or movements in exchange rates may cause the value of underlying investments to go up or down. The Coronation Money Market fund is not a bank deposit account. The fund has a constant price, and the total return is made up of interest received and any gain or loss made on any particular instrument, in most cases the return will merely have the effect of increasing or decreasing the daily yield, but in the case of abnormal losses it can have the effect of reducing the capital value of the portfolio. Excessive withdrawals could place the fund under liquidity pressures, in such circumstances a process of ring-fencing of redemption instructions and managed pay-outs over time may be followed. A fund of funds invests in collective investment schemes that levy their own fees and charges, which could result in a higher fee structure for this fund. A feeder fund invests in a single fund of a collective investment scheme, which levies its own charges and could result in a higher fee structure for the feeder fund. Coronation Management Company (RF) (Pty) Ltd is a Collective Investment Schemes Manager approved by the Financial Services Board in terms of the Collective Investment Schemes Control Act. Unit trusts are traded at ruling prices set on every day trading. Forward pricing is used. For Domestic Unit Trust Funds and Tax Free Investments, including rand-denominated International Unit Trust Funds, fund valuations take place at approximately 15h00 each business day, except at month end when the valuation is performed at approximately 17h00 (JSE market close). For these Funds, instructions must reach the Management Company before 14h00 (12h00 for the Money Market Fund) to ensure same day value. For International Unit Trust Funds that are denominated in a foreign currency, fund valuations take place at approximately 17h00 each business day (Irish Time) and instructions must reach the Management Company before 12h00 (South African Time) to ensure the value of the next business day. For Retirement Products, fund valuations take place at approximately 15h00 each business day, except at month end when valuation is performed at approximately 17h00 (JSE market close). For these Products, instructions must reach the Management Company before 14h00 to ensure the value of the next business day. Additional information such as fund prices, brochures, application forms and a schedule of fund fees and charges is available on our website, www.coronation.com. Coronation Fund Managers Limited is a Full member of the Association for Savings & Investment South Africa (ASISA). Coronation Asset Management (Pty) Ltd (FSP 548) and Coronation Investment Management International (Pty) Ltd (FSP 45646) are authorised financial services providers.

A P R I L 2 0 1 8 3
GROWTH ASSETS DISAPPOINTED …
Many investors are understandably feeling disappointed by the portfolio outcomes reported in their most recent quarterly investment statements. In the early months of 2018 growth assets (equities and property) did not produce the returns investors want. The local All Share Index declined by 6%, global equities by 5.4% (in rands) and the local property index by an eye-watering 20%. The story was different for income assets. Local bonds did excep-tionally well, returning 8.1%, and cash delivered the expected 1.7%.
It is perfectly reasonable to expect higher returns from growth assets than from income assets. Historically, equities have produced an average annual return of inflation plus 6% to 7%, while bonds have returned inflation plus 3%. The theoretical explanation for this 3% to 4% return gap is that equity investors require a higher expected return to compensate for the relatively higher risk of equity investing. Herein lies the paradox: while it is
Notes from my inbox“You can’t always get what you want, but if you try sometimes you
just might find you get what you need.” – The Rolling Stones
By Pieter Koekemoer
Pieter is head of the personal investments business. His key responsibility is to ensure exceptional client service through a combination of appropriate product, relevant market information and good client outcomes.
A P R I L 2 0 1 8 3

4 C O R O S P O N D E N T
highly probable that growth assets will beat income assets in the long run, this quarter again reminds us that short-term outcomes are, quite frankly, all over the place.
The current investment environment is made more testing by an unusually long period of below-trend returns from growth assets, and above-trend returns for bonds. Bonds have outperformed local property over the past five years, local equities over the past four years and global equities over the past three years. This is the sort of environment in which one could easily start to question whether the equity risk premium still exists.
… BUT RETURNS WILL EVENTUALLY MEAN-REVERT
We firmly believe that to lose faith in growth assets would be the wrong lesson for investors. Periods of weaker return typically coincide with an improvement in the fundamentals that underpin future returns. It is no different this time. Lower share prices coupled with underlying earnings growth result in more attrac-tive valuation levels, which are supportive of better future returns. Weak historical returns make better expected returns more likely, not less. Investors are more likely to get what they need if they are able to stay the course.
KEY MARKET EVENTS DURING THE QUARTER
The erratic behaviour of US president Donald Trump remains a key driver of sentiment. Towards the end of 2017, the market cel-ebrated his administration’s corporate tax cuts by bidding up US equities. In 2018, the focus shifted to fears about real wars (in the Middle East or North Korea) and trade wars (mostly with China).
Despite growing concerns, the global economy continues to expand at a brisk pace. While this may sound like a good thing, the positive outlook has led to fears about inflation and higher interest rates, particularly in the US (an economy close to full employment). This in turn led to the return of volatility, with the US market in technical correction territory during February. It also reminded investors that the so-called ‘quality shares’ are not bond proxies after all, with the richly valued consumer staples sector leading the global equity market down with a 5.7% dollar decline. Despite intense scrutiny of Facebook’s unsat-isfactory management of user data which led to a congressional hearing, information technology was the best performing global equity sector, recording a 3.5% dollar gain. Read more about the state of international markets in Tony Gibson’s market review on page 28.
‘Ramaphoria’ continued to define local market outcomes. Decisive action, including changes at Eskom, a mostly constructive cabinet reshuffle and a suitably austere Budget enabled Moody’s to affirm South Africa’s investment grade rating and secure our continued inclusion in the bellwether bond index, the Citigroup World Government Bond Index. This was the driving factor behind the strong performance of the bond market and continued rand strength. It also supported performance from South Africa Inc.
stocks such as the banks (up 4.2%) and cyclical retailers (up 9.4%). We reduced exposure to these sectors. While prospects have improved, these shares are priced for very good outcomes which are not necessarily consistent with an environment in which both disposable consumer income and government finances remain under pressure.
The complex issue of land reform also featured prominently on parliament’s passing of a motion to investigate changes to the property clause in the Constitution. While too early to make defin-
itive statements, economist Marie Antelme highlights on page 6 that a well-managed process will be critical for success.
A number of local blue-chip shares declined during the quarter. Naspers fell by 16% despite good results announced by Tencent and encouraging signs from some of its other investments. MTN declined by 9% despite a much-
improved operating performance, primarily on concerns about its exposure to Iran. British American Tobacco (BAT) also slipped by 16%, partly due to its status as a consumer staple and partly due to concerns about the possible impact of potential regulatory inter-ventions in the US. We continue to hold these shares in our funds as we believe all three to be attractively valued. Read Siphamandla Shozi’s article for a detailed review of the BAT investment case.
GOVERNANCE AND SCANDALS
In the wake of the Steinhoff collapse in December, the market remains intensely focused on companies vulnerable to poor gov-ernance and/or aggressive accounting risks. The listed property
MARKET MOVEMENTS
1st quarter 2018 2017
All Share Index R (5.97%) 20.95%
All Share Index $ (1.57%) 33.78%
All Bond R 8.06% 10.22%
All Bond $ 13.11% 21.90%
Cash R 1.69% 7.53%
Resources Index R (3.83%) 17.90%
Financial Index R (3.56%) 20.61%
Industrial Index R (7.99%) 22.50%
MSCI World $ (1.28%) 22.40%
MSCI ACWI $ (0.96%) 23.97%
MSCI EM $ 1.42% 37.28%
S&P 500 (0.76%) 21.83%
Nasdaq $ 3.15% 32.99%
MSCI Pacifi c $ (0.57%) 24.96%
Dow Jones EURO Stoxx 50 $ (1.47%) 24.27%
Sources: Bloomberg, IRESS
We firmly believe that to lose faith in growth assets would
be the wrong lesson for investors.

5 A P R I L 2 0 1 8
index came under severe pressure on concerns around valuation levels and accusations of share price manipulation within the Resilient Group. These shares (Resilient, Fortress B, NEPI Rockcastle and Greenbay Properties) declined by between 40% and 70% as a result. At the end of 2017, these companies made up approxi-mately 45% of the index, explaining why property performed so poorly over the quarter. Regulatory investigations into the allega-tions are ongoing. Capitec Bank was the subject of a short-seller report suggesting that it was technically insolvent, resulting in a 27% fall in late January. After strong support by the South African Reserve Bank and a swift rebuttal from the company, the share price recovered somewhat. Our multi-asset and general equity funds had no exposure to the affected counters at the time of the share price declines.
The audit profession, whose primary responsibility is making sure that all stakeholders have access to reliable financial information,
also remains under scrutiny. The debate has moved on from whether reforms are necessary to how the regulatory framework will change. Portfolio manager (and a chartered accountant) Neville Chester shares our views on the matter on page 9.
If you require additional information on a specific Coronation fund, please refer to the fact sheets available on www.coronation.com. You are also welcome to email us at [email protected] if you have any specific questions, concerns or issues that you would like to discuss. +

C O R O S P O N D E N T 6
ALL ASPECTS OF land reform are complex and emotive. Throughout history and across geographies, people’s ties to land are closely linked to their own cultural identity and economic position, and are often fraught with periods of upheaval. In South Africa this is profoundly complicated by our colonial and apart-heid history, legacies that have always loomed large in govern-ment’s approach to land reform. In the early 1990s, even the deeply divided negotiating parties recognised the importance of addressing land ownership as a critical condition of economic and social stability.
Land reform as a policy priority has had some successes, but also abject failures. This partly explains the calls for expropriation without compensation, but it is not the only reason. Years of poor service delivery, falling per capita GDP and widening inequality have all contributed to extreme social frustration, but the failure to distribute land more equitably is an obvious focal point. There is a political explanation, which also needs to be recognised.
The recent focus on expropriation without compensation, while critically important, detracts from the wider issue – the severely
Land reform under new leadership – both risk and opportunity
By Marie Antelme
P O L I T I C S
Marie is an economist with 17 years’ experience in financial markets. She joined Coronation in 2014 after working for UBS AG, First South Securities and Credit Suisse First Boston.
Matters of land

7 A P R I L 2 0 1 8
unequal distribution of ownership patterns in South Africa is undesirable and unsustainable, and has to change. However, any disorderly or confusing policy directives perceived to contest private property rights could quickly undermine both stability and growth. The enormous challenge for government now is to imple-ment a programme of equitable land reform while containing the manner in which this is achieved.
In this short note, we cannot hope to address all the relevant and complicated issues that form part of the umbrella term ‘land reform’. What we do hope to achieve is a better under-standing of the context by which the ANC came to adopt land reform as a resolution after the elective conference at Nasrec in December last year. We look at the history of the ANC’s land reform programme and offer some views on the path ahead for the new resolution.
LAND REFORM HAS ALWAYS BEEN AN ANC POLICY PRIORITY
In the early 1990s, after a number of failed negotiations, the 26 parties of the Multi-Party Negotiating Process agreed the pri-orities that would ultimately be the framework for the national constitution. The highly unequal distribution of land ownership was widely recognised as a key legacy of the past, and one which directly contributed to broader issues of wealth and power con-centration, and entrenched rural poverty. Despite this, negotia-tions were protracted and heated, resulting in intentionally vague wording in the final draft, which was left open to judicial and other interpretation.
The institutional framework for land reform was entrenched in the Bill of Rights in the Constitution in the ‘Property Clause’ (Section 25). This includes three rights to land – equitable access, tenure security and restitution. It provides for the protection of property rights as well as the expropriation of land for both ‘public services’ and in the ‘public interest’ for ‘just and equi-table’ compensation.
Land reform falls firmly in the ‘public interest’ provision and ‘just and equitable’ compensation takes into consideration the full history and use of the land in question, possibly allowing com-pensation from zero up to market price. The 1913 Land Act was intentionally included as the starting date against which both the right to restitution and the right to secure tenure were to be measured.
Land reform was identified as a key programme to be adopted by the incoming democratic government, with multiple objectives of delivering restitution for dispossession, driving rural develop-ment, creating jobs, raising income, and alleviating poverty and inequality. The potentially positive wider impacts of land reform were thus strongly emphasised from the outset. The ANC govern-ment embarked on an ambitious land reform programme early in 1994. It had three component programmes which were intended to be complementary:
1. The land redistribution programme to broaden the black majority’s access to land. The target was 30% of land in the first five years.
2. The land restitution programme to restore land to or compen-sate people dispossessed of land as a result of racial discrimi-nation after the 1913 Land Act.
3. The tenure reform programme to secure the rights of people living under insecure arrangements on land that they did not own, including land owned by the state (including former homelands) and by private individuals, including farm land.
To deliver redistribution, the Constitution provides for the state to ‘take reasonable measures’ ‘within available resources’. This is an important condition to remember, as it informs the new policy debate.
LAND REFORM UNDER THE ANC: SUCCESS AND FAILURE
Early progress with land reform was slow. From 1994 to 1999, various laws were passed to build a consensus on land reform, and restitution claims were submitted to a deadline of December 1998. The focus was primarily on helping the poor. A total of 63 455 land claims were lodged, about 88% of which were by individuals or groups in urban areas. An audit showed that some of the claims were ‘bundled’; the number of claims was therefore revised up to 79 696 in 2007. By March 1999, only 650 000 hectares (less than 1% of private farmland) had been transferred under various pilot schemes aimed at funding groups of people to enable commercial operation of transferred farms. Some progress was made with early legislation to ensure security of tenure (mostly halting illegal evictions), but this then stalled and has never recovered.
During Mbeki’s presidency from 1999 to 2009, the pace acceler-ated. The focus shifted from meeting the land needs of the poor to the transformation of commercial farming. The land redistribution target of 30% was moved to 2014. By the end of 2009, government reported that 3.04 million hectares had been transferred to 185 858 beneficiaries. The restitution programme had settled 75 787 claims by that time, most of them urban, and most of these saw claimants compensated for property. Some 1.5 million people benefited.
However, problems dogged all the programmes. Official pro-cesses were incredibly slow and there was poor coordination between departments, with Agriculture and Land Affairs often passing regulations in conflict with each other. Some of the pro-visions in the regulations made both transfer and management of farms problematic. Grants had to be pooled to buy large tracts of land, but subdivision was not allowed. Technical support for emerging farmers was woefully inadequate and many thriving commercial farms failed. Corruption and collusion by both private and public entities were rife.
By 2009, land reform was perceived to be in deep trouble and public opinion plummeted. With the global financial crisis and domestic recession, the state had also started to run out of finan-cial resources to fund it. A number of diagnostic investigations suggested that government had not used ‘reasonable measures’ or ‘available resources’ to their full extent or aggressively enough in delivering bigger transfers or finalising restitution claims.
The period from 2009 to date was characterised by a consider-able slowing in delivery as well as a substantial increase in rhetoric

8 C O R O S P O N D E N T
and associated legislation about the importance of land reform, not least with the emergence of the Economic Freedom Fighters (EFF) in the 2014 elections. The raft of new regulations passed during this time complicated the land reform programme enor-mously. Importantly, a new Expropriation Bill was introduced in 2015 and approved in 2016. It aims to bring legislation governing expropriation, currently dating back to 1975, and applicable only to ‘public use’, in line with the Constitution. It also gives clarity to the ‘just and equitable’ provision in the Constitution, which may be an elegant way of circumventing any debate about needing to change the Constitution. The Bill has not yet been enacted.
Within this context, the ANC formally adopted land reform without compensation as a resolution at its elective conference in December 2017. It is very clear that 24 years after the initial programme started, the slow pace of progress on all three pro-grammes has been an increasing source of frustration for many people who are still landless, impoverished and extremely vul-nerable. The situation is exacerbated by mounting discontent with very weak general service delivery, the very low level of economic growth prevailing over the past 10 years, falling real per capita GDP seen over the last five years and associated rising inequality.
Prioritising this more populist approach to a long-held policy also has a political aspect. First, the ANC has captured the radical rhetoric of EFF leader Julius Malema, providing the opportunity to both deliver on this priority and manage the way in which the programme is implemented. Secondly, expropriation was cham-pioned within the ANC by the losing presidential candidate, Nkosazana Dlamini-Zuma. By formally adopting this resolution, her backers have leverage over the president in terms of deliv-ering on this policy. What we do know, however, is that this issue is combustible, and if it is not contained in a rigid policy framework, it could have severely damaging socioeconomic consequences.
WHAT IS THE LIKELY PATH FROM HERE?
Time is of the essence. Government needs to put a framework in place that can deliver effectively and transparently both land and/or title to landless people on some scale, before the process becomes disorderly. It also urgently needs to manage the para- meters of how a new programme is communicated.
There is little concrete by which to assess the new approach to land reform, but there are a few things we do know. The first issue to clarify relates to a resolution passed by parliament – in February, the National Assembly passed a motion to review the Constitutional provision for the expropriation of property (land) without compensation. This was not the original, more extreme, motion brought by the EFF, which called for an amendment of the Constitution, but rather a commitment to review the provi-sion. This was approved by 241 votes to 83. The Constitutional Review Committee has until 30 August to report its findings and make a recommendation to parliament.
There is considerable legal debate about whether or not ‘just and equitable’ compensation could already be interpreted to include zero compensation, but it is necessary for this to be decided once and for all. Even a recommendation to change the
Constitution may not guarantee it passes, because an amend-ment needs a two-thirds majority in the National Assembly, which means the ANC will need the EFF’s backing. At this stage it is clear that the two parties have very different views of how a policy of expropriation of property should look.
Next, it is clear that any new policy will also not just be about agricultural land; it will be about all land, public and private. The state, and state-owned entities, hold vast tracts of land that can be utilised. Throughout the land redistribution programme, the state has been accumulating farms (estimates suggest 4 500 to 5 000 farms are owned by government) in addition to urban and peri-urban land. President Ramaphosa has called for an audit to accurately identify government land which could be used to establish a precedent. In addition, inner-city absentee landlord properties and private land on which there are estab-lished informal settlements could be opportunities to invest, improve the quality of infrastructure and establish ownership.
Government needs to strengthen the legal framework within which a new programme will operate. There are few judicial precedents of challenges to compensation policies for land transfer. Thus amending and expediting the Expropriation Bill (2017) may provide clarity and help establish some jurisprudence.
Lastly, the process needs buy-in. Both president Ramaphosa and ANC veteran Jeremy Cronin have committed to extensive con-sultation. It is clear that many people are angry, or frightened by the proposals, but also that the current situation is unsustain-able. Clearly stating the conditions under which expropriation without compensation may be used, possibly on a case-by-case basis, could help rationalise the debate. Focusing attention on assisting the very poor and vulnerable linked to other efforts to reduce poverty might strengthen social commitment.
CONCLUSION
The critical and sensitive nature of land reform in South Africa demands strong leadership, clear principles to follow and effi-cient, consistent implementation with visible lines of account-ability. Should South Africa fail in this undertaking, it would leave us vulnerable to the kinds of populism that can lead to chaos.
Land restoration in practice is unlikely to be possible in all cases and it will take competent leadership, which has been sorely lacking, to communicate that appropriately to communities. It is important that a moral purpose is instilled in the process, as the implementation requires sensitivity and respect between South Africans of different backgrounds. In many circumstances, financial settlements are the only way to compensate people. This compensation can only come from the government, given that land ownership may have changed hands numerous times over the years.
For a lasting solution, we need to recognise the different spiri-tual and cultural needs of South Africans to reach mutual under-standing. While the concept of land ownership is complex, speaking not only to material needs but also to the spiritual significance of specific land, at its heart is restoring dignity and cultural rights to our people. +

A P R I L 2 0 1 8 9
OPEN THE NEWSPAPERS virtually any day of the week, or google ‘auditor scandal’, and you will be inundated with articles describing the failure of auditors, locally and globally, to achieve the objective of their function. The way markets have reacted to the failure of audit firms to meet their clients’ expectations is in stark contrast to almost any other industry. Globally, companies which sell products or services that fail to live up to expectations are punished and often end up going out of business. Despite the constant failings of the audit profession at providing the users of financial statements with what was asked for, it survives and thrives. However, the backlash is building, as much globally as we have seen locally, against these trusted guardians whose important role in verifying information, systems and controls is the foundation of the corporate system.
Who guards the guards?The relevance of auditors in a post-financial scandal world
By Neville Chester
Neville is a senior member of the investment team with 20 years’ investment experience. He joined Coronation in 2000 and manages Coronation’s Aggressive Equity strategy.
* Satires of Juvenal, 1st century AD
R E G U L A T O R Y
Quis custodiet ipsos custodes?*
10 C O R O S P O N D E N T
In 2001, the world was exposed to the last major failing of an audit firm where any measure of accountability was taken. Arthur Andersen, one of the then ‘Big Five’ audit firms was found to have failed to identify vast, fraudulently overstated revenue at the energy trading business Enron. The much-publicised shredding of working papers by Arthur Andersen staff in an attempt to frustrate investigations amplified the fallout. Since then, the remaining Big Four have held a virtual monopoly over the audits of major cor-porations around the world, and despite many audit failures, the same situation with the same Big Four prevails, with little evidence that audit outcomes have improved.
In South Africa, there was justifiably outrage over the discovery that KPMG had presented a report to the South African Revenue Service, which it subsequently withdrew as being inappropriate. It was also found that the audit firm had an inappropriate rela-tionship with the Gupta family before firing them as a client in 2016. Subsequently, the reaction against the auditors of compa-nies where there has been fraudulent representation over many years has been more muted, bizarrely so given the billions that have been lost as a result.
Deloitte is currently giving evidence in defence of its African Bank Investments Limited (ABIL) audit, and is likely to be investigated for its role in Steinhoff. Before the ink was dry on the draft copy of this article, two further audit scandals came to light. First, PwC provided internal audit services and KPMG provided an external audit to VBS Mutual Bank where it now appears there was significant fraudulent activity, resulting in its 2017 accounts being withdrawn. Secondly, the amaBhungane Centre for Investigative Journalism discovered that the audit firm Nkonki had been bought out by parties related to the Guptas. Soon after, the firm and its chosen partner in this case, PwC, received significant consulting work from Eskom on very favourable payment terms.
The only possible reason that the rush by companies to fire KPMG as their auditors has not been matched by similar moves against other audit firms is the stark realisation that there is not much choice. Listed companies and their investors have always pre-ferred their audits to be conducted by one of the prestigious firms, believing that these firms had the capacity to undertake complex audits, were more likely to be independent given their much larger fee base and brand reputation, and attracted better quality employees due to their stature. While these factors do hold true, sadly this does not seem to be any guarantee of an appropriate audit being conducted. Simply firing one of the Big Four auditors and appointing a small audit firm does not make the problem go
away. If this audit then becomes the firm’s largest revenue client, it still challenges the argument of independence, as over-reliance on any one client is likely to cloud such a firm’s judgement.
Despite the shadow hanging over the Big Four, their dominance continues to grow. Grant Thornton, the fifth-largest firm in the UK, recently announced that it is pulling out of bidding for large UK audits given the dominance of the Big Four and the firm’s lack of client wins. Facing the prospect of bidding costs of approximately R5 million and perpetually being excluded in favour of the Big Four, they have made the rational economic decision to stop par-ticipating, leaving investors the poorer for choice.
While the problems are multiplying, the solutions are not obvious. We face the centuries-old challenge, alluded to in the title, of who will hold these guardians accountable for their own failures. Thus far, it has not been the independent regulatory bodies. South Africa’s regulator of the auditing industry, the Independent Regulatory Board for Auditors (IRBA), is only now getting around to investigating the ABIL audit, and is woefully understaffed to deal with the number of challenges it currently faces.
In order to be an audit partner, you need to be a registered accoun-tant. The South African Institute of Chartered Accountants (SAICA) has yet to publicly rescind the use of its designation by members implicated in the recent KPMG, ABIL or Steinhoff scandals. Groucho Marx famously said, “I would never belong to a club that would have me as a member”. As a member of SAICA, and given the company that I share, I question why I would want to remain a member. This does not appear to be a solely South African problem. In the UK, it took the Financial Reporting Council, that country’s accounting oversight body, 10 years to review KPMG’s audit of HBOS bank, which failed during the financial crisis. KPMG was found not guilty.
Reinforcing the global angle on audit failure, the Financial Times highlighted a recent report from the International Forum of Independent Audit Regulators indicating that global accounting watchdogs had identified problems at 40% of the audits they inspected in 2017. The most common issue identified by these reg-ulators was a failure among auditors to “assess the reasonableness of assumptions”. The second biggest problem was a failure among auditors to “sufficiently test the accuracy and completeness of data or reports produced by management”.
There is clearly a problem. The issue is how do the users of finan-cial statements resolve it? It will be especially challenging for individual entities to drive the change necessary, given that it is a global problem and outside of regulatory intervention.
The first step we are taking as an organisation is enforcing the mandatory rotation of auditors in the companies in which we invest. While there is already pushback from the companies on this course of action, we think it is the only way to impose some measure of accountability on audit firms. Having a new firm come in and assess the state of reporting and controls with a fresh eye should encourage the incumbent auditor to ensure that its review is up to standard. By allowing a maximum tenure of 10 years, this avoids the additional costs and administrative burden of changing firms too often. The common view that the cost of changing audit firms is too
External auditor/statutory auditor: An independent firm engaged by the client subject to the audit to express an opinion on whether the company’s financial statements are free of material misstatements, whether due to fraud or error. For publicly traded companies, external auditors may also be required to express an opinion over the effectiveness of internal controls over financial reporting.

11 A P R I L 2 0 1 8
We face the centuries-old challenge, alluded to in the title, of who will hold these guardians
accountable for their own failures.
burdensome on the companies involved is spurious, considering the cost to investors of fraudulent activity.
The other benefit of mandatory audit firm rotation is that it should change behaviour in asserting the link between the users of financial statements and those that prepare them. For too long auditors have behaved as if the company is the client, whereas in fact the client is all stakeholders who use the financial state-ments. The auditors need to be cognisant that they are appointed by shareholders, not the executive of the company, and should be beholden to provide them with a quality service.
A problem that is evident from pursuing mandatory audit firm rotation is the limited choice available, with the Big Four dom-inating the sector. The challenge of growing more competition will require more work and thought by shareholders and regula-tors. There is an element of a circular argument which needs to be solved. Smaller audit firms do not have sufficient skilled resources to complete the audits of large listed companies. However, they are not prepared to hire more resources if they do not have the client base, and there is no guarantee that they will get the clients once they have hired more staff. In addition, it is best for multinational companies to be audited by a single audit firm rather than by a number of smaller firms working within a global network, to reduce the risk of ‘passing the blame’ between audit firms. In order to break this circle, we need to see stakeholders undertake in advance to move audits to a Big Five or Big Six firm, or a regulatory body like the stock exchange or the IRBA to force the random selection of a firm from pre-approved auditors.
While some of these options may seem onerous and unfair, we should remember that the entire auditing profession exists because of a regulatory requirement that a company has audited financial statements. Their ability to generate returns is due to a regulatory mandate. To tweak this regulation to ensure better outcomes for stakeholders is not an unfair request.
The second issue that needs to be dealt with is the regulation of the industry and its participants. Without a doubt, the oversight of the auditing profession needs to be improved. While a statutory oversight body (the IRBA) exists, the fact that the failings have been so many and so widespread implies it is not succeeding. Improved resourcing is undoubtedly required and a more proactive, rather than reactive, stance needs to be taken. We must also consider those who prepare the financial statements and what level of oversight is required. There is strangely absolutely no regulation over who can prepare the financial statements of a listed company. The only requirement is that “the audit committee must, notwithstanding its duties pursuant to Section 94 of the Companies Act consider, on an annual basis, and satisfy itself of the appropriateness of the exper-tise and experience of the financial director”.
Another issue to consider is the structure of the audit firm. The auditing profession has always avoided the corporate struc-ture and has been structured as a partnership. Having personal
liability was supposed to make the partner more accountable. But it does not seem to have worked. While a global brand is used worldwide, accountability and responsibility rest only in the localised regions, preventing aggrieved investors from accessing the global audit firm’s resources. Properly ensuring consistent standards for global auditing firms should be seriously consid-ered so that the entire group can be held accountable for failures. This would drive greater monitoring and compliance within the organisation, as opposed to today’s system where there is very little incentive for the global organisation to monitor its regional operations closely.
In addition, the corporate governance of auditing firms should be addressed. They do not have an independent board overseeing how their operations are run. After the recent lapses at KPMG, the firm has introduced the role of an independent chairperson and a lead independent director. This should become standard for all firms auditing listed companies and state-owned entities.
The regular response from the audit firms to challenges to the status quo has been to complain about how much this will cost
them. The reality is we have very little insight into the finances and profit-ability of these monitors of corporate reputability. It is ironic that those tasked with ensuring transparency in financial reporting are themselves inscrutable organisations where prof-itability and executive pay are often not in the public domain. Requiring audit firms to report their accounts will help the users of their services to
determine the profitability of this industry and of the ancillary services and consulting work that they undertake.
There is a large lobby that believes part of the solution is to break up the firms into separate auditing and consulting operations. I am not in favour of this option, as I think the provision of consulting services makes the businesses more sustainable and helps to attract the right talent. However, what should be in place are strict rules around limiting the ability of current auditors to consult to and audit the same group, and appropriate cooling-off periods between pro-viding these different services. The practice of loss-leading on the audit to gain a foothold into the organisation to sell more lucra-tive additional services should also be examined, as it potentially prevents non-consulting audit firms from being competitive.
The fact that so many organisations, tasked with the important societal role of confirming the accuracy of company accounts, are either complicit in fraud or unable to identify inappropriate controls and accounting policies is truly breathtaking. Over the past 10 years, as white-collar crime has soared alongside state capture and theft of public assets, it appears that the entire coun-try’s moral compass has shifted. What is required is a complete reset of values and a strong sense of accountability among members of the profession. The very definition of profession is ‘any type of work that needs special training or a particular skill, often one that is respected because it involves a high level of education’. It is time that the auditing profession starts to show us how it will once again earn our respect. +

C O R O S P O N D E N T 12
BRITISH AMERICAN TOBACCO (BAT) is one of the world’s leading tobacco and next-generation product (NGP) groups managing an extensive portfolio of brands. It has delivered earnings growth of over 10% per annum in constant currency over the last decade, a feat that ranks with the best in global staples. Shareholders have been rewarded with a dollar return of 9% per annum over this 10-year period, strongly outperforming the MSCI World Index return of 6.5% per annum over the same period. This excellent track record has been achieved despite severe tightening of smoking regulations around the world. Not many businesses can operate, let alone thrive, in the midst of unfavourable regulations that include bans on public smoking and advertising, and plain packaging (effectively a ban on branding). BAT’s performance is testament to the robustness of its business model.
PRICING POWER
There are not many businesses with true pricing power. BAT has the ability to pass through pricing ahead of inflation significantly more than the average company due to the addictiveness of its product. Pricing is a key lever needed to offset declining volumes caused by fewer smokers. Regular increases in excise/sin taxes also contribute to frequent price increases being passed on to consumers. Over the past decade, BAT has been able to generate, on average, 6% per annum in pricing, resulting in low to mid-single digit revenue growth.
S T O C K A N A L Y S I S
Thriving in a highly regulated industry
By Siphamandla Shozi
Siphamandla is a portfolio manager within the South Africa-focused investment team. He co-manages the Coronation Smaller Companies Fund and has research responsibilities across a range of South African stocks.
British American Tobacco

13 A P R I L 2 0 1 8
MARKET SHARE GAINS, COST SAVINGS AND MARGINS
BAT has consistently gained market share over the last seven years, driven by its strategy of pushing through global drive brands (GDBs) to replace a plethora of local brands with less market appeal. GDBs include familiar brands like Kent, Dunhill and Rothmans. GDBs have grown at 7% to 8% per annum and constitute over 50% of total volumes. The process of consolidating the brand portfolio around GDBs comes with massive synergies in areas such as advertising, supply chain and complexity reduction in manufacturing. The imple-mentation of enterprise resource planning system SAP has resulted in additional cost savings, leading to annual margin expansions and consequent mid-high single digit operating profit growth.
EXCELLENT CASH GENERATION AND CAPITAL ALLOCATION
BAT has low capital intensity which, when coupled with high margins, results in good free cash flow conversion. This free cash has been used to reward shareholders with high payout ratios coupled with periodical share buybacks. Significant acquisitions have been largely of businesses in which BAT already had a stake, which reduces the associated risk considerably.
REYNOLDS OPPORTUNITY
BAT acquired 58% of the stake it did not already own in Reynolds American Incorporated (RAI) last year. RAI is the second-largest tobacco company in the US with a 35% share of the market, behind market leader Altria, which owns the popular Marlboro brand. This deal makes BAT the largest tobacco company in the world. We believe this is a company-transforming transaction for BAT, providing it with access to the third-biggest, most profitable and one of the most affordable tobacco markets in the world. RAI has much room to increase prices without making cigarettes in the US too expensive. There are also significant cost and revenue syn-ergies from combining the two businesses, and it gives the kind of scale required to invest in NGPs.
NGP OPPORTUNITY HAS POTENTIAL TO STEP CHANGE EARNINGS BASE
BAT has made significant investments into NGPs, a term used to describe various smoking devices that seek to deliver nicotine and other flavours in ways that are safer than combustible cigarettes. These can be grouped as heat-not-burn and e-vapour products; the key difference is that the former heats up actual tobacco while the latter heats up liquid/salts. The NGP category is growing rapidly across the world (forecast to be a £30 billion market by 2020). The US has the largest e-vapour market and Japan the largest heat-not-burn market. Due to a combination of premium positioning and favourable tax treatment, these products are two to three times more profitable than normal cigarettes. BAT is currently rolling them out aggressively across 14 countries. We believe these products could add at least 15% to BAT’s earnings base over the next five years.
FOOD AND DRUG ADMINISTRATION (FDA) CONCERNS
BAT’s share price has come under a lot of pressure in recent months, more so than its competitors. Besides rising global bond yields which have put pressure on most global staples, BAT is facing an
uncertain regulatory environment in the US, its largest market. However, given improvements in NGP technology, there is now an alternative to smoking for those who still want nicotine.
The US FDA is starting a comprehensive process that seeks to develop a product standard for combustible cigarettes. Its aim is to reduce nicotine levels in combustible cigarettes to a minimally addictive/non-addictive level. This has the market worried. However, our research suggests that the science supporting any level of nicotine as non-addictive is still very weak at best. In addition, economic effects such as the impact on various state tax revenues and the possible growth of illicit markets will still need to be determined over the next few years. Compared to other markets, US tobacco nicotine content levels are an outlier and could be reduced considerably without affecting the market significantly if effected in a phased approach.
The FDA is also considering regulating flavours in smoking products, including menthol in cigarettes. The intention is to inves-tigate whether certain flavours make it more likely for youth to start the habit of smoking. Menthol cigarettes make up a quarter of BAT’s revenue; any ban would therefore be extremely negative. However, the tobacco industry has been down this road before in the US, where a ban on menthol was considered through a process that began in 2011. The attempt was unsuccessful, and there have been no significant scientific developments since then that lead us to believe that a different outcome is likely.
CONCLUSION
BAT has delivered considerable value for its shareholders over a long period, despite operating in a closely regulated industry. The tobacco industry has very attractive fundamentals, including pricing power, margin expansion opportunity, strong free cash flow conversion and high returns on investment. With its attrac-tive profitability and positioning, the NGP opportunity has the potential to step change BAT’s earnings base. The current uncer-tainty over potential changes in the US regulatory environment, led by the FDA, has been priced into the current BAT share price. We believe exceptional global staples (for example, Unilever and Nestlé) should be valued at 20 to 22 times multiple to normal earnings. Given the regulatory risks that the tobacco industry face, we discount this multiple by 15%, which is why we value BAT at 18 times multiple to its normal earnings. BAT currently trades at 10.4 times multiple to our assessment of normal earnings, which in our view significantly undervalues the business. +
As long-term investors, environmental, social and governance (ESG) considerations are fully integrated into our investment process and form part of the mosaic for any investment case, in understanding the long-term sustainability of companies and their business worth. When valuing a business, we take ESG factors into account predominantly by adjusting the discount rate applied to the assessment of its normalised earnings. We therefore implicitly build the risks relating to ESG considerations into the ratings of the businesses we analyse. Where we can, we explicitly allow for ESG costs in the modelling of a company’s earnings. Social objectives vary significantly between investors, and ESG issues are often intrinsically fraught with ambiguity. We do not exclude investments in companies that perform poorly on ESG screens, but we do require greater risk-adjusted upside before investing. In practice, a business with an ambiguous ESG profile will be required to deliver higher returns to justify its inclusion in the portfolio.

C O R O S P O N D E N T 14
THE ADIDAS THREE stripes logo is a familiar sight to sports and fashion lovers the world over. While the brand can be traced all the way back to a German shoe factory owned by the Dassler brothers in the 1920s, Adidas was officially created in 1949 by Adolf (Adi) Dassler. (After a falling out, his brother Rudolf formed Puma.) The company has a long, successful history and is now the largest sportswear manufacturer in Europe and the second-largest globally. Popular products include the Boost running shoe and the Copa Mundial football boot, which is the bestselling football boot of all time. In this article we discuss the global sportswear market and why we believe the investment case for Adidas presents a compelling opportunity for our funds.
GLOBAL SPORTSWEAR
There are a number of reasons why we consider the global sports-wear market to be attractive. It is relatively fragmented, with the largest player, Nike, holding just over 24% market share and Adidas holding around 14%. A fragmented market allows strong brands such as these to gradually increase their share over time, through innovation, superior distribution channels and clever marketing. Customers also tend to be relatively brand loyal, allowing strong brands to enjoy pricing power and healthy gross margins.
Earning its stripes
By Graydon Wilson
S T O C K A N A L Y S I S
Graydon is an analyst within the Global Emerging Markets investment unit. He joined the company in January 2016 and is a qualified chartered accountant.
Adidas

15 A P R I L 2 0 1 8
Sportswear is estimated to be a $350 billion annual industry. The market has grown strongly for many years, having expe-rienced over 7% annual growth since 2009. This is more than double global GDP growth rates over the same period. Despite this impressive performance, there is still a significant runway for growth as emerging market consumers substantially underspend on sportswear relative to their developed market counterparts. Rising emerging market income levels mean growing numbers of middle-class consumers with more discretionary spending and greater participation rates in sports and leisure activities.
China is expected to be a significant growth driver going forward, powered by a growing middle class and a new national fitness plan with ambitious targets for fitness levels and increased sports participation. In 2015, the size of the Chinese middle class reached 109 million adults, surpassing the US for the first time. China also
PER CAPITA SPENDING ON SPORTSWEAR
350
250
300
150
200
100
50
0
Sources: Credit Suisse Emerging Consumer Survey, Euromonitor
US
Swed
en
Finl
and U
K
Ger
ma
ny
Aus
tra
lia
Den
ma
rk
Net
herl
and
s
Fra
nce
Ita
ly
Jap
an
Swit
zerl
and
Sout
h A
fric
a
Rus
sia
Wo
rld
Mex
ico
Turk
ey
Bra
zil
Chi
na
Ind
ia
Ind
one
sia
Emerging marketsDeveloped markets
$ per year
Most upside clearly resides in emerging markets
$ million
REVENUE COMPARISON OVER TIME
30 000
35 000
25 000
20 000
15 000
5 000
10 000
0
Source: Bloomberg
2006 20082007 2009 2010 2011 2012 2013 2014 2015 2016 2017
AdidasNike Anta Sports
has 425 million Millenials who have grown up with social media and put a premium on looking good. A good physique is now associated with virtues such as perseverance and self-discipline. According to the China Business Research Academy, gym membership in China doubled between 2008 and 2016. The number of yoga practitioners has more than doubled over the same period, while running is also gaining popularity. The sportswear market in China has consis-tently grown at double-digit growth rates over the past five years but is still less than a third of the size of the US sportswear market. Nike, Adidas and local Chinese company Anta Sports have strong positions in the country and stand to benefit from a market that we expect will continue to grow at a healthy pace.
Sportswear brands have benefited significantly from ‘athleisure’ trends and the casualisation of work attire over time. Adidas in particular has done very well partnering with global celebrities such as Kanye West and Pharrell Williams, with new limited edition designs that have created much hype for the Adidas brand and positioned its sneakers and clothing as high-quality, aspirational products in the consumer’s mind.
ADIDAS GETS ITS BOOST
Over longer time periods, Nike has outperformed Adidas from a sales growth and margin perspective, to the point where we believe Adidas was underearning relative to its potential. In 2015, a new game plan was announced at Adidas called ‘Creating the New’, which is being driven by a new management team. Current CEO Kasper Rorsted has enviable credentials and from 2008 to 2016 was responsible for the impressive turnaround of another underperforming German business – chemical and consumer goods company Henkel. He did this by focusing the product port-folio and instituting a new entrepreneurial, performance-driven culture at the company. There are early signs of him adding similar value to the Adidas business.
The new game plan is based on three strategic pillars – speed, key cities and open source. First, Adidas is focused on increasing the speed of its supply chain and production processes to be at the cutting edge of new fashion trends and improve the avail-ability of product. Secondly, recognising that this is where new
%
SPORTSWEAR MARKET SHARE IN CHINA
Sources: Euromonitor, Macquarie
39.2 Others
20.8 Nike
20.1 Adidas
10.6 Anta Sports
5.3 Li-Ning
4.0 361 Degrees
16 C O R O S P O N D E N T
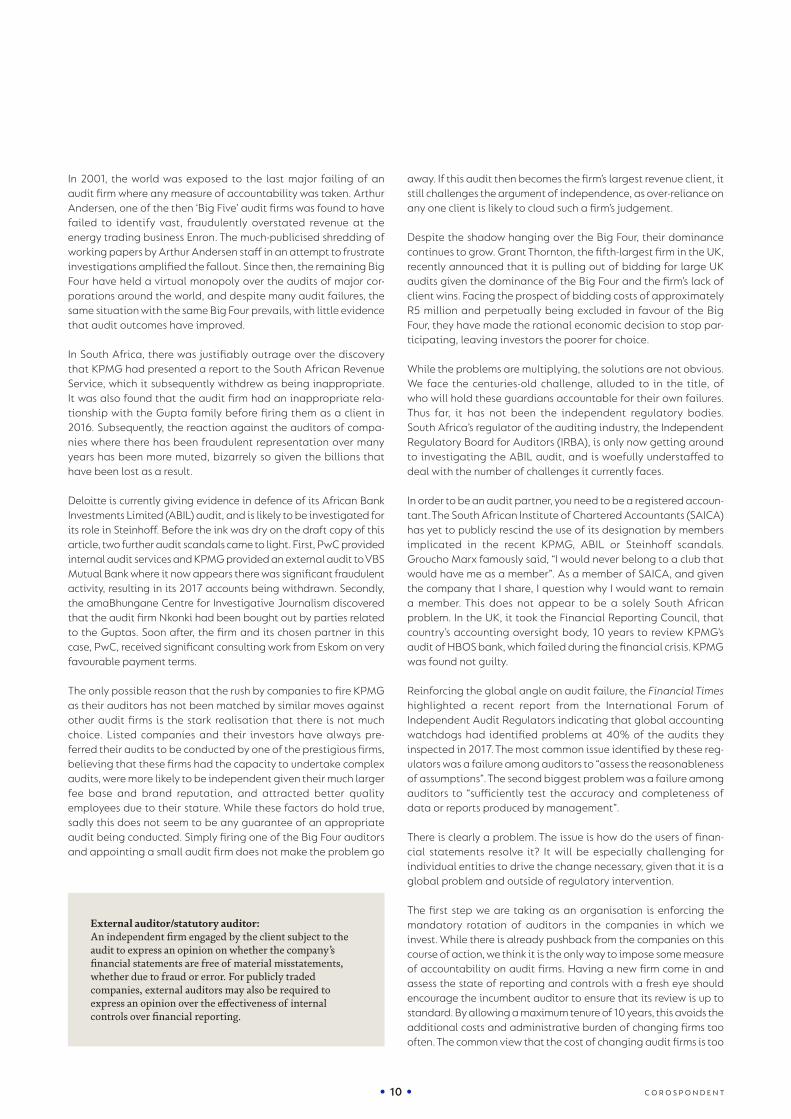
trends develop, the company has directed it sales and marketing activities towards six of the world’s most influential metropol-itan centres – New York, Los Angeles, London, Paris, Shanghai and Tokyo. Thirdly, ‘open source’ describes a new drive of inviting athletes, consumers and partners to collaborate with its brands. This has resulted in successful new products sold under the Adidas YEEZY and Adidas Originals names.
On the back of these initiatives, sales have grown at healthy double digits over the past three years and operating margins have increased from 6% to 10%, which represents a 55% increase in margin. Growth has been broad based, with the company’s three major regions (North America, Europe and China) growing significantly. Despite impressive recent financial performance, we believe there are still improvements to come. In spite of steady advances over the last decade when the company set out to narrow the gap between Nike and itself, operating margins are still significantly below those of its main rival (see the graph below) and management is focused on further expanding margins over the foreseeable future. This will be driven by a number of
factors, including increasing the share of direct-to-consumer sales, which consist of physical Adidas store sales and ecommerce. Sales through these channels result in higher gross margins as they capture the retail markup in addition to the wholesale margin they would otherwise have earned.
As a key strategic focus area for management, ecommerce is expected to grow strongly going forward, and will allow Adidas to gain the above-mentioned retail markup with less of the associated cost that goes with running physical retail infrastruc-ture. Other initiatives to improve margins include driving more full-price sales with the company’s ‘speed’ initiatives, and further cost-saving projects. Adidas also owns the less significant and underperforming Reebok brand, which we believe the manage-ment team will turn around over time.
CONCLUSION
Our investment team has closely followed both Adidas and Nike for a number of years. Due to similarly compelling investment cases, we have owned both companies at varying sizes in our funds over time. We also like the fundamentals of Anta Sports, a homegrown Chinese sportswear company that we have analysed in detail in the past but have chosen not to own due to a high valuation and an insufficient margin of safety. All three stocks have done well over the past five years, beating the broader market comfortably.
Adidas is a world-class premium sports brand, with strong market positions in attractive, growing categories and across geogra-phies. We are encouraged by the fact that the business now has a strong management team with a good track record that is doing the right things to improve the operational performance of the company.
After reducing its debt levels over recent years, the company also has a strong balance sheet and is committed to returning excess capital in the form of dividends and share buybacks. A recent pullback in the share price in late 2017 meant that the stock was trading on 20 times earnings, at a material valuation discount to Nike and with a better earnings growth profile due to its low margins. This provided us with an opportunity to build a mean-ingful position in our funds. +
%
OPERATING MARGINS
14
16
10
12
6
8
4
2
0
Source: Bloomberg
200
0
200
1
200
2
200
3
200
4
200
5
200
6
200
7
200
8
200
9
2010
2011
2012
2013
2014
2015
2016
2017
AdidasNike

A P R I L 2 0 1 8 17
Nothing changes if nothing changes
South Africa’s prospects are looking better, but durable change needs vision and consensus
By Marie Antelme
SINCE NARROWLY WINNING the leadership of the ANC in December 2017, president Cyril Ramaphosa has made mean-ingful changes to his cabinet and some state-owned entities. However, there are still legitimate concerns about his ability to make sufficient robust leadership changes to reverse the ruin that undermined policy and growth under his predecessor. But we are off to a good start.
WHAT HAS CHANGED? PRESIDENT RAMAPHOSA HAS BEEN VERY BUSY
At the end of January, even before he became president, Ramaphosa appointed a new board to embattled electricity utility Eskom in an effort to halt its decline and avoid a ratings downgrade. President Zuma stepped down on 14 February after tense negotiations and parliament elected Ramaphosa the fol-lowing day. On 16 February, newly elected president Ramaphosa
S O U T H A F R I C A N E C O N O M Y
Marie is an economist with 17 years’ experience in financial markets. She joined Coronation in 2014 after working for UBS AG, First South Securities and Credit Suisse First Boston.
18 C O R O S P O N D E N T
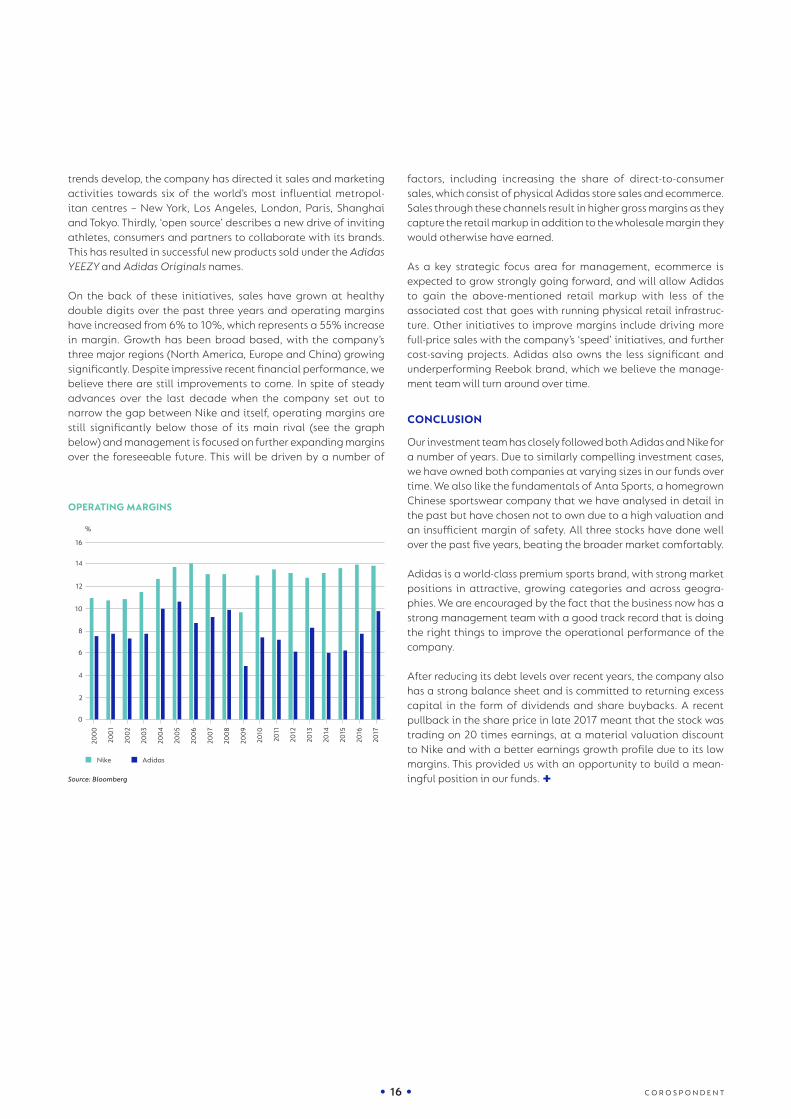
delivered the delayed State of the Nation address, reiterating his election promise to foster growth, create jobs, reduce poverty, provide policy certainty, deal decisively with corruption and restore integrity to state institutions.
On 26 February, the president appointed his cabinet, replacing almost a third of the existing ministers and almost all of those tainted by accusations of graft. Importantly, he appointed expe-rienced ministers to key economic institutions, notably former minister Nene back to Finance and minister Gordhan to Public Enterprises. Minister Mantashe should be a capable set of hands at Mineral Resources.
Behind the scenes, investigations into corruption at Eskom con-tinued, with heated parliamentary hearings, and Justice Zondo appointed his team to undertake the enquiry into state capture. More recently, Ramaphosa suspended South African Revenue Service commissioner Tom Moyane under whose watch revenue collection has faltered and tax morality fallen. He then appointed veteran Mark Kingon as interim commissioner. That is a lot of change in four months!
ECONOMIC CHANGE HAS BEEN LESS DRAMATIC, BUT VISIBLE NONETHELESS
In February, former finance minister Gigaba presented the Budget, which was a considerable improvement on the Medium Term Budget Policy Statement (MTBPS) he tabled in October last year. The Budget detailed R36 billion in revenue adjustments, the biggest contribution coming from an increase in the value-added tax rate from 14% to 15%, effective 1 April. This intervention has always been viewed as politically challenging to deliver and the signalling attached to the change is almost as important as the revenue generated by it.
A further expenditure consolidation of R85 billion over the next three years was also put into the Budget, of which R57 billion has
%
SOUTH AFRICAN CAPEX AND POLITICAL CONSTRAINTS
10
20
30
0
-10
-20
40
20
0
60
80
100
Sources: Bureau for Economic Research (BER), Statistics South Africa
Q4
19
94
Q4
19
97
Q4
20
00
Q4
20
03
Q4
20
06
Q4
20
09
Q4
20
12
Q4
20
17
Q4
20
15
BER political constraint Index (4-quarter 2017 moving average) (RHS)
Private gross fixed capital formation, % y/y, 4-quarter 2017 moving average
been ‘reallocated’ to fund free higher education. Despite these changes, the forecasted main budget deficit for the coming year is -3.8% of GDP, from an estimated -4.6% in 2017/2018. This is better than the profile laid out in the MTBPS, but not back at the intended consolidation detailed in the previous Budget. This implies a slower pace of debt accumulation, with debt rising to 56% of GDP in 2020/2021.
GDP growth surprised to the upside in 2017’s fourth quarter. As a result, growth for the year as a whole was moderately stronger than expected, given the chronic political uncertainty that intensified last year. GDP was 1.3% in real terms in 2017, from just 0.9% in 2016, with an acceleration in the fourth quarter of 2017 to 3.1% quarter on quarter, seasonally adjusted and annualised, and equivalent to about 1.9% year on year (y/y).
The acceleration was reasonably broad based across sectors, and from a demand-side perspective, household spending rose smartly, up 2.7% y/y (3.6% quarter on quarter, seasonally adjusted and annualised). Capital investment recovered off a protracted weak base to grow 0.3% y/y (7.4% quarter on quarter, annualised). With the rise in investment, imports accelerated too, offsetting some of the positive impact on growth. Elevated terms of trade remain an ongoing support for exports.
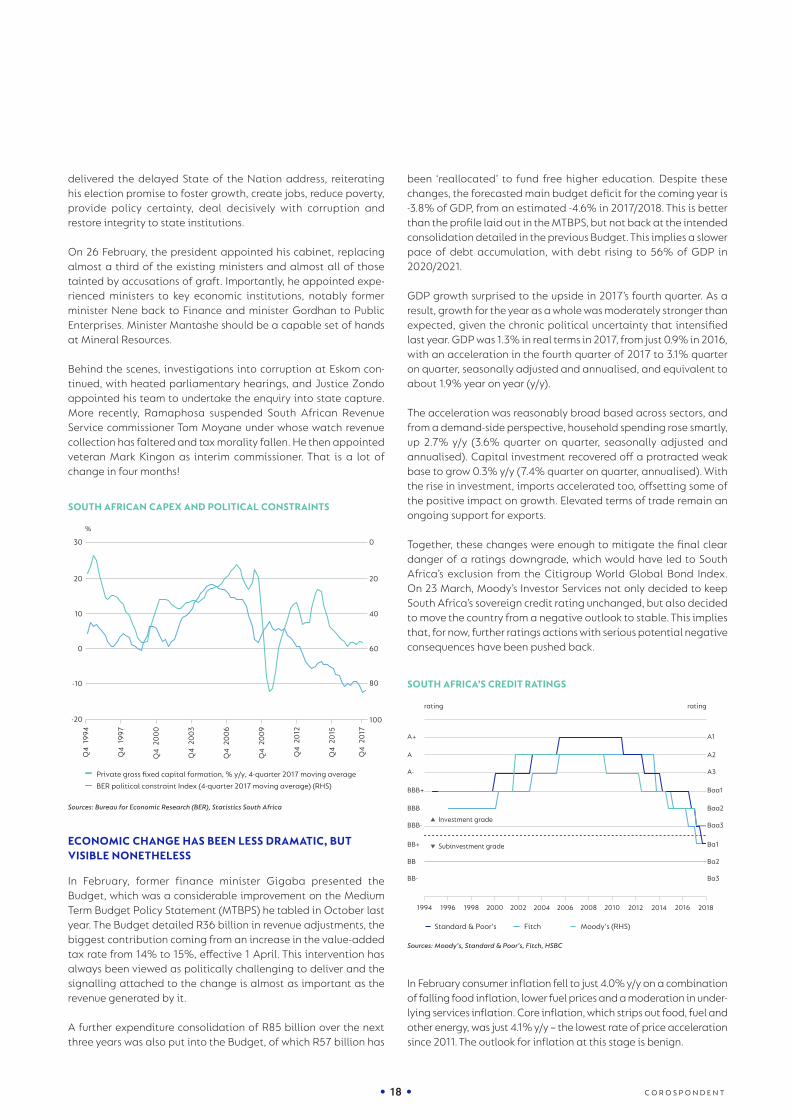
Together, these changes were enough to mitigate the final clear danger of a ratings downgrade, which would have led to South Africa’s exclusion from the Citigroup World Global Bond Index. On 23 March, Moody’s Investor Services not only decided to keep South Africa’s sovereign credit rating unchanged, but also decided to move the country from a negative outlook to stable. This implies that, for now, further ratings actions with serious potential negative consequences have been pushed back.
In February consumer inflation fell to just 4.0% y/y on a combination of falling food inflation, lower fuel prices and a moderation in under-lying services inflation. Core inflation, which strips out food, fuel and other energy, was just 4.1% y/y – the lowest rate of price acceleration since 2011. The outlook for inflation at this stage is benign.
ratingrating
SOUTH AFRICA’S CREDIT RATINGS
BB-
A+
A
A-
BBB+
BBB
BBB-
BB+
BB
Ba3
A1
A2
A3
Baa1
Baa2
Baa3
Ba1
Ba2
Sources: Moody’s, Standard & Poor’s, Fitch, HSBC
1994 20081996 1998 2000 2002 2004 2006 2010 2012 2014 2016 2018
Standard & Poor’s Moody’s (RHS)Fitch
Investment grade
Subinvestment grade

19 A P R I L 2 0 1 8
We expect CPI to remain comfortably within the South African Reserve Bank’s 3% to 6% target band, with a forecast average of 4.8% in 2018 and 5.2% in 2019, anchored by low food infla-tion, the tailwind of currency appreciation and slowing service inflation.
WHAT REMAINS THE SAME? THE UNDERLYING POLITICS
South Africa has always faced the challenges of a much-divided political society. Race, culture, history, age, rural-urban divisions and different political and economic ideologies are all inter-woven, and it will be hard to achieve both a unified vision and consensus.
Milton Friedman said, “Hell hath no fury like a bureaucrat scorned”. With an outcome as close as the ANC election in December, fac-tionalism and resistance to change still exist within the ruling party. While the process to expose and eradicate corruption may well be under way, there is still representation of many opposing interest groups within the party leadership that may be chal-lenging to navigate.
While Ramaphosa’s election has clearly brought change and there is optimism that the country is being steered onto a more sustainable path, it will take a long time to move on from what became the political norm of incompetence, corruption and lack of accountability. The ramifications of this will present their own challenges, not only to the economy but also to the social and political landscape. The ongoing deterioration in education stan-dards, the failure to properly skill young people, the inadequate provisioning for investment in infrastructure and a history of mis-allocation of fiscal resources all need to be overcome.
Outside of the ruling party, the Democratic Alliance (the official opposition) has been embroiled in an internal dispute and severely affected by the protracted drought in the Western Cape.
Navigating support into the next election is going to be chal-lenging. The more radical Economic Freedom Fighters, who have lost their rallying call for land expropriation without compensa-tion to the ANC, will also have to reinvent themselves.
We cannot overstate the economic risk posed by state-owned enterprises that have been maladministered for extended periods of time, entrenching corruption and incompetence to the point of failure. Interventions into the management of Eskom and South African Airways will help, but the institutions themselves, the associated contracts and their ability to fulfil their economic obligations in a sustainable manner have not yet changed. It will require actively addressing entrenched cor-ruption, vision, time and diligent efforts at rehabilitation to turn these entities around.
THE LONG-TERM ECONOMIC CHALLENGES
Coming off a stronger base and coupled with the political changes we have detailed, it is reasonable to expect growth to improve. We forecast GDP growth of 1.8% in 2018 and 2.2% in 2019, fuelled by an acceleration in consumption expenditure (as household confidence and real incomes recover), balance sheets that are in reasonably good shape and some growth in investment returns.
While this acceleration is a welcome relief from three years of growth at about 1%, it is a far cry from the average 2.8% since 1994, and well below the average emerging market growth rate of 4.4% over the past three years. It is also not enough to reverse the downward trend in per capita GDP growth, which is crucial for improving dire levels of poverty and inequality.
Available data paint a mixed picture of activity at the start of 2018, despite the more upbeat sentiment. The Purchasing Managers’ Index consolidated early gains in March, slipping back to 46.9 from 50.8 in February.
% GDP
GOVERNMENT DEBT, INCLUDING GUARANTEES
30
40
50
60
70
80
20
10
0
Sources: National Treasury, IMF
200
5/0
6
200
6/0
7
200
7/0
8
200
8/0
9
200
9/1
0
2010
/11
2011
/12
2012
/13
2013
/14
2014
/15
2015
/16
2016
/17
2017
/18
2018
/19
2019
/20
2020
/21
South Africa’s guaranteesSouth Africa’s gross debt
Emerging markets average gross debt
%, year on year
REAL PER CAPITA GDP COMPARISONS
0
2
4
6
8
-2
-4
-6
Source: Datastream
1994 20021998 2006 201820142010
EUG7
Emerging Europe South Africa
Emerging markets

20 C O R O S P O N D E N T
Mining production has been a little better than expected, but manufacturing was weaker. Trade data have been weak, but early-year volatility may be distorting the hard data.
The long-term economic challenges are serious. South Africa needs a pragmatic and accelerated approach to transforma-tion. The open debate about land expropriation needs to be clearly defined. It is already a drag on growth and sentiment, and carries material risk of becoming difficult to contain if not agreed urgently.
This need for clarity in policy extends beyond land to mining, labour, the future and ownership structures of state-owned entities, and a real need for a new approach to education. For the allocated budget to education, the end-delivery is woefully poor.
THINGS LOOK BETTER, BUT MATERIAL CHANGE REQUIRES VISION, COMMITMENT AND CONSENSUS
This may well be the start of better things for the economy and for South Africans. It is safe to say that most people feel it is certainly much better than it was. However, it will require vision and con-sensus commitment for the political changes to become socially and economically real, durable and entrenched. Practically, turning around the numerous broken state institutions, in addition to the state-owned enterprises, is going to be a Herculean task, and it is not clear that there are enough skilled people available to undertake it. Still, growth generates options and resources. If the new government can do enough to sustain an improved rate of growth, it will be easier to implement reforms to raise potential meaningfully. +

A P R I L 2 0 1 8 21
THE THEMES OF late 2017 continued into the first quarter of 2018. Emerging markets continued to move stronger, driven by expectations of strong, synchronous global growth with no significant upward pressure on inflation. Strong upward growth revisions in the US and many of the emerging markets drove global growth expectations higher, to between 3.5% and 4% for 2018. Undoubtedly, 2017 was a year of very low or no realised volatility, with the VIX (the Chicago Board Options Exchange SPX Volatility Index, a proxy for global market volatility) registering three consecutive all-time lows.
However, even a massive spike in that index to levels of 30% from below 10% was not enough to derail the valuations of emerging market currencies and local bond markets in the first quarter of 2018. For the first three months of the year, emerging market bonds returned 4.3% in dollars, as suggested by the JP Morgan Government Bond Index-Emerging Markets (GBI-EM) Diversified Index, compared to 1.2% for emerging market equities and -0.8% for the Standard & Poor’s (S&P) 500 Index.
B O N D O U T L O O K
The local economy looks better
But after riding the wave of optimism, we are now cautious of South African bonds at current levels
By Nishan Maharaj
Nishan is head of Fixed Interest and responsible for the investment process and performance across all portfolios within the fixed interest offering. He has 15 years’ investment experience.

22 C O R O S P O N D E N T
as an issuer. At the time of writing, the level for the US 10-year was 2.8%, the inflation differential 3% (5% in South Africa and 2% in the US) and the South African sovereign spread 2.47%.
This implies a fair value for the South African 10-year bond at 8.27%, compared to a market trading level of 8.18%, putting it close to fair value. However, the sustainability of the global risk-free rate (US 10-year) and South African sovereign spread levels must be questioned.
The sheer magnitude of quantitative easing by the US Federal Reserve (Fed), Europe (the European Central Bank, ECB) and Japan (the Bank of Japan, BoJ) since the global financial crisis has driven global bonds yields tighter, particularly in developed markets. Since the Fed stopped its quantitative easing programme in 2014, both the BoJ and the ECB have taken up the slack, with purchases far in excess of those made by the Fed (see the graph below).
However, in the next 18 months, global central banks are expected to purchase 80% less than they currently do. This, together with the fact that globally developed market policy rates are on aggregate expected to rise, suggests that one should anticipate a further move higher in developed market bond yields, especially the US 10-year. The Fed’s current forecasts put the Fed funds rate (US policy rate) at 2.875% by the end of 2019, while the market is expecting closer to 2.475%.
At the bare minimum, based purely on policy rates, if the Fed’s forecast is realised, it suggests that the US 10-year should be trading at 3.2%. Coupled with the removal of the largest buyers of developed market bonds from the market (the ECB and the BoJ), it is easy to justify 3.2% as a minimum expectation rather than a cap on US 10-year yields.
The purchase of bonds by global central banks has forced investors to go further up the risk curve in search of yield. This has led to a com-pression in credit spreads, especially in emerging markets, making it cheaper for many emerging market countries to borrow money.
$ amount
TOTAL PURCHASES BY MAJOR CENTRAL BANKS
500
1 000
1 500
2 000
0
-500
-1 000
Source: Citibank
2009 20112010 20132012 2016 2017 2018 201920152014
European Central BankBank of Japan US Federal Reserve
Forecast
Aggregate
In South Africa, ‘Ramaphoria’ continued to inspire a further rally in local assets. The election of Cyril Ramaphosa as leader of the ANC was a much-needed step in the right direction. What has proved to be surprising were the pace and impact of consequent changes. His replacement of Jacob Zuma as president of the country led to a cabinet reshuffle to focus on policy stability and implementation.
Emphasis has been on getting state-owned enterprises back on track, with the appointment of credible individuals at Eskom and Public Enterprises. Most importantly, Ramaphosa has inspired a nation to hope again. The announcement of an adequate budget added further credibility, as it sought to put South Africa back on the path to fiscal consolidation by making tough decisions on value-added tax increases and expenditure.
South African bonds, despite rallying 50 basis points (bps) since the ANC elective conference, continued to revel in the ‘new dawn’, with the benchmark bond rallying another 50 bps to end the quarter at 7.98%. The All Bond Index (ALBI) returned 8.1%, driven primarily by bonds with maturity of greater than 12 years (constituting 60% of the ALBI), which returned 10%. The R900 billion reduction in bond issuance by the National Treasury at its weekly auction drove the outperformance of the longer end of the bond curve.
The local economy is now fundamentally on a much stronger footing, with local inflation forecasts and expectations revised lower. Inflation, as measured by the CPI headline index, is set to average 5% over the next two years and should, at the bare minimum, start to alleviate pressure on an economy that has strug-gled to grow meaningfully above 1% over the last three years.
Furthermore, the risks to inflation are tilted to the downside, stemming primarily from food (15% of the basket) and services (50% of the basket) inflation. Services prices are set on historical CPI measurements; based on lower expected inflation going forward, it is very likely that this becomes self-reinforcing, resulting in stable to lower services prices. In addition, regulatory scrutiny in the insurance and medical aid industries should help keep prices in check. The consumer should benefit from lower inflation as real disposable income increases, underpinning the growth recovery.
As ‘Ramaphoria’ filters through South Africa, we should also see a renewed uptick in both business and consumer confidence. This increased confidence should enable corporate South Africa to start spending on inventory renewal and investing in longer-term projects. The combination of increased consumer spending and fixed investment could help South Africa achieve 2% to 2.5% growth over the next two to three years. While this is a marked improvement, it is still some way off what is necessary to achieve sustainable job creation and reduce poverty levels.
The recent price moves in South African assets have been remark-able, but it is vital for South Africa and financial assets that prices do not move too far ahead of reality, especially given the long road ahead and risks around implementation. Our fair value for South African government bonds depends on the global risk-free rate (US 10-year), the inflation differential between South Africa and the rest of the world (US CPI) and the credit spread for South Africa

23 A P R I L 2 0 1 8
South Africa has also been a beneficiary of this hunt for yield. The country effectively has a split rating – Fitch and S&P rate it as sub- investment grade while Moody’s rates it as investment grade. This makes the comparison of South Africa’s credit spread quite difficult.
Thus, in the graph below we use an average (the blue line) of the BBB (Investment Grade [IG] Credit Index) and BB (the first rung of the sub-IG Credit Index) to compare South Africa’s credit spread.
There are two key observations. First, South Africa trades slightly cheap relative to this average index, given its split rating (c. 25 bps). Secondly, the absolute level of these credit spreads is quite low. If a normalisation were to take place, that is, if global central banks con-tinued to reduce quantitative easing as expected and remove policy accommodation, it is very likely that we would see credit spreads moving closer to their historical average (the dashed line in the graph below).
SOUTH AFRICA’S SOVEREIGN SPREAD VERSUS AVERAGE (BB & BBB INDEX)
350
450
550
650
750
850
250
150
50
Source: Bloomberg
Ap
r 99
Ap
r 00
Ap
r 01
Ap
r 02
Ap
r 03
Ap
r 04
Ap
r 05
Ap
r 06
Ap
r 07
Ap
r 08
Ap
r 09
Ap
r 10
Ap
r 11
Ap
r 12
Ap
r 13
Ap
r 14
Ap
r 15
Ap
r 16
Ap
r 17
South Africa’s sovereign spread Average (BB & BBB)
This implies that although the South African credit spread might move tighter relative to the average index, the absolute level of credit spreads will have to move wider. The longer-term average of the index is approximately 80 bps higher than current levels. To be conservative, if normalisation does occur, we could see credit spreads moving at least halfway back to their longer-term average, which is a move of 40 bps higher. In such an environment, even if South Africa does everything right and moves back to investment grade, we would still need to see South African credit spreads 15 bps wider.
The point is that the current level of the South African credit spread should be seen as a floor/minimum rather than having scope for further compression. Adjusting our estimates of fair value for the above, we have a global risk-free rate of 3.2%, a South African credit spread of 2.62% and an inflation differential of 3%. This suggests a fair value on the South African 10-year of 8.82%, making the current level of 8.18% expensive.
The outlook for the local economy is much better. Inflation should allow the South African Reserve Bank room to ease rates some more. In addition, lower inflation and positive sentiment should help increase consumer spending and provide a decent underpin for growth. This could lead to new investment by corporate South Africa into inventory renewal and long-term projects, which could also add more upside to the growth outlook. The pace of changes made by the new leadership has been impressive, but most of the easy wins have already been realised. What lies ahead is a much tougher battle.
South African bonds have ridden the wave of optimism on the back of the new dawn. However, at current levels, most of the good news (if not more) has already been priced in. The risks from global monetary policy tightening (higher policy rates and a reduction in quantitative easing) could have negative consequences for South African bonds (which have a very limited buffer to withstand these shocks). We therefore choose to be cautious of South African bonds at current levels, looking instead for more attractive levels before moving to neutral or overweight positions. +

C O R O S P O N D E N T 24
INVESTOR NEED: LONG-TERM GROWTH
Domestic general equity funds
The JSE had a poor quarter, with the FTSE/JSE Capped All Share Index declining 6.0%. The weakness was driven by industrials (-8%) and property (-20%), with the latter being impacted by the collapse in the share price of the Resilient group of companies on the back of allegations of share price manipulation. While our
PERFORMANCE FOR VARIOUS PERIODS
Launch date Quarter 3 years 5 years 10 years 15 years 20 years
Top 20* Oct 00 (5.8%) 4.3% 9.1% 12.8% 19.9% -
Equity1 Apr 96 (5.1%) 4.4% 9.8% 11.9% 18.7% 14.8%
Average competitor (4.7%) 2.2% 7.8% 8.6% 16.4% 12.5%
The Coronation Top 20 fund is a concentrated portfolio of locally listed shares. The Coronation Equity fund is a more diversifi ed portfolio of locally listed shares, plus a concentrated portfolio of developed and emerging market shares. Performance is shown for the A classes of the funds. The average competitor return represents the median of the South Africa – Equity – General category, excluding the Coronation funds in the category, and is sourced from Morningstar as at 31 March 2018.
Source: Morningstar
S O U T H A F R I C A N F L A G S H I P F U N D U P D A T E
Performance and positioning
We continue to focus on valuation to find attractive opportunities

25 A P R I L 2 0 1 8
equity funds had no exposure to the Resilient counters, exposure to industrial shares such as Naspers and British American Tobacco (BAT) detracted during the quarter. The funds added significant value relative to the average competitor over all meaningful periods.
The financial sector continued its rally post the ANC elective con-ference, with banks (+4.2%) and life insurers (+1.2%) ending the quarter in positive territory. While the share prices of most South Africa-specific banks are up 30% to 35% since December 2017, Investec is flat despite a significant portion of its earnings deriving from South African financial services. We took the opportunity to build a decent-sized position, as we think its recently announced new leadership will be able to significantly unlock the value present in the business.
The resources sector declined by 3.8%, with platinum stocks (-21%) in particular having another terrible quarter. We continue to maintain reasonable exposure to resources based on our assess-ment of their long-term value. Our preference for Anglo American (+10%) over BHP Billiton (-3%) – based on a more attractive com-modity mix and valuation – continued to contribute to perfor-mance for the quarter. However, our platinum exposure, mainly through Northam, has detracted.
The Equity fund’s 21% weighting in global and in particular, selected emerging market equities, added significantly to performance over the past year and quarter respectively. Three of the fund’s largest international holdings, 58.com (+9%), Booking Holdings (+14%) and Vostok New Ventures (+9%) delivered strong performances.
The volatility in global markets has created opportunities for us to capitalise on compelling investment opportunities in some of our global diversified holdings. The significant de-rating of shares like BAT and Mondi allowed us to add to these positions at very attrac-tive prices. The combination of cheap multiples and cash-gener-ative business models will deliver substantial shareholder value in future.
Other portfolio changes included a further reduction in our Naspers position on the back of a very strong run in Tencent’s share price. We also sold most of our position in Discovery – again on share price strength. We further exited our position in The Foschini Group (TFG) as the business was trading above our assessment of fair value.
We currently have limited exposure to the South African clothing retailers given their stretched valuations. At this point our pre-ferred domestic equity exposure are the defensive counters such as hospitals (Netcare and Life Healthcare) and food retailers (Pick n Pay and Spar) where we believe valuations are still attractive.
Multi-asset class funds
The funds added significant value relative to the average com-petitor over all meaningful periods. The regulatory allowance for offshore exposure increased during February to 30% and 40% for Balanced Plus and Market Plus respectively. Although we cur-rently hold below the maximum, over the longer term significant offshore exposure remains a meaningful contributor to the funds’ performance.
This past quarter’s heightened volatility in global markets were driven by concerns around the impact of rising global bond yields and more recently the growing risk of a US/China trade war. Against this backdrop, the MSCI All Country World Index ended the quarter down 1.0% in US dollars (-5.4% in South African rands). Emerging markets continued their recent outperformance, returning +1.4% for the period relative to developed markets, which returned -1.3%.
We have taken some profits on our offshore equity positions and added opportunistically to domestic shares, thereby marginally increasing our domestic equity exposure.
We continue to avoid owning global bonds given our expectation that bond yields will move higher. The global economy is experi-encing a synchronised recovery, with signs of inflation returning. This, coupled with central bank policy rates that we believe are still too low for a non-crisis global economy and US president Donald Trump’s tax package – which will provide further economic stimulus – makes it appear almost inevitable that interest rates will eventually have to rise to more normal levels. This will have knock-on implications for the pricing of all risk assets and we would temper expectations around global equity market returns relative to the strong dollar gains we have experienced in recent years.
Locally, the good news post the ANC’s elective conference in December has continued. The decisiveness of president Cyril Ramaphosa’s cabinet reshuffle, together with a sound 2018/2019 Budget, was rewarded when Moody’s maintained the country’s sovereign rating at Baa3, which keeps it in the Citigroup World Government Bond Index. Although we have yet to see better sentiment translate into improved corporate earnings, we are confident that the economy is once again heading in the right direction.
PERFORMANCE FOR VARIOUS PERIODS
Launch date Quarter 3 years 5 years 10 years 15 years 20 years
Balanced Plus* Apr 96 (3.4%) 4.2% 8.9% 10.7% 16.2% 12.9%
Market Plus2 Jul 01 (3.7%) 4.7% 8.8% 11.2% 16.9% -
Average competitor (3.6%) 3.4% 7.5% 8.2% 14.0% 12.4%
The Coronation Balanced Plus fund represents our best investment view for long-term retirement savers and is managed according to the investment restrictions applicable to retirement funds. The Coronation Market Plus fund represents our best investment view for long-term discretionary savers and as such can have more exposure to shares and foreign assets. Performance is shown for the A classes of the funds. The average competitor return represents the median of the South Africa – Asset Allocation – High Equity category, excluding the Coronation fund in the category, and is sourced from Morningstar as at 31 March 2018.
Source: Morningstar
Our objective remains building diversified portfolios that can absorb
unanticipated shocks.

26 C O R O S P O N D E N T
Given the improved political and economic outlook, the rand continued its December rally. Domestic bonds also had a very strong quarter, with the All Bond Index (ALBI) ending up 8.1%, making South African government bonds some of the best-performing assets globally this quarter. Our low exposure to domestic fixed rate bonds detracted from performance over this period. However, we believe that South African fixed income assets are currently fully priced and are reflecting much of the good news for the local economy. Furthermore, local bond yields provide very little cushioning against a further increase in global inflation and a rise in developed market bond yields. We there-fore continue to maintain very low exposure to fixed rate bonds. This is partly offset by our overweight position in listed property, especially the A property shares, which we believe offer very attractive risk-adjusted returns.
In this uncertain world, our objective remains building diversified portfolios that can absorb unanticipated shocks. We will continue to focus on valuation and seek to take advantage of attractive opportunities that the market may present to us, and in so doing generate inflation-beating returns for our investors over the long term.
INVESTOR NEED: INCOME AND GROWTH
Multi-asset class funds
Our absolute return portfolios have the dual mandate of beating inflation over time and protecting capital in the short term. While the funds have delivered on their capital protection objective, they failed to achieve their return targets (inflation plus 3% and 4% respectively) in the recent past, which has been disappointing. Longer-term returns, however, remain ahead of benchmark.
Given this disappointing performance, we provide some context to the underperformance by unpacking the rolling one-, three- and
PERFORMANCE FOR VARIOUS PERIODS
Launch date 1 year 3 years 5 years 10 years 15 years
Capital Plus* Jul 01 1.5% 3.4% 6.5% 9.1% 12.5%
Balanced Defensive* Feb 07 4.0% 5.2% 7.5% 9.8% -
Infl ation 4.2% 5.5% 5.3% 5.8% 5.7%
Sources: Morningstar, IRESS
five-year asset class returns. As is clear from the table below, it has been a tough investment environment where real returns across asset classes have been far lower than the historical trend.
Disappointingly, both funds’ domestic equity performance has lagged the index over the one- and three-year periods. It is important that returns are viewed in the context of the portfolios being constructed to outperform inflation and not the relevant equity benchmark. That said, the funds’ defensive positioning has detracted from performance, as have the large holdings in dual-listed rand hedge stocks.
Domestic property exposure has generated alpha relative to the South African Listed Property Index (SAPY) over all periods. However, returns for both the funds and the sector did not beat the respective inflation-plus targets.
Our domestic bond portfolios have, despite their conservative duration positioning, either matched or outperformed the perfor-mance of the ALBI over all periods.
Offshore assets have been a drag on performance over the rolling one- and three-year periods. The continued strengthening of the rand relative to major developed market currencies has been a headwind to the funds’ performance. In hard currency, the funds’ offshore allocations have generally lagged global equity markets given the more defensive nature of these portfolios, with only 50% to 55% of the respective portfolios’ offshore assets allocated to equities.
Over the quarter, we took advantage of the market sell-off, increasing the funds’ allocation to domestic equity through the purchase of index futures and adding to our positions in BAT and Investec. We trimmed our holding in Naspers and exited positions in TFG, Mr Price and Coronation on the back of strong share price performance and reduced margin of safety.
We also reduced the funds’ allocation to domestic property by trimming positions in Growthpoint, Hammerson and Redefine into strength. We further reduced exposure to local government bonds as, in our view, valuations are not attractive on a risk- adjusted basis.
No meaningful changes were made to the funds’ offshore asset allocation. We believe the funds’ offshore allocation remains appropriate given the benefits of diversification, value in the underlying offshore assets and our expectation of future rand weakness.
In an incredibly uncertain world, we continue striving to build diversified portfolios that can absorb unanticipated shocks. We will remain focused on valuations and seek to take advan-tage of whatever attractive opportunities the market presents to generate inflation-beating returns for investors over the long term. While we are cognisant of the fact that we have not deliv-ered inflation-beating returns in the recent past, we remain confident that the positioning of the portfolio and our invest-ment approach for the income-and-growth funds should deliver inflation-beating returns consistent with the portfolio’s long-term track record.
INDEX PERFORMANCE FOR THE ROLLING ONE-, THREE- AND FIVE-YEAR PERIODS
Asset class 1 year 3 years 5 years
Domestic equity (capped SWIX) 8.0% 3.8% 10.4%
Domestic property (SAPY) (7.1%) (0.5%) 7.1%
Domestic bonds (ALBI) 16.2 8.6% 7.7%
Domestic cash (STeFI3M) 7.9% 6.8% 6.3%
Off shore assets
(50% ACWI / 50% US Treasury Bills)(2.3%) 4.8% 11.4%
Source: IRESS

27 A P R I L 2 0 1 8
INVESTOR NEED: IMMEDIATE INCOME
Income fund
In addition to rallying 50 basis points (bps) post the ANC elective conference, local bonds continued to revel in the ‘new dawn’, with the benchmark bond rallying another 50 bps to end the quarter at 8.0%. The ALBI returned 8.1%, driven primarily by bonds with maturity of greater than 12 years (constituting 60% of the ALBI), which returned 10%.
The outlook for the local economy is much better. Subdued infla-tion should allow the South African Reserve Bank room to ease rates a little more. In addition, lower inflation and positive sen-timent should help increase consumer spending and provide a decent underpin for growth. This could lead to new investment by corporate South Africa into inventory renewal and long-term projects, which could also add more upside to the growth outlook. The pace of changes made by the new leadership has been impressive, but most of the easy wins have already been realised.
PERFORMANCE FOR VARIOUS PERIODS
Launch date Quarter 1 year 3 years 5 years 10 years 15 years
Strategic Income* Jul 01 2.0% 8.9% 8.4% 8.0% 9.3% 9.8%
Cash (STeFI3M) 1.7% 7.1% 6.8% 6.3% 6.8% 7.4%
The Coronation Strategic Income Fund aims to provide an alternative to cash or medium-term fi xed deposits. Cash returns are measured using the STeFI 3-month index.
Sources: Morningstar, IRESS
What lies ahead is a much tougher battle. South African bonds have ridden the wave of optimism on the back of the new dawn. However, at current levels, most of the good news (if not more) has already been priced in. The risks from global monetary policy tight-ening (higher policy rates and a reduction in quantitative easing) could have negative consequences for South African bonds (which have a very limited buffer to withstand these shocks). We there-fore choose to be cautious of South African bonds at current levels, looking instead for more attractive levels before moving to neutral or overweight positions.
We remain confident that the listed property sector in South Africa offers selective value. The fund maintains holdings in counters that offer strong distribution and income growth. In the event of a moderation in listed property valuations (which may be triggered by further risk asset or bond market weakness), we will look to increase the fund’s exposure to this sector.
We remain vigilant of risks emanating from the dislocation between stretched valuations and the underlying fundamentals of the South African economy. The fund’s current positioning reflects this caution. The fund’s yield of 8.8% remains attractive relative to its duration risk. We continue to believe that this yield is an adequate proxy for expected fund performance over the next 12 months. +
1 Highest annual return: 62.5% (Aug 2004 - Jul 2005); Lowest annual return: -28.7% (Mar 2008 - Feb 2009)
2 Highest annual return: 50.0% (Aug 2004 - Jul 2005); Lowest annual return: -20.1% (Mar 2008 - Feb 2009)
* For highest and lowest annual return, refer to page 36.

C O R O S P O N D E N T 28
Tony is a founder member of Coronation and a former CIO. He established Coronation’s international business in the mid-1990s, and has managed the Global Equity Fund of Funds strategy since inception.
I N T E R N A T I O N A L O U T L O O K
Rising global inflation How worried should investors be?
By Tony Gibson
AFTER AN UNPRECEDENTED 16 months of consecutive gains, it was not surprising that global equities experienced a sharp rise in volatility at the end of the first quarter of 2018. Initially, there was a sharp sell-off in February. While the monthly decline in US equities was 4.2% in February, the fall approached 10% at one point during the month. The MSCI Emerging Markets Index fared even worse, with a decline of 4.6%.
TURBULENCE IN THE EQUITY MARKET
These falls were essentially due to an equity bull market that has risen for a very long time without any material correction. The trigger for the sell-off was most likely concern about rising inflation and bond yields, with the 10-year US Treasury yield having risen from 2.41% at the end of last year to a high of 2.95% by mid-February. Commodity prices fell along with other risk assets, with Brent Crude and natural gas down by 6% and 7% respectively during February. However, the heightened volatility during late March and early April was due to a more specific event – the escalation in retaliatory exchanges between Washington

29 A P R I L 2 0 1 8
push, rising trade tensions as the Trump administration seeks leverage in trying to renegotiate trade tariffs and the ever-present ‘tail risk’ of rising geopolitical risk associated with the nuclear standoff between the US and North Korea.
GLOBAL GROWTH OUTLOOK BUOYED BY CURRENT MOMENTUM
Notwithstanding recent concerns and increased volatility, we believe that the bull case for equities will endure for a while yet. The synchronised global expansion seems set to continue for several years, inflation remains moderate on a global basis, central banks are still providing ample liquidity and equities continue to look attractively priced relative to government bonds.
We believe that the fundamental outlook for global growth and interest rates is little changed from where it stood at the start of 2018. Global economic data continue to reflect an impressive, broad-based global economic expansion. Economists estimate that global manufacturing output accelerated to a 5.5% annual rate in the last quarter of 2017, its fastest pace since 2010.
As last year’s second-half rise in energy prices begins to dampen consumer spending, the pace of this expansion is expected to ease somewhat this year. However, there is sufficient momentum in the global economy that labour and product market constraints in
developed markets should push both wage and core CPI inflation higher in coming quarters, along with expectations about central bank policy rates.
Outside the US, there has been relatively little change in expec-tations regarding monetary policy among the major central banks. Despite a noticeably stronger Eurozone economy, the European Central Bank is still on an extremely gradual path toward
policy normalisation. Quantitative easing is widely expected to end only in September, while the first rate hike is not expected until the first or second quarter of 2019.
In Japan, officials continue to stress that no change in its quanti-tative easing programme should be expected anytime soon, but economists there believe that the Bank of Japan may ratchet up its target level for 10-year government bond yields from the current level of zero to 0.25% by the end of the year. In both Canada and the UK, interest rate futures markets predict the most likely scenario for further rate hikes coming at each central bank’s May meeting.
Taking a longer-term perspective, although we are late in the economic cycle, ongoing cyclical tail winds should fuel economic resilience in the US over the next 24 to 36 months. A key driver of this surprising resilience is the growth created by the coming of age of American Millennials, overlapping peak spending by Generation X families and the ageing but still healthy Baby Boom young seniors.
and Beijing regarding terms of trade. This elevated concerns of a nascent ‘trade war’.
Although a little technical, another factor needs to be highlighted. Against this fundamental backdrop, a ‘volatility event’ related to the rapid liquidation of short-volatility positions in inverse Volatility Index (VIX) products appears to have exacerbated tur-bulence in the equity market. This was reflected in a 116% increase in the Chicago Board Options Exchange (CBOE) VIX on 5 February, which was its largest ever one-day change.
This event was not unlike the ‘flash crash’ of May 2010, given that equity volatility spiked far more dramatically than the volatility of rates, currencies or oil prices. A study of the 2010 event by the US Securities and Exchange Commission observed that “the inter-action between automated execution programs and algorithmic trading strategies can quickly erode liquidity and result in disor-derly markets”.
We believe that volatility of this magnitude, rather than being an outlying event, might well be the new normal. During this period, there was no protection to be found in bonds or gold, while equity sector diversification did not help either. All assets correlated.
The massive inflow into passive management has played a big role in creating this new environment. It is estimated that the exchange-traded fund (ETF) indus-try’s assets under management stood at $4.6 trillion at the end of 2017. In 2017 alone, ETF assets grew by over one trillion dollars compared to the US mutual fund industry that recorded growth of a mere $91 billion. Passive capital inflows therefore outgrew active flows by a factor of 10. During the first week of February, ETF outflows were $30 billion, which was suffi-cient to cause significant market disruption. This of course begs the question as to what would happen if these outflows were far larger; an outflow of, say, $300 billion will be a small percentage of recent flows into ETFs, yet the impact on volatility and correla-tions will most likely be extreme.
The correction in February left the MSCI World and MSCI Emerging Markets indices trading at reasonable levels of 16.0 and 12.4 times estimated earnings, which suggests that valuations alone are not an impediment to the resumption of the global equity bull market in coming quarters.
However, ETF outflows aside, even modestly rising inflation pres-sures and further gradual movements toward interest rate normal-isation among major developed market central banks suggest a continued move towards more normal levels of equity market vola-tility, certainly relative to the extremely passive conditions of 2017.
Meanwhile, investors will continue to watch key risks closely. These include US inflation and interest rate pressures, the possibility of a significant slowdown in China in response to the negative credit
Key risks are US inflation and interest rate pressures, a potential
slowdown in China in response to the negative credit push and
rising tensions as Trump tries to renegotiate trade tariffs with China.

30 C O R O S P O N D E N T
Collectively, the maturing of the core of a large generation exag-gerates consumer demand, workforce productivity, capital invest-ment and economic growth. Housing is an important component of this. In the US, estimates are that 400 000 housing units are lost each year, for example through demolitions and fires.
To keep pace with the net rise in American household formations, at least 1.5 million new units must be built each year over the next decade. While the number of housing starts has rebounded slightly over the past three years (after the post-2008 supply glut absorbed from 2010 to 2014), building is still far below what is needed to meet rising Millennial Generation demand. Supply shortages have fed housing price inflation and set the stage for a further rise in residential construction across the country.
Additionally, following the 2008 financial crisis and global reces-sion, many analysts had forecast that annual US new vehicle demand would never rebound above 16 million units. This belief was built on the understanding that the pre-crisis numbers were inflated by subprime lending, high fleet sales and irresponsibly low lease-end residuals. Yet demand has rebounded to a cyclical high above 17 million units per year. Although sales may soften slightly this year to about 16.8 million units, the con-sistently strong numbers are due to lower income taxes, rising household incomes and full-time employment and wages for Millennials, the largest market for new vehicles over the next 12 years.
INVESTOR CONCERNS ABOUT INFLATION ON THE RISE
As alluded to earlier, for the first time in many years, investors are becoming increasingly concerned about potential inflation, particularly in the US. This concern is based on the acceleration in the US hourly earnings to a 2.9% year-on-year pace in January, while the CPI rate also jumped by a greater than expected 0.5%.
Additional concerns arise from the fact that, on a for-ward-looking basis, US fiscal policy is becoming highly expan-sionary at a time when the economy is already at full employ-ment. Based on the combined effect of previously announced tax cuts and a US budget deal in February that increases gov-ernment spending by almost $400 billion, estimates are that 0.7% will be added to GDP growth in 2018 and 0.6% in 2019.
This has raised concerns that the US Federal Reserve (Fed) will need to push up interest rates more than was expected earlier. Interest rate futures are now pricing in a 35% chance that the Fed will hike rates four or more times by the end of this year, even though three rate hikes remain the most likely scenario.
Taking a longer-term outlook on inflation, in our opinion demand-pull inflation is no longer a force in the industrialised northern hemisphere, with the exception of the US. Essentially, this is due to the secular ageing and imminent contraction in the populations of Western Europe, Eastern Europe, Russia, Japan
and South Korea. China will soon follow along this path, as its working-age population has already begun to shrink.
Since the US population is still growing, albeit slowly, brief surges of demand-pull inflation are still possible. However, ongoing con-traction of consumer demand across most of Europe and North Asia will mute or offset such cyclical pricing power over the next few decades. While currency weakness or supply disruptions will cause periodic short-term local or regional inflationary pressures, any such pricing power will be short-lived due to the slow but inev-itable deterioration of demand in the industrialised north.
Over the next decade, resilient US demand and rising per capita consumption in emerging South Asia are likely to offset demand weakness in Europe and Northeast Asia. However, the collec-tive global shrinkage of demand will become more pronounced over the next 10 years as population ageing and contraction
outside the US gathers momentum. Therefore, while investors must focus near term on modest pricing pressures created by the US- and China-led synchronised rise in global growth, any inflationary pressure is likely to be muted and short lived.
While manipulation of monetary and fiscal policies may temporarily boost input and consumer prices, over the longer term fewer high-income con-
sumers will lead to reduced demand for food, energy, materials, goods and services. Meanwhile, year-on-year consumer infla-tion is moderating or under control in the world’s three largest emerging economies.
Put another way, if the populations of Europe and Northeast Asia were growing at a rate similar to the US, it can be argued that there would not have been a decade-long distortion of extremely low interest rates. As is well known, some of the consequences of these policies are blown-out equity price-earnings ratios, as well as impacts on asset allocations, commodity demand and over- leveraging in a reach for real yields. To give this perspective, we know that an individual consumes more at age 40 than at 60. The ageing of Europe and Japan has thus had a significant negative impact on collective global demand, and in turn, on pricing power for materials, goods and services.
Looking forward, the drag will become even more pronounced as most countries in the industrial north see their populations age further and decline in number. Fewer and older is a recipe for decline in demand, economic growth and public sentiment, and as a consequence, potentially political stability. While infla-tionary pressures will most likely see a late-cycle lift over the next 18 to 24 months, this pricing power is likely to prove temporary as secular deflationary pressures take hold during and beyond 2020.
Therefore, while fears of deflation and recession are currently giving way to worries about overheating due to recent ill-timed fiscal stimuli, it may not be long before investor concerns begin to turn back toward fears of stagnation and the social pressures associated with stagflation.
Notwithstanding recent concerns and increased volatility, we believe that the bull case for equities will
endure for a while yet.

31 A P R I L 2 0 1 8
POSITIVE US ECONOMIC DYNAMICS REMAIN
In summary, fears of a near-term US recession should fade as we move into the second quarter, as the stimulus created by tax cuts, federal spending hikes and modestly higher wages boost consumer spending and capital investment. This is of course based on the view that it is in neither the US nor China’s interest to allow a full-scale trade war to take hold. However, this late-cycle growth is likely to dissipate later next year and into 2020 as rising
interest rates dampen public and consumer spending and cause renewed job market anxiety. That said, while momentum inves-tors will expect this slowdown to become irreversible, the positive dynamics of virtuous US population demographics should surprise the pessimists and reward long-term investors with a resumption of strong economic growth from the US. This will widen the diver-gence between North America and the ageing and contracting populations of Europe, Japan, Russia, South Korea and most of China. +

C O R O S P O N D E N T 32
INVESTING IN FRONTIER markets provides for a huge cross section in opportunities as market dynamics differ significantly. From the currency-frozen markets of Zimbabwe to the mature markets of Eastern Europe, there is something for everyone. Of course, the key to making returns in these markets is all about what you pay.
As far as frontier markets go, Vietnam is a pleasure to visit. The visa process is a breeze and as you land there is a steamed bunfight of hawkers trying to sell you cheap mobile cards, currency and trans-fers – pretty much whatever you might need and more. Everything works, without having to pay excessively for it. Hotels are superb, the food quality is incredible and for R10 you can jump on the back of an Uber scooter and zip through the craziness to whatever awaits.
We visited Vietnam in March to meet with a number of companies. It is an economy on the rise, growing at 7% per annum and with much going for it. It is a decent-sized market with close to 100
Ho Chi Minh City vs. CairoWhat you see is not always what you get
By Peter Leger
Peter is head of Global Frontiers and manages all strategies within the global frontiers offering. He joined Coronation in 2005 and has 20 years’ experience in the financial markets in Africa as both a portfolio manager and research analyst.
F R O N T I E R M A R K E T S
A tale of two cities

33 A P R I L 2 0 1 8
million people with a wonderful work ethic and a ‘can-do’ attitude. Still, in the Coronation Global Frontiers strategy, we have zero exposure to Vietnam.
WHAT GIVES?
The current optimism towards Vietnam has seen very large capital flows into the country. It is a market with a healthy 18% of MSCI Frontiers Index weighting and managers of both Frontier and Global Emerging Market assets have been enthusiastic supporters.
However, the Vietnamese stock exchange is quirky. Trades have to be prefunded. A number of companies have foreign owner limits, which means stocks trade at two price points – one level between domestic buyers and another, much higher level, between foreign buyers. The foreign transactions are opaque and the regular market bid-offer transparency is not there.
A large number of listings have recently come to market, to great support. We have battled to find value and have resisted the temptation to buy into the momentum. An extreme example of the value dislocation is the coming to market of the largest cable operator, VTV: a 48% stake is being offered at 260 times 2016 earnings and 20 times its book value. As yet, there are no 2017 numbers available. The fact that something like this can even be brought to market screams warning signs.
So we left Ho Chi Minh city empty-handed following our trip. The story is great. The opportunity set is far less so.
SO WHERE DO WE SEE VALUE?
An interesting exercise is to compare Vietnam to Egypt. Both countries have populations close to 100 million people and their respective GDPs per capita are almost identical, at $2 482 and $2 492 respectively for Vietnam and Egypt. While it is treacherous to use read-across metrics such as market capital-isation to GDP, it is interesting that the Vietnamese total market capitalisation weighs in at $154 billion while that of Egypt is only $42 billion. Ratings in Vietnam are far higher, at an average of 21
times earnings, with the more interesting stocks trading at further premiums of as much as 50% due to foreign ownership levels. We would argue that the earnings base is also much higher in Vietnam, given the more stable multiyear growth history. Egypt trades on an average multiple of 15 times earnings, with the earnings base below normal given the country’s recent history.
This quarter, we met with a number of Egyptian companies. We are still managing to find high-quality businesses on single multiples – and this in an economy where inflation and interest rates have recently spiked and are now coming down quickly. Interest rates were cut 200 basis points this quarter, with expec-tations of further cuts in the months ahead. Inflation is likely to hit single-digit figures this year from having hit 30% in 2017.
Most of the businesses we talked to spoke of an improving trading environment. Economic reforms of the last couple of years are starting to yield results and the outlook for Egypt to experience growth over the next few years is good. However, due to previous hard years, many of these businesses have earnings well below our estimate of normal. So despite the strong stock market per-formance in Egypt, there are still companies trading below their intrinsic value.
While we hold no Vietnamese exposure today, we hold maximum positions in Egypt in both our Africa Frontiers strategy and our Global Frontiers strategy. This is as a direct result of specific high- conviction stock positions that stack up to give the overall exposure weighting.
I remember a conversation with a potential investor who was looking at Africa in 2014, when the markets had run hard. He said, “Give me a call when things are on single earnings multiples”. After the torrid 2015 and 2016, I did just that and gave him a call. “Oh no, I can’t invest in Africa! There’s just so much bad news,” he said. And that is the thing – most investors want the kind of deal that the UK is looking for in Brexit – divorce where you get to keep all the brilliant children, and pass on the delinquents. High-growth markets and single-digit multiples seldom go together. We think we might have found one in Egypt. +

34 C O R O S P O N D E N T
Domestic flagship fund range
Coronation offers a range of domestic and international funds to cater for the majority of investor needs. These funds share the common Coronation DNA of a disciplined, long-term focused and valuation-based investment philosophy and our commitment to provide investment excellence.
INVESTOR NEED
INCOME ONLY INCOME AND GROWTH LONG-TERM CAPITAL GROWTH
FUND STRATEGIC INCOMECash†
BALANCED DEFENSIVEInflation†
CAPITAL PLUSInflation†
BALANCED PLUSComposite benchmark†
(equities, bonds and cash)
TOP 20FTSE/JSE CAPI†
FUND DESCRIPTION Conservative asset allocation across the
yielding asset classes. Ideal for investors
looking for an intelligent alternative to cash or
bank deposits over periods from 12 to 36
months.
A lower risk alternative to Capital Plus for investors
requiring a growing regular income. The fund holds fewer growth assets and more income assets
than Capital Plus and has a risk budget that is in line with the typical
income-and-growth portfolio.
Focused on providing a growing regular income.
The fund has a higher risk budget than the typical
income-and-growth fund, making it ideal for investors in retirement
seeking to draw an income from their capital over an extended period
of time.
Best investment view across all asset classes. Ideal for pre-retirement
savers as it is managed in line with the investment restrictions that apply to pension funds. If you are not saving within a retirement vehicle,
consider Market Plus, the unconstrained version of
this mandate.
A concentrated portfolio of 15-20 shares selected
from the entire JSE, compared to the average
equity fund holding 40-60 shares. The
fund requires a longer investment time horizon and is an ideal building block for investors who
wish to blend their equity exposure across a number
of funds. Investors who prefer to own just one
equity fund may consider the more broadly
diversified Coronation Equity Fund.
INCOME VS GROWTH ASSETS1
INCOME GROWTH
92.0% 8.0%
61.5% 38.5%
57.7% 42.4%
19.5% 80.5%
0% 100%
LAUNCH DATE Jul 2001 Feb 2007 Jul 2001 Apr 1996 Oct 2000
ANNUAL RETURN2 (Since launch)
10.4%7.8%†
9.7%6.2%†
12.2%6.0%†
14.8%13.4%†
18.5%14.4%†
QUARTILE RANK (Since launch) 1st 1st 1st 1st 1st
ANNUAL RETURN (Last 10 years)
9.3%6.8%†
9.8%5.8%†
9.1%5.8%†
10.7%10.3%†
12.8%9.2%†
STANDARD DEVIATION (Last 10 years)
1.8%0.5%†
4.2%1.5%†
5.9%1.5%†
8.9%9.3%†
14.6%15.6%†
FUND HIGHLIGHTS Outperformed cash by 1.7% p.a. over the past 5 years and 2.6% p.a. since
launch in 2001.
Outperformed inflation by 3.5% p.a. (after fees)
since launch, while producing positive returns over all 12-month periods.
Outperformed inflation by 6.2% p.a. (after fees)
since launch, while producing positive returns over 24 months more than
99% of the time.
No. 1 balanced fund in South Africa since launch in 1996, outperforming its average competitor
by 2.4% p.a. Outperformed inflation
by on average 8.4% p.a. since launch and
outperformed the ALSI on average by 1.2% p.a.
The fund added 4.1% p.a. to the return of the market.
This means that R100 000 invested in Top 20 at launch in Oct 2000
grew to more than R1.9 million by end-March
2018 – nearly double the value of its current
benchmark. The fund is a top quartile performer
since launch.
1 Income versus growth assets as at 31 March 2018. Growth assets defined as equities, listed property and commodities (excluding gold).
2 Highest annual return Strategic Income: 18.7% (Nov 2002 – Oct 2003); Coronation Balanced Defensive: 21.2% (Jun 2012 – May 2013); Coronation Capital Plus: 33.8% (Aug 2004 – Jul 2005); Coronation Balanced Plus: 49.3% (Aug 2004 – Jul 2005); Coronation Top 20: 68.9% ( May 2005 – Apr 2006)
Lowest annual return Strategic Income: 2.6% (Jun 2007 – May 2008); Balanced Defensive: 2.0% (Mar 2008 – Feb 2009); Capital Plus: - 6.2% (Nov 2007 – Oct 2008); Balanced Plus: -17.4% (Sep 1997 – Aug 1998); Top 20: -31.7% (May 2002 – Apr 2003)
Figures are quoted from Morningstar as at 31 March 2018 for a lump sum investment and are calculated on a NAV-NAV basis with income distributions reinvested.

35 A P R I L 2 0 1 8
RISK VERSUS RETURN
10-year annualised return and risk (standard deviation) quoted as at 31 March 2018. Figures quoted in ZAR after all income reinvested and all costs deducted.
Long-term growth (equity only) 12.8%
10.7%Long-term growth (multi-asset)
Income and growth (multi-asset)
Income (multi-asset)
9.1%
9.8%
9.3%
EXPECTED RISK
EX
PEC
TE
D R
ETU
RN
14.6%
8.9%
5.9%
4.2%
1.8%
Top 20
Balanced Plus
Capital Plus
Balanced Defensive
Strategic Income
GROWTH OF R100 000 INVESTED IN OUR DOMESTIC FLAGSHIP FUNDS ON 1 JULY 2001
Value of R100 000 invested in Coronation’s domestic flagship funds since inception of Capital Plus on 1 July 2001 as at 31 March 2018. All income reinvested for funds; FTSE/JSE All Share Index is on a total return basis. Balanced Defensive is excluded as it was only launched on 2 February 2007.
Dec
01
Jun
02
Dec
02
Jun
03
Dec
03
Jun
04
Dec
04
Jun
05
Dec
05
Jun
06
Dec
06
Jun
07
Dec
07
Jun
08
Dec
08
Jun
09
Dec
09
Jun
10
Dec
10
Jun
11
Dec
11
Jun
12
Dec
12
Jun
13
Dec
13
Jun
14
Dec
14
Jun
15
Dec
15
Jun
16
Dec
16
Jun
01
R’000s
0
200
400
600
800
1 000
1 200
1 400
1 600Ju
n 17
Dec
17
Ma
r 18
All Share Index: R1 003 581
Inflation: R263 593
R1 473 383
R687 880
R940 114
R527 339
Source: Morningstar
Top 20 Balanced Plus Capital Plus Strategic Income FTSE/JSE All Share Index Inflation
Source: Morningstar

36 C O R O S P O N D E N T
International flagship fund range
INVESTOR NEED
DEPOSIT ALTERNATIVE CAPITAL PRESERVATIONLONG-TERM CAPITAL
GROWTH (MULTI-ASSET)
LONG-TERM CAPITAL GROWTH(EQUITY ONLY)
FUND1 GLOBAL STRATEGIC USD INCOME [ZAR]
FEEDER
GLOBAL STRATEGIC USD INCOMEUS dollar cash
(3 Month Libor)†
GLOBAL CAPITAL PLUS [ZAR] FEEDER
GLOBAL CAPITAL PLUS [FOREIGN CURRENCY]4
US dollar cash (3 Month Libor)†
GLOBAL MANAGED [ZAR] FEEDER
GLOBAL MANAGED [USD]
Composite (equities and bonds)†
GLOBAL OPPORTUNITIES
EQUITY [ZAR] FEEDER
GLOBAL OPPORTUNITIES
EQUITY [USD]MSCI ACWI†
GLOBAL EMERGING MARKETS FLEXIBLE
[ZAR]
GLOBAL EMERGING MARKETS [USD]
MSCI Emerging Markets Index†
FUND DESCRIPTION An intelligent alternative to dollar-denominated
bank deposits over periods of 12 months or
longer.
A low-risk global balanced fund reflecting
our best long-term global investment
view moderated for investors with smaller risk
budgets. We offer both hedged and houseview currency classes of this fund. In the case of the
former, the fund aims to preserve capital in the class currency over any
12-month period.
A global balanced fund reflecting our best long-term global investment
view for investors seeking to evaluate outcomes in hard currency terms. Will invest in different asset
classes and geographies, with a bias towards
growth assets in general and equities in particular.
A diversified portfolio of the best global equity
managers (typically 6-10) who share our investment philosophy. An ideal fund for investors who prefer to own just one global equity fund. Investors who want
to blend their international equity exposure may consider Coronation
Global Equity Select, which has more concentrated
exposure to our best global investment views.
Our top stock picks from companies providing exposure to emerging markets. The US dollar
fund remains fully invested in equities at
all times, while the rand fund will reduce equity
exposure when we struggle to find value.
INCOME VS GROWTH ASSETS2
INCOME GROWTH
95.9% 4.1%
62.2% 37.8%
31.9% 68.1%
0.3% 99.7%
1.9% 98.1%
LAUNCH DATE OF OLDEST FUND Dec 2011 Nov 2008 Oct 2009 Aug 1997 Dec 2007
ANNUAL RETURN3 (Since launch)
2.5%0.6%†
5.2%0.6%†
6.9%7.1%†
7.0%6.1%†
3.8%2.0%†
QUARTILE RANK (Since launch)
1st 1st 1st 1st 1st
ANNUAL RETURN3 (Last 5 years)
1.5%0.7%
1.9%0.7%
4.9%6.7%
8.2% 10.3%
3.4%5.2%
ANNUAL RETURN3 (Last 10 years)
5.7%6.5%
4.2%3.3%
QUARTILE RANK (Last 5 years)
– 3rd 2nd 2nd 3rd
FUND HIGHLIGHTS Outperformed US dollar cash by 1.9% p.a (after
fees) since launch in December 2011.
Outperformed US dollar cash by 4.6% p.a. (after
fees) since launch in 2008.
No. 1 global multi-asset high equity fund in South
Africa since launch in October 2009.
Both the rand and US dollar versions of the
fund have outperformed the global equity market with less risk since their
respective launch dates.
Both the rand and US dollar versions of the fund
outperformed the MSCI Emerging Markets Index by more than 1.7% p.a. since
their respective launch dates.
Collective Investment Schemes in Securities (unit trusts) are generally medium- to long-term investments. The value of participatory interests (units) may go down as well as up and past performance is not necessarily an indication of future performance. Participatory interests are traded at ruling prices and can engage in scrip lending and borrowing. Fluctuations or movements in exchange rates may cause the value of underlying investments to go up or down. A schedule of fees and charges is available on request from the management company. Pricing is calculated on a net asset value basis, less permissible deductions. Forward pricing is used. Commission and incentives may be paid and, if so, are included in the overall costs. Coronation is a member of the Association for Savings and Investment South Africa (ASISA).
1 Rand- and US dollar-denominated fund names are included for reference.2 Income versus growth assets as at 31 March 2018 (for US dollar funds). Growth assets defined as equities,
listed property and commodities (excluding gold).3 Returns quoted in US dollar for the oldest fund.
Highest annual return Global Strategic USD Income: 7.1% ( Jan 2012 – Dec 2012); Global Capital Plus [ZAR] Feeder: 31.4% (Mar 2009 – Feb
2010); Global Managed [ZAR] Feeder: 23.1% (Jul 2010 – Jun 2011); Global Emerging Markets Flexible [ZAR]: 56.9% (Apr 1999 – Mar 2000); Global Opportunities Equity [ZAR] Feeder: 96.0% (Mar 2009 – Feb 2010)
Lowest annual return Global Strategic USD Income: -1.0% (Mar 2015 – Feb 2016); Global Capital Plus [ZAR] Feeder: -7.0% (Mar 2015 – Feb 2016); Global Managed [ZAR] Feeder: -14.9% (Mar 2015 – Feb 2016); Global Emerging Markets Flexible [ZAR]: -41.3% (Mar 2008 – Feb 2009); Global Opportunities Equity [ZAR] Feeder: -51.9% (Mar 2008 – Feb 2009)
4 Available in US dollar Hedged (launched 1 December 2011), GBP Hedged (launched 1 December 2011), EUR Hedged (launched 1 December 2011) or Houseview currency class (launched 1 September 2009).
Figures are quoted from Morningstar as at 31 March 2018 for a lump sum investment and are calculated on a NAV-NAV basis
HAVE YOU CONSIDERED EXTERNALISING RANDS? IT IS EASIER THAN YOU MIGHT THINK.
The South African Reserve Bank allows each resident South African taxpayer to externalise funds of up to R11 million per calendar year (a
R10 million foreign capital allowance and a R1 million single discretionary allowance) for direct offshore investment in foreign currency denominated assets. If you want to invest more than R1 million, the process is as easy as:
1 Obtain approval from the South
African Revenue Service by completing the appropriate form available via eFiling or your local tax office. Approvals are valid for 12 months and relatively easy to obtain if you are a taxpayer in good standing.
2 Pick the mandate that is appropriate to your
needs from the range of funds listed here. You may find the ‘Choosing a Fund’ section or ‘Compare Funds’ tool on our website helpful, or you may want to consult your financial advisor if you need advice.
3 Complete the relevant application forms
and do a swift transfer to our US dollar subscription account. Your banker or a foreign exchange currency provider can assist with the forex transaction, while you can phone us on 0800 86 96 42, or read the FAQ on our website, at any time if you are uncertain.

37 A P R I L 2 0 1 8
100
90
110
120
130
140
150
160
170
$’000s
Oct
11
Jun
11
Feb
11
Jun
10
Feb
10
Jun
15
Feb
15
Oct
14
Jun
14
Feb
14
Oct
13
Jun
13
Feb
13
Oct
12
Jun
12
Feb
12
Oct
10
Oct
09
Oct
15
Feb
16
Jun
16
Oct
16
Feb
17
Jun
17
Dec
17
Ma
r 18
180
190
$178 043
$174 894
$131 372
$104 625
Source: Morningstar
Global Managed (USD) Feeder Global Managed Benchmark (USD) Global Capital Plus (USD) Feeder 3 Month USD LIBOR
RISK VERSUS RETURN
5-year annualised return and risk (standard deviation) quoted as at 31 March 2018. Figures quoted in USD (for the oldest fund) after all income reinvested and all costs deducted.
GEM Flexible [ZAR]GEM [USD]
Global Opportunities Equity [ZAR] Feeder Global Opportunities Equity [USD]
Global Managed [ZAR] FeederGlobal Managed [USD]
Global Capital Plus [ZAR] FeederGlobal Capital Plus [USD]
Global Strategic USD Income [ZAR] FeederGlobal Strategic USD Income
Source: Morningstar
3.4%
8.2%
4.9%
1.9%
1.5%
19.5%
11.8%
11.4%
6.3%
1.3%
Long-term growth (equity only)
Long-term growth (multi-asset)
Preservation (multi-asset)
Cash deposit alternative (multi-asset)
EXPECTED RISK
EX
PEC
TE
D R
ETU
RN
GROWTH OF $100 000 INVESTED IN OUR GLOBAL MULTI-ASSET FUNDS ON 29 OCTOBER 2009
Value of $100 000 invested in Global Managed [ZAR] Feeder and Global Capital Plus [ZAR] Feeder since inception of Global Managed [ZAR] Feeder on 29 October 2009. All returns quoted in USD. All income reinvested for funds. MSCI World Index is on a total return basis.

38 C O R O S P O N D E N T
Long-term investment track record
CORONATION EQUITY RETURNS VS EQUITY BENCHMARK
5-YEAR ANNUALISED RETURNS CORONATION EQUITY EQUITY BENCHMARK ALPHA
2000 15.66% 6.17% 9.49%
2001 12.37% 9.38% 2.99%
2002 12.15% 7.14% 5.01%
2003 14.63% 13.49% 1.14%
2004 13.82% 10.46% 3.36%
2005 23.32% 19.44% 3.88%
2006 26.84% 23.91% 2.93%
2007 31.53% 30.40% 1.12%
2008 20.70% 20.09% 0.60%
2009 19.31% 19.37% (0.06%)
2010 15.97% 15.12% 0.85%
2011 9.83% 8.65% 1.18%
2012 11.54% 10.60% 0.94%
2013 22.51% 20.60% 1.91%
2014 17.58% 17.78% (0.20%)
2015 13.76% 14.72% (0.96%)
2016 14.11% 14.44% (0.33%)
2017 12.45% 12.29% 0.16%
4 years 3 months to 31 March 2018 6.54% 8.39% (1.85%)
ANNUALISED TO 31 MARCH 2018
1 year 5.63% 8.03% (2.40%)
3 years 4.41% 4.51% (0.10%)
5 years 9.75% 10.84% (1.09%)
10 years 11.87% 10.94% 0.94%
Since inception in October 1993 annualised 16.01% 13.11% 2.91%
Average outperformance per 5-year return 1.69%
Number of 5-year periods outperformed 14.00
Number of 5-year periods underperformed 5.00
An investment of R100 000 in Coronation Equity on 15 April 1996 would have grown to R2 592 594 by 31 March 2018. By comparison, the returns generated by the fund’s benchmark over the same period would have grown a similar investment to R1 487 086, while the average competitor would have grown a similar investment to R1 592 538.
CUMULATIVE PERFORMANCE ANNUALISED RETURNS TO 31 MARCH 2018
100
600
1 100
1 600
2 100
2 600
3 100
Ap
r 17
Dec
17
Ma
r18
Ap
r 16
Ap
r 15
Ap
r 14
Ap
r 13
Ap
r 12
Ap
r 11
Ap
r 10
Ap
r 09
Ap
r 08
Ap
r 07
Ap
r 06
Ap
r 05
Ap
r 04
Ap
r 03
Ap
r 02
Ap
r 01
Ap
r 00
Ap
r 99
Ap
r 98
Ap
r 97
Ap
r 96
Coronation Equity Fund Equity benchmarkCoronation Equity SA equity general mean Coronation Equity Fund benchmark
R’000s %
0
5
10
15
20
Since inceptionannualised
10 years5 years3 years1 year
Source: Morningstar Source: Morningstar

39 A P R I L 2 0 1 8
CORONATION BALANCED PLUS FUND VS INFLATION AND AVERAGE COMPETITOR*
5-YEAR ANNUALISED RETURNS CORONATION BALANCED PLUS INFLATION REAL RETURN
2000 16.00% 7.90% 8.10%
2001 14.38% 7.41% 6.97%
2002 10.73% 8.04% 2.69%
2003 14.68% 7.33% 7.35%
2004 13.82% 6.68% 7.14%
2005 20.53% 5.85% 14.68%
2006 22.43% 5.54% 16.89%
2007 25.35% 5.17% 20.18%
2008 19.28% 6.41% 12.87%
2009 17.60% 6.82% 10.77%
2010 13.97% 6.71% 7.26%
2011 9.49% 6.94% 2.55%
2012 10.81% 6.36% 4.45%
2013 17.98% 5.39% 12.58%
2014 15.57% 5.19% 10.38%
2015 14.05% 5.54% 8.51%
2016 12.69% 5.67% 7.02%
2017 11.27% 5.48% 5.79%
4 years 3 months to 31 March 2018 6.59% 5.60% 0.99%
ANNUALISED TO 31 MARCH 2018 CORONATION BALANCED PLUS AVERAGE COMPETITOR ALPHA
1 year 4.79% 3.41% 1.38%
3 years 4.15% 3.38% 0.77%
5 years 8.88% 7.40% 1.48%
10 years 10.66% 7.93% 2.72%
Since inception in April 1996 annualised 14.81% 12.42% 2.39%
Average 5-year real return 8.80%
Number of 5-year periods where the real return is >10% 7.00
Number of 5-year periods where the real return is 5% - 10% 8.00
Number of 5-year periods where the real return is 0% - 5% 4.00
* Median of Peer Group is the median of the fully-discretionary retirement portfolios of the largest managers as published in performance surveys and calculated by Coronation Fund Managers.
An investment of R100 000 in Coronation Balanced Plus on 15 April 1996 would have grown to R2 064 613 by 31 March 2018. By comparison, the South African multi-asset high-equity sector over the same period would have grown a similar investment to R1 301 918.
CUMULATIVE PERFORMANCE ANNUALISED RETURNS TO 31 MARCH 2018
500
0
2 000
1 500
1 000
2 500
Coronation Balanced Plus Average competitorCoronation Balanced Plus SA MA High Equity Mean CPI
R’000s %
0
4
2
8
6
10
12
16
14
18
Since inceptionannualised
10 years5 years3 years1 year
Ap
r 17
Dec
17
Ma
r 18
Ap
r 16
Ap
r 15
Ap
r 14
Ap
r 13
Ap
r 12
Ap
r 11
Ap
r 10
Ap
r 09
Ap
r 08
Ap
r 07
Ap
r 06
Ap
r 05
Ap
r 04
Ap
r 03
Ap
r 02
Ap
r 01
Ap
r 00
Ap
r 99
Ap
r 98
Ap
r 97
Ap
r 96
Source: Morningstar Source: Morningstar


![Neutral Citation Number: [2018] EWHC 1208 (QB)fy68w4dd72j1r1z33vbuky14-wpengine.netdna-ssl.com/wp-content/... · Alexander Antelme QC, Michael Spencer QC, David Myhill, Richard Sage](https://img.pdfslide.net/doc/110x75/5b9a723609d3f2dc408b5743/neutral-citation-number-2018-ewhc-1208-qbfy68w4dd72j1r1z33vbuky14-alexander.jpg)


![L’ESPÈCE HUMAINE de Robert Antelme...4 lorem ipsum :: [Date] 4 PROJET DE CRÉATION – L’ESPÈCE HUMAINE DE ROBERT ANTELME – Les présentations de cette création autour de](https://img.pdfslide.net/doc/110x75/5fedbff0fa46ad341c30836b/laespce-humaine-de-robert-antelme-4-lorem-ipsum-date-4-projet-de-cration.jpg)