Embed Size (px)
Citation preview
Corona Discharge Ion Mobility Spectrometry with OrthogonalAcceleration Time of Flight Mass Spectrometry for Monitoring ofVolatile Organic CompoundsMartin Sabo and Stefan Matejcík*
Comenius University, Faculty of Mathematics, Physics and Informatics, Department of Experimental Physics, Mlynska dolina F2 84248 Bratislava, Slovakia
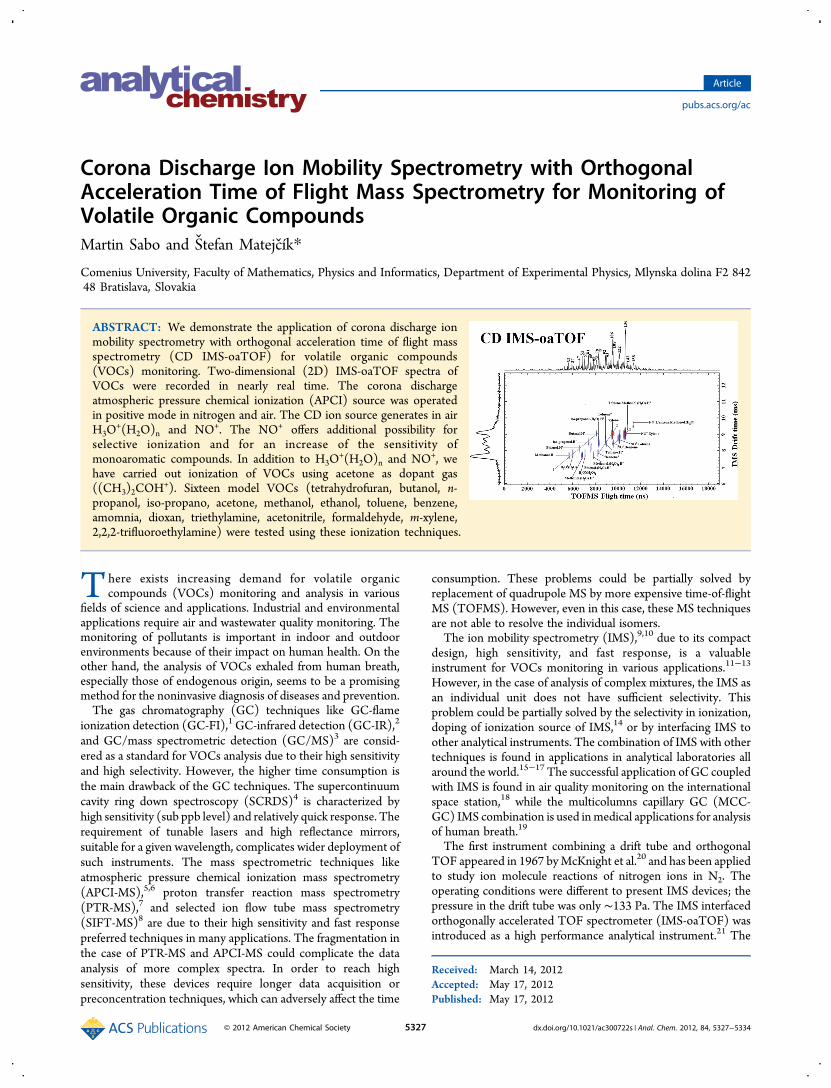
ABSTRACT: We demonstrate the application of corona discharge ionmobility spectrometry with orthogonal acceleration time of flight massspectrometry (CD IMS-oaTOF) for volatile organic compounds(VOCs) monitoring. Two-dimensional (2D) IMS-oaTOF spectra ofVOCs were recorded in nearly real time. The corona dischargeatmospheric pressure chemical ionization (APCI) source was operatedin positive mode in nitrogen and air. The CD ion source generates in airH3O
+(H2O)n and NO+. The NO+ offers additional possibility forselective ionization and for an increase of the sensitivity ofmonoaromatic compounds. In addition to H3O
+(H2O)n and NO+, wehave carried out ionization of VOCs using acetone as dopant gas((CH3)2COH
+). Sixteen model VOCs (tetrahydrofuran, butanol, n-propanol, iso-propano, acetone, methanol, ethanol, toluene, benzene,amomnia, dioxan, triethylamine, acetonitrile, formaldehyde, m-xylene,2,2,2-trifluoroethylamine) were tested using these ionization techniques.
There exists increasing demand for volatile organiccompounds (VOCs) monitoring and analysis in various
fields of science and applications. Industrial and environmentalapplications require air and wastewater quality monitoring. Themonitoring of pollutants is important in indoor and outdoorenvironments because of their impact on human health. On theother hand, the analysis of VOCs exhaled from human breath,especially those of endogenous origin, seems to be a promisingmethod for the noninvasive diagnosis of diseases and prevention.The gas chromatography (GC) techniques like GC-flame
ionization detection (GC-FI),1 GC-infrared detection (GC-IR),2
and GC/mass spectrometric detection (GC/MS)3 are consid-ered as a standard for VOCs analysis due to their high sensitivityand high selectivity. However, the higher time consumption isthe main drawback of the GC techniques. The supercontinuumcavity ring down spectroscopy (SCRDS)4 is characterized byhigh sensitivity (sub ppb level) and relatively quick response. Therequirement of tunable lasers and high reflectance mirrors,suitable for a given wavelength, complicates wider deployment ofsuch instruments. The mass spectrometric techniques likeatmospheric pressure chemical ionization mass spectrometry(APCI-MS),5,6 proton transfer reaction mass spectrometry(PTR-MS),7 and selected ion flow tube mass spectrometry(SIFT-MS)8 are due to their high sensitivity and fast responsepreferred techniques in many applications. The fragmentation inthe case of PTR-MS and APCI-MS could complicate the dataanalysis of more complex spectra. In order to reach highsensitivity, these devices require longer data acquisition orpreconcentration techniques, which can adversely affect the time
consumption. These problems could be partially solved byreplacement of quadrupole MS by more expensive time-of-flightMS (TOFMS). However, even in this case, these MS techniquesare not able to resolve the individual isomers.The ion mobility spectrometry (IMS),9,10 due to its compact
design, high sensitivity, and fast response, is a valuableinstrument for VOCs monitoring in various applications.11−13
However, in the case of analysis of complex mixtures, the IMS asan individual unit does not have sufficient selectivity. Thisproblem could be partially solved by the selectivity in ionization,doping of ionization source of IMS,14 or by interfacing IMS toother analytical instruments. The combination of IMS with othertechniques is found in applications in analytical laboratories allaround the world.15−17 The successful application of GC coupledwith IMS is found in air quality monitoring on the internationalspace station,18 while the multicolumns capillary GC (MCC-GC) IMS combination is used inmedical applications for analysisof human breath.19
The first instrument combining a drift tube and orthogonalTOF appeared in 1967 byMcKnight et al.20 and has been appliedto study ion molecule reactions of nitrogen ions in N2. Theoperating conditions were different to present IMS devices; thepressure in the drift tube was only ∼133 Pa. The IMS interfacedorthogonally accelerated TOF spectrometer (IMS-oaTOF) wasintroduced as a high performance analytical instrument.21 The
Received: March 14, 2012Accepted: May 17, 2012Published: May 17, 2012
Article
pubs.acs.org/ac
© 2012 American Chemical Society 5327 dx.doi.org/10.1021/ac300722s | Anal. Chem. 2012, 84, 5327−5334
IMS-oaTOF spectrometry with MALDI and ESI ionizationsources was used for lipid, peptide, nucleotide, and human bloodanalysis.22−24 Traveling wave IMS-MS (TWIMS-MS) withthermal desorption ESI ionization source was presented in arecent publication by Reynolds et al.25 for detection of VOCs inhuman breath.The corona discharge (CD) ion source offers, in contrast to
conventional (radioactive) ion sources used with IMS in air, anadditional versatility. In addition to the chemical ionization viaproton transfer H3O
+(H2O)n, the CD ion source generates NO+
ions, which offer an additional selective ionization channel. Inthis paper, we discuss in detail the processes associated with
ionization of selected VOCs with CD ion source anddemonstrate the VOCs analysis by linear CD IMS-oaTOF.
■ EXPERIMENTAL SECTION
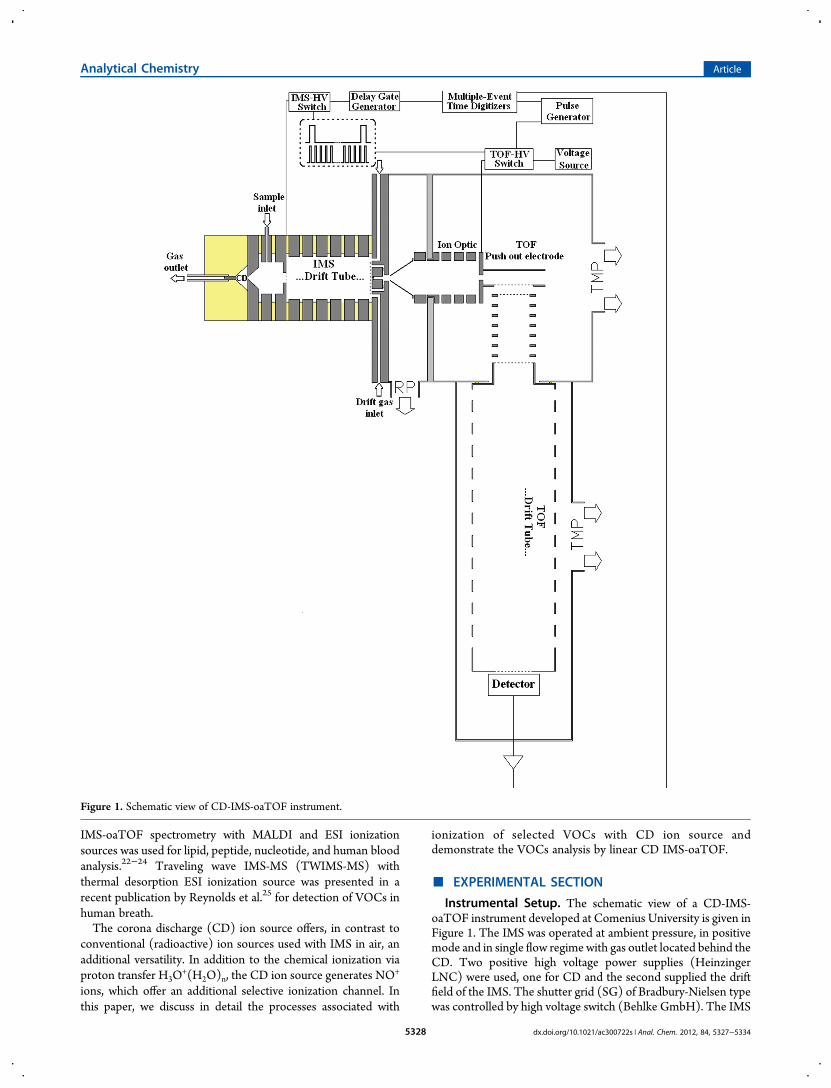
Instrumental Setup. The schematic view of a CD-IMS-oaTOF instrument developed at Comenius University is given inFigure 1. The IMS was operated at ambient pressure, in positivemode and in single flow regime with gas outlet located behind theCD. Two positive high voltage power supplies (HeinzingerLNC) were used, one for CD and the second supplied the driftfield of the IMS. The shutter grid (SG) of Bradbury-Nielsen typewas controlled by high voltage switch (Behlke GmbH). The IMS
Figure 1. Schematic view of CD-IMS-oaTOF instrument.
Analytical Chemistry Article
dx.doi.org/10.1021/ac300722s | Anal. Chem. 2012, 84, 5327−53345328
typically operated with drift field 430 V/cm; the SG gate wasopen for 110 μs with a period of 15 ms, and the operationtemperature was 317 K. The detailed description of CD-IMS wasgiven in our previous work.26
The IMS was interfaced to a differential pumping systemthrough a 100 μm pinhole in the collector. The differentialpumping system consists of three vacuum chambers. The firstone was pumped by two rotary pumps (Pfeiffer Vacuum overallpumping speed, 30 m3/h) to the pressure of 10−1 mbar. Thesecond one was pumped by a turbo molecular pump with apumping speed of 330 L·s−1 (Pfeiffer Vacuum) to the pressure of10−5 mbar. The third chamber was also pumped by a turbomolecular pump with a pumping speed of 250 L·s−1 (PfeifferVacuum) to the pressure of 5 × 10⁻⁶ mbar. For more details ofour differential pumping system, please refer to ref 27.The ions that passed through the 100 μm pinhole of the IMS
collector were guided by the ion optic (IO) located in the secondvacuum chamber, to the orthogonal acceleration chamber oflinear time-of-flight mass spectrometer,28 located in the thirdvacuum chamber. The ion optic consists of the skimmer and fiveelectrodes; the operation potential of the skimmer was −3.2 V,and the potential of the remaining electrodes was below −15 V.The orthogonal acceleration chamber of TOF consists of twoparallel electrodes. The distance between the electrodes is 5 mmwith 2 mm entrance slit (Figure 1). The rear electrode of theorthogonal acceleration chamber of TOF serves as a push outelectrode, while the front one was partially shielded by thestainless steel mesh with a transmittance of 60%. The ionsshuttered from this region were uniformly accelerated to the drifttube of a oaTOF spectrometer. The acceleration region ofoaTOF29 contains seven electrodes at 7 mm separation betweenthe electrodes, interconnected by the high precision vacuumresistors. The drift tube of the oaTOF was constructed from astainless steel perforated tube of total length of 547 mm. Themultichannel plate (MCP) detector (Tectra) was used. Thesignal from the detector was processed by a preamplifier (Ortec9301) and collected by a multiscaler PCI card (FASTComTecGmbH, model P-7888). The TOF was calibrated byFASTComTec software delivered with the multiscaler PCI card.The push out electrode was pulsed with the 25 μs period and
10 μs pulse width. The push out electrode was controlled by ahigh voltage transistor switch (Behlke GmbH) managed by apulse generator (HAMEG HM8035). The pulse generator wasalso used for the triggering of a multiscaler PCI card. Themultiscaler PCI card was able to generate a synchronic TTLsignal additionally modified by a delay gate generator(TENELEC, TC410A) to manage the high voltage switch(Behlke GmbH) of IMS, as it is schematically depicted on Figure1. Thus, the IMS was synchronically operated with the TOFspectrometer.Author: The present CD IMS-oaTOF instrument was able to
operate in three modes: in “Single IMS” mode, in “Single TOF”mode when the SG of IMS was fully open, and in the two-dimensional “2D mode” used when the IMS and TOFspectrometers were operated synchronically. The limits ofdetection which will be discussed in more detail in the nextsections were determined for Single IMS mode with dataacquisition time of several seconds. This limit of detection can beachieved as well in Single TOF and 2D mode. The highselectivity in the Single TOF and 2D modes is on the costs ofincreasing data acquisition time to ∼1 or ∼5 min, respectively.Operation parameters of the IMS-oaTOF system are summar-ized in Table 1.
Gases and Chemicals. The gases used in this experimentwere N2 and O2 obtained from Linde Gas with purity up to 5.0(99.999%). The gases were additionally purified by molecularsieve trap (Aglinet) in order to reduce water concentration downto 14 ppb. The drift gas flowwas 500mL/min, and carrier samplegas stream was 100 mL/min during the experiment.The chemicals used in this study, tetrahydrofuran, butanol, n-
propanol, iso-propano, acetone, methanol, ethanol, toluene,benzene, amomnia, dioxan, triethylamine, acetonitrile, form-aldehyde,m-xylene, and 2,2,2-trifluoroethylamine, were obtainedfrom different suppliers with stated purity up to 99%. Dilutedvapors of the chemicals were dosed to the reaction region of theIMS instrument by the syringe pumps (Kent Scientific, GeniePlus). In order to prevent diffusion, the syringe tip was interfacedto a 15 cm long stainless steel capillary with an inner diameter of0.2 mm.
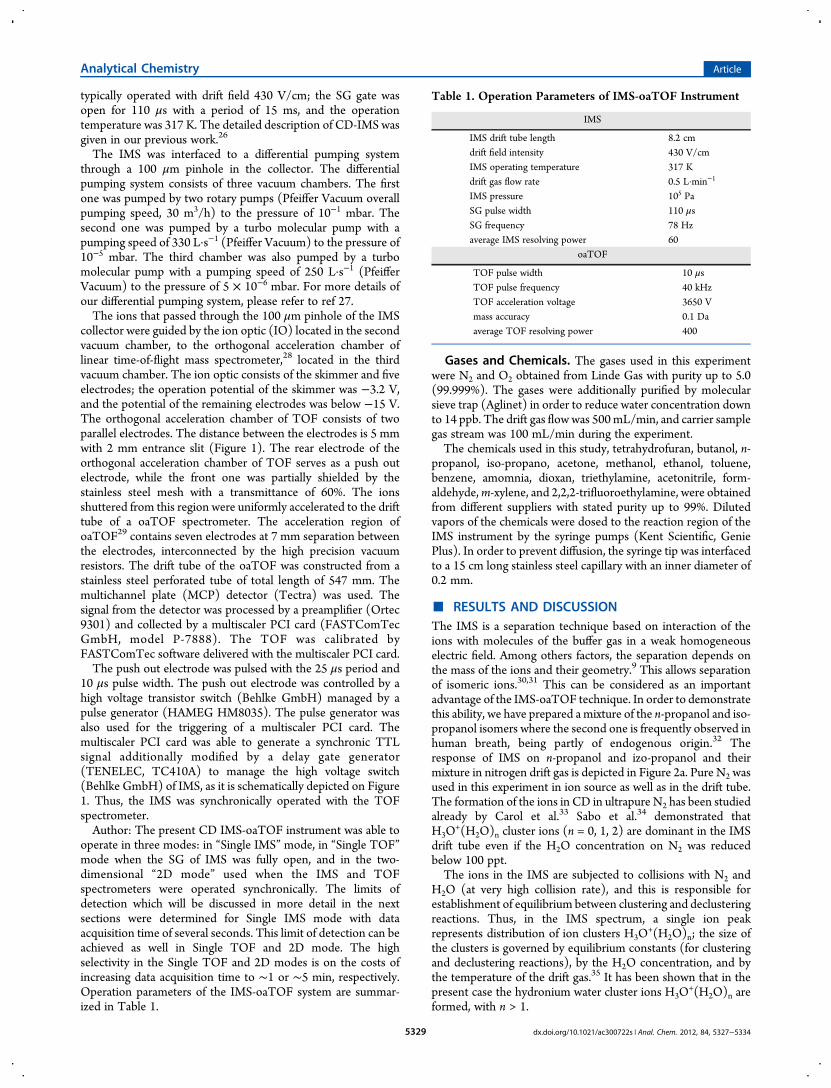
■ RESULTS AND DISCUSSIONThe IMS is a separation technique based on interaction of theions with molecules of the buffer gas in a weak homogeneouselectric field. Among others factors, the separation depends onthe mass of the ions and their geometry.9 This allows separationof isomeric ions.30,31 This can be considered as an importantadvantage of the IMS-oaTOF technique. In order to demonstratethis ability, we have prepared a mixture of the n-propanol and iso-propanol isomers where the second one is frequently observed inhuman breath, being partly of endogenous origin.32 Theresponse of IMS on n-propanol and izo-propanol and theirmixture in nitrogen drift gas is depicted in Figure 2a. Pure N2 wasused in this experiment in ion source as well as in the drift tube.The formation of the ions in CD in ultrapure N2 has been studiedalready by Carol et al.33 Sabo et al.34 demonstrated thatH3O
+(H2O)n cluster ions (n = 0, 1, 2) are dominant in the IMSdrift tube even if the H2O concentration on N2 was reducedbelow 100 ppt.The ions in the IMS are subjected to collisions with N2 and
H2O (at very high collision rate), and this is responsible forestablishment of equilibrium between clustering and declusteringreactions. Thus, in the IMS spectrum, a single ion peakrepresents distribution of ion clusters H3O
+(H2O)n; the size ofthe clusters is governed by equilibrium constants (for clusteringand declustering reactions), by the H2O concentration, and bythe temperature of the drift gas.35 It has been shown that in thepresent case the hydronium water cluster ions H3O
+(H2O)n areformed, with n > 1.
Table 1. Operation Parameters of IMS-oaTOF Instrument
IMS
IMS drift tube length 8.2 cmdrift field intensity 430 V/cmIMS operating temperature 317 Kdrift gas flow rate 0.5 L·min−1
IMS pressure 105 PaSG pulse width 110 μsSG frequency 78 Hzaverage IMS resolving power 60
oaTOF
TOF pulse width 10 μsTOF pulse frequency 40 kHzTOF acceleration voltage 3650 Vmass accuracy 0.1 Daaverage TOF resolving power 400
Analytical Chemistry Article
dx.doi.org/10.1021/ac300722s | Anal. Chem. 2012, 84, 5327−53345329
The ionization of the propanol isomers can proceed via protontransfer reaction:
+ → ++ +H O (H O) M MH products3 2 n (1)
as well as via the switching reaction:
+ → · ++ +H O (H O) M M H O products3 2 n 3 (2)
The reaction 1 is followed by further clustering:
+ + → ++ +MH M N M H N2 2 2 (3)
The two peaks of n-propanol with reduced mobilities of 1.92and 1.71 cm2V−1s−1 correspond to protonated monomers[M·(H2O)n·H
+] (n = 0, 1) and its dimer [M2·H+] ions,
respectively. On other hand, the protonated izo-propanolmonomer and its dimer possess reduced mobilities of 1.97 and1.76 cm2V−1s−1 (Figure 2a).The protonated monomers [M·(H2O)·H
+] are resolved aswell, if a mixture of these two isomers is introduced to thereaction chamber of IMS. In contrast to IMS spectra of isolatedmolecules, in the case of a mixture, a dimer peak with reducedmobility of 1.74 cm2V−1s−1 is formed, which is located in thecenter between the dimer peaks of isolated substances (Figure2a). This suggests formation of an asymmetric dimer complexcomposed of both propanol isomers. The width of this peakindicates that besides asymmetric dimer still nonasymmetric
dimer ions are present. The monomer peaks are also resolved byIMS-oaTOF spectrometry, as we can see from the 2Dmap in theFigure 2b. This demonstrates the selectivity of IMS-oaTOFtechnique toward the isomers. The high selectivity of IMS-oaTOF can be effectively used in applications where analysis ofmore complex spectra is required, as it has high selectivity notonly against isomer but also against isobaric molecules.The monitoring of monoaromatic VOCs like benzene,
toluene, and m-xylene (BTX) has become a case of interest invarious fields of environmental36−38 and medical applications.32
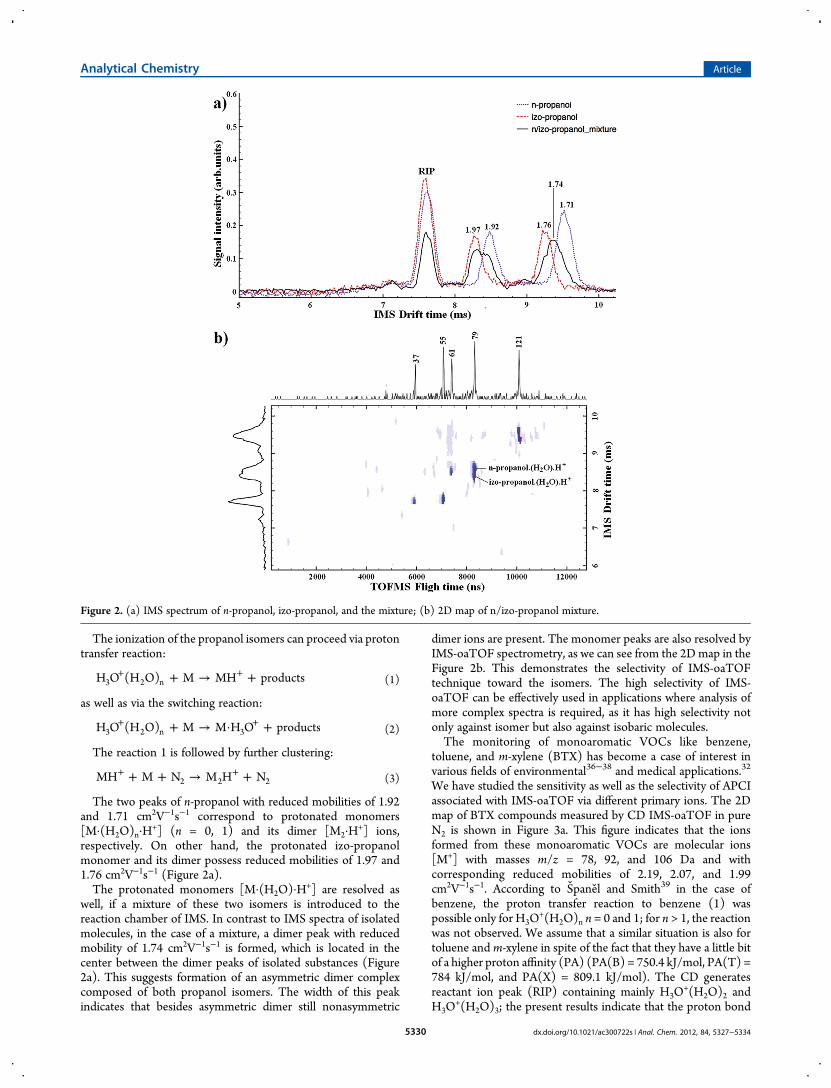
We have studied the sensitivity as well as the selectivity of APCIassociated with IMS-oaTOF via different primary ions. The 2Dmap of BTX compounds measured by CD IMS-oaTOF in pureN2 is shown in Figure 3a. This figure indicates that the ionsformed from these monoaromatic VOCs are molecular ions[M+] with masses m/z = 78, 92, and 106 Da and withcorresponding reduced mobilities of 2.19, 2.07, and 1.99cm2V−1s−1. According to Spanel and Smith39 in the case ofbenzene, the proton transfer reaction to benzene (1) waspossible only for H3O
+(H2O)n n = 0 and 1; for n > 1, the reactionwas not observed. We assume that a similar situation is also fortoluene and m-xylene in spite of the fact that they have a little bitof a higher proton affinity (PA) (PA(B) = 750.4 kJ/mol, PA(T) =784 kJ/mol, and PA(X) = 809.1 kJ/mol). The CD generatesreactant ion peak (RIP) containing mainly H3O
+(H2O)2 andH3O
+(H2O)3; the present results indicate that the proton bond
Figure 2. (a) IMS spectrum of n-propanol, izo-propanol, and the mixture; (b) 2D map of n/izo-propanol mixture.
Analytical Chemistry Article
dx.doi.org/10.1021/ac300722s | Anal. Chem. 2012, 84, 5327−53345330

energy in RIP ions exceed the PA of BTX compounds. Theabsence of switching reaction 2 indicates that as well thehydronium ion bond to water in the RIP exceeds those to theBTX. This is the reason why the proton transfer reaction 1 as wellas the switching reaction 2 are not operative in CD in pure N2.We explain the detection of M+ ions in MS by dissociative chargetransfer reaction:
+ → + + ++ +H O (H O) M M H H O (H O)3 2 n 2 2 n (4)
We have evaluated the limit of detection (LOD) for BTX forCD ion source in pure nitrogen for H3O
+(H2O)n chemicalionization; the values determined were 37 ppb for benzene, 41ppb for toluene, and 72 ppb form-xylene. The sensitivity of IMS-oaTOF is relatively low for H3O
+(H2O)n ionization. We maycompare it with the PTR-MS technique byWarneke et al.40 Theyreported for benzene and toluene a LOD of 9 and 5 ppt,respectively. Huang et al.6 reported a LOD of 0.2 and 0.5 ppb forbenzene and toluene, respectively, using the APCI-MStechnique. The high sensitivity of PTR-MS is due to chemicalionization with H3O
+ and H3O+(H2O), which are able to ionize
these compounds by proton transfer reaction. The low sensitivityof IMS-oaTOF is due to formation of large cluster ionsH3O
+(H2O)n with n ≥ 1 in CD and inability of these clustersto ionize BTX. The ionization via reaction 4 is inefficient.
The situation improves, if we switch to synthetic air as workinggas in the CD and IMS. The CD generates in this case twodifferent groups of primary ions H3O
+(H2O)n and NO+. Thereactions of NO+ primary ions with analytes result in appearanceof [M·NO+] ions in the mass spectra (Figure 3b), which areformed via association reaction in the presence of the working gasN2 or O2:
+ + → · ++ +NO M N M NO N2 2 (5)
The association reaction of NO+ with molecules has beenintensively studied by Spanel and Smith using selected ion flowtube (SIFT) for large classes of organic compounds (please seeSpanel and Smith41 and the references therein). Recently, thePTR-MS instrument was modified in order to allow O2
+ andNO+ for chemical ionization (Jordan et al.42). The application ofNO+ chemical ionization in IMS was reported by Karasek et al.43
who used radioactive ion sources and the NO+ reactant ionintensity depended onNO admixture to zero air. Borsdorf et al.30
reported ionization NO+·(H2O)n formed in CD and its reactivityto toluene.The formation of the NO+ in the positive CD in air can be
considered as an important aspect of the CD ionization source incomparison to the widely used radioactive sources. The NO+
yield from CD in air depends on many discharge parameters like:
Figure 3. (a) 2D map of BTX molecular ions measured in pure N2; (b) 2D map of BTX molecular and NO+ adducts ions measured in zero air.
Analytical Chemistry Article
dx.doi.org/10.1021/ac300722s | Anal. Chem. 2012, 84, 5327−53345331
discharge power, gas flow speed, flow direction, and manyothers.44,45 The CD source used in this study was designed forefficient removal of the radicals from CD gap26 and thus notoptimized for NO+ generation; the total NO+ yield from our CDwas only 22% for high CD power. However, also, this NO+ yieldresults in a significant increase in the sensitivity for BTXcompounds. The LOD for [M·NO+] product ions wasdetermined to be 1.5 ppb for benzene, 1.4 ppb for toluene, and2.6 ppb form-xylene. The 2D plot of BTX compounds at 0.1 ppmconcentration obtained in zero air is shown in Figure 3b. Theions with reduced mobilities 2.14, 1.95, and 1.81 cm2V−1s−1 andmasses m/z = 78, 92, and 106 Da were assigned to molecularBTX ions [M+] while the ions with reduced mobilities 2.0, 1.87,and 1.79 cm2V−1s−1 and masses m/z = 108, 122, and 136 Da towere assigned to [M·NO+] ions. The ability of CD in air toproduce NO+ thus offers an additional way to detect thechemicals via reaction 5. This advantage may be very desirable formore complex analytical tasks.An important feature of the IMS-oaTOF instruments is the
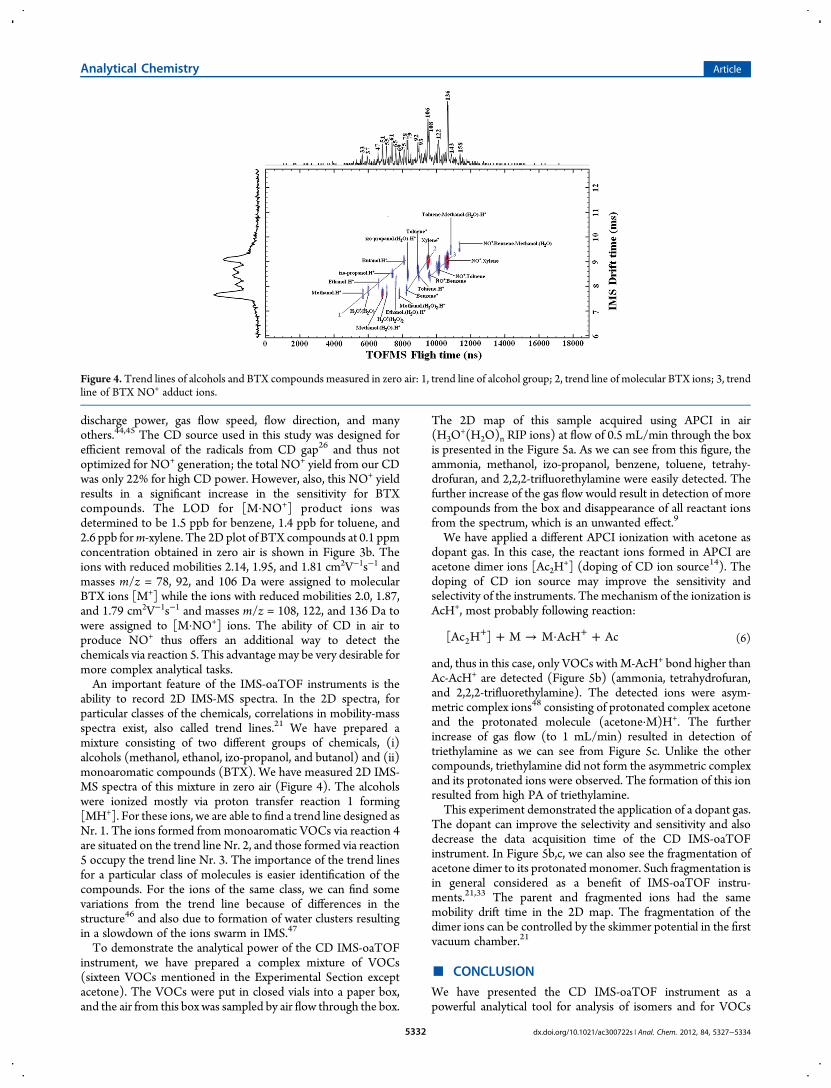
ability to record 2D IMS-MS spectra. In the 2D spectra, forparticular classes of the chemicals, correlations in mobility-massspectra exist, also called trend lines.21 We have prepared amixture consisting of two different groups of chemicals, (i)alcohols (methanol, ethanol, izo-propanol, and butanol) and (ii)monoaromatic compounds (BTX). We have measured 2D IMS-MS spectra of this mixture in zero air (Figure 4). The alcoholswere ionized mostly via proton transfer reaction 1 forming[MH+]. For these ions, we are able to find a trend line designed asNr. 1. The ions formed from monoaromatic VOCs via reaction 4are situated on the trend line Nr. 2, and those formed via reaction5 occupy the trend line Nr. 3. The importance of the trend linesfor a particular class of molecules is easier identification of thecompounds. For the ions of the same class, we can find somevariations from the trend line because of differences in thestructure46 and also due to formation of water clusters resultingin a slowdown of the ions swarm in IMS.47
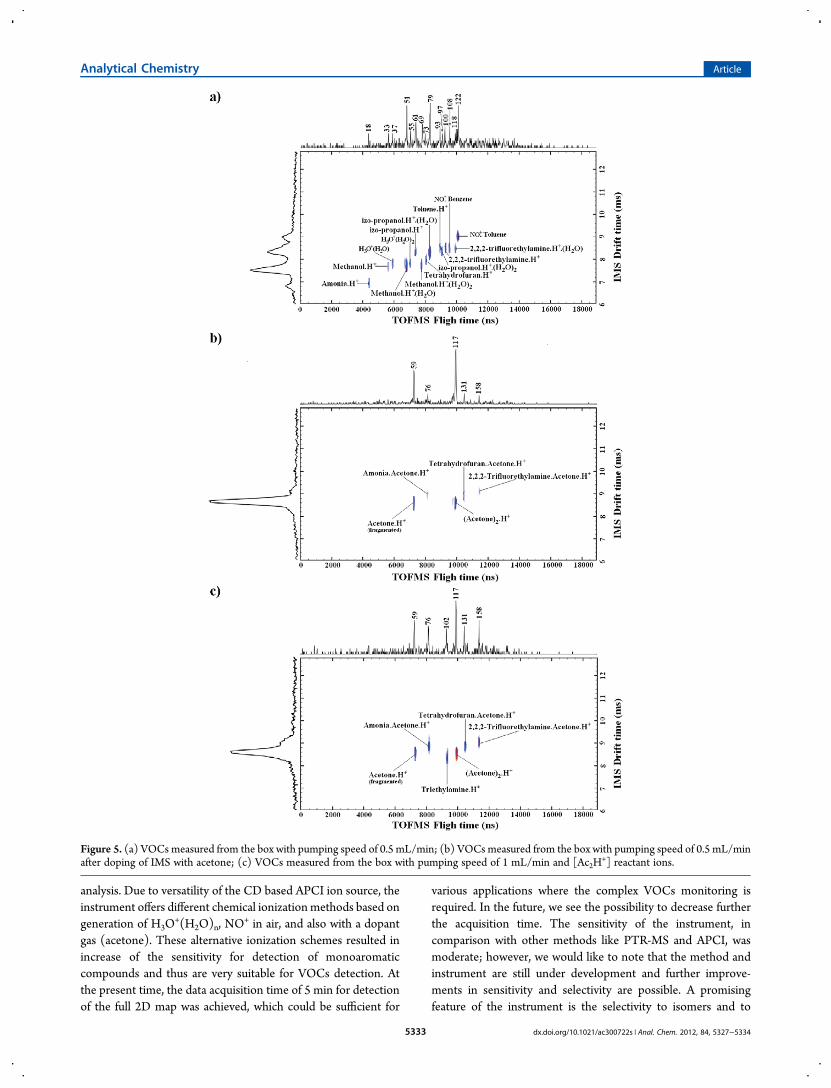
To demonstrate the analytical power of the CD IMS-oaTOFinstrument, we have prepared a complex mixture of VOCs(sixteen VOCs mentioned in the Experimental Section exceptacetone). The VOCs were put in closed vials into a paper box,and the air from this box was sampled by air flow through the box.
The 2D map of this sample acquired using APCI in air(H3O
+(H2O)n RIP ions) at flow of 0.5 mL/min through the boxis presented in the Figure 5a. As we can see from this figure, theammonia, methanol, izo-propanol, benzene, toluene, tetrahy-drofuran, and 2,2,2-trifluorethylamine were easily detected. Thefurther increase of the gas flow would result in detection of morecompounds from the box and disappearance of all reactant ionsfrom the spectrum, which is an unwanted effect.9
We have applied a different APCI ionization with acetone asdopant gas. In this case, the reactant ions formed in APCI areacetone dimer ions [Ac2H
+] (doping of CD ion source14). Thedoping of CD ion source may improve the sensitivity andselectivity of the instruments. The mechanism of the ionization isAcH+, most probably following reaction:
+ → · ++ +[Ac H ] M M AcH Ac2 (6)
and, thus in this case, only VOCs with M-AcH+ bond higher thanAc-AcH+ are detected (Figure 5b) (ammonia, tetrahydrofuran,and 2,2,2-trifluorethylamine). The detected ions were asym-metric complex ions48 consisting of protonated complex acetoneand the protonated molecule (acetone·M)H+. The furtherincrease of gas flow (to 1 mL/min) resulted in detection oftriethylamine as we can see from Figure 5c. Unlike the othercompounds, triethylamine did not form the asymmetric complexand its protonated ions were observed. The formation of this ionresulted from high PA of triethylamine.This experiment demonstrated the application of a dopant gas.
The dopant can improve the selectivity and sensitivity and alsodecrease the data acquisition time of the CD IMS-oaTOFinstrument. In Figure 5b,c, we can also see the fragmentation ofacetone dimer to its protonated monomer. Such fragmentation isin general considered as a benefit of IMS-oaTOF instru-ments.21,33 The parent and fragmented ions had the samemobility drift time in the 2D map. The fragmentation of thedimer ions can be controlled by the skimmer potential in the firstvacuum chamber.21
■ CONCLUSION
We have presented the CD IMS-oaTOF instrument as apowerful analytical tool for analysis of isomers and for VOCs
Figure 4. Trend lines of alcohols and BTX compounds measured in zero air: 1, trend line of alcohol group; 2, trend line of molecular BTX ions; 3, trendline of BTX NO+ adduct ions.
Analytical Chemistry Article
dx.doi.org/10.1021/ac300722s | Anal. Chem. 2012, 84, 5327−53345332
analysis. Due to versatility of the CD based APCI ion source, theinstrument offers different chemical ionizationmethods based ongeneration of H3O
+(H2O)n, NO+ in air, and also with a dopant
gas (acetone). These alternative ionization schemes resulted inincrease of the sensitivity for detection of monoaromaticcompounds and thus are very suitable for VOCs detection. Atthe present time, the data acquisition time of 5 min for detectionof the full 2D map was achieved, which could be sufficient for
various applications where the complex VOCs monitoring isrequired. In the future, we see the possibility to decrease furtherthe acquisition time. The sensitivity of the instrument, incomparison with other methods like PTR-MS and APCI, wasmoderate; however, we would like to note that the method andinstrument are still under development and further improve-ments in sensitivity and selectivity are possible. A promisingfeature of the instrument is the selectivity to isomers and to
Figure 5. (a) VOCs measured from the box with pumping speed of 0.5 mL/min; (b) VOCs measured from the box with pumping speed of 0.5 mL/minafter doping of IMS with acetone; (c) VOCs measured from the box with pumping speed of 1 mL/min and [Ac2H
+] reactant ions.
Analytical Chemistry Article
dx.doi.org/10.1021/ac300722s | Anal. Chem. 2012, 84, 5327−53345333
isobaric molecules. This could find future applications in thefields of VOCs analysis for environmental, industrial, andmedicalapplications.
■ AUTHOR INFORMATIONCorresponding Author*E-mail: [email protected]. Fax:+421-2-65429980.NotesThe authors declare no competing financial interest.
■ ACKNOWLEDGMENTSThis work was supported by Slovak research and development398 agency contract Nr. LPP-0143-06, APVV-0733-11 and grantagency VEGA 399 project Nr. 1/0514/12.
■ REFERENCES(1) Potter, T. L. Ground Water Monit. Rem. 1996, 16, 157−162.(2) Diehl, J. W.; Finkbeiner, J. W.; DiSanzo, F. P. Anal. Chem. 1995, 67,2015−2019.(3) Ribes, A.; Carrera, G.; Galleho, E.; Roca, X.; Berenguer, M. J.;Guardino, X. J. Chromatogr., A 2007, 1140, 44−55.(4) Stelmaszczyk, K.; Fechner, M.; Rohwetter, P.; Queiber, M.;Stacewicz, A.; Woste, L. Appl. Phys. B: Lasers Opt. 2009, 94, 369−373.(5) Marotta, E.; Paradisi, C. J. Am. Soc. Mass Spectrom. 2009, 20, 697−707.(6) Huang, G.; Gao, L.; Duncan, J.; Harper, J. D.; Sanders, N. L.;Ouyang, Z.; Cooksa, R. G. J. Am. Soc. Mass Spectrom. 2010, 21, 132−135.(7) Ammann, C.; Spirig, C.; Neftel, A.; Steinbacher, M.; Komenda, M.;Haub, A. S. C. Int. J. Mass Spectrom. 2004, 239, 87−101.(8) Spanel, P.; Smith, D. Eur. J. Mass Spectrom. 2007, 13, 77−82.(9) Eiceman, G. A.; Karpas, Z. Ion mobility spectrometry, 2nd ed.; CRCPress: Boca Raton, FL, 2005.(10) Borsdorf, H.; Mayer, T.; Zarejousheghani, M.; Eiceman, G. A.Appl. Spectrosc. Rev. 2011, 46, 472−521.(11) Eiceman, G. A.; Wang, Y. F.; Gonzales, L. G.; Harden, C. S.; Shoff,D. B. Anal. Chim. Acta 1995, 306, 21−33.(12) Eiceman, G. A.; Nazarov, E. G.; Tadjikov, B.; Miller, R. A. FieldAnal. Chem. Technol. 2000, 297−308.(13) Meng, Q.; Karpas, Z.; Eiceman, G. A. Int. J. Environ. Anal. Chem.1995, 61, 81−94.(14) Puton, J.; Nousiainen, M.; Sillanpaa, M. Talanta 2008, 76, 978−987.(15) Baumbach, J. I.; Eiceman, G. A. Appl. Spectrosc. 1999, 53, 338A−355A.(16) Vautz, W.; Zimmermann, D.; Hartmann, M.; Baumbach, J. I.;Nolte, J.; Jung, J. Food Addit. Contam. 2006, 23, 1064−1073.(17) Creaser, C. S.; Griffiths, J. R.; Bramwell, C. J.; Noreen, S.; Hill, C.A.; Thomas, C. L. P. Analyst 2004, 129, 984−994.(18) Kanu, A. B.; Hill, H. H. J. Chromatogr., A 2008, 946, 12−27.(19) Baumbach, J. I. J. Breath Res. 2009, 3, 034001.(20) McKnight, L. G.; McAffe, K. B.; Sipler, D. P. Phys. Rev. A 1967,164, 62−70.(21) Kanu, A. B.; Dwivedi, P.; Tam, M.; Matz, L.; Hill, H. H. J. Mass.Spectrom. 2008, 43, 1−22.(22)Woods, A.; Ugarov, M.; Egan, T.; Koomen, J.; Gillig, K. J.; Fuhrer,K.; Gonin, M.; Schultz, J. A. Anal. Chem. 2004, 76, 2187−2195.(23) Dwivedy, P.; Schultz, A. J.; Hill, H. H. Int. J. Mass Spectrom. 2010,298, 78−90.(24) Harvey, S. R.; MacPhee, C. E.; Barran, P. E. Methods 2011, 54,454−461.(25) Reynolds, J. C.; Blackburn, G. J.; Guallar-Hoyas, C.; Moll, V. H.;Bocos-Bintintan, V.; Kuar-Atwal, G.; Howdle, M. D.; Harry, E. L.;Brown, L. J.; Creaser, C. S.; Thomas, C. L. P. Anal. Chem. 2010, 82,2139−2144.(26) Sabo, M.; Matuska, J.; Matejcík, S. Talanta 2011, 85, 400−405.(27) Sabo, M.; Paleník, J.; Kucera, M.; Han, H.; Wang, H.; Chu, Y.;Matejcík, S. Int. J. Mass Spectrom. 2010, 293, 23−27.
(28) Wiley, W. C.; McLaren, I. H. Rev. Sci. Instrum. 1955, 26, 1150−1157.(29) Guilhaus, M.; Selby, D.; Mlynsky, V.Mass Spectrom. Rev. 2000, 19,65−117.(30) Borsdorf, H.; Neith, K.; Eiceman, G. A.; Stone, J. A. Talanta 2009,78, 1464−1475.(31) Sieleman, S.; Baumbach, J. I.; Smidt, H.; Pilizecker, P. Anal. Chim.Acta 2001, 431, 293−301.(32) Schwarz, K.; Filipiak, W.; Amann, A. J. Breath Res. 2009, 3, 1−15.(33) Carroll, D. I.; Dzdic, I.; Stillwell, R. N.; Horning, E. C. Anal. Chem.1975, 47, 1956.(34) Sabo, M.; Klas, M.; Wang, H.; Huang, C.; Chu, Y.; Matejcik, S.Eur. Phys. J. Appl. Phys. 2011, 55, 13808-p1−13808-p5.(35) Kebarle, P.; Searles, S. K.; Zolla, A.; Scarborough, J.; Arshadi, M. J.Am. Chem. Soc. 1967, 89, 6393−6399.(36) Elke, K.; Jermann, E.; Begerow, J.; Duneman, L. J. Chromatogr., A1998, 826, 191−200.(37) Wan, C.; Harrington, B.; Davis., D. M. Talanta 1998, 46, 1169−1179.(38) Baumbach, J. I.; Sieleman, S.; Xie, Z.; Schmidt, H. Anal. Chem.2003, 75, 1483−1490.(39) Spanel, P.; Smith, D. J. Phys. Chem. 1995, 99, 15551−15556.(40) Warneke, C.; van der Veena, C.; Luxembourg, S.; de Gouwa, J. A.;Kok, A. Int. J. Mass Spectrom. 2001, 207, 167−182.(41) Spanel, P.; Smith, D. Int. J. Mass Spectrom. 1999, 185/186/187,139−147.(42) Jordan, A.; Haidacher, S.; Hanel, G.; Hartungen, E.; Herbig, J.;Mark, L.; Schottkowsky, R.; Seehauser, H.; Sulzer, P.; Mark, T. D. Int. J.Mass Spectrom. 2009, 286, 32−38.(43) Karasek, F. W.; Denney, D. W. Anal. Chem. 1974, 46, 1312−1314.(44) Tabrizchi, M.; Ilbeigi, V. J. Hazard. Mater. 2010, 176, 692−696.(45) Pavlík, M.; Skalny, J. D. RCM 1997, 11, 1757−1766.(46) Ruotolo, B. T.; Gillig, K. J.; Stone, E. G.; Russell, D. H. J.Chromatogr. 2002, 782, 385−392.(47) Eiceman, G. A.; Stone, J. A. Anal. Chem. 2004, 76, 392A.(48) Steiner, W. E.; Clowers, B. H.; Fuhrer, K.; Gonin, M.; Matz, L. M.;Siems, W. F.; Schultz, A. J.; Hill, H. H. RCM 2001, 15, 2221−2226.
Analytical Chemistry Article
dx.doi.org/10.1021/ac300722s | Anal. Chem. 2012, 84, 5327−53345334