Embed Size (px)
Citation preview
Full Terms & Conditions of access and use can be found athttps://www.tandfonline.com/action/journalInformation?journalCode=tijr20
IETE Journal of Research
ISSN: 0377-2063 (Print) 0974-780X (Online) Journal homepage: https://www.tandfonline.com/loi/tijr20
Coronary Artery Heart Disease Prediction: AComparative Study of Computational IntelligenceTechniques
Safial Islam Ayon, Md. Milon Islam & Md. Rahat Hossain
To cite this article: Safial Islam Ayon, Md. Milon Islam & Md. Rahat Hossain (2020): CoronaryArtery Heart Disease Prediction: A Comparative Study of Computational Intelligence Techniques,IETE Journal of Research, DOI: 10.1080/03772063.2020.1713916
To link to this article: https://doi.org/10.1080/03772063.2020.1713916
Published online: 21 Jan 2020.
Submit your article to this journal
View related articles
View Crossmark data
IETE JOURNAL OF RESEARCHhttps://doi.org/10.1080/03772063.2020.1713916
Coronary Artery Heart Disease Prediction: A Comparative Study ofComputational Intelligence Techniques
Safial Islam Ayon1, Md. Milon Islam1 and Md. Rahat Hossain2
1Department of Computer Science and Engineering, Khulna University of Engineering & Technology, Khulna, Bangladesh; 2School ofEngineering and Technology, Central Queensland University, Rockhampton, Australia
ABSTRACTDiseases is an unusual circumstance that affects single or more parts of a human’s body. Becauseof lifestyle and patrimonial, different kinds of disease are increasing day by day. Among all thosediseases, heart disease turns out to be the most common disease and the impact of this ailment isdangerous than all other diseases. In this paper, we compared a number of computational intelli-gence techniques for the prediction of coronary artery heart disease. Seven computational intelli-gence techniques named as Logistic Regression (LR), Support Vector Machine (SVM), Deep NeuralNetwork (DNN), Decision Tree (DT), Naïve Bayes (NB), Random Forest (RF), and K-Nearest Neigh-bor (K-NN) were applied and a comparative study was drawn. The performance of each techniquewas evaluated using Statlog and Cleveland heart disease dataset which are retrieved from the UCImachine learning repository database with several evaluation techniques. From the study, it can becarried out that the highest accuracy of 98.15% obtained by deep neural network with sensitivityand precision 98.67% and 98.01% respectively. The outcomes of the study were compared with theoutcomes of the state of the art focusing on heart disease prediction that outperforms the previousstudy.
KEYWORDSComputational intelligencetechniques; Coronary arteryheart disease; Decision tree;Deep neural network;K-nearest neighbor; Logisticregression; Naïve Bayes;Random forest; Supportvector machine
1. INTRODUCTION
In the current world, Coronary Artery Heart Disease(CAHD) is a leading reason for death. According to theWorld Health Organization (WHO) [1], millions of peo-ple die forCAHDevery year. Basically, heart disease is thedisorder of heart that affects the regular action of heartfunction. Narrowing or blockage in the coronary arter-ies are the two most common reasons for heart diseasebecause it supplies blood to the heart itself. Estimationshows that more than 30 million people will die for thereason of heart disease by 2040.
There are several features of CAHD disease that canaffect the structure or function of the heart. The physi-cians and doctors face many problems to detect heartdisease correctly and rapidly. So, it is significant to makean intelligence CAHD prediction model to predict theheart disease in an initial state with a low cost. Withoutany previous symptoms, twenty-five percent of people diesuddenly who are suffered by CAHD [2]. CAHD is oneof the most significant types of diseases that can affectthe heart badly and causes of heart attack. Timely treat-ment and being aware of disease symptoms can reduceCAHD.
Many researchers have found that several factors areresponsible for increasing the risk of heart disease. Thereare some main risk factors like smoking, tobacco, highblood cholesterol, diabetes mellitus, overweight, highblood pressure, etc. which can increase the chance ofcoronary heart and blood vessel diseases [3]. Other fac-tors are known as contributing risk factors like stress andalcohol may increase the hazard of heart disease. Theirsignificance and prevalence, however, have not yet beendetermined precisely. It is possible to modify, control ormanage some of the risk factors. So, the person whohas more risk factors, the better chance to attack by theCAHD [3].
Many researches reveal that in the investigation commu-nity, computational intelligence techniques have drawnan excessive amount of thoughtfulness and it can provideexcessive accuracy in the classification problems withcompare to the other data classification models [4]. LRis a type of computational intelligence technique in thefield of statistics. It is a predictive analysis and here thedependent variable is binary. The outcomes of the LR rep-resent such as pass/fail or win/lose [5]. It also applied inmedical fields to solve different problems. SVMs are one
© 2020 IETE
2 S.I. AYON ET AL.: CORONARY ARTERY HEART DISEASE PREDICTION
of the most popular and used computational intelligencetechnique in the present researches. SVMs have mainlysupervised learning and used in classification, regres-sion and outliers’ detection. SVMshows extensive successin the field of image classification, Bioinformatics, tex-tual content categorization, hand-written categorization,etc. [6]. Many researches have proven that SVM perfor-mance is higher than other classificationmethods such asstatistical algorithms, decision-tree, and instance-basedlearning methods [7]. Deep learning is a technique thatis rapidly growing and works like a human mind. It rep-resents multi-level records and is capable of effectivelyresolving the selectivity-invariance dilemma [8]. Deeplearning techniques are used frequently in the field of sci-entific prognosis. It can work with the massive amountof data and have the ability to decode complex hasslein a smooth manner. Bayesian classifiers disperse themaximum possible class to a specified sample definedby its feature vector. In many real-world applications,including text classification, medical diagnosis and sys-tem performance management, Naïve Bayes has proveneffective [9]. Decision tree is an extrapolative techniquethat can be used to represent the classification problem.In addition, Decision trees are useful as an investigativemethod in economics, marketing, medicine and engi-neering [10]. Random Forest is an ensemble of unpruneddecision trees. RF algorithm is used when the trainingdataset and input variables both are large. It is a classifierform that consists of many decision trees and producesthe class that is the classifier output mode of the individ-ual trees [11]. K-Nearest Neighbor (K-NN) is a methodused to classify the samples in the feature space based onnearby training samples. K-NN is a category of instance-based learning where the function is only approxi-mated locally and all calculations are delayed untilclassification. [12].
Very recently, various computational intelligence tech-niques [13–21] are used in several medical prognoses.In this paper, we have compared some computationalintelligence techniques like LR, SVM, DNN, DT, NB, RF,and K-NN that can predict the coronary disease morecorrectly and fast.
There aremany tools like RapidMiner,WEKA, etc. whichcan provide the classification result. But there are someproblems to use such tools. In RapidMiner, it took toomuch memory and slow down the system [22]. Also,it supports less formula and expensive. In the case ofWEKA, the tool does not implement the new technique.Scaling, data preparation and visualization are also twomain problems of WEKA [23].
The main objective of this paper is to predict heartdisease prediction using different computational intelli-gence technique such as SVM, LR, DNN, DT, NB, RF,and K-NN. There are many proposed systems to predictthe heart disease, yet we have done this because some ofthe proposed systems’ accuracy is not well, some of themnot handle missing values, also DNN is a recent populartechnique for classification.
The remaining part of the paper is organized as fol-lows. Section 2 describes a quick view of the researchersthat have been done in this field. Section 3 demonstratesthe background study. Section 4 illustrates the overallmethodology, including data collection and preparation.The experimental outcomes analysis is investigated inSection 5. Finally, Section 6 concludes the paper.
2. OVERVIEWOF THE STATE OF ART
In medical science, classification is one of the most cru-cial, important, and popular decision-making tools. Topredict coronary heart disease accurately and correctly, alot of modern technology has been introduced. Some ofthe works that are related to this area are described brieflyas follows.
Guan et al. [24] proposed a system which was totallybased on support vector machine that can efficiently pre-dict the heart disease. The accuracy rate of the proposedsystem is 76.5%. The system compared different modelslike Standard SVM, Recursive Characteristic Elimina-tion and approximated L0-norm SVM strategies. Shi-laskar and Ghatol [25] used various classification strate-gies and feature selection algorithms to predict coronaryheart disease. They used an SVM classifier to the for-ward characteristic optimization and selection as well asback-elimination characteristic selection. Their experi-ment shows that it reduced the number of input vari-ables and upgraded the accuracy rate. The system foundan accuracy rate near about 85%. Shao et al. [26] pro-posed a system to find the accuracy of coronary heartdisease prediction using machine learning strategies likelogistic regression, and to select the best and importantfeatures. The system used rough set strategies and mul-tivariate adaptive regression splines to decrease the sizeof explanatory features for heart disease diagnosis. Theproposed system achieved an accuracy of 82.14%.
Kumar and Inbarani [27] developed a system using clas-sification strategies with Particle Swarm Optimization(PSO) for coronary heart disease diagnosis. The sys-tem used brief optimization and relative optimization
S.I. AYON ET AL.: CORONARY ARTERY HEART DISEASE PREDICTION 3
to find out the appropriate features. After getting themaximum benefit and maximum useful optimal fea-tures they used the result as input for machine learn-ing techniques like K-Nearest Neighbor (K-NN), Mul-tilayer perception (MLP), SVM, and Backpropagationtechniques to categorize the dataset and obtained accu-racy of 81.73%, 82.30%, 75.37%, and 91.94% respectively.Rajathi and Radhamani [28] proposed a model using K-NN (K-Nearest Neighbor) combined with Ant ColonyOptimization (ACO) techniques for coronary heart dis-ease prediction. They compared their accuracy (70.26%)with 4 different machine learning algorithms. Bashir etal. [29] proposed a system using SVM, Naïve Bayes,and DT-GI for the heart disease prediction. The miss-ing values in the dataset are removed in the preprocess-ing step. Then, with the use of majority voting strate-gies, they determined the coronary heart disease predic-tion accuracy. They found 82% of accuracy in their testresult.
Amin et al. [30] proposed a hybrid model where theimportant key risk features are used for classificationthe heart disease. They used two popular tools for theirsystem named as Neural Networks system and GeneticAlgorithm.With the help of genetic algorithm and globaloptimization technique, they initialized the weight ofeach neuron on the neural networks. Their experimentrevealed that their model is quick as compared to differ-ent models and they got an accuracy of 89%. Khatibi andMontazer [31] introduced a fuzzy based system using theconcepts of fuzzy sets and the theory of Dempster-Shafer.The proposed method follows two steps. First, the inputsare described through fuzzy units and carried out thefuzzy sets through the fuzzy inference system. Second, itgenerated the hybrid inference engine’s interval of beliefsand combined the various information using combina-tion rules. It executed the accuracy of 91.58%. Temurtasand Tanrikulu [32] proposed a model using neural net-work techniques to classify heart disease dataset. Theypartitioned the dataset into 3-fold cross-validation andthen used the neural network strategies to find the result.In the experiment, they achieved 96.30% accuracy fortheir model. Yumusak and Temurtas [33] used multi-layer neural networks to predict coronary heart disease.They used two hidden layers between the input and out-put layer and found an average accuracy of 91.60% fortheir model. Liu et al. [34] used regression and LocallyLinear Embedding (LLE) strategies for the classificationof coronary heart disease and obtained the accuracy ofabout 80%.
Nashif et al. [35] developed an application using differentmachine learning algorithms to monitor heart patients.
A cloud-based system was proposed in this research,where the patients can upload the physiological data forchecking the status of their cardiac health. The system86.40%, 97.53%, 95.76%, 95.05%, and 77.39% using naïvebayes, SVM, random forest, simple logistic, and ANNrespectively. Singh et al. [36] designed a heart disease pre-diction system based on Structural Equation Modeling(SEM) and Fuzzy Cognitive Map (FCM). They validatedthe data of the Canadian Community Health Surveydataset, where 20 significant attributes are present. AnSEMmodel is definedwith the relationship betweenCCC121 along with 20 attributes; here CCC 121 is a vari-able which defines whether the patient has heart disease.Ghadge et al. [37] developed an intelligent heart attackprediction system using big data. The main contribu-tion of this research was to find a model of an intelligentheart attack prediction system that uses big data and datamining modeling techniques.
3. COMPUTATIONAL INTELLIGENCETECHNIQUES
Computational intelligence technique is a collection ofcomputational models. Using it many kinds of problemscan be solved easily which are difficult to solve usingconventional computational algorithms [38]. There aredifferent applications of computational intelligence in thefield of medicine and pathology [39–41]. In this section,the LR, SVM, DNN, DT, NB, RF, and K-NN algorithmswhich are used in this comparative study are explainedin details. Another interesting method is reinforcementlearning. Reinforcement Learning works better for clas-sification problems for imbalanced dataset. For classifi-cation problems, reinforcement learning has served inremoving noisy data and learning better features, whichmade a great improvement in classification performance[42]. But this technique works better for a large amountof dataset and image dataset. As the dataset size of Cleve-land and Statlog are not so big and all the attributesare numeric, hence reinforcement technique is not bettersuited for this study.
3.1 Support Vector Machine
In the recent years support vector machine shows excel-lent performance in medicine sectors [43,44] for diseaseprediction. SVM is a supervised learning technique andthe principal purpose is to design it for regression andclassification tasks as well as minimizing the general-ization errors. SVM classifies the data into two classesover a hyperplane. In high dimensional spaces, SVM isvery effective even the dimensions are greater than thenumber of samples. Mathematically, SVM represented
4 S.I. AYON ET AL.: CORONARY ARTERY HEART DISEASE PREDICTION
as follows.
If Yi = +1;wxi + b ≥ 1 (1)
If Yi = −1;wxi + b ≤ 1 (2)
For all i; yi(wi + b) ≥ 1 (3)
In the equation, x is a vector point and w is a weight anda vector. So, to separate the data in Equation (1) shouldalways be greater than zero and the data in Equation(2) should always less than zero. Among all possiblehyperplanes, SVM selects the one where the distance ofhyperplane is as large as possible.
3.2 Logistic Regression
Logistic regression helps in various ways for disease diag-nosis and prognosis [45]. LR is a discriminative categoryapproach that works on the actual-valued input vector. Itwas used to extract substantial statistics items from themodel or to predict the tendency of data. In the LR, thedependent variable is a binary variable that contains datacoded as 1 (yes, success, etc.) or 0 (no, failure, etc.). InLR analysis, the main task is to estimate the log oddsof an event. Mathematically, LR estimates multiple linearregression functions defined as.
logp(y = 1)
1 − (p = 1)= β0 + β1X1 + β2X2 + · · · + βkXk;
where k = 1, 2, . . . , n (4)
3.3 Deep Neural Network
Deep neural network contributes in medicine, pathologyand other medical sectors [46,47]. A DNN is a complexneural network structure where there is a neural networkwith several hidden layers between the layers of inputand output. Here, the input data are transformed intonon-linearity or activation functions to output one orextra linearly separable classes. The intermediate layersare known as hidden layers. A deep neural network witha hidden layer is a function f : RA → RB, where A and Bare the size of the input vector and output vector respec-tively. The relation between input and output vectors areexpressed as follows:
f (x) = ∅(b(2) + w(2)(ϕ(b(1) + w(1)))) (5)
With bias vectors b(1) and b(2), weight matrices w(1) andw(2), and activation functions φ and ϕ.
3.4 Decision Tree
Decision trees are powerful and popular tools for predict-ing and classifying medical data [48]. DT is a classifier
expressed as a recursive part of the information spacedepending on the values of the attributes. Each internalnode splits the instance space into two or more sub-spaces according to certain function of the input attributevalues. Each leaf is allocated to one class that repre-sents the most appropriate value. There are many typesof algorithm for DT. Among them, we have used ID3algorithm because of its simplicity.
To evaluate the performance usingDT there are 4 steps:
(1) Calculate the Gini index.(2) Split the dataset and evaluate all the splits. Then
select the best split.(3) Generate the decision tree. To develop the tree three
important parts are considered which are as fol-lows.(i) Terminal nodes(ii) Recursive nodes(iii) Developing the tree.
3.5 Naïve Bayes
Naïve Bayes has been widely used in the field of medi-cal data mining and has proven to be well suited to thespecial features of medical data [49]. NB classification isthe method of the presence of the important features ofa class unrelated to the presence of any other feature. NBrepresents every class with a probabilistic summary andfinds the most expected class. It is known that NB classi-fication works very well on some domains, and poorly onothers. The performance of NB suffers in domains thatinvolve redundant correlated and irrelevant feature. TheNB classification function has been defined as follows:
classify(f1, . . . , fn)
= argmaxp(C = c)n∏
i=0p(Fi = fi IC = c) (6)
3.6 Random Forest
The use of random forests in medical diagnostics [50,51]has become quite prevalent in latest times. The RFalgorithm has been utilized in the forecast and likelihoodestimation. RF comprises of numerous decision trees.Each decision tree gives a vote that shows the decisionabout the class of the item. The steps of RF are:
(1) From the training set, select a new bootstrap sample.(2) Generate on an unpruned tree on this bootstrap
sample.
S.I. AYON ET AL.: CORONARY ARTERY HEART DISEASE PREDICTION 5
(3) Randomly select at each interior node and deter-mine the best split.
(4) If each tree is completely developed, no need toperform pruning.
(5) The final output is taken using the majority votefrom every one of the trees.
3.7 K-Nearest Neighbor
K-Nearest Neighbor has been commonly used to minecomprehensive medical database information [52,53].KNN algorithm is a method of classification which isbased on the similarity of one case to other cases. At aparticular point, when a case is new, its distance fromevery one of the cases in the model is determined. Theoutput of the technique indicates the case just like theclosest neighbor, which is the most comparable. In thismanner, it puts the case into the output that contains theclosest neighbors. K-NN has 2 steps:
(1) Find the K training occasions which are nearest tothe unidentified occurrence.
(2) Pick the most regularly happening classifications forthese K occasions.
4. METHODS ANDMATERIALS
In this paper, to predict the coronary artery heart dis-ease, we follow the following steps, (1) Data collection,(2) Data preprocessing, (3) Implementation of the tech-niques, and (4) Performance measure. The followingsubsections explain all the steps in details.
4.1 Data Collection
The Statlog [54] and Cleveland [55] heart disease datasetis available in the UCI machine learning repositorydatabase. The patients are both male and female inthe dataset. There are 270 samples and the samples aredivided into 13 attributes and the class distribution is the14th attribute. The details for both datasets are shown inTable 1.
Samples with the absence of coronary heart disease aretreated as a negative class (1) and samples with thepresent are treated as a positive class (2). Data correla-tion is the way in which one set of data may correspondto another set. In a machine learning perspective, howthe features correspond to output. Sometimes, it becomesvery hard to figure out how the data are correlated witheach other. In this situation, data visualization can helpto find out how individual featuresmay correlate with theoutput. Pearson’s CorrelationCoefficient helps to find out
Table 1: Description of Statlog and Cleveland heart diseasedataset
Attributes Type Value
(i) Age Integer [29–77](ii) Sex Integer male = 1; female = 0(iii) Chest pain type Integer angina = 1; abnanr = 2;
notang = 3;asympt = 4
(iv) Blood pressure value Integer [94–200](v) Serum cholesterol Integer [126–564](vi) Fasting blood sugar Integer true = 1; false = 0(vii) Resting electro-
cardiographicresults
Integer [0–2]
(viii) Maximum heart rate Integer [71–202](ix) Angina induced by
ExerciseInteger [1–4] = yes; 0 = no
(x) Old Peak Float [0.0–62.0](xi) The slant of the peak
exercise ST segmentInteger upsloping = 1; flat = 2;
downsloping = 3(xii) The numeral of the
main vesselsInteger [0–3]
(xiii) Thal Integer normal = 3; fixeddefect = 6; reversibledefect = 7
(xiv) Coronary heart diseasediagnosis
Integer present = 1; absent = 0
the relationship between the two quantities. The valueof Pearson’s Correlation Coefficient can be between −1to +1. 1 means that they are highly correlated and 0means no correlation. −1 means that there is a negativecorrelation.
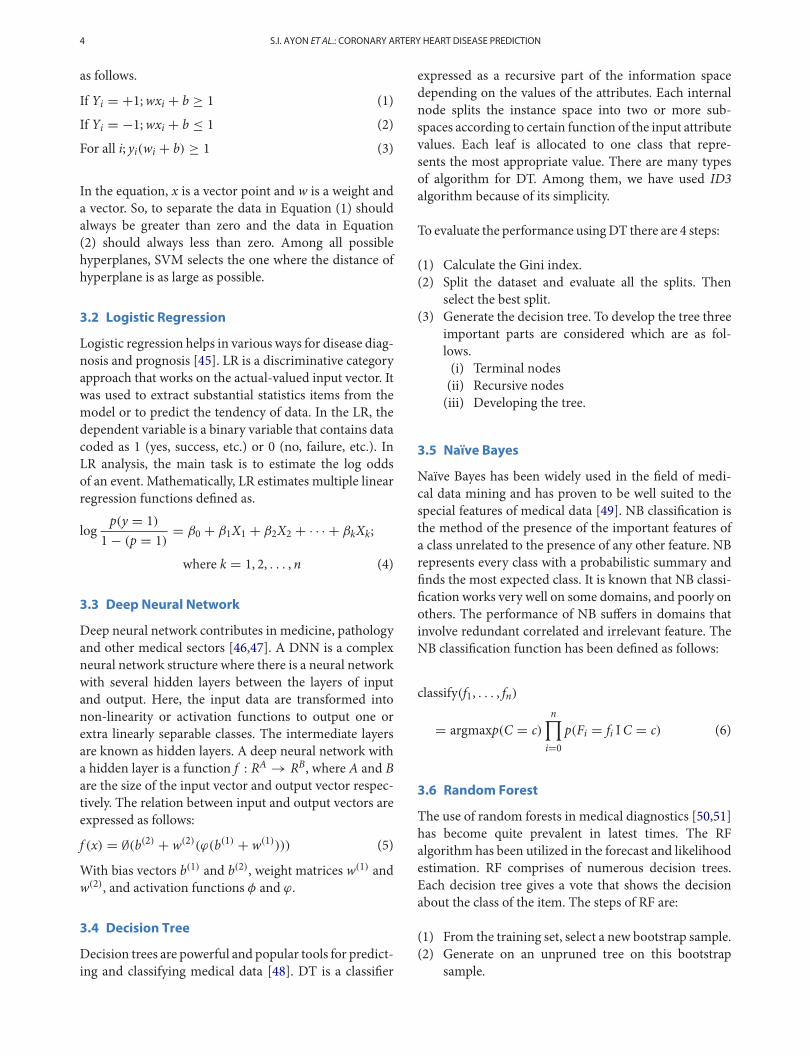
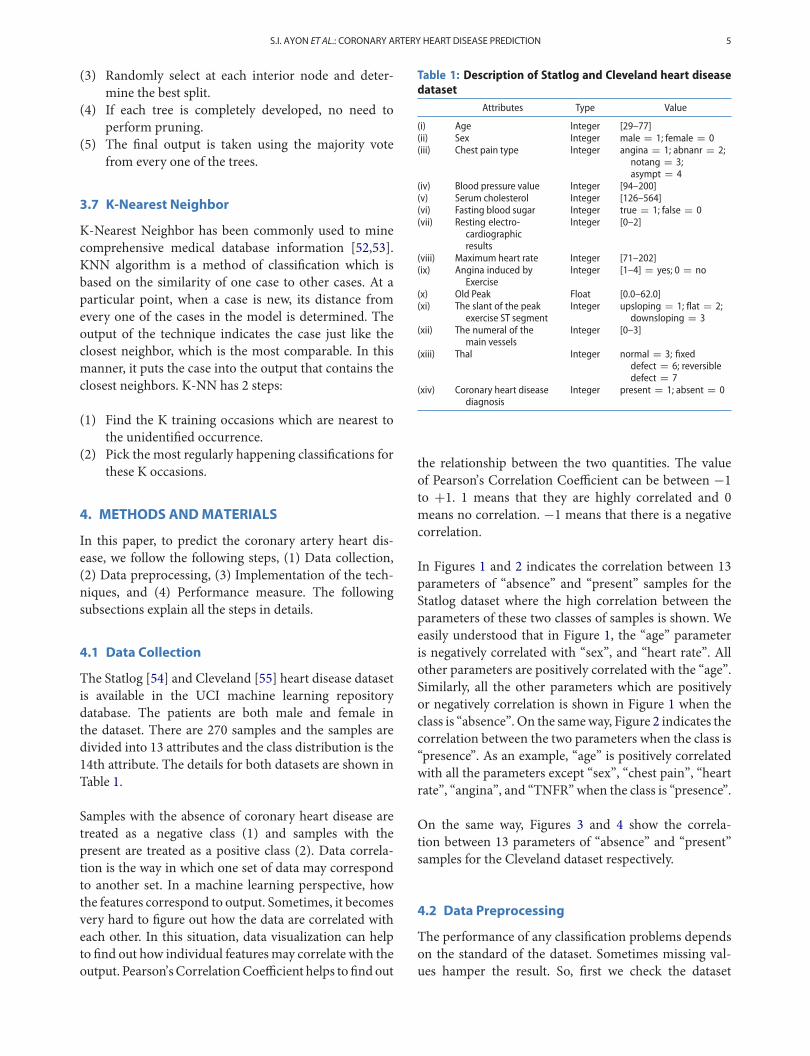
In Figures 1 and 2 indicates the correlation between 13parameters of “absence” and “present” samples for theStatlog dataset where the high correlation between theparameters of these two classes of samples is shown. Weeasily understood that in Figure 1, the “age” parameteris negatively correlated with “sex”, and “heart rate”. Allother parameters are positively correlated with the “age”.Similarly, all the other parameters which are positivelyor negatively correlation is shown in Figure 1 when theclass is “absence”. On the sameway, Figure 2 indicates thecorrelation between the two parameters when the class is“presence”. As an example, “age” is positively correlatedwith all the parameters except “sex”, “chest pain”, “heartrate”, “angina”, and “TNFR” when the class is “presence”.
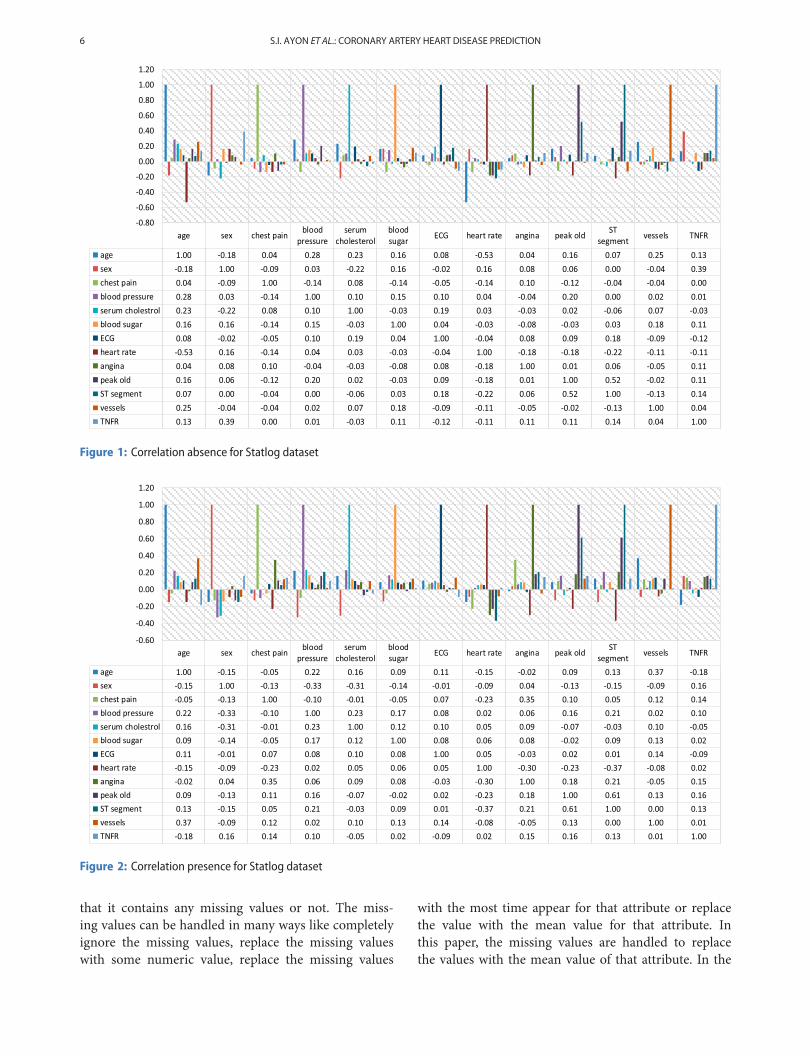
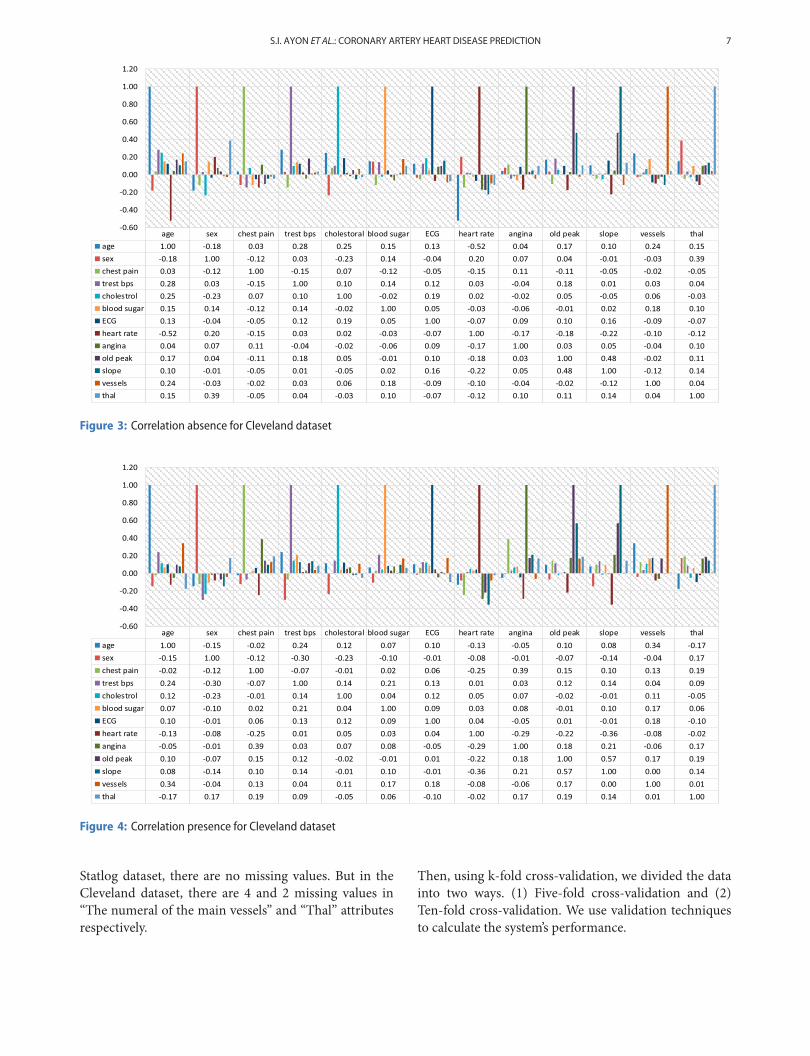
On the same way, Figures 3 and 4 show the correla-tion between 13 parameters of “absence” and “present”samples for the Cleveland dataset respectively.
4.2 Data Preprocessing
The performance of any classification problems dependson the standard of the dataset. Sometimes missing val-ues hamper the result. So, first we check the dataset
6 S.I. AYON ET AL.: CORONARY ARTERY HEART DISEASE PREDICTION
Figure 1: Correlation absence for Statlog dataset
Figure 2: Correlation presence for Statlog dataset
that it contains any missing values or not. The miss-ing values can be handled in many ways like completelyignore the missing values, replace the missing valueswith some numeric value, replace the missing values
with the most time appear for that attribute or replacethe value with the mean value for that attribute. Inthis paper, the missing values are handled to replacethe values with the mean value of that attribute. In the
S.I. AYON ET AL.: CORONARY ARTERY HEART DISEASE PREDICTION 7
Figure 3: Correlation absence for Cleveland dataset
Figure 4: Correlation presence for Cleveland dataset
Statlog dataset, there are no missing values. But in theCleveland dataset, there are 4 and 2 missing values in“The numeral of the main vessels” and “Thal” attributesrespectively.
Then, using k-fold cross-validation, we divided the datainto two ways. (1) Five-fold cross-validation and (2)Ten-fold cross-validation. We use validation techniquesto calculate the system’s performance.
8 S.I. AYON ET AL.: CORONARY ARTERY HEART DISEASE PREDICTION
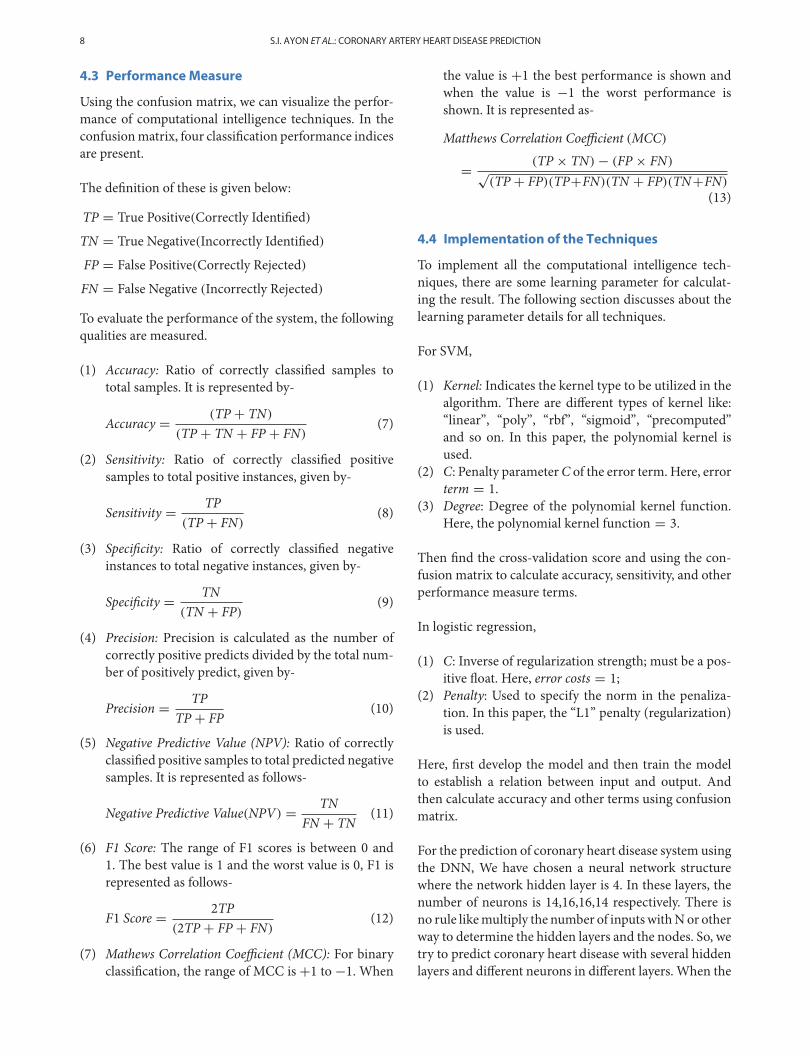
4.3 PerformanceMeasure
Using the confusion matrix, we can visualize the perfor-mance of computational intelligence techniques. In theconfusionmatrix, four classification performance indicesare present.
The definition of these is given below:
TP = True Positive(Correctly Identified)
TN = True Negative(Incorrectly Identified)
FP = False Positive(Correctly Rejected)
FN = False Negative (Incorrectly Rejected)
To evaluate the performance of the system, the followingqualities are measured.
(1) Accuracy: Ratio of correctly classified samples tototal samples. It is represented by-
Accuracy = (TP + TN)
(TP + TN + FP + FN)(7)
(2) Sensitivity: Ratio of correctly classified positivesamples to total positive instances, given by-
Sensitivity = TP(TP + FN)
(8)
(3) Specificity: Ratio of correctly classified negativeinstances to total negative instances, given by-
Specificity = TN(TN + FP)
(9)
(4) Precision: Precision is calculated as the number ofcorrectly positive predicts divided by the total num-ber of positively predict, given by-
Precision = TPTP + FP
(10)
(5) Negative Predictive Value (NPV): Ratio of correctlyclassified positive samples to total predicted negativesamples. It is represented as follows-
Negative Predictive Value(NPV) = TNFN + TN
(11)
(6) F1 Score: The range of F1 scores is between 0 and1. The best value is 1 and the worst value is 0, F1 isrepresented as follows-
F1 Score = 2TP(2TP + FP + FN)
(12)
(7) Mathews Correlation Coefficient (MCC): For binaryclassification, the range of MCC is +1 to −1. When
the value is +1 the best performance is shown andwhen the value is −1 the worst performance isshown. It is represented as-
Matthews Correlation Coefficient (MCC)
= (TP × TN) − (FP × FN)√(TP + FP)(TP+FN)(TN + FP)(TN+FN)
(13)
4.4 Implementation of the Techniques
To implement all the computational intelligence tech-niques, there are some learning parameter for calculat-ing the result. The following section discusses about thelearning parameter details for all techniques.
For SVM,
(1) Kernel: Indicates the kernel type to be utilized in thealgorithm. There are different types of kernel like:“linear”, “poly”, “rbf”, “sigmoid”, “precomputed”and so on. In this paper, the polynomial kernel isused.
(2) C: Penalty parameterC of the error term. Here, errorterm = 1.
(3) Degree: Degree of the polynomial kernel function.Here, the polynomial kernel function = 3.
Then find the cross-validation score and using the con-fusion matrix to calculate accuracy, sensitivity, and otherperformance measure terms.
In logistic regression,
(1) C: Inverse of regularization strength; must be a pos-itive float. Here, error costs = 1;
(2) Penalty: Used to specify the norm in the penaliza-tion. In this paper, the “L1” penalty (regularization)is used.
Here, first develop the model and then train the modelto establish a relation between input and output. Andthen calculate accuracy and other terms using confusionmatrix.
For the prediction of coronary heart disease system usingthe DNN, We have chosen a neural network structurewhere the network hidden layer is 4. In these layers, thenumber of neurons is 14,16,16,14 respectively. There isno rule likemultiply the number of inputswithNor otherway to determine the hidden layers and the nodes. So, wetry to predict coronary heart disease with several hiddenlayers and different neurons in different layers. When the
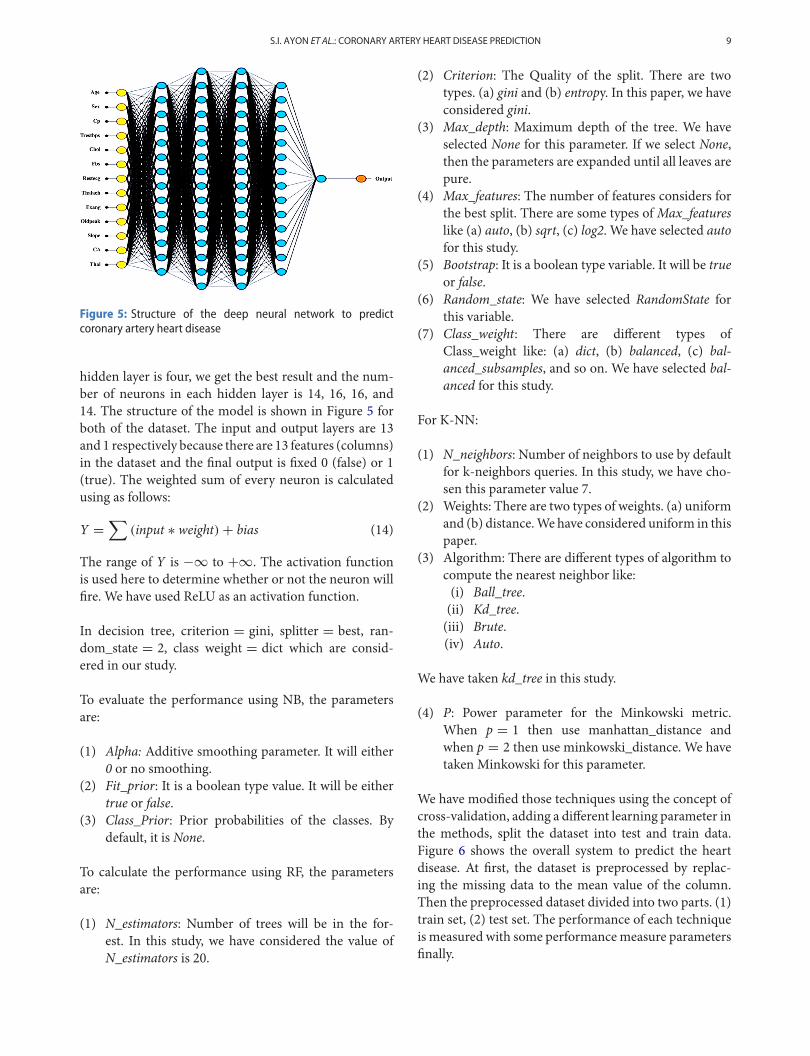
S.I. AYON ET AL.: CORONARY ARTERY HEART DISEASE PREDICTION 9
Figure 5: Structure of the deep neural network to predictcoronary artery heart disease
hidden layer is four, we get the best result and the num-ber of neurons in each hidden layer is 14, 16, 16, and14. The structure of the model is shown in Figure 5 forboth of the dataset. The input and output layers are 13and 1 respectively because there are 13 features (columns)in the dataset and the final output is fixed 0 (false) or 1(true). The weighted sum of every neuron is calculatedusing as follows:
Y =∑
(input ∗ weight) + bias (14)
The range of Y is −∞ to +∞. The activation functionis used here to determine whether or not the neuron willfire. We have used ReLU as an activation function.
In decision tree, criterion = gini, splitter = best, ran-dom_state = 2, class weight = dict which are consid-ered in our study.
To evaluate the performance using NB, the parametersare:
(1) Alpha: Additive smoothing parameter. It will either0 or no smoothing.
(2) Fit_prior: It is a boolean type value. It will be eithertrue or false.
(3) Class_Prior: Prior probabilities of the classes. Bydefault, it is None.
To calculate the performance using RF, the parametersare:
(1) N_estimators: Number of trees will be in the for-est. In this study, we have considered the value ofN_estimators is 20.
(2) Criterion: The Quality of the split. There are twotypes. (a) gini and (b) entropy. In this paper, we haveconsidered gini.
(3) Max_depth: Maximum depth of the tree. We haveselected None for this parameter. If we select None,then the parameters are expanded until all leaves arepure.
(4) Max_features: The number of features considers forthe best split. There are some types ofMax_featureslike (a) auto, (b) sqrt, (c) log2. We have selected autofor this study.
(5) Bootstrap: It is a boolean type variable. It will be trueor false.
(6) Random_state: We have selected RandomState forthis variable.
(7) Class_weight: There are different types ofClass_weight like: (a) dict, (b) balanced, (c) bal-anced_subsamples, and so on. We have selected bal-anced for this study.
For K-NN:
(1) N_neighbors: Number of neighbors to use by defaultfor k-neighbors queries. In this study, we have cho-sen this parameter value 7.
(2) Weights: There are two types of weights. (a) uniformand (b) distance.We have considered uniform in thispaper.
(3) Algorithm: There are different types of algorithm tocompute the nearest neighbor like:(i) Ball_tree.(ii) Kd_tree.(iii) Brute.(iv) Auto.
We have taken kd_tree in this study.
(4) P: Power parameter for the Minkowski metric.When p = 1 then use manhattan_distance andwhen p = 2 then use minkowski_distance. We havetaken Minkowski for this parameter.
We have modified those techniques using the concept ofcross-validation, adding a different learning parameter inthe methods, split the dataset into test and train data.Figure 6 shows the overall system to predict the heartdisease. At first, the dataset is preprocessed by replac-ing the missing data to the mean value of the column.Then the preprocessed dataset divided into two parts. (1)train set, (2) test set. The performance of each techniqueis measured with some performancemeasure parametersfinally.
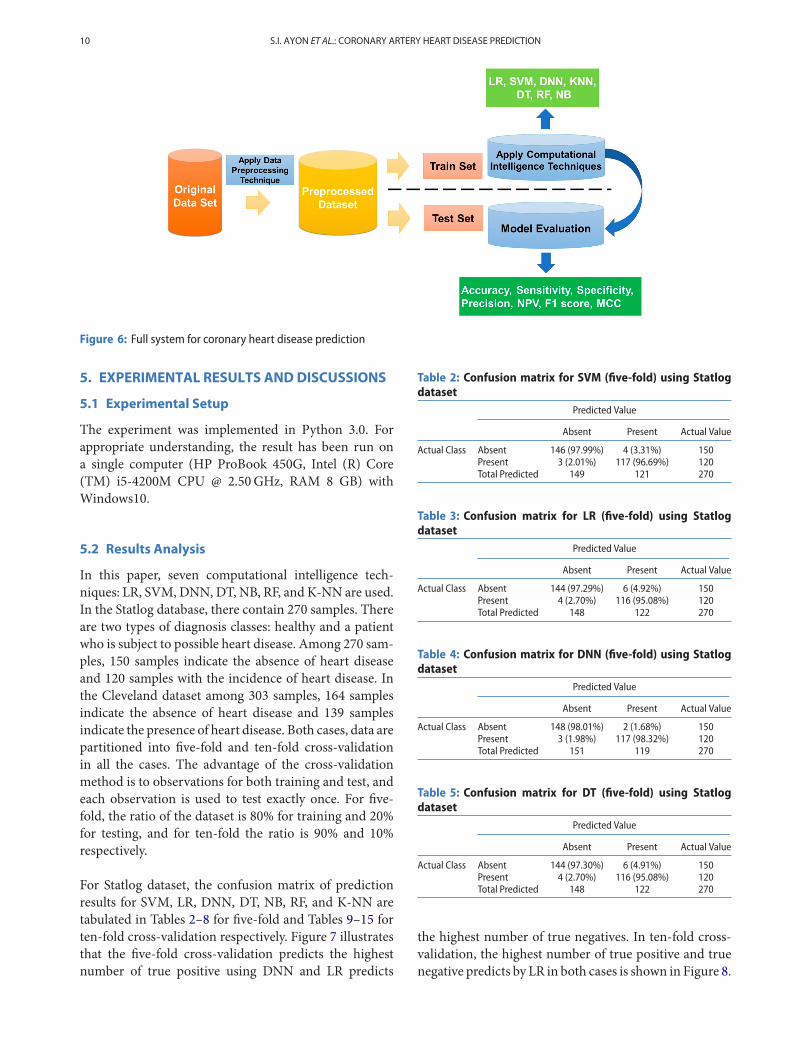
10 S.I. AYON ET AL.: CORONARY ARTERY HEART DISEASE PREDICTION
Figure 6: Full system for coronary heart disease prediction
5. EXPERIMENTAL RESULTS ANDDISCUSSIONS
5.1 Experimental Setup
The experiment was implemented in Python 3.0. Forappropriate understanding, the result has been run ona single computer (HP ProBook 450G, Intel (R) Core(TM) i5-4200M CPU @ 2.50GHz, RAM 8 GB) withWindows10.
5.2 Results Analysis
In this paper, seven computational intelligence tech-niques: LR, SVM, DNN, DT, NB, RF, and K-NN are used.In the Statlog database, there contain 270 samples. Thereare two types of diagnosis classes: healthy and a patientwho is subject to possible heart disease. Among 270 sam-ples, 150 samples indicate the absence of heart diseaseand 120 samples with the incidence of heart disease. Inthe Cleveland dataset among 303 samples, 164 samplesindicate the absence of heart disease and 139 samplesindicate the presence of heart disease. Both cases, data arepartitioned into five-fold and ten-fold cross-validationin all the cases. The advantage of the cross-validationmethod is to observations for both training and test, andeach observation is used to test exactly once. For five-fold, the ratio of the dataset is 80% for training and 20%for testing, and for ten-fold the ratio is 90% and 10%respectively.
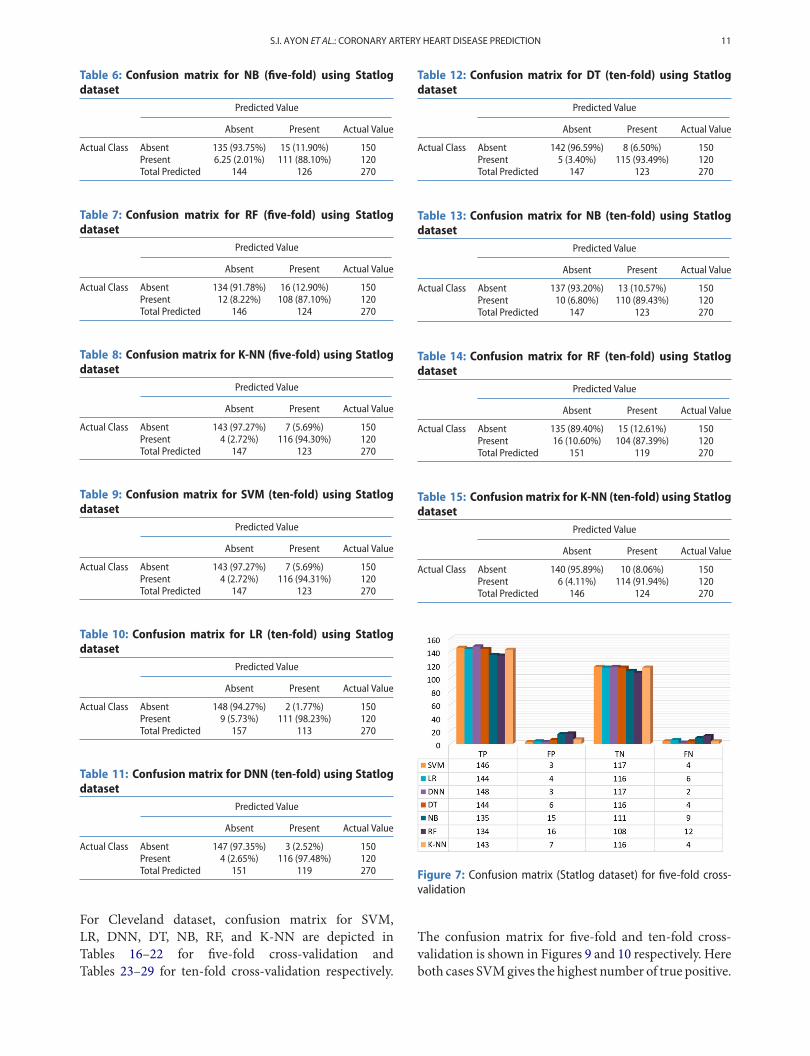
For Statlog dataset, the confusion matrix of predictionresults for SVM, LR, DNN, DT, NB, RF, and K-NN aretabulated in Tables 2–8 for five-fold and Tables 9–15 forten-fold cross-validation respectively. Figure 7 illustratesthat the five-fold cross-validation predicts the highestnumber of true positive using DNN and LR predicts
Table 2: Confusion matrix for SVM (five-fold) using Statlogdataset
Predicted Value
Absent Present Actual Value
Actual Class Absent 146 (97.99%) 4 (3.31%) 150Present 3 (2.01%) 117 (96.69%) 120Total Predicted 149 121 270
Table 3: Confusion matrix for LR (five-fold) using Statlogdataset
Predicted Value
Absent Present Actual Value
Actual Class Absent 144 (97.29%) 6 (4.92%) 150Present 4 (2.70%) 116 (95.08%) 120Total Predicted 148 122 270
Table 4: Confusion matrix for DNN (five-fold) using Statlogdataset
Predicted Value
Absent Present Actual Value
Actual Class Absent 148 (98.01%) 2 (1.68%) 150Present 3 (1.98%) 117 (98.32%) 120Total Predicted 151 119 270
Table 5: Confusion matrix for DT (five-fold) using Statlogdataset
Predicted Value
Absent Present Actual Value
Actual Class Absent 144 (97.30%) 6 (4.91%) 150Present 4 (2.70%) 116 (95.08%) 120Total Predicted 148 122 270
the highest number of true negatives. In ten-fold cross-validation, the highest number of true positive and truenegative predicts by LR in both cases is shown in Figure 8.
S.I. AYON ET AL.: CORONARY ARTERY HEART DISEASE PREDICTION 11
Table 6: Confusion matrix for NB (five-fold) using Statlogdataset
Predicted Value
Absent Present Actual Value
Actual Class Absent 135 (93.75%) 15 (11.90%) 150Present 6.25 (2.01%) 111 (88.10%) 120Total Predicted 144 126 270
Table 7: Confusion matrix for RF (five-fold) using Statlogdataset
Predicted Value
Absent Present Actual Value
Actual Class Absent 134 (91.78%) 16 (12.90%) 150Present 12 (8.22%) 108 (87.10%) 120Total Predicted 146 124 270
Table 8: Confusion matrix for K-NN (five-fold) using Statlogdataset
Predicted Value
Absent Present Actual Value
Actual Class Absent 143 (97.27%) 7 (5.69%) 150Present 4 (2.72%) 116 (94.30%) 120Total Predicted 147 123 270
Table 9: Confusion matrix for SVM (ten-fold) using Statlogdataset
Predicted Value
Absent Present Actual Value
Actual Class Absent 143 (97.27%) 7 (5.69%) 150Present 4 (2.72%) 116 (94.31%) 120Total Predicted 147 123 270
Table 10: Confusion matrix for LR (ten-fold) using Statlogdataset
Predicted Value
Absent Present Actual Value
Actual Class Absent 148 (94.27%) 2 (1.77%) 150Present 9 (5.73%) 111 (98.23%) 120Total Predicted 157 113 270
Table 11: Confusion matrix for DNN (ten-fold) using Statlogdataset
Predicted Value
Absent Present Actual Value
Actual Class Absent 147 (97.35%) 3 (2.52%) 150Present 4 (2.65%) 116 (97.48%) 120Total Predicted 151 119 270
For Cleveland dataset, confusion matrix for SVM,LR, DNN, DT, NB, RF, and K-NN are depicted inTables 16–22 for five-fold cross-validation andTables 23–29 for ten-fold cross-validation respectively.
Table 12: Confusion matrix for DT (ten-fold) using Statlogdataset
Predicted Value
Absent Present Actual Value
Actual Class Absent 142 (96.59%) 8 (6.50%) 150Present 5 (3.40%) 115 (93.49%) 120Total Predicted 147 123 270
Table 13: Confusion matrix for NB (ten-fold) using Statlogdataset
Predicted Value
Absent Present Actual Value
Actual Class Absent 137 (93.20%) 13 (10.57%) 150Present 10 (6.80%) 110 (89.43%) 120Total Predicted 147 123 270
Table 14: Confusion matrix for RF (ten-fold) using Statlogdataset
Predicted Value
Absent Present Actual Value
Actual Class Absent 135 (89.40%) 15 (12.61%) 150Present 16 (10.60%) 104 (87.39%) 120Total Predicted 151 119 270
Table 15: Confusionmatrix for K-NN (ten-fold) using Statlogdataset
Predicted Value
Absent Present Actual Value
Actual Class Absent 140 (95.89%) 10 (8.06%) 150Present 6 (4.11%) 114 (91.94%) 120Total Predicted 146 124 270
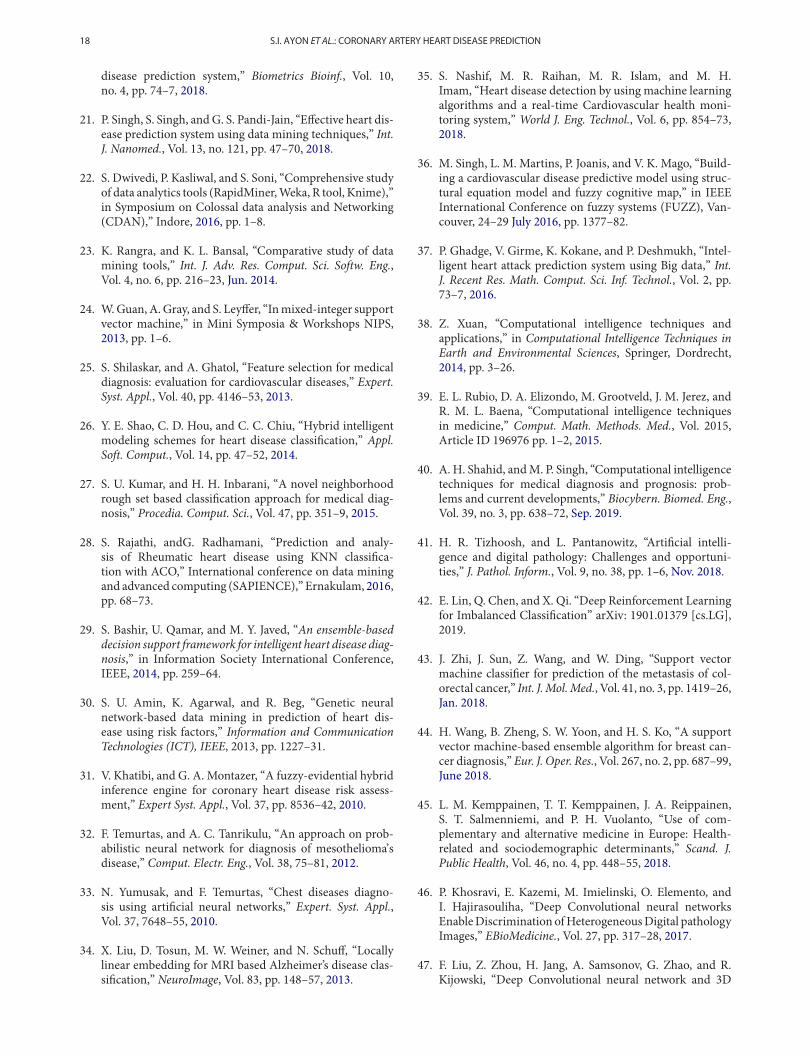
Figure 7: Confusion matrix (Statlog dataset) for five-fold cross-validation
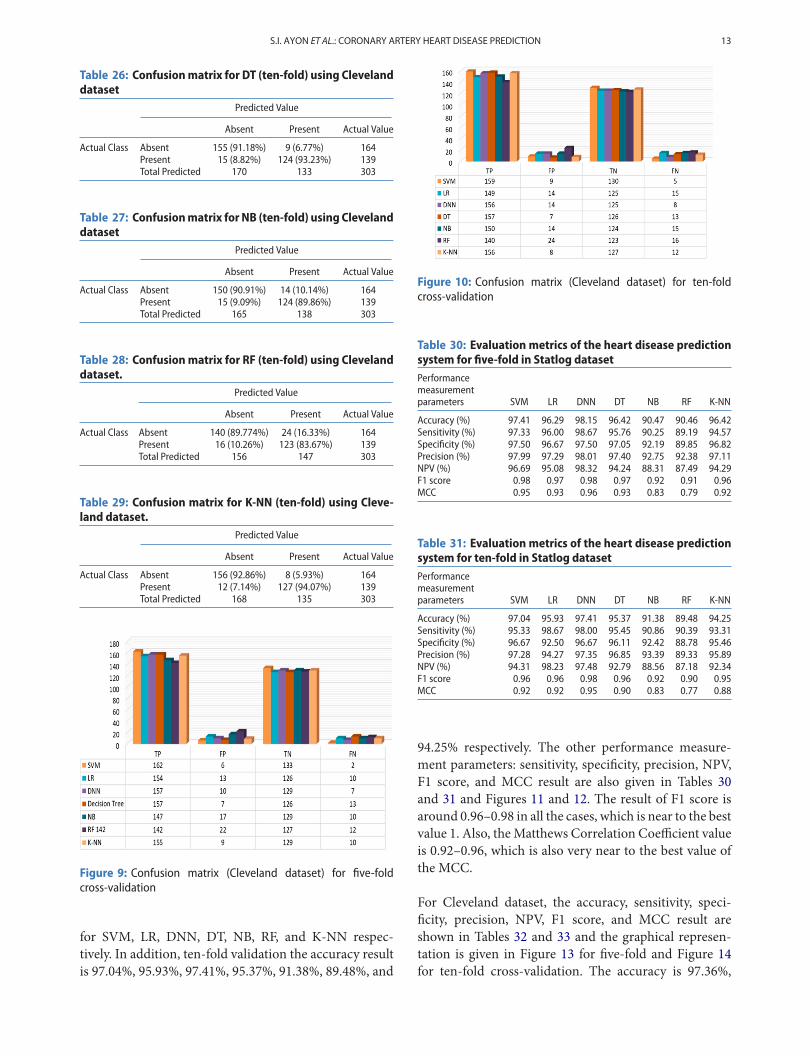
The confusion matrix for five-fold and ten-fold cross-validation is shown in Figures 9 and 10 respectively. Hereboth cases SVMgives the highest number of true positive.

12 S.I. AYON ET AL.: CORONARY ARTERY HEART DISEASE PREDICTION
Figure 8: Confusion matrix (Statlog dataset) for ten-fold cross-validation
Table 16: Confusion matrix for SVM (five-fold) using Cleve-land dataset
Predicted Value
Absent Present Actual Value
Actual Class Absent 162 (96.43%) 2 (1.48%) 164Present 6 (3.57%) 133 (98.52%) 139Total Predicted 168 135 303
Table 17: Confusionmatrix for LR (five-fold) using Clevelanddataset
Predicted Value
Absent Present Actual Value
Actual Class Absent 154 (92.22%) 10 (7.35%) 164Present 13 (7.78%) 126 (92.65%) 139Total Predicted 167 136 303
Table 18: Confusion matrix for DNN (five-fold) using Cleve-land dataset
Predicted Value
Absent Present Actual Value
Actual Class Absent 157 (94.01%) 7 (5.15%) 164Present 10 (5.99%) 129 (94.85%) 139Total Predicted 167 136 303
Table 19: Confusionmatrix forDT (five-fold) usingClevelanddataset
Predicted Value
Absent Present Actual Value
Actual Class Absent 157 (92.35%) 7 (5.26%) 164Present 13 (7.65%) 126 (94.74%) 139Total Predicted 170 133 303
With the help of confusion matrix accuracy, sensitivity,specificity, precision, negative predictive value, F1 score,and MCC are measured. The result for Statlog dataset isshown in Table 30 for five-fold and Table 31 for ten-fold
Table 20: Confusionmatrix forNB (five-fold)usingClevelanddataset
Predicted Value
Absent Present Actual Value
Actual Class Absent 147 (93.63%) 17 (11.64%) 164Present 10 (6.37%) 129 (88.36%) 139Total Predicted 157 146 303
Table 21: Confusionmatrix for RF (five-fold) using Clevelanddataset
Predicted Value
Absent Present Actual Value
Actual Class Absent 142 (92.21%) 22 (14.77%) 164Present 12 (7.79%) 127 (85.23%) 139Total Predicted 154 149 303
Table 22: Confusion matrix for K-NN (five-fold) using Cleve-land dataset
Predicted Value
Absent Present Actual Value
Actual Class Absent 155 (93.94%) 9 (6.52%) 164Present 10 (6.06%) 129 (93.48%) 139Total Predicted 165 138 303
Table 23: Confusion matrix for SVM (ten-fold) using Cleve-land dataset
Predicted Value
Absent Present Actual Value
Actual Class Absent 159 (94.64%) 5 (3.70%) 164Present 9 (5.35%) 130 (96.30%) 139Total Predicted 168 135 303
Table 24: Confusionmatrix for LR (ten-fold) using Clevelanddataset.
Predicted Value
Absent Present Actual Value
Actual Class Absent 149 (91.41%) 15 (10.71%) 164Present 14 (8.59%) 125 (89.29%) 139Total Predicted 163 140 303
Table 25: Confusion matrix for DNN (ten-fold) using Cleve-land dataset
Predicted Value
Absent Present Actual Value
Actual Class Absent 156 (91.76%) 8 (6.02%) 164Present 14 (8.24%) 125 (93.98%) 139Total Predicted 170 133 303
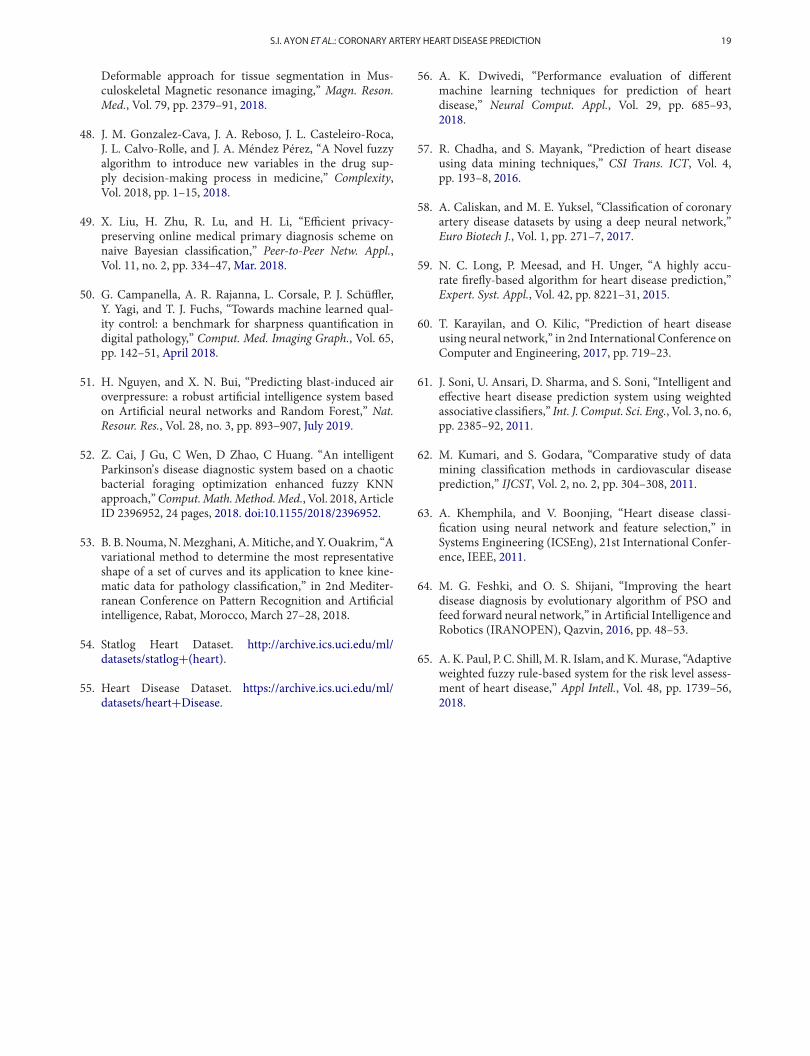
cross validation result is given. The graphical representa-tion of the result for Statlog dataset is shown in Figure 11for five-fold and Figure 12 for ten-fold cross-validation.The accuracy obtained by five-fold validation are 97.41%,96.29%, 98.15%, 96.42%, 90.47%, 90.46%, and 96.42%
S.I. AYON ET AL.: CORONARY ARTERY HEART DISEASE PREDICTION 13
Table 26: Confusionmatrix for DT (ten-fold) using Clevelanddataset
Predicted Value
Absent Present Actual Value
Actual Class Absent 155 (91.18%) 9 (6.77%) 164Present 15 (8.82%) 124 (93.23%) 139Total Predicted 170 133 303
Table 27: Confusionmatrix for NB (ten-fold) using Clevelanddataset
Predicted Value
Absent Present Actual Value
Actual Class Absent 150 (90.91%) 14 (10.14%) 164Present 15 (9.09%) 124 (89.86%) 139Total Predicted 165 138 303
Table 28: Confusionmatrix for RF (ten-fold) using Clevelanddataset.
Predicted Value
Absent Present Actual Value
Actual Class Absent 140 (89.774%) 24 (16.33%) 164Present 16 (10.26%) 123 (83.67%) 139Total Predicted 156 147 303
Table 29: Confusion matrix for K-NN (ten-fold) using Cleve-land dataset.
Predicted Value
Absent Present Actual Value
Actual Class Absent 156 (92.86%) 8 (5.93%) 164Present 12 (7.14%) 127 (94.07%) 139Total Predicted 168 135 303
Figure 9: Confusion matrix (Cleveland dataset) for five-foldcross-validation
for SVM, LR, DNN, DT, NB, RF, and K-NN respec-tively. In addition, ten-fold validation the accuracy resultis 97.04%, 95.93%, 97.41%, 95.37%, 91.38%, 89.48%, and
Figure 10: Confusion matrix (Cleveland dataset) for ten-foldcross-validation
Table 30: Evaluation metrics of the heart disease predictionsystem for five-fold in Statlog datasetPerformancemeasurementparameters SVM LR DNN DT NB RF K-NN
Accuracy (%) 97.41 96.29 98.15 96.42 90.47 90.46 96.42Sensitivity (%) 97.33 96.00 98.67 95.76 90.25 89.19 94.57Specificity (%) 97.50 96.67 97.50 97.05 92.19 89.85 96.82Precision (%) 97.99 97.29 98.01 97.40 92.75 92.38 97.11NPV (%) 96.69 95.08 98.32 94.24 88.31 87.49 94.29F1 score 0.98 0.97 0.98 0.97 0.92 0.91 0.96MCC 0.95 0.93 0.96 0.93 0.83 0.79 0.92
Table 31: Evaluation metrics of the heart disease predictionsystem for ten-fold in Statlog datasetPerformancemeasurementparameters SVM LR DNN DT NB RF K-NN
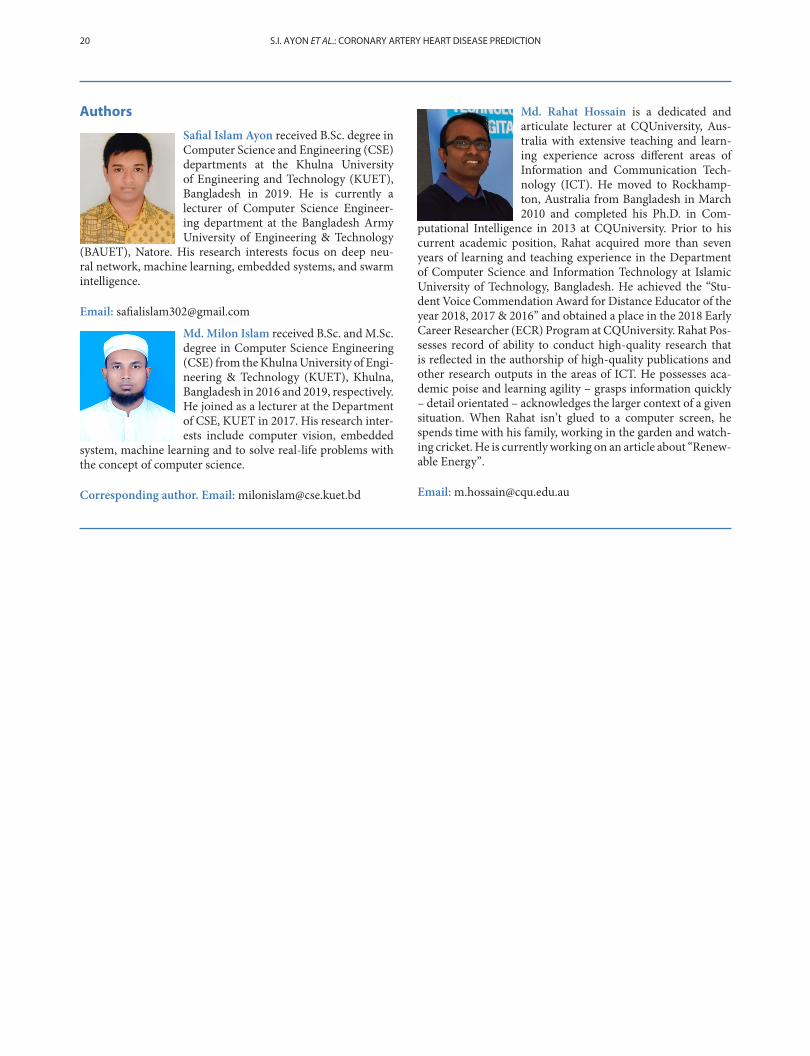
Accuracy (%) 97.04 95.93 97.41 95.37 91.38 89.48 94.25Sensitivity (%) 95.33 98.67 98.00 95.45 90.86 90.39 93.31Specificity (%) 96.67 92.50 96.67 96.11 92.42 88.78 95.46Precision (%) 97.28 94.27 97.35 96.85 93.39 89.33 95.89NPV (%) 94.31 98.23 97.48 92.79 88.56 87.18 92.34F1 score 0.96 0.96 0.98 0.96 0.92 0.90 0.95MCC 0.92 0.92 0.95 0.90 0.83 0.77 0.88
94.25% respectively. The other performance measure-ment parameters: sensitivity, specificity, precision, NPV,F1 score, and MCC result are also given in Tables 30and 31 and Figures 11 and 12. The result of F1 score isaround 0.96–0.98 in all the cases, which is near to the bestvalue 1. Also, theMatthews Correlation Coefficient valueis 0.92–0.96, which is also very near to the best value ofthe MCC.
For Cleveland dataset, the accuracy, sensitivity, speci-ficity, precision, NPV, F1 score, and MCC result areshown in Tables 32 and 33 and the graphical represen-tation is given in Figure 13 for five-fold and Figure 14for ten-fold cross-validation. The accuracy is 97.36%,

14 S.I. AYON ET AL.: CORONARY ARTERY HEART DISEASE PREDICTION
Figure 11: Evaluation metrics of the heart disease prediction (five-fold) system using Statlog dataset
Figure 12: Evaluation metrics of the heart disease prediction (ten-fold) system using Statlog dataset
Table 32: Evaluation metrics of the heart disease predictionsystem for five-fold in Cleveland datasetPerformancemeasurementparameters SVM LR DNN DT NB RF K-NN
Accuracy (%) 97.36 92.41 94.39 92.76 91.18 89.41 94.28Sensitivity (%) 98.78 93.90 95.73 96.23 90.44 87.35 95.30Specificity (%) 95.68 90.65 92.81 91.45 93.05 90.89 93.45Precision (%) 96.43 92.22 94.01 91.87 93.66 91.54 93.88NPV (%) 98.51 92.65 94.85 95.22 88.30 85.29 92.75F1 score 0.98 0.93 0.95 0.94 0.92 0.89 0.94MCC 0.95 0.85 0.89 0.87 0.82 0.78 0.87
92.41%, 94.39%, 92.76%, 91.18%, 89.41% and 94.28%for SVM, LR, DNN, DT, NB, RF, and K-NN when wechose five-fold cross-validation and in case of ten-foldcross-validation the accuracy is 95.38%, 90.43%, 92.74%,92.34%, 90.05%, 87.45%, and 92.85% for SVM, LR, DNN,DT, NB, RF, and K-NN respectively. Other performancemeasurement parameters: sensitivity, specificity, preci-sion, negative predictive value, F1 score, and Matthews
Table 33: Evaluation metrics of the heart disease predictionsystem for ten-fold in Cleveland datasetPerformancemeasurementparameters SVM LR DNN DT NB RF K-NN
Accuracy (%) 95.38 90.43 92.74 92.34 90.05 87.45 92.85Sensitivity (%) 96.95 90.85 95.12 95.05 90.87 87.68 95.48Specificity (%) 93.53 89.93 89.93 88.89 89.35 88.18 90.86Precision (%) 94.64 91.41 91.76 91.15 90.71 90.42 93.42NPV (%) 96.30 89.29 93.98 92.86 90.46 84.25 94.35F1 score 0.96 0.91 0.93 0.93 0.91 0.88 0.94MCC 0.91 0.81 0.85 0.84 0.81 0.74 0.87
correlation coefficient are given in Tables 32 and 33 andFigures 13 and 14.
In Statlog dataset, the experimental result shows that inboth the cases (five-fold and ten-fold) DNN works bet-ter than the other techniques. But in Cleveland dataset,SVM shows better results than the other methods (LR,DNN, DT, NB, NB, and K-NN). Here it can be noted

S.I. AYON ET AL.: CORONARY ARTERY HEART DISEASE PREDICTION 15
Figure 13: Evaluation metrics of the heart disease prediction (five-fold) system using Cleveland dataset
Figure 14: Evaluation metrics of the heart disease prediction (ten-fold) system using Cleveland dataset
that the five-fold gives better result compare to ten-foldcross-validation result.
5.3 Application
The systemusesmobile application, web server and cloudserver to predict the disease. The attribute values col-lected frompatients are sent to a cloud server inwhich thecomputation intelligencemodel is placed throughmobileapplication as well as web server. The prediction is sentback from cloud server to patients and doctor. Figure 15shows the real-time application of the coronary heart dis-ease prediction system. The mobile application demon-strates the predicted result for different input attributesvalue. Both the patient and doctor can use this appli-cation for their own purpose. First, the patients openthe app and input different attributes value like age, sex,cheese pain type, blood pressure, etc. The input valuesgo to the webserver and save the values there also. Insidethe cloud server, the predicted model is placed and using
the attributes value, the result is predicted and againacknowledge to the webserver. This result also saves inthe webserver. The patients and doctor can observe thepredicted result (i.e. if the patient has heart disease ornot) and the risk level. The risk level is marked into 0–4.0 means no risk and 4 means high risk.
5.4 Comparative Study
A comparative study of computational intelligence tech-niques in our study (SVM, LR, DNN, DT, NB, RF, andK-NN) and the existing system is shown in Tables 34and 35 for Statlog dataset and Cleveland dataset respec-tively. As the developed system used the same datasetbut the implementation techniques are different so wetake the direct experimental result from their paper with-out implementation of those methods. In Table 34 weobserved that A.K. Dwivedi [56] proposed a system topredict the heart disease using SVM and LR and theyfound 82% and 85% accuracy respectively. Chadha and

16 S.I. AYON ET AL.: CORONARY ARTERY HEART DISEASE PREDICTION
Figure 15: Real-time application of heart disease prediction system
Table 34: Comparison of our study (Statlog Dataset) withexistingmethods in terms of AccuracyAuthors Methods Accuracy (%)
A.K. Dwivedi [56] SVM 82.00Logistic regression 85.00
Chadha and Mayank [57] Decision tree 88.03Naïve Bayes 85.86
Caliskan and Yuksel [58] DNN 85.20Long et al. [59] Firefly algorithm 87.20Karayilan and Kilic [60] Neural Network 95.55Our Study SVM 97.41
Logistic regression 96.29DNN 98.15Decision Tree 96.42Naïve Bayes 91.38Random Forest 90.46K-NN 96.42
Mayank [57] used decision tree and Naïve Bayes to theirsystem and found an accuracy of 88.03% and 85.86%respectively. Caliskan and Yuksel [58] proposed a systemusing the deep neural network to predict heart diseaseand achieved an accuracy of 85.20%. Long et al. [59]proposed a system using firefly algorithm and found theaccuracy of 87.20%. Karavilan and Kilic [60] proposedsystem using the neural network with an accuracy rateof 95.55%.
In Table 35, the accuracy result shows that our experi-mental study is very effective for heart disease predictionusing SVM, LR, DNN, DT, NB, RF, and K-NN. Soni etal. [61] used association rules to predict the heart disease
Table 35: Comparison of our study (Cleveland Dataset) withexistingmethods in terms of AccuracyAuthors Methods Accuracy (%)
Soni et al. [61] Association rules 81.51Kumari and Godara [62] SVM 84.12Khemphila and Boonjing [63] Back Propagation MLP 89.56Feshki and Shijani [64] PSO and Feedforward
neural network91.94
Paul et al. [65] Adaptive FDSS 95.56Our Study SVM 97.36
Logistic regression 92.41DNN 94.39Decision Tree 92.76Naïve Bayes 91.18Random Forest 89.41KNN 94.28
and they obtained 81.51% accuracy. Kumari and Godara[62] used SVM and achieved an accuracy of 84.12%.Khemphaila and Boonjing [63] proposed amethod usingback propagation method with multilayer and they got89.56% accuracy. Feshki and Shijani [64] used PSO andfeedforward network and finally, they got the accuracy91.94%. Paul et al. [65] used an adaptive weighted fuzzyrule-based system (FDSS) to predict heart disease andthey got 95.56% accuracy in their system.
6. CONCLUSION
Heart disease is complicated and every year it causes alot of death. If the early symptoms of heart disease areignored, in a short period of time the patient may end

S.I. AYON ET AL.: CORONARY ARTERY HEART DISEASE PREDICTION 17
up having drastic consequences. In this system, we usedseven computational intelligence techniques to predictcoronary heart disease using the Statlog and Clevelandheart disease dataset. In the comparative study, the deepneural network performed better and obtained an accu-racy of 98.15% with Statlog dataset. In the case of Cleve-land dataset, SVMachieved an accuracy of 97.36%,whichis comparatively better than the others. This type of com-putational intelligence techniques plays an important rolein medical diagnoses. Hopefully, these techniques makethe physician’s works easier. In the future, the same tech-niques can also be applied to other disease prediction andalso some other intelligence techniques will be appliedto predict the coronary artery heart disease. The diver-sity of resources will deliver improved performance inknowledge extraction and a clear understanding of themeasuring and collecting data problems. The real-timeapplication will be updated and more features will beadded and a real-time website will be designed for theprediction of heart disease. The feature selection tech-niques can be applied in order to select the best input fea-tures that can improve the performance of the predictionsystem.
ACKNOWLEDGMENT
The authors would like to acknowledge the colleagues andfriends who make valuable comments on the study thatenhanced the quality of the research.
REFERENCES
1. Coronary Artery Disease. https://my.clevelandclinic.org/health/diseases/16898-coronary-artery-disease.
2. R. O. Bonow, D. L. Mann, D. P. Zipes, and P. Libby.Braunwald’s heart disease: A textbook of CardiovascularMedicine,” Vol. 9, Saunders, New York, 2012.
3. Risk Factors for Coronary Artery Disease. https://www.healthline.com/health/coronary-artery-disease/risk-factors.
4. K. Bache, and M. Lichman. “UCI machine learning repos-itory,” University of California, School of Information andComputer Science, Irvine, CA, 2013.
5. C. R. Boyd, M. A. Talson, and W. S. Copes, “Evaluatingtrauma care: The TRISS method. Trauma score and theinjury severity score,” J. Trauma, Vol. 27, pp. 370–8, 1987.
6. K. Durgesh, and S. L. Bhambhu, “Data classification usingsupport vector machine,” J. Theor. Appl. Inf. Technol.,Vol. 12, pp. 1–7, 2009.
7. T. V. Gestel et al., Benchmarking Least Squares SupportVector Machine Classifiers, Vol. 54. Kluwer Academic Pub-lishers (Machine Learning), 2004, pp. 5–32.
8. Y. Le Cun, Y. Bengio, and G. E. Hinton, “Deep learning,”Nature, Vol. 521, pp. 436–44, May 2015.
9. P. Domingos, and M. Pazzani, “On the optimality of thesimple Bayesian classifier under zero-one loss,” Mach.Learn., Vol. 29, pp. 103–30, 1997.
10. S. Sohn, and J. Kim, “Decision tree-based technology creditscoring for start-up firms: Korean case,” Expert. Syst. Appl.,Vol. 39, no. 4, pp. 4007–12, 2012.
11. D. Gao, Y. X. Zhang, and Y. H. Zhao, “Random forestalgorithm for classification of multiwavelength data,” Res.Astron. Astrophys., Vol. 9, no. 2, pp. 220–6, 2009.
12. J. P. Gou, H. X. Ma, W. H. Ou, S. N. Zeng, Y. B. Rao, andH. B. Yang, “A generalized mean distance-based k-nearestneighbor classifier,”Expert Syst. Appl., Vol. 115, pp. 356–72,Jan. 2019.
13. S. I. Ayon, and M. M. Islam, “Diabetes prediction: A deeplearning approach,” Int. J. Inf. Eng. Electron. Bus., Vol. 11,no. 2, pp. 21–7, Mar. 2019.
14. M. Gunasekaran, R. Varatharaian, and M. K. Priyan,“Hybrid recommendation system for heart disease diagno-sis based on multiple kernel learning with adaptive neuro-fuzzy inference system,”Multimed. Tools. Appl., Vol. 77, no.4, pp. 4379–99, 2018.
15. M. K. Hasan, M. M. Islam, and M. M. A. Hashem,“Mathematical model development to detect breast cancerusing multigene genetic programming,” in 5th Interna-tional Conference on Informatics, Electronics and vision(ICIEV), Dhaka, 2016, pp. 574–9.
16. M. R. Haque, M. M. Islam, H. Iqbal, M. S. Reza, and M.K. Hasan, “Performance evaluation of random forests andArtificial neural networks for the classification of Liverdisorder,” in InternationalConference onComputer, Com-munication, Chemical, Material and Electronic Engineer-ing (IC4ME2), Rajshahi, 2018, pp. 1–5.
17. M. M. Islam, H. Iqbal, M. R. Haque, and M. K. Hasan,“Prediction of breast cancer using support vector machineand K-Nearest neighbors,” in IEEE Region 10 Humani-tarian Technology Conference (R10-HTC), Dhaka, 2018,pp. 226–9.
18. K. Kadam, V. K. Pooja, and P. M. Amita, “Cardiovasculardisease prediction using data mining techniques: A pro-posed framework using big data approach,” in AdvancedMetaheuristic Methods in Big Data Retrieval and Analytics,IGI Globa, Hershey, 2018, pp. 159–79.
19. K. Mathan, P. M. Kumar, P. Panchatcharam, G. Manoga-ram, and R. Varadharaian, “A novel gini index decisiontree dataminingmethodwith neural network classifiers forprediction of heart disease,” Des. Autom. Embedded Syst.,Vol. 22, no. 3, 1–18, 2018.
20. S. Shylaja, and R. Muralidharan, “Comparative analysis ofvarious classification and clustering algorithms for heart
18 S.I. AYON ET AL.: CORONARY ARTERY HEART DISEASE PREDICTION
disease prediction system,” Biometrics Bioinf., Vol. 10,no. 4, pp. 74–7, 2018.
21. P. Singh, S. Singh, andG. S. Pandi-Jain, “Effective heart dis-ease prediction system using data mining techniques,” Int.J. Nanomed., Vol. 13, no. 121, pp. 47–70, 2018.
22. S. Dwivedi, P. Kasliwal, and S. Soni, “Comprehensive studyof data analytics tools (RapidMiner,Weka, R tool, Knime),”in Symposium on Colossal data analysis and Networking(CDAN),” Indore, 2016, pp. 1–8.
23. K. Rangra, and K. L. Bansal, “Comparative study of datamining tools,” Int. J. Adv. Res. Comput. Sci. Softw. Eng.,Vol. 4, no. 6, pp. 216–23, Jun. 2014.
24. W.Guan, A.Gray, and S. Leyffer, “Inmixed-integer supportvector machine,” in Mini Symposia & Workshops NIPS,2013, pp. 1–6.
25. S. Shilaskar, and A. Ghatol, “Feature selection for medicaldiagnosis: evaluation for cardiovascular diseases,” Expert.Syst. Appl., Vol. 40, pp. 4146–53, 2013.
26. Y. E. Shao, C. D. Hou, and C. C. Chiu, “Hybrid intelligentmodeling schemes for heart disease classification,” Appl.Soft. Comput., Vol. 14, pp. 47–52, 2014.
27. S. U. Kumar, and H. H. Inbarani, “A novel neighborhoodrough set based classification approach for medical diag-nosis,” Procedia. Comput. Sci., Vol. 47, pp. 351–9, 2015.
28. S. Rajathi, andG. Radhamani, “Prediction and analy-sis of Rheumatic heart disease using KNN classifica-tion with ACO,” International conference on data miningand advanced computing (SAPIENCE),” Ernakulam, 2016,pp. 68–73.
29. S. Bashir, U. Qamar, and M. Y. Javed, “An ensemble-baseddecision support framework for intelligent heart disease diag-nosis,” in Information Society International Conference,IEEE, 2014, pp. 259–64.
30. S. U. Amin, K. Agarwal, and R. Beg, “Genetic neuralnetwork-based data mining in prediction of heart dis-ease using risk factors,” Information and CommunicationTechnologies (ICT), IEEE, 2013, pp. 1227–31.
31. V. Khatibi, and G. A. Montazer, “A fuzzy-evidential hybridinference engine for coronary heart disease risk assess-ment,” Expert Syst. Appl., Vol. 37, pp. 8536–42, 2010.
32. F. Temurtas, and A. C. Tanrikulu, “An approach on prob-abilistic neural network for diagnosis of mesothelioma’sdisease,” Comput. Electr. Eng., Vol. 38, 75–81, 2012.
33. N. Yumusak, and F. Temurtas, “Chest diseases diagno-sis using artificial neural networks,” Expert. Syst. Appl.,Vol. 37, 7648–55, 2010.
34. X. Liu, D. Tosun, M. W. Weiner, and N. Schuff, “Locallylinear embedding for MRI based Alzheimer’s disease clas-sification,” NeuroImage, Vol. 83, pp. 148–57, 2013.
35. S. Nashif, M. R. Raihan, M. R. Islam, and M. H.Imam, “Heart disease detection by using machine learningalgorithms and a real-time Cardiovascular health moni-toring system,” World J. Eng. Technol., Vol. 6, pp. 854–73,2018.
36. M. Singh, L. M. Martins, P. Joanis, and V. K. Mago, “Build-ing a cardiovascular disease predictive model using struc-tural equation model and fuzzy cognitive map,” in IEEEInternational Conference on fuzzy systems (FUZZ), Van-couver, 24–29 July 2016, pp. 1377–82.
37. P. Ghadge, V. Girme, K. Kokane, and P. Deshmukh, “Intel-ligent heart attack prediction system using Big data,” Int.J. Recent Res. Math. Comput. Sci. Inf. Technol., Vol. 2, pp.73–7, 2016.
38. Z. Xuan, “Computational intelligence techniques andapplications,” in Computational Intelligence Techniques inEarth and Environmental Sciences, Springer, Dordrecht,2014, pp. 3–26.
39. E. L. Rubio, D. A. Elizondo, M. Grootveld, J. M. Jerez, andR. M. L. Baena, “Computational intelligence techniquesin medicine,” Comput. Math. Methods. Med., Vol. 2015,Article ID 196976 pp. 1–2, 2015.
40. A. H. Shahid, andM. P. Singh, “Computational intelligencetechniques for medical diagnosis and prognosis: prob-lems and current developments,” Biocybern. Biomed. Eng.,Vol. 39, no. 3, pp. 638–72, Sep. 2019.
41. H. R. Tizhoosh, and L. Pantanowitz, “Artificial intelli-gence and digital pathology: Challenges and opportuni-ties,” J. Pathol. Inform., Vol. 9, no. 38, pp. 1–6, Nov. 2018.
42. E. Lin, Q. Chen, and X. Qi. “Deep Reinforcement Learningfor Imbalanced Classification” arXiv: 1901.01379 [cs.LG],2019.
43. J. Zhi, J. Sun, Z. Wang, and W. Ding, “Support vectormachine classifier for prediction of the metastasis of col-orectal cancer,” Int. J.Mol.Med., Vol. 41, no. 3, pp. 1419–26,Jan. 2018.
44. H. Wang, B. Zheng, S. W. Yoon, and H. S. Ko, “A supportvector machine-based ensemble algorithm for breast can-cer diagnosis,” Eur. J. Oper. Res., Vol. 267, no. 2, pp. 687–99,June 2018.
45. L. M. Kemppainen, T. T. Kemppainen, J. A. Reippainen,S. T. Salmenniemi, and P. H. Vuolanto, “Use of com-plementary and alternative medicine in Europe: Health-related and sociodemographic determinants,” Scand. J.Public Health, Vol. 46, no. 4, pp. 448–55, 2018.
46. P. Khosravi, E. Kazemi, M. Imielinski, O. Elemento, andI. Hajirasouliha, “Deep Convolutional neural networksEnableDiscrimination ofHeterogeneousDigital pathologyImages,” EBioMedicine., Vol. 27, pp. 317–28, 2017.
47. F. Liu, Z. Zhou, H. Jang, A. Samsonov, G. Zhao, and R.Kijowski, “Deep Convolutional neural network and 3D
S.I. AYON ET AL.: CORONARY ARTERY HEART DISEASE PREDICTION 19
Deformable approach for tissue segmentation in Mus-culoskeletal Magnetic resonance imaging,” Magn. Reson.Med., Vol. 79, pp. 2379–91, 2018.
48. J. M. Gonzalez-Cava, J. A. Reboso, J. L. Casteleiro-Roca,J. L. Calvo-Rolle, and J. A. Méndez Pérez, “A Novel fuzzyalgorithm to introduce new variables in the drug sup-ply decision-making process in medicine,” Complexity,Vol. 2018, pp. 1–15, 2018.
49. X. Liu, H. Zhu, R. Lu, and H. Li, “Efficient privacy-preserving online medical primary diagnosis scheme onnaive Bayesian classification,” Peer-to-Peer Netw. Appl.,Vol. 11, no. 2, pp. 334–47, Mar. 2018.
50. G. Campanella, A. R. Rajanna, L. Corsale, P. J. Schüffler,Y. Yagi, and T. J. Fuchs, “Towards machine learned qual-ity control: a benchmark for sharpness quantification indigital pathology,” Comput. Med. Imaging Graph., Vol. 65,pp. 142–51, April 2018.
51. H. Nguyen, and X. N. Bui, “Predicting blast-induced airoverpressure: a robust artificial intelligence system basedon Artificial neural networks and Random Forest,” Nat.Resour. Res., Vol. 28, no. 3, pp. 893–907, July 2019.
52. Z. Cai, J Gu, C Wen, D Zhao, C Huang. “An intelligentParkinson’s disease diagnostic system based on a chaoticbacterial foraging optimization enhanced fuzzy KNNapproach,”Comput.Math.Method.Med., Vol. 2018, ArticleID 2396952, 24 pages, 2018. doi:10.1155/2018/2396952.
53. B. B. Nouma,N.Mezghani, A.Mitiche, andY.Ouakrim, “Avariational method to determine the most representativeshape of a set of curves and its application to knee kine-matic data for pathology classification,” in 2nd Mediter-ranean Conference on Pattern Recognition and Artificialintelligence, Rabat, Morocco, March 27–28, 2018.
54. Statlog Heart Dataset. http://archive.ics.uci.edu/ml/datasets/statlog+(heart).
55. Heart Disease Dataset. https://archive.ics.uci.edu/ml/datasets/heart+Disease.
56. A. K. Dwivedi, “Performance evaluation of differentmachine learning techniques for prediction of heartdisease,” Neural Comput. Appl., Vol. 29, pp. 685–93,2018.
57. R. Chadha, and S. Mayank, “Prediction of heart diseaseusing data mining techniques,” CSI Trans. ICT, Vol. 4,pp. 193–8, 2016.
58. A. Caliskan, and M. E. Yuksel, “Classification of coronaryartery disease datasets by using a deep neural network,”Euro Biotech J., Vol. 1, pp. 271–7, 2017.
59. N. C. Long, P. Meesad, and H. Unger, “A highly accu-rate firefly-based algorithm for heart disease prediction,”Expert. Syst. Appl., Vol. 42, pp. 8221–31, 2015.
60. T. Karayilan, and O. Kilic, “Prediction of heart diseaseusing neural network,” in 2nd International Conference onComputer and Engineering, 2017, pp. 719–23.
61. J. Soni, U. Ansari, D. Sharma, and S. Soni, “Intelligent andeffective heart disease prediction system using weightedassociative classifiers,” Int. J. Comput. Sci. Eng., Vol. 3, no. 6,pp. 2385–92, 2011.
62. M. Kumari, and S. Godara, “Comparative study of datamining classification methods in cardiovascular diseaseprediction,” IJCST, Vol. 2, no. 2, pp. 304–308, 2011.
63. A. Khemphila, and V. Boonjing, “Heart disease classi-fication using neural network and feature selection,” inSystems Engineering (ICSEng), 21st International Confer-ence, IEEE, 2011.
64. M. G. Feshki, and O. S. Shijani, “Improving the heartdisease diagnosis by evolutionary algorithm of PSO andfeed forward neural network,” in Artificial Intelligence andRobotics (IRANOPEN), Qazvin, 2016, pp. 48–53.
65. A. K. Paul, P. C. Shill,M. R. Islam, andK.Murase, “Adaptiveweighted fuzzy rule-based system for the risk level assess-ment of heart disease,” Appl Intell., Vol. 48, pp. 1739–56,2018.
20 S.I. AYON ET AL.: CORONARY ARTERY HEART DISEASE PREDICTION
Authors
Safial Islam Ayon received B.Sc. degree inComputer Science and Engineering (CSE)departments at the Khulna Universityof Engineering and Technology (KUET),Bangladesh in 2019. He is currently alecturer of Computer Science Engineer-ing department at the Bangladesh ArmyUniversity of Engineering & Technology
(BAUET), Natore. His research interests focus on deep neu-ral network, machine learning, embedded systems, and swarmintelligence.
Email: [email protected]
Md.Milon Islam received B.Sc. andM.Sc.degree in Computer Science Engineering(CSE) from theKhulnaUniversity of Engi-neering & Technology (KUET), Khulna,Bangladesh in 2016 and 2019, respectively.He joined as a lecturer at the Departmentof CSE, KUET in 2017. His research inter-ests include computer vision, embedded
system, machine learning and to solve real-life problems withthe concept of computer science.
Corresponding author. Email:[email protected]
Md. Rahat Hossain is a dedicated andarticulate lecturer at CQUniversity, Aus-tralia with extensive teaching and learn-ing experience across different areas ofInformation and Communication Tech-nology (ICT). He moved to Rockhamp-ton, Australia from Bangladesh in March2010 and completed his Ph.D. in Com-
putational Intelligence in 2013 at CQUniversity. Prior to hiscurrent academic position, Rahat acquired more than sevenyears of learning and teaching experience in the Departmentof Computer Science and Information Technology at IslamicUniversity of Technology, Bangladesh. He achieved the “Stu-dent Voice Commendation Award for Distance Educator of theyear 2018, 2017 & 2016” and obtained a place in the 2018 EarlyCareer Researcher (ECR) Program at CQUniversity. Rahat Pos-sesses record of ability to conduct high-quality research thatis reflected in the authorship of high-quality publications andother research outputs in the areas of ICT. He possesses aca-demic poise and learning agility – grasps information quickly– detail orientated – acknowledges the larger context of a givensituation. When Rahat isn’t glued to a computer screen, hespends time with his family, working in the garden and watch-ing cricket. He is currently working on an article about “Renew-able Energy”.
Email:[email protected]