Embed Size (px)
Citation preview

Coronavirus (COVID-19): Credit Risk Impact
on Commercial Real Estate Loan Portfolios
April 24, 2020Moody’s Analytics

Credit Risk Impact on CRE Loan Portfolios | April 24, 2020 2
Victor Calanog, PhDHead of Commercial Real Estate Economics
Moody’s Analytics
Jun Chen, PhDHead of Commercial Real Estate Research
Moody’s Analytics
Chris HenkelBusiness Development and Advisory Services Lead
Moody’s Analytics
Credit Risk Impact on CRE Loan Portfolios | April 24, 2020 3
1. Property Types & Geographic Markets: Anticipating Distress
2. Historical Credit Cycles and Key Risk Drivers
3. CRE Portfolio Analysis: Customer Case Studies
4. Questions & Answers
Agenda

1Property Types &
Geographic Markets:
Anticipating Distress
Credit Risk Impact on CRE Loan Portfolios | April 24, 2020 5
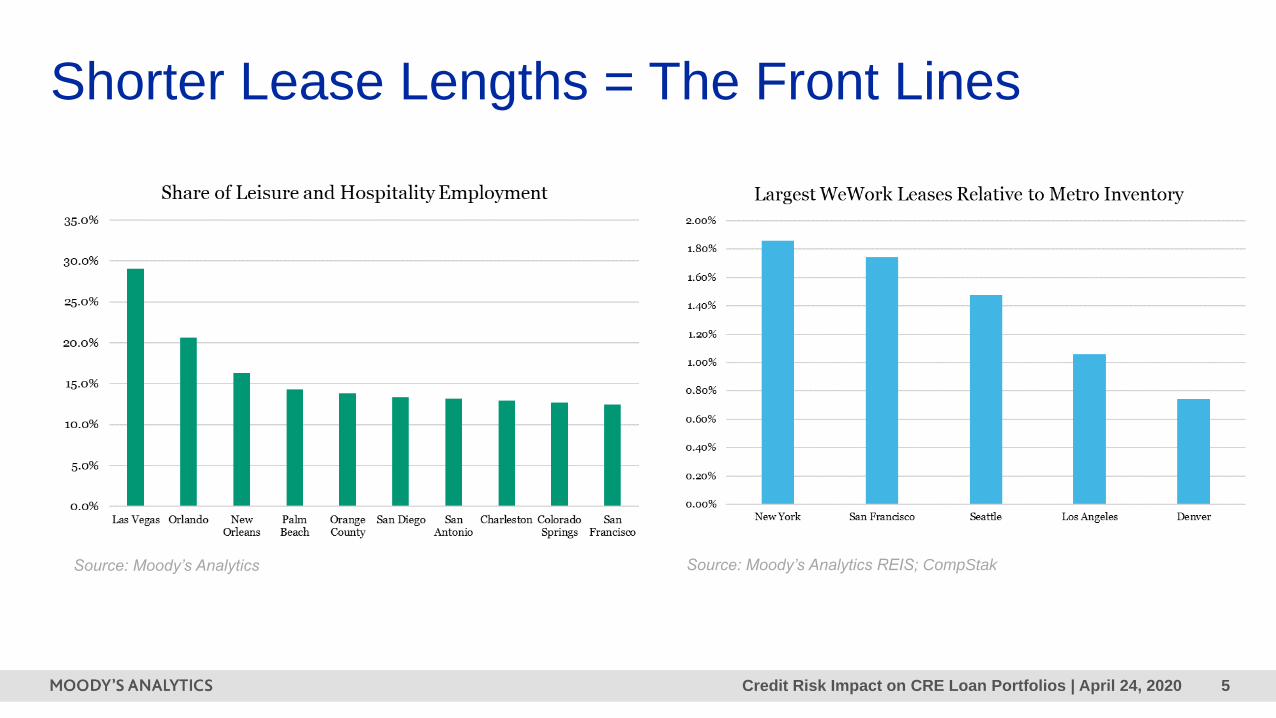
Shorter Lease Lengths = The Front Lines
Source: Moody’s Analytics Source: Moody’s Analytics REIS; CompStak
Credit Risk Impact on CRE Loan Portfolios | April 24, 2020 6
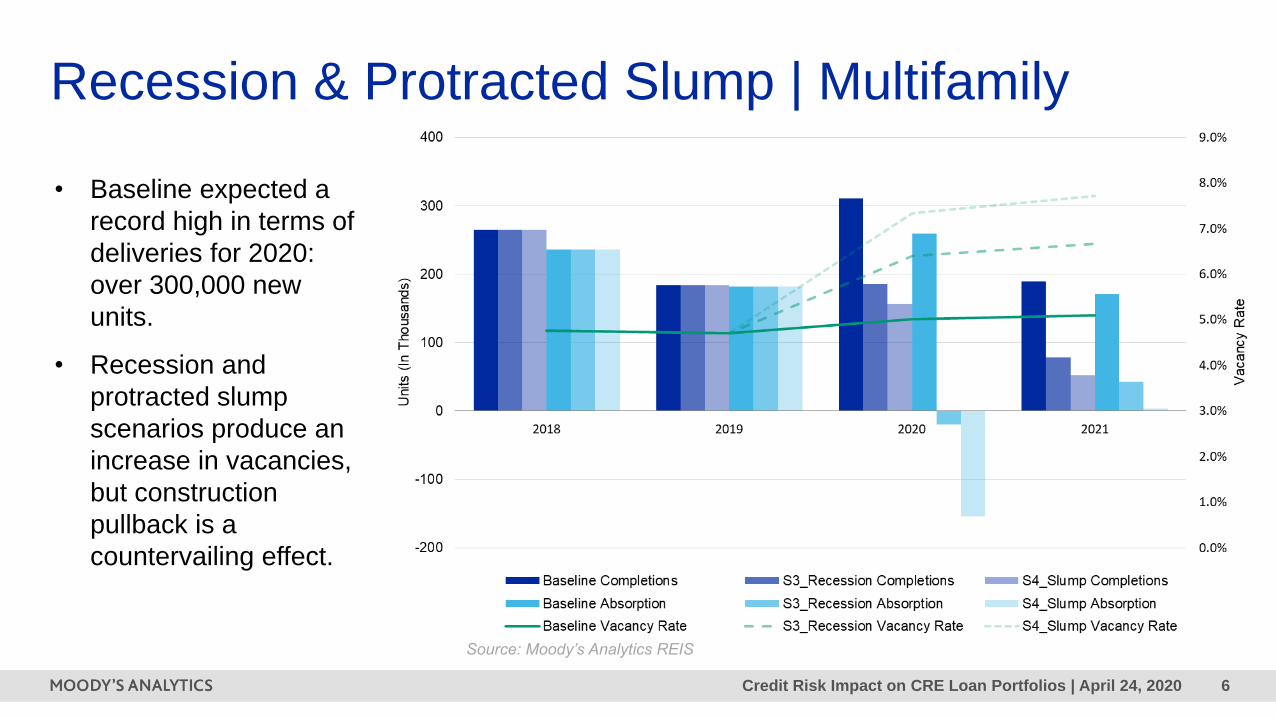
Recession & Protracted Slump | Multifamily
• Baseline expected a
record high in terms of
deliveries for 2020:
over 300,000 new
units.
• Recession and
protracted slump
scenarios produce an
increase in vacancies,
but construction
pullback is a
countervailing effect.
Source: Moody’s Analytics REIS
Credit Risk Impact on CRE Loan Portfolios | April 24, 2020 7
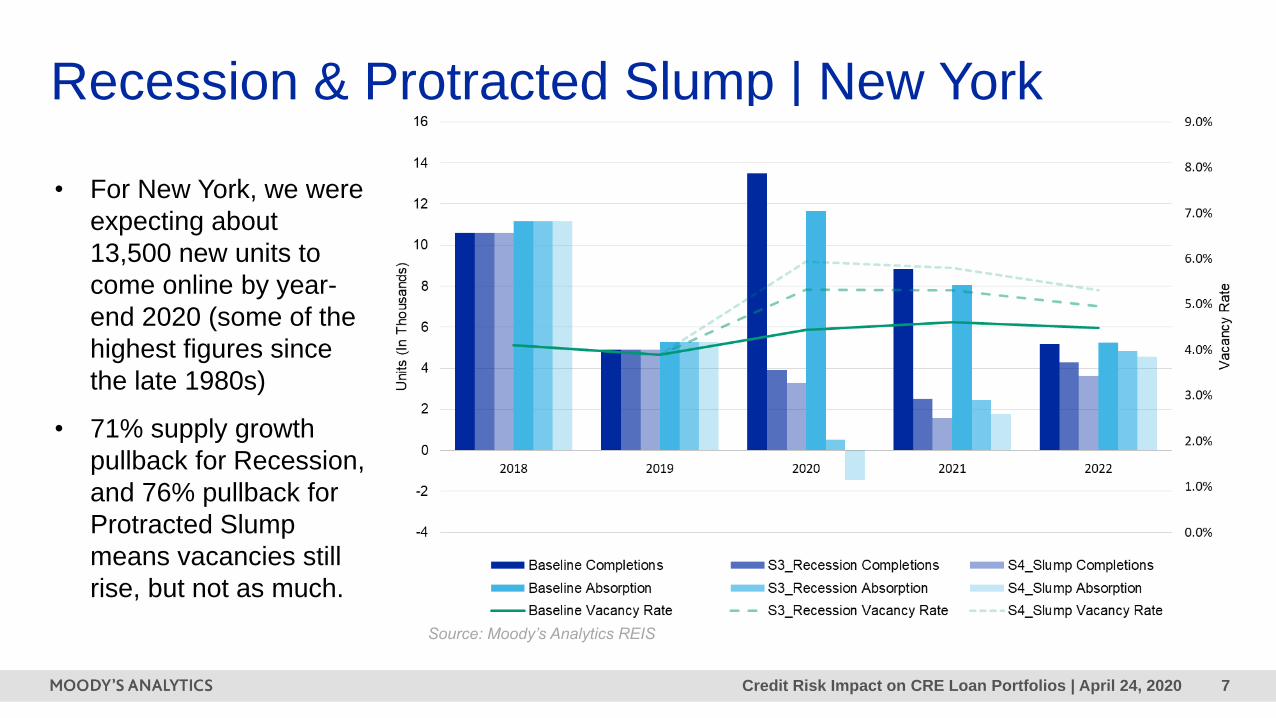
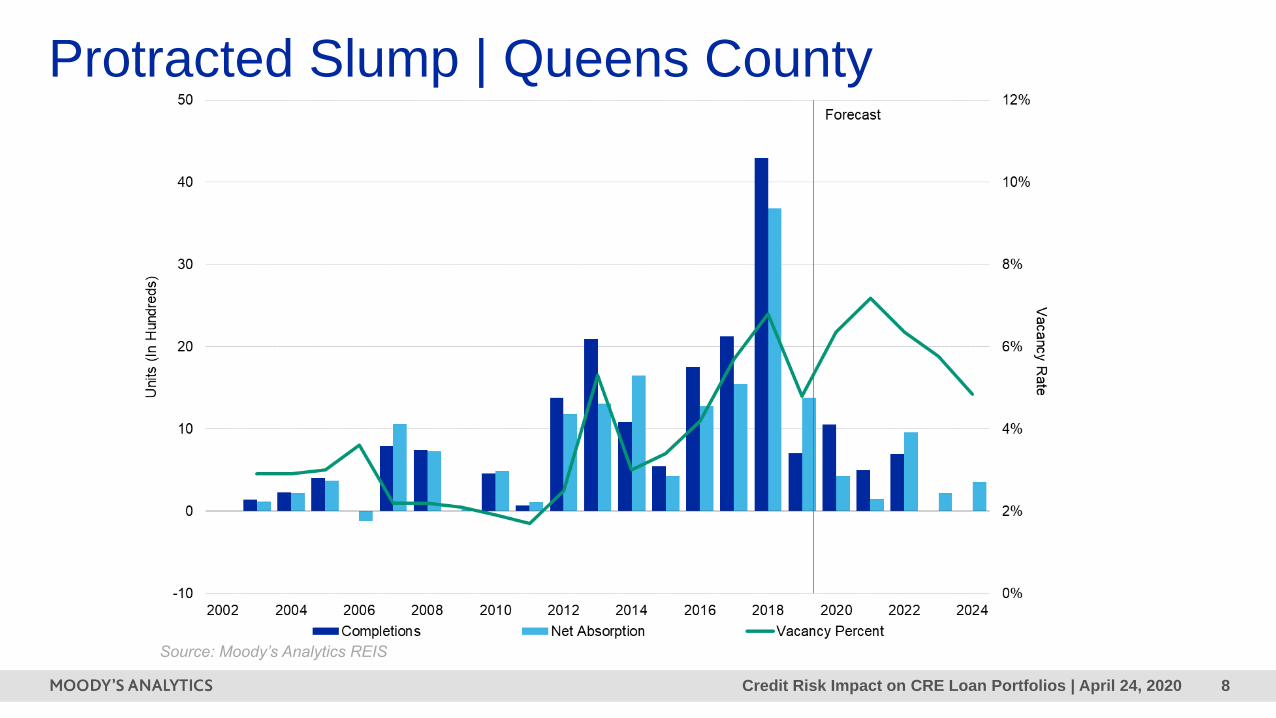
Recession & Protracted Slump | New York
• For New York, we were
expecting about
13,500 new units to
come online by year-
end 2020 (some of the
highest figures since
the late 1980s)
• 71% supply growth
pullback for Recession,
and 76% pullback for
Protracted Slump
means vacancies still
rise, but not as much.
Source: Moody’s Analytics REIS
Credit Risk Impact on CRE Loan Portfolios | April 24, 2020 8
Protracted Slump | Queens County
Source: Moody’s Analytics REIS
Credit Risk Impact on CRE Loan Portfolios | April 24, 2020 9
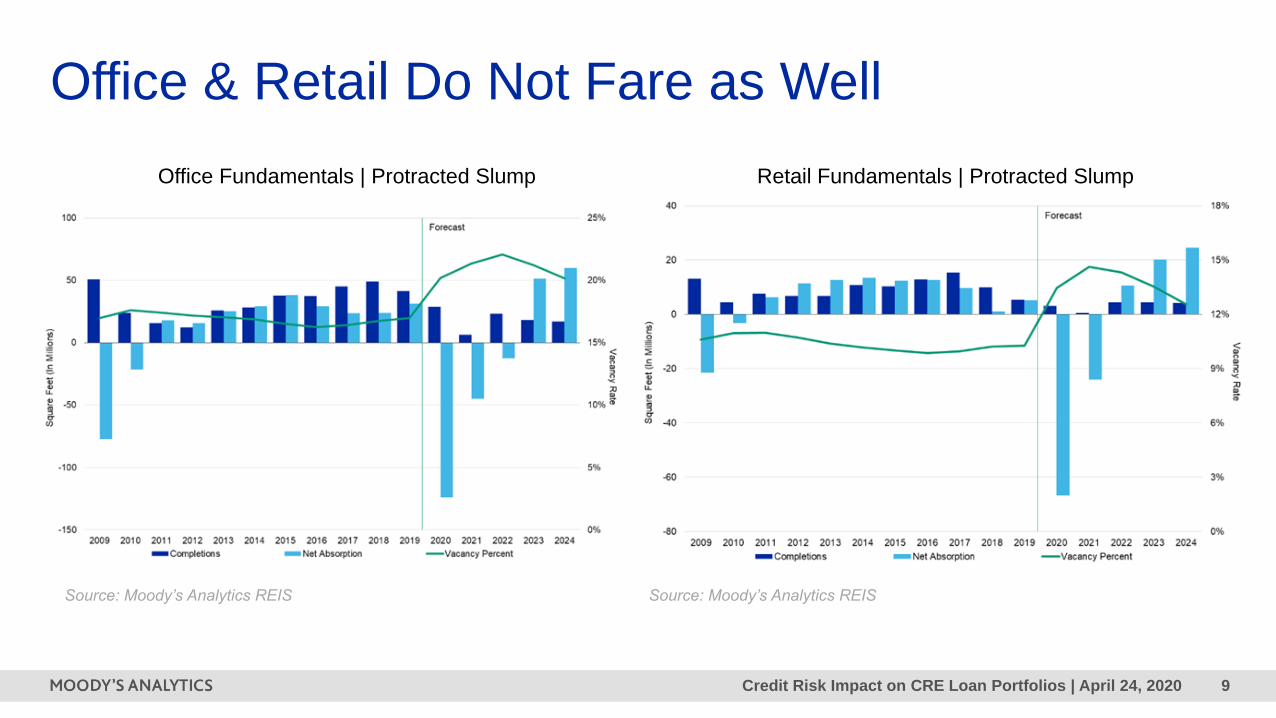
Office & Retail Do Not Fare as Well
Source: Moody’s Analytics REIS
Office Fundamentals | Protracted Slump Retail Fundamentals | Protracted Slump
Source: Moody’s Analytics REIS
Credit Risk Impact on CRE Loan Portfolios | April 24, 2020 10
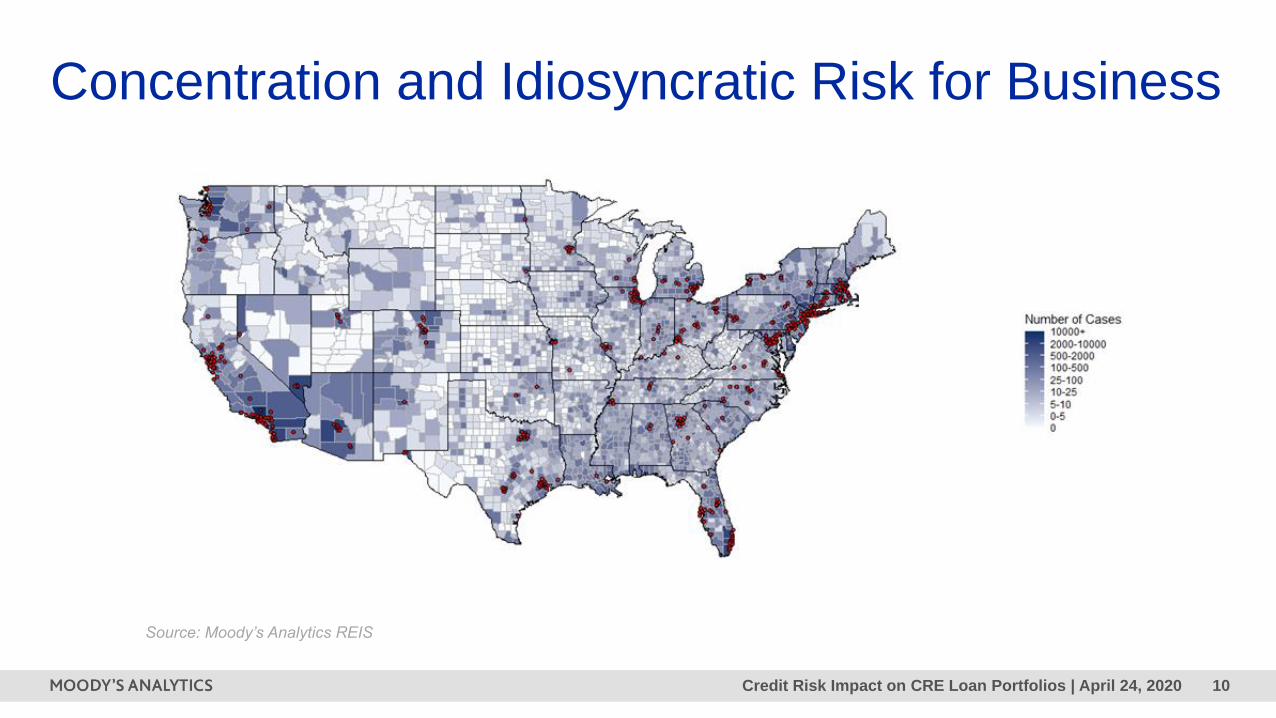
Concentration and Idiosyncratic Risk for Business
Source: Moody’s Analytics REIS
Credit Risk Impact on CRE Loan Portfolios | April 24, 2020 11
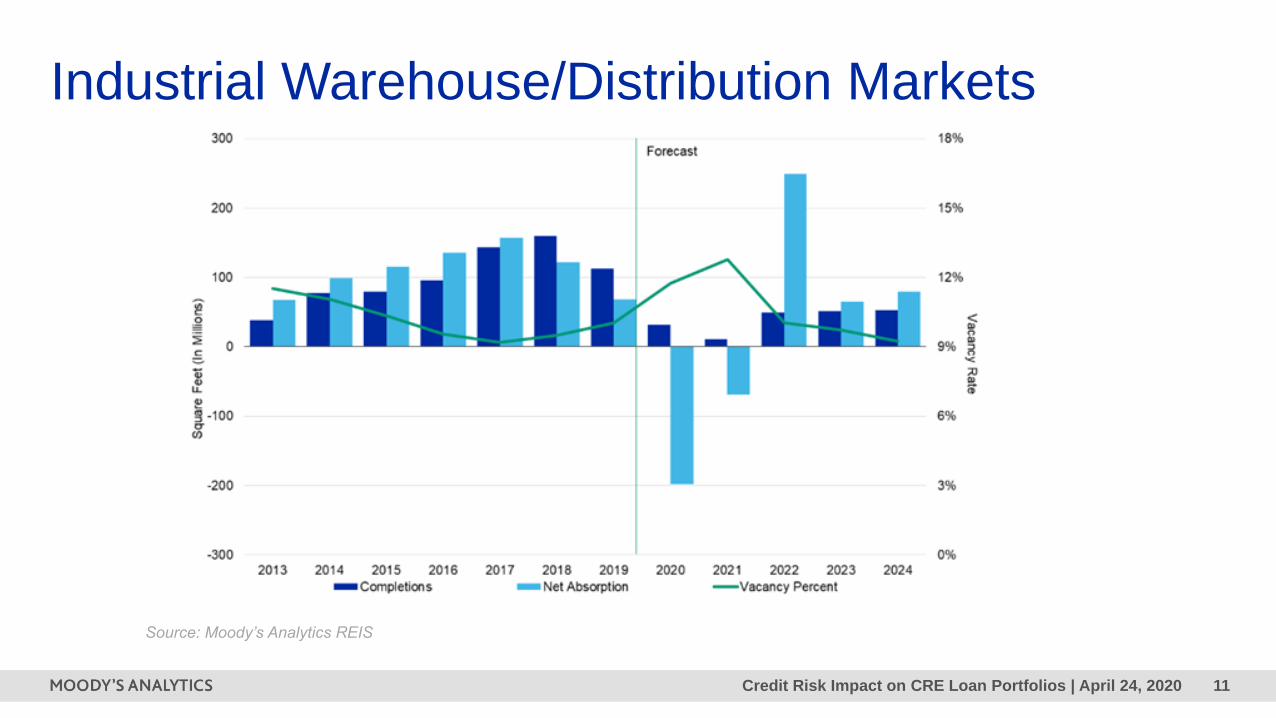
Industrial Warehouse/Distribution Markets
Source: Moody’s Analytics REIS

2 Historical Credit Cycles and
Key Risk Drivers
Credit Risk Impact on CRE Loan Portfolios | April 24, 2020 13
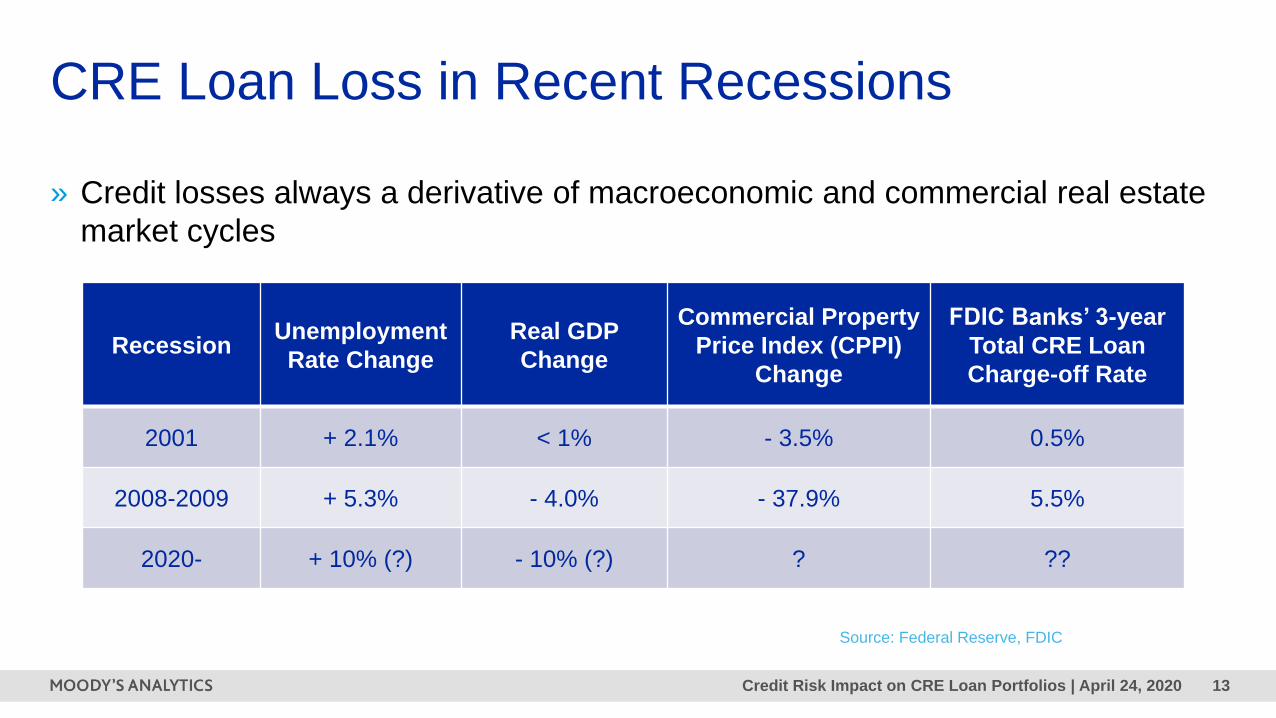
» Credit losses always a derivative of macroeconomic and commercial real estate
market cycles
CRE Loan Loss in Recent Recessions
RecessionUnemployment
Rate Change
Real GDP
Change
Commercial Property
Price Index (CPPI)
Change
FDIC Banks’ 3-year
Total CRE Loan
Charge-off Rate
2001 + 2.1% < 1% - 3.5% 0.5%
2008-2009 + 5.3% - 4.0% - 37.9% 5.5%
2020- + 10% (?) - 10% (?) ? ??
Source: Federal Reserve, FDIC
Credit Risk Impact on CRE Loan Portfolios | April 24, 2020 14
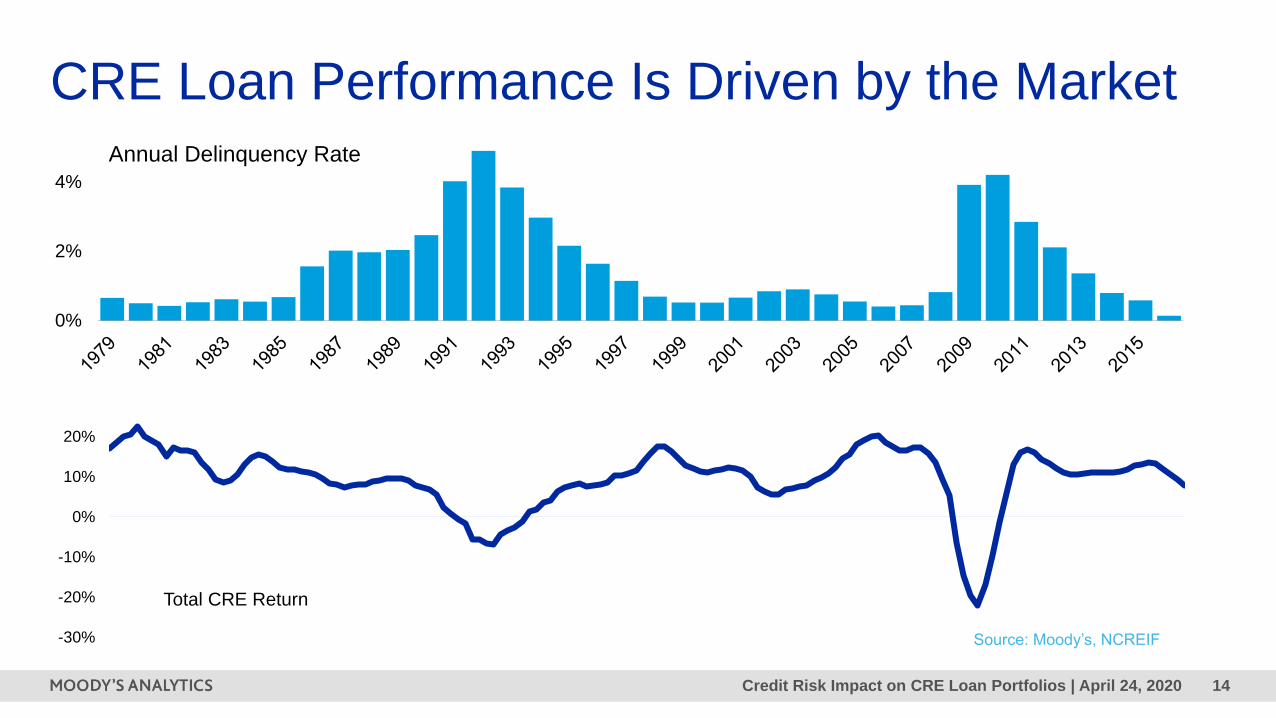
0%
2%
4%
Annual Delinquency Rate
-30%
-20%
-10%
0%
10%
20%
Total CRE Return
Source: Moody’s, NCREIF
CRE Loan Performance Is Driven by the Market
Credit Risk Impact on CRE Loan Portfolios | April 24, 2020 15
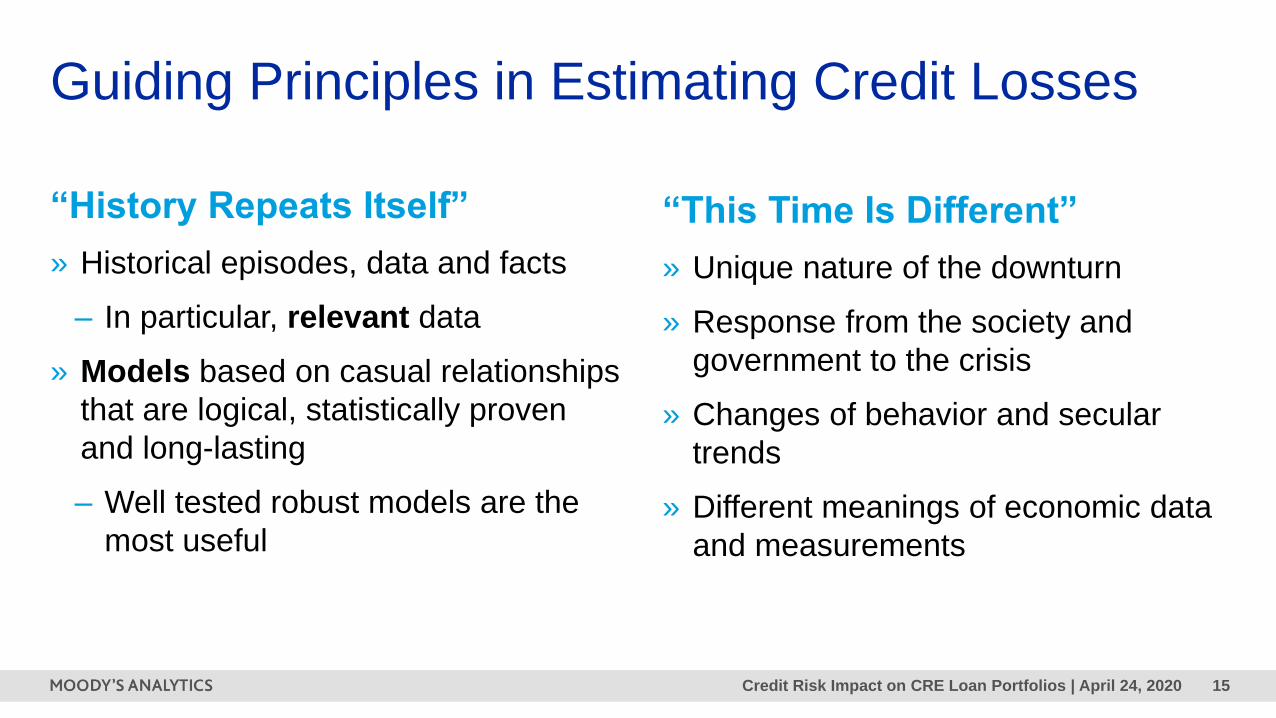
Guiding Principles in Estimating Credit Losses
“History Repeats Itself”
» Historical episodes, data and facts
– In particular, relevant data
» Models based on casual relationships
that are logical, statistically proven
and long-lasting
– Well tested robust models are the
most useful
“This Time Is Different”
» Unique nature of the downturn
» Response from the society and
government to the crisis
» Changes of behavior and secular
trends
» Different meanings of economic data
and measurements
Credit Risk Impact on CRE Loan Portfolios | April 24, 2020 16
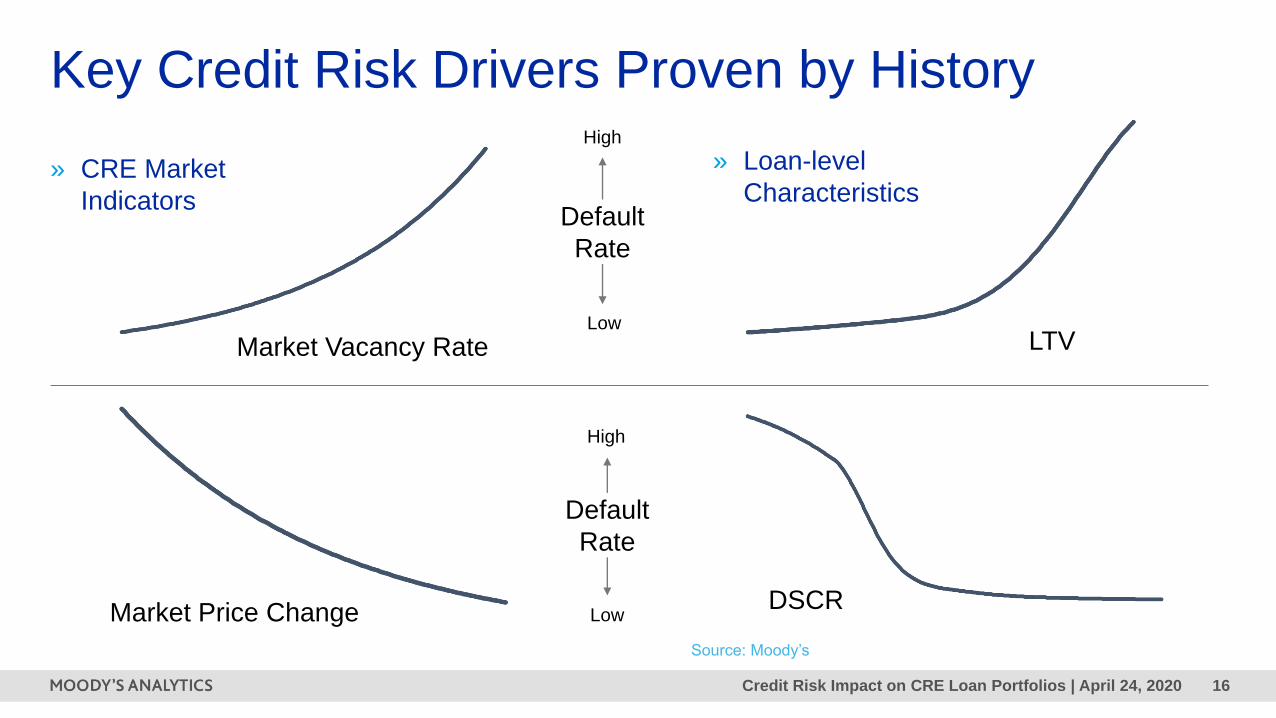
Source: Moody’s
Key Credit Risk Drivers Proven by History
LTV
DSCR
Market Vacancy Rate
Market Price Change
Default
Rate
Default
Rate
High
Low
High
Low
» CRE Market
Indicators
» Loan-level
Characteristics
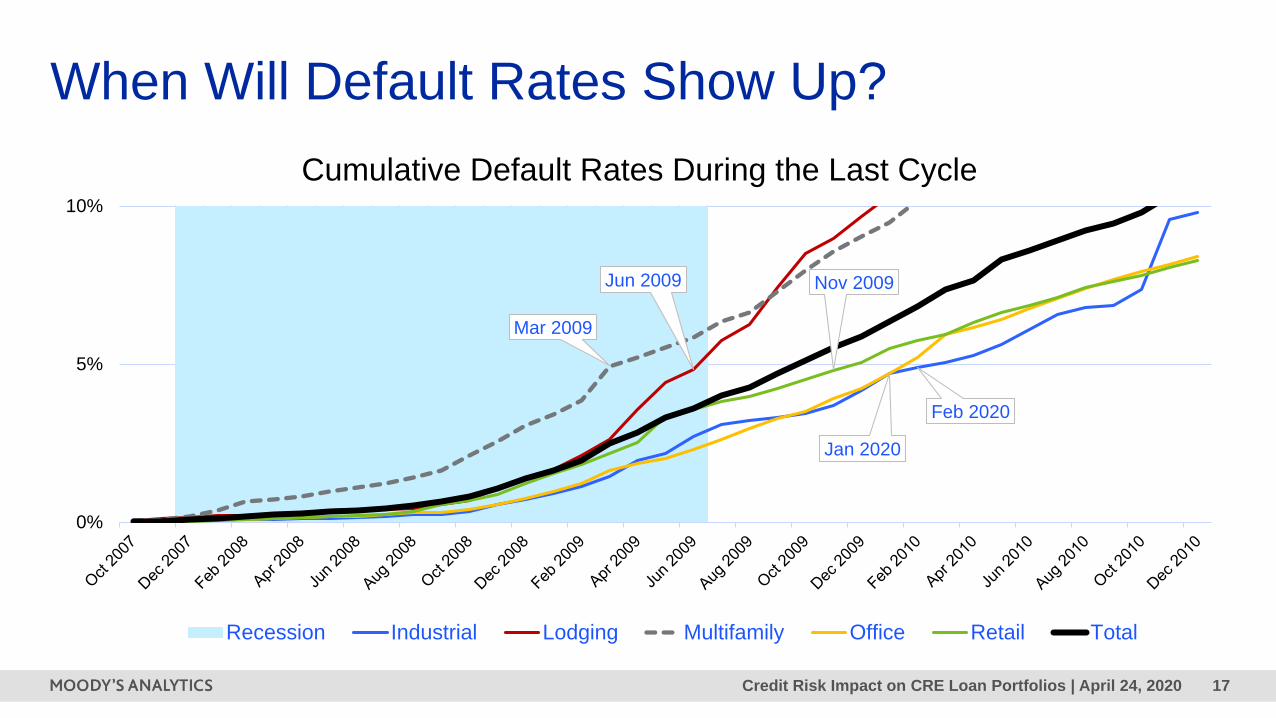
Credit Risk Impact on CRE Loan Portfolios | April 24, 2020 17
When Will Default Rates Show Up?
Feb 2020
Jun 2009
Mar 2009
Jan 2020
Nov 2009
0%
5%
10%
Cumulative Default Rates During the Last Cycle
Recession Industrial Lodging Multifamily Office Retail Total
Credit Risk Impact on CRE Loan Portfolios | April 24, 2020 18
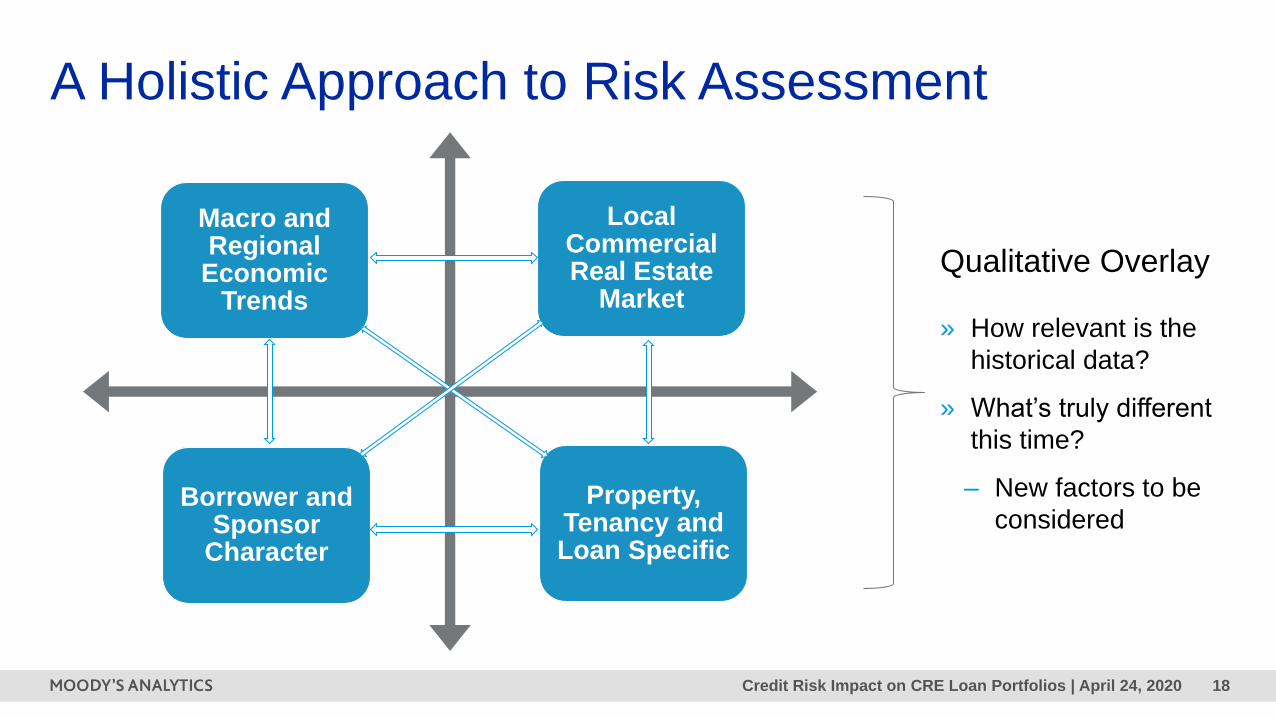
Property, Tenancy and Loan Specific
Local Commercial Real Estate
Market
Borrower and Sponsor
Character
Macro and Regional
Economic Trends
A Holistic Approach to Risk Assessment
Qualitative Overlay
» How relevant is the
historical data?
» What’s truly different
this time?
– New factors to be
considered
Credit Risk Impact on CRE Loan Portfolios | April 24, 2020 19
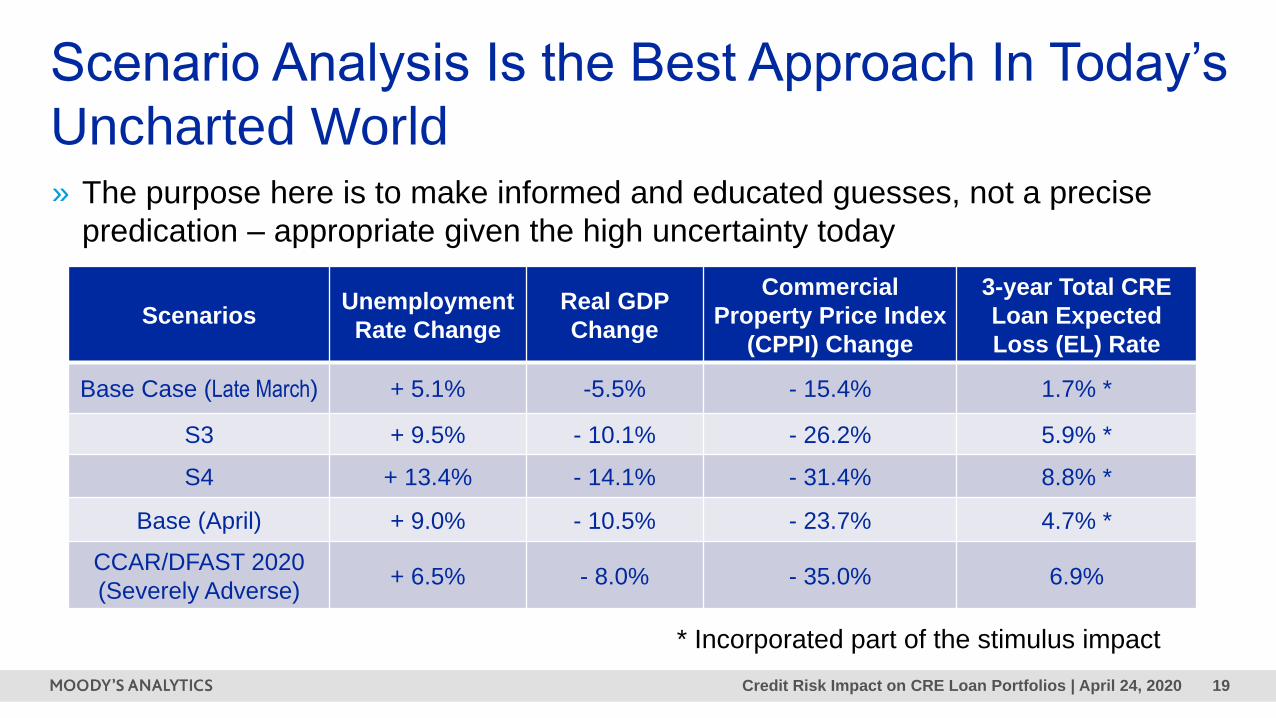
» The purpose here is to make informed and educated guesses, not a precise
predication – appropriate given the high uncertainty today
Scenario Analysis Is the Best Approach In Today’s
Uncharted World
ScenariosUnemployment
Rate Change
Real GDP
Change
Commercial
Property Price Index
(CPPI) Change
3-year Total CRE
Loan Expected
Loss (EL) Rate
Base Case (Late March) + 5.1% -5.5% - 15.4% 1.7% *
S3 + 9.5% - 10.1% - 26.2% 5.9% *
S4 + 13.4% - 14.1% - 31.4% 8.8% *
Base (April) + 9.0% - 10.5% - 23.7% 4.7% *
CCAR/DFAST 2020
(Severely Adverse)+ 6.5% - 8.0% - 35.0% 6.9%
* Incorporated part of the stimulus impact

3 CRE Portfolio Analysis:
Customer Case Studies
Credit Risk Impact on CRE Loan Portfolios | April 24, 2020 21
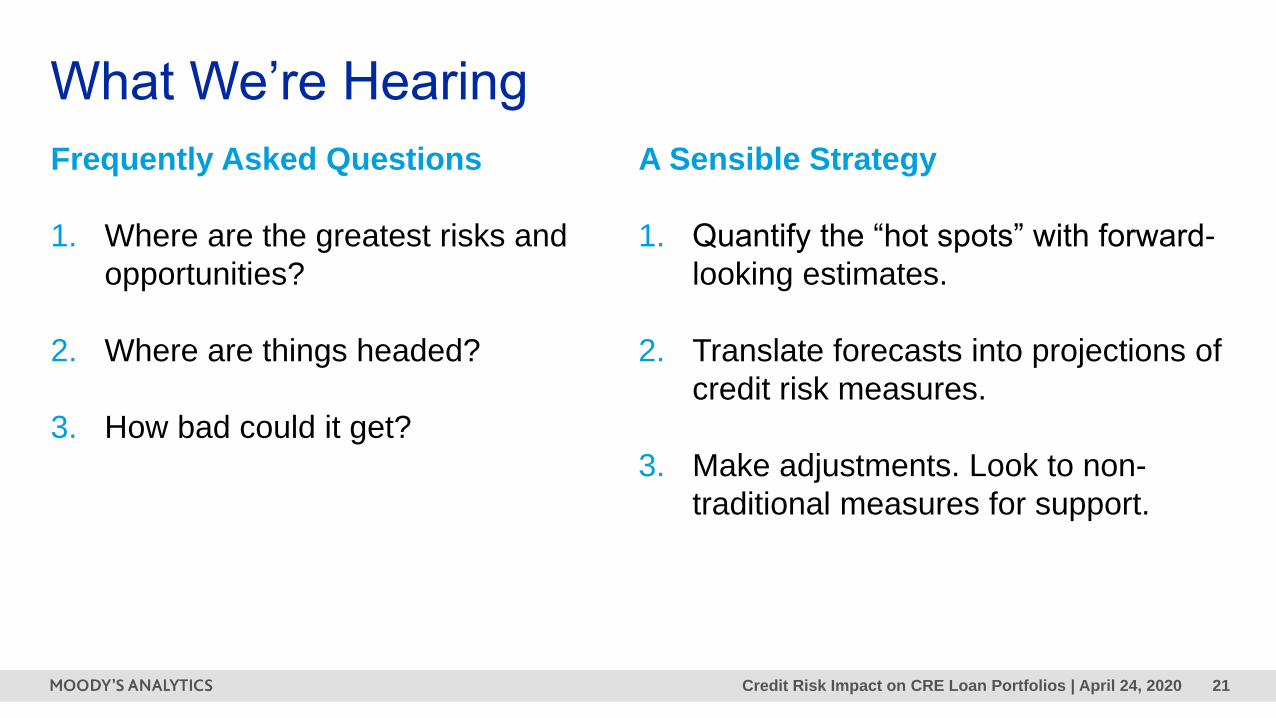
What We’re Hearing
Frequently Asked Questions
1. Where are the greatest risks and
opportunities?
2. Where are things headed?
3. How bad could it get?
A Sensible Strategy
1. Quantify the “hot spots” with forward-
looking estimates.
2. Translate forecasts into projections of
credit risk measures.
3. Make adjustments. Look to non-
traditional measures for support.
Credit Risk Impact on CRE Loan Portfolios | April 24, 2020 22
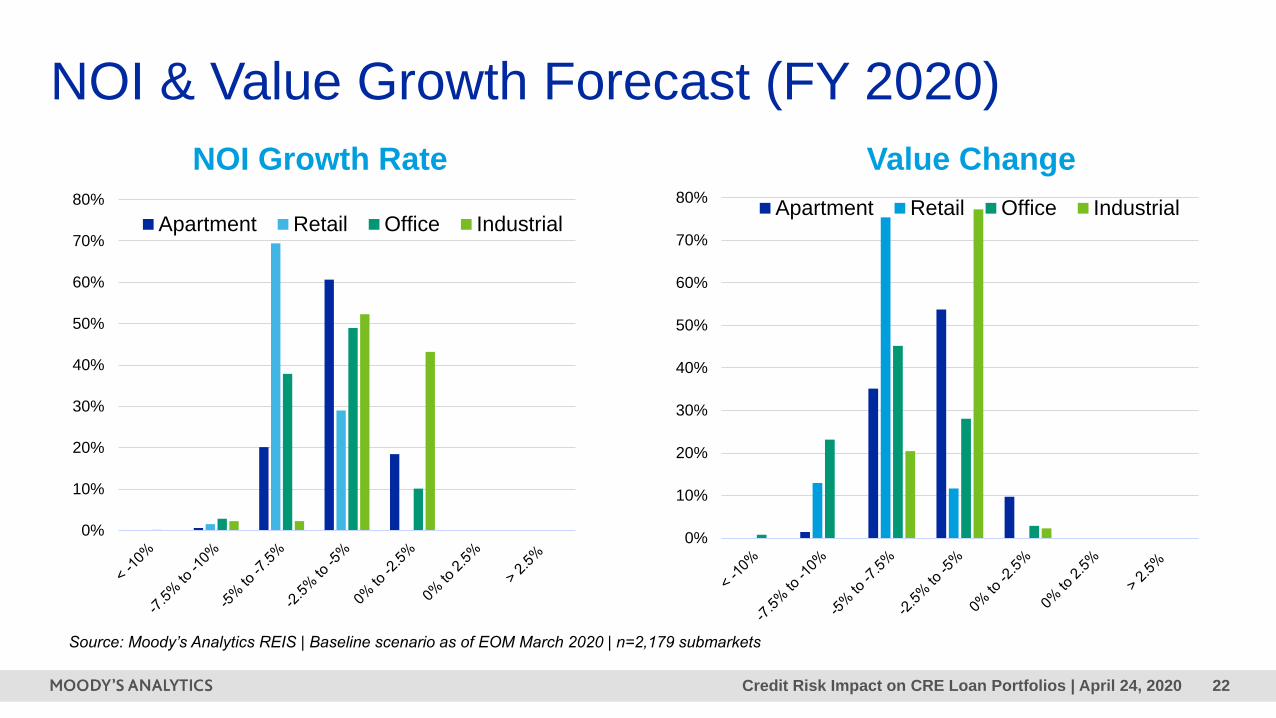
NOI & Value Growth Forecast (FY 2020)
Source: Moody’s Analytics REIS | Baseline scenario as of EOM March 2020 | n=2,179 submarkets
NOI Growth Rate
0%
10%
20%
30%
40%
50%
60%
70%
80%
Apartment Retail Office Industrial
Value Change
0%
10%
20%
30%
40%
50%
60%
70%
80%Apartment Retail Office Industrial
Credit Risk Impact on CRE Loan Portfolios | April 24, 2020 23
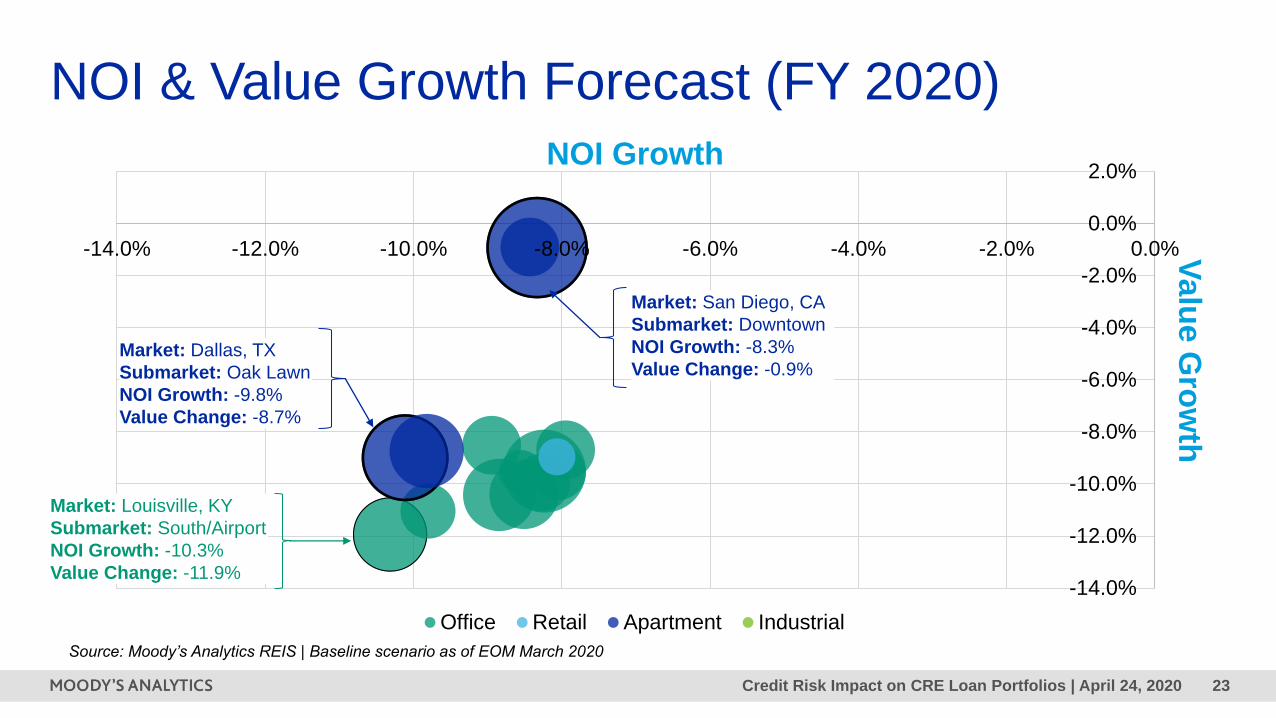
NOI & Value Growth Forecast (FY 2020)
-14.0%
-12.0%
-10.0%
-8.0%
-6.0%
-4.0%
-2.0%
0.0%
2.0%
-14.0% -12.0% -10.0% -8.0% -6.0% -4.0% -2.0% 0.0%
Office Retail Apartment Industrial
Valu
e G
row
th
NOI Growth
Market: San Diego, CA
Submarket: Downtown
NOI Growth: -8.3%
Value Change: -0.9%
Market: Louisville, KY
Submarket: South/Airport
NOI Growth: -10.3%
Value Change: -11.9%
Market: Dallas, TX
Submarket: Oak Lawn
NOI Growth: -9.8%
Value Change: -8.7%
Source: Moody’s Analytics REIS | Baseline scenario as of EOM March 2020

Credit Risk Impact on CRE Loan Portfolios | April 24, 2020 24
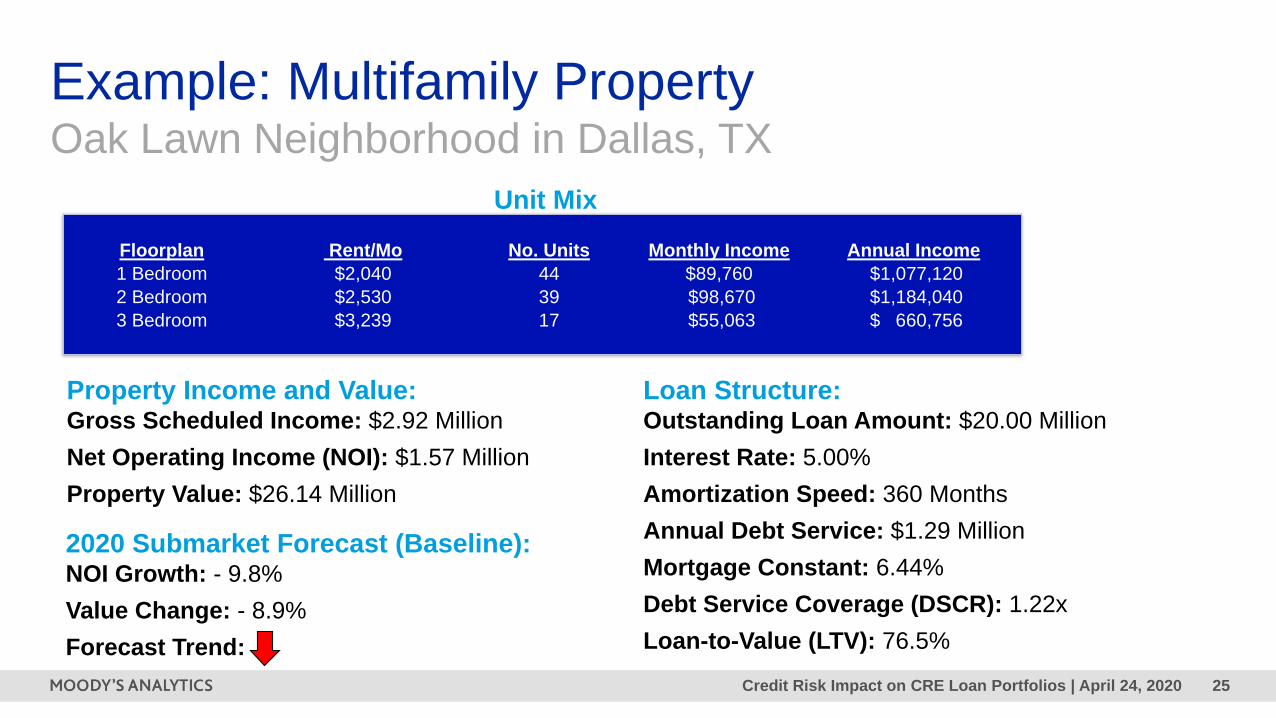
Example: Multifamily PropertyOak Lawn Neighborhood in Dallas, TX
Subject Property’s Submarket
Credit Risk Impact on CRE Loan Portfolios | April 24, 2020 25
Floorplan Rent/Mo No. Units Monthly Income Annual Income
1 Bedroom $2,040 44 $89,760 $1,077,120
2 Bedroom $2,530 39 $98,670 $1,184,040
3 Bedroom $3,239 17 $55,063 $ 660,756
Unit Mix
Property Income and Value: Gross Scheduled Income: $2.92 Million
Net Operating Income (NOI): $1.57 Million
Property Value: $26.14 Million
Example: Multifamily PropertyOak Lawn Neighborhood in Dallas, TX
2020 Submarket Forecast (Baseline): NOI Growth: - 9.8%
Value Change: - 8.9%
Forecast Trend:
Loan Structure: Outstanding Loan Amount: $20.00 Million
Interest Rate: 5.00%
Amortization Speed: 360 Months
Annual Debt Service: $1.29 Million
Mortgage Constant: 6.44%
Debt Service Coverage (DSCR): 1.22x
Loan-to-Value (LTV): 76.5%
Credit Risk Impact on CRE Loan Portfolios | April 24, 2020 26
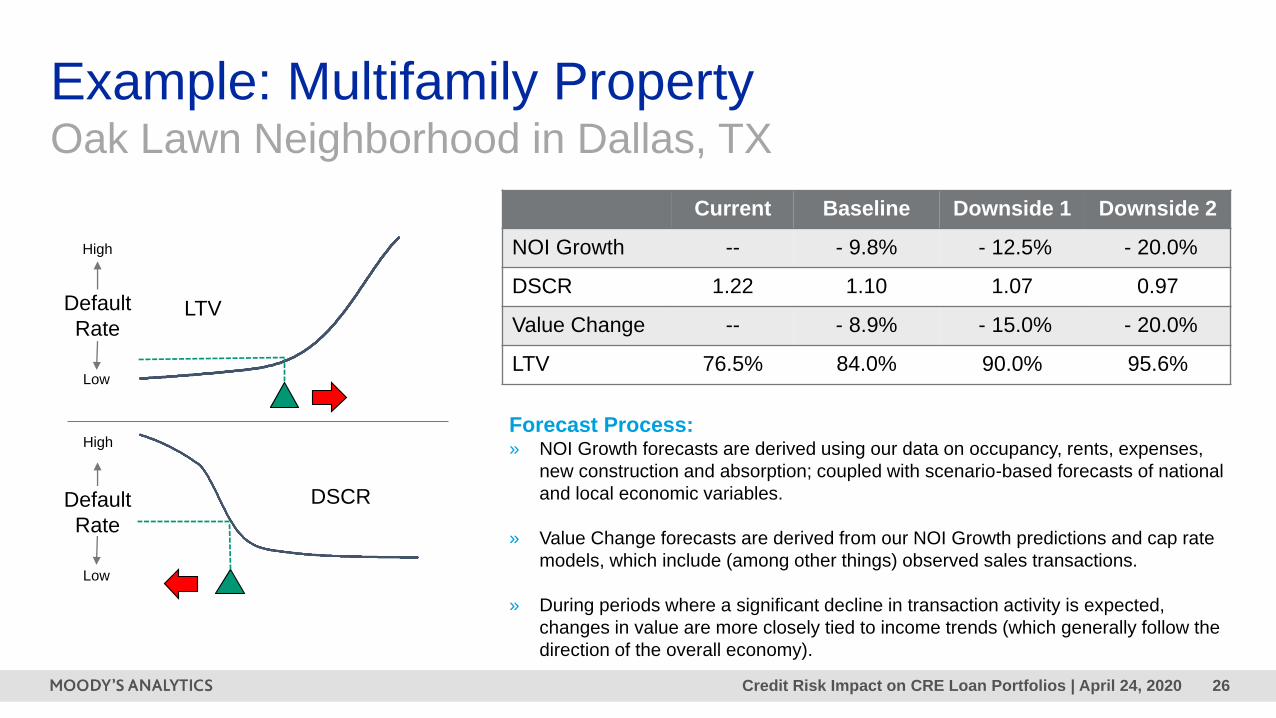
LTV
DSCR
Default
Rate
Default
Rate
High
Low
High
Low
Current Baseline Downside 1 Downside 2
NOI Growth -- - 9.8% - 12.5% - 20.0%
DSCR 1.22 1.10 1.07 0.97
Value Change -- - 8.9% - 15.0% - 20.0%
LTV 76.5% 84.0% 90.0% 95.6%
Forecast Process:» NOI Growth forecasts are derived using our data on occupancy, rents, expenses,
new construction and absorption; coupled with scenario-based forecasts of national
and local economic variables.
» Value Change forecasts are derived from our NOI Growth predictions and cap rate
models, which include (among other things) observed sales transactions.
» During periods where a significant decline in transaction activity is expected,
changes in value are more closely tied to income trends (which generally follow the
direction of the overall economy).
Example: Multifamily PropertyOak Lawn Neighborhood in Dallas, TX
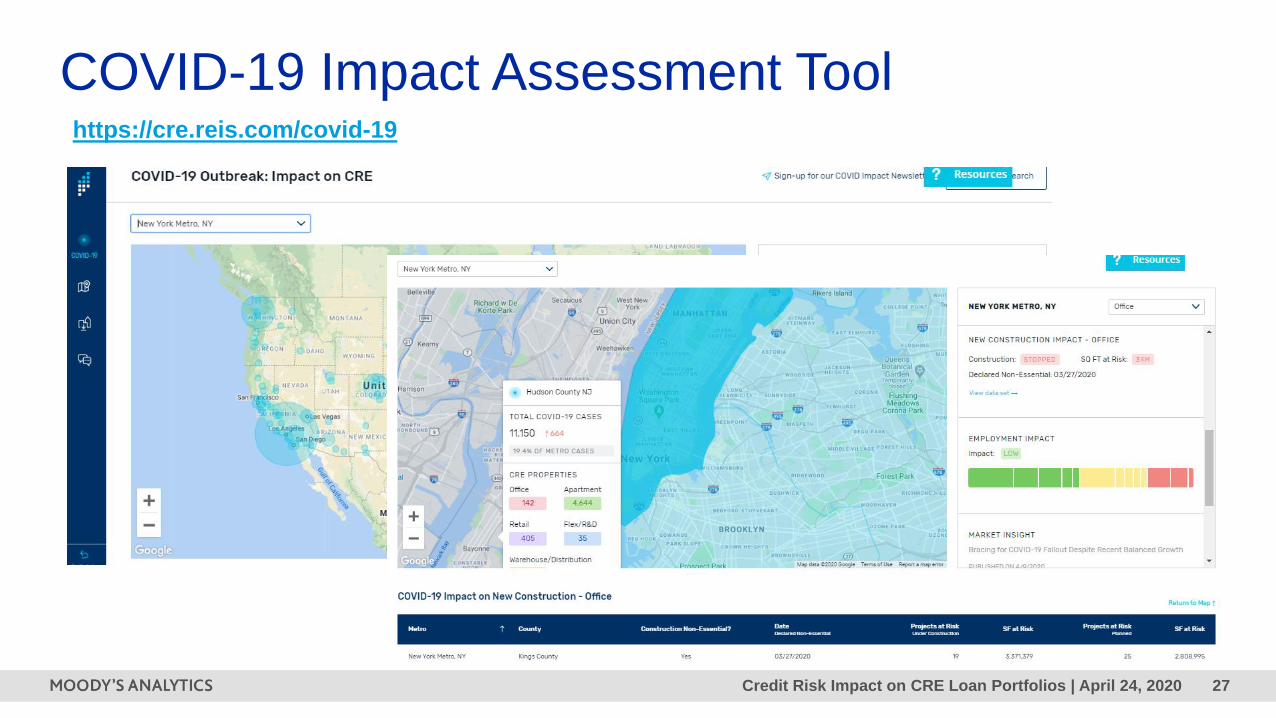
Credit Risk Impact on CRE Loan Portfolios | April 24, 2020 27
COVID-19 Impact Assessment Toolhttps://cre.reis.com/covid-19

Questions &
Answers

Thank You
Credit Risk Impact on CRE Loan Portfolios | April 24, 2020 31
© 2020 Moody’s Corporation, Moody’s Investors Service, Inc., Moody’s Analytics, Inc. and/or their licensors and affiliates (collectively, “MOODY’S”). All
rights reserved.
CREDIT RATINGS ISSUED BY MOODY'S INVESTORS SERVICE, INC. AND/OR ITS CREDIT RATINGS AFFILIATES ARE MOODY’S CURRENT
OPINIONS OF THE RELATIVE FUTURE CREDIT RISK OF ENTITIES, CREDIT COMMITMENTS, OR DEBT OR DEBT-LIKE SECURITIES, AND
MATERIALS, PRODUCTS, SERVICES AND INFORMATION PUBLISHED BY MOODY’S (COLLECTIVELY, “PUBLICATIONS”) MAY INCLUDE SUCH
CURRENT OPINIONS. MOODY’S INVESTORS SERVICE DEFINES CREDIT RISK AS THE RISK THAT AN ENTITY MAY NOT MEET ITS
CONTRACTUAL FINANCIAL OBLIGATIONS AS THEY COME DUE AND ANY ESTIMATED FINANCIAL LOSS IN THE EVENT OF DEFAULT OR
IMPAIRMENT. SEE MOODY’S RATING SYMBOLS AND DEFINITIONS PUBLICATION FOR INFORMATION ON THE TYPES OF CONTRACTUAL
FINANCIAL OBLIGATIONS ADDRESSED BY MOODY’S INVESTORS SERVICE CREDIT RATINGS. CREDIT RATINGS DO NOT ADDRESS ANY
OTHER RISK, INCLUDING BUT NOT LIMITED TO: LIQUIDITY RISK, MARKET VALUE RISK, OR PRICE VOLATILITY. CREDIT RATINGS, NON-
CREDIT ASSESSMENTS (“ASSESSMENTS”), AND OTHER OPINIONS INCLUDED IN MOODY’S PUBLICATIONS ARE NOT STATEMENTS OF
CURRENT OR HISTORICAL FACT. MOODY’S PUBLICATIONS MAY ALSO INCLUDE QUANTITATIVE MODEL-BASED ESTIMATES OF CREDIT RISK
AND RELATED OPINIONS OR COMMENTARY PUBLISHED BY MOODY’S ANALYTICS, INC. AND/OR ITS AFFILIATES. MOODY’S CREDIT RATINGS,
ASSESSMENTS, OTHER OPINIONS AND PUBLICATIONS DO NOT CONSTITUTE OR PROVIDE INVESTMENT OR FINANCIAL ADVICE, AND
MOODY’S CREDIT RATINGS, ASSESSMENTS, OTHER OPINIONS AND PUBLICATIONS ARE NOT AND DO NOT PROVIDE RECOMMENDATIONS
TO PURCHASE, SELL, OR HOLD PARTICULAR SECURITIES. MOODY’S CREDIT RATINGS, ASSESSMENTS, OTHER OPINIONS AND
PUBLICATIONS DO NOT COMMENT ON THE SUITABILITY OF AN INVESTMENT FOR ANY PARTICULAR INVESTOR. MOODY’S ISSUES ITS
CREDIT RATINGS, ASSESSMENTS AND OTHER OPINIONS AND PUBLISHES ITS PUBLICATIONS WITH THE EXPECTATION AND
UNDERSTANDING THAT EACH INVESTOR WILL, WITH DUE CARE, MAKE ITS OWN STUDY AND EVALUATION OF EACH SECURITY THAT IS
UNDER CONSIDERATION FOR PURCHASE, HOLDING, OR SALE.
MOODY’S CREDIT RATINGS, ASSESSMENTS, OTHER OPINIONS, AND PUBLICATIONS ARE NOT INTENDED FOR USE BY RETAIL INVESTORS
AND IT WOULD BE RECKLESS AND INAPPROPRIATE FOR RETAIL INVESTORS TO USE MOODY’S CREDIT RATINGS, ASSESSMENTS, OTHER
OPINIONS OR PUBLICATIONS WHEN MAKING AN INVESTMENT DECISION. IF IN DOUBT YOU SHOULD CONTACT YOUR FINANCIAL OR OTHER
PROFESSIONAL ADVISER.
ALL INFORMATION CONTAINED HEREIN IS PROTECTED BY LAW, INCLUDING BUT NOT LIMITED TO, COPYRIGHT LAW, AND NONE OF SUCH
INFORMATION MAY BE COPIED OR OTHERWISE REPRODUCED, REPACKAGED, FURTHER TRANSMITTED, TRANSFERRED, DISSEMINATED,
REDISTRIBUTED OR RESOLD, OR STORED FOR SUBSEQUENT USE FOR ANY SUCH PURPOSE, IN WHOLE OR IN PART, IN ANY FORM OR
MANNER OR BY ANY MEANS WHATSOEVER, BY ANY PERSON WITHOUT MOODY’S PRIOR WRITTEN CONSENT.
MOODY’S CREDIT RATINGS, ASSESSMENTS, OTHER OPINIONS AND PUBLICATIONS ARE NOT INTENDED FOR USE BY ANY PERSON AS A
BENCHMARK AS THAT TERM IS DEFINED FOR REGULATORY PURPOSES AND MUST NOT BE USED IN ANY WAY THAT COULD RESULT IN THEM
BEING CONSIDERED A BENCHMARK.
All information contained herein is obtained by MOODY’S from sources believed by it to be accurate and reliable. Because of the possibility of human or
mechanical error as well as other factors, however, all information contained herein is provided “AS IS” without warranty of any kind. MOODY'S adopts all
necessary measures so that the information it uses in assigning a credit rating is of sufficient quality and from sources MOODY'S considers to be reliable
including, when appropriate, independent third-party sources. However, MOODY’S is not an auditor and cannot in every instance independently verify or
validate information received in the rating process or in preparing its Publications.
To the extent permitted by law, MOODY’S and its directors, officers, employees, agents, representatives, licensors and suppliers disclaim liability to any
person or entity for any indirect, special, consequential, or incidental losses or damages whatsoever arising from or in connection with the information
contained herein or the use of or inability to use any such information, even if MOODY’S or any of its directors, officers, employees, agents, representatives,
licensors or suppliers is advised in advance of the possibility of such losses or damages, including but not limited to: (a) any loss of present or prospective
profits or (b) any loss or damage arising where the relevant financial instrument is not the subject of a particular credit rating assigned by MOODY’S.
To the extent permitted by law, MOODY’S and its directors, officers, employees, agents, representatives, licensors and suppliers disclaim liability for any
direct or compensatory losses or damages caused to any person or entity, including but not limited to by any negligence (but excluding fraud, willful
misconduct or any other type of liability that, for the avoidance of doubt, by law cannot be excluded) on the part of, or any contingency within or beyond the
control of, MOODY’S or any of its directors, officers, employees, agents, representatives, licensors or suppliers, arising from or in connection with the
information contained herein or the use of or inability to use any such information.
NO WARRANTY, EXPRESS OR IMPLIED, AS TO THE ACCURACY, TIMELINESS, COMPLETENESS, MERCHANTABILITY OR FITNESS FOR ANY
PARTICULAR PURPOSE OF ANY CREDIT RATING, ASSESSMENT, OTHER OPINION OR INFORMATION IS GIVEN OR MADE BY MOODY’S IN ANY
FORM OR MANNER WHATSOEVER.
Moody’s Investors Service, Inc., a wholly-owned credit rating agency subsidiary of Moody’s Corporation (“MCO”), hereby discloses that most issuers of debt
securities (including corporate and municipal bonds, debentures, notes and commercial paper) and preferred stock rated by Moody’s Investors Service, Inc.
have, prior to assignment of any credit rating, agreed to pay to Moody’s Investors Service, Inc. for credit ratings opinions and services rendered by it fees
ranging from $1,000 to approximately $2,700,000. MCO and Moody’s investors Service also maintain policies and procedures to address the independence
of Moody’s Investors Service credit ratings and credit rating processes. Information regarding certain affiliations that may exist between directors of MCO
and rated entities, and between entities who hold credit ratings from Moody’s Investors Service and have also publicly reported to the SEC an ownership
interest in MCO of more than 5%, is posted annually at www.moodys.com under the heading “Investor Relations — Corporate Governance — Director and
Shareholder Affiliation Policy.”
Additional terms for Australia only: Any publication into Australia of this document is pursuant to the Australian Financial Services License of MOODY’S
affiliate, Moody’s Investors Service Pty Limited ABN 61 003 399 657AFSL 336969 and/or Moody’s Analytics Australia Pty Ltd ABN 94 105 136 972 AFSL
383569 (as applicable). This document is intended to be provided only to “wholesale clients” within the meaning of section 761G of the Corporations Act
2001. By continuing to access this document from within Australia, you represent to MOODY’S that you are, or are accessing the document as a
representative of, a “wholesale client” and that neither you nor the entity you represent will directly or indirectly disseminate this document or its contents to
“retail clients” within the meaning of section 761G of the Corporations Act 2001. MOODY’S credit rating is an opinion as to the creditworthiness of a debt
obligation of the issuer, not on the equity securities of the issuer or any form of security that is available to retail investors.
Additional terms for Japan only: Moody's Japan K.K. (“MJKK”) is a wholly-owned credit rating agency subsidiary of Moody's Group Japan G.K., which is
wholly-owned by Moody’s Overseas Holdings Inc., a wholly-owned subsidiary of MCO. Moody’s SF Japan K.K. (“MSFJ”) is a wholly-owned credit rating
agency subsidiary of MJKK. MSFJ is not a Nationally Recognized Statistical Rating Organization (“NRSRO”). Therefore, credit ratings assigned by MSFJ
are Non-NRSRO Credit Ratings. Non-NRSRO Credit Ratings are assigned by an entity that is not a NRSRO and, consequently, the rated obligation will not
qualify for certain types of treatment under U.S. laws. MJKK and MSFJ are credit rating agencies registered with the Japan Financial Services Agency and
their registration numbers are FSA Commissioner (Ratings) No. 2 and 3 respectively.
MJKK or MSFJ (as applicable) hereby disclose that most issuers of debt securities (including corporate and municipal bonds, debentures, notes and
commercial paper) and preferred stock rated by MJKK or MSFJ (as applicable) have, prior to assignment of any credit rating, agreed to pay to MJKK or
MSFJ (as applicable) for credit ratings opinions and services rendered by it fees ranging from JPY125,000 to approximately JPY250,000,000.
MJKK and MSFJ also maintain policies and procedures to address Japanese regulatory requirements.