Embed Size (px)
Citation preview
Corporate BriefingFor the year ended
December 31, 2018
March 8, 2019
2
Sequence of Presentation
2018 Review
Corporate Awards
Thar Energy Limited
Future Outlook / Challenges
Q & A Session
1
2
3
4
5

2018 Review
4
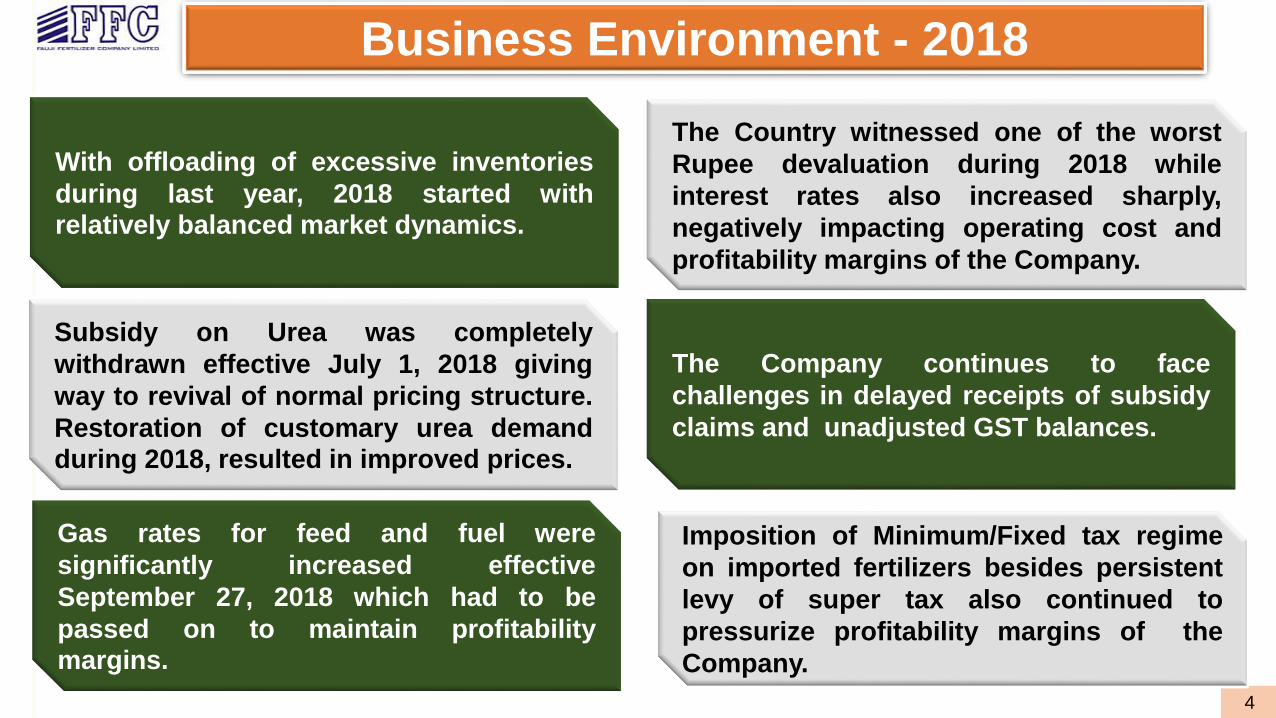
Business Environment - 2018
Business Environment - 2017
With offloading of excessive inventories
during last year, 2018 started withrelatively balanced market dynamics.
Subsidy on Urea was completely
withdrawn effective July 1, 2018 giving
way to revival of normal pricing structure.
Restoration of customary urea demandduring 2018, resulted in improved prices.
Gas rates for feed and fuel were
significantly increased effective
September 27, 2018 which had to be
passed on to maintain profitabilitymargins.
The Country witnessed one of the worst
Rupee devaluation during 2018 while
interest rates also increased sharply,
negatively impacting operating cost and
profitability margins of the Company.
Imposition of Minimum/Fixed tax regime
on imported fertilizers besides persistent
levy of super tax also continued to
pressurize profitability margins of the
Company.
The Company continues to face
challenges in delayed receipts of subsidy
claims and unadjusted GST balances.
5
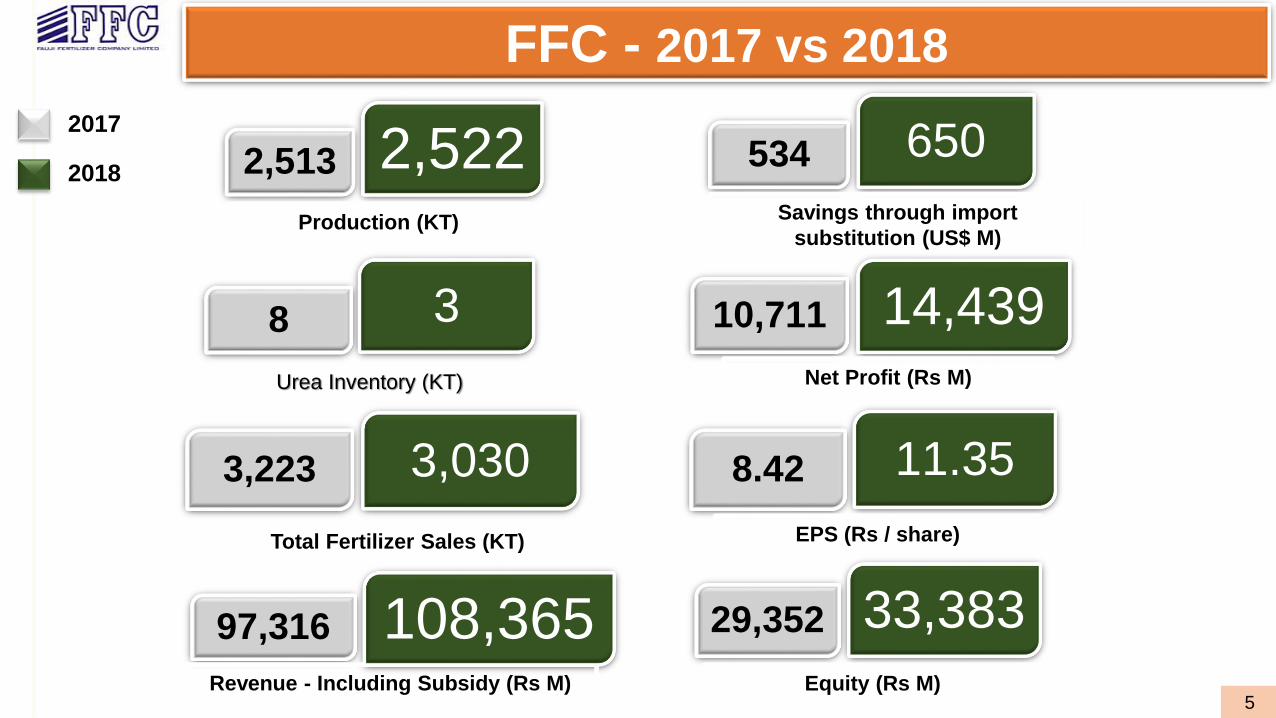
Savings through import
substitution (US$ M)
650534
3,0303,223
Total Fertilizer Sales (KT)
Equity (Rs M)
33,38329,352
14,439Net Profit (Rs M)
10,711
Urea Inventory (KT)
38
108,365Revenue - Including Subsidy (Rs M)
97,316
11.358.42
EPS (Rs / share)
FFC - 2017 vs 2018
2,5222,513
Production (KT)
2017
2018
6
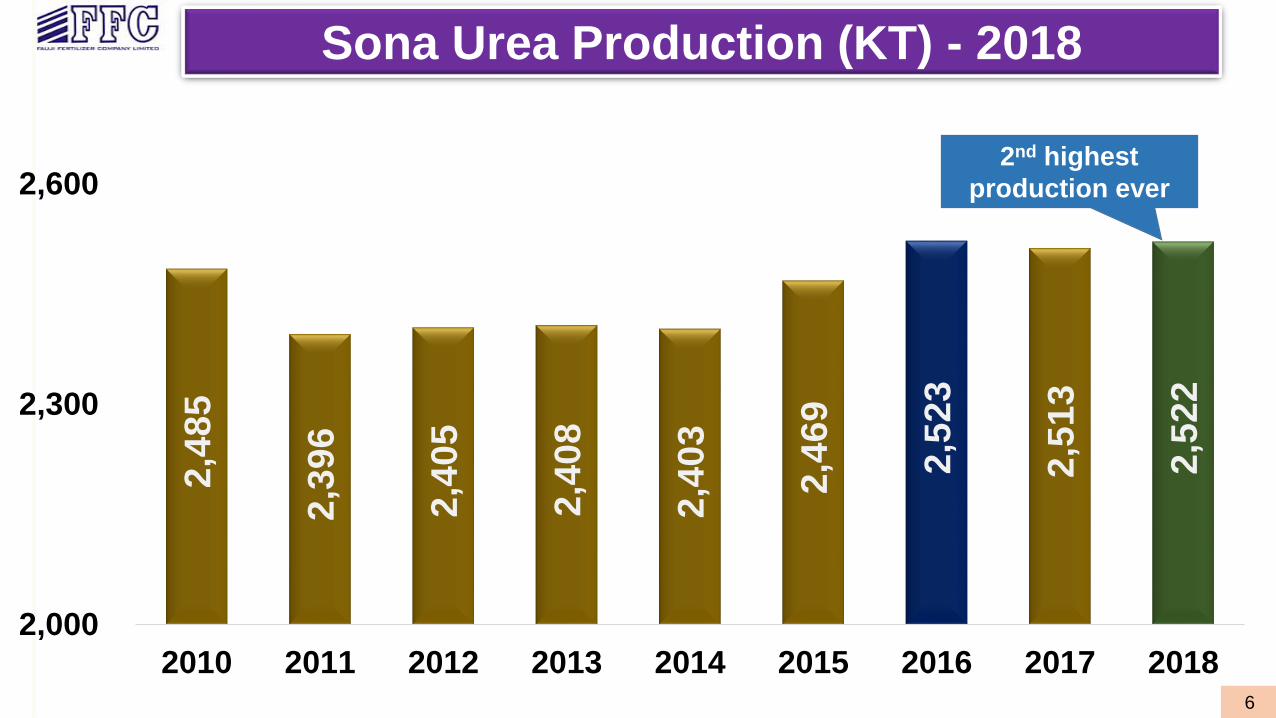
2nd highest
production ever
Sona Urea Production (KT) - 2018
2,4
85
2,3
96
2,4
05
2,4
08
2,4
03
2,4
69
2,5
23
2,5
13
2,5
22
2,000
2,300
2,600
2010 2011 2012 2013 2014 2015 2016 2017 2018
7
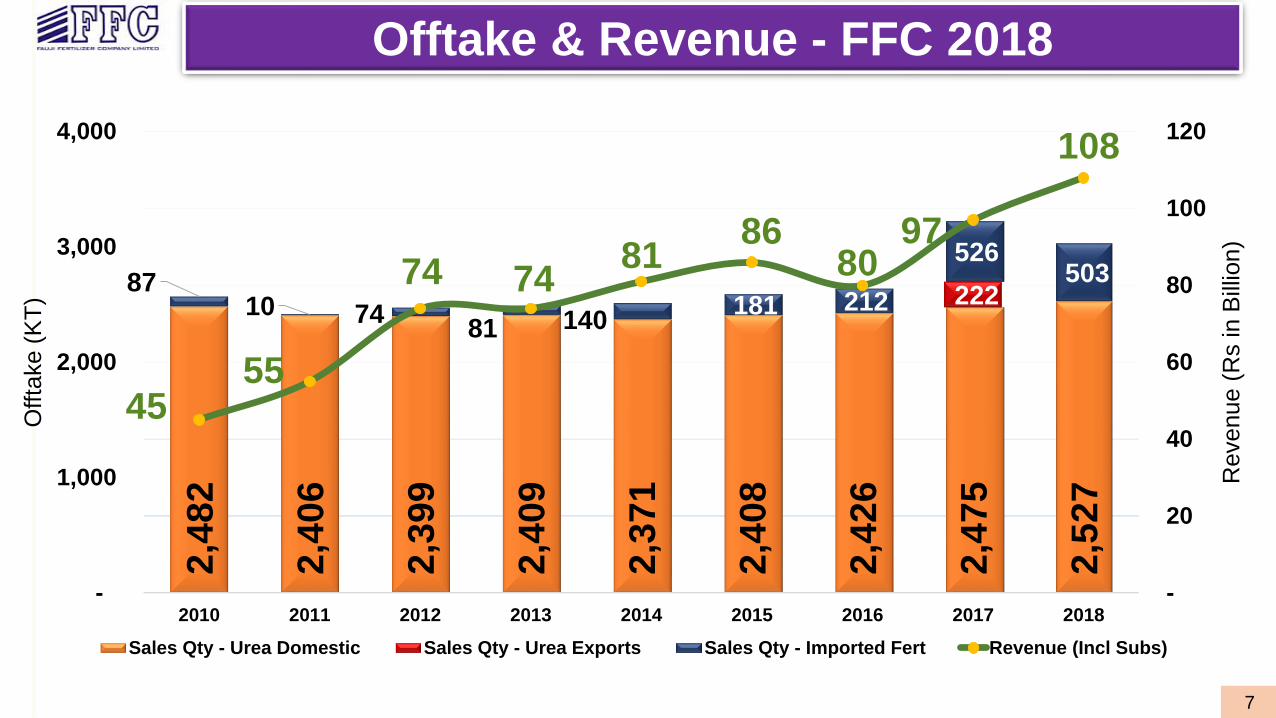
Offtake & Revenue - FFC 2018
2,4
82
2,4
06
2,3
99
2,4
09
2,3
71
2,4
08
2,4
26
2,4
75
2,5
27
222 87
10 74 81 140
181 212
526 503
45 55
74 74 81
86 80
97
108
-
20
40
60
80
100
120
-
1,000
2,000
3,000
4,000
2010 2011 2012 2013 2014 2015 2016 2017 2018
Revenue (
Rs in B
illio
n)
Offta
ke (
KT
)
Sales Qty - Urea Domestic Sales Qty - Urea Exports Sales Qty - Imported Fert Revenue (Incl Subs)

8
Industry Urea Sales - Domestic (KT)
5,276 5,903
5,618 5,585 5,500 5,816 5,810
-
1,000
2,000
3,000
4,000
5,000
6,000
7,000
2012 2013 2014 2015 2016 2017 2018
9
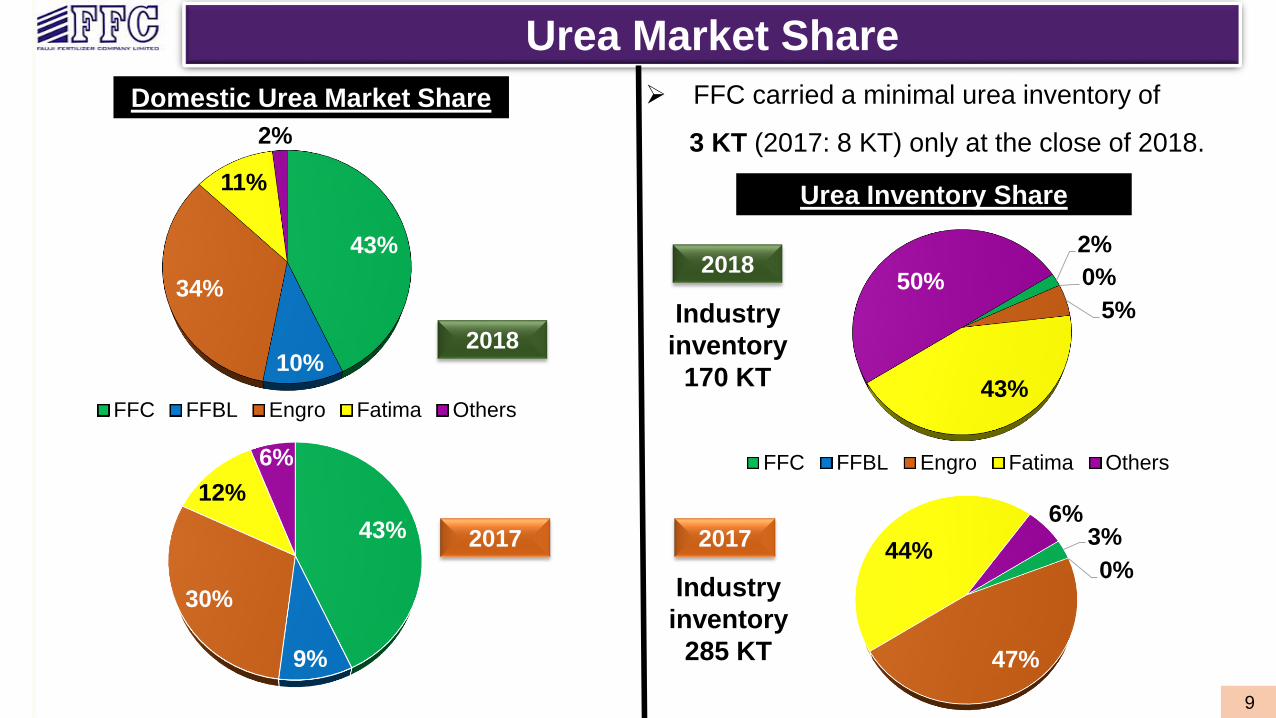
2%
43%
Domestic Urea Market Share
9%
4%
2017
Urea Market Share
43%
9%
30%
12%
6%
2018
43%
10%
34%
11%
2%
FFC FFBL Engro Fatima Others
3%
0%
47%
44%
6%2017
2018
Urea Inventory Share
2%
0%
5%
43%
50%
FFC FFBL Engro Fatima Others
FFC carried a minimal urea inventory of
3 KT (2017: 8 KT) only at the close of 2018.
Industry
inventory
170 KT
Industry
inventory
285 KT
10
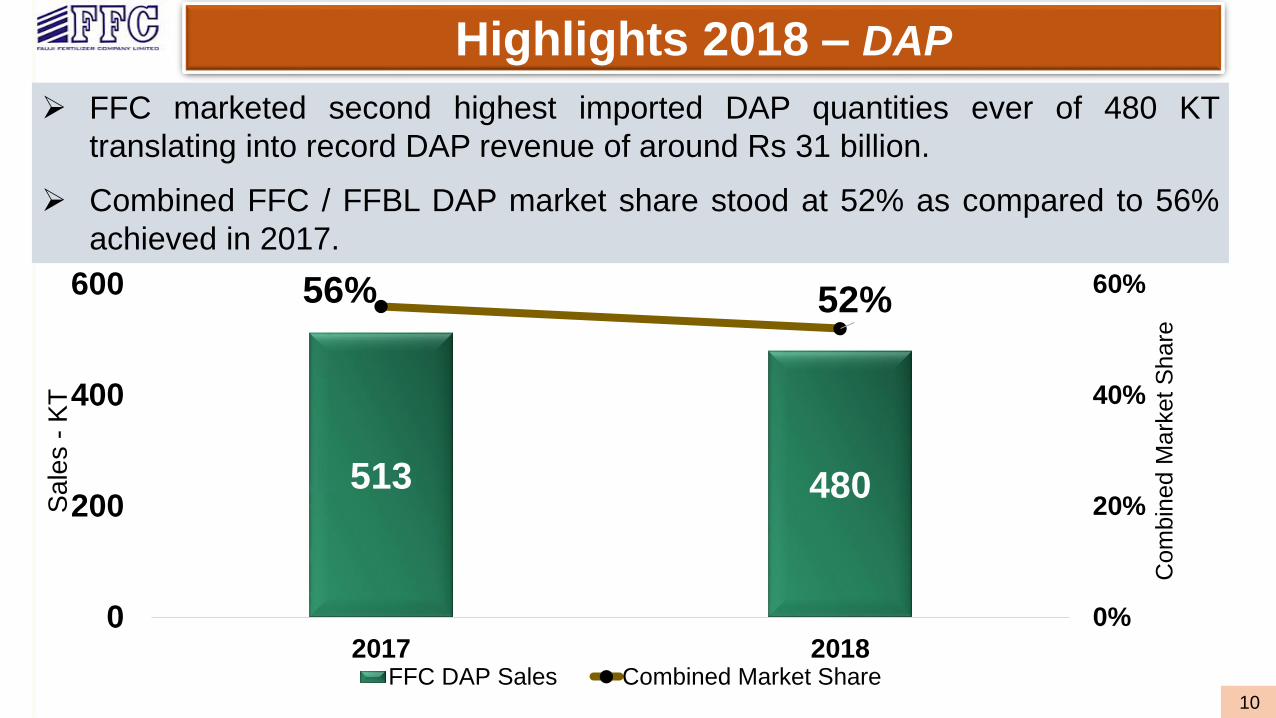
FFC marketed second highest imported DAP quantities ever of 480 KT
translating into record DAP revenue of around Rs 31 billion.
Combined FFC / FFBL DAP market share stood at 52% as compared to 56%
achieved in 2017.
35%
21%
Highlights 2018 – DAP
513 480
56% 52%
0%
20%
40%
60%
0
200
400
600
2017 2018
Com
bin
ed M
ark
et
Share
Sa
les -
KT
FFC DAP Sales Combined Market Share
11
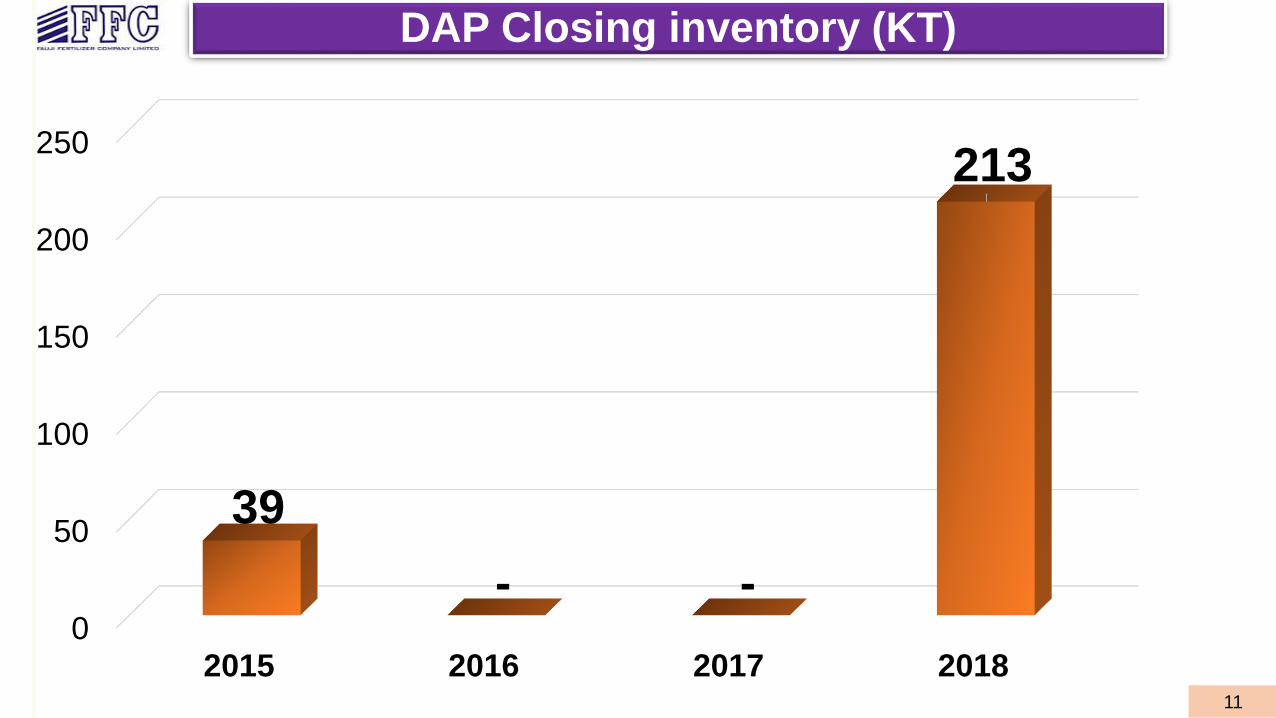
DAP Closing inventory (KT)
0
50
100
150
200
250
2015 2016 2017 2018
39
- -
213
12
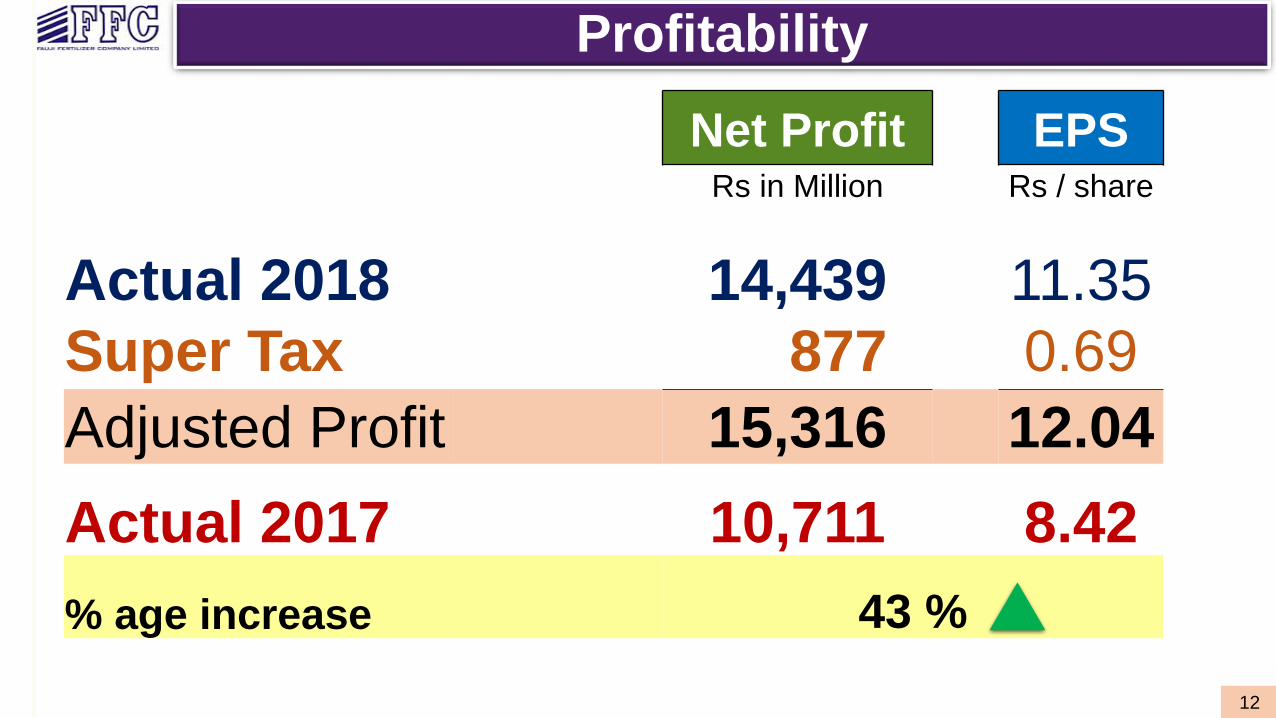
Profitability
Net Profit EPSRs in Million Rs / share
Actual 2018 14,439 11.35
Super Tax 877 0.69
Adjusted Profit 15,316 12.04
Actual 2017 10,711 8.42
% age increase 43 %
13
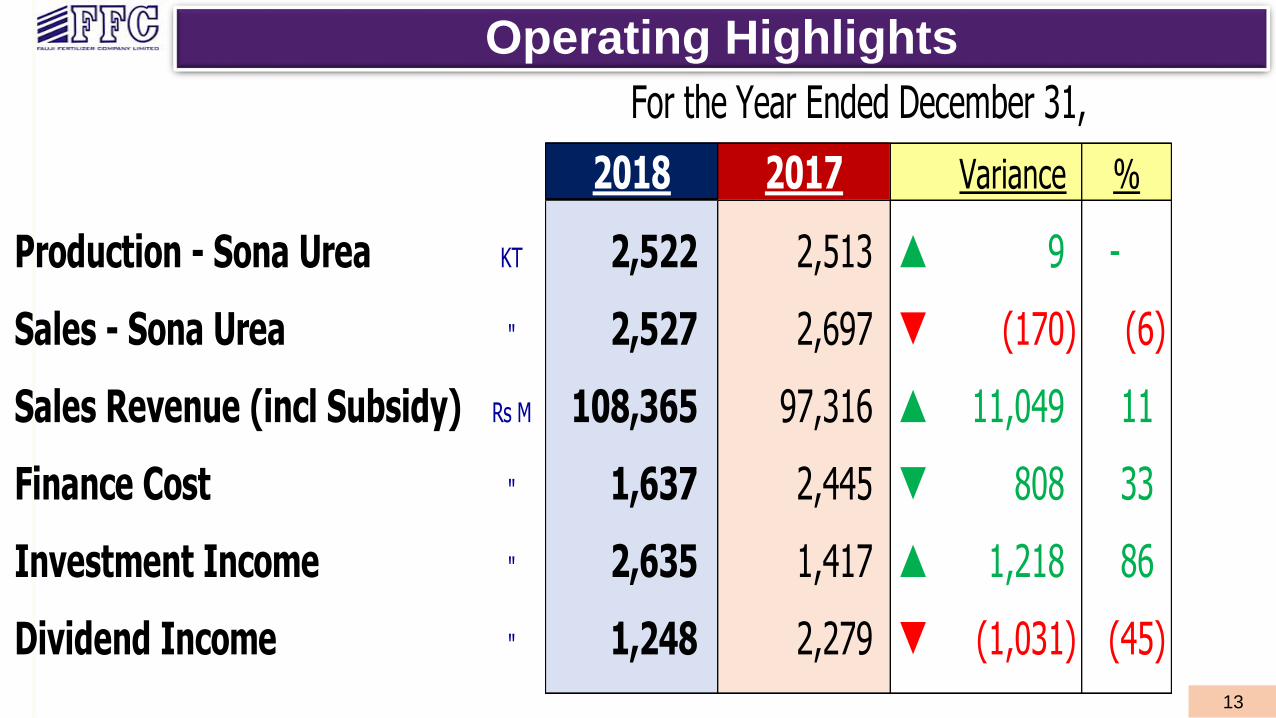
Operating Highlights
2018 2017 Variance %
Production - Sona Urea KT 2,522 2,513 p 9 -
Sales - Sona Urea " 2,527 2,697 q (170) (6)
Sales Revenue (incl Subsidy) Rs M 108,365 97,316 p 11,049 11
Finance Cost " 1,637 2,445 q 808 33
Investment Income " 2,635 1,417 p 1,218 86
Dividend Income " 1,248 2,279 q (1,031) (45)
For the Year Ended December 31,

Corporate Awards

15
Awards & Achievements
SAFA Award 2017
Ranked amongst the best under “Corporate Governance Disclosures” category
Best Corporate Report Award 2017 - ICAP / ICMAP
First position in “Chemical & Pharmaceuticals” sector
Best Sustainability Report Award 2017 - ICAP / ICMAPRanked amongst the best sustainability reports
PSX Award
Stood first on PSX Top 25 Companies list, for the year 2016 which was the
7th consecutive year for the top placement
New VentureThar Energy Limited
17
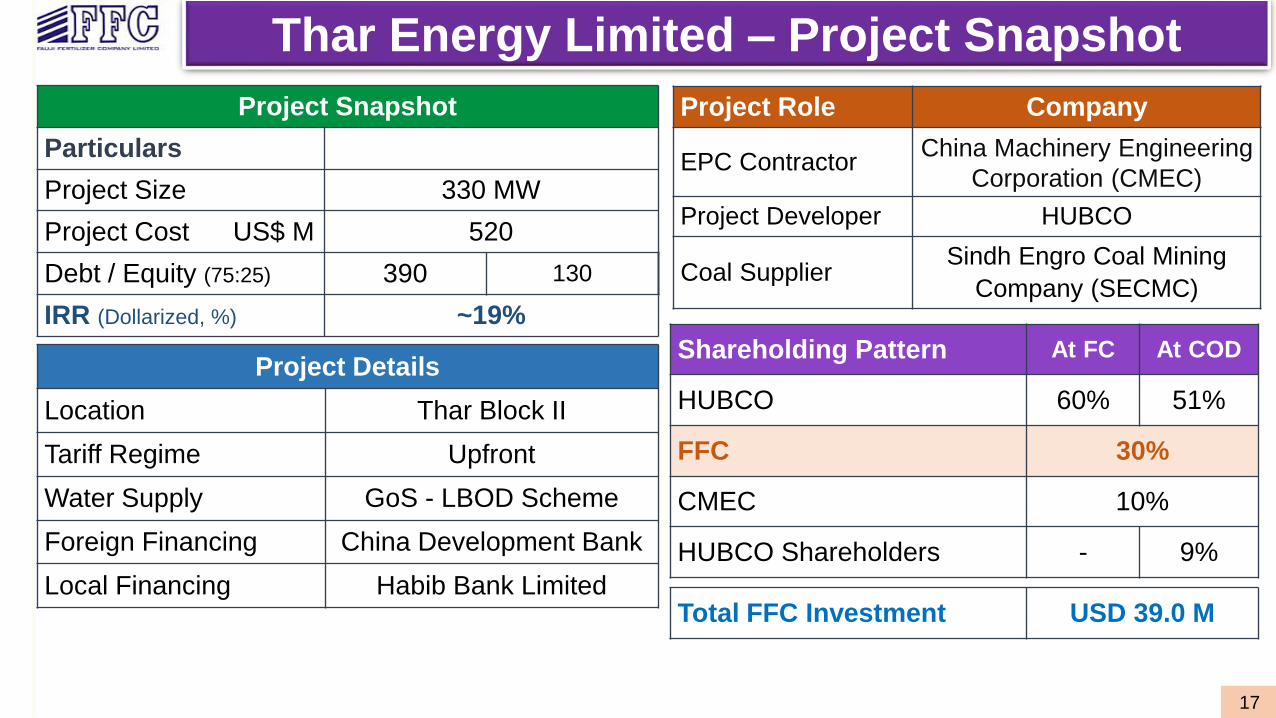
Project Snapshot
Particulars
Project Size 330 MW
Project Cost US$ M 520
Debt / Equity (75:25) 390 130
IRR (Dollarized, %) ~19%
Shareholding Pattern At FC At COD
HUBCO 60% 51%
FFC 30%
CMEC 10%
HUBCO Shareholders - 9%
Total FFC Investment USD 39.0 M
Project Role Company
EPC ContractorChina Machinery Engineering
Corporation (CMEC)
Project Developer HUBCO
Coal SupplierSindh Engro Coal Mining
Company (SECMC)
Project Details
Location Thar Block II
Tariff Regime Upfront
Water Supply GoS - LBOD Scheme
Foreign Financing China Development Bank
Local Financing Habib Bank Limited
Thar Energy Limited – Project Snapshot
18
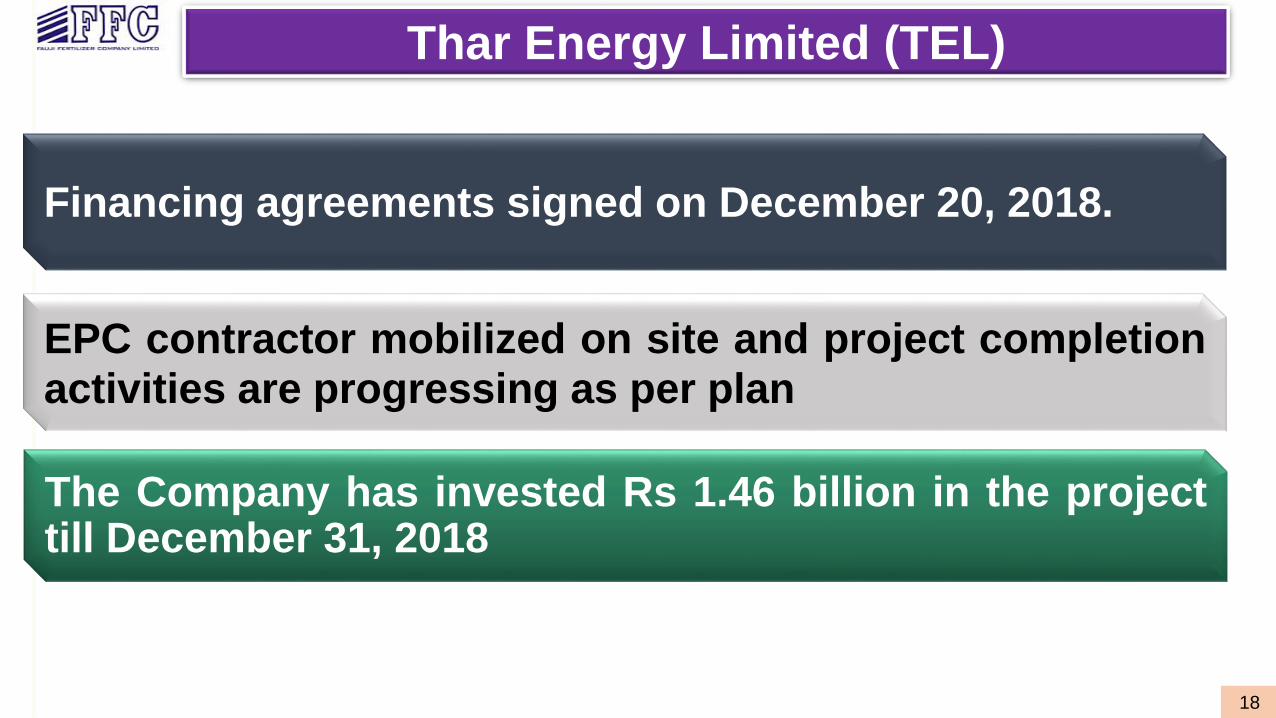
Thar Energy Limited (TEL)
Financing agreements signed on December 20, 2018.
The Company has invested Rs 1.46 billion in the projecttill December 31, 2018
EPC contractor mobilized on site and project completionactivities are progressing as per plan

Future Outlook/
Challenges
20
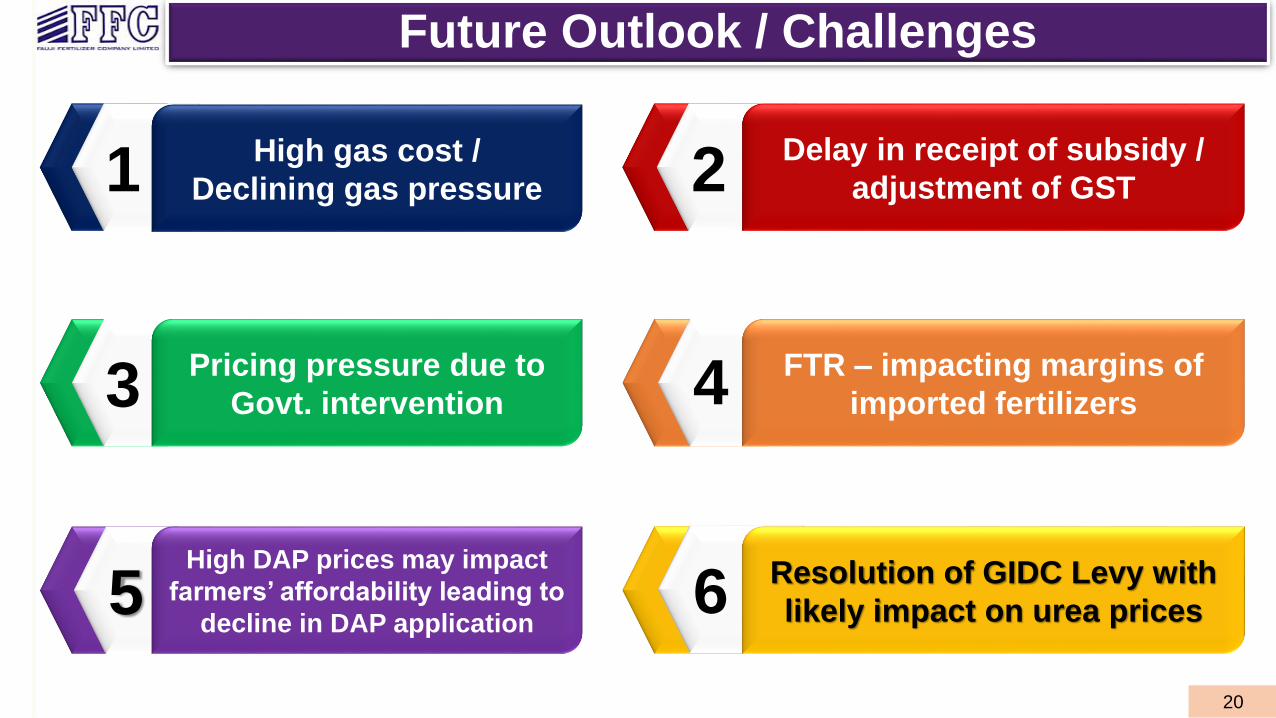
11 High gas cost /
Declining gas pressure
13Pricing pressure due to
Govt. intervention
15High DAP prices may impact
farmers’ affordability leading to
decline in DAP application
12Delay in receipt of subsidy /
adjustment of GST
14 FTR – impacting margins of
imported fertilizers
16 Resolution of GIDC Levy with
likely impact on urea prices
Future Outlook / Challenges
21
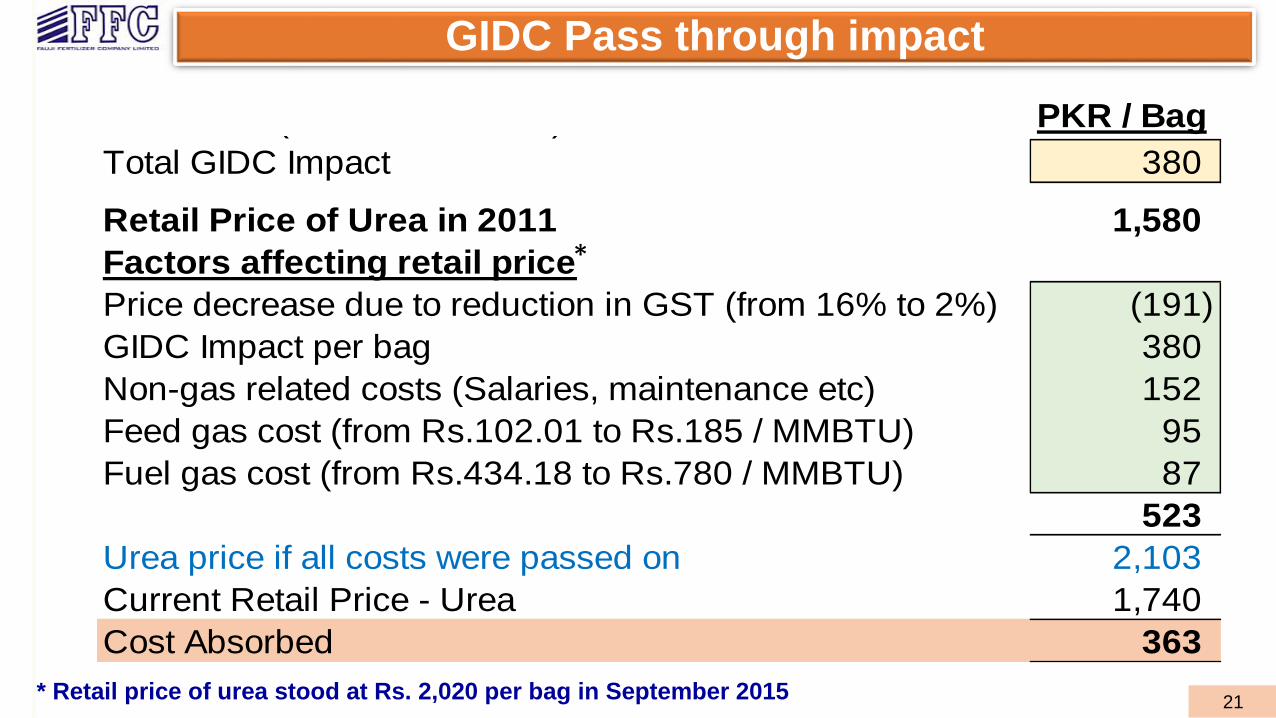
PKR / BagFuel GIDC (Rs. 150/MMBTU) 36
Total GIDC Impact 380
Retail Price of Urea in 2011 1,580
Factors affecting retail price
Price decrease due to reduction in GST (from 16% to 2%) (191)
GIDC Impact per bag 380
Non-gas related costs (Salaries, maintenance etc) 152
Feed gas cost (from Rs.102.01 to Rs.185 / MMBTU) 95
Fuel gas cost (from Rs.434.18 to Rs.780 / MMBTU) 87
523
Urea price if all costs were passed on 2,103
Current Retail Price - Urea 1,740
Cost Absorbed 363
GIDC Pass through impact
*
* Retail price of urea stood at Rs. 2,020 per bag in September 2015

Q & A Session
Thank you