Embed Size (px)
Citation preview

Discussion Paper Number:
ICM-2016-03
Discussion Paper
Corporate Carbon Emission and Financial Performance: Does Carbon Disclosure Mediate the Relationship in the UK?
June 2016
Yang Stephanie Liu Keele Management School, Keele University
Xiaoyan Zhou ICMA Centre, Henley Business School, University of Reading
Jessica H Yang Henley Business School, University of Reading
Andreas G F Hoepner ICMA Centre, Henley Business School, University of Reading & Technical Advisory Committee (Data), Carbon Disclosure Project

ii © Liu et al, June 2016
The aim of this discussion paper series is to
disseminate new research of academic
distinction. Papers are preliminary drafts,
circulated to stimulate discussion and critical
comment. Henley Business School is triple
accredited and home to over 100 academic
faculty, who undertake research in a wide range
of fields from ethics and finance to international
business and marketing.
www.icmacentre.ac.uk
© Liu et al, June 2016

Henley Discussion Paper Series
© Liu et al, June 2016 1
Corporate Carbon Emission and Financial Performance:
Does Carbon Disclosure Mediate the Relationship in the
UK?
Abstract Academic debate relating to the link between corporate environmental disclosures,
environmental performance and financial performance is persistent and controversial. In this
paper, we investigate whether and if so, how, carbon emission performance is related to
corporate financial performance and how disclosures of carbon emission in the annual and
standalone reports mediate such relationship. Specifically, we construct a 42-item disclosure
index to quantify the quality of corporate carbon emission information of 62 FTSE 100
companies from the period of 2010 to 2012. We find that while carbon emission is negatively
associated with financial performance, it is positively related to the level of carbon disclosures
which is significantly and positively related to financial performance. The findings show that
market responses to excessive carbon emission; however, companies with poor carbon
performance tend to use disclosure strategically to manage the legitimacy threat and to reduce
the information asymmetry.
Keywords carbon emission, carbon disclosure, financial performance, firm value, mediation analysis
Contact Yang Stephanie Liu, Keele Management School, Darwin Building, Keele University, Keele
ST5 5BG, United Kingdom. Email: [email protected]

ICMA Centre
2 © Liu et al, June 2016
1 Introduction
A substantial body of literature examines the question ‘Does it pay to be green?’ using either
environmental performance or environmental disclosure as proxy for corporate engagement
with corporate social responsibility (CSR). The studies are designed to investigate the
association between CSR disclosure and financial performance (Al-Tuwaijri, Christensen, &
Hughes Ii, 2004; Freedman & Jaggi, 1982; Konar & Cohen, 2001; Li, Richardson, & Thornton,
1997; Qiu, Shaukat, & Tharyan, 2016; Saka & Oshika, 2014; Ullmann, 1985) and between CSR
performance and financial performance (Dowell, Hart, & Yeung, 2000; Dye, 1985; Flammer,
2015; King & Lenox, 2001; Li et al., 1997; Liao, Luo, & Tang, 2014; Saka & Oshika, 2014), while the
results are greatly controversial. Furthermore, the association between CSR performance and
CSR disclosure is yet clear (Al-Tuwaijri et al., 2004; Cho & Patten, 2007; Clarkson, Li, Richardson,
& Vasvari, 2008; Li et al., 1997; Patten, 2002; Saka & Oshika, 2014; Ullmann, 1985; Wiseman,
1982). Nevertheless, these studies collectively emphasise the importance of understanding the
impact of corporate CSR engagement on corporate financial performance and the mechanisms
behind the association.
There are two main streams of explanations for the controversial outcomes of the above
association. From an economic perspective, engaging in CSR is a cost burden to companies and
provides few financial benefits, as companies incurring costs for environmentally responsible
engagement put themselves at an economic disadvantage compared to other companies
without such expenditures. This view has been challenged as more countries mandate
regulations for corporate CSR behaviours and also as the legitimate interests of the stakeholder
is emerging, which has created renewed scepticism about the objectives of business. On one
hand, engaging in CSR protects companies from potential legal fines and regulatory costs. On
the other hand, the socio-political view suggests that companies can gain benefit from satisfying
diverse groups of stakeholders and can gain competitive advantage by engaging in CSR activities
(Dye, 1985; Hart & Ahuja, 1996). In addition, it is recognised that CSR engagement is a
multidimensional construct that encompasses a variety of corporate actions in relation to its
resources, processes and outputs (Brammer & Millington, 2008; Carroll, 1979; Waddock &
Graves, 1997). Fundamentally different parts of CSR engagement would be differently motivated
and would accordingly have different implications for corporate financial performance. This
study therefore addresses this issue by emphasizing one particular element of CSR – carbon
emission issues.

Henley Discussion Paper Series
© Liu et al, June 2016 3
It is also argued in the current study that environmental disclosure or environmental
performance alone does not provide the full picture of corporate environmental engagement;
the association between environmental performance and corporate financial performance
could be mediated by environmental disclosure in annual reports and CSR reports, which are
used by the market to assess corporate environmental performance. Al-Tuwaijri et al. (2004)
claim that the prior empirical research of the relations between environmental performance,
environmental disclosure and corporate financial performance mainly focus on the strength of
paired-wise association between two of these three variables. In the current study,
environmental disclosure and environmental performance are separated into two variables as
they measure different things. This study extends Al-Tuwaijri et al. (2004) holistic approach to
investigate the interrelationship among corporate carbon emission, carbon disclosures and
corporate financial performance simultaneously.
To achieve the aim of this research and answer the research questions, the study employs annual
reports and stand-alone CSR reports of 62 environmentally sensitive FTSE 100 companies in the
United Kingdom (UK). Mediation path analysis is used to explain how carbon emission
performance and financial performance are related. Based on our longitudinal data, we employ a
two-level mediation model to test the direct effect of carbon emission performance on
corporate financial performance, and the indirect effect of carbon emission, mediated by annual
carbon emission disclosure, if any.
The structural equation modelling analysis shows that in the UK context, corporate carbon
emissions impact on corporate financial performance through both direct and indirect
mechanisms. For the direct impact, it is found that corporate carbon emission is negatively
associated with corporate financial performance, which indicates that the market does respond
to corporate carbon emission performance. For the indirect impact, the results show that
corporate carbon emission is positively related to the level of corporate carbon disclosures
(companies with more carbon emissions make more extensive disclosures), and also show that a
significant positive relation exists between corporate carbon disclosure and corporate financial
performance (more carbon disclosures lead to higher subsequent share return for the
company). Thus, the higher levels of corporate carbon disclosures appear to mediate the
potential negative effects of the company’s high carbon emissions. The direct and indirect
mechanisms are in line with the prediction of socio-political and economic disclosure theories,
which suggest that the market does respond to corporate environmental performance
(Clarkson, Li, Richardson, & Vasvari, 2011; Matsumura, Prakash, & Vera-Muñoz, 2013; Saka &
Oshika, 2014), and companies with poor environmental performance tend to disclose more
ICMA Centre
4 © Liu et al, June 2016
information to manage the legitimacy threat that is subsequently created by the poor
performance (Chauvey, Giordano-Spring, Cho, & Patten, 2014; Cho & Patten, 2007; Patten,
2002) and to reduce the information asymmetry (Al-Tuwaijri et al., 2004; Healy & Palepu, 2001;
G. F. Peters & Romi, 2014).
This study contributes to the understanding of how social concerns for climate change affect
corporate financial performance and provides in-depth understanding of the mechanisms of the
association. To our best knowledge, this is the first study investigating the simultaneous
association among corporate carbon emission, carbon disclosures and corporate financial
performance. The use of the two-level mediation model allows us to evaluate direct, indirect and
total effects between our interests’ variables. The mediating impact of carbon disclosure on the
negative association between carbon emission and corporate financial performance sheds light
on the motivation of corporate voluntary carbon disclosures. This study also contributes to
corporate carbon accounting and reporting literature by providing an overview of expected
disclosures from government, lobby groups and other climate change related institutions
through building up a comprehensive carbon disclosure index. The findings also have important
implications for corporate top management and government who are interested in improving
corporate carbon emission reduction and reporting strategy. Extending previous literature, this
study contributes by providing new conceptual and methodological advancements.
The paper is organised as follows. Section 2 reviews the relevant literature and presents the main
hypotheses. In Section 3, the research methods are discussed. Section 4 presents the results and
discussion, followed by the summary and conclusions in Section 5.
2 Literature review and hypothesis development
2.1 Carbon emission and corporate financial performance
In terms of carbon emission management, there is a direct financial impact from both the
regulatory perspective and investment perspective in the UK. From the regulatory perspective, if
companies cannot fulfil their responsibilities to reduce their emissions to the targets under
mandatory carbon management schemes, they should either pay for the fines or buy emission
allowance from the carbon trading market, both of which cause financial burden for the
company. To achieve the carbon emission targets and avoid the fines, companies could invest in
their carbon reduction management system by using low emission energy, equipment, and/or
by developing low carbon technology. When their carbon emission is below their emission
target, companies could have some surplus of their carbon emission allowances and they could

Henley Discussion Paper Series
© Liu et al, June 2016 5
sell their surplus in the carbon trading market for financial benefits.1 Better performance in
carbon management will therefore lessen the financial burden and even bring profit for the
company that does well. In addition to the tangible financial impact, better carbon emission
performance may, according to stakeholder theory prediction (Freeman, 2010), have other
intangible impacts on the company, such as good reputation and better relationships with
government, suppliers and customers (Brammer & Pavelin, 2005; Brown & Dacin, 1997; Sen &
Bhattacharya, 2001). Given all of the above, this study attempts to test if in fact a company with
better carbon emission performance will benefit from improved financial performance.
There is limited empirical evidence of the link between carbon emission and financial
performance. The studies of environmental performance and corporate financial performance
should shed light on the association between carbon emission and corporate financial
performance. Clarkson et al. (2011) seek insights into the question ‘Does it pay to be green?’
They employ a sample of 242 companies from the four most polluting industries in the US,
across the time period 1990–2003. Toxic release inventory in pounds per cost of goods sold is
used as a measure of corporate environmental performance. Their results show that companies
with improvement in their environmental performance benefit from increased Tobin’s Qs,
profitability, liquidity and sales growth in the subsequent periods.
Studies with a focus on corporate carbon emission performance find similar results. Using
carbon emission data of a sample of S&P 500 companies, Matsumura et al. (2013) find
significantly negative association between carbon emission and firm value. The authors hand-
collect carbon emissions data of S&P firms from carbon disclosure project (CDP) questionnaires
and use market value of common equity as the measure of firm value. They find that on average,
for every additional thousand metric tons of carbon emissions, firm value decreases by
$212,000. Saka and Oshika (2014) examine the association between corporate carbon emission
and firm value in the Japanese context. Instead of using the voluntarily reported volume of
carbon emissions, they use mandatorily reported carbon emissions data, which is claimed to
solve the endogeneity problems in previous studies. Consistent with previous studies, they use
market value of equity to measure corporate value. They evidence that carbon emissions and
firm value are negatively related. Clarkson, Li, Pinnuck, and Richardson (2015) further look into
how corporate carbon emissions affect firm valuation under the European Union Emissions
Trading Scheme (EU ETS). They explicitly consider the impact of carbon emission allowances and
a company’s ability to pass carbon compliance cost on to the end users and consumers in their
1 European Climate Exchange, the world’s largest carbon exchange, has proved to be a mature market for
carbon trading over the period of 2008 and 2011.(Ibikunle, Gregoriou, Hoepner and Rhodes, 2015)
ICMA Centre
6 © Liu et al, June 2016
valuation model. For the firm value, the authors use the Ohlson valuation model as a measure.
Their results show that a company’s carbon allowances are not associated with firm value but
that the shortfalls are negatively associated. Accordingly, the first hypothesis relates to the
association between corporate carbon emission and financial performance. These above
arguments lead to the following hypothesis:
Hypothesis 1. There is a negative relationship between corporate carbon emission and corporate
financial performance.
2.2 Carbon emission and carbon disclosure
Previous studies examining the relationship between environmental disclosure and
environmental performance are motivated by the voluntary nature of disclosures related to
corporate environmental affairs. For the disclosures to be useful to stakeholders, there should be
some correspondence between the disclosures and actual performance. Patten (2002) uses a
Toxics Release Inventory (TRI) related sample of 131 US companies and controls for size and
industry in the model. Content analysis of annual reports is used to assess the content of
environmental disclosure. The results document a significant negative relationship between
disclosure and actual performance and the association is stronger for companies from non-
environmentally sensitive industries. Cho and Patten (2007) later provide additional support for
the argument that companies with poorer environmental performance provide more
environmental disclosures as a legitimate tool for addressing the increased threats to their
legitimacy. Instead of using absolute pollution, they subcategorise the 100 KLD-related sample
in terms of worse performers and better performers, using the corporate social and
environmental performance ratings compiled by KLD Research and Analytics. Environmental
disclosures in companies’ 10K reports are measured using an eight-item content analysis
classification developed by Patten (2002), further distinguishing monetary and non-monetary
items. Consistent with previous studies, they find that generally poorer performers disclose
more than better performers and the use of monetary and non-monetary components of
disclosure varies across groups. Cho and Roberts (2010) provide more evidence of the
environmental performance–disclosure link in a more recent study. The authors employ a
comprehensive disclosure evaluation metric to assess both the content and the presentation of
corporate website environmental disclosures and utilise a company’s Toxic 100 toxic score to
proxy for corporate environmental performance. The disclosures of Toxic 100 companies are
compared with the disclosures of non-Toxic 100 companies. It is concluded that corporate
environmental disclosures on websites are often de-coupled from corporate actual

Henley Discussion Paper Series
© Liu et al, June 2016 7
environmental performance and companies use Internet reporting to project a more socially
acceptable environmental management approach to public stakeholders.
There is very limited literature on the environmental performance–disclosure link focusing on
corporate carbon emission issues. Hassan and Kouhy (2014) examine the environmental
disclosure–performance link of the Nigerian oil and gas industry. They content analyse corporate
annual reports, press releases and fact sheets to measure the substance of disclosure and also
the volume of disclosure. The data envelopment analysis model, which is based on the
mathematical technique of linear programming, is used for measuring carbon emission
performance. The results document a significant negative association between the substance of
disclosure and performance.
In line with the previous studies, this study concentrates on the legitimising function of
voluntary disclosures. Legitimacy theory recognises the fact that companies are bound by a
social contract in which they agree to perform within the norms of their respective societies, and
posits that organizations employ environmental disclosures as a legitimacy tool to meet the
expectations of the society and thus to gain or maintain their legitimacy (Deegan, 2002; Deegan,
Rankin, & Tobin, 2002; Dowling & Pfeffer, 1975; Lindblom, 1994; Patten, 1992). Legitimacy
theory posits a negative association between corporate environmental performance and
environmental disclosure, which indicates that companies with poor environmental
performance tend to make more environmental disclosures to meet the expectation from the
stakeholder to maintain their social contract to operate within the society. Given all of the above
discussion, this study hypothesises that:
Hypothesis 2. There is a positive relationship between corporate carbon emission and corporate
carbon disclosures.
2.3 Carbon disclosure and corporate financial performance
In contrast to examinations of the environmental performance–disclosure link and
environmental performance–financial performance link, explorations of the financial impact of
environmental disclosures are more limited. E.-H. Kim and T. Lyon (2011) study the
circumstances under which share prices are increased for the Financial Times Global 500
companies due to participation in the CDP. They use participation of CDP as proxy for corporate
carbon disclosure and fail to find evidence that CDP participation itself could lead to increased
shareholder value. However, CDP participants do benefit from increased stock prices in a
significant and sustained fashion when there is likelihood of climate change regulation risk when

ICMA Centre
8 © Liu et al, June 2016
Russia ratified the Kyoto Protocol. The participant companies are perceived as being more
prepared for exogenous shocks. In addition to the positive impact of carbon disclosure on firm
value during carbon sensitive periods, Saka and Oshika (2014) investigate, in the context of
Japan, the association between carbon disclosure and firm value during ‘normal days’ when
there is no specific carbon agenda. Similar to E.-H. Kim and T. Lyon (2011) study, they use
companies’ responses to CDP as proxy for carbon disclosures. Market value is measured as the
market value of equity. They document a positive effect of carbon disclosures on corporate
value. And the positive impact is more significant for companies with high volume of carbon
emissions. Instead of examining the firm-value impact of carbon disclosure directly, Matsumura
et al. (2013) compare the firm value for the companies that choose to disclose their carbon
emission to CDP with a propensity score matched sample of companies that choose to not
disclose this information. They find that the median firm value of companies that disclose their
carbon emission information is about $2.3 billion higher than that of their non-disclosing
counterparts.
Revealing information about a company’s environmental technologies, environmental practices
and performance satisfies the needs of a company’s stakeholders, including regulators,
employees and customers. In general, disclosures provide benefits through reduced information
asymmetry between the company and outsiders, consequently facilitating efficient allocation of
scarce resources (Healy & Palepu, 2001) and leading to the company’s adaptation to external
demands (Orlitzky, Schmidt, & Rynes, 2003). A company that makes more extensive and
objective voluntary carbon emission disclosures is therefore more likely to benefit from higher
share prices. The market is likely to treat non-disclosure behaviour as an adverse signal and to
penalise non-disclosing companies. Based on this discussion, the hypothesis is stated as follows:
Hypothesis 3. There is a positive association between corporate carbon disclosures and corporate
financial performance.
Together with the discussion in the above three sub-sections (2.1, 2.2 and 2.3), if all the three
correlations are confirmed – that more carbon emissions have a negative impact on corporate
financial performance and a positive impact on carbon disclosures, and that carbon disclosures
positively impact on corporate financial performance – it is reasonable to confirm that
companies choose to disclose their carbon emissions, likely knowing that capital markets
penalise them for their carbon emissions. In this relationship, carbon disclosures should be
considered as a mediator variable. Matsumura et al. (2013) find that the market penalises all
companies for their carbon emissions, but a further penalty is imposed on companies that do
not disclose their emission information.

Henley Discussion Paper Series
© Liu et al, June 2016 9
3 Methods
3.1 Sample selection
To achieve the aim of this research and answer the research questions, the study employs annual
reports and stand-alone CSR reports of 62 carbon sensitive FTSE 100 companies in the UK. The
majority of the existing literature on environmental disclosure focused on disclosure by
environmentally intensive industries (Berthelot & Robert, 2012; Dragomir, 2012; Eleftheriadis &
Anagnostopoulou, 2014; E.-H. Kim & T. P. Lyon, 2011; Matisoff, 2012; Pizer, Morgenstern, & Shih,
2011). This study extends previous studies by identifying carbon sensitive industries. Carbon-
sensitive industries are identified by investigating the industries with companies that are Carbon
Trading Account Holders (AH). Carbon Operator Holding Accounts are recorded by the
European Commission in the European Union Transaction Log at:
http://ec.europa.eu/environment/ets/welcome.do?languageCode=en. The database records the
ownership of carbon allowances in both the EU Emission Trading System (EU ETS) and the
United Nations system, based on countries that have ratified the Kyoto Protocol. The Operator
Holding Accounts in the database is employed in the current research. In the case of carbon
emissions, carbon sensitive industries are more concerned with carbon emission and carbon
information and are consequently expected to be more willing to release carbon disclosure data
to the public, to demonstrate the legitimacy of their operations (Dowling & Pfeffer, 1975). There
are a number of reasons for using UK data. Firstly, UK ETS was introduced in 2002, thus the UK
has a relatively well developed system on carbon emission. The UK is also the country that
ratified the Kyoto Protocol in the very early stages; companies from countries ratifying the
Protocol are more forthcoming to make greenhouse gas (GHG) disclosures (Freedman & Jaggi,
2005). Climate change issues are more salient in the UK. The selection of FTSE 100 is justified
from both the theoretical and empirical perspectives. Legitimacy theory suggests that large
companies are facing more legitimacy concerns and are more exposed to social scrutiny
(Dowling & Pfeffer, 1975), and a number of prior studies document that the extent of corporate
CSR disclosures are positively associated with company size(Chauvey et al., 2014; Elsayed, 2006;
Patten, 1992, 2002; Qiu et al., 2016). The FTSE companies are also argued to have
heterogeneous stakeholders with different vested interests (Liao et al., 2014; Qiu et al., 2016;
Salama, 2005).
Deegan (2002) indicates that financial report disclosures are used by the management of
companies as a legitimizing tool and the annual report is the most important media for
companies to communication to their stakeholders and the public (Adams, Hill, & Roberts,

ICMA Centre
10 © Liu et al, June 2016
1998). Information disclosed in annual reports are widely used in previous research (Cho &
Patten, 2007; Mahadeo, Oogarah-Hanuman, & Soobaroyen, 2011; Patten, 1992, 2002; Roberts,
1992; Wiseman, 1982). In addition to annual reports, we also use CSR reports and/or standalone
reports to examine the quality of corporate carbon disclosures, based on the following reasons.
Firstly, carbon issues are more technical than other social and environmental issues; companies
prefer to provide more detailed carbon information in their standalone reports rather than
annual reports. Secondly, while the social and environmental information in annual reports is
not usually audited, the fact that more and more standalone reports are would enhance the
credibility and quality of the information disclosed.
3.2 Variable measurements
3.2.1 Carbon disclosure
To measure corporate carbon disclosure, existing literature mainly uses the CDP data either as
the proxy for the existence of carbon disclosure of companies and/or as proxy for the quality of
carbon disclosure (Ben‐Amar & McIlkenny, 2014; Freedman & Jaggi, 2005; Kolk, Levy, & Pinkse,
2008; Liao et al., 2014; Luo, Lan, & Tang, 2012; Saka & Oshika, 2014; Stanny, 2013). CDP changed
their questionnaire over time and company responses are also in constant flux (Kolk et al., 2008;
Liao et al., 2014).2 Using CDP data is therefore not suitable for this longitudinal analysis and
comparison. Another data source of existing carbon disclosure literature is content analysis of
annual reports and/or CSR reports, which is more discretionary than corporate response to
CDP’s questionnaire (Dwyer et al., 2009; Eleftheriadis & Anagnostopoulou, 2014; Freedman &
Jaggi, 2005; Ieng Chu, Chatterjee, & Brown, 2012; JM Ferreira, Anastasia Mariussen, Kuo, & Yi-Ju
Chen, 2013; Lee, Park, & Klassen, 2015; Peng, Sun, & Luo, 2014). This discretionary nature of
content analysis is of particular importance, since Liesen et al. (2015) document quantitative
corporate carbon disclosures to suffer from incompleteness, as less than a quarter of European
firms in their sample report greenhouse gas emissions of scope 1 and 2 for more than 90% of
their operations. For the purpose of this study, qualitative content analysis is hence more
appropriate to assess the quality of corporate carbon disclosure rather than the quantity of
disclosure (Chelli, Durocher, & Richard, 2014; Cormier, Magnan, & Van Velthoven, 2005;
Wiseman, 1982).
This paper extends prior study by using a 42-item disclosure index, as provided in the Appendix.
Besides the extant environmental disclosure and carbon emission studies, the index design
2 It is also noteworthy that company responses to the CDP questionnaire do not always equal the same
company’s carbon disclosure in its sustainability report.

Henley Discussion Paper Series
© Liu et al, June 2016 11
closely follows certain carbon accounting and reporting guidelines, which include GRI (2013),
WBCSD and WRI (2004), DEFRA (2013), CDP (2012), carbon accounting and reporting literature
(Andrew & Cortese, 2011; Bebbington & Larrinaga-Gonzalez, 2008; Burritt, Schaltegger, &
Zvezdov, 2011; Cook, 2009; Haque & Deegan, 2010; Hopwood, 2009; Kolk et al., 2008;
Lohmann, 2009), and also makes reference to research associations of corporate carbon
emission accounting and reporting issues. It is believed that those documents present the
mainstream requirements or expectations of corporate carbon disclosures from society and
stakeholders and represents the best practice of carbon emission disclosures. A score of “1” is
awarded for each item in the index when the information is disclosed in either annual or
standalone reports; otherwise a score of “0” is given. The total score thus ranges from 0 to 42.
3.2.2 Financial performance
There are two categories of financial performance: accounting based performance and market
based performance. Accounting performance indicators mainly include return on equity, return
on asset, which are based on the information from corporate financial statements. The argument
for the positive association between CSR and accounting performance is mainly based on
stakeholder theory (Preston and O’Bannon, 1997, Salama, 2005, Hatch and Cunliffe, 2012) The
argument for the negative association between CSR and accounting performance is based on
agency theory (Barnea & Rubin, 2010; M. Friedman, 1970) However, the impact of CSR is not
only on the accounting performance; CSR is recognised as a kind of corporate investment that
creates opportunities to enhance organizational financial performance in the future (Jones,
1995), so socially, environmentally responsible companies are likely to be viewed more
favourably by investors (Friedman & Miles, 2001; Hoepner, Oikonomou, Scholtens, & Schröder,
2016; Majoch, Hoepner, & Hebb, 2016). Consistent with the prediction of the resource based
view (stakeholder theory) one can argue that companies with more engagement in CSR are
likely to benefit from higher share prices. In recent studies, market based financial performance
is widely used in CSR studies ((Balabanis, Phillips, & Lyall, 1998; Cho & Roberts, 2010; Clarkson,
Li, Pinnuck, & Richardson, 2014; Ingram, 1978; Jacobs, Singhal, & Subramanian, 2010; Lee et al.,
2015; Matsumura et al., 2013; Murray, Sinclair, Power, & Gray, 2006; Patten & Nance, 1999; Qiu
et al., 2016; Saka & Oshika, 2014; Salama, 2005; Shane & Spicer, 1983). In this study, market
based financial performance is employed to fully reflect the impact of corporate carbon
reduction engagement through carbon emission performance and also carbon emission
disclosure. Monthly total return index from 2011 to 2013 is first collected from Thomson
Reuters Datastream and annual returns are calculated for full firm year observation. Sector

ICMA Centre
12 © Liu et al, June 2016
average return is then subtracted to obtain the sector adjusted return (Kang & Shivdasani,
1995).
3.2.3 Carbon emission
While we are aware of the weaknesses of quantitative carbon emissions data (Liesen, Hoepner,
Patten, & Figge, 2015; Yu, Hoepner, & Adamsson, 2016), these quantitative data points albeit
insufficient are still used frequently in the literature (Clarkson et al., 2015; Saka & Oshika, 2014).
Yearly total carbon emission from 2010 to 2012 is downloaded from environmental, social and
governance (ESG) data powered by Thomson Reuters ASSET4 on Datastream, is also used by
extant literature (Ioannou & Serafeim, 2012; Ziegler, Busch, & Hoffmann, 2011). The ASSET4
database provides objective, relevant, and systematic corporate Environmental, Social and
Governance performance information, and it contains more than 750 data points including all
exclusion (ethical screening) criteria and all aspects of sustainability performance. There are
more than 280 key performance indicators (KPI) integrated and structured into 18 categories.
Emission related KPIs include CO2 Equivalents Emission Total, CO2 Equivalents Emission Direct
(i.e. Scope 1), CO2 Equivalents Emission Indirect (Scope 2) and CO2 Equivalents Indirect
Emissions (Scope 3).investor. However, data availability on the individual scopes is,
unfortunately, limited, since a significant proportion of companies only reports aggregated
emissions instead of emissions by scope.3 Hence, due to this data in availability, we use only at
corporate total carbon emissions (i.e. CO2 Equivalents Emission Total).
3.3 Empirical model and tests
Two-level meditational modelling is designed to test mediated effects in clustered datasets and
it is appropriate to accommodate independent and mediator variables measured in the
longitudinal data. Figure 1 indicates the hypothesised meditational relationship in a longitudinal
dataset in which year observations are nested within the firm. The three interest variables –
independent variable ( , ), mediator or mediation variable ( , ) and
dependent variable ( , ) – are all measured at firm (year observation) level. It illustrates that
carbon emission performance in previous years relates to carbon disclosure during that same
year which in turn relates to the firm financial performance in the current year. It is also noted
that there is a direct relation of , to , that is the direct effect of carbon emission
on return. Another reason to lag the variables is to account for the potential existence of a
contemporaneous, bidirectional association between carbon emission, carbon disclosure and
3 This is confirmed by ASSET 4 through email.
Henley Discussion Paper Series
© Liu et al, June 2016 13
firm return. Control variables ( , are firm characteristics in year 1 that could
affect firm return in year . The reason to lag these firm characteristics in the model is based on
the notion that resources available at the beginning of a fiscal period dictate spending for the
period (Clarkson et al., 2011). Control variables ( , are firm characteristics in year
2 that could affect carbon disclosure in year 1. One year lagged return ( , ) and one
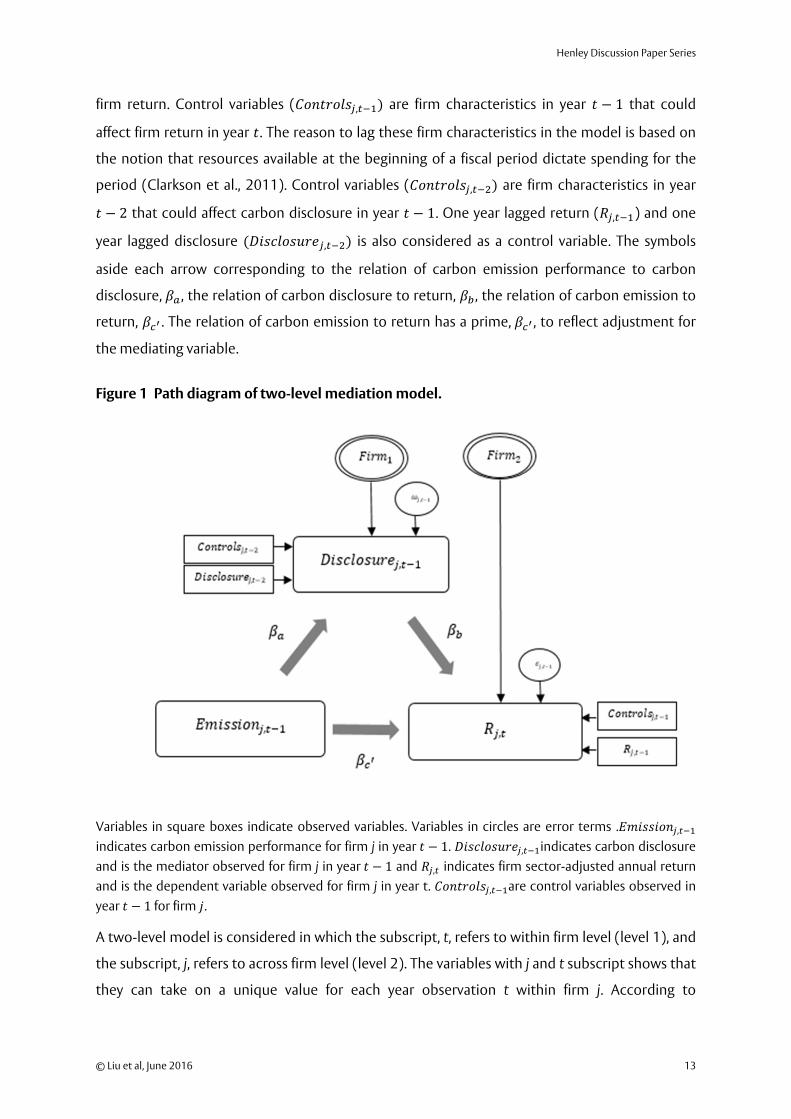
year lagged disclosure , is also considered as a control variable. The symbols
aside each arrow corresponding to the relation of carbon emission performance to carbon
disclosure, , the relation of carbon disclosure to return, , the relation of carbon emission to
return, . The relation of carbon emission to return has a prime, , to reflect adjustment for
the mediating variable.
Figure 1 Path diagram of two-level mediation model.
Variables in square boxes indicate observed variables. Variables in circles are error terms . ,
indicates carbon emission performance for firm j in year 1. , indicates carbon disclosure
and is the mediator observed for firm j in year 1 and , indicates firm sector-adjusted annual return
and is the dependent variable observed for firm j in year t. , are control variables observed in
year 1 for firm .
A two-level model is considered in which the subscript, t, refers to within firm level (level 1), and
the subscript, j, refers to across firm level (level 2). The variables with j and t subscript shows that
they can take on a unique value for each year observation t within firm j. According to

ICMA Centre
14 © Liu et al, June 2016
stakeholder theory, it is hypothesized that previous year ( 1) carbon emission and carbon
disclosure affect the current year ( firm financial performance. Following this hypotheses and
the notation of Kenny, Korchmaros, and Bolger (2003) and Krull and MacKinnon (2001) a two-
level mediation model is depicted with the following two equations. Two-level mediation
estimation include (1) a regression equation predicating firm financial performance from the
previous year carbon emission and carbon disclosure variable; and (2) a regression equation
predicting carbon disclosure from carbon emission performance.
1) Level 1: , , , , ,
,
Level 2:
2) Level 1: , , ,
,
Level 2:
Where , is the independent variables observed for firm j in year 1,
, indicates carbon disclosure and is the mediator observed at for firm j in year 1
and , indicates firm financial performance and is the dependent/outcome variable observed at
year t for firm . , is the control variables observed in year 2 for regression
equations predicting the carbon disclosure and , is the control variables observed in
year 1 for regression equations predicting the firm financial performance respectively. One
year lagged return ( , ) and one year lagged disclosure , are considered as
control variables in regression (1) and (2) respectively. This set of equation includes a within firm
level (Level 1) equation and an across firm level equation (level 2).
The intercept term ( ) has been indexed by the subscript j, which suggest that it is treated as a
random intercept and varies across firm level units. It equals an overall mean of the intercept
( and a deviation from the mean for each across firm level unity ( . It is this second level
error term ( that allows the two - level model to address within firm homogeneity of errors
in the longitudinal data.
The slops in level 1 of all three regressions , , are path coefficients. The direct effect
carbon emission on firm financial performance controlling the mediator (carbon disclosure) is
designated, , the effect of carbon disclosure on the dependent variable is designated, , and
the effect of carbon emission on carbon disclosure is designated, . The product is a

Henley Discussion Paper Series
© Liu et al, June 2016 15
second point estimate of the mediated effect, which evaluates the extent to which carbon
emission affects carbon disclosure and the extent to which the carbon disclosure, in turn, affects
firm financial performance. The path coefficient is measured by the standardized regression
coefficient. It represents the change in the dependent variable for a 1 standard deviation change
in the independent variable. The error term , represents the part of return that is not
explained by its relation with carbon emission and carbon disclosure in regression (1). The error
term , indicates the part of carbon disclosure that is not explained by its relation with
carbon emission in regression (2).
In equation regression (2), the dependent variable is carbon disclosure and it is scored using the
criteria descripted previously for the firm-year observation. It is non-negative and discrete and
roughly following Poisson distribution. Thus, regression (2) is considered as Poisson regression
equation.
4 Empirical results
4.1 Descriptive statistics
Table 1 Panel A reports summary statistics of the above variables including mean, standard
deviation, minimum and maximum values. The main interest variables are carbon disclosure,
carbon emission and sector-adjusted return. The mean and the standard deviation of carbon
disclosure is 16.741 and 7.989 respectively, which suggests that the overall carbon emission is
quite spread out over the range from 0 to 35. The mean and standard deviation of carbon
emission are about 6 and 1 respectively with minimum value of 3.883 and maximum value of
7.929. And these summary statistics indicate that the overall variation of carbon emission is
moderate. The summary statistics of firm sector-adjusted return suggest that the distribution is
not dispersed and the data points are very close to the mean. However, as the data are
longitudinal, details with decomposition are investigated within and between firm observations
in Table 1 Panel B.
The control variables descriptive statistics indicate that the most dispersed distribution is
dividend yield. The distributions of return on equity, leverage and profit margin are also very
dispersed. However, the size does not vary greatly with standard deviation of 0.595. A similar
distribution pattern applies to capital expenditure with standard deviation of 0.813, minimum
value of 3.791 and maximum value of 7.310.

ICMA Centre
16 © Liu et al, June 2016
Table 1
Panel A: summary statistics of variables.
Variable Obs Mean St.d Min Max
Carbon disclosure 185 16.741 7.989 0 35
Log carbon emission 173 6.051 1.011 3.883 7.929
Sector adjusted return 185 0.001 0.027 –0.097 0.064
Log (MV) 182 4.113 0.595 1.269 5.149
MTBV 179 2.949 4.061 –43.438 12.078
Profit margin 184 19.702 13.325 –0.02 61.79
Leverage 184 35.762 20.161 0 99.245
Dividend yield 182 21.484 157.310 0 1725.605
Current ratio 184 1.505 0.997 0.213 6.53
Capital expenditure 184 5.604 0.813 3.791 7.310
Return on equity 181 23.801 30.009 –29.92 338.268
Panel B: Within and between firm summary statistics of interest variables.
Variable Mean St.d Min Max Observation
Carbon disclosure
Overall 16.741 7.989 0 35 N=185
Between 7.653 0 33.667 N=62
Within 2.361 6.407 25.074 T-bar=2.98
Sector adjusted return
Overall 0.001 0.027 –0.097 0.064 N=185
Between 0.015 –0.046 0.045 N=62
Within 0.023 –0.071 0.068 T-bar=2.98
Log(Carbon emission)
Overall 6.051 1.011 3.889 7.929 N=173
Between 0.997 3.916 7.920 N=60
Within 0.164 4.470 6.845 T-bar=2.88
Table 1 panel B decomposes the standard deviation, minimum and maximum values into
‘between’ and ‘within’ components for the independent variables (carbon emission), mediation
variable (carbon disclosure in annual report) and outcome variable (firm sector adjusted return).

Henley Discussion Paper Series
© Liu et al, June 2016 17
The mean of firm sector adjusted return is close to 0 with minimum value of –0.097 and
maximum value of 0.064. The standard deviations of sector adjusted return between firm and
within firm are 0.015 and 0.023 (close to overall St.d of 0.027) respectively. These summary
statistics indicate that sector-adjusted return changes more over the sample time than across
firm dispersion. The overall mean of carbon disclosure is 16.7 with minimum value of 0 and
maximum value of 35. And the standard deviation of carbon disclosure between firm is 7.653
suggests that carbon disclosure is quite dispersed between firm. However, within firm standard
deviation is only 2.361 indicate that the carbon disclosure does not change much during the
sample period 2010–2012. The mean of log carbon emission is about 6.051 with minimum value
of 3.889 and maximum value of 7.929. The standard deviations across firm and within firm are
0.997 and 0.164 respectively, which indicates that carbon emission is more spread out between
firm compared with within firm variation. This is a very interesting finding: carbon disclosure
variance between and within firms follows the same pattern as carbon emission.
4.2 Analysing the interrelationship
The standardised regression coefficient is reported in the results in Table 2. It is rescaled
regression coefficient to measure the effect size in the mediated effect. The direct effect of
carbon emission on firm sector-adjusted return is measured by and estimated to be -0.004.
This negative effect is small but statistically significant. It indicates that one standard deviation
increase of carbon emission decreases firm sector-adjusted return by 0.004 standard deviation.
The path coefficient indicates the effect of carbon emission on carbon disclosure and is
estimated to be 0.18. It is a moderate effect and highly statistically significant. This result
suggests that one standard deviation increase in carbon emission increases carbon disclosure by
0.18 standard deviation. The effect of carbon disclosure on sector-adjusted return is measured
by . This effect is very small (0.0004) and marginally statistically significant. It indicates that
carbon disclosure in year 1 positively associated with sector-adjusted return in year ,
however, the influence is very small. The result of and together suggest that carbon
emission performance affects carbon disclosure in firm annual report and which in turn, affects
the firm return. Thus we could argue that carbon disclosure in the previous year annual report is
a mediator of the effect of carbon emission on the firm’s financial performance. The indirect
effect of carbon emission on firm return is the effect of carbon emission on carbon disclosure
multiplied by the effect of carbon disclosure on return ( , and it is almost negligible. The
total effect of carbon emission on sector-adjusted return equals the direct effect ( plus the
indirect effect ∗ , and the result is –0.0037. It is argued that carbon emission in previous
years is negatively associated with firm sector-adjusted return, however this effect is small.

ICMA Centre
18 © Liu et al, June 2016
Table 2 Parameter and standard error estimates for two-level mediation model.
Parameters Estimates Standard Error 95% confidence interval
Lower Upper
Direct Effects on firm sector-adjusted return (regression equation 1)
Carbon emission ( ) –0.0038** 0.0019 –0.0075 –0.0001
Carbon disclosure( ) 0.0004* 0.0002 –0.0000 0.0008
Industry control Yes
Firm characteristics control Yes
Lagged return control Yes
M1 [firm id] Constrained to 1
Carbon emission effects on carbon disclosure (regression equation 2)
Carbon emission ( ) 0.1788*** 0.0578 0.0654 0.2922
Lagged carbon disclosure 0.0346*** 0.0051 0.0246 0.0445
MV 0.0518 0.0923 –0.1290 0.2327
MTBV –0.0070 0.0044 –0.0157 0.0017
Capital expenditure –0.1467* 0.0824 –0.3083 0.0148
Leverage –0.0018 0.0016 –0.0048 0.0014
Profit margin 0.0039 0.0025 –0.0009 0.0088
Industry control Yes
M2 [firm id] Constrained to 1
Variances
Variance (M1) 2.15e-35 1.80e-20
Variance (M2) 0.0178 0.0125 0.0037 0.0733
Variance (e. return) 0.0002 0.0000 0.0002 0.0003
Observation 113
Notes: *, **, and *** denote statistical significant at 10%, 5% and 1% levels respectively.
Looking at the factors that affect carbon disclosure, it is reported that, as expected, previous year
carbon disclosure is a significant predicator of the current year carbon disclosure. It is also found
that capital expenditure is negatively related to carbon disclosure. Other firm characteristics,
such as size, profit margin, current ratio, return on equity and leverage do not seem to exert
influence on carbon disclosure in annual reports. One explanation is that those firm
characteristics are likely being captured by carbon disclosure in the annual report in the same
year.

Henley Discussion Paper Series
© Liu et al, June 2016 19
The variance of M1 and M2 indicates the extent to which the strength of the across-firm
difference explains the dependent variables in regression (1) and regression (2). The estimated
variance of M1 in regression equation (1) is almost negligible. The variance of M2 in regression
(2) is estimated to be 0.018 – a small size. This indicates that across-firm difference is more
influential in explaining carbon disclosure in annual report than in explaining sector-adjusted
return.
5 Discussion
The results are in support of H1, H2 and H3 and are also consistent with prior studies (Cho &
Patten, 2007; Clarkson et al., 2011; Hassan & Kouhy, 2014; E.-H. Kim & T. Lyon, 2011; Matsumura
et al., 2013; Patten, 2002; Saka & Oshika, 2014). Overall, the simultaneous association among
the three variables indicates a mechanism of the underling relationship between corporate
carbon emission and financial performance – carbon emission has a direct negative effect on
corporate financial performance and an indirect or mediated effect through carbon disclosures.
The results confirm the mediating effect of carbon disclosures.
The direct effect of carbon emission on corporate subsequent share return implies that the
capital market does respond to corporate carbon emission. The results are consistent with prior
studies suggesting that market analysts increasingly gather corporate environmental
information as an indicator of corporate future capital market returns (Kiernan, 1998). Since the
launch of the Kyoko Protocol in 1997, climate change and corporate carbon emissions have
become a central aspect of the corporate environmental issue, but scholars have only started to
pay more attention to the association between corporate carbon emission and corporate
financial performance over the last couple of years. The results for the link between carbon
emission and financial performance is more consistent than that between holistic
environmental performance and financial performance. The earlier environmental
performance–financial performance link studies show evidence that corporate environmental
engagement is negatively linked with financial performance; the capital market takes such
activities more as a financial burden (Jaggi & Freedman, 1992). In the more recent views of
corporate environmental performance, the intangible and reputational impact has been
recognised to explain the financial benefit of improving corporate environmental performance
(Salama, 2005). With regards to the negative impact of corporate carbon emission on the
subsequent financial performance, it provides evidence that lower carbon emission can increase
shareholders’ wealth and earn profits above the return on its tangible assets. Tackling carbon
emissions allows companies to lower the costs of complying with further environmental

ICMA Centre
20 © Liu et al, June 2016
regulations (e.g., more carbon reduction regulations would be expected following the Paris
Climate Summit in 2015 as a result of the first global agreement in carbon reduction), drive
down corporate operating costs, improve their corporate reputation, enhance the loyalty of key
stakeholders who equate companies with their environmentally friendly side, and enhance
corporate financial performance. This result is consistent with prior studies showing that the
market does negatively respond to corporate carbon emission (Busch & Hoffmann, 2011;
Clarkson et al., 2015; Matsumura et al., 2013; Saka & Oshika, 2014).
The indirect effect of corporate carbon emission on subsequent share return works through the
mediating impact of carbon disclosure. There is no known studies examining the links between
corporate carbon disclosure in annual or standalone CSR reports, corporate carbon emission
and financial performance. Prior studies use corporate response to CDP as proxy for corporate
carbon disclosure – 0 score for no response and 1 score for response – without consideration of
the extent of disclosure (Lee et al., 2015; Matsumura et al., 2013; Saka & Oshika, 2014). Still,
those studies could shed light on the results of the current study and the results found in this
study are consistent with those prior studies, indicting the mediating influence of carbon
disclosures. On one hand, carbon disclosure is found to be positively associated with subsequent
corporate financial performance. In general, disclosures provide benefits through reduced
information asymmetry between the company and outsiders, including its investors, customers,
lobby institutions, and subsequently facilitates efficient allocation of scarce resources (Healy &
Palepu, 2001). Companies making truthful voluntary carbon disclosures deliver transparent
nonfinancial information to investors. If companies do not disclose their carbon emission
information, investors will not be able to impute the company’s carbon emissions, but will also
likely treat non-disclosure as an adverse signal and may penalise non-disclosing
companies(Oikonomou, Brooks, & Pavelin, 2012, 2014). Voluntary disclosure is also used by
companies to reduce further regulatory intervention (Blacconiere & Patten, 1994). On the other
hand, carbon disclosure is found to be positively associated with concurrent carbon emission. A
legitimacy gap is created when a company’s carbon emission does not meet the expectation of
the stakeholders. If a company suspects its social legitimacy is or might be threatened, it has the
incentive to actively participate in policy process and to communicate its legitimacy repairing
strategy to the stakeholders (Liesen et al., 2015).Subsequently, companies with more carbon
emissions intend to disclose more extensive carbon emission information in an attempt to
address the increased threats to their poor carbon emission performance. The above two
aspects together explain why companies choose to make carbon emission disclosures even if
the capital markets penalise companies for their carbon emissions. However, the carbon
disclosure–financial performance link is inconsistent with some other studies. Lee et al. (2015)

Henley Discussion Paper Series
© Liu et al, June 2016 21
investigate the association with a sample of companies from the CDP in Korea. Their results
suggest that the market is likely to respond negatively to company’s carbon disclosure, implying
that investors tend to perceive carbon disclosure as bad news. One plausible explanation is that
carbon related costs and benefits are more recognised in more developed countries, which have
more experience in carbon emission issues and are more pronounced in promoting carbon
reduction activities.
Another interest of this study is to investigate factors that could impact on corporate carbon
disclosure. Looking at the factors that affect carbon disclosure, it is shown in Table 2 that, as
expected, previous year carbon disclosure is a significant predicator of the current year carbon
disclosure; this result is highly consistent with the conclusion of the previous chapter, that
corporate carbon disclosures become institutionalised and normative within and between
companies. It is also found that capital expenditure is negatively related with carbon disclosure.
This result is consistent with previous studies that indicate capital expenditure is found to be
highly related with the level of corporate environmental disclosures and is usually controlled in
environmental disclosure research (C. de Villiers & C. van Staden, 2011; C. de Villiers & C. J. van
Staden, 2011; G. F. Peters & Romi, 2014; Tauringana & Chithambo, 2014). Companies with less
capital expenditures are less likely to invest in carbon reduction innovative technologies and
other carbon management investment; according to legitimacy theory, those companies would
be more likely to disclose more information to maintain their operating legitimacy in society.
Interestingly, other firm characteristics, such as size, profit margin, current ratio, return on equity
and leverage, which are found to be determinant factors of corporate social and environmental
disclosures in extant studies (Bewley & Li, 2000; Branco & Rodrigues, 2008; Liao et al., 2014), do
not seem to exert influence on carbon disclosure in annual and standalone reports. One
plausible explanation is that those firm characteristics are likely being captured by carbon
disclosure in the same year.
6 Summary and conclusion
This study investigates the simultaneous relationship between corporate carbon emission
performance, financial performance and corporate carbon disclosures, for an extensive panel
data sample of 62 FTSE 100 companies between the years 2010 and 2012. In addition, the study
is also interested in the determinant factors of the extent to which companies disclose their
carbon emission information. The corporate carbon disclosure data was collected from hand
review of reports using a self-constructed disclosure index that represents the best practice and
stakeholders’ expectations of corporate carbon emission information. The rest of the data was

ICMA Centre
22 © Liu et al, June 2016
downloaded from Datastream. The structural equation modelling analysis shows that corporate
carbon emission impacts on corporate financial performance through both direct and indirect
mechanisms. For the direct impact, it is found that corporate carbon emission is negatively
associated with corporate financial performance, which indicates that the UK market does
respond to corporate carbon emission performance. For the indirect impact, the results show
that corporate carbon emission is positively related to the level of corporate carbon disclosures
(companies with more carbon emissions make more extensive disclosures), and also show a
significant positive relation between corporate carbon disclosure and corporate financial
performance (more carbon disclosures lead to higher subsequent share return for the
company). Thus, the higher levels of corporate carbon disclosures appear to mediate the
potential negative effects of more carbon emissions of the company. The results are consistent
with prior studies investigating the three links respectively.
The findings are also consistent with the predictions of socio-political theories and economic
disclosure theories. The study provides evidence that the market does value corporate carbon
emission issues, including both actual carbon emissions and the carbon emission related
information published in annual and standalone reports. Consistent with both socio-political
and economic disclosure theories, companies with higher carbon emissions would try to keep
their legitimacy to operate in society by increasing their carbon disclosure to address the
legitimacy threat. The increased disclosures therefore reduce information asymmetry and
investors can gauge how well the companies are managing their carbon emission risks and how
well they are equipped to tackle the risks in the future.
This study also evidences that previous year carbon disclosure is a significant predicator of the
current year carbon disclosure. Corporate carbon disclosures become institutionalised and
normative within and between companies. It is also found that capital expenditure is negatively
related with carbon disclosure. Companies with less effort in their investment are more
motivated to communicate with their stakeholders through increased level of disclosures. Other
firm characteristics, such as size, profit margin, current ratio, return on equity and leverage do
not seem to exert influence on carbon disclosure in annual reports. One plausible explanation is
that those firm characteristics are likely being captured by the control of last year carbon
disclosures.
Like all research, ours is subject to limitations. The first limitation lies in the subjectivity of
building a disclosure score rating index to arrive at an aggregate disclosure quality score. It is
also the inherent limitation of qualitative content analysis. The selection of index units and
categories could be arbitrary. The author managed to reduce the subjectivity by referring to

Henley Discussion Paper Series
© Liu et al, June 2016 23
extant environmental disclosure, carbon reporting literature, and also carbon reporting
guidance and regulations. Secondly, our sample is restricted to the largest UK carbon-sensitive
companies – the sample size is therefore relatively small. Based on our results, the quality of
carbon disclosures among those companies remains low and there is still companies making no
carbon disclosures at all. Therefore, including more companies in the sample would not improve
the quality of the study. Due to data availability, this study only employs corporate total carbon
emission as measurement of corporate carbon emission performance. The enacted 2013 carbon
disclosure regulation in the Companies Act 2006 requires companies to disclose their direct
(scope 1 and 2) and indirect (scope 3) emissions. Further research could be done when the data
is available to investigate if the financial market reacts differently to different types of carbon
emissions and if different types of carbon emissions have a different determinant impact on
carbon emission related disclosures.

ICMA Centre
24 © Liu et al, June 2016
Appendix
Extending the methodology used by Haque and Deegan (2010) the selection criteria for these items is the key issue and is addressed in at least two of
the literature sources and in corporate reports. The index also focuses on the usefulness of the information disclosed by companies. For example, if
the organization discloses that it funds other organization’s carbon reduction research, it is useful for users of the reports to know the amount of the
funding, in order to assess the impact of this activity. Consequently, such complementary items are included in the index to ensure organizations that
disclose useful information receive higher scores than organizations that only disclose information that is superficial and/or intended to improve
their image.
Specific issues Description Literature background
Examples
1. Whether the CEO/chairperson articulates
the organisation’s views on the issue of
climate change through publicly available
documents such as annual reports,
sustainability reports.
Whether carbon
emission issues are
in the chairman's
and executive’s
letters.
Haque and Deegan
(2010), CDP (2012),
DEFRA (2013)
‘We apply a carbon price to some of our new projects, and
require existing operations to consider and implement cost-
effective efficiency measures.’ (BP, SA2012 CEO Letter, P4)
2. Whether any quantitative carbon emission
performance information is included in
CEO/chairman’s reports.
The context of the
quantitative
information.
DEFRA (2013) ‘Sadly, greater transparency of North American activities has
caused an apparent increase from 2.3 to 3.8 tonnes of carbon
per employee…’ (Amec, AR2012, CEO Letter, p9)
3. Whether carbon emission issues are under
the supervision of the Board or executive
management team.
Whether carbon
emission issues are
in the statement of
responsibility of
Board, individual
position statements,
or board committee
or whether a specific
Haque and Deegan
(2010), CDP (2012)
‘Following this, the Sustainability Committee has overseen the
introduction of a new target for the next five years, which aims
to reduce the overall intensity of the Group’s GHG emissions
by 10%’.(BG, AR 2012, P56)

Henley Discussion Paper Series
© Liu et al, June 2016 25
board committee
exists to deal with
carbon issues, from
the name of
committee and risk
management
system.
4. Whether the organization has a general
knowledge of carbon emission reduction
but no target or result is stated (qualitative
policy).
General strategy
/policy.
CDP (2012), DEFRA
(2013)
‘While energy is available to meet growing demand, action is
needed to limit carbon dioxide.’
(CO2) (BP, AR2012,P13)
5. Whether the organization implements or
plans to implement any specific carbon
management schemes or strategies.
Whether carbon
reduction initiatives
are implemented or
planned within the
organizations.
WBCSD and WRI
(2004), DEFRA
(2013)
‘Introduction of new carbon software allowed far greater
transparency of data, resulting in a significant increase in the
number of offices reporting utility usage, particularly in the
Americas’. (Amec, SA 2012, P39)
6. Whether the organization has a future
quantitative target for carbon emission
reduction.
Quantitative targets. Haque and Deegan
(2010), CDP (2012),
DEFRA (2013),
Ratnatunga and
Balachandran
(2009)
Our long term targets form part of our strategy and remain at:
15 per cent reduction in CO2 by 2013, 40 per cent reduction in
CO2 by 2020, 60 per cent reduction in CO2 by 2030, 80 per
cent reduction in CO2 by 2050. (AMEC, SA2012, P38)
7. Whether the organization discloses the
methodology or methodologies used to
measure or calculate carbon emissions.
Methodology
disclosed or
reference or link
provided.
GRI (2011), GRI
(2013), WBCSD and
WRI (2004), DEFRA
(2013)
‘We have reported for more than a decade using the global
World Resources Institute/World Business Council on
Sustainable Development (WRI/WBCSD) GHG protocol which
sets out how to measure and account for emissions.’ (BG, SA
2012, P8)
8. Whether the organization conducts its
carbon measurement in accordance with
any carbon footprint measurement
High quality of
information and
data if the
GRI (2011), GRI
(2013), CDP (2012),
DEFRA (2013)
‘We have reported for more than a decade using the global
World Resources Institute/World Business Council on
Sustainable Development (WRI/WBCSD) GHG protocol which

ICMA Centre
26 © Liu et al, June 2016
standard, e.g. GHG Protocol, ISO 14064-1, BS
8901, UK Government’ s Environmental
Reporting Guidance WRI/WBCSD, Climate
Change Agreements, EU ETS, The Carbon
Reduction Commitment Energy Efficiency
Scheme (CRC Energy Efficiency), and
reporting standards in other countries.
organization
complies with any
measurement
standard.
sets out how to measure and account for emissions.’ (BG, SA
2012, P8)
9. Whether the organization discloses the
consolidation approach for carbon
emissions and/ or any changes during the
reporting period.
Boundary of the
organization, e.g.,
Equity shares,
financial control or
operational control
approach.
GRI (2013), CDP
(2012), WBCSD and
WRI (2004), DEFRA
(2013)
‘We report GHG emissions on a CO2-equivalent basis,
including CO2 and methane. This represents all consolidated
entities and BP’s share of equity accounted entities except
TNK-BP’. (BP,SA2011, P38)
10. Whether the organization defines and
reviews the operational boundary.
Operational
/inventory boundary,
e.g., direct emissions
and indirect
emissions; scope 1,
scope 2, scope 3
emissions.
Haque and Deegan
(2010), GRI (2011),
GRI (2013), CDP
(2012), WBCSD and
WRI (2004), DEFRA
(2013)
‘Our only significant source of Scope 2 emissions (indirect
emissions that arise from the consumption of purchased
electricity, heat or steam) is electricity.’(BG, SA 2012, P9)
11. Whether the organization sets up a base or
baseline year to measure and/or compare its
carbon emissions.
Baseline or
benchmark.
DEFRA (2013),
WBCSD and WRI
(2004), CDP (2012),
DEFRA (2013)
‘We are therefore treating 2012 as our baseline year for CO2
emissions.’ (Tullow, SA 2012, P42)
12. Whether the organization adopts absolute
quantitative disclosures of its direct carbon
emission (scope 1).
Gross direct carbon
emission quantities.
GRI (2011), GRI
(2013), CDP (2012),
WBCSD and WRI
(2004), DEFRA
(2013)
‘Our direct GHG emissions were 59.8 million tonnes (Mte) in
2012, compared with 61.8Mte in 2011, a decrease of 2.0Mte
versus 2011.(BP,AR2012, P52)
13. Whether the organization adopts Performance GRI (2011), (GRI, Our direct GHG emissions were 59.8 million tonnes (Mte) in

Henley Discussion Paper Series
© Liu et al, June 2016 27
quantitative comparison of direct carbon
emission (scope 1), with either previous
year/years, or with the baseline year.
compared with
historical data.
2013), CDP (2012),
WBCSD and WRI
(2004), DEFRA
(2013)
2012, compared with 61.8Mte in 2011, a decrease of 2.0Mte
versus 2011.(BP,AR2012, P52)
14. Whether the organization adopts absolute
quantitative disclosures of its indirect
carbon emission from purchasing energy
(scope 2).
Gross indirect
carbon emission
quantities.
GRI (2011), GRI
(2013), CDP (2012),
WBCSD and WRI
(2004), DEFRA
(2013)
Indirect carbon dioxide (CO2)h (Mte), 9.2 (2008), 9.6 (2009),
10 (2010), 9 (2011), 8.4 (2012) (BP,SA2012, P48)
15. Whether the organization adopts
quantitative comparison of its indirect
carbon emission (scope 2), with either
previous year/years, or with the baseline
year.
Performance
compared with
historical data
and/or targets.
GRI (2011), GRI
(2013), CDP (2012),
WBCSD and WRI
(2004), DEFRA
(2013)
Indirect carbon dioxide (CO2)h (Mte), 9.2 (2008), 9.6 (2009),
10 (2010), 9 (2011), 8.4 (2012) (BP,SA2012, P48)
16. Whether the organization uses intensity
ratios to disclose its scope 1 and scope 2
carbon emission information.
Ratios that compare
scope 1 and 2
emissions data with
relevant business
metrics or financial
indicators.
DEFRA (2013),
WBCSD and WRI
(2004), GRI (2013)
Sadly, greater transparency of North American activities has
caused an apparent increase from 2.3 to 3.8 tonnes of carbon
per employee, despite many good initiatives in other
areas.(Amec, AR 2012, P9)
17. Whether the organization makes any
quantitative disclosures of other indirect
carbon emission (scope 3).
Gross scope 3
carbon emission
quantities.
GRI (2011), GRI
(2013), CDP (2012),
WBCSD and WRI
(2004), DEFRA
(2013)
‘Customer emissions (MteCO2): 530 (2008), 554 (2009), 573
(2010), 539 (2011), 517 (2012)’.(BP,SA2012, P48)
18. Whether the organization makes
quantitative comparison of its other indirect
carbon emission (scope 3), with either
previous year/years, or with baseline year.
Performance
compared with
historical data
and/or targets.
GRI (2011), GRI
(2013), CDP
(2012),WBCSD and
WRI (2004)
‘Customer emissions (MteCO2): 530 (2008), 554 (2009), 573
(2010), 539 (2011), 517 (2012)’.(BP,SA2012, P48)

ICMA Centre
28 © Liu et al, June 2016
19. Whether the organization uses intensity
ratios to disclose its scope 3 carbon
emissions.
Ratios that compare
scope 3 emissions
data with relevant
business metric or
financial indicators.
DEFRA (2013), GRI
(2013), WBCSD and
WRI (2004)
‘Tonnes carbon per £million turnover, total scope (‘000
tonnes carbon), 22.6 (2012)…’(Amec, SA 2012, P71)
20. Whether the organization breaks down the
carbon emissions, e.g., by the organization’s
activities, products or services, combustion
of fuel, operation of facilities, electricity, heat
etc.
Emission sources. GRI (2011), GRI
(2013), CDP (2012),
WBCSD and WRI
(2004), DEFRA
(2013)
‘Around 55% of our GHG emissions came from the refineries
and chemical plants in our downstream business. The
production of oil and gas in our Upstream business accounted
for around 40% of our GHG emissions, and our shipping
activities for the remaining 5%.’(SHELL,SA 2011,P28)
21. Whether the organization explains its
carbon performance and/ or any significant
changes of its carbon performance.
Reasons that caused
significant increase
or reduction of
carbon emissions.
DEFRA (2013),
WBCSD and WRI
(2004)
‘Our absolute emissions rose significantly in 2012, due to
better inclusion of more complete data from our Americas
business. We will be reviewing this in 2013 and looking at re-
base lining our 2008 data following numerous acquisitions.’
(AMEC, SA, 2012, P8)
22. Whether the organization has any
disclosures of financial implications of
carbon emission.
Implications of
carbon emission
issues on financial
statements/financial
performance.
CDP (2012), Burritt
et al. (2011)
‘Approval of the project will allow EVRAZ NTMK to exercise its
right to sell Emission Reduction Units (ERUs). The Group
expects that total revenues from the sale of ERUs under the
EVRAZ NTMK project could be in the region of US$28
million.’(Evraz, AR,2010, P57)
23. Whether the carbon emission data disclosed
by the organization is independently verified
by a third party.
Whether the data
disclosed is verified
independently.
Haque and Deegan
(2010), CDP (2012),
WBCSD and WRI
(2004), DEFRA
(2013)
‘Independent assurance statement to Tullow Group Services
Limited on the Tullow Oil plc 2012 Corporate Responsibility
Report.’ (Tullow, SA 2012, P71)
24. Whether the third party gives unqualified
opinion of organization’s carbon disclosures.
Unqualified opinion
indicates high
quality of
disclosures.
Haque and Deegan
(2010), CDP (2012),
WBCSD and WRI
(2004), DEFRA
‘Based on the scope of our work and the assurance procedures
we performed, nothing has come to our attention that causes
us to believe that the selected CR performance indicators
compiled as described in Tullow Oil’s basis of reporting and
presented on pages 72-76 are materially misstated.’(Tullow,

Henley Discussion Paper Series
© Liu et al, June 2016 29
(2013) SA 2012, P71)
25. Whether the organization makes any
disclosures of its carbon allowance
recognition policy (net position method or
donated asset method).
Accounting policies. Bebbington and
Larrinaga-Gonzalez
(2008), Cook
(2009), Hopwood
(2009), Lohmann
(2009)
‘Allowances, whether issued by government or purchased, are
accounted for as intangible assets in accordance with IAS 38
‘Intangible Assets’. Allowances that are issued for less than fair
value are measured initially at their fair value.’ (EVRAZ, AR,
2010,P131)
26. Whether the organization makes any
disclosures of its valuation basis to measure
its carbon items in financial statements.
Accounting policies. Bebbington and
Larrinaga-Gonzalez
(2008), Hopwood
(2009), Lohmann
(2009)
‘When allowances are issued for less than fair value, the
difference between the amount paid and fair value is
recognised as a government grant. Initially the grant is
recognised as deferred income in the statement of financial
position and subsequently recognised as income on a
systematic basis over the compliance period for which the
allowances were issued, regardless of whether the allowances
are held or sold.’(EVRAZ, AR, 2010,P131)
27. Whether the organization has a policy of
compliance with any guidance to report its
carbon emissions e.g., GRI, DEFRA Guidance,
Climate Change Reporting Framework
(CCRF).
Compliance with
reporting standards
implies high quality
of disclosures.
Haque and Deegan
(2010), CDP (2012),
DEFRA (2013)
‘This report applies the Global Initiative G3.1 Guidelines and
Oil and Gas Sector Supplement, which are designed to help
organisations measure and report on their economic,
environmental and social performance over time’. (Tullow, SA
2012, P70)
28. Whether the organization discloses or plans
to disclose its carbon information to CDP.
Voluntary response
to CDP represents
the organization’s
carbon emission
disclosure strategy.
Kolk et al. (2008), G.
Peters and Romi
(2009)
‘We have been disclosing to the Carbon Disclosure Project
since 2007’.(Amec, SA 2012, P42)
29. Whether the organization recognizes its
regulatory and compliance risks.
Risk arising from the
changing of carbon
measurement,
trading or reporting
standards.
Haque and Deegan
(2010), CDP (2012),
WBCSD and WRI
(2004)
‘In the future, we expect that additional regulation of GHG
emissions aimed at addressing climate change will have an
increasing impact on our businesses.’(BP,AR2012, P52)

ICMA Centre
30 © Liu et al, June 2016
30. Whether the organization recognizes the
risk of the carbon price.
Risk arising from the
changing of the
carbon price.
Ratnatunga and
Balachandran
(2009), Lohmann
(2009)
‘Climate change and carbon pricing policies could result in
higher costs and reduction in future revenue and strategic
growth opportunities.’(BP,AR2012, P38)
31. Whether the organization pursues strategies
to minimise exposure to potential
regulatory or compliance risks.
E.g., the organization
purses a policy to
work closely with
government or
policy makers, or
advances its practice
according to
government
documents.
CDP (2012),
Ratnatunga and
Balachandran
(2009)
‘During 2012, we prepared for the implementation of new
government carbon pricing and trading legislation in key
markets and collaborated with industry partners on important
issues such as fugitive emissions.’ (BG, SA 2012, P4)
32. Whether the organization recognizes any
other carbon-related risks.
Disclosures of
relevant or potential
implications of
carbon risks.
CDP (2012), Burritt
et al. (2011),
Ratnatunga and
Balachandran
(2009)
‘Compliance with changes in laws, regulations and obligations
relating to climate change could result in substantial capital
expenditure, taxes, reduced profitability from changes in
operating costs, and revenue generation and strategic growth
opportunities being impacted.’ (BP, AR2012, P38)
33. Whether the organization endeavours to
achieve energy efficiency and/or renewable
energy to reduce carbon emissions.
Whether the
organization
purchases or
develops renewable
energy, or improves
its utilization of
energy.
Haque and Deegan
(2010), WBCSD and
WRI (2004),
Ratnatunga and
Balachandran
(2009)
‘policies that emphasize efficiency in production and energy
use as reducing the amount of energy used can have a
material impact on GHG emissions’.(BP,SA2012, P16)
34. Whether the organization discloses its
investment in energy efficiency and/or
renewable energy.
Quantitative
disclosure of
investment or cost
in energy efficiency
or renewable
Burritt et al. (2011),
Ratnatunga and
Balachandran
(2009)
‘During 2011, we invested a further $1.6 billion in our
Alternative Energy business, which takes total investment
since 2005 to $6.6 billion.’(BP,AR2011, P17)

Henley Discussion Paper Series
© Liu et al, June 2016 31
energy.
35. Whether the organization endeavours to
develop lower-carbon technology.
Lower-carbon
technology other
than energy
efficiency or
renewable energy.
Haque and Deegan
(2010), Burritt et al.
(2011)
‘BP is continuing to take a number of practical steps, including
investing in lower-carbon energy products…’(BP,AR2012,
P52)
36. Whether the organization discloses the
amount of its investment in lower-carbon
technology.
Disclosure of the
amount of cost or
investment.
CDP (2012), Burritt
et al. (2011)
‘Since 2005 we have invested $7.6 billion in lower-carbon
businesses.’(BP, AR2012, P27)
37. Whether the organization endeavours to
improve its business process to reduce
carbon emissions.
Improvement of
business processes
other than energy
efficiency or
renewable energy.
Burritt et al. (2011),
Ratnatunga and
Balachandran
(2009)
‘During 2012 we encouraged the use of electronic
communication tools instead of physical travel to
meetings.’(Amec, SA 2012, P41)
38. Whether the organization trains its
employees and/ or its value chain
organizations and/ or its customers in
carbon emission issues or encourages its
suppliers to reduce carbon emissions.
Employee training
and/ or customer
carbon reduction
service.
Haque and Deegan
(2010), Ratnatunga
and Balachandran
(2009)
‘In addition, we work to help our customers conserve energy
and reduce their CO2 emissions, including through the
development and sale of advanced fuels and
lubricants...’(Shell, AR2012, P47)
39. Whether the organization works with any
other organizations to identify carbon
reduction issues.
Co-operation with
other organizations
or participation in
any carbon
reduction projects
or schemes.
Haque and Deegan
(2010)
‘BP is a founding member of the UK’s Energy Technologies
Institute-a public/private partnership established in 2008 to
accelerate lower-carbon technology development.’ (BP,
AR2012, P58)
40. Whether the organization funds any
organizations involved in carbon emission
issues.
Provision of funding
to other
organizations in
carbon reduction
Haque and Deegan
(2010)
‘BP is funding the Energy Sustainability Challenge, a
consortium of academics that is analysing the complex
relationships between energy and natural resources.’(BP,
SA2012, P5)

ICMA Centre
32 © Liu et al, June 2016
research or projects.
41. Whether the organization discloses the
amount of funding of professional
organizations.
Quantitative
disclosure of
funding.
CDP (2012) ‘Developed under the direction of scientists at the University
of Miami’s Rosenstiel School of Marine and Atmospheric
Science, the devices gather a wide range of data to aid in
assessing ocean pollution and researching global climate
change and cyclic weather patterns. ... In addition to providing
ships as platforms for the required equipment, Carnival has
also supported the organization with annual contributions of
$50,000 since 2008.’(Carnival, SA 2011, P57)
42. Whether the organization recognizes any
other carbon-related opportunities.
Disclosures of any
other carbon-
related
opportunities
recognized by the
organization.
CDP (2012), Burritt
et al. (2011),
Ratnatunga and
Balachandran
(2009)
‘We ran workshops in partnership with the Carbon Trust this
year to help 80 UK SMEs improve their understanding of
climate change and develop action plans to reduce their
impact.’ (BT, AR 2011, P38)

Henley Discussion Paper Series
© Liu et al, June 2016 33
References
Adams, Carol A, Hill, Wan-Ying, & Roberts, Clare B. (1998). Corporate social reporting practices
in Western Europe: legitimating corporate behaviour? The British Accounting Review, 30(1), 1-
21.
Al-Tuwaijri, Sulaiman A, Christensen, Theodore E, & Hughes Ii, KE. (2004). The relations among
environmental disclosure, environmental performance, and economic performance: a
simultaneous equations approach. Accounting, Organizations and Society, 29(5), 447-471.
Andrew, Jane, & Cortese, Corinne. (2011). Accounting for climate change and the self-regulation of
carbon disclosures. Paper presented at the Accounting Forum.
Balabanis, George, Phillips, Hugh C, & Lyall, Jonathan. (1998). Corporate social responsibility and
economic performance in the top British companies: are they linked? European Business
Review, 98(1), 25-44.
Barnea, Amir, & Rubin, Amir. (2010). Corporate social responsibility as a conflict between
shareholders. Journal of business ethics, 97(1), 71-86.
Bebbington, J., & Larrinaga-Gonzalez, C. (2008). Carbon trading: Accounting and reporting
issues. European Accounting Review, 17(4), 697-717.
Ben‐Amar, Walid, & McIlkenny, Philip. (2014). Board effectiveness and the voluntary disclosure
of climate change information. Business Strategy and the Environment.
Berthelot, Sylvie, & Robert, Anne-Marie. (2012). Climate change disclosures: An examination of
Canadian oil and gas firms. Issues in Social and Environmental Accounting, 5(1/2), 106-123.
Bewley, Kathryn, & Li, Yue. (2000). Disclosure of environmental information by Canadian
manufacturing companies: a voluntary disclosure perspective. Advances in environmental
accounting and management, 1(1), 201-226.
Blacconiere, Walter G, & Patten, Dennis M. (1994). Environmental disclosures, regulatory costs,
and changes in firm value. Journal of accounting and economics, 18(3), 357-377.
Brammer, Stephen, & Millington, Andrew. (2008). Does it pay to be different? An analysis of the
relationship between corporate social and financial performance. Strategic Management
Journal, 29(12), 1325-1343.
Brammer, Stephen, & Pavelin, Stephen. (2005). Corporate reputation and an insurance
motivation for corporate social investment. Journal of Corporate Citizenship, 2005(20), 39-51.
Branco, Manuel Castelo, & Rodrigues, Lucia Lima. (2008). Factors influencing social responsibility
disclosure by Portuguese companies. Journal of Business Ethics, 83(4), 685-701.
Brown, Tom J, & Dacin, Peter A. (1997). The company and the product: Corporate associations
and consumer product responses. The Journal of Marketing, 68-84.
ICMA Centre
34 © Liu et al, June 2016
Burritt, Roger L, Schaltegger, Stefan, & Zvezdov, Dimitar. (2011). Carbon management
accounting: explaining practice in leading German companies. Australian Accounting Review,
21(1), 80-98.
Busch, Timo, & Hoffmann, Volker H. (2011). How hot is your bottom line? Linking carbon and
financial performance. Business & Society, 50(2), 233-265.
Carroll, Archie B. (1979). A three-dimensional conceptual model of corporate performance.
Academy of management review, 4(4), 497-505.
CDP (Producer). (2012, 01/06/2013). CDP 2012 Scoring Methodology. Retrieved from
https://www.cdproject.net/Documents/Guidance/CDP-2012-Scoring-Methodology.pdf
Chauvey, Jean-Noël, Giordano-Spring, Sophie, Cho, Charles H, & Patten, Dennis M. (2014). The
Normativity and Legitimacy of CSR Disclosure: Evidence from France. Journal of Business
Ethics, 1-15.
Chelli, Mohamed, Durocher, Sylvain, & Richard, Jacques. (2014). France’s new economic
regulations: Insights from institutional legitimacy theory. Accounting, Auditing &
Accountability Journal, 27(2), 4-4.
Cho, Charles H, & Patten, Dennis M. (2007). The role of environmental disclosures as tools of
legitimacy: A research note. Accounting, Organizations and Society, 32(7), 639-647.
Cho, Charles H, & Roberts, Robin W. (2010). Environmental reporting on the internet by
America's Toxic 100: Legitimacy and self-presentation. International Journal of Accounting
Information Systems, 11(1), 1-16.
Clarkson, Peter M, Li, Yue, Pinnuck, Matthew, & Richardson, Gordon D. (2014). The valuation
relevance of greenhouse gas emissions under the European Union carbon emissions trading
scheme. European Accounting Review(ahead-of-print), 1-30.
Clarkson, Peter M, Li, Yue, Pinnuck, Matthew, & Richardson, Gordon D. (2015). The valuation
relevance of greenhouse gas emissions under the European Union carbon emissions trading
scheme. European Accounting Review, 24(3), 551-580.
Clarkson, Peter M, Li, Yue, Richardson, Gordon D, & Vasvari, Florin P. (2008). Revisiting the
relation between environmental performance and environmental disclosure: An empirical
analysis. Accounting, Organizations and Society, 33(4), 303-327.
Clarkson, Peter M, Li, Yue, Richardson, Gordon D, & Vasvari, Florin P. (2011). Does it really pay to
be green? Determinants and consequences of proactive environmental strategies. Journal of
Accounting and Public Policy, 30(2), 122-144.
Cook, Allan. (2009). Emission rights: From costless activity to market operations. Accounting,
Organizations and Society, 34(3), 456-468.
Cormier, Denis, Magnan, Michel, & Van Velthoven, Barbara. (2005). Environmental disclosure
quality in large German companies: economic incentives, public pressures or institutional
conditions? European Accounting Review, 14(1), 3-39.

Henley Discussion Paper Series
© Liu et al, June 2016 35
de Villiers, Charl, & van Staden, Chris. (2011). Shareholder requirements for compulsory
environmental information in annual reports and on websites. Australian Accounting Review,
21(4), 317-326.
de Villiers, Charl, & van Staden, Chris J. (2011). Where firms choose to disclose voluntary
environmental information. Journal of Accounting and Public Policy, 30(6), 504-525.
Deegan, Craig. (2002). Introduction: The legitimising effect of social and environmental
disclosures–a theoretical foundation. Accounting, Auditing & Accountability Journal, 15(3),
282-311.
Deegan, Craig, Rankin, Michaela, & Tobin, John. (2002). An examination of the corporate social
and environmental disclosures of BHP from 1983-1997: A test of legitimacy theory.
Accounting, Auditing & Accountability Journal, 15(3), 312-343.
DEFRA. (2013). Environmental Reporting Guidelines: Including mandatory greenhouse gas
emissions reporting guidance. Development for Environment Food&Rural Affairs.
Dowell, Glen, Hart, Stuart, & Yeung, Bernard. (2000). Do corporate global environmental
standards create or destroy market value? Management science, 46(8), 1059-1074.
Dowling, John, & Pfeffer, Jeffrey. (1975). Organizational legitimacy: Social values and
organizational behavior. Pacific sociological review, 122-136.
Dragomir, Voicu D. (2012). The disclosure of industrial greenhouse gas emissions: a critical
assessment of corporate sustainability reports. Journal of Cleaner Production, 29, 222-237.
Dwyer, Rocky, Lamond, David, Prado-Lorenzo, José-Manuel, Rodríguez-Domínguez, Luis, Gallego-
Álvarez, Isabel, & García-Sánchez, Isabel-María. (2009). Factors influencing the disclosure of
greenhouse gas emissions in companies world-wide. Management Decision, 47(7), 1133-
1157.
Dye, Ronald A. (1985). Disclosure of nonproprietary information. Journal of accounting research,
123-145.
Eleftheriadis, Iordanis M, & Anagnostopoulou, Evgenia G. (2014). Relationship between
Corporate Climate Change Disclosures and Firm Factors. Business Strategy and the
Environment.
Elsayed, Khaled. (2006). Reexamining the expected effect of available resources and firm size on
firm environmental orientation: an empirical study of UK firms. Journal of Business Ethics,
65(3), 297-308.
Flammer, Caroline. (2015). Does corporate social responsibility lead to superior financial
performance? A regression discontinuity approach. Management Science.
Freedman, Martin, & Jaggi, Bikki. (1982). Pollution disclosures, pollution performance and
economic performance. Omega, 10(2), 167-176.

ICMA Centre
36 © Liu et al, June 2016
Freedman, Martin, & Jaggi, Bikki. (2005). Global warming, commitment to the Kyoto protocol,
and accounting disclosures by the largest global public firms from polluting industries. The
International Journal of Accounting, 40(3), 215-232.
Freeman, R.E. (2010). Strategic management: A stakeholder approach: Cambridge University Press.
Friedman, & Miles, Samantha. (2001). Socially responsible investment and corporate social and
environmental reporting in the UK: an exploratory study. The British Accounting Review, 33(4),
523-548.
Friedman, M. (1970). The Social Responsibility of Business is to Increase its Profits.
GRI. (2011). RG: Sustainability reporting guidelines -version 3.1: Global Reporting Initiative.
GRI. (2013). G4: Sustainability Reporting Guidelines-Reporting Principles and Standard
Disclosures Global Reporting Initiative.
Haque, Shamima, & Deegan, Craig. (2010). Corporate Climate Change‐Related Governance
Practices and Related Disclosures: Evidence from Australia. Australian Accounting Review,
20(4), 317-333.
Hart, Stuart L, & Ahuja, Gautam. (1996). Does it pay to be green? An empirical examination of
the relationship between emission reduction and firm performance. Business strategy and the
Environment, 5(1), 30-37.
Hassan, Aminu, & Kouhy, Reza. (2014). Time-series cross-sectional environmental performance
and disclosure relationship: specific evidence from a less-developed country. International
Journal of Accounting and Economics Studies, 2(2), 60-73.
Healy, Paul M, & Palepu, Krishna G. (2001). Information asymmetry, corporate disclosure, and
the capital markets: A review of the empirical disclosure literature. Journal of accounting and
economics, 31(1), 405-440.
Hoepner, Andreas G, Oikonomou, Ioannis, Scholtens, Bert, & Schröder, Michael. (2016). The
Effects of Corporate and Country Sustainability Characteristics on The Cost of Debt: An
International Investigation. Journal of Business Finance & Accounting, 43(1-2), 158-190.
Hopwood, Anthony G. (2009). Accounting and the environment. Accounting, Organizations and
Society, 34(3), 433-439.
Ieng Chu, Choi, Chatterjee, Bikram, & Brown, Alistair. (2012). The current status of greenhouse
gas reporting by Chinese companies: A test of legitimacy theory. Managerial Auditing Journal,
28(2), 114-139.
Ingram, Robert W. (1978). An investigation of the information content of (certain) social
responsibility disclosures. Journal of accounting research, 16(2), 270-285.
Ioannou, Ioannis, & Serafeim, George. (2012). What drives corporate social performance?
The role of nation-level institutions. Journal of International Business Studies, 43(9), 834-864.

Henley Discussion Paper Series
© Liu et al, June 2016 37
Jacobs, Brian W, Singhal, Vinod R, & Subramanian, Ravi. (2010). An empirical investigation of
environmental performance and the market value of the firm. Journal of Operations
Management, 28(5), 430-441.
Jaggi, Bikki, & Freedman, Martin. (1992). An examination of the impact of pollution performance
on economic and market performance: pulp and paper firms. Journal of Business Finance and
Accounting, 19(5), 697-713.
JM Ferreira, Jose Enrique Vila, Anastasia Mariussen, João, Kuo, Lopin, & Yi-Ju Chen, Vivian. (2013).
Is environmental disclosure an effective strategy on establishment of environmental
legitimacy for organization? Management Decision, 51(7), 1462-1487.
Jones, Thomas M. (1995). Instrumental stakeholder theory: A synthesis of ethics and economics.
Academy of management review, 20(2), 404-437.
Kang, Jun-Koo, & Shivdasani, Anil. (1995). Firm performance, corporate governance, and top
executive turnover in Japan. Journal of financial economics, 38(1), 29-58.
Kenny, David A, Korchmaros, Josephine D, & Bolger, Niall. (2003). Lower level mediation in
multilevel models. Psychological methods, 8(2), 115.
Kiernan, MJ. (1998). The eco-efficiency revolution. Plan Sponsor April, 68-70.
Kim, Eun-Hee, & Lyon, Thomas. (2011). When does institutional investor activism increase
shareholder value?: the carbon disclosure project. The BE Journal of Economic Analysis & Policy,
11(1).
Kim, Eun-Hee, & Lyon, Thomas P. (2011). Strategic environmental disclosure: Evidence from the
DOE's voluntary greenhouse gas registry. Journal of environmental economics and
management, 61(3), 311-326.
King, Andrew A, & Lenox, Michael J. (2001). Does it really pay to be green? An empirical study of
firm environmental and financial performance: An empirical study of firm environmental and
financial performance. Journal of Industrial Ecology, 5(1), 105-116.
Kolk, Ans, Levy, David, & Pinkse, Jonatan. (2008). Corporate responses in an emerging climate
regime: the institutionalization and commensuration of carbon disclosure. European
Accounting Review, 17(4), 719-745.
Konar, Shameek, & Cohen, Mark A. (2001). Does the market value environmental performance?
Review of economics and statistics, 83(2), 281-289.
Krull, Jennifer L, & MacKinnon, David P. (2001). Multilevel modeling of individual and group level
mediated effects. Multivariate behavioral research, 36(2), 249-277.
Lee, Su‐Yol, Park, Yun‐Seon, & Klassen, Robert D. (2015). Market responses to firms' voluntary
climate change information disclosure and carbon communication. Corporate Social
Responsibility and Environmental Management, 22(1), 1-12.
Li, Yue, Richardson, Gordon D, & Thornton, Daniel B. (1997). Theory and Evidence. Contemporary
Accounting Research, 4(3), 435-474.

ICMA Centre
38 © Liu et al, June 2016
Liao, Lin, Luo, Le, & Tang, Qingliang. (2014). Gender diversity, board independence,
environmental committee and greenhouse gas disclosure. The British Accounting Review.
Liesen, Andrea, Hoepner, Andreas G, Patten, Dennis M, & Figge, Frank. (2015). Does stakeholder
pressure influence corporate GHG emissions reporting? Empirical evidence from Europe.
Accounting, Auditing & Accountability Journal, 28(7), 1047-1074.
Lindblom, CK. (1994). The implications of organizational legitimacy for corporate social
performance and disclosure. Paper presented at the Critical Perspectives on Accounting
Conference, New York.
Lohmann, Larry. (2009). Toward a different debate in environmental accounting: The cases of
carbon and cost–benefit. Accounting, Organizations and Society, 34(3), 499-534.
Luo, Le, Lan, Yi‐Chen, & Tang, Qingliang. (2012). Corporate incentives to disclose carbon
information: Evidence from the CDP Global 500 Report. Journal of International Financial
Management & Accounting, 23(2), 93-120.
Mahadeo, Jyoti D, Oogarah-Hanuman, Vanisha, & Soobaroyen, Teerooven. (2011). A longitudinal
study of corporate social disclosures in a developing economy. Journal of Business Ethics,
104(4), 545-558.
Majoch, Arleta A. A., Hoepner, Andreas G. F., & Hebb, Tessa. (2016). Sources of Stakeholder
Salience in the Responsible Investment Movement: Why Do Investors Sign the Principles for
Responsible Investment? Journal of Business Ethics, 1-19. doi: 10.1007/s10551-016-3057-2
Matisoff, Daniel C. (2012). Privatizing Climate Change Policy: is there a public benefit?
Environmental and Resource Economics, 53(3), 409-433.
Matsumura, Ella Mae, Prakash, Rachna, & Vera-Muñoz, Sandra C. (2013). Firm-value effects of
carbon emissions and carbon disclosures. The Accounting Review, 89(2), 695-724.
Murray, Alan, Sinclair, Donald, Power, David, & Gray, Rob. (2006). Do financial markets care
about social and environmental disclosure? Further evidence and exploration from the UK.
Accounting, Auditing & Accountability Journal, 19(2), 228-255.
Oikonomou, Ioannis, Brooks, Chris, & Pavelin, Stephen. (2012). The impact of corporate social
performance on financial risk and utility: A longitudinal analysis. Financial Management, 41(2),
483-515.
Oikonomou, Ioannis, Brooks, Chris, & Pavelin, Stephen. (2014). The effects of corporate social
performance on the cost of corporate debt and credit ratings. Financial Review, 49(1), 49-75.
Orlitzky, Marc, Schmidt, Frank L, & Rynes, Sara L. (2003). Corporate social and financial
performance: A meta-analysis. Organization studies, 24(3), 403-441.
Patten, Dennis M. (1992). Intra-industry environmental disclosures in response to the Alaskan oil
spill: a note on legitimacy theory. Accounting, Organizations and Society, 17(5), 471-475.
Patten, Dennis M. (2002). The relation between environmental performance and environmental
disclosure: a research note. Accounting, Organizations and Society, 27(8), 763-773.

Henley Discussion Paper Series
© Liu et al, June 2016 39
Patten, Dennis M, & Nance, Jon R. (1999). Regulatory cost effects in a good news environment:
the intra-industry reaction to the Alaskan oil spill. Journal of Accounting and Public Policy,
17(4), 409-429.
Peng, Juan, Sun, Jianfei, & Luo, Rui. (2014). Corporate Voluntary Carbon Information Disclosure:
Evidence from China's Listed Companies. The World Economy.
Peters, G, & Romi, A. (2009). Carbon disclosure incentives in a global setting: an empirical
investigation. University of Arkansas, Fayetteville, AR, working paper.
Peters, Gary F, & Romi, Andrea M. (2014). Does the voluntary adoption of corporate governance
mechanisms improve environmental risk disclosures? Evidence from greenhouse gas
emission accounting. Journal of Business Ethics, 125(4), 637-666.
Pizer, William A, Morgenstern, Richard, & Shih, Jhih-Shyang. (2011). The performance of
industrial sector voluntary climate programs: Climate Wise and 1605 (b). Energy Policy,
39(12), 7907-7916.
Qiu, Yan, Shaukat, Amama, & Tharyan, Rajesh. (2016). Environmental and social disclosures: Link
with corporate financial performance. The British Accounting Review.
Ratnatunga, Janek TD, & Balachandran, Kashi R. (2009). Carbon business accounting: the impact
of global warming on the cost and management accounting profession. Journal of Accounting,
Auditing & Finance, 24(2), 333-355.
Roberts, Robin W. (1992). Determinants of corporate social responsibility disclosure: an
application of stakeholder theory. Accounting, Organizations and Society, 17(6), 595-612.
Saka, Chika, & Oshika, Tomoki. (2014). Disclosure effects, carbon emissions and corporate value.
Sustainability Accounting, Management and Policy Journal, 5(1), 22-45.
Salama, A. (2005). A note on the impact of environmental performance on financial
performance. Structural change and economic dynamics, 16(3), 413-421.
Sen, Sankar, & Bhattacharya, Chitra Bhanu. (2001). Does doing good always lead to doing
better? Consumer reactions to corporate social responsibility. Journal of marketing Research,
38(2), 225-243.
Shane, Philip B, & Spicer, Barry H. (1983). Market response to environmental information
produced outside the firm. Accounting Review, 521-538.
Stanny, Elizabeth. (2013). Voluntary disclosures of emissions by US firms. Business Strategy and
the Environment, 22(3), 145-158.
Tauringana, Venancio, & Chithambo, Lyton. (2014). The effect of DEFRA guidance on greenhouse
gas disclosure. The British Accounting Review.
Ullmann, Arieh A. (1985). Data in search of a theory: a critical examination of the relationships
among social performance, social disclosure, and economic performance of US firms.
Academy of management review, 540-557.
ICMA Centre
40 © Liu et al, June 2016
Waddock, Sandra A, & Graves, Samuel B. (1997). The corporate social performance-financial
performance link. Strategic management journal, 18(4), 303-319.
WBCSD, & WRI. (2004). The Greenhouse Gas Protocol: A Corporate Accounting and Reporting
Standard (Revised Edition). World Business Council for Sustainable Development (WBCSD) and
World Resource Institute (WRI).
Wiseman, Joanne. (1982). An evaluation of environmental disclosures made in corporate annual
reports. Accounting, Organizations and Society, 7(1), 53-63.
Yu, Pei-Shan, Hoepner, Andreas G, & Adamsson, Hampus. (2016). Towards a Carbon Data Science.
Henely Business School. Retrieved from https://www.henley.ac.uk/files/pdf/research/papers-
publications/ICM-2016-01_Yu_et_al.pdf
Ziegler, Andreas, Busch, Timo, & Hoffmann, Volker H. (2011). Disclosed corporate responses to
climate change and stock performance: An international empirical analysis. Energy Economics,
33(6), 1283-1294.