Embed Size (px)
Citation preview
Corporate ESG Profile on Performance:
Evidence from Indonesian Insurance Industry
December 2018
Abstract
Sustainable growth is necessary, and even a key, to every business, including financial institutions
such as an insurance company. Many financial institutions conducting irresponsible practices, such as
exploiting market inefficiency, have been faced with severe consequences. Evidence from some
studies conclude that insurance firms need to adopt a socially responsible approach to conducting
business as it may lead to better financial performance. Designing and proposing sustainable
insurance programs to insurance companies that run their businesses in Indonesia have been one of
the insurers’ approaches to creating more stable and certain industry climate since ESG issues have
become prominent discussion among developed and developing countries. In our study, we attempt to
construct the ESG profile by integrating three components: (1) the firm’s level of understanding of
ESG principles, (2) the way or manner by which the firm is integrating the ESG, and (3) the firm’s
paradigm on ESG integration. This study explores and examines the current state of sustainable
insurance development in Indonesia, portrayed by insurance firms’ knowledge, readiness, and
potential in developing sustainable insurance. By performing two techniques of multivariate analysis:
SEM analysis and econometric analysis, the SME results conclude that the insurer’s knowledge and
current development in sustainable insurance products have a positive effect on the insurance firm’s
willingness to develop sustainable insurance products in the future, while our regression analysis
provides evidence that an insurance company’s level of understanding of sustainable finance
principles is positively and significantly related to firm performance. Accordingly, the main
recommendation of this study is broadening the horizon of ESG risk knowledge of the potential
clients of sustainable insurance products could help insurance companies market their sustainable
products more effectively and efficiently.
JEL Classifications: G22
Keywords: ESG Profile, Firm Performance, Insurance Industry
Corresponding author: Istiana Maftuchah ([email protected]).
The findings and interpretations expressed in this paper are entirely those of the authors and do not
represent the views of Indonesia Financial Services Authority (OJK). All remaining errors and
omissions rest with the authors.
WP/18/07
2
I. Background
Sustainable insurance can be implemented by insurance firms by: (1) embedding the
ESG (environmental-social-governance) principle in decision-making, (2) building a
framework that enables an insurer to identify and evaluate ESG factors, and (3) implementing
the framework in company operations. Thus, the sustainable insurance concept is an
amalgamation of the green insurance and micro-insurance insurance concepts. The landmark
of sustainable finance era was established through the passage of Indonesian Financial
Services Authority (Otoritas Jasa Keuangan, OJK) Regulation concerning the
Implementation of Sustainable Finance by Financial Institutions, which stipulates that
financial sectors/institutions have to implement Sustainable Finance to support sustainable
economic growth, social justice and environmental quality improvement. OJK has launched
POJK No.51/POJK.03/2017 concerning the Application of Sustainable Finance for Financial
Service Institutions, Issuers, and Public Companies on July 2017.
There has been some literature that investigated the causality between ESG profile
and financial performance. El Ghoul et al. (2011) and Gregory et al. (2014) argue that a
strong ESG profile has higher valuation. El Ghoul et al. (2011) show that ESG investments in
employee relation, environmental policy, and product strategy contribute to lowering the
firm’s cost of equity. Meanwhile, Gregory et al. (2014) also find evidence that high ESG
firms tend to have a higher expected growth and a lower cost of equity.
As a result, insurance firms need to adopt a socially responsible approach to
conducting business as it may lead to better financial performance. ESG investing is faced
with an agency problem in its implementation (UNEP FI and WBCSD, 2010). Many of the
investors have a narrow view on the ESG factors. In fact, they tend to be more concerned
about ESG factors that might affect the company reputation, thereby constraining a
company’s executives to manage the ESG factors. Hence, empirical studies on ESG investing
are needed to raise investor awareness. UNEP FI and WBCSD’s (2010) report also finds
evidence that most of the executives agreed to the notion that ESG factors affected their
companies’ performances in a long run.
As an insurance firm’s business environment becomes more demanding and complex,
all intertwined financial industry stakeholders must pay more attention and be responsive to
the circumstances. Designing and proposing sustainable insurance programs to insurance
companies that run their businesses in Indonesia have been one of the OJK’s approaches to
creating more stable and certain industry climate since environmental issues have become
prominent discussion among developed and developing countries. Currently, Indonesian
insurance firms have offered three types of sustainable insurance products: (1) agriculture, (2)
micro-insurance, and (3) weather index. Therefore, Indonesian insurers still have a big room
for maneuver in product offering. Geographically, Indonesia is relatively prone to catastrophe
incidents, such as earthquakes, flood, etc. Natural disaster is indeed a serious concern for
economic sustainability, and it could certainly drive businesses out of operations.
Hence, to implement sustainable finance we have to identify what kinds of products
insurers have offered at the moment. In this study, we investigate whether Indonesian
insurance firms have the capability of developing sustainable insurance products, and in what
state the product development has been reached. Our study seeks to find insurer’s awareness
on the principles of sustainable finance mentioned in. We harness the insurer’s awareness as
a component for constructing the ESG profile.
Accordingly, this study purports to (1) analyze Indonesian insurance firms’ level of
understanding of sustainable finance principles in insurance, (2) discuss the current
circumstances of sustainable insurance implementation by Indonesian insurance companies,
(3) evaluate the potentials of sustainable insurance development in Indonesia, and (4)
3
examine the relationship between sustainable insurance profile and financial performance.
We conduct survey and analyze whether insurance companies in Indonesia are interested in
developing sustainable insurance products. We are also interested in documenting what types
of products they willing to create. Participants’ responses depict insurance firms’ paradigm
on the ESG integration.
The remainder of this paper is structured as follows. Section 2 discusses theoretical
foundation of this study. Section 3 describes our research methodology. Section 4 presents
our empirical findings. Eventually, Section 5 concludes the paper.
II. Theoretical Foundation: Sustainable Insurance
Insurance is playing an important role, both in its function in enabling the
mutualization of risk and as an institutional investor. By reducing uncertainty and the impacts
of big losses, this industry could encourage new investments and innovation, incentivize risk
reduction, and enable economic recovery after a disaster. The UNEP FI (United Nations
Finance Initiative) describes sustainable insurance as a strategic approach wherein all
activities in the insurance industry chain, including interactions with stakeholders, are
conducted responsibly and is forward looking through identifying, assessing, managing, and
controlling risk and opportunities associated with environmental, social, and governance
issues (“ESG Issues”: environmental, social and governance).1 The aim of sustainable
insurance is to minimize risk, develop innovative solutions, increasing business performance,
and contributing to the longevity of the environment, society, and the economy.
What is meant by “sustainable” in sustainable insurance is that the insurance company
conducts its business activities whilst considering the environmental aspects, social
circumstances, and financial dimensions to ensure its longevity in the coming future. The
rising concern regarding environmental, social, and governance issues pose risks as well as
creating new opportunities in the insurance sector. The insurance sector has a great potential
to play a role in the economic realization and sustainable social growth.
Risk identification and measurement are salient challenges to insurance firms.
Meanwhile, climate change and disasters are the major risk sources in Indonesia. According
to the National Disaster Relief Agency (BNPB), Indonesia suffered 2,341 incidents of
disasters during 2017 (Riswandi, 2018). Accordingly, insurance products that insure climate
change have a high demand potential in Indonesia. This implies that insurer’s capacity to
identify and measure climate risk may significantly lead to stronger firm performance.
As alluded to above, product innovation is one way for an insurer to implement
sustainable insurance. Sustainable products are created by integrating economic, social, and
governance (ESG) factors in their product features. Hence, the more relevant the product
features with ESG issues, the better the insurer implementing sustainable insurance will be.
We utilize the United Nations Environment Program Finance Initiative’s (UNEP FI)
publication and the Environmental-based Business Activities (Kegiatan Usaha Berbasis
Lingkungan, KUBL) as references to identify the ESG issues.
Wang and Zhi’s (2016) study shows that there are six potential products that an
insurer can offer to implement sustainable finance: (1) environmental fund and biodiversity
fund, debt-for-environment swaps, forestry securitization, weather derivatives, nature-linked
securities, and green investment fund. Sloggett (2016) documents that ESG factors could
affect a firm’s valuation through various channels. He examined the ESG factors alongside
other valuation drivers. Although the ESG factors are generally qualitative in nature,
1 Prinsip Investasi Berkelanjutan UNEP FI.
4
investors have increasingly quantified and integrated the ESG factors into financial
forecasting and firm valuation models.
The regulation POJK No.51/POJK.03/2017 mandates that the Principles for
Sustainable Finance (PSF) be the guidelines for the implementation of sustainable finance
and include the establishment of compulsory environmental and social management systems
and associated reporting in the entire financial services sector including publicly listed issuers
and companies with a gradual application for each financial service institution including
insurance firms. In implementing the OJK regulation on Sustainable Finance, OJK
encourages financial services sector actors in creating, developing sustainable product
innovations, and supporting financing of production activities that can create economic
growth, social justice and environmental quality improvement. Based on this POJK regarding
the Implementation of Sustainable Financing for Financial Services Institutions, Issuers, and
Public Companies, the insurance products which are included in the environmentally friendly
and social welfare products include green insurance, insurance covering environmental
damage, building insurance, agricultural insurance and premium discounting for green
projects.
Issues which are a main concern of sustainable insurance include:
Green issues
Human activities are predicted to be one of the leading causes of global warming. The
rapid growth of the industrial sector and various human activities increases the
quantity of CO2 and other emissions in the atmosphere. According to the United
Nation’s 2015 Global Assessment Report on Disaster Risk Reduction report2, as
many as 25.4 million people experience loss due to natural disasters or other
circumstances related to climate change each year (after 2007). Losses due to
damage/loss of assets due to these events are predicted to reach 250-350 billion
dollars each year. The occurrence of natural disasters or other events related to
climate change may distort the market and even create the disappearance of people’s
livelihood. The poor are set to be the party with the greatest loss when natural
disasters strike, as the total of their assets are usually only enough to fulfil daily needs
with no savings to cover for emergencies such as disasters.
Insurance is one of the ways risk management may facilitate the adaptation process
linked to climate change. Insurance may aid in risk reduction that may occur due to
climate change. Moreover, it guarantees any damages done to the environment due to
climate change or even human activities. Drastic climate change due to global
warming and the continued rapid growth of the industrial sector pushes insurance
companies to develop insurance products which heeds to risks arising due to climate
change as well as encouraging green activities and green behaviors. This notion
underlies the “green insurance” concept. Progress in green insurance is meant to incite
innovations in emission reductions and resolving and mitigating global climate
change.
Green insurance usually includes insurance with a variety of premiums with base
characteristics/behaviors that are relevant to environmental conditions, as well as
products aimed to compel people to engage in green activities and sustainability.
Green insurance products are insurance products which ensures the planning,
production and implementation of environmentally friendly products and public
health. For example, insurance companies in developed countries offering green
insurance products use incentives for the insured to use renewable energy and
becoming more energy efficient. Furthermore, insurance companies also aid closing
2 http://www.cgap.org/blog/disaster-risk-insurance-promote-resilience, Accessed on 27 June 2018.
5
costs in the development of renewable energy infrastructure. In addition, green
insurance also offers to guarantee the consequences of environmental damage that
will be caused by an agency/business and/or guarantee the victims of environmental
damage.
Social issues
Prevalent social issues which become a concern of the insurance industry
amongst others include, financial inclusion, human rights violations, the increased
human-caused health risks, and the aging population. The level of awareness for
insurance of the Indonesian society is still considerably low when compared to other
nations. Insurance s still considered to be a tertiary need, wherein it is very closely
related to a person’s level of income and education. Therefore, insurance products
which are more affordable for the lower middle class, such as farmers and fishermen,
need to be developed. The Indonesia’s Financial Services Authority defines micro-
insurance products as insurance products which are designed to give protection from
financial risks that are being faced by those with low income.
Micro-insurance is a method to channel insurance to the poor through micro-
financial concepts and is a solution for social and economic vulnerability as well as
financial inclusion. In the Grand Design of the Indonesian Micro-insurance3, low
income citizens are defined as citizens with an income per month of less than
Rp2,500,000. Micro-insurance products will thus provide protection for people with
low income from the various risks that may threaten the survival of poor households.
Governance issue
The issue of governance which have become the concern of the insurance
sector to actualize sustainable insurance include the regulations which are
implemented within the insurance company, monitoring of processes, alignment of
interests with the stake holders, the values of the organization, code of ethics,
business principles, as well as the transparency of the company. Good corporate
governance for insurance companies is to have a set structure and processes which are
used and applied by each component of the insurance company to increase the
achievement of the business goals and optimizing the insurance company values for
all stakeholders4. The implementation of good corporate governance can achieve
sustainability for insurance companies.
III. Research Methods
This research employs a positivism approach as it includes the confirmatory
verification of different experiences rather than an intuitive approach (Gefen et al, 2000).
This research is essentially a quantitative exploratory study. Another part of this study is
descriptive in nature, analyzing Indonesian insurance firms’ level of understanding of ESG
principles, discussing the current circumstances of ESG implementation by Indonesian
insurance firms, and evaluating the potentials for sustainable insurance development in
Indonesia.
To observe an insurer’s perception toward ESG and sustainable insurance issues, a
quantitative method is utilized for measurement. Since mere quantitative statistics will not be
able to address the whole issues, this research harnesses an array of approaches. Data were
collected through a questionnaire distributed to top management responsible for green
product development and/or investment in the Indonesian insurance companies from mid July
3 Tim Pengembangan Asuransi Mikro Otoritas Jasa Keuangan, 2017, “Grand Design Pengembangan Asuransi Mikro Indonesia”, hal. 4. 4 POJK No. 73/POJK.05/2016 tentang Tata Kelola Perusahaan yang Baik bagi Perusahaan Perasuransian
6
to mid September 2018. Sample firms in this study are all Indonesian insurance companies
that sell general (property and casualty) insurance products. Our sample set consists of
general insurance firms, with a total sample of 44 companies.
Indonesian insurance firms’ level of understanding is measured through respondents’
feedback on part one of the questionnaire. We apply the descriptive statistics approach to
analyzing data and presenting results. It is conjectured that insurance firms that have
implemented the sustainable insurance principles are more inclined to show a greater
understanding of ESG principles. The current circumstances of ESG implementation by
Indonesian insurance firms are depicted by the survey participants’ responses in the second
part of the questionnaire. We also make use of descriptive statistics to elaborate on the data.
Insurance firms that have implemented sustainable principles are more likely to have a
greater of level of fitness.
Quantitative research method that consists of multivariate SEM model and regression
analysis attempts to acquire a precise measurement of something, whose main purpose is to
examine the causalities among the variables provided in a questionnaire (Cooper and
Schindler, 2014). In our study, the questionnaire set is comprised of five different parts, with
each part consisting of a series of items. Questions listed in the questionnaire are both open
and closed questions. Respondents in this research are all Indonesian insurance companies’
representatives. After the participants have responded to our set of questionnaire, we analyze
the data using econometrics and multivariate analysis techniques.
III.1. Research Framework and Rationale
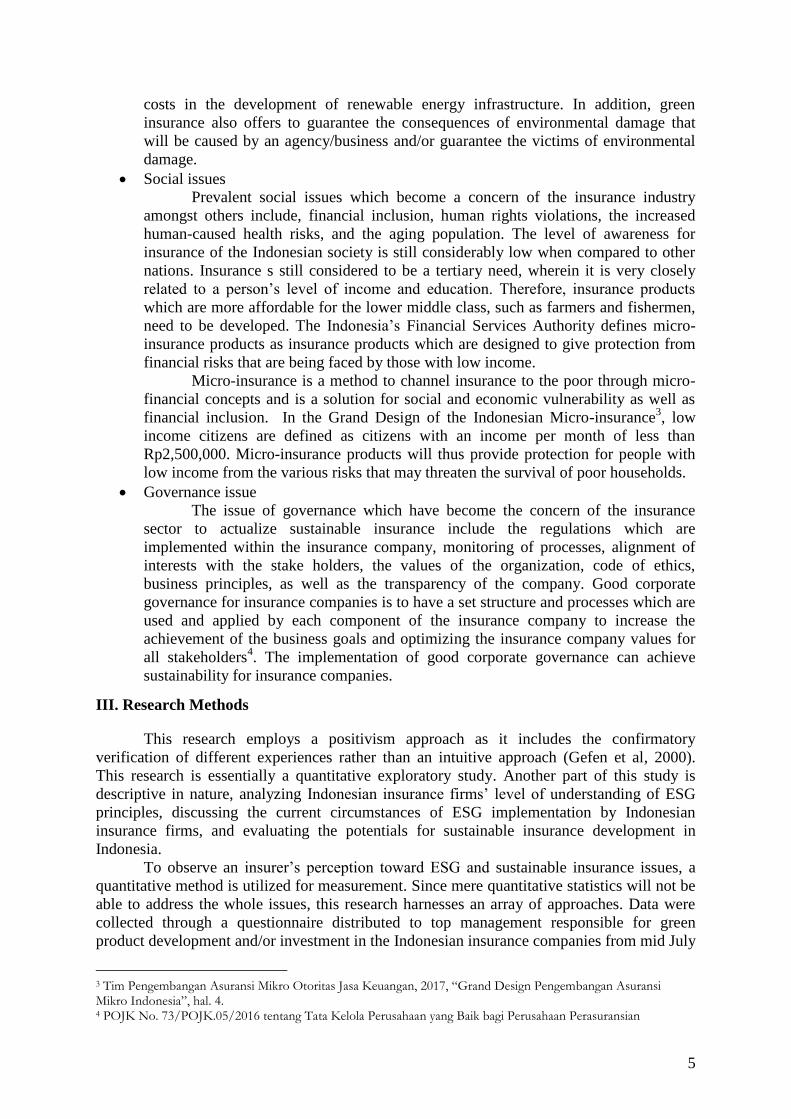
A rationale of our research framework is the association between knowledge and
organizational learning in Nonaka’s5 (1994) discussion on the interaction between tacit and
explicit knowledge and its subsequent spiraling through different organizational levels.
Knowledge creation is focused on the building of both tacit and explicit knowledge and, more
importantly, on the interconnectedness between these two aspects of knowledge through
internalization and externalization (see Figure 1).
Figure 1. Nonaka’s (1994) Spiral of Organizational Knowledge Creation
5 A Dynamic Theory of Organizational Knowledge Creation, Nonaka, Ikujuro (1994), Organization Science, Vol. 5, No. 1 (Feb., 1994), pp. 14-37
7
Ringer et al.6 (2016) in the 49
th CIRP Conference on Manufacturing Systems (CIRP-
CMS, 2016) reveal that the competitive pressure among product manufacturing companies is
steadily increasing. Customers continuously demand for enhanced quality and product
performance, added functionality, lower prices, and a higher speed of innovation. To survive
in today’s rapidly changing business environment, firms must develop more desirable
products ahead concerning sustainability and ESG issues. Change is a continuous process for
any organization, and the environment of change acceptance is necessary for a successful
implementation of total quality management (Haffar et al., 2013; Weeks et al., 1995). Haffar
et al.’s (2013) findings indicate that organizations should be focused on individual change
readiness (ICR) to adopt changes in already developed processes/products. For this study,
insurance firms in Indonesia differ one from another where they have a unique ICR nature
that becomes a mediating variable between the Level of Insurer’s Understanding of ESG
Issues and the Level of Sustainable Insurance Product Development.
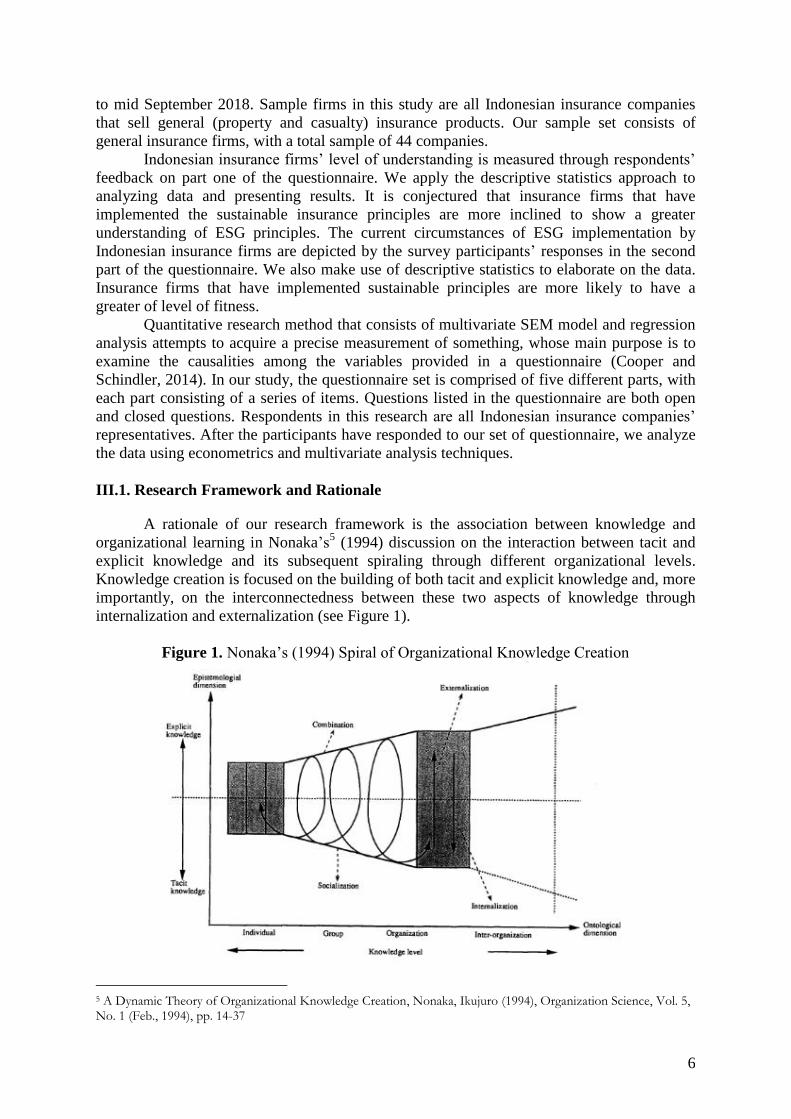
Another rationale of our research framework is derived from the Theory of Planned
Behavior (TPB). As in the original theory of reasoned action, a central factor in the TPB is an
individual’s intention to perform given behavior7 (Ajzen, 1991). Intention is assumed to
capture motivational factors that affect behavior. It is an indication of how hard people are
willing to strive and how much effort they are planning to exert in order to perform the
behavior (see Figure 2). As a general rule, the stronger the intention to engage in behavior,
the more likely the higher performance would be. It should be clear, however, that a
behavioral intention can find expression in behavior only if the behavior in question is under
a volitional control, i.e., if the person could decide at will to perform or not perform the
behavior. Although some behavior might in fact meet this requirement, the performance is
dependent upon non-motivational factors, such as the availability of requisite opportunities
and resources (e.g., time, money, skills, cooperations; see Ajzen, 1985 for discussion).
Overall, these factors represent people’s actual control over the behavior. To the level that a
person intends to perform the behavior and has the required opportunities and resources, he
or she would succeed in doing so.
Figure 2. Theory of Planned Behavior
6 Learning and knowledge systems in product development, Procedia CIRP 57 (2016), 49-54 7 The Theory of Planned Behavior, Ajzen, Icek (1991), ORGANIZATIONAL BEHAVIOR AND HUMAN DECISION PROCESSES 50, 179-211
8
The first objective of our research is to analyze Indonesian insurance firms’ level of
understanding of ESG principles from the perspectives of top executives of insurance firms
or institutions in Indonesia. Corresponding with the purposes of each part of the
questionnaire and the target respondents, we attempt to capture the motivational factors that
influence behavior and the willingness of respondents to comply with sustainable insurance
and ESG issues. We utilize TPB as the main theoretical standpoint since it is an appropriate
concept to capture the intention of respondents. Accordingly, in this study, we investigate
whether Indonesian insurance firms have the capability of developing sustainable insurance
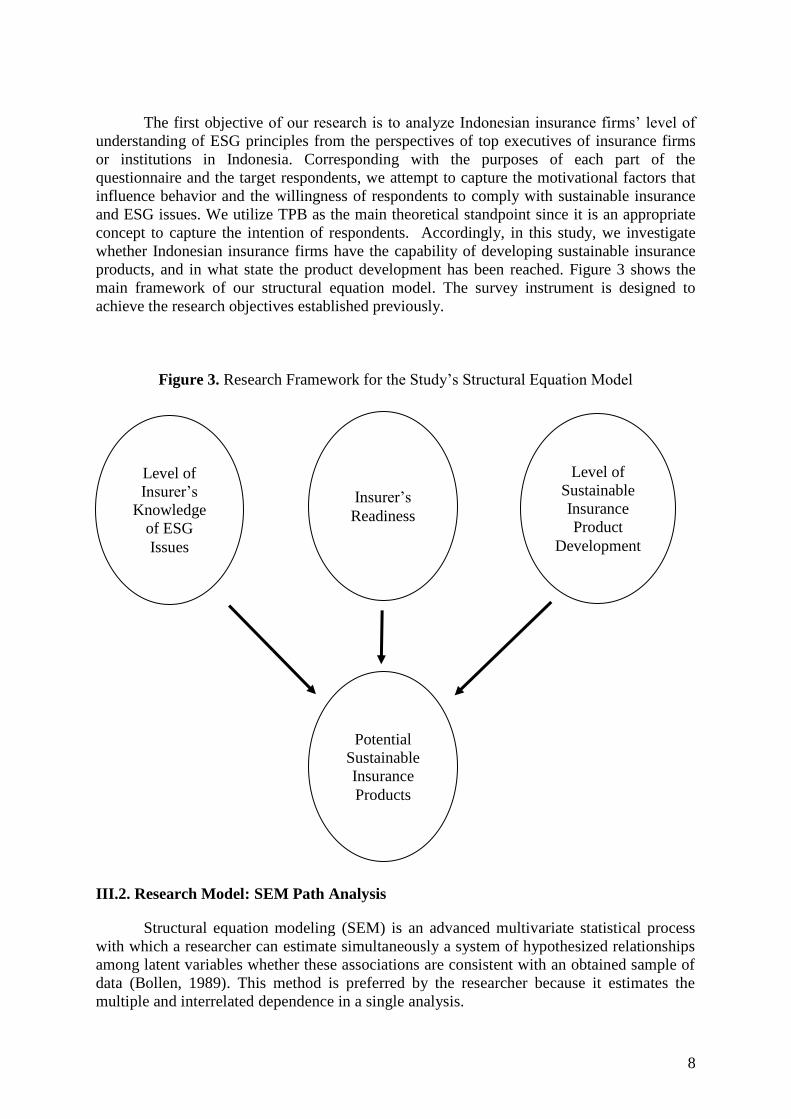
products, and in what state the product development has been reached. Figure 3 shows the
main framework of our structural equation model. The survey instrument is designed to
achieve the research objectives established previously.
Figure 3. Research Framework for the Study’s Structural Equation Model
III.2. Research Model: SEM Path Analysis
Structural equation modeling (SEM) is an advanced multivariate statistical process
with which a researcher can estimate simultaneously a system of hypothesized relationships
among latent variables whether these associations are consistent with an obtained sample of
data (Bollen, 1989). This method is preferred by the researcher because it estimates the
multiple and interrelated dependence in a single analysis.
Level of
Insurer’s
Knowledge
of ESG
Issues
Insurer’s
Readiness
Potential
Sustainable
Insurance
Products
Level of
Sustainable
Insurance
Product
Development
9
Latent variables are theoretical concepts that unite phenomena under a single term,
e.g., knowledge of ESG, readiness of ESG implementation, product development, and
potential product development. Latent variables are not measured directly but can be
expressed in terms of one or more directly measurable variables called indicators. Many
structural equation models are represented by path diagrams, with which researchers describe
their theories about the relationships among variables.
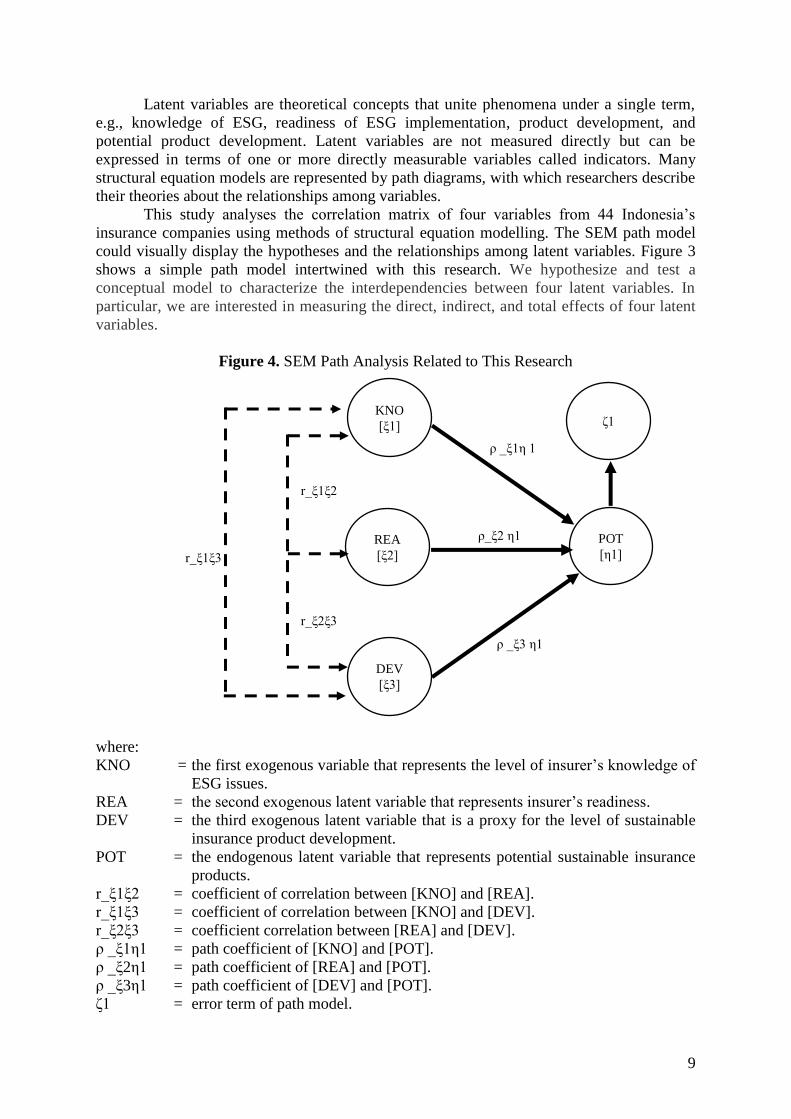
This study analyses the correlation matrix of four variables from 44 Indonesia’s
insurance companies using methods of structural equation modelling. The SEM path model
could visually display the hypotheses and the relationships among latent variables. Figure 3
shows a simple path model intertwined with this research. We hypothesize and test a
conceptual model to characterize the interdependencies between four latent variables. In
particular, we are interested in measuring the direct, indirect, and total effects of four latent
variables.
Figure 4. SEM Path Analysis Related to This Research
where:
KNO = the first exogenous variable that represents the level of insurer’s knowledge of
ESG issues.
REA = the second exogenous latent variable that represents insurer’s readiness.
DEV = the third exogenous latent variable that is a proxy for the level of sustainable
insurance product development.
POT = the endogenous latent variable that represents potential sustainable insurance
products.
r_ξ1ξ2 = coefficient of correlation between [KNO] and [REA].
r_ξ1ξ3 = coefficient of correlation between [KNO] and [DEV].
r_ξ2ξ3 = coefficient correlation between [REA] and [DEV].
ρ _ξ1η1 = path coefficient of [KNO] and [POT].
ρ _ξ2η1 = path coefficient of [REA] and [POT].
ρ _ξ3η1 = path coefficient of [DEV] and [POT].
ζ1 = error term of path model.
KNO
[ξ1]
REA
[ξ2]
DEV
[ξ3]
POT
[η1] r_ξ1ξ3
r_ξ1ξ2
r_ξ2ξ3
ρ _ξ1η 1
ρ_ξ2 η1
ρ _ξ3 η1
ζ1
10
The relationships discussed above can be formally stated as follows:
𝜂𝑖 = 𝛾1𝜉1𝑖 + 𝛾2𝜉2𝑖 + 𝛾3𝜉3𝑖 + 𝜀𝑖 where:
ηi = the endogenous latent variable that represents potential sustainable insurance
products.
ξ1i = the first exogenous variable that represents the level of insurer’s knowledge of
ESG issues.
ξ2i = the second exogenous latent variable that represents insurer’s readiness.
ξ3i = the third exogenous latent variable that represents the level of sustainable
insurance product development.
γ1, γ2, γ3 = regression coefficients on exogenous latent variables.
εi = error term.
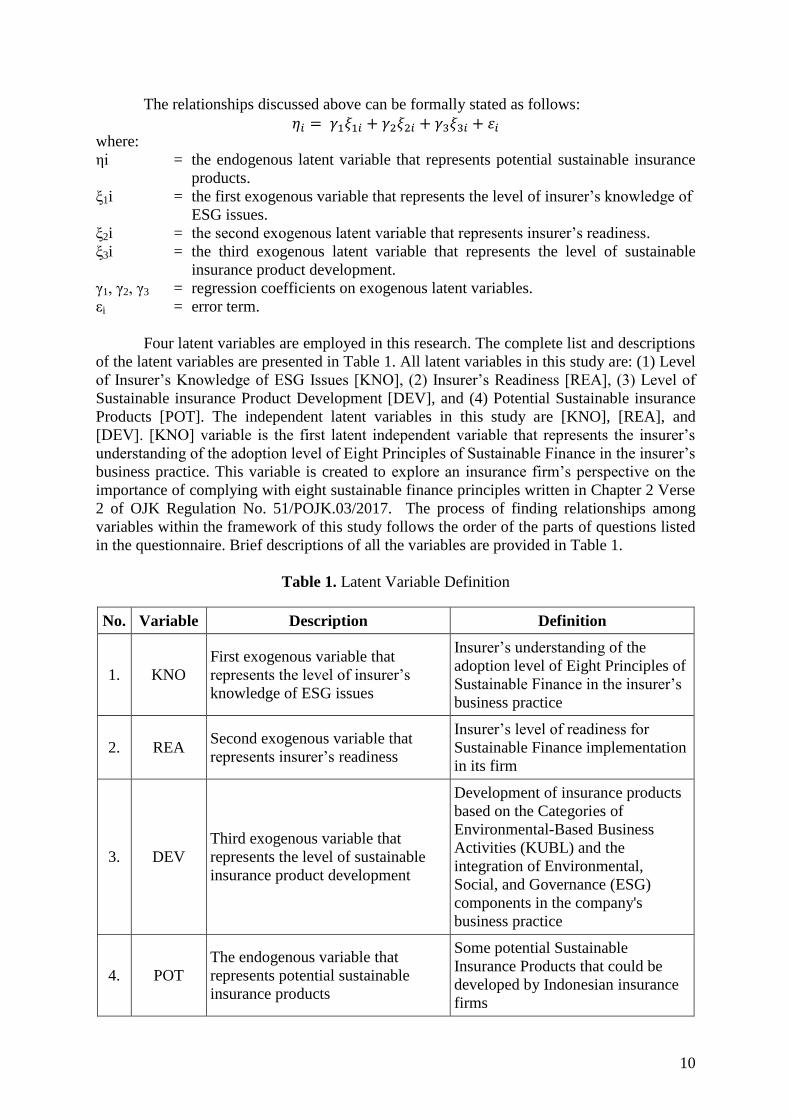
Four latent variables are employed in this research. The complete list and descriptions
of the latent variables are presented in Table 1. All latent variables in this study are: (1) Level
of Insurer’s Knowledge of ESG Issues [KNO], (2) Insurer’s Readiness [REA], (3) Level of
Sustainable insurance Product Development [DEV], and (4) Potential Sustainable insurance
Products [POT]. The independent latent variables in this study are [KNO], [REA], and
[DEV]. [KNO] variable is the first latent independent variable that represents the insurer’s
understanding of the adoption level of Eight Principles of Sustainable Finance in the insurer’s
business practice. This variable is created to explore an insurance firm’s perspective on the
importance of complying with eight sustainable finance principles written in Chapter 2 Verse
2 of OJK Regulation No. 51/POJK.03/2017. The process of finding relationships among
variables within the framework of this study follows the order of the parts of questions listed
in the questionnaire. Brief descriptions of all the variables are provided in Table 1.
Table 1. Latent Variable Definition
No. Variable Description Definition
1. KNO
First exogenous variable that
represents the level of insurer’s
knowledge of ESG issues
Insurer’s understanding of the
adoption level of Eight Principles of
Sustainable Finance in the insurer’s
business practice
2. REA Second exogenous variable that
represents insurer’s readiness
Insurer’s level of readiness for
Sustainable Finance implementation
in its firm
3. DEV
Third exogenous variable that
represents the level of sustainable
insurance product development
Development of insurance products
based on the Categories of
Environmental-Based Business
Activities (KUBL) and the
integration of Environmental,
Social, and Governance (ESG)
components in the company's
business practice
4. POT
The endogenous variable that
represents potential sustainable
insurance products
Some potential Sustainable
Insurance Products that could be
developed by Indonesian insurance
firms
11
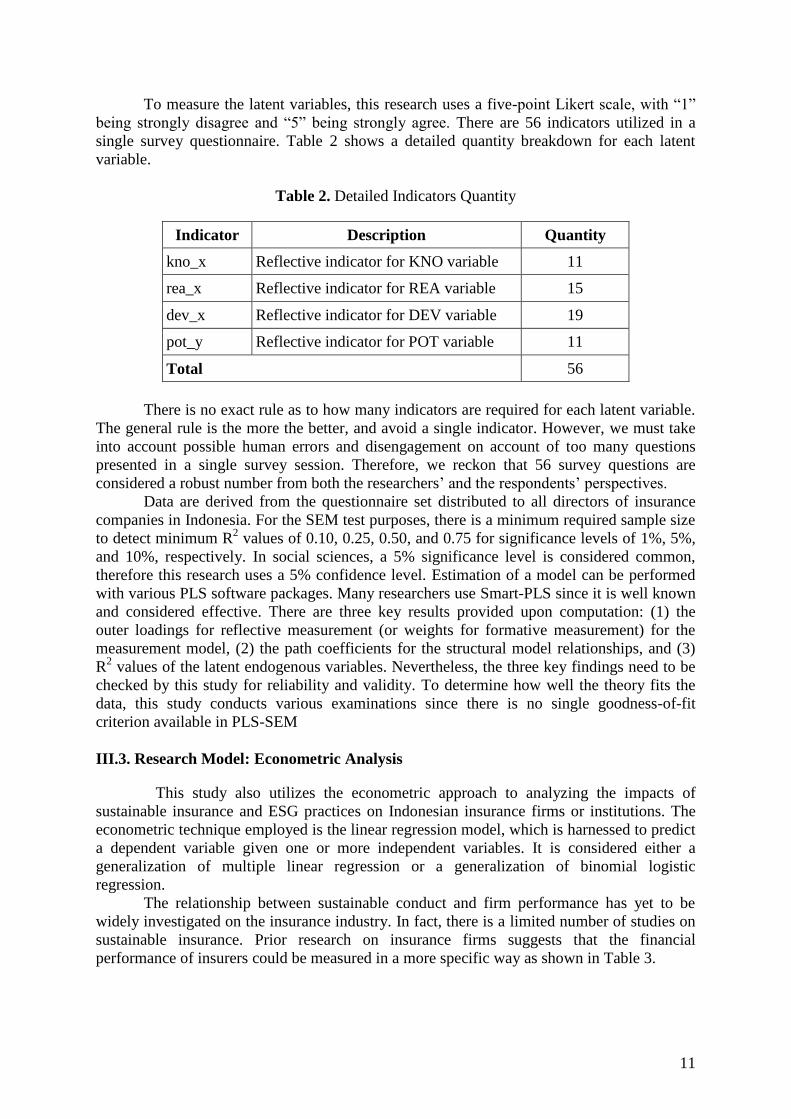
To measure the latent variables, this research uses a five-point Likert scale, with “1”
being strongly disagree and “5” being strongly agree. There are 56 indicators utilized in a
single survey questionnaire. Table 2 shows a detailed quantity breakdown for each latent
variable.
Table 2. Detailed Indicators Quantity
Indicator Description Quantity
kno_x Reflective indicator for KNO variable 11
rea_x Reflective indicator for REA variable 15
dev_x Reflective indicator for DEV variable 19
pot_y Reflective indicator for POT variable 11
Total 56
There is no exact rule as to how many indicators are required for each latent variable.
The general rule is the more the better, and avoid a single indicator. However, we must take
into account possible human errors and disengagement on account of too many questions
presented in a single survey session. Therefore, we reckon that 56 survey questions are
considered a robust number from both the researchers’ and the respondents’ perspectives.
Data are derived from the questionnaire set distributed to all directors of insurance
companies in Indonesia. For the SEM test purposes, there is a minimum required sample size
to detect minimum R2 values of 0.10, 0.25, 0.50, and 0.75 for significance levels of 1%, 5%,
and 10%, respectively. In social sciences, a 5% significance level is considered common,
therefore this research uses a 5% confidence level. Estimation of a model can be performed
with various PLS software packages. Many researchers use Smart-PLS since it is well known
and considered effective. There are three key results provided upon computation: (1) the
outer loadings for reflective measurement (or weights for formative measurement) for the
measurement model, (2) the path coefficients for the structural model relationships, and (3)
R2 values of the latent endogenous variables. Nevertheless, the three key findings need to be
checked by this study for reliability and validity. To determine how well the theory fits the
data, this study conducts various examinations since there is no single goodness-of-fit
criterion available in PLS-SEM
III.3. Research Model: Econometric Analysis
This study also utilizes the econometric approach to analyzing the impacts of
sustainable insurance and ESG practices on Indonesian insurance firms or institutions. The
econometric technique employed is the linear regression model, which is harnessed to predict
a dependent variable given one or more independent variables. It is considered either a
generalization of multiple linear regression or a generalization of binomial logistic
regression.
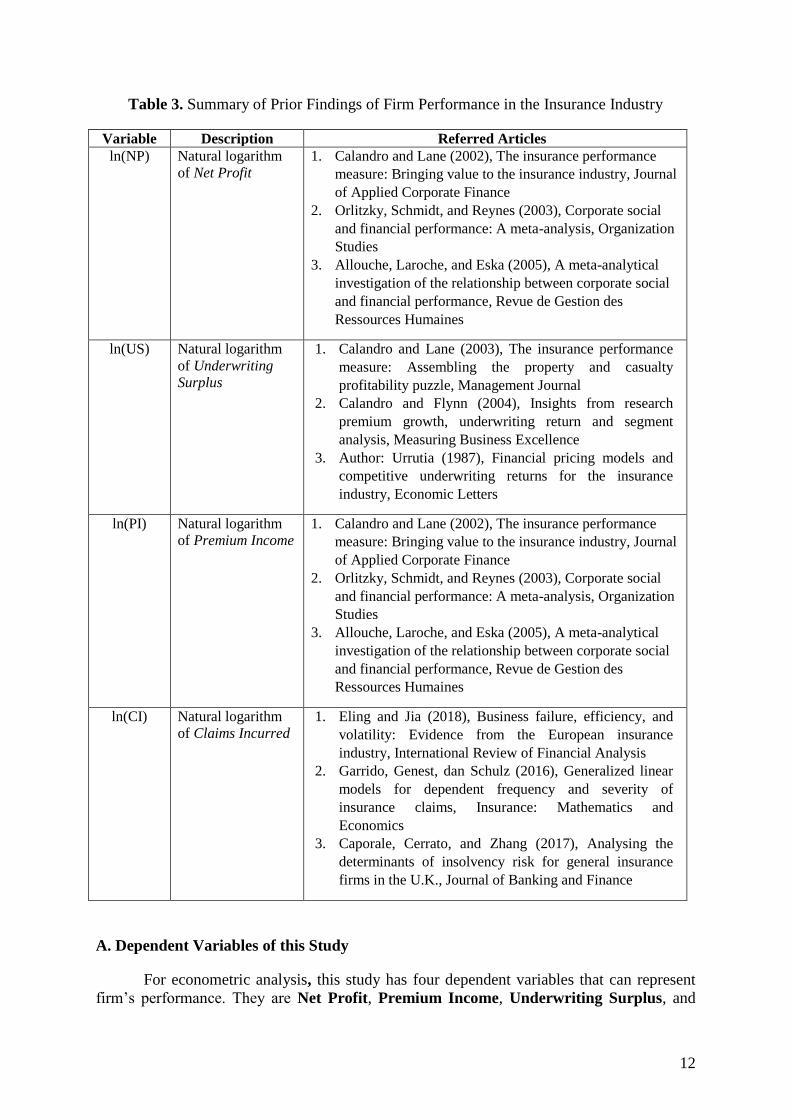
The relationship between sustainable conduct and firm performance has yet to be
widely investigated on the insurance industry. In fact, there is a limited number of studies on
sustainable insurance. Prior research on insurance firms suggests that the financial
performance of insurers could be measured in a more specific way as shown in Table 3.
12
Table 3. Summary of Prior Findings of Firm Performance in the Insurance Industry
Variable Description Referred Articles
ln(NP) Natural logarithm
of Net Profit
1. Calandro and Lane (2002), The insurance performance
measure: Bringing value to the insurance industry, Journal
of Applied Corporate Finance
2. Orlitzky, Schmidt, and Reynes (2003), Corporate social
and financial performance: A meta-analysis, Organization
Studies
3. Allouche, Laroche, and Eska (2005), A meta-analytical
investigation of the relationship between corporate social
and financial performance, Revue de Gestion des
Ressources Humaines
ln(US) Natural logarithm
of Underwriting
Surplus
1. Calandro and Lane (2003), The insurance performance
measure: Assembling the property and casualty
profitability puzzle, Management Journal
2. Calandro and Flynn (2004), Insights from research
premium growth, underwriting return and segment
analysis, Measuring Business Excellence
3. Author: Urrutia (1987), Financial pricing models and
competitive underwriting returns for the insurance
industry, Economic Letters
ln(PI) Natural logarithm
of Premium Income
1. Calandro and Lane (2002), The insurance performance
measure: Bringing value to the insurance industry, Journal
of Applied Corporate Finance
2. Orlitzky, Schmidt, and Reynes (2003), Corporate social
and financial performance: A meta-analysis, Organization
Studies
3. Allouche, Laroche, and Eska (2005), A meta-analytical
investigation of the relationship between corporate social
and financial performance, Revue de Gestion des
Ressources Humaines
ln(CI) Natural logarithm
of Claims Incurred
1. Eling and Jia (2018), Business failure, efficiency, and
volatility: Evidence from the European insurance
industry, International Review of Financial Analysis
2. Garrido, Genest, dan Schulz (2016), Generalized linear
models for dependent frequency and severity of
insurance claims, Insurance: Mathematics and
Economics
3. Caporale, Cerrato, and Zhang (2017), Analysing the
determinants of insolvency risk for general insurance
firms in the U.K., Journal of Banking and Finance
A. Dependent Variables of this Study
For econometric analysis, this study has four dependent variables that can represent
firm’s performance. They are Net Profit, Premium Income, Underwriting Surplus, and
13
Claims Incurred. The purpose of creating the four variables as the dependent variables is to
investigate whether the corporate ESG’s profile of insurers have any effect on firm’s
performance.
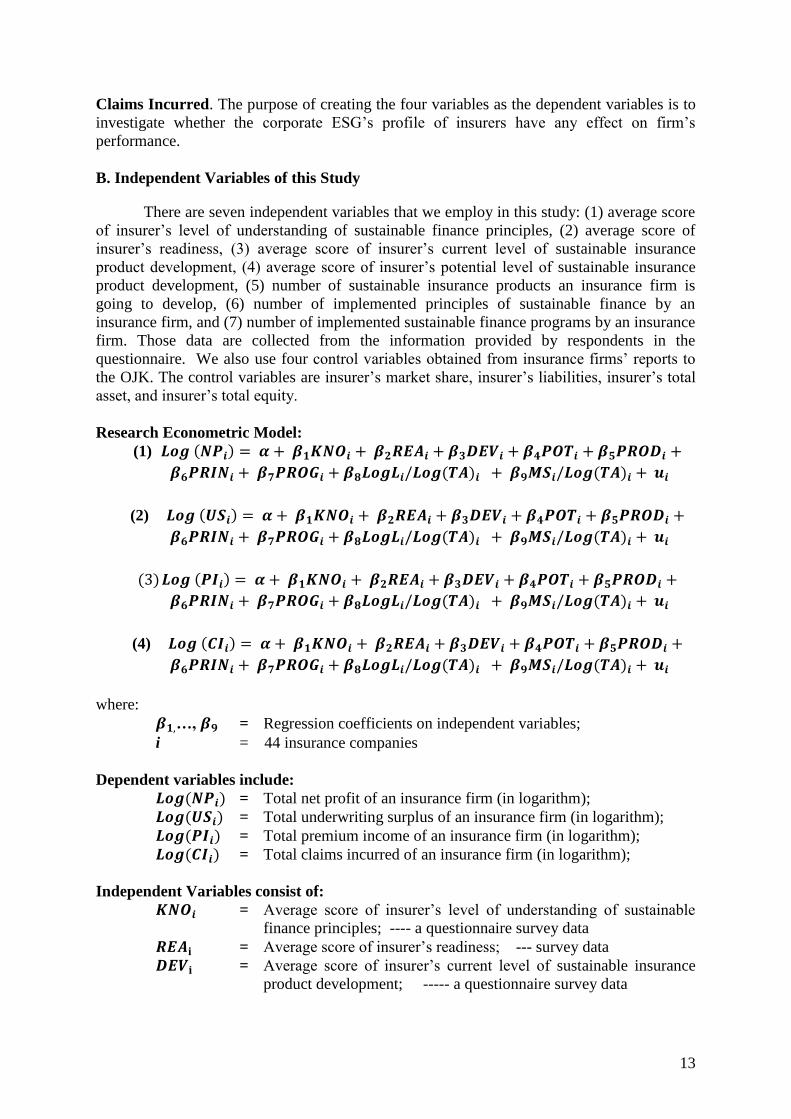
B. Independent Variables of this Study
There are seven independent variables that we employ in this study: (1) average score
of insurer’s level of understanding of sustainable finance principles, (2) average score of
insurer’s readiness, (3) average score of insurer’s current level of sustainable insurance
product development, (4) average score of insurer’s potential level of sustainable insurance
product development, (5) number of sustainable insurance products an insurance firm is
going to develop, (6) number of implemented principles of sustainable finance by an
insurance firm, and (7) number of implemented sustainable finance programs by an insurance
firm. Those data are collected from the information provided by respondents in the
questionnaire. We also use four control variables obtained from insurance firms’ reports to
the OJK. The control variables are insurer’s market share, insurer’s liabilities, insurer’s total
asset, and insurer’s total equity.
Research Econometric Model:
(1) 𝑳𝒐𝒈 (𝑵𝑷𝒊) = 𝜶 + 𝜷𝟏𝑲𝑵𝑶𝒊 + 𝜷𝟐𝑹𝑬𝑨𝒊 + 𝜷𝟑𝑫𝑬𝑽𝒊 + 𝜷𝟒𝑷𝑶𝑻𝒊 + 𝜷𝟓𝑷𝑹𝑶𝑫𝒊 +
𝜷𝟔𝑷𝑹𝑰𝑵𝒊 + 𝜷𝟕𝑷𝑹𝑶𝑮𝒊 + 𝜷𝟖𝑳𝒐𝒈𝑳𝒊/𝑳𝒐𝒈(𝑻𝑨)𝒊 + 𝜷𝟗𝑴𝑺𝒊/𝑳𝒐𝒈(𝑻𝑨)𝒊 + 𝒖𝒊
(2) 𝑳𝒐𝒈 (𝑼𝑺𝒊) = 𝜶 + 𝜷𝟏𝑲𝑵𝑶𝒊 + 𝜷𝟐𝑹𝑬𝑨𝒊 + 𝜷𝟑𝑫𝑬𝑽𝒊 + 𝜷𝟒𝑷𝑶𝑻𝒊 + 𝜷𝟓𝑷𝑹𝑶𝑫𝒊 +
𝜷𝟔𝑷𝑹𝑰𝑵𝒊 + 𝜷𝟕𝑷𝑹𝑶𝑮𝒊 + 𝜷𝟖𝑳𝒐𝒈𝑳𝒊/𝑳𝒐𝒈(𝑻𝑨)𝒊 + 𝜷𝟗𝑴𝑺𝒊/𝑳𝒐𝒈(𝑻𝑨)𝒊 + 𝒖𝒊
(3) 𝑳𝒐𝒈 (𝑷𝑰𝒊) = 𝜶 + 𝜷𝟏𝑲𝑵𝑶𝒊 + 𝜷𝟐𝑹𝑬𝑨𝒊 + 𝜷𝟑𝑫𝑬𝑽𝒊 + 𝜷𝟒𝑷𝑶𝑻𝒊 + 𝜷𝟓𝑷𝑹𝑶𝑫𝒊 +
𝜷𝟔𝑷𝑹𝑰𝑵𝒊 + 𝜷𝟕𝑷𝑹𝑶𝑮𝒊 + 𝜷𝟖𝑳𝒐𝒈𝑳𝒊/𝑳𝒐𝒈(𝑻𝑨)𝒊 + 𝜷𝟗𝑴𝑺𝒊/𝑳𝒐𝒈(𝑻𝑨)𝒊 + 𝒖𝒊
(4) 𝑳𝒐𝒈 (𝑪𝑰𝒊) = 𝜶 + 𝜷𝟏𝑲𝑵𝑶𝒊 + 𝜷𝟐𝑹𝑬𝑨𝒊 + 𝜷𝟑𝑫𝑬𝑽𝒊 + 𝜷𝟒𝑷𝑶𝑻𝒊 + 𝜷𝟓𝑷𝑹𝑶𝑫𝒊 +
𝜷𝟔𝑷𝑹𝑰𝑵𝒊 + 𝜷𝟕𝑷𝑹𝑶𝑮𝒊 + 𝜷𝟖𝑳𝒐𝒈𝑳𝒊/𝑳𝒐𝒈(𝑻𝑨)𝒊 + 𝜷𝟗𝑴𝑺𝒊/𝑳𝒐𝒈(𝑻𝑨)𝒊 + 𝒖𝒊
where:
𝜷𝟏,…, 𝜷𝟗 = Regression coefficients on independent variables;
i = 44 insurance companies
Dependent variables include:
𝑳𝒐𝒈(𝑵𝑷𝒊) = Total net profit of an insurance firm (in logarithm);
𝑳𝒐𝒈(𝑼𝑺𝒊) = Total underwriting surplus of an insurance firm (in logarithm);
𝑳𝒐𝒈(𝑷𝑰𝒊) = Total premium income of an insurance firm (in logarithm);
𝑳𝒐𝒈(𝑪𝑰𝒊) = Total claims incurred of an insurance firm (in logarithm);
Independent Variables consist of:
𝑲𝑵𝑶𝒊 = Average score of insurer’s level of understanding of sustainable
finance principles; ---- a questionnaire survey data
𝑹𝑬𝑨𝐢 = Average score of insurer’s readiness; --- survey data
𝑫𝑬𝑽𝐢 = Average score of insurer’s current level of sustainable insurance
product development; ----- a questionnaire survey data
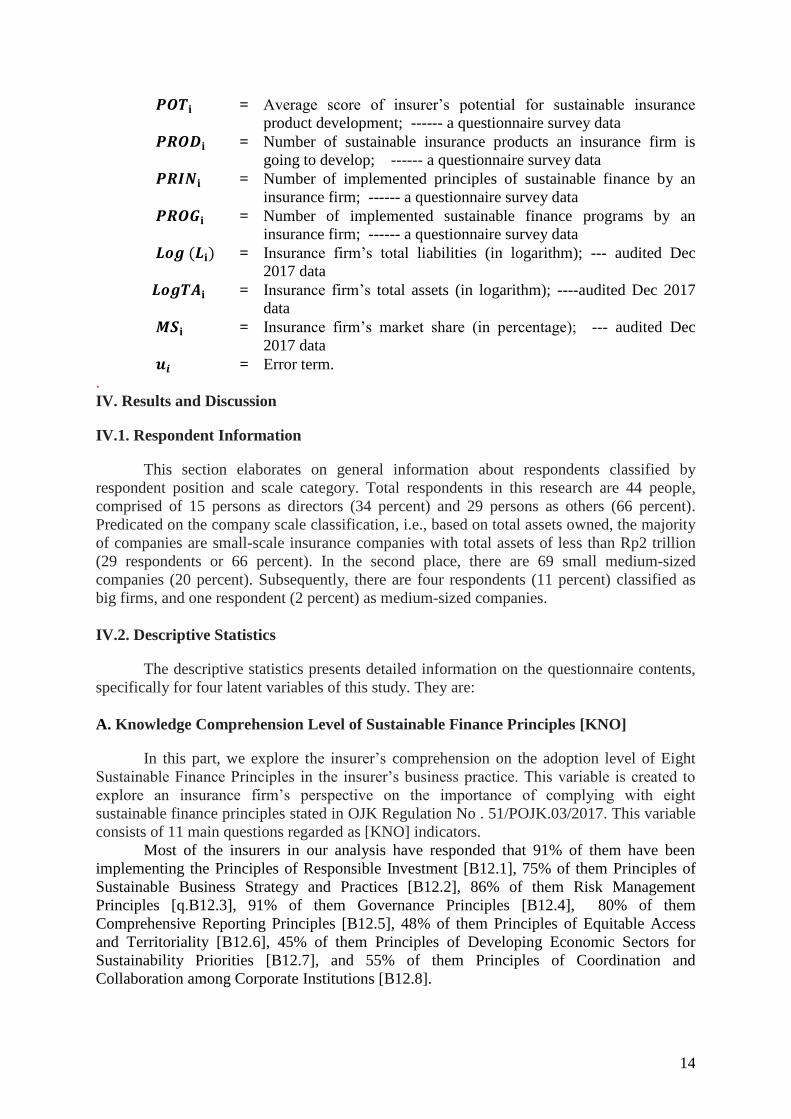
14
𝑷𝑶𝑻𝐢 = Average score of insurer’s potential for sustainable insurance
product development; ------ a questionnaire survey data
𝑷𝑹𝑶𝑫𝐢 = Number of sustainable insurance products an insurance firm is
going to develop; ------ a questionnaire survey data
𝑷𝑹𝑰𝑵𝐢 = Number of implemented principles of sustainable finance by an
insurance firm; ------ a questionnaire survey data
𝑷𝑹𝑶𝑮𝐢 = Number of implemented sustainable finance programs by an
insurance firm; ------ a questionnaire survey data
𝑳𝒐𝒈 (𝑳𝐢) = Insurance firm’s total liabilities (in logarithm); --- audited Dec
2017 data
𝑳𝒐𝒈𝑻𝑨𝐢 = Insurance firm’s total assets (in logarithm); ----audited Dec 2017
data
𝑴𝑺𝐢 = Insurance firm’s market share (in percentage); --- audited Dec
2017 data
𝒖𝒊 = Error term.
.
IV. Results and Discussion
IV.1. Respondent Information
This section elaborates on general information about respondents classified by
respondent position and scale category. Total respondents in this research are 44 people,
comprised of 15 persons as directors (34 percent) and 29 persons as others (66 percent).
Predicated on the company scale classification, i.e., based on total assets owned, the majority
of companies are small-scale insurance companies with total assets of less than Rp2 trillion
(29 respondents or 66 percent). In the second place, there are 69 small medium-sized
companies (20 percent). Subsequently, there are four respondents (11 percent) classified as
big firms, and one respondent (2 percent) as medium-sized companies.
IV.2. Descriptive Statistics
The descriptive statistics presents detailed information on the questionnaire contents,
specifically for four latent variables of this study. They are:
A. Knowledge Comprehension Level of Sustainable Finance Principles [KNO]
In this part, we explore the insurer’s comprehension on the adoption level of Eight
Sustainable Finance Principles in the insurer’s business practice. This variable is created to
explore an insurance firm’s perspective on the importance of complying with eight
sustainable finance principles stated in OJK Regulation No . 51/POJK.03/2017. This variable
consists of 11 main questions regarded as [KNO] indicators.
Most of the insurers in our analysis have responded that 91% of them have been
implementing the Principles of Responsible Investment [B12.1], 75% of them Principles of
Sustainable Business Strategy and Practices [B12.2], 86% of them Risk Management
Principles [q.B12.3], 91% of them Governance Principles [B12.4], 80% of them
Comprehensive Reporting Principles [B12.5], 48% of them Principles of Equitable Access
and Territoriality [B12.6], 45% of them Principles of Developing Economic Sectors for
Sustainability Priorities [B12.7], and 55% of them Principles of Coordination and
Collaboration among Corporate Institutions [B12.8].
15
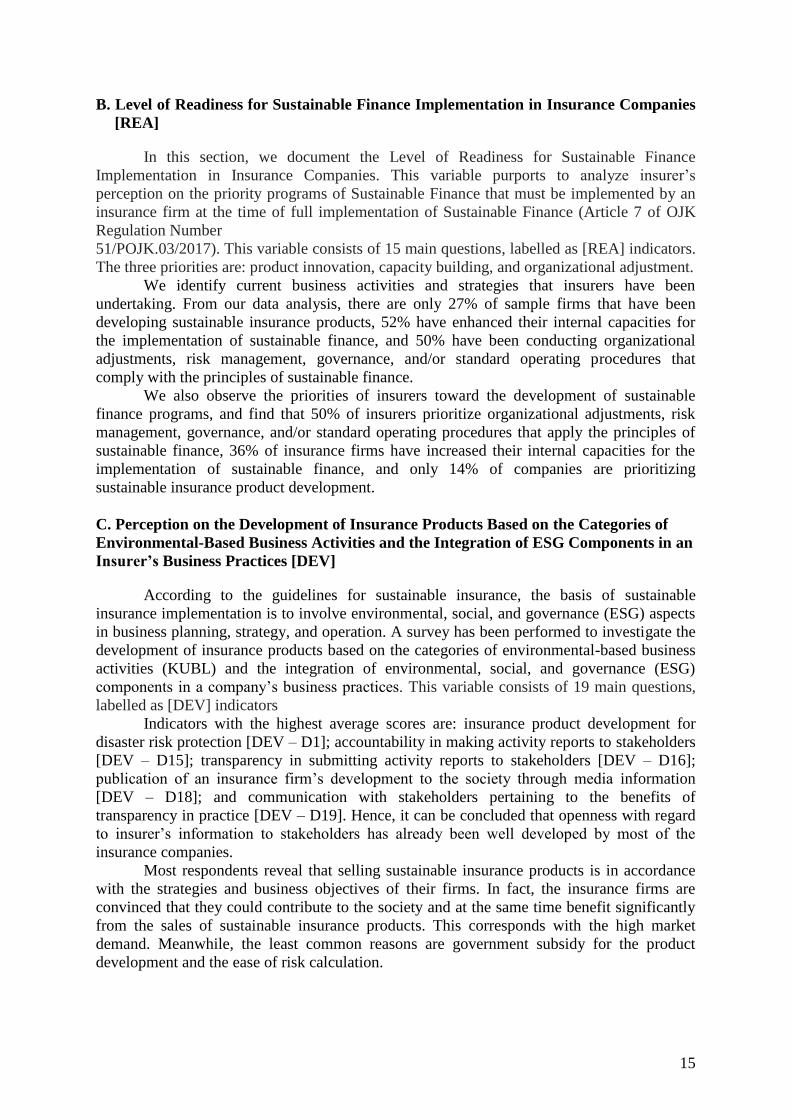
B. Level of Readiness for Sustainable Finance Implementation in Insurance Companies
[REA]
In this section, we document the Level of Readiness for Sustainable Finance
Implementation in Insurance Companies. This variable purports to analyze insurer’s
perception on the priority programs of Sustainable Finance that must be implemented by an
insurance firm at the time of full implementation of Sustainable Finance (Article 7 of OJK
Regulation Number
51/POJK.03/2017). This variable consists of 15 main questions, labelled as [REA] indicators.
The three priorities are: product innovation, capacity building, and organizational adjustment.
We identify current business activities and strategies that insurers have been
undertaking. From our data analysis, there are only 27% of sample firms that have been
developing sustainable insurance products, 52% have enhanced their internal capacities for
the implementation of sustainable finance, and 50% have been conducting organizational
adjustments, risk management, governance, and/or standard operating procedures that
comply with the principles of sustainable finance.
We also observe the priorities of insurers toward the development of sustainable
finance programs, and find that 50% of insurers prioritize organizational adjustments, risk
management, governance, and/or standard operating procedures that apply the principles of
sustainable finance, 36% of insurance firms have increased their internal capacities for the
implementation of sustainable finance, and only 14% of companies are prioritizing
sustainable insurance product development.
C. Perception on the Development of Insurance Products Based on the Categories of
Environmental-Based Business Activities and the Integration of ESG Components in an
Insurer’s Business Practices [DEV]
According to the guidelines for sustainable insurance, the basis of sustainable
insurance implementation is to involve environmental, social, and governance (ESG) aspects
in business planning, strategy, and operation. A survey has been performed to investigate the
development of insurance products based on the categories of environmental-based business
activities (KUBL) and the integration of environmental, social, and governance (ESG)
components in a company’s business practices. This variable consists of 19 main questions,
labelled as [DEV] indicators
Indicators with the highest average scores are: insurance product development for
disaster risk protection [DEV – D1]; accountability in making activity reports to stakeholders
[DEV – D15]; transparency in submitting activity reports to stakeholders [DEV – D16];
publication of an insurance firm’s development to the society through media information
[DEV – D18]; and communication with stakeholders pertaining to the benefits of
transparency in practice [DEV – D19]. Hence, it can be concluded that openness with regard
to insurer’s information to stakeholders has already been well developed by most of the
insurance companies.
Most respondents reveal that selling sustainable insurance products is in accordance
with the strategies and business objectives of their firms. In fact, the insurance firms are
convinced that they could contribute to the society and at the same time benefit significantly
from the sales of sustainable insurance products. This corresponds with the high market
demand. Meanwhile, the least common reasons are government subsidy for the product
development and the ease of risk calculation.
16
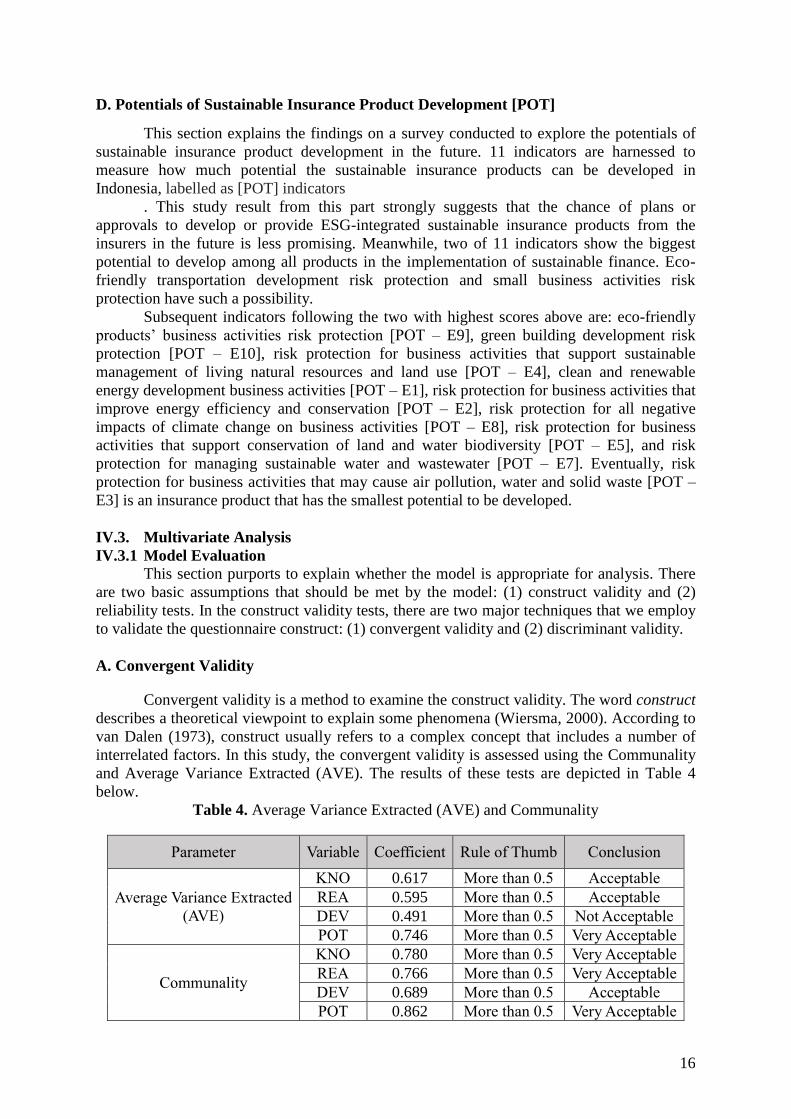
D. Potentials of Sustainable Insurance Product Development [POT]
This section explains the findings on a survey conducted to explore the potentials of
sustainable insurance product development in the future. 11 indicators are harnessed to
measure how much potential the sustainable insurance products can be developed in
Indonesia, labelled as [POT] indicators
. This study result from this part strongly suggests that the chance of plans or
approvals to develop or provide ESG-integrated sustainable insurance products from the
insurers in the future is less promising. Meanwhile, two of 11 indicators show the biggest
potential to develop among all products in the implementation of sustainable finance. Eco-
friendly transportation development risk protection and small business activities risk
protection have such a possibility.
Subsequent indicators following the two with highest scores above are: eco-friendly
products’ business activities risk protection [POT – E9], green building development risk
protection [POT – E10], risk protection for business activities that support sustainable
management of living natural resources and land use [POT – E4], clean and renewable
energy development business activities [POT – E1], risk protection for business activities that
improve energy efficiency and conservation [POT – E2], risk protection for all negative
impacts of climate change on business activities [POT – E8], risk protection for business
activities that support conservation of land and water biodiversity [POT – E5], and risk
protection for managing sustainable water and wastewater [POT – E7]. Eventually, risk
protection for business activities that may cause air pollution, water and solid waste [POT –
E3] is an insurance product that has the smallest potential to be developed.
IV.3. Multivariate Analysis
IV.3.1 Model Evaluation
This section purports to explain whether the model is appropriate for analysis. There
are two basic assumptions that should be met by the model: (1) construct validity and (2)
reliability tests. In the construct validity tests, there are two major techniques that we employ
to validate the questionnaire construct: (1) convergent validity and (2) discriminant validity.
A. Convergent Validity
Convergent validity is a method to examine the construct validity. The word construct
describes a theoretical viewpoint to explain some phenomena (Wiersma, 2000). According to
van Dalen (1973), construct usually refers to a complex concept that includes a number of
interrelated factors. In this study, the convergent validity is assessed using the Communality
and Average Variance Extracted (AVE). The results of these tests are depicted in Table 4
below.
Table 4. Average Variance Extracted (AVE) and Communality
Parameter Variable Coefficient Rule of Thumb Conclusion
Average Variance Extracted
(AVE)
KNO 0.617 More than 0.5 Acceptable
REA 0.595 More than 0.5 Acceptable
DEV 0.491 More than 0.5 Not Acceptable
POT 0.746 More than 0.5 Very Acceptable
Communality
KNO 0.780 More than 0.5 Very Acceptable
REA 0.766 More than 0.5 Very Acceptable
DEV 0.689 More than 0.5 Acceptable
POT 0.862 More than 0.5 Very Acceptable
17
From Table 4 above, it could be observed that the questionnaire construct is mostly
convergent, with the exception of [DEV] variable as it has an AVE coefficient below 0.5.
Nevertheless, if an AVE is less than 0.5 but the composite reliability is higher than 0.6, then
the convergent validity of a construct is still adequate (Fornell and Larcker, 1981).
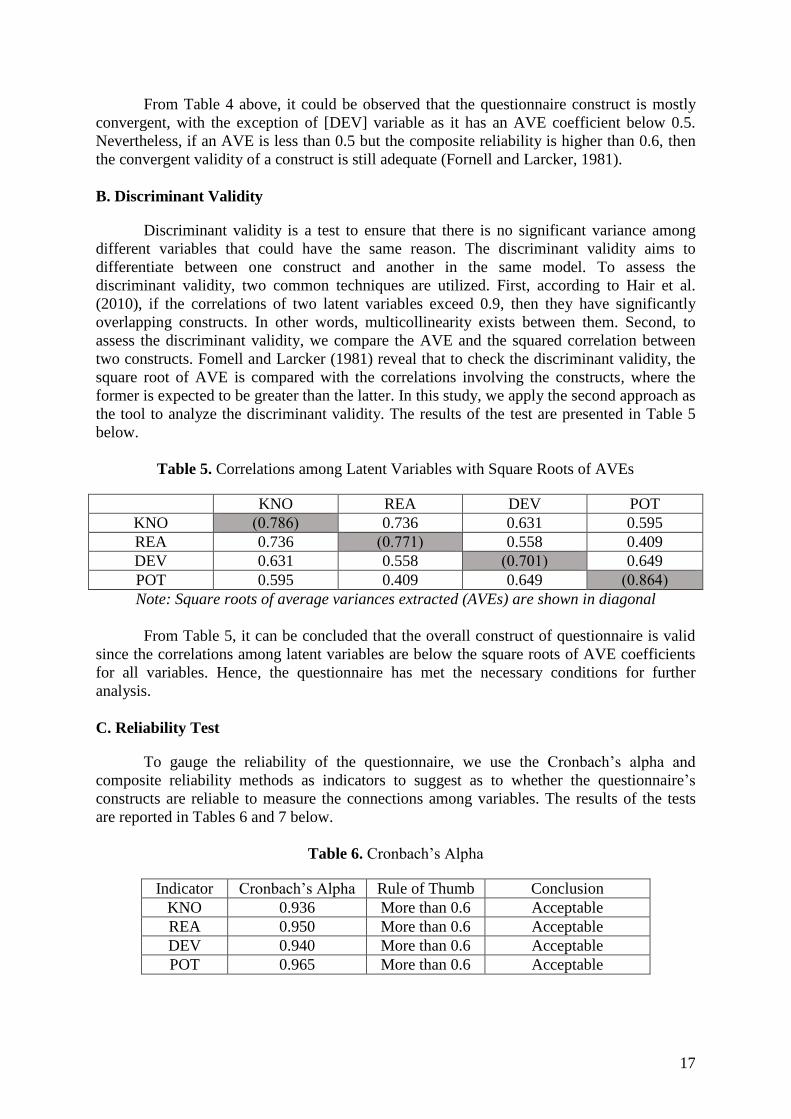
B. Discriminant Validity
Discriminant validity is a test to ensure that there is no significant variance among
different variables that could have the same reason. The discriminant validity aims to
differentiate between one construct and another in the same model. To assess the
discriminant validity, two common techniques are utilized. First, according to Hair et al.
(2010), if the correlations of two latent variables exceed 0.9, then they have significantly
overlapping constructs. In other words, multicollinearity exists between them. Second, to
assess the discriminant validity, we compare the AVE and the squared correlation between
two constructs. Fomell and Larcker (1981) reveal that to check the discriminant validity, the
square root of AVE is compared with the correlations involving the constructs, where the
former is expected to be greater than the latter. In this study, we apply the second approach as
the tool to analyze the discriminant validity. The results of the test are presented in Table 5
below.
Table 5. Correlations among Latent Variables with Square Roots of AVEs
KNO REA DEV POT
KNO (0.786) 0.736 0.631 0.595
REA 0.736 (0.771) 0.558 0.409
DEV 0.631 0.558 (0.701) 0.649
POT 0.595 0.409 0.649 (0.864)
Note: Square roots of average variances extracted (AVEs) are shown in diagonal
From Table 5, it can be concluded that the overall construct of questionnaire is valid
since the correlations among latent variables are below the square roots of AVE coefficients
for all variables. Hence, the questionnaire has met the necessary conditions for further
analysis.
C. Reliability Test
To gauge the reliability of the questionnaire, we use the Cronbach’s alpha and
composite reliability methods as indicators to suggest as to whether the questionnaire’s
constructs are reliable to measure the connections among variables. The results of the tests
are reported in Tables 6 and 7 below.
Table 6. Cronbach’s Alpha
Indicator Cronbach’s Alpha Rule of Thumb Conclusion
KNO 0.936 More than 0.6 Acceptable
REA 0.950 More than 0.6 Acceptable
DEV 0.940 More than 0.6 Acceptable
POT 0.965 More than 0.6 Acceptable
18
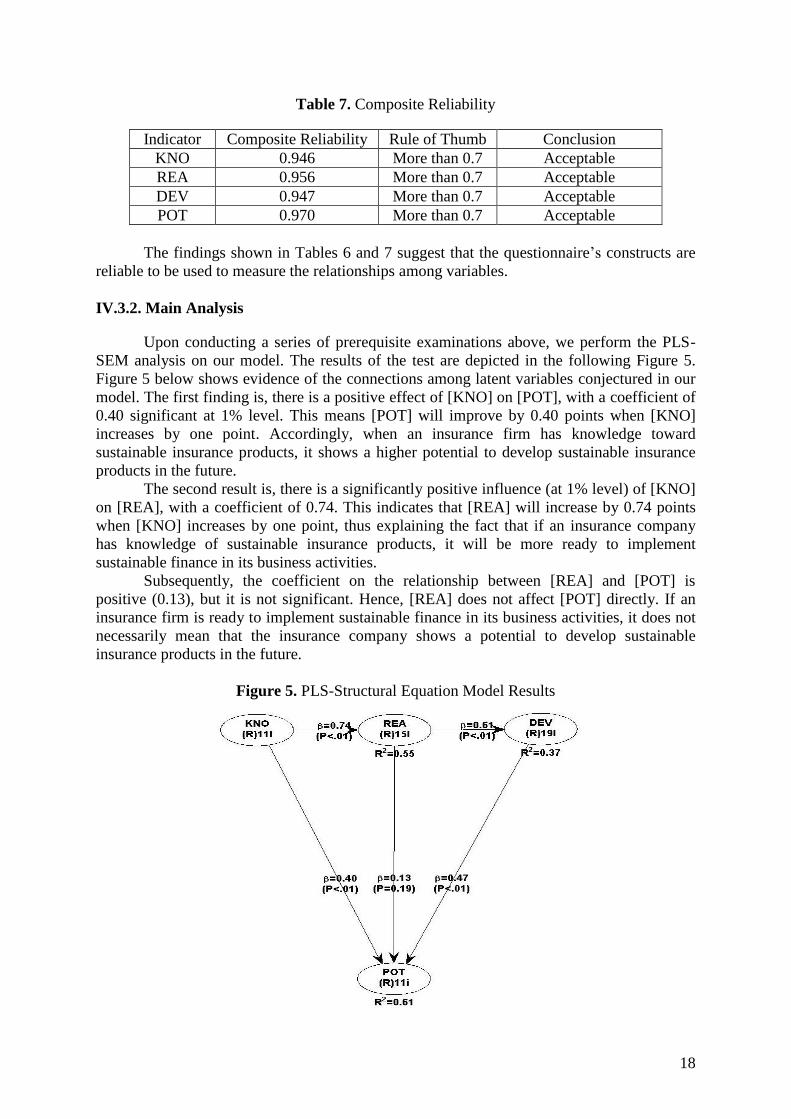
Table 7. Composite Reliability
Indicator Composite Reliability Rule of Thumb Conclusion
KNO 0.946 More than 0.7 Acceptable
REA 0.956 More than 0.7 Acceptable
DEV 0.947 More than 0.7 Acceptable
POT 0.970 More than 0.7 Acceptable
The findings shown in Tables 6 and 7 suggest that the questionnaire’s constructs are
reliable to be used to measure the relationships among variables.
IV.3.2. Main Analysis
Upon conducting a series of prerequisite examinations above, we perform the PLS-
SEM analysis on our model. The results of the test are depicted in the following Figure 5.
Figure 5 below shows evidence of the connections among latent variables conjectured in our
model. The first finding is, there is a positive effect of [KNO] on [POT], with a coefficient of
0.40 significant at 1% level. This means [POT] will improve by 0.40 points when [KNO]
increases by one point. Accordingly, when an insurance firm has knowledge toward
sustainable insurance products, it shows a higher potential to develop sustainable insurance
products in the future.
The second result is, there is a significantly positive influence (at 1% level) of [KNO]
on [REA], with a coefficient of 0.74. This indicates that [REA] will increase by 0.74 points
when [KNO] increases by one point, thus explaining the fact that if an insurance company
has knowledge of sustainable insurance products, it will be more ready to implement
sustainable finance in its business activities.
Subsequently, the coefficient on the relationship between [REA] and [POT] is
positive (0.13), but it is not significant. Hence, [REA] does not affect [POT] directly. If an
insurance firm is ready to implement sustainable finance in its business activities, it does not
necessarily mean that the insurance company shows a potential to develop sustainable
insurance products in the future.
Figure 5. PLS-Structural Equation Model Results
19
The fourth finding is, [REA] affects [DEV] positively, with a coefficient of 0.61
significant at 1% level. This finding suggests that [DEV] will increase by 0.61 points if
[REA] increases by one point. Therefore, when an insurance company is ready to implement
sustainable finance in its business activities, it will be more likely to develop sustainable
insurance products that correspond with the environmental-based activities and ESG issues in
its business practice.
Eventually, the fifth result documents that there is a positive and significant effect (at
1% level) of [DEV] on [POT], with a coefficient of 0.47. This means that [POT] will be
higher by 0.47 points when [DEV] increases by one point, substantiating the conjecture that
if an insurance firm has developed insurance products that are aware of the environmental-
based activities and ESG issues in its business practice, the insurance company will show a
higher potential to develop sustainable insurance products in the future.
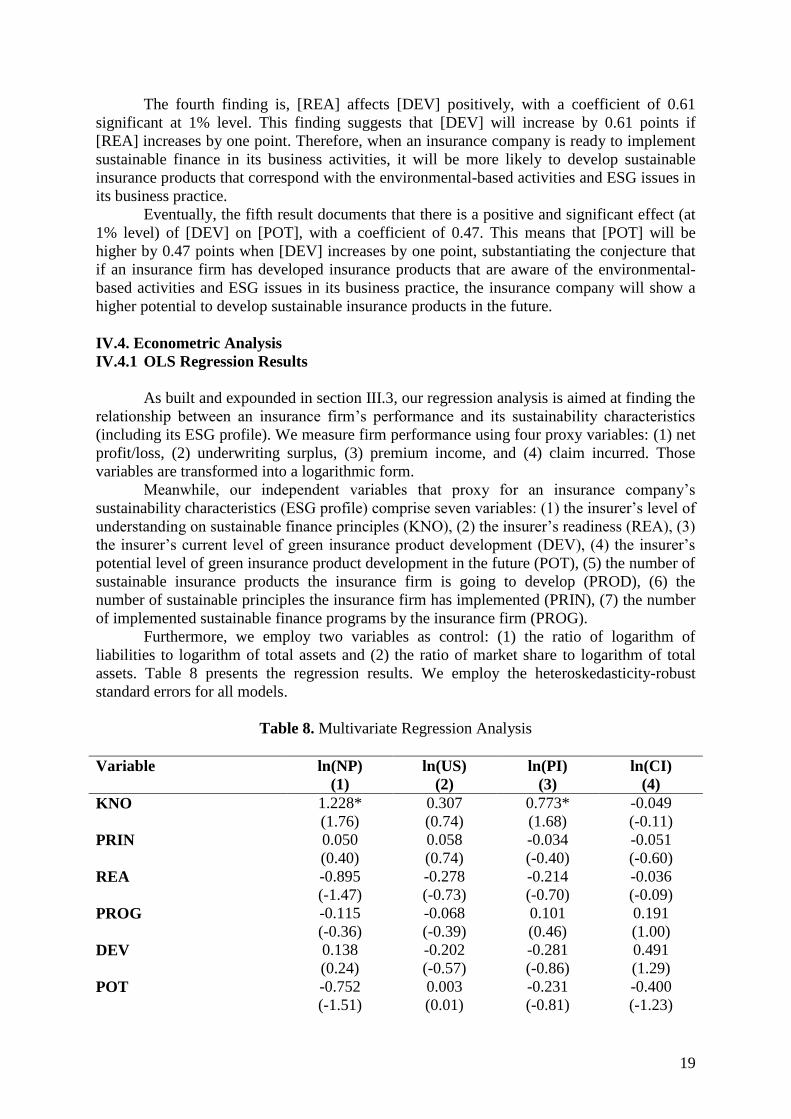
IV.4. Econometric Analysis
IV.4.1 OLS Regression Results
As built and expounded in section III.3, our regression analysis is aimed at finding the
relationship between an insurance firm’s performance and its sustainability characteristics
(including its ESG profile). We measure firm performance using four proxy variables: (1) net
profit/loss, (2) underwriting surplus, (3) premium income, and (4) claim incurred. Those
variables are transformed into a logarithmic form.
Meanwhile, our independent variables that proxy for an insurance company’s
sustainability characteristics (ESG profile) comprise seven variables: (1) the insurer’s level of
understanding on sustainable finance principles (KNO), (2) the insurer’s readiness (REA), (3)
the insurer’s current level of green insurance product development (DEV), (4) the insurer’s
potential level of green insurance product development in the future (POT), (5) the number of
sustainable insurance products the insurance firm is going to develop (PROD), (6) the
number of sustainable principles the insurance firm has implemented (PRIN), (7) the number
of implemented sustainable finance programs by the insurance firm (PROG).
Furthermore, we employ two variables as control: (1) the ratio of logarithm of
liabilities to logarithm of total assets and (2) the ratio of market share to logarithm of total
assets. Table 8 presents the regression results. We employ the heteroskedasticity-robust
standard errors for all models.
Table 8. Multivariate Regression Analysis
Variable ln(NP) ln(US) ln(PI) ln(CI)
(1) (2) (3) (4)
KNO 1.228* 0.307 0.773* -0.049
(1.76) (0.74) (1.68) (-0.11)
PRIN 0.050 0.058 -0.034 -0.051
(0.40) (0.74) (-0.40) (-0.60)
REA -0.895 -0.278 -0.214 -0.036
(-1.47) (-0.73) (-0.70) (-0.09)
PROG -0.115 -0.068 0.101 0.191
(-0.36) (-0.39) (0.46) (1.00)
DEV 0.138 -0.202 -0.281 0.491
(0.24) (-0.57) (-0.86) (1.29)
POT -0.752 0.003 -0.231 -0.400
(-1.51) (0.01) (-0.81) (-1.23)
20
PROD 0.004 0.012 0.016 0.000
(0.12) (0.64) (0.90) (-0.01)
RLTA 14.115* 17.15822*** 20.33843*** 18.75219***
(2.00) (3.82) (3.98) (3.76)
RMSTA 973.740*** 861.8567*** 669.611*** 970.2767***
(5.30) (7.47) (6.19) (7.81)
Intercept -3.402 -3.824 -9.154 -6.551
(-0.46) (-0.82) (-1.67) (-1.26)
Adj. R2 0.5530 0.698 0.735 0.750
F-stat 5.95*** 12.06*** 9.83*** 15.00***
N 37 44 42 43 *, **, and *** denote significance levels at 10%, 5%, and 1%, respectively. F-stat shows the overall
significance of the regression model. The omitted numbers of observations in Models (1), (3), and (4) are due to
incomplete data for net profit, premium income, and claim incurred.
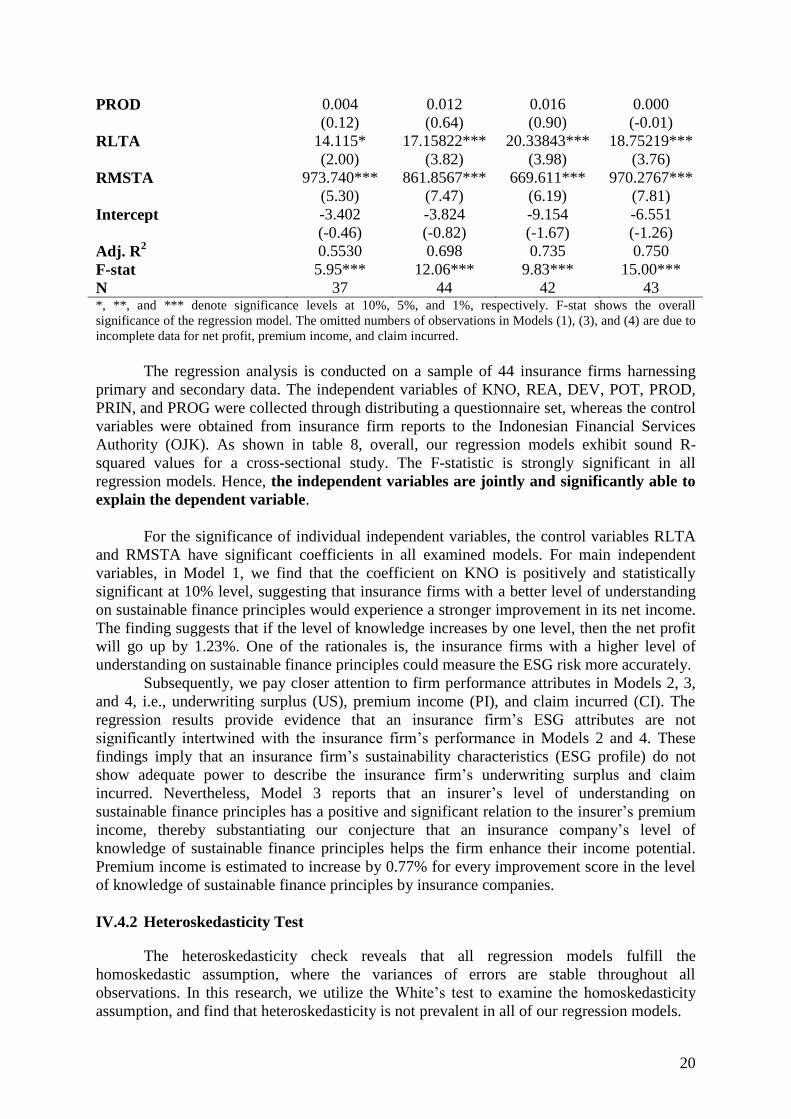
The regression analysis is conducted on a sample of 44 insurance firms harnessing
primary and secondary data. The independent variables of KNO, REA, DEV, POT, PROD,
PRIN, and PROG were collected through distributing a questionnaire set, whereas the control
variables were obtained from insurance firm reports to the Indonesian Financial Services
Authority (OJK). As shown in table 8, overall, our regression models exhibit sound R-
squared values for a cross-sectional study. The F-statistic is strongly significant in all
regression models. Hence, the independent variables are jointly and significantly able to
explain the dependent variable.
For the significance of individual independent variables, the control variables RLTA
and RMSTA have significant coefficients in all examined models. For main independent
variables, in Model 1, we find that the coefficient on KNO is positively and statistically
significant at 10% level, suggesting that insurance firms with a better level of understanding
on sustainable finance principles would experience a stronger improvement in its net income.
The finding suggests that if the level of knowledge increases by one level, then the net profit
will go up by 1.23%. One of the rationales is, the insurance firms with a higher level of
understanding on sustainable finance principles could measure the ESG risk more accurately.
Subsequently, we pay closer attention to firm performance attributes in Models 2, 3,
and 4, i.e., underwriting surplus (US), premium income (PI), and claim incurred (CI). The
regression results provide evidence that an insurance firm’s ESG attributes are not
significantly intertwined with the insurance firm’s performance in Models 2 and 4. These
findings imply that an insurance firm’s sustainability characteristics (ESG profile) do not
show adequate power to describe the insurance firm’s underwriting surplus and claim
incurred. Nevertheless, Model 3 reports that an insurer’s level of understanding on
sustainable finance principles has a positive and significant relation to the insurer’s premium
income, thereby substantiating our conjecture that an insurance company’s level of
knowledge of sustainable finance principles helps the firm enhance their income potential.
Premium income is estimated to increase by 0.77% for every improvement score in the level
of knowledge of sustainable finance principles by insurance companies.
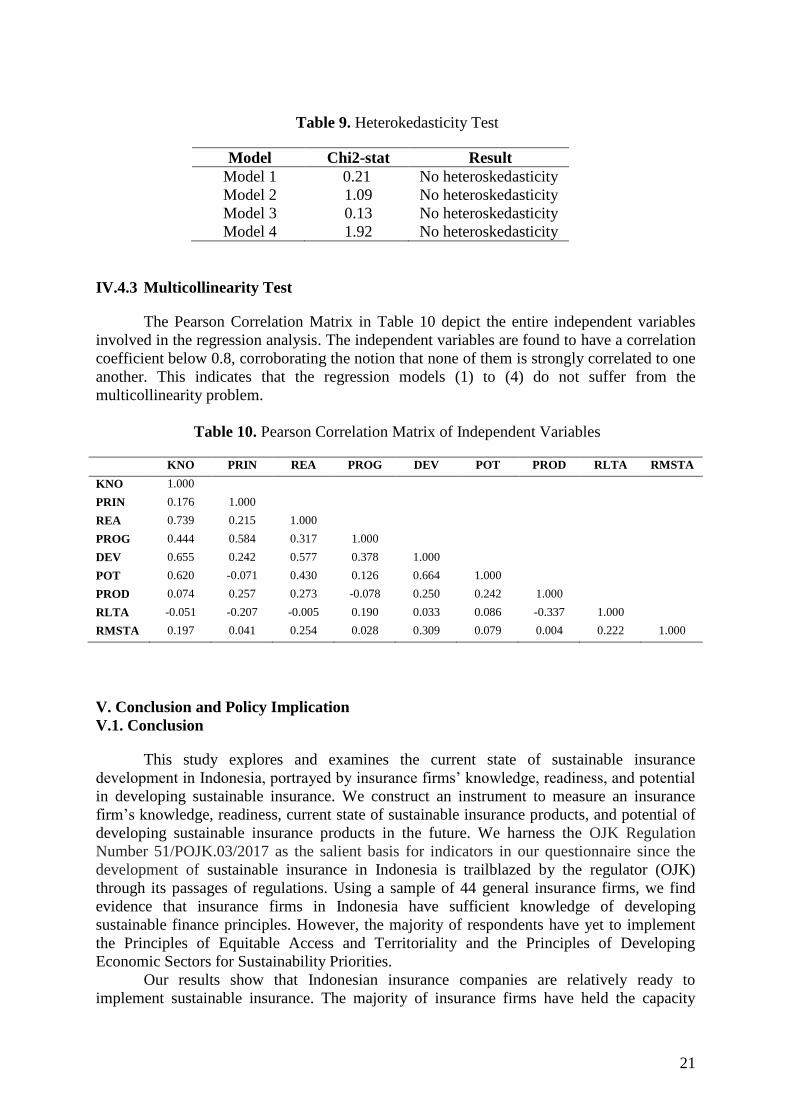
IV.4.2 Heteroskedasticity Test
The heteroskedasticity check reveals that all regression models fulfill the
homoskedastic assumption, where the variances of errors are stable throughout all
observations. In this research, we utilize the White’s test to examine the homoskedasticity
assumption, and find that heteroskedasticity is not prevalent in all of our regression models.
21
Table 9. Heterokedasticity Test
Model Chi2-stat Result
Model 1 0.21 No heteroskedasticity
Model 2 1.09 No heteroskedasticity
Model 3 0.13 No heteroskedasticity
Model 4 1.92 No heteroskedasticity
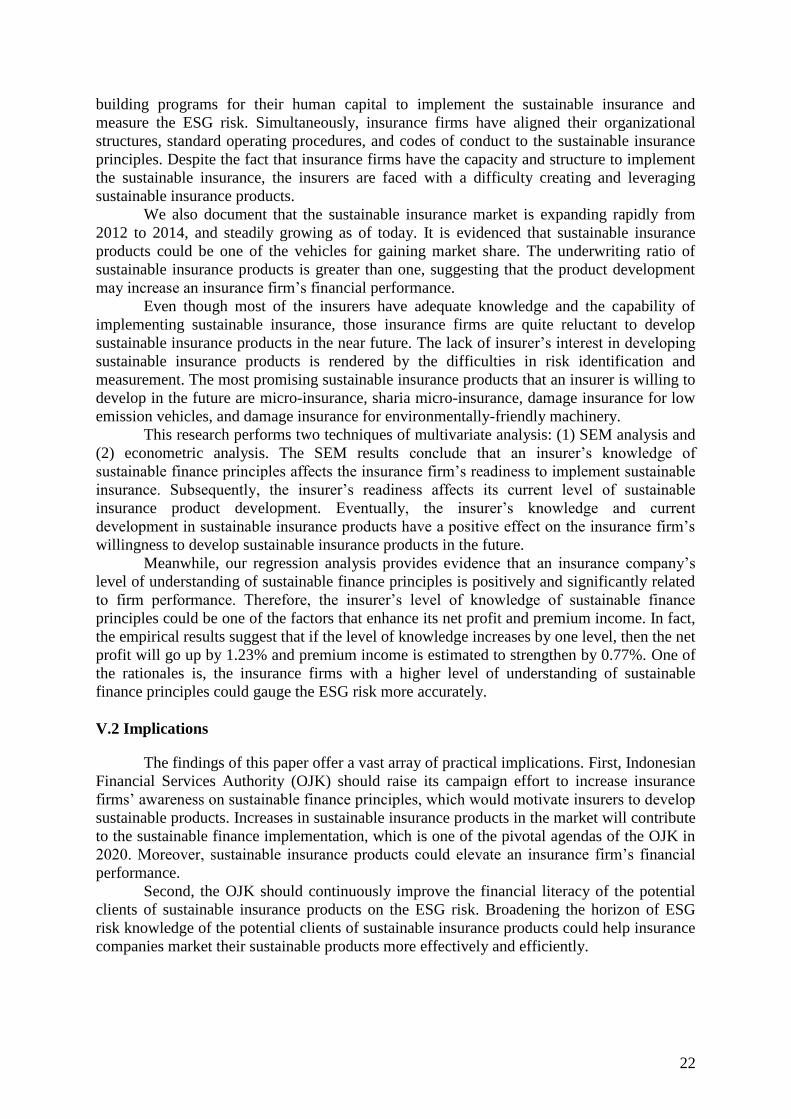
IV.4.3 Multicollinearity Test
The Pearson Correlation Matrix in Table 10 depict the entire independent variables
involved in the regression analysis. The independent variables are found to have a correlation
coefficient below 0.8, corroborating the notion that none of them is strongly correlated to one
another. This indicates that the regression models (1) to (4) do not suffer from the
multicollinearity problem.
Table 10. Pearson Correlation Matrix of Independent Variables
KNO PRIN REA PROG DEV POT PROD RLTA RMSTA
KNO 1.000
PRIN 0.176 1.000
REA 0.739 0.215 1.000
PROG 0.444 0.584 0.317 1.000
DEV 0.655 0.242 0.577 0.378 1.000
POT 0.620 -0.071 0.430 0.126 0.664 1.000
PROD 0.074 0.257 0.273 -0.078 0.250 0.242 1.000
RLTA -0.051 -0.207 -0.005 0.190 0.033 0.086 -0.337 1.000
RMSTA 0.197 0.041 0.254 0.028 0.309 0.079 0.004 0.222 1.000
V. Conclusion and Policy Implication
V.1. Conclusion
This study explores and examines the current state of sustainable insurance
development in Indonesia, portrayed by insurance firms’ knowledge, readiness, and potential
in developing sustainable insurance. We construct an instrument to measure an insurance
firm’s knowledge, readiness, current state of sustainable insurance products, and potential of
developing sustainable insurance products in the future. We harness the OJK Regulation
Number 51/POJK.03/2017 as the salient basis for indicators in our questionnaire since the
development of sustainable insurance in Indonesia is trailblazed by the regulator (OJK)
through its passages of regulations. Using a sample of 44 general insurance firms, we find
evidence that insurance firms in Indonesia have sufficient knowledge of developing
sustainable finance principles. However, the majority of respondents have yet to implement
the Principles of Equitable Access and Territoriality and the Principles of Developing
Economic Sectors for Sustainability Priorities.
Our results show that Indonesian insurance companies are relatively ready to
implement sustainable insurance. The majority of insurance firms have held the capacity
22
building programs for their human capital to implement the sustainable insurance and
measure the ESG risk. Simultaneously, insurance firms have aligned their organizational
structures, standard operating procedures, and codes of conduct to the sustainable insurance
principles. Despite the fact that insurance firms have the capacity and structure to implement
the sustainable insurance, the insurers are faced with a difficulty creating and leveraging
sustainable insurance products.
We also document that the sustainable insurance market is expanding rapidly from
2012 to 2014, and steadily growing as of today. It is evidenced that sustainable insurance
products could be one of the vehicles for gaining market share. The underwriting ratio of
sustainable insurance products is greater than one, suggesting that the product development
may increase an insurance firm’s financial performance.
Even though most of the insurers have adequate knowledge and the capability of
implementing sustainable insurance, those insurance firms are quite reluctant to develop
sustainable insurance products in the near future. The lack of insurer’s interest in developing
sustainable insurance products is rendered by the difficulties in risk identification and
measurement. The most promising sustainable insurance products that an insurer is willing to
develop in the future are micro-insurance, sharia micro-insurance, damage insurance for low
emission vehicles, and damage insurance for environmentally-friendly machinery.
This research performs two techniques of multivariate analysis: (1) SEM analysis and
(2) econometric analysis. The SEM results conclude that an insurer’s knowledge of
sustainable finance principles affects the insurance firm’s readiness to implement sustainable
insurance. Subsequently, the insurer’s readiness affects its current level of sustainable
insurance product development. Eventually, the insurer’s knowledge and current
development in sustainable insurance products have a positive effect on the insurance firm’s
willingness to develop sustainable insurance products in the future.
Meanwhile, our regression analysis provides evidence that an insurance company’s
level of understanding of sustainable finance principles is positively and significantly related
to firm performance. Therefore, the insurer’s level of knowledge of sustainable finance
principles could be one of the factors that enhance its net profit and premium income. In fact,
the empirical results suggest that if the level of knowledge increases by one level, then the net
profit will go up by 1.23% and premium income is estimated to strengthen by 0.77%. One of
the rationales is, the insurance firms with a higher level of understanding of sustainable
finance principles could gauge the ESG risk more accurately.
V.2 Implications
The findings of this paper offer a vast array of practical implications. First, Indonesian
Financial Services Authority (OJK) should raise its campaign effort to increase insurance
firms’ awareness on sustainable finance principles, which would motivate insurers to develop
sustainable products. Increases in sustainable insurance products in the market will contribute
to the sustainable finance implementation, which is one of the pivotal agendas of the OJK in
2020. Moreover, sustainable insurance products could elevate an insurance firm’s financial
performance.
Second, the OJK should continuously improve the financial literacy of the potential
clients of sustainable insurance products on the ESG risk. Broadening the horizon of ESG
risk knowledge of the potential clients of sustainable insurance products could help insurance
companies market their sustainable products more effectively and efficiently.
23
References
Arena, M. 2006. Does Insurance Market Activity Promote Economic Growth?. World Bank
Policy Research Working Paper 4098.
Asian Development Bank. 2017. Agriculture Insurance. ADB Briefs No. 77, April 2017.
Asuransi. https://www.ojk.go.id/id/kanal/iknb/Pages/Asuransi.aspx.
Bollen, K. A. 1989. Structural equations with latent variables. New York: Wiley.
Boer, R. 2012. Asuransi Iklim Sebagai Jaminan Perlindungan Ketahanan Petani Terhadap
Perubahan Iklim. Widyakarya Nasional Pangan dan Gizi 10: Pemantapan Ketahanan
Pangan dan perbaikan Gizi Berbasis Kemandirian dan Kearifan Lokal. LIPI, Jakarta.
BP Migas. 2011. Pedoman Tata Kerja Pengelolaan Asuransi BP Migas dan Kontraktor Kerja
Sama No. PTK-044/BP00000/2011/S0.
ClimateWise. 2011. ClimateWise Compendium of disaster risk transfer initiatives in the
developing world.
Copy of Circular Letter of the Financial Services Authority No. 9/SEOJK.05/2017 on Micro-
insurance Products and Marketing Channels of Micro-insurance Products.
Copy of Regulation of the Financial Services Authority No. 23/POJK.05/2015 on Insurance
Products and Insurance Product Marketing.
Departemen Penelitian dan Penngaturan Perbankan Otoritas Jasa Keuangan. 2017. Pokok-
Pokok Pengaturan POJK No. 51/POJK.03/2017 tentang Penerapan Keuangan
Berkelanjtan bagi Lembaga Jasa Keuangan, Emiten dan Perusahaan Publik.
Direktorat Jenderal Anggaran. 2016. Analisis Strategi Pencapaian Efektivitas Pelaksanaan
Anggaran Asuransi Pertanian dalam APBN melalui Analisis SWOT. Kajian Tematik
Direktorat Anggaran Bidang Perekonomian dan Kemaritiman.
Eccles, R. G., Ioannou, I., Serafeim, G. 2014. The impact of corporate sustainability on
organizational processes and performance. Manag. Sci. 60, 2835–2857.
Engert, S., Rauter, R., Baumgartner, R. J. 2016. Exploring the integration of corporate
sustainability into strategic management: a literature review. J. Clean. Prod. 112, 2833
2850.
Estiningtyas, W. 2015. Asuransi Pertanian Berbasis Indeks Iklim: Opsi Pemberdayaan dan
Perlindungan Petani Terhadap Risiko Iklim. Jurnal Sumberdaya Lahan Vol. 9 No. 1,
51-64.
Estiningtyas, W., Boer, R., Las, I., Buono, A., Rakhman, A. 2011. Deliniasi Risiko Iklim dan
Evaluasi Model Hubungan Curah Hujan dan Produksi Padi dalam Mendukung
Pengembangan Asuransi Indeks Iklim (Climate Index Insurance) Pada Sistem
Usahatani Berbasis Padi. Jurnal Ilmu Pertanian Indonesia, 198-208.
Faris, C., Gilbert, B., LeBlanc, B., Ballou, B., Heitger, D. L. 2013. Demystifying
Sustainability Risk: Integrating the Triple Bottom Line into an Enterprise Risk
Management Program. The Committee of Sponsoring Organizations of the Treadway
Commission (COSO).
Fiscal Risks Management Center of The Ministry of Finance Fiscal Policy Agency. 2014.
Kajian Persiapan Implementasi Asuransi Pertanian Secara Nasional.
Giese, Guido, Linda-Eling Lee, Dimitris Melas, Zoltan Nagy, and Laura Nishikawa June.
2018. Foundation of ESG Investing Part 1: How ESG Affects Equity Valuation, Risk
and Performance. MSCI.
Giese, Guido, Linda-Eling Lee, Dimitris Melas, Zoltan Nagy, and Laura Nishikawa June.
2018. Foundation of ESG Investing Part 2: Integrating ESG into Benchmarks. MSCI.
Giese, Guido, Linda-Eling Lee, Dimitris Melas, Zoltan Nagy, and Laura Nishikawa June.
2018. Foundation of ESG Investing Part 3: Integrating ESG into Passive Portfolio.
MSCI.
24
Giese, Guido, Linda-Eling Lee, Dimitris Melas, Zoltan Nagy, and Laura Nishikawa June.
2018. Foundation of ESG Investing Part 4: Integrating ESG into Factor Strategies and
Active Portfolio. MSCI.
Gilbert, S., Zhao, L. 2017. The Knowns and Unknowns of China’s Green Finance,
Contributing Paper for The Sustainable Infrastructure Imperative: Financing for Better
Growth and Development. New Climate Economy, London, Washington, DC.
Global Councel. 2015. ASEAN Insurance Markets.
Green Insurance. https://www.iii.org/article/green-insurance.
Hazell, P. B., Pomareda, C., Valdes, A. 1986. Crop Insurance for Agricultural Development:
Issues and Experience.
Herremans, I. M. and Nazari, J. A. 2016. Sustainability reporting driving forces and
management control systems. J. Manag. Account. Res. 28, 103–124.
Insurance Working Group of the United Nations Environment Programme Finance Initiative.
2007. Insuring for Sustainability: Why and How the Leaders are Doing It. Inaugural
Report.
Insyafiah and Wardhani, I. 2014. Kajian Persiapan Implementasi Asuransi Pertanian Secara
Nasional. Pusat Pengelolaan Risiko Fiskal Badan Kebijakan Fiskal Kementerian
Keuangan.
Jollands, S., Akroyd, C., Sawabe, N. 2015. Core values as a management control in the
construction of “sustainable development”. Qual. Res. Account. Manag. 12, 127–152.
Joshi, S., Li, Y. 2016. What is corporate sustainability and how do firms practice it? A
management accounting research perspective. J. Manag. Account. Res. 28, 1–11.
Li, Wei, Hu, M. 2014. An overview of the environmental finance policies in China:
Retrofitting an Integrated Mechanism for Environmental Management. Front. Environ.
Sci. Eng. 2014, 8(3), 316-328.
Mills, E. 2015. Insurers as Partners in Inclusive Green Growth. International Finance
Corporation World Bank Group.
Moraes, Claudio O, Monte, Gabriel C, Antunes, José Américo Pereira. 2016. How does
capital regulation react to monetary policy? New evidence on the risk-taking channel.
Economic Modelling Vol.56, pp. 177-186.
Munich Re Foundation dan GIZ-RFPI. 2014. The Landscape of Micro-insurance in Asia and
Oceania 2013.
NASA. Climate Change: How do We Know? https://climate.nasa.gov/evidence/.
Ng, Artie W. 2018. From sustainability accounting to a green financing system: Institutional
legitimacyand market heterogeneity in a global financial centre. Journal of Cleaner
Production Vol.195. pp. 585–592.
O’Dwyer, B. 2011. The case of sustainability assurance: constructing a new assurance
service. Contemp. Account. Res. 28, 1230–1266.
O’Dwyer, B., Owen, D. L. 2005. Assurance statement practice in environmental, social and
sustainability reporting: a critical evaluation. Br. Account. Rev. 37, 205–229.
O’Dwyer, B., Owen, D., Unerman, J. 2011. Seeking legitimacy for new assurance forms: the
case of assurance on sustainability reporting. Account. Organ. Soc. 36, 31–52.
Organisasi Perburuhan Internasional. 2008. Konvensi ILO No. 102 Tahun 1952 mengenai
(Standar Minimal) Jaminan Sosial. Jakarta.
Otoritas Jasa Keuangan. 2013. Grand Design Pengembangan Asuransi Mikro Indonesia. Tim
Pengembangan Asuransi Mikro Otoritas Jasa Keuangan.
Otoritas Jasa Keuangan. 2017. Statistik Perasuransian Indonesia 2016.
Peraturan Menteri Negara Lingkungan Hidup Nomor 18 Tahun 2009 tentang Tata Cara
Perizinan Pengelolaan Limbah Bahan Berbahaya dan Beracun.
25
Peraturan Otoritas Jasa Keuangan No. 23/POJK.05/2015 tentang Produk Asuransi dan
Pemasaran Produk Asuransi.
Peraturan Otoritas Jasa Keuangan No. 73/POJK.05/2016 tentang Tata Kelola Perusahaan
yang Baik Bagi Perusahaan Perasuransian.
Peraturan Pemerintah Republik Indonesia No. 46 tahun 2017 tentang Instrumen Ekonomi
Lingkungan Hidup.
Perdinan. 2014. Climate Change and Crop Insurance: Application of Crop Model. Workshop
on Capacity Development on Downscaling Climate Change Projection and Index Base
Agrcultural Insurance.
PricewaterhouseCoopers. 2013. Exploring green finance incentives in China. p. 1-71.
http://www.pwccn.com/webmedia/doc/635163938836835335_green_finance_incentive
s_oct2013_eng.pdf.
Riswinandi. 2018. Growing Climate Change Risk and How It Manifest for Insurance
Markets. Indonesia Financial Service Authority presentation in Tokyo, April 26,2018.
Non-published presentation
Sloggert, Justin. 2016. A Practical Guide to ESG Integration for Equity Investing.
Smith, V. H., Glauber W. J. 2012. Agricultural Insurance in Developed Countries: Where
Have We Been and Where Are We Going?. Applied Economic Perspectives and Policy
363-390.
Solheim, E. 2016. Green Finance for Developing Countries: Needs, Concerns and
Innovations. www.UNEP.org.
Tayler, William J and Zilberman, Roy. 2016. Macroprudential regulation, credit spreads and
the role of monetary policy. Journal of Financial Stability Vol.26, Pp. 144-158.
The Consultative Group to Assist the Poor (CGAP). Disaster Risk Insurance to Promote
Resilience. Accessed Juni 27, 2018. CGAP (the Consultative Group to Assist the Poor).
The Geneva Association. 2018. Climate Change and the Insurance Industry: Taking Action
as Risk Managers and Investors.
The Insurance Climate Change Initiatives. Global insurance industry statement on Adapting
to Climate Change in Developing Countries.
The Literacy and Financial Inclusion Department of Education And Consumer Protection of
The Financial Services Authority (OJK). 2017. Survey Nasional Literasi dan Inklusi
Keuangan 2016.
The PSI Global Resilience Project. 2015. Collacorating for Resiliece: Partnership that Build
Disaster-Resilient Communities and Economies. UNEP Finance Initiative.
The UNEP Inquiry into the design of a sustainable financial system. 2015. Towards a
sustainable financial system in Indonesia. Ulrich Volz, SOAS, University of London
and German Development Institute.
The UNEP Inquiry. 2015. Insurance 2030: harnessing Insurance for Sustainable
Development. Inquiry Working Paper.
Undang-Undang Republik Indonesia No. 19 Tahun 2013 tentang Perlindungan dan
Pemberdayaan Petani.
Undang-Undang Republik Indonesia No. 23 tahun 1997 tenteng Pengelolaan Lingkungan
Hidup.
Undang-Undang Republik Indonesia No. 32 Tahun 2009 tentang Perlindungan dan
Pengelolaan Lingkungan Hidup.
Undang-Undang Republik Indonesia No. 40 Tahun 2004 Tentang Sistem Jaminan Sosial
Nasional.
UNEP FI and WBCSD. 2010. Translating ESG into Sustainable Business Value. Genève:
UNEP FI and WBCSD.
UNEP FI. 2012. PSI: Principles for Sustainable Insurance. Genève: UNEP FI.
26
UNEP Finance Initiative. 2012. Principles for Sustainable Insurance: A global sustainability
framework and initiative of the United Nations Environment Programme Finance
Initiative.
UNEP Financial Initiative. 2012. PSI: Principles for Sustainable Insurance. Genève: United
Nation Environment Programme Finance Initiative.
Wang,Yao and Zhi, Qiang. 2016. The role of green finance in environmental protection: Two
aspects of market mechanism and policies. Energy Procedia vol. 104, pp. 311 – 316.
Weber, O. 2014. The financial sector's impact on sustainable development. J. Sustain.
Finance. Invest. 4, 1–8.
Weber, O., Scholz, R. W., Michalik, G. 2010. Incorporating sustainability criteria into credit
risk management. Bus. Strategy Environ. 19, 39-50.
Wibisana, A. G., and Putri, P. K. 2009. Analisa Law and Economics atas Kompensasi dan
Asuransi Lingkungan di Indonesia: Sebuah Kritik atas Kompensasi Tanpa Sistem.
Jurnal Hukum dan Pembangunan Tahun ke-39 No. 4 531-571.
World Food Programme dan OXFAM America. 2014. R4 Rural Resilience Initiative.
Quarterly Report.
Zona, Rita, Kevin Roll, and Zora Law. 2014. Sustainable/Green Insurance Products.
Casualty Actuarial Society E-Forum.


![Evidence profile [Updated 2015] pdf, 1.07Mb](https://img.pdfslide.net/doc/110x75/5895a3cc1a28abc2578bc483/evidence-profile-updated-2015-pdf-107mb.jpg)