Embed Size (px)
Citation preview
Tous droits réservés © Management international / International Management/ Gestión Internacional, 2017
This document is protected by copyright law. Use of the services of Érudit(including reproduction) is subject to its terms and conditions, which can beviewed online.https://apropos.erudit.org/en/users/policy-on-use/
This article is disseminated and preserved by Érudit.Érudit is a non-profit inter-university consortium of the Université de Montréal,Université Laval, and the Université du Québec à Montréal. Its mission is topromote and disseminate research.https://www.erudit.org/en/
Document generated on 03/15/2022 1:44 a.m.
Management internationalInternational ManagementGestiòn Internacional
Corporate Governance and Equity Prices: The Effect of Board ofDirectors and Audit Committee IndependenceGouvernance d’entreprise et cours des actions : effet del’indépendance du conseil d’administration et du comité d’auditGobierno corporativo y precios de las acciones: Efecto de laindependencia de la Consejo de Administración y el comité deauditoríaTaher Hamza and Nada Mselmi
Les nouvelles frontières du management publicThe new frontiers of Public ManagementLas nuevas fronteras de la gestión públicaVolume 21, Number 2, Winter 2017
URI: https://id.erudit.org/iderudit/1052694arDOI: https://doi.org/10.7202/1052694ar
See table of contents
Publisher(s)HEC MontréalUniversité Paris Dauphine
ISSN1206-1697 (print)1918-9222 (digital)
Explore this journal
Cite this articleHamza, T. & Mselmi, N. (2017). Corporate Governance and Equity Prices:The Effect of Board of Directors and Audit Committee Independence. Management international / International Management / Gestiòn Internacional,21(2), 152–164. https://doi.org/10.7202/1052694ar
Article abstractThis paper investigates the effect of board and audit committee independenceon firm market performance. Using a sample of French listed firms, we find anegative and significant relation between board independence and equityreturns. This suggests that appointing more independent directors fails inenhancing firm stock returns. Furthermore, we show that firms withindependent audit committees exhibit higher equity returns. We analyze threeportfolios sorted by the percentage of independent directors on boards andaudit committees using Carhart’s model and find that the portfolio of firmswith low board independence and high audit committee independenceexhibits the highest abnormal returns.JEL Classification: G34, G11
Contributions of studies on corporate governance are central to businesses and decision makers, especially following a
series of firm bankruptcies and frauds. Enron, WorldCom and Tyco scandals were caused by fraud and accounting manipula-tions practiced by managers who conceal their illegal actions and obstruct investigations at the expense of shareholders. The finance literature defines corporate governance as “the ways in which suppliers of finance to corporations assure themselves of getting a return on their investment” (Shleifer and Vishny, 1997). It considers good corporate governance practices as a criterion
for portfolio investment decision making since they improve firm performance (Gompers et al. 2003; Cremers and Nair, 2005; Brown and Caylor, 2006; Bebchuk et al. 2009).
The board of directors is central to the corporate govern-ance system (Jensen, 1993). A number of empirical studies have examined the role of board characteristics (size, composition, independence, etc.) on firm performance. For instance, Jensen (1993) endorses the proposal of a small board of directors to ensure that it will not be controlled easily by the CEO and to reduce problems of communication and coordination so that
ABSTRACTThis paper investigates the effect of board and audit committee independence on firm market performance. Using a sample of French listed firms, we find a negative and significant relation between board inde-pendence and equity returns. This suggests that appointing more independent direc-tors fails in enhancing firm stock returns. Furthermore, we show that firms with inde-pendent audit committees exhibit higher equity returns. We analyze three portfolios sorted by the percentage of independent direc-tors on boards and audit committees using Carhart’s model and find that the portfolio of firms with low board independence and high audit committee independence exhibits the highest abnormal returns.Keywords: Corporate governance; Board independence; Audit committee; Carhart’s (1997) four-factor model; Equity prices.JEL Classification: G34, G11
RÉSUMÉCet article étudie l’effet de l’indépendance du conseil d’administration et du comité d’audit sur la performance de marché des entre-prises. A partir d’un échantillon d’entre-prises françaises cotées, notre étude montre une relation négative et significative entre l’indépendance du conseil d’administra-tion et le rendement des actions. De plus, les enterprises à comité d’audit indépen-dant affichent des rendements plus élevés. Nous analysons trois portefeuilles triés par le pourcentage d’administrateurs indépen-dants dans le conseil et le comité d’audit en utilisant le modèle de Carhart. Il ressort que le portefeuille d’entreprises à faible indépen-dance du conseil et à forte indépendance du comité d’audit affiche les rendements anormaux les plus élevés.Mots clés : Gouvernance d’entreprise; Indépendance du conseil d’administra-tion; Comité d’audit; Modèle à 4 facteur de Carhart’s (1997); Prix des actionsClassification JEL: G34, G11
RESUMENEn este artículo se analiza el efecto de la inde-pendencia del consejo de administración y del comité de auditoría en el rendimiento de la empresa. A partir de una muestra de empresas francesas cotizadas, nuestro estudio muestra, por una parte, una relación negativa y signi-ficativa entre la independencia del consejo de administración y el rendimiento de las acciones. Por otra parte, ponemos de relieve que, las empresas cuyo comité de auditoría es independiente tienen rendimientos más eleva-dos. Hemos analizado tres portafolios según el porcentaje de administradores indepen-dientes en el consejo de administración y en el comité de auditoría utilizando el modelo de Carhart. De ello se deduce que, el portafolio de empresas cuya independencia del consejo de administración es débil, y cuya independencia del comité de auditoría es fuerte, muestra los rendimientos anormales más altos.Palabras clave: Gobierno corporativo; Independencia del Consejo de Administración; Comité de Auditoría; Modelo 4 factores de Carhart (1997); precios de las accionesClasificación JEL: G34, G11
Corporate Governance and Equity Prices: The Effect of Board of Directors and Audit Committee Independence
Gouvernance d’entreprise et cours des actions : Effet de l’indépendance du conseil d’administration et du comité d’audit
Gobierno corporativo y precios de las acciones: Efecto de la independencia de la Consejo de Administración y el comité de auditoríaTAHER HAMZAIHEC, University of Carthage, TunisiaVALLOREM, Université d’Orléans, France
NADA MSELMILEO, Université d'Orléans, France .LAMIDED, University of Sousse, Tunisia
Pour
cite
r cet
art
icle
: H
amza
, T. &
Mse
lmi,
N. (
2017
). C
orpo
rate
gov
erna
nce
and
equi
ty p
rice
s: Th
e ef
fect
of b
oard
of d
irec
tors
an
d au
dit c
omm
ittee
inde
pend
ence
. Man
agem
ent i
nter
natio
nal,
152-
164.
Corporate Governance and Equity Prices: The Effect of Board of Directors and Audit Committee Independence 153
its effectiveness gets better which improves the firm perform-ance. In this same stream of research, Breeden (2003) suggests that a small board size guarantees a mix of skills, experience and area of knowledge such as finance and regulatory knowledge, experience in project management and technology, etc. Agrawal and Knoeber (1996) find significant relations between firm per-formance and four corporate control mechanisms including the presence of outside directors. Following the advent of several accounting scandals and concerns about the quality of financial statements, recent research have given a special attention to the role and the percentage of independent members on the board of directors as well as the role of independent audit committee, and investigated their effects on firm market performance (e.g., Black et al. 2006; Coles et al. 2008; Bronson et al. 2009; Choi et al. 2014; Cai et al. 2015).
Our study extends the above-mentioned literature by focus-ing simultaneously on the effects of board of directors and audit committee independence on firm performance. Specifically, we examine how the market performance of French listed companies can be improved through the proportion of independent members in both the board of directors and the audit committee. This study empirically considers the listed firms that belong to the French SBF120 index and follows a 3-step procedure. We first collect the percentage of independent directors in both the corporate board and the audit committee for the sample of firms under considera-tion. We then classify each individual firm into one of the three portfolios sorted with respect to the percentage of independent directors on the board and the audit committee. We assume that portfolio of well governed firms is best performing than the one of poorly governed firms. Finally, we regress the return of each sorted portfolio on the Carhart (1997) four pricing risk factors (market risk premium, size risk premium, value risk premium, and momentum risk premium). We focused in particular on the model estimation of the Jensen’s alpha (1968) that measures the abnormal returns generated by the different sorted portfolios. Note that a sizeable literature has proved the explanatory power of these pricing risk factors on stock returns.
Our main findings over January 2005 – December 2012 period can be summarized as follows: i) There is a negative and significant relation between the percentage of independents on the board of directors and firm market performance. Indeed, firms with low percentage of independent directors on corporate boards exhibit a high level of abnormal returns; ii) We find that firms with high percentage of independent directors on the audit committee exhibit higher equity returns; iii) We use a four factor pricing model to analyze the returns of three sorted portfolios and find that the portfolio of firms with low percentage of independent directors on corporate boards and high percentage of independent direc-tors in audit committees exhibit the highest abnormal returns.
France provides a particularly suitable context for studying the effect of efficient corporate governance mechanisms, such as the board of directors and the audit committee independence, on firm market performance. Indeed, there is a greater need for monitoring by the board of directors and the audit committee to the extent that some characteristics of the French corporate governance model (closely held companies, high ownership and
control wedge, extensive family ownership) are deemed to foster private benefits extraction by controlling shareholders (Faccio and Lang, 2002). In this regard, Ben-Nasr et al. (2015) docu-ment that “Fench listed firms are controlled by large sharehold-ers through different mechanisms, such as pyramid structures, non-voting shares, and double-voting shares… These mechan-isms give them incentives to extract private benefits of control at the expense of minority shareholders”. Moreover, the fact that France is a civil law country with a weak investor’s protection incorporated in the legal system and regulatory arrangements is more likely to facilitate minority shareholders expropriation (Boubaker and Labégorre, 2008). Board of directors and audit committee independence should therefore constitute power-ful internal governance mechanisms that increase intensity of monitoring and discipline effectiveness, contributing to enhance investor confidence. In light of this, it is particularly interesting to assume that some aspects of portfolio investment, such as the equity selection strategy, are affected by the corporate governance quality and specifically by the appointment of independents on both the board of directors and the audit committee. Such line of research has scarcely been explored in France.
This study adds to the recent literature in at least three ways. First, it asserts that appointing more independent directors on the board fails in enhancing firm equity returns. Second, it supplements the literature by showing that firms with independ-ent audit committees exhibit higher equity returns. Third, this paper shows that firms with low board independence and high audit committee independence exhibit the highest firm mar-ket performance. As such, we consider our research to be an important and timely contribution to this field.
The remainder of this study is organized as follows. Section 2 briefly reviews the literature on the effect of board of direc-tors and audit committee characteristics as corporate govern-ance mechanisms, on firm market performance, with a focus on the use of portfolio sorting procedure. Section 3 describes the methodology and reports the empirical results. Section 4 provides some concluding remarks.
Corporate governance and firm market performance: the role of board of directors
and audit committee independence.The stream of research that investigates the relation between corporate governance and performance has grown rapidly since the beginning of 2000. The common idea stipulates that corpo-rate governance quality is associated with greater performance.
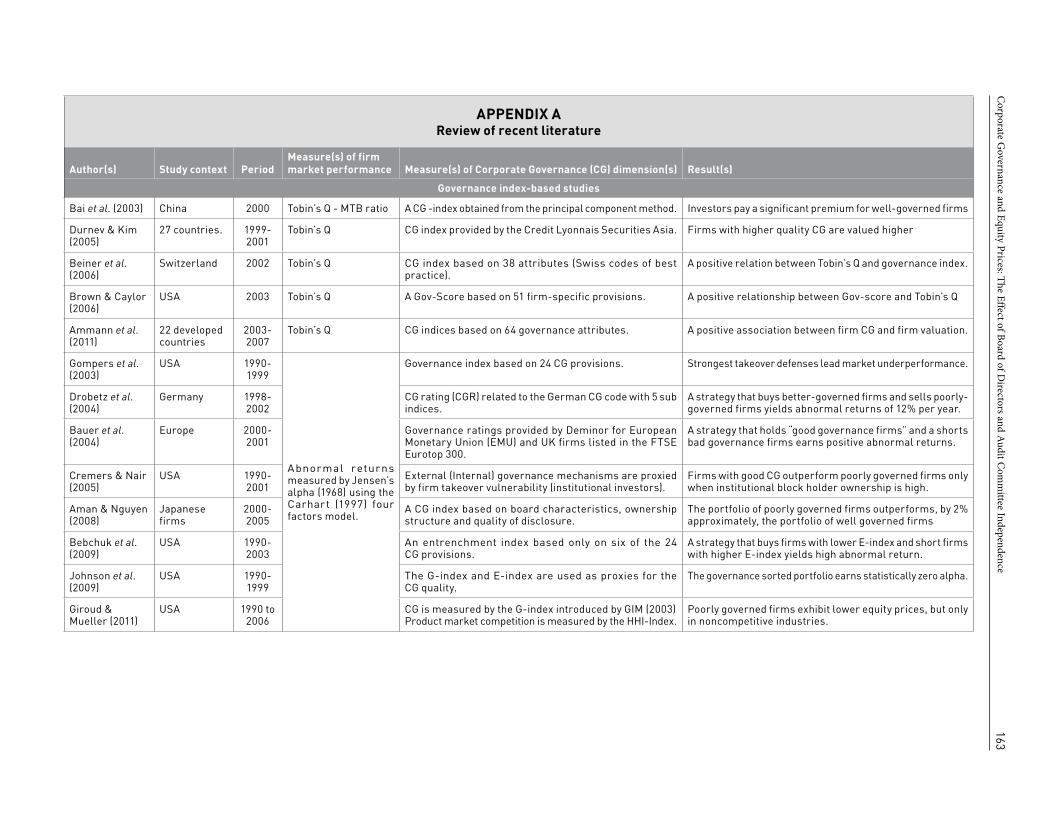
Corporate governance and firm market performance: A review of governance index-based studiesThe extant literature has focused extensively on how internal and external governance mechanisms affect equity prices. To this end, several works developed “Governance Indexes (G-Index)” to proxy for firm-level governance quality. Gompers et al. (2003) construct a governance index (G-index) and its subindices (Delay, Protection, Voting, Other, and State) calculated from 24 corporate governance provisions.1 The portfolio containing firms with the
1. The authors form 10 decile portfolios depending on the value of the G-index: G ≤ 5, G= 6,..., 13 and G ≥ 14. A special attention is given to the 2 extreme portfolios respectively: the “shareholder” portfolio and the “managerial” portfolio.
154 Management international / International Management / Gestión Internacional
weakest shareholder rights (G ≥ 14), realizes negative and signifi-cant monthly abnormal returns (-0.42%). The one formed by firms with the strongest shareholder rights (G ≤ 5), realizes positive and significant monthly abnormal returns (0.29%). Thus, a strategy that buys the “shareholder” portfolio and sells the “managerial” portfolio exhibit annual abnormal returns of 8.5%. This finding is however not always corroborated by subsequent studies.
In the same context, Johnson et al. (2009) determine the long term abnormal returns of different portfolios sorted by the G-Index. They conclude that “non-democracy and non-dictatorship firms cluster in industries are either systematically mispriced by standard asset pricing models or unexpectedly, earn non-zero long-term abnormal returns despite their governance effectiveness”. Differently, Bebchuk et al. (2009) examine all firms provided by the Investor Responsibility Research Center (IRRC) during the 1990–2003 period, and focus on the abnormal returns resulting from a strategy that buys firms with a lower entrench-ment index (E-Index) and sells firms with a higher E-index score. These authors regress the monthly returns of their strategy on the four factor pricing model of Carhart (1997). They find posi-tive and statistically significant abnormal returns, and underline that these returns decrease continually. Bauer et al. (2004) test whether good governance contributes to higher common stock returns for a sample of firms of the FTSE100. The authors follow Gompers et al. (2003) and construct portfolios formed by well governed and poorly governed firms and then compare their marker performance. Their findings suggest a positive relation between corporate governance and common stock returns.
Cremers and Nair (2005) focus on U.S firms and test the link between both internal and external governance and firm market performance and find that well governed firms exhibit abnormal returns that range from 10% to 15%. In the same context, Giroud and Mueller (2011) show that poorly governed firms have lower equity returns and lower firm value, but only in noncompetitive industries. Aman and Nguyen (2008) investigate the impact of corporate governance on Japanese stock returns. As a proxy for corporate governance, the authors construct a governance index taking into account the board structure, the ownership charac-teristics and the quality of disclosure. Using governance-sorted portfolios, they show that the portfolio of well governed firms underperforms, by 2% approximately, the portfolio of poorly gov-erned firms. The authors explain this result by the overvaluation of well-governed firms, the undervaluation of poorly governed firms and the lower risk exposure of well governed firms. In the Chinese context, Bai et al. (2003) construct a governance index for 1004 listed firms and estimate the corporate governance premium. Their results show that the governance index has a negative and significant impact on market valuation. Moreover, Bai et al. (2003) suggest that investors compensate well governed firms by the payment of a significant premium.
It is worth noting that to date, a significant number of empir-ical studies have focused on specific corporate governance mechanisms including board characteristics and independent audit committee, and examined the link between these mechan-isms and firm market performance. In what follows, we discuss the main studies of this strand of literature and formulate our testing hypotheses.
Board independence and firm market performanceThe board of directors is a crucial mechanism for controlling managerial behavior. It contributes to protect shareholder’s interests and reduce agency conflicts. There is now evidence to suggest that the degree of board independence significantly affects the board effectiveness and the firm market performance for the U.S. firms. Rosenstein and Wyatt (1990) find a positive and significant effect of the appointment of an outside director on the share price. They suggest that profits gained from the appointment of an outside director exceed the anticipated costs of potential managerial entrenchment and inefficient decision making. Using a sample of 515 Korean public companies, Black et al. (2006) investigate whether better-governed firms have higher market value than poorly-governed firms. The authors underline that greater board independence causally predicts higher equity prices. They point out that firms with 50% of outside directors have 0.13 higher Tobin’s Q (40% higher share price). Their findings are robust to alternative measures of firm market value (Tobin’s Q, market to book, and market to sales) and even after controlling for the other G-Index attributes. The findings of Bruno and Claessens (2010) support this view. The authors report a positive link between independent boards and firm Tobin’s Q in any country’s legal regime. For their part, Nguyen and Nielsen (2010) analyze the stock price reaction to sudden deaths of firm directors and show that stock prices dec-rease by 0.85% on average following the death of an independent director. Similarly, O’Connell and Cramer (2010) define 2 groups of firms according to their stock market value and find, in all cases, a positive relation between market performance and the proportion of independent directors.
The positive relation between board independence and firm market performance is however not always supported. In the U.S. market, Agrawal and Knoeber (1996) find a negative link between Tobin’s Q and the proportion of outside directors. According to these authors, political reasons explain the increase of the pro-portion of outside directors. Coles et al. (2008) also show that the proportion of independent directors is negatively correlated to the Tobin’s Q, while the latter is positively linked to owner-ship. Their results thus imply that firms with high productivity of CEO efforts choose less independent boards.
The dominance of empirical evidence on the positive relation between board independence and firm market performance leads us to hypothesize that:
H1: There is a positive relation between board independence and firm equity returns.
Audit committee independence and firm market performanceAs a factor that contributes to the firm disclosure effectiveness, the audit committee should be formed mainly of independent members in order to ensure an effective supervision of financial statements. In the U.S. context, the Securities and Exchange Com-mission (SEC) incites companies to have recourse to a completely independent audit committee in order to improve the quality of the company’s financial disclosure and the suitability of internal controls. The Breeden report (2003) proposes to set up board committees in which the CEO is not a member of any of the
Corporate Governance and Equity Prices: The Effect of Board of Directors and Audit Committee Independence 155
board committees. Hence, committees are composed entirely of independent members. Moreover, the author stresses that the Articles of Incorporation require an independent audit committee composed of a minimum of three members.2 In France, the Vienot I & II Reports (1995, 1999) state that the audit committee should: i) include for at least one-third of independent directors with a minimum of three members; ii) examine the consistency and the relevance of the accounting methods and the reliability of internal control and reporting systems with a special focus on transactions potentially associated with conflicts of interests; iii) meet privately with the CFO, internal and external auditors and appreciate the independence of the latters. The Bouton Report (2002) suggests independent, competent and active audit committee and advo-cates an objective of two-thirds of independent directors in the audit committee. A number of French studies (Piot, 2004; Piot and Janin, 2007; Maraghni and Nekhili, 2014) provide evidence that audit committee adds to the quality of the audit process by coordinating the internal and external audits, and by protecting external auditors’ independence from managerial pressure.
The audit committee independence contributes to improve the quality of information flows from the agent to the principal which reduces agency costs and managerial entrenchment risk (Choi et al. 2014; Cai et al. 2015). Moreover, the monitoring effect related to audit committee independence contributes to more transpar-ency, less information asymmetry and then a lower idiosyncratic risk. This fact leads ceteris paribus, to higher value of the firm (Chan and Li, 2008). Consistent with this conjecture, Bronson et al. (2009) examine the level of monitoring benefits arising from a partial independent committee, and find that, in financial dis-tressed firms, the higher level of audit committee effectiveness is only associated with a completely independent audit committee. Yeh et al. (2011) underline that the market performance during the crisis period is higher for financial institutions with more independent directors on audit and risk committee.
Cai et al. (2015) investigate the agency costs of corporate ownership structure and the role of audit committees in miti-gating their effect. They find that audit committees complement existing internal governance systems, substitute for inefficient external regulatory environments and are value relevant. This view is corroborated by DeFond et al. (2005) who report that the market values financial expertise on audit committees. Moreover, Chan and Li (2008) show that the presence of expert-independent directors in the audit committee enhances firm value. Aldamen et al. (2012) find that smaller audit committees with more experience and financial expertise are more likely to be associated with positive firm market performance.
In reference to the Article L.823-19 of the French Commercial Code (FCC), the board of directors decides on the audit com-mittee composition. Some competences are required such as academic background and professional experience in the field of finance, accounting, internal control and risk management. However, this FCC doesn’t specify the exact number of members in this committee, but only recommends a minimum number of independent members. Our study is thus concerned by this specificity in the French market. To the extent that the audit
committee is a subgroup of the board of directors, we presume that a greater proportion of independent directors on the audit committee may lead to higher firm performance. Therefore, our H2 hypothesis can be stated as:
H2: A greater audit committee’s independence leads to higher firm equity returns.
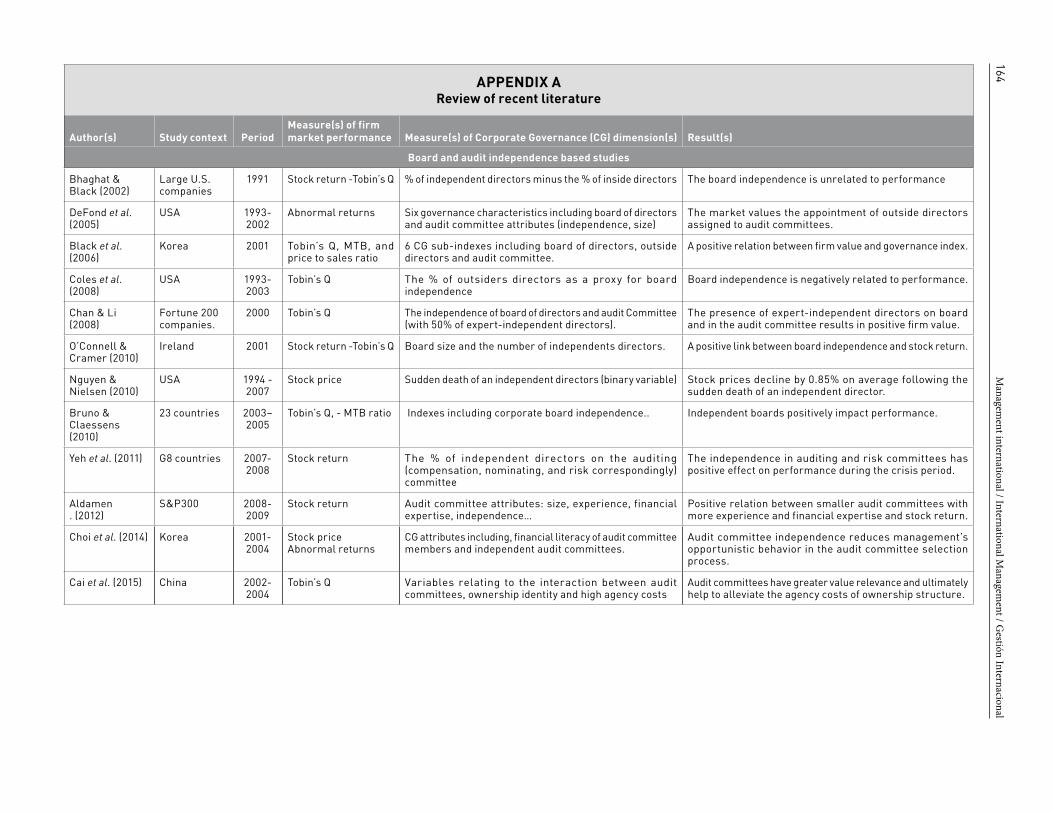
Overall, the literature review underlines research strands that disagree on whether corporate governance affects firm market performance. Appendix A summarizes major relevant studies.
Methodology and resultsOur testing hypotheses involve the examination of the link between firm market performance and board of directors and audit committee characteristics in the French context. We use governance-sorted portfolio procedure and compare portfolio formed by well governed firms to the one formed by poorly governed firms. In reference to the extant literature, we assume that good governance contributes to higher firm equity returns.
We first collect the percentage of independent directors in both the corporate board and the audit committee for the sample of firms under consideration. We then classify each individual firm into one of the three portfolios sorted with respect to the percentage of independent directors on the board and the audit committee. A Carhart’s (1997) four factor pricing model (market risk premium, size risk premium, value risk premium, and momentum risk premium) is set up to explain the monthly excess returns on portfolios sorted by board of directors and audit committee independence. Specifically, we focused on the model estimation of the Jensen’s alpha (1968) that measures the abnormal returns generated by the different sorted portfolios. Note that the explanatory power of these pricing factors on stock returns has been proved in a number of past studies (Fama and French, 1993; Jegadeesh and Titman, 1993; Doukas and McKnight, 2005; Avramov and Chordia, 2006; Zhang, 2006; Fama and French, 2008).
Data and sample selectionOur sample includes French listed companies from the SBF120 index over the period January 2005–December 2012. We eli-minate the financial and banking firms (SIC codes between 6000 and 6999) from our sample, given that they have different financial, operating, and risk characteristics. Companies with missing governance data for the whole period study are also excluded. Our final sample includes 95 firms. Board characte-ristics are manually gathered from firms’ annual reports. We test the effects of board characteristics on firm market perfor-mance by using the four factor pricing model as in Gompers et al. (2003). The construction of the four risk factors requires sorting portfolios by size, book-to-market, and momentum. To this end, we use accounting and financial data collected from the Thomson One Banker database. Historical stock prices are obtained from Datastream database. The French 1-month T-bill rate is used as the risk-free asset.
2. Articles of incorporation, sometimes called Certificate of Incorporation or the corporate charter, are basic charter and first rules governing the management of a company in the United State and Canada. They are field with the state or other regulatory agency.
156 Management international / International Management / Gestión Internacional
Model specificationThe empirical specification of the Carhart’s (1997) four-factor model for each of the four portfolios sorted by board charac-teristics is given by:
Portfolio risk premium = f(Market risk premium, Size risk premium, Value risk premium, Momentum risk premium)
Ri,t-RF,t = αi,t + βi (Rm,t - RF,t) + βSMBi SMBt + βHMLi HMLt + βWMLi WMLt + εi,t
Where αi,t, (Ri,t-RF,t) and (Rm,t - RF,t) refer to the constant term, the monthly return on the sorted portfolio i in excess of the risk free rate, and the market risk premium measured by the monthly return on the market portfolio in excess of the risk free rate, respectively. Apart from the market risk factor, the model incorporate three other risk factors: size factor (Small size minus Big size - SMB), the value factor (High book-to-market minus Low Book-to-market - HML), and the momen-tum factor (Winner stocks minus Loser stocks - WML). The coefficients βi, βSMBi, βHMLi, and βWMLi, capture the sensitivity of sorted portfolio returns to the variations in risk factors.
Dependent and independent variablesTable 1 shows the definitions and the measurement of dependent and independent variables we use in our study.
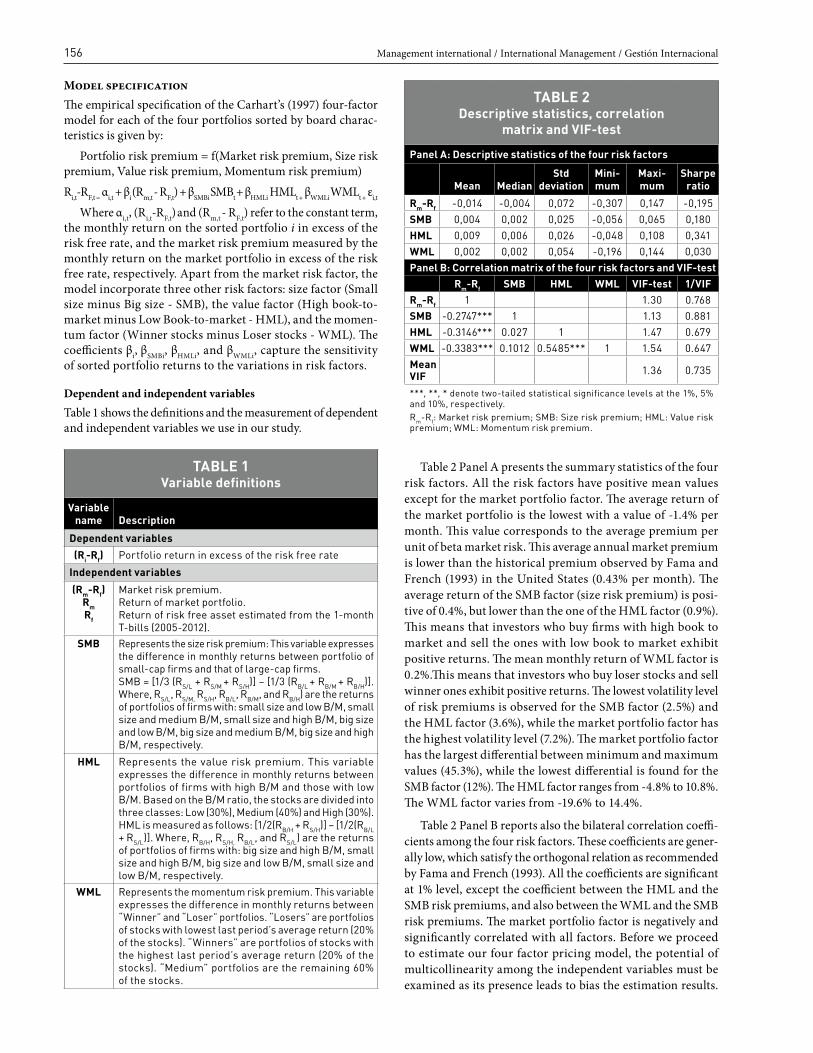
Table 2 Panel A presents the summary statistics of the four risk factors. All the risk factors have positive mean values except for the market portfolio factor. The average return of the market portfolio is the lowest with a value of -1.4% per month. This value corresponds to the average premium per unit of beta market risk. This average annual market premium is lower than the historical premium observed by Fama and French (1993) in the United States (0.43% per month). The average return of the SMB factor (size risk premium) is posi-tive of 0.4%, but lower than the one of the HML factor (0.9%). This means that investors who buy firms with high book to market and sell the ones with low book to market exhibit positive returns. The mean monthly return of WML factor is 0.2%.This means that investors who buy loser stocks and sell winner ones exhibit positive returns. The lowest volatility level of risk premiums is observed for the SMB factor (2.5%) and the HML factor (3.6%), while the market portfolio factor has the highest volatility level (7.2%). The market portfolio factor has the largest differential between minimum and maximum values (45.3%), while the lowest differential is found for the SMB factor (12%). The HML factor ranges from -4.8% to 10.8%. The WML factor varies from -19.6% to 14.4%.
Table 2 Panel B reports also the bilateral correlation coeffi-cients among the four risk factors. These coefficients are gener-ally low, which satisfy the orthogonal relation as recommended by Fama and French (1993). All the coefficients are significant at 1% level, except the coefficient between the HML and the SMB risk premiums, and also between the WML and the SMB risk premiums. The market portfolio factor is negatively and significantly correlated with all factors. Before we proceed to estimate our four factor pricing model, the potential of multicollinearity among the independent variables must be examined as its presence leads to bias the estimation results.
TABLE 1 Variable definitions
Variable name Description
Dependent variables
(Ri-Rf) Portfolio return in excess of the risk free rate
Independent variables
(Rm-Rf)RmRf
Market risk premium. Return of market portfolio.Return of risk free asset estimated from the 1-month T-bills (2005-2012).
SMB Represents the size risk premium: This variable expresses the difference in monthly returns between portfolio of small-cap firms and that of large-cap firms.SMB = [1/3 (RS/L + RS/M + RS/H)] – [1/3 (RB/L + RB/M + RB/H)]. Where, RS/L, RS/M, RS/H, RB/L, RB/M, and RB/H) are the returns of portfolios of firms with: small size and low B/M, small size and medium B/M, small size and high B/M, big size and low B/M, big size and medium B/M, big size and high B/M, respectively.
HML Represents the value risk premium. This variable expresses the difference in monthly returns between portfolios of firms with high B/M and those with low B/M. Based on the B/M ratio, the stocks are divided into three classes: Low (30%), Medium (40%) and High (30%). HML is measured as follows: [1/2(RB/H + RS/H)] – [1/2(RB/L + RS/L)]. Where, RB/H, RS/H, RB/L, and RS/L) are the returns of portfolios of firms with: big size and high B/M, small size and high B/M, big size and low B/M, small size and low B/M, respectively.
WML Represents the momentum risk premium. This variable expresses the difference in monthly returns between “Winner” and “Loser” portfolios. “Losers” are portfolios of stocks with lowest last period’s average return (20% of the stocks). “Winners” are portfolios of stocks with the highest last period’s average return (20% of the stocks). “Medium” portfolios are the remaining 60% of the stocks.
TABLE 2Descriptive statistics, correlation
matrix and VIF-test
Panel A: Descriptive statistics of the four risk factors
Mean MedianStd
deviationMini-mum
Maxi-mum
Sharpe ratio
Rm-Rf -0,014 -0,004 0,072 -0,307 0,147 -0,195SMB 0,004 0,002 0,025 -0,056 0,065 0,180HML 0,009 0,006 0,026 -0,048 0,108 0,341WML 0,002 0,002 0,054 -0,196 0,144 0,030Panel B: Correlation matrix of the four risk factors and VIF-test
Rm-Rf SMB HML WML VIF-test 1/VIFRm-Rf 1 1.30 0.768SMB -0.2747*** 1 1.13 0.881HML -0.3146*** 0.027 1 1.47 0.679WML -0.3383*** 0.1012 0.5485*** 1 1.54 0.647Mean VIF 1.36 0.735
***, **, * denote two-tailed statistical significance levels at the 1%, 5% and 10%, respectively.Rm-Rf: Market risk premium; SMB: Size risk premium; HML: Value risk premium; WML: Momentum risk premium.
Corporate Governance and Equity Prices: The Effect of Board of Directors and Audit Committee Independence 157
The variance inflation factor (VIF), which measures the part of variance that an independent variable shares with the other ones, is thus used to detect the multicollinearity problem. We underline that the values of VIF for different specifications do not exceed 1.54, which indicate the absence of multicollinear-ity among the independent variables (see table 2, panel B ). Therefore, all the independent variables (Rm-Rf, SMB, HML, WML) are orthogonal to each other which leads to accurate estimates for the four factor pricing model.
Sorted portfolios and uni-criterion analysis
We construct four sorted portfolios to separately test the effect of the board of directors and the audit committee inde-pendence on the portfolio returns. The composition of these portfolios is based, on the percentage of independents in the board of directors on the one hand, and on the percentage of independent directors in the audit committee on the other hand, such as:
• PLB: Portfolio of firms with the lowest level of board independence: the % of independent directors < median (1).
• PHB: Portfolio of firms with the highest level of board independence: the % of independent directors > median (1).
• PLA: Portfolio of firms with the lowest level of audit committee independence: the % of independent directors < median (2).
• PHA: Portfolio of firms with the highest level of audit commit-tee independence: the % of independent directors > median (2).
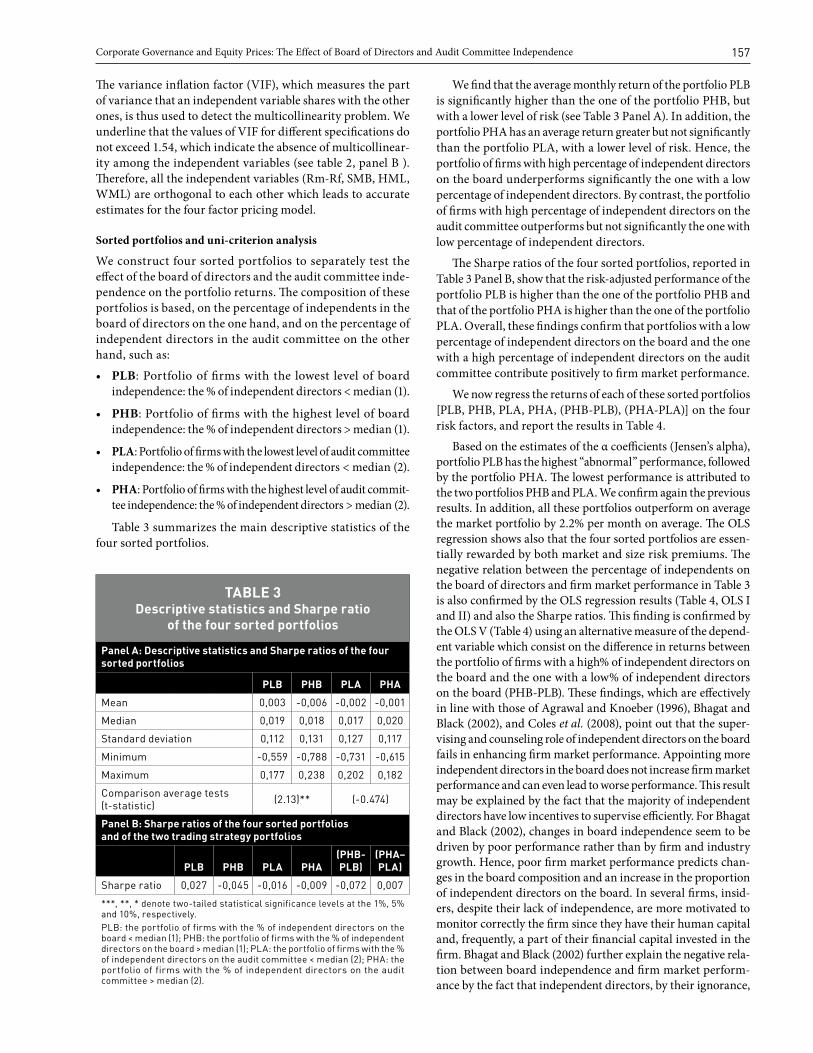
Table 3 summarizes the main descriptive statistics of the four sorted portfolios.
We find that the average monthly return of the portfolio PLB is significantly higher than the one of the portfolio PHB, but with a lower level of risk (see Table 3 Panel A). In addition, the portfolio PHA has an average return greater but not significantly than the portfolio PLA, with a lower level of risk. Hence, the portfolio of firms with high percentage of independent directors on the board underperforms significantly the one with a low percentage of independent directors. By contrast, the portfolio of firms with high percentage of independent directors on the audit committee outperforms but not significantly the one with low percentage of independent directors.
The Sharpe ratios of the four sorted portfolios, reported in Table 3 Panel B, show that the risk-adjusted performance of the portfolio PLB is higher than the one of the portfolio PHB and that of the portfolio PHA is higher than the one of the portfolio PLA. Overall, these findings confirm that portfolios with a low percentage of independent directors on the board and the one with a high percentage of independent directors on the audit committee contribute positively to firm market performance.
We now regress the returns of each of these sorted portfolios [PLB, PHB, PLA, PHA, (PHB-PLB), (PHA-PLA)] on the four risk factors, and report the results in Table 4.
Based on the estimates of the α coefficients (Jensen’s alpha), portfolio PLB has the highest “abnormal” performance, followed by the portfolio PHA. The lowest performance is attributed to the two portfolios PHB and PLA. We confirm again the previous results. In addition, all these portfolios outperform on average the market portfolio by 2.2% per month on average. The OLS regression shows also that the four sorted portfolios are essen-tially rewarded by both market and size risk premiums. The negative relation between the percentage of independents on the board of directors and firm market performance in Table 3 is also confirmed by the OLS regression results (Table 4, OLS I and II) and also the Sharpe ratios. This finding is confirmed by the OLS V (Table 4) using an alternative measure of the depend-ent variable which consist on the difference in returns between the portfolio of firms with a high% of independent directors on the board and the one with a low% of independent directors on the board (PHB-PLB). These findings, which are effectively in line with those of Agrawal and Knoeber (1996), Bhagat and Black (2002), and Coles et al. (2008), point out that the super-vising and counseling role of independent directors on the board fails in enhancing firm market performance. Appointing more independent directors in the board does not increase firm market performance and can even lead to worse performance. This result may be explained by the fact that the majority of independent directors have low incentives to supervise efficiently. For Bhagat and Black (2002), changes in board independence seem to be driven by poor performance rather than by firm and industry growth. Hence, poor firm market performance predicts chan-ges in the board composition and an increase in the proportion of independent directors on the board. In several firms, insid-ers, despite their lack of independence, are more motivated to monitor correctly the firm since they have their human capital and, frequently, a part of their financial capital invested in the firm. Bhagat and Black (2002) further explain the negative rela-tion between board independence and firm market perform-ance by the fact that independent directors, by their ignorance,
TABLE 3Descriptive statistics and Sharpe ratio
of the four sorted portfolios
Panel A: Descriptive statistics and Sharpe ratios of the four sorted portfolios
PLB PHB PLA PHA
Mean 0,003 -0,006 -0,002 -0,001
Median 0,019 0,018 0,017 0,020
Standard deviation 0,112 0,131 0,127 0,117
Minimum -0,559 -0,788 -0,731 -0,615
Maximum 0,177 0,238 0,202 0,182
Comparison average tests (t-statistic) (2.13)** (-0.474)
Panel B: Sharpe ratios of the four sorted portfolios and of the two trading strategy portfolios
PLB PHB PLA PHA(PHB- PLB)
(PHA– PLA)
Sharpe ratio 0,027 -0,045 -0,016 -0,009 -0,072 0,007
***, **, * denote two-tailed statistical significance levels at the 1%, 5% and 10%, respectively.PLB: the portfolio of firms with the % of independent directors on the board < median (1); PHB: the portfolio of firms with the % of independent directors on the board > median (1); PLA: the portfolio of firms with the % of independent directors on the audit committee < median (2); PHA: the portfolio of firms with the % of independent directors on the audit committee > median (2).

158 Management international / International Management / Gestión Internacional
act speedily and wrongly following a difficulty. Hermalin and Weisbach (1991) suggest that both insiders and outsiders can-not succeed in representing shareholders’ interests correctly, and think that we should not suppose that outsiders are better than insiders in the protection of shareholders’ interests. Several authors underline that the proportion of independent directors is related negatively to firm market performance and argue that firms tend to integrate too many independent directors given that the proportion of independent directors is supposed maxi-mizing firm value (Agrawal and Knoeber, 1996 and Coles et al. 2008). Moreover, these authors think that political reasons tend sometimes, to increase the proportion of independent directors on the board by including politicians, consumer activists, etc.
The comparison average tests in Table 3 Panel A show also that the percentage of independent directors in the audit com-mittee is positively but not significantly related to firm market performance. OLS regression results (Table 4, OLS III and IV) indicate that firms with high% of independent directors on the audit committee experience a higher Jensen’s alpha than those with low% of independent directors on the audit committee. We use an alternative measure of the dependent variable which consists on the difference in returns between the portfolio of firms with high% of independent directors on the audit committee and the one with low% of independent directors on the audit committee (PHA-PLA). The previews finding is confirmed by the regression VI (Table 4 Panel A) which suggests a positive and significant relation between the percentage of independent directors on the audit committee and the firm market performance. Our results are in line with those of DeFond et al. (2005) and Chan and Li (2008) who find a positive and significant relation between the
appointment of outside directors and the firm market perform-ance. This relation is found to be more effective for the audit com-mittee than for the board of directors. Independent directors on the audit committee strengthen the choice of accounting policies and grant objective monitoring since they are influenced neither by economic nor personal relation with the firm’s management. Their financial backgrounds help them in well monitoring risk and improving the quality of financial reporting (Klein, 2002; DeFond et al. 2005). Other studies show that firms with high percentage of insiders on the audit committee tend often to modify external auditors after the reception of a going-concern report (Carcello and Neal, 2000; Lahaije, 2010). Additionally, independent directors, with their expertise, ameliorate the process of decision making and reduce agency problems (Choi et al. 2014; Cai et al. 2015).
Overall, the results in Table 4 suggest that, firms with low percentage of independent directors in the board outperform those with high percentage of independent directors and that, firms with high percentage of independent directors on the audit committee, exhibit higher market performance than those with low audit committee independence.
Dual characteristics and sorted portfolios
We divide our sample into four portfolios according to both the percentage of independents on the board of directors and on the audit committee:
• P-LBLA: includes firms with a% of independent directors on the board < median (1) and a% of independent directors on the audit committee < median (2).
TABLE 4OLS regression results
Dependent variable: Sorted portfolio return
I I I I I I IVAlternative tests
V VIPLB PHB PLA PHA (PHB-PLB) (PHA–PLA)
Intercept 0,024*** 0,020** 0,021** 0,022*** -0,004 0,013**(2,74) (2,02) (2,15) (2,54) (-0,88) (1,97)
Rm-Rf 1,145*** 1,383*** 1,299*** 1,231*** 0,238*** 0,743***(9,45) (9,96) (9,39) (10,03) (4,02) (7,72)
SMB -0,656** -0,598* -0,588* -0,648** 0,058 -0,511**(-1,99) (-1,69) (-1,66) (-1,97) (0,36) (-1,95)
HML -0,220 -0,409 -0,283 -0,300 -0,188 0,230(-0,63) (-1,02) (-0,71) (-0,85) (-1,1) (0,83)
WML 0,092 0,036 0,069 0,069 -0,056 0,097(0,52) (0,18) (0,34) (0,38) (-0,65) (0,69)
Adjusted R2 57.91% 59.54% 56.88% 60.49% 19.12% 48.46%Fisher Test 31.30 33.48 30.01 34.82 6.01 22.33Nb. Obs. 96 96 96 96 96 96
***, **, * denote two-tailed statistical significance levels at the 1%, 5% and 10%, respectively.Rm-Rf: Market risk premium; SMB: Size risk premium; HML: Value risk premium; WML: Momentum risk premium; PLB: the portfolio of firms with the % of independent directors on the board < median (1); PHB: the portfolio of firms with the % of independent directors on the board > median (1); PLA: the portfolio of firms with the % of independent directors on the audit committee < median (2); PHA: the portfolio of firms with the % of independent directors on the audit committee > median (2). (PHB-PLB) is an alternative dependent variable that represents the difference in return between the portfolio of firms with a high % of independent directors on the board and the one with a low % of independent directors on the board. (PHA-PLA) is an alternative dependent variable that represents the difference in return between the portfolio of firms with the high % of independent directors on the audit committee and the one with a low % of independent directors on the audit committee.
Corporate Governance and Equity Prices: The Effect of Board of Directors and Audit Committee Independence 159
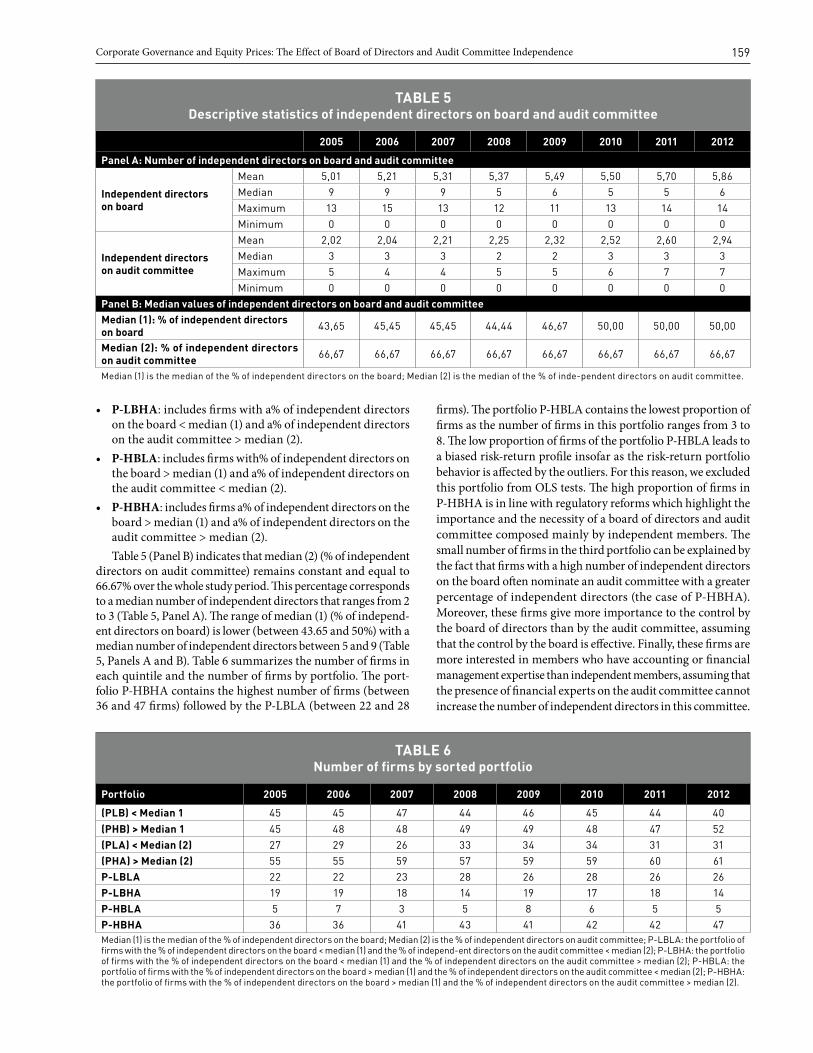
• P-LBHA: includes firms with a% of independent directors on the board < median (1) and a% of independent directors on the audit committee > median (2).
• P-HBLA: includes firms with% of independent directors on the board > median (1) and a% of independent directors on the audit committee < median (2).
• P-HBHA: includes firms a% of independent directors on the board > median (1) and a% of independent directors on the audit committee > median (2).Table 5 (Panel B) indicates that median (2) (% of independent
directors on audit committee) remains constant and equal to 66.67% over the whole study period. This percentage corresponds to a median number of independent directors that ranges from 2 to 3 (Table 5, Panel A). The range of median (1) (% of independ-ent directors on board) is lower (between 43.65 and 50%) with a median number of independent directors between 5 and 9 (Table 5, Panels A and B). Table 6 summarizes the number of firms in each quintile and the number of firms by portfolio. The port-folio P-HBHA contains the highest number of firms (between 36 and 47 firms) followed by the P-LBLA (between 22 and 28
firms). The portfolio P-HBLA contains the lowest proportion of firms as the number of firms in this portfolio ranges from 3 to 8. The low proportion of firms of the portfolio P-HBLA leads to a biased risk-return profile insofar as the risk-return portfolio behavior is affected by the outliers. For this reason, we excluded this portfolio from OLS tests. The high proportion of firms in P-HBHA is in line with regulatory reforms which highlight the importance and the necessity of a board of directors and audit committee composed mainly by independent members. The small number of firms in the third portfolio can be explained by the fact that firms with a high number of independent directors on the board often nominate an audit committee with a greater percentage of independent directors (the case of P-HBHA). Moreover, these firms give more importance to the control by the board of directors than by the audit committee, assuming that the control by the board is effective. Finally, these firms are more interested in members who have accounting or financial management expertise than independent members, assuming that the presence of financial experts on the audit committee cannot increase the number of independent directors in this committee.
TABLE 5Descriptive statistics of independent directors on board and audit committee
2005 2006 2007 2008 2009 2010 2011 2012
Panel A: Number of independent directors on board and audit committee
Independent directors on board
Mean 5,01 5,21 5,31 5,37 5,49 5,50 5,70 5,86Median 9 9 9 5 6 5 5 6Maximum 13 15 13 12 11 13 14 14Minimum 0 0 0 0 0 0 0 0
Independent directors on audit committee
Mean 2,02 2,04 2,21 2,25 2,32 2,52 2,60 2,94Median 3 3 3 2 2 3 3 3Maximum 5 4 4 5 5 6 7 7Minimum 0 0 0 0 0 0 0 0
Panel B: Median values of independent directors on board and audit committeeMedian (1): % of independent directors on board 43,65 45,45 45,45 44,44 46,67 50,00 50,00 50,00
Median (2): % of independent directors on audit committee 66,67 66,67 66,67 66,67 66,67 66,67 66,67 66,67
Median (1) is the median of the % of independent directors on the board; Median (2) is the median of the % of inde-pendent directors on audit committee.
TABLE 6Number of firms by sorted portfolio
Portfolio 2005 2006 2007 2008 2009 2010 2011 2012
(PLB) < Median 1 45 45 47 44 46 45 44 40
(PHB) > Median 1 45 48 48 49 49 48 47 52(PLA) < Median (2) 27 29 26 33 34 34 31 31(PHA) > Median (2) 55 55 59 57 59 59 60 61P-LBLA 22 22 23 28 26 28 26 26P-LBHA 19 19 18 14 19 17 18 14P-HBLA 5 7 3 5 8 6 5 5P-HBHA 36 36 41 43 41 42 42 47Median (1) is the median of the % of independent directors on the board; Median (2) is the % of independent directors on audit committee; P-LBLA: the portfolio of firms with the % of independent directors on the board < median (1) and the % of independ-ent directors on the audit committee < median (2); P-LBHA: the portfolio of firms with the % of independent directors on the board < median (1) and the % of independent directors on the audit committee > median (2); P-HBLA: the portfolio of firms with the % of independent directors on the board > median (1) and the % of independent directors on the audit committee < median (2); P-HBHA: the portfolio of firms with the % of independent directors on the board > median (1) and the % of independent directors on the audit committee > median (2).
160 Management international / International Management / Gestión Internacional
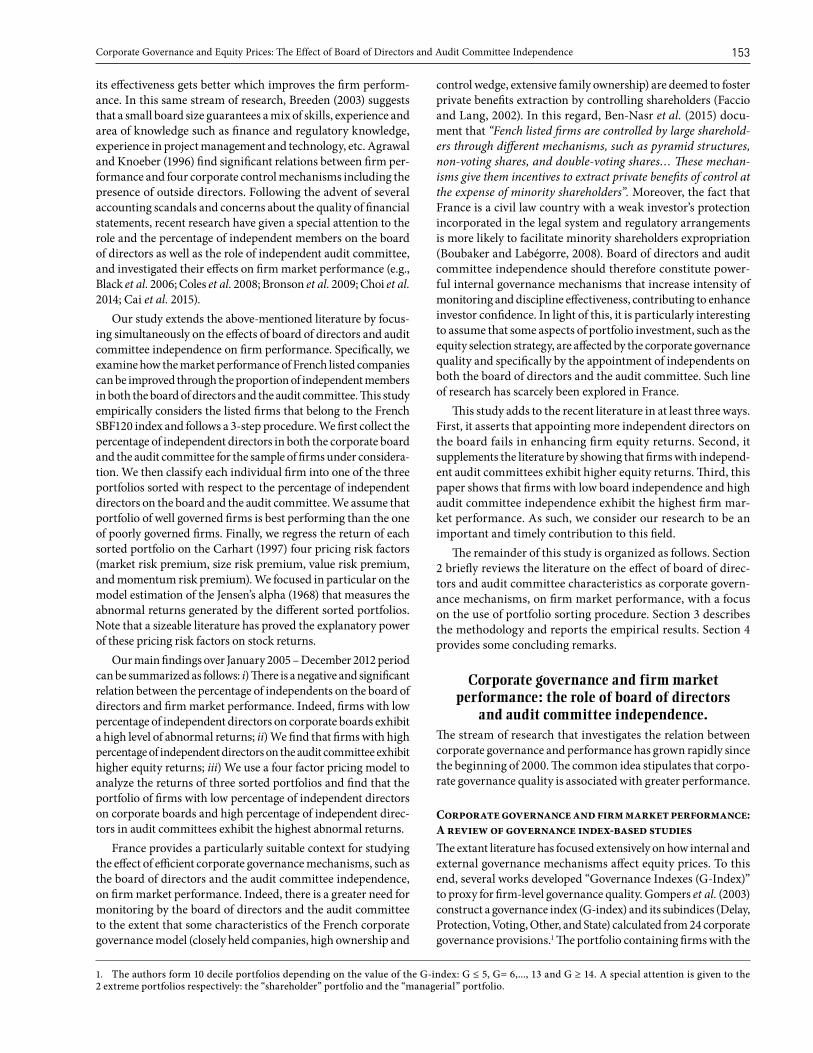
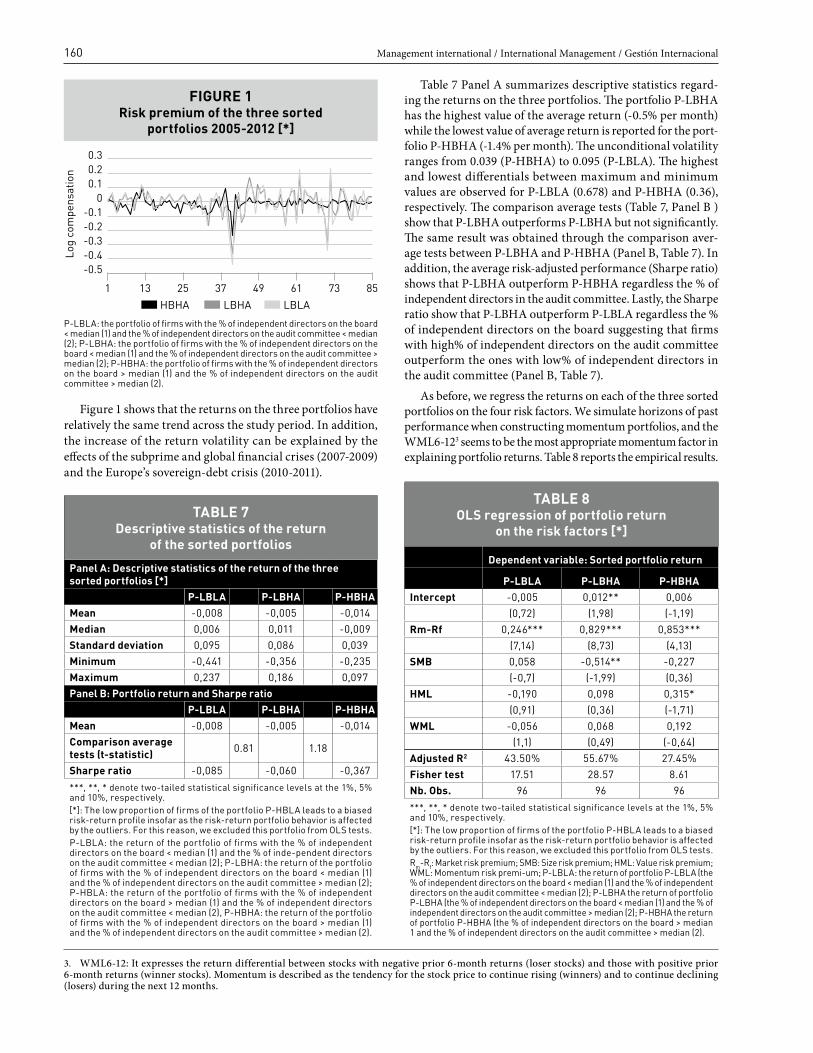
Figure 1 shows that the returns on the three portfolios have relatively the same trend across the study period. In addition, the increase of the return volatility can be explained by the effects of the subprime and global financial crises (2007-2009) and the Europe’s sovereign-debt crisis (2010-2011).
Table 7 Panel A summarizes descriptive statistics regard-ing the returns on the three portfolios. The portfolio P-LBHA has the highest value of the average return (-0.5% per month) while the lowest value of average return is reported for the port-folio P-HBHA (-1.4% per month). The unconditional volatility ranges from 0.039 (P-HBHA) to 0.095 (P-LBLA). The highest and lowest differentials between maximum and minimum values are observed for P-LBLA (0.678) and P-HBHA (0.36), respectively. The comparison average tests (Table 7, Panel B ) show that P-LBHA outperforms P-LBHA but not significantly. The same result was obtained through the comparison aver-age tests between P-LBHA and P-HBHA (Panel B, Table 7). In addition, the average risk-adjusted performance (Sharpe ratio) shows that P-LBHA outperform P-HBHA regardless the % of independent directors in the audit committee. Lastly, the Sharpe ratio show that P-LBHA outperform P-LBLA regardless the % of independent directors on the board suggesting that firms with high% of independent directors on the audit committee outperform the ones with low% of independent directors in the audit committee (Panel B, Table 7).
As before, we regress the returns on each of the three sorted portfolios on the four risk factors. We simulate horizons of past performance when constructing momentum portfolios, and the WML6-123 seems to be the most appropriate momentum factor in explaining portfolio returns. Table 8 reports the empirical results.
TABLE 7Descriptive statistics of the return
of the sorted portfolios
Panel A: Descriptive statistics of the return of the three sorted portfolios [*]
P-LBLA P-LBHA P-HBHAMean -0,008 -0,005 -0,014Median 0,006 0,011 -0,009Standard deviation 0,095 0,086 0,039Minimum -0,441 -0,356 -0,235Maximum 0,237 0,186 0,097Panel B: Portfolio return and Sharpe ratio
P-LBLA P-LBHA P-HBHAMean -0,008 -0,005 -0,014Comparison average tests (t-statistic) 0.81 1.18
Sharpe ratio -0,085 -0,060 -0,367
***, **, * denote two-tailed statistical significance levels at the 1%, 5% and 10%, respectively.[*]: The low proportion of firms of the portfolio P-HBLA leads to a biased risk-return profile insofar as the risk-return portfolio behavior is affected by the outliers. For this reason, we excluded this portfolio from OLS tests.P-LBLA: the return of the portfolio of firms with the % of independent directors on the board < median (1) and the % of inde-pendent directors on the audit committee < median (2); P-LBHA: the return of the portfolio of firms with the % of independent directors on the board < median (1) and the % of independent directors on the audit committee > median (2); P-HBLA: the return of the portfolio of firms with the % of independent directors on the board > median (1) and the % of independent directors on the audit committee < median (2), P-HBHA: the return of the portfolio of firms with the % of independent directors on the board > median (1) and the % of independent directors on the audit committee > median (2).
P-LBLA: the portfolio of firms with the % of independent directors on the board < median (1) and the % of independent directors on the audit committee < median (2); P-LBHA: the portfolio of firms with the % of independent directors on the board < median (1) and the % of independent directors on the audit committee > median (2); P-HBHA: the portfolio of firms with the % of independent directors on the board > median (1) and the % of independent directors on the audit committee > median (2).
-0.5
1 13
HBHA LBHA LBLA
Log
com
pens
atio
n
493725 61 73 85
-0.4-0.3-0.2-0.1
00.10.20.3
FIGURE 1Risk premium of the three sorted
portfolios 2005-2012 [*]
TABLE 8OLS regression of portfolio return
on the risk factors [*]
Dependent variable: Sorted portfolio return
P-LBLA P-LBHA P-HBHAIntercept -0,005 0,012** 0,006
(0,72) (1,98) (-1,19)Rm-Rf 0,246*** 0,829*** 0,853***
(7,14) (8,73) (4,13)SMB 0,058 -0,514** -0,227
(-0,7) (-1,99) (0,36)HML -0,190 0,098 0,315*
(0,91) (0,36) (-1,71)WML -0,056 0,068 0,192
(1,1) (0,49) (-0,64)Adjusted R2 43.50% 55.67% 27.45%Fisher test 17.51 28.57 8.61Nb. Obs. 96 96 96
***, **, * denote two-tailed statistical significance levels at the 1%, 5% and 10%, respectively.[*]: The low proportion of firms of the portfolio P-HBLA leads to a biased risk-return profile insofar as the risk-return portfolio behavior is affected by the outliers. For this reason, we excluded this portfolio from OLS tests.Rm-Rf: Market risk premium; SMB: Size risk premium; HML: Value risk premium; WML: Momentum risk premi-um; P-LBLA: the return of portfolio P-LBLA (the % of independent directors on the board < median (1) and the % of independent directors on the audit committee < median (2); P-LBHA the return of portfolio P-LBHA (the % of independent directors on the board < median (1) and the % of independent directors on the audit committee > median (2); P-HBHA the return of portfolio P-HBHA (the % of independent directors on the board > median 1 and the % of independent directors on the audit committee > median (2).
3. WML6-12: It expresses the return differential between stocks with negative prior 6-month returns (loser stocks) and those with positive prior 6-month returns (winner stocks). Momentum is described as the tendency for the stock price to continue rising (winners) and to continue declining (losers) during the next 12 months.

Corporate Governance and Equity Prices: The Effect of Board of Directors and Audit Committee Independence 161
The estimated values of α coefficients (Jensen’s alpha) rep-resent the abnormal return in excess related to a buy-and-hold portfolio taking the risk factors into account. Portfolio P-LBHA is the only one that has a positive and significant Jensen’s alpha. It outperforms the market portfolio by 1.2% per monthly. The two other portfolios (P-LBLA and P-HBHA) do not exhibit significant abnormal returns. This finding implies that the portfolio P-LBHA generates a superior performance over the other portfolios, i.e., firms with low% of independent directors on board and high% of independent directors in audit committee experience the highest market performance. Compared to P-LBLA, the finding regarding P-LBHA indicates the specific effect of the high% of independent directors in audit committee on the firm market performance. With respect to the underperformance of the portfolio P-HBHA, Aman and Nguyen (2008) document that high board of directors and audit committee independence fails in enhancing firm equity returns. The authors explain these findings by the overvaluation of well-governed firms and the lower risk exposure of these firms.
The OLS regression results also show that all sorted portfolios are rewarded with a positive market premium and a negative size risk premium. The HML factor affects significantly and negatively the portfolio P-HBHA returns (portfolio of firms with high% of independents on both board of directors and audit committee). The latter result indicates that these firms have a low level of dis-tress risk. Finally, there is no significant effect of the momentum factor on the three portfolios. Overall, the different specification tests show a level of adjusted R2
between 27.45% and 55.67% and a good statistical fit of the model specifications (Fisher test).
ConclusionIn this paper, we investigate the relation between board inde-pendence, audit committee independence and firm market per-formance in the French context. Indeed, there is a greater need for monitoring by the board of directors and the audit committee to the extent that Fench public firms are controlled by large share-holders through different mechanisms who give them incentives to expropriate minority shareholders. Board of directors and audit committee independence should therefore constitute powerful internal corporate governance mechanisms that play an efficient monitoring role in curbing private benefits extraction by large shareholders, contributing to enhance investor confidence.
Consistent with the extant literature, we assume that well gov-erned firms exhibit higher equity returns than poorly governed firms. Through the implementation of a Carhart’s (1997) four-factor equity pricing model, we estimate the abnormal returns generated by portfolios sorted by board attributes (percentage of independent members on the board of directors and on the audit committee). The best performing firms are those that exhibit the highest abnormal returns. Our results show evidence of a negative and significant relation between the percentage of independents on the board of directors and equity returns. This suggests that high level board independence fails in enhancing firm equity returns. Furthermore, we find that firms with high percentage of independent directors on the audit committee exhibit higher equity returns. When the percentage of independents on board of directors and the percentage of independent directors on audit committee are simultaneously used to sort portfolios, we find that the portfolio of firms with low percentage of independent directors on corporate boards and high percentage of independent directors in audit committees exhibit the highest equity returns and outperforms market and size portfolio strategy.
In terms of managerial implications, our results suggest that board of directors and audit committee independence affect firm market performance and thereby shareholder wealth. They also help investors to price assets more accurately and implement efficient portfolio selection strategy. Future research could examine also the percentage of independent directors on nomination commit-tee and remuneration committee. Besides, studying the European markets may provide the effect of the contextual characteristics and could lead to very useful conclusions and implications.
ReferencesAgrawal, Agrawal; Knoeber, Charles R. (1996). “Firm Performance
and Mechanisms to Control Agency Problems between Managers and Shareholders”, The Journal of Financial and Quantitative Analysis, Vol.31, N° 3, p. 377-397.
Aldamen, Husam; Duncan, Keith; Kelly Simone; Mcnamara, Ray; Nagel Stephan (2012). “Audit committee characteristics and firm performance during the global financial crisis”, Accounting and Finance, Vol. 52, N°4, p. 971-1000.
Aman, Hiroyuki; Nguyen, Pascal (2008). “Do stock prices reflect the corporate governance quality of Japanese firms?”, Journal of the Japanese and International Economies, Vol. 22, N°4, p. 647-662.
Ammann, Manuel; Oesch, David; Shmid, Markus M. (2011). “Corporate governance and firm value: International evidence”, Journal of Empirical Finance, Vol. 18, N°1, p. 36-55.
Avramov, Doron; Chordia, Tarun (2006). “Asset pricing models and financial market anomalies”, Review of Financial Studies, Vol. 19, N°3, p. 1001-1040.
Bai, Chong-En; Liu, Qiao; Lu, Joe; Song, Frank M.; Zhang, Junxi (2003). “Corporate governance and markets valuation in china”, Journal of Comparative Economics, Vol. 32, N°4, p.599-825.
Bauer, Rob; Guenster, Nadja; Otten, Rogér (2004). “Empirical evidence on corporate governance in Europe: the effect on stock returns, firm value and performance”, Journal of asset mana-gement, Vol. 5, N° 2, p.91-104.
Bebchuk, Lucian; Cohen, Alma; Ferrell, Allen (2009). “What Matters in Corporate Governance?”, Review of Financial Studies, Vol. 22, N° 2, p. 783-827.
Ben-Nasr, Hamdi; Boubaker, Sabri; Rouatbi, Wael (2015). “Ownership Structure, Control Contestability and Debt Maturity Structure”, Journal of Corporate Finance, Vol.35, p.265-285.
Beiner, Stefan; Drobetz, Wolfgang; Schmid, Markus M.; Zimmermann, Heinz (2006). “An integrated framework of corporate governance and firm valuation”, European Financial Management, Vol. 12, N° 2, p. 249-283.
Bhagat, Sanjai; Black, Bernard S. (2002). “The non-correlation between board independence and long-term firm performance”, Journal of Corporation Law, Vol. 27, N°23, p. 231-273.
Black, Bernard S.; Jang, Hasung; Kim, Woochan (2006). “Does Corporate Governance Predict Firms’ Market Values? Evidence from Korea”, Journal of Law, Economics and Organization, Vol. 22, N°2, p.366-413.
Boubaker, Sabri; Labegorre, Florence (2008). “Ownership structure, corporate governance and analyst following: A study of French listed firms”, Journal of Banking & Finance, Vol. 32, N°6, p.961-976.
Bouton, Daniel (2002). “Pour une meilleure gouvernance des entreprises cotées”, Rapport Bouton, MEDEF & AFEP-AGREF.
Breeden, Richard C. (2003). “Restoring Trust - The Breeden Report on Corporate Governance for the future of MCI, Inc”, The United States District Court for the Southern District of New York.
162 Management international / International Management / Gestión Internacional
Bronson, Scott N.; Carcello, Joseph V.; Hollingsworth, Carl W.; Neal, Terry L. (2009). “Are fully independent audit com-mittees really necessary?”, Journal of Accounting and Public Policy, Vol. 28, N°4, p.265-280.
Brown, Lawrence D.; Caylor, Marcus L. (2006). “Corporate governance and firm valuation”, Journal of accounting and public policy, Vol. 25, N°4, p. 409-434.
Bruno, Valentina; Claessens, Stijn (2010). “Corporate governance and regulation: can there be too much of a good thing?”, Journal of Financial Intermediation, Vol. 19, N°4, p.461-482.
Carcello, Joseph V.; Neal, Terry L. (2003). “Audit committee characteristics and auditor dismissals following “new” going-concern reports”, The Accounting Review, Vol. 78, N°1, p. 95-117.
Carhart, Mark M. (1997). “On Persistence in Mutual Fund Performance”, The Journal of Finance, Vol. 52, N°1, p. 57-82.
Cai Charlie X.; Hillier, David; Tian, Gaoling; Wu, Qinghua (2015). “Do audit committees reduce the agency costs of ownership structure?”, Pacific-Basin Finance Journal, Vol. 13, p. 225-240.
Chan, Kam C.; Li Joanne (2008). “Audit committee and firm value: Evidence on outside top executives as expert-independent directors”, Corporate Governance: An International Review, Vol. 16, N°1, p.16-31.
Choi, Yoon K.; Han, Seung Hung; Lee, Sangwon (2014). “Audit Committees, Corporate Governance, and Shareholder Wealth: Evidence from Korea”, Journal of Accounting and Public Policy, Vol. 33, N°5, p. 470-489.
Coles, Jeffrey L., Lemmon, Michael L.; Wang, Yan (2008). “The Joint Determinants of Managerial Ownership, Board Independence, and Firm Performance”, Second Singapore International Conference on Finance.
Core, John E.; Guay, Wayne R.; Rusticus, Tjomme O. (2006). “Does Weak Governance Cause Weak Stock Returns? An Examination of Firm Operating Performance and Investors’ Expectations”, The Journal of Finance, Vol. 61, N°2, p.655-687.
Cremers, Martijn K.J.; Nair, Vinay B. (2005). “Governance Mechanisms and Equity Prices”, The Journal of Finance, Vol. 60, N°6, p. 2859-2894.
Defond, Mark L.; Hann, Rebecca N.; Hu Xuesong (2005). “Does the market value financial expertise on audit committees of boards of directors?”, Journal of Accounting Research, Vol. 43, N°2, p. 153-193.
Doukas, John A.; Mcknight, Phillip J. (2005). “European momen-tum strategies, information diffusion, and investor conservatism”, European Financial Management, Vol. 11, N°3, p. 313-338.
Drobetz Wolfgang; Schillhofer, Andreas; Zimmermann Heinz (2004). “Corporate governance and expected stock returns: Evidence from Germany”, European Financial Management, Vol. 10, N°2, p. 267-293.
Durnev, Art; Kim, Han E. (2005). “To steal or not to steal: Firm attributes, legal environment, and valuation”, The Journal of Finance, Vol. 60, N°3, p. 1461-1493.
Eisenberg, Theodore; Sundgren, Stefan; Wells, Martin T. (1998). “Larger board size and decreasing firm value in small firms”, Journal of Financial Economics, Vol. 48, N°1, p. 35-54.
Faccio, Mara; Lang, Larry H.P. (2002). “The Ultimate Ownership of Western European Corporations”, Journal of Financial Economics, Vol. 65, N°3, p. 365-395.
FAMA, Eugene F.; French, Kenneth R. (1993). “Common risk factors in the returns on bonds and stocks”, Journal of Financial Economics, Vol. 33, N°1, p. 3-53.
Fama Eugene F.; French, Kenneth R. (2008). “Dissecting anoma-lies”, Journal of Finance, Vol. 63, N°4, p. 1653-1678.
Fama, Eugene F.; Jensen, Michael C. (1983). “Separation of Ownership and Control”, Journal of Law and Economics, Vol. 26, N°2, p. 301-325.
Giroud, Xavier; Mueller, Holger M. (2011). “Corporate gover-nance, product market competition, and equity prices”, The Journal of Finance, Vol. 66, N°2, p. 563-600.
Gompers, Paul; Ishii, Joy; Metrick, Andrew. (2003). “Corporate Governance and Equity Prices”, Quarterly Journal of Economics, Vol. 118, N°1, p. 107-155.
Hermalin, Benjamin E.; Weisbach, Michael S. (1991). “The Effects of Board Composition and Direct Incentives on Firm Performance”, Financial Management, Vol. 20, N°4, p. 101-112.
Jegadeesh, Narasimhan; Titman, Sheridan. (1993). “Returns to buying winners and selling losers: Implications for stock market efficiency”, The Journal of Finance, Vol. 48, N°1, Vol. 65-92.
Jensen, Michael C. (1993). “The Modern Industrial Revolution, Exit and the Failure of Internal Control Systems”, The Journal of Finance, Vol. 48, N°3, p. 831-880.
Johnson, Shane A.; Moorman, Theodore C.; Sorescu, Sorin. (2009). “A Reexamination of Corporate Governance and Equity Prices”, Review of Financial Studies, Vol. 22, N°11, p. 4753-4786.
Klein, April (2002). “Audit committee, board of director charac-teristics, and earnings management”, Journal of Accounting and Economics, Vol. 33, N°3, p.375-400.
Lahaije Marieke (2010). “Factors influencing audit committee reporting in France and the UK”, Maastricht University, SBE.
Maraghni, Ines; Nekhili, Mehdi (2014). “Audit committee diligence in French companies: a question of independence or competence?”, Comptabilité–Contrôle–Audit, Vol. 20, N°2, p. 99-128.
Nguyen, Bang Dang; Nielsen, Kasper M. (2010). “The value of independent directors: Evidence from sudden deaths”, Journal of Financial Economics, Vol. 98, N°3, p. 550-567.
O’connell, Vincent; Cramer, Nicole. (2010). “The relationship between firm performance and board structure in Ireland”, European Management Journal, Vol. 28, N°5, p.387-399.
Piot, Charles (2004). “The existence and independence of audit committees in France”, Accounting and Business Research, Vol. 34, N°3, p. 223-246.
Piot, Charles; Janin, Rémi (2007). “External Auditors, Audit Committees and Earnings Management in France”, European Accounting Review, Vol. 16, N°2, p. 429-454.
Rosenstein, Stuart; Wyatt, Jeffrey G. (1990). “Outside directors, board independence and shareholder wealth”, Journal of Financial Economics, Vol. 26, N°2, p. 175-191
Shleifer, Andrei; Vishny, Robert W. (1997). “A Survey of Corporate Governance”, The Journal of Finance, Vol. 52, N°2, p. 737-783.
Viénot, Marc (1999). “Recommendations of the Committee on corporate governance (Viénot II)”, The French Association of Private Enterprises (AFEP).
Yeh, Yin-Hua; Chung, Huimin; Liu Chih-Liang (2011). “Committee independence and financial institution performance during the 2007-08 credit crunch: Evidence from a multi-country study”, Corporate Governance: An International Review, Vol. 19, N°5, p. 437-458.
Zhang, Frank X. (2006). “Information uncertainty and stock returns”, The Journal of Finance, Vol. 61, N°1, p. 105-136.
Corporate G
overnance and Equity Prices: The Effect of Board of Directors and Audit C
omm
ittee Independence163
APPENDIX A Review of recent literature
Author(s) Study context PeriodMeasure(s) of firm market performance Measure(s) of Corporate Governance (CG) dimension(s) Result(s)
Governance index-based studies
Bai et al. (2003) China 2000 Tobin’s Q - MTB ratio A CG -index obtained from the principal component method. Investors pay a significant premium for well-governed firms
Durnev & Kim (2005)
27 countries. 1999-2001
Tobin’s Q CG index provided by the Credit Lyonnais Securities Asia. Firms with higher quality CG are valued higher
Beiner et al. (2006)
Switzerland 2002 Tobin’s Q CG index based on 38 attributes (Swiss codes of best practice).
A positive relation between Tobin’s Q and governance index.
Brown & Caylor (2006)
USA 2003 Tobin’s Q A Gov-Score based on 51 firm-specific provisions. A positive relationship between Gov-score and Tobin’s Q
Ammann et al. (2011)
22 developed countries
2003-2007
Tobin’s Q CG indices based on 64 governance attributes. A positive association between firm CG and firm valuation.
Gompers et al. (2003)
USA 1990-1999
Abnormal returns measured by Jensen’s alpha (1968) using the Carhart (1997) four factors model.
Governance index based on 24 CG provisions. Strongest takeover defenses lead market underperformance.
Drobetz et al. (2004)
Germany 1998-2002
CG rating (CGR) related to the German CG code with 5 sub indices.
A strategy that buys better-governed firms and sells poorly-governed firms yields abnormal returns of 12% per year.
Bauer et al. (2004)
Europe 2000-2001
Governance ratings provided by Deminor for European Monetary Union (EMU) and UK firms listed in the FTSE Eurotop 300.
A strategy that holds “good governance firms” and a shorts bad governance firms earns positive abnormal returns.
Cremers & Nair (2005)
USA 1990-2001
External (Internal) governance mechanisms are proxied by firm takeover vulnerability (institutional investors).
Firms with good CG outperform poorly governed firms only when institutional block holder ownership is high.
Aman & Nguyen (2008)
Japanese firms
2000-2005
A CG index based on board characteristics, ownership structure and quality of disclosure.
The portfolio of poorly governed firms outperforms, by 2% approximately, the portfolio of well governed firms
Bebchuk et al. (2009)
USA 1990-2003
An entrenchment index based only on six of the 24 CG provisions.
A strategy that buys firms with lower E-index and short firms with higher E-index yields high abnormal return.
Johnson et al. (2009)
USA 1990-1999
The G-index and E-index are used as proxies for the CG quality.
The governance sorted portfolio earns statistically zero alpha.
Giroud & Mueller (2011)
USA 1990 to 2006
CG is measured by the G-index introduced by GIM (2003)Product market competition is measured by the HHI-Index.
Poorly governed firms exhibit lower equity prices, but only in noncompetitive industries.
164 M
anagement international / International M
anagement / G
estión Internacional
APPENDIX A Review of recent literature
Author(s) Study context PeriodMeasure(s) of firm market performance Measure(s) of Corporate Governance (CG) dimension(s) Result(s)
Board and audit independence based studies
Bhaghat & Black (2002)
Large U.S. companies
1991 Stock return -Tobin’s Q % of independent directors minus the % of inside directors The board independence is unrelated to performance
DeFond et al. (2005)
USA 1993-2002
Abnormal returns Six governance characteristics including board of directors and audit committee attributes (independence, size)
The market values the appointment of outside directors assigned to audit committees.
Black et al. (2006)
Korea 2001 Tobin’s Q, MTB, and price to sales ratio
6 CG sub-indexes including board of directors, outside directors and audit committee.
A positive relation between firm value and governance index.
Coles et al. (2008)
USA 1993-2003
Tobin’s Q The % of outsiders directors as a proxy for board independence
Board independence is negatively related to performance.
Chan & Li (2008)
Fortune 200 companies.
2000 Tobin’s Q The independence of board of directors and audit Committee (with 50% of expert-independent directors).
The presence of expert-independent directors on board and in the audit committee results in positive firm value.
O’Connell & Cramer (2010)
Ireland 2001 Stock return -Tobin’s Q Board size and the number of independents directors. A positive link between board independence and stock return.
Nguyen & Nielsen (2010)
USA 1994 - 2007
Stock price Sudden death of an independent directors (binary variable) Stock prices decline by 0.85% on average following the sudden death of an independent director.
Bruno & Claessens (2010)
23 countries 2003–2005
Tobin’s Q, - MTB ratio Indexes including corporate board independence.. Independent boards positively impact performance.
Yeh et al. (2011) G8 countries 2007-2008
Stock return The % of independent directors on the auditing (compensation, nominating, and risk correspondingly) committee
The independence in auditing and risk committees has positive effect on performance during the crisis period.
Aldamen . (2012)
S&P300 2008-2009
Stock return Audit committee attributes: size, experience, financial expertise, independence…
Positive relation between smaller audit committees with more experience and financial expertise and stock return.
Choi et al. (2014) Korea 2001-2004
Stock priceAbnormal returns
CG attributes including, financial literacy of audit committee members and independent audit committees.
Audit committee independence reduces management’s opportunistic behavior in the audit committee selection process.
Cai et al. (2015) China 2002-2004
Tobin’s Q Variables relating to the interaction between audit committees, ownership identity and high agency costs
Audit committees have greater value relevance and ultimately help to alleviate the agency costs of ownership structure.