Embed Size (px)
Citation preview

CORPORATE GOVERNANCE AND FIRM
PERFORMANCE: THE CASE FOR TURKEY
BUSN 89 Degree Project in Corporate and Financial
Management – Master Level
Spring 2016
Supervisor: Authors:
Maria Gårdängen Ece Oguz
Halide Hande Dincer

ACKNOWLEDGEMENTS
We would like to express our sincere gratitude to our supervisor Maria Gårdängen
for the continuous support of our thesis for her patience, advices and motivations. Her guidance
helped us all the time of research and writing of the paper.
We would like to also thank our bachelor professor who is Hasan Fehmi Baklacı that helped
us to define our thesis topic, and Hasan Basri Biberoğlu and Viktoria Janovskis that supported
us for proper English usage.
Besides them, we need to thank to our parents because without them we would not pursued
our studies and dreams and to our all friends that provide us full support during this process.
This accomplishment would not have been possible without all of them.
LIST OF TABLES AND FIGURES
Table 1: 2011 and 2014 Communique on Corporate Governance by CMB…………………9
Table 2: Corporate Governance Variables (Explanatory-Independent)……………………..23
Table 3: Firm Performance Variables (Dependent Variables)………………………………25
Table 4: Corporate Governance Variables (Control-Independent Variables)……………….26
Table 5: Descriptive Analysis……………………………………………………………….27
Table 6: Pairwise Correlation……………………………………………………………….29
Table 7: Ordinary Least Square (ROA)……………………………………………………..31
Table 8: Ordinary Least Square (ROE)……………………………………………………..32
Table 9: Ordinary Least Square (Tobin’s Q)………………………………………………..33
Table 10: Summary of Multiple Regression Analysis Interpretation……………………….35
Table 11: Distribution of Non-Executive Members of Turkish Sampled
Companies for year 2008-2014……………………………………………………………..37
Table 12: Distribution of Ceo Duality of Turkish Sampled Companies
for year 2008-2014………………………………………………………………………….38
Table 13: Distribution Board Size of Turkish Sampled Companies
for year 2008-2014………………………………………………………………………….39
TABLE OF CONTENTS
ABSTRACT…………………………………………………………………………………1
LIST OF ABBREVATIONS……………………………………………………………….2
1. INTRODUCTION
1.1 Background…………………………………………………………………...3
1.2 Problem Discussion………………………………………………………...…4
1.3 Research Purpose and Question…………………………………………....…5
1.4 Study Limitations……………………………………………………………..6
1.5 Report Structure………………………………………………………………6
2. SCOPES OF RESEARCH
2.1 Corporate Governance In Turkey………………………………………….…7
2.2 Enhancing The Corporate Governance In Turkey……………………………10
2.3 Bıst and Bıst Indexes…………………………………………………………11
3. LITERATURE REVIEW
3.1 Corporate Governance Concept……………………………………….………13
3.2 Corporate Governance Definitions……………………………………...…….13
3.3 Theories Related To Corporate Governance
3.3.1 Agency Theory……………………………………………………………………14
3.3.2 Stakeholder Theory……………………………………………………………...15
3.4 Good Corporate Governance And Its Importance……………………………15
3.5 Association Between Independent Variables and Firm Performance
3.5.1 Board Size And Firm Performance……………………………………………16
3.5.2 Ceo Duality And Firm Performance………………………………………….17
3.5.3 Board Composition And Firm Performance…………………………………18
3.5.4 Board Committees And Firm Performance………………………………….19
3.5.5 Firm Size And Firm Performance…………………………………………….20
3.5.6 Firm Age And Firm Performance…………………………………………….20
4. EMPIRICAL INVESTIGATION
4.1 Research Design……………………………………………………….……..21
4.2 Sampling, Data Sources And Collection……………………………….…….21
4.3 Variable Descriptions
4.3.1 Corporate Governance Variables…………………………………….……....22
4.3.2 Financial Performance Variables…………………………………….………23
4.3.2.1 Accounting Based Measurements (ROA)-(ROE)…………….……..24
4.3.2.2 Market Based Measurement (Tobin’s Q)…………………….……...24
4.3.3 Control Variables
4.3.3.1 Firm Size…………………………………………………………….………25
4.3.3.2 Firm Age…………………………………….……………………….…..….25
5. DATA INTERPRETATION
5.1 Descriptive Analysis………………………………………………………27
5.2 Pairwise Correlation Between Independent Variables……………………29
5.3 Regression Analysis
5.3.1 Corporate Governance Variables’ Relation With ROA………………..30
5.3.2 Corporate Governance Variables’ Relation With ROE………………..32
5.3.3 Corporate Governance Variables’ Relation With Tobin’s Q………….33
5.4 Discussion………………………………………………………………...36
6. CONCLUSION.....................................................................................................40
6.1 Future Directions For Research…………………………………………..41
REFERENCES………………………………………………………………….43
APPENDIX……………………………………………………………………...53
1
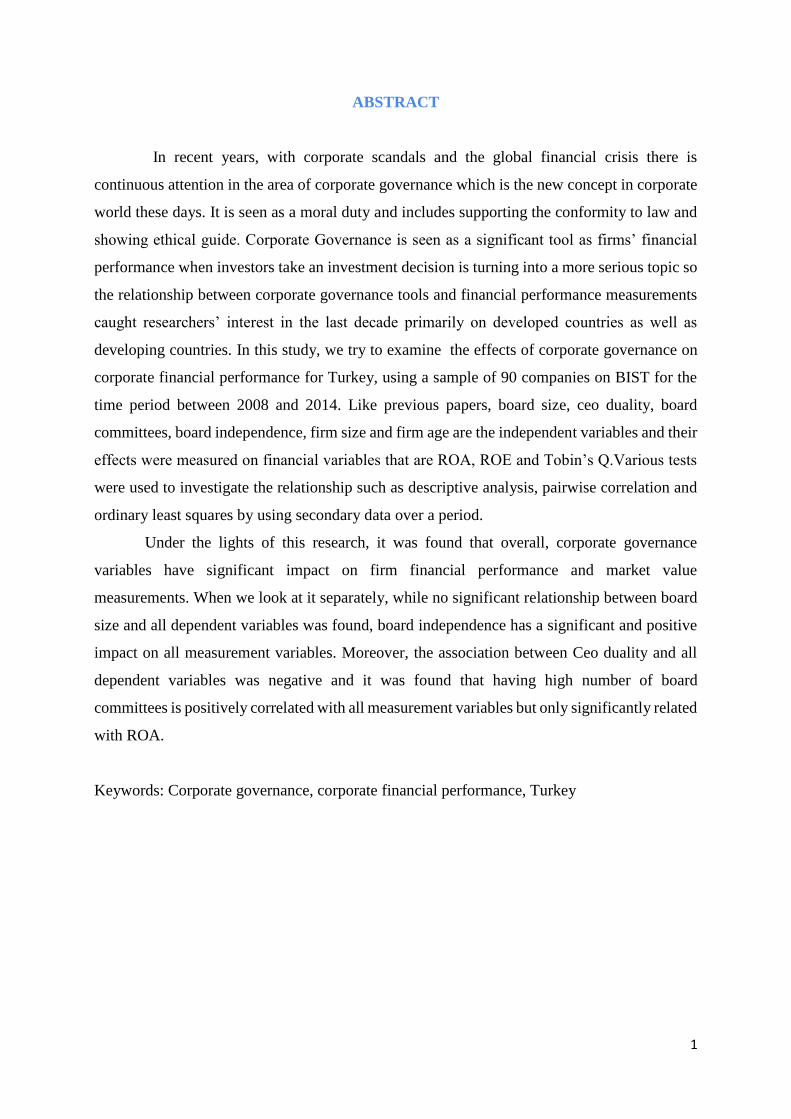
ABSTRACT
In recent years, with corporate scandals and the global financial crisis there is
continuous attention in the area of corporate governance which is the new concept in corporate
world these days. It is seen as a moral duty and includes supporting the conformity to law and
showing ethical guide. Corporate Governance is seen as a significant tool as firms’ financial
performance when investors take an investment decision is turning into a more serious topic so
the relationship between corporate governance tools and financial performance measurements
caught researchers’ interest in the last decade primarily on developed countries as well as
developing countries. In this study, we try to examine the effects of corporate governance on
corporate financial performance for Turkey, using a sample of 90 companies on BIST for the
time period between 2008 and 2014. Like previous papers, board size, ceo duality, board
committees, board independence, firm size and firm age are the independent variables and their
effects were measured on financial variables that are ROA, ROE and Tobin’s Q.Various tests
were used to investigate the relationship such as descriptive analysis, pairwise correlation and
ordinary least squares by using secondary data over a period.
Under the lights of this research, it was found that overall, corporate governance
variables have significant impact on firm financial performance and market value
measurements. When we look at it separately, while no significant relationship between board
size and all dependent variables was found, board independence has a significant and positive
impact on all measurement variables. Moreover, the association between Ceo duality and all
dependent variables was negative and it was found that having high number of board
committees is positively correlated with all measurement variables but only significantly related
with ROA.
Keywords: Corporate governance, corporate financial performance, Turkey
2
LIST OF ABBREVIATIONS
BIST: Borsa Istanbul – Istanbul Stock Exchange (New)
BIST 100: Borsa Istanbul 100 Endeksi – Istanbul Stock Exchange 100 Index
KAP: Kamuoyu Aydınlatma Platformu - Turkey Public Disclosure Platform
TKYD: Türkiye Kurumsal Yönetim Derneği – Corporate Governance Association Of Turkey
TÜSİAD: Türkiye İş Adamları Derneği – Turkish Industry And Business Association
CMB: Türkiye Sermaye Piyasası Kurulu - Capital Markets Board of Turkey
IMKB: Istanbul Menkul Kıymetler Borsası - Istanbul Stock Exchange (Old)
IMKB 100: Istanbul Menkul Kıymetler Borsası 100 Indeksi - Istanbul Stock Exchange 100
Index
VOB: Vadeli İşlemler Borsası Türkiye, Futures Exchange of Turkey
ROA: Return On Asset
ROE: Return on Equity
3
1.INTRODUCTION
1.1 Background
Corporate governance has been gaining importance ever since the mid 80s and in recent
years, with rising of competitive power, the importance of the corporate governance concept
has reached appreciable level. It is defined as the “rules and practices by which companies are
guided or run” and it also improves the relationship between the managers and shareholders of
a corporation, as well as its stakeholders. It contributes to growth and financial stability by
boosting up market assurance, financial market, integrity and economic efficiency
(Organisation for Economic Cooperation and Development (OECD,2004) therefore inadequacy
of corporate governance policy of public and private sector is counted among the important
reasons of the generated international financial crisis and company. It has become a concern
both in developing and developed economies since previous financial scandals have increased
demand for improved corporate governance practices (Baydoun et al 2013). The sudden
disappearance of companies such as Enron and Worldcom which are prominent examples of
world leading companies, showed that what is known about good company management needs
to be thought through corporate scandals and mismanagements. This has caused the losses
suffered by stakeholders of companies, primarily shareholders as a result the importance of
corporate governance has increased further and becomes an essential part of financial markets,
business and management. The reason for the concerns of corporate governance coming to the
foreground and the protection of its position in the next years is corporate scandals that have
happened recently. In the latest years after the fiscal crises happening in US and major corporate
bankruptcies, corporate governance concept came to the fore in Turkey as well in order to be
in harmony with the world and attract the foreign capital inflow to Turkey. Because Turkey has
different characteristics, its improvement is more slowly when it is compared with developed
markets. However, increasing need of foreign investment has boosted corporate governance
applications in Turkey.
With the previous unfortunate incidents, many authors have studied about the
relationship between corporate governance and firm performance and interestingly found
different results. Some of them found a positive association between corporate governance and
firm performance (Kiel and Nicholson, 2003; Haniffa and Hudaib, 2006; Jackling and Johl,
2009). Good corporate governance has become necessary for improving firm performance,
establishing investor rights, enhancing the investment atmosphere and encouraging economic
4
development (Braga- Alves & Shastri, 2011) and has gained extensive fame in the stock market
economy (Adiloglu & Vuran, 2012). Another researches stated that corporate governance
influence firm performance inversely (Yermack, 1996; Hutchinson and Gul, 2003; Mashayekhi
and Bazaz, 2008). Moreover, according to Bhagat and Black, 2002, there is no relationship
between corporate governance practises and firm financial performance. In this context, this
study investigates this relationship for the case of Turkey. This is because, generally studies has
concentrated on developed or developing countries but in this context Turkey is a special case
because according to different organizations it is defined as both developed and developing
countries. Moreover while there are studies related to relationship between corporate
governance and firm performance for Turkey, they were conducted by using different variables
than independent variables that are used for this study. Since their variables are different, it is
not possible to compare results with previous investigations. Therefore, it is found that there is
a research gap for this case. Hence, the focus for this study is exploring the impacts of corporate
governance variables that are board size, board independence, ceo duality, board committees,
firm age and firm size on corporate financial performance and market value that are ROA, ROE
and Tobin’s Q.
1.2 Problem Discussion
It is obvious that corporate governance practices have many benefits for companies,
countries and institutions. The most important benefits are rising business performance, easy
access to low capital financial sources, efficient using of sources, positive image for company
and country, providing security to investors, providing internal auditing to company, prevention
of interest conflict and providing sustainability (Claessens, Djankor, Fan and Lang, 2003). They
note that poor corporate governance not only causes low company performance but it can be
also the reason for macroeconomic crises.
Although good corporate governance has benefits on financial performance, in
developing countries it still has shortcomings while in developed countries corporate
governance is structured well and has good implications. As compared with developed
countries, social, economic environments and traditional management understandings hinder to
reach the good corporate governance practises in developing countries (Arif Saldanlı, 2012).
The previous researches have not concentrated on the economies that show the
characteristics of both developing and developed countries like Turkey. Different

5
organizations comprise different criterias to identify the country as developed or developing.
Therefore while some organizations (Dow Jones, FTSE and MSCI) identify Turkey as
developing, The CIA World Factbook defines Turkey as developed country. This lead to
positioning of Turkey in the line between developed and developing countries. Hence it is not
clear whether Turkish case will give same results with developing countries or developed ones.
Moreover there are empirical studies that use same methodology and variables based on ceo
duality, board independence, board committees and board size but in the cases for Turkey this
relationship is examined with different methodology and variables based on 4 principles scores
that are public transparency and disclosure, stakeholders, shareholders and board of directors.
Therefore, Turkey will be used as the case for this study and we have considered to have same
methodology with previous studies. By using the common methodology, we want compare our
findings with the results of the other empirical studies that carried throughout the World. Hence
firstly, this study might help us to enhance our understanding on the relationship of corporate
governance and company’s financial performance specifically in Turkey and secondly we want
to see whether the results are same with the other studies or not. So these reasons make the topic
worthy and the thesis will be beneficial for Turkish companies in the sense of understanding to
what extent can corporate governance affect firm performance and considering to increase
application of corporate governance.
1.3 Research Purpose and Question
From regulator perspective, there is a common belief regarding that good corporate
governance applications have positive effect on firms’ financial performance but corporate
governance indicators have different correlation on firm financial performance in every
countries. Therefore, the aim of this paper is to examine whether corporate governance
applications of listed Turkish companies can affect their firm performance. To achieve this
purpose, the following questions are presented:
1. To provide an analysis that examine to what extent do the various components of
corporate governance which are board size, board independence, board committees,
CEO duality, firm age and firm size influence the firm performance that are measured
by ROA, ROE and Tobin’s Q, by the help of percentages of companies’ compliance.
2. To see whether the results from this paper will be similar with past studies that use same
methodology for an other countries.

6
3. To analyze the relationship between CMB’s recommendations and compliance of
companies with them in order to understand whether compliance with advices ensure
better corporate governance implementations.
1.4 Study Limitations
Sampled companies were chosen from only BIST that includes all listed companies.
Therefore, unlisted companies could not be analyzed due to lack of information about their
operations. The assessment of the relationship in small companies and financial institutions are
not in the context of the research. The main source of data for this study is annual reports so
when the companies do not publish their annual reports for some years or do not include special
information that we need in this study, this hinders to reach the information source. Hence,
there are some missing observations in this paper.
1.5 Report Structure
This Master thesis comprises of six chapters.
Section 1 gives the general background of the research, states problem discussion, research
purpose and question and study limitations.
Section 2 gives details about background about corporate governance in Turkey, its
improvement, its enhancing and CMB’s indexes,
Section 3 presents literature review which provides general background about corporate
governance, theoretical framework for corporate governance and previous empirical studies’
findings about the relationship between corporate governance and financial performance,
Section 4 gives details about how the study will be conducted,
Section 5 presents the data interpretation of our empirical study,
Section 6 concludes the thesis.
7
2. SCOPES OF RESEARCH
2.1 Corporate Governance In Turkey
In order to increase the positive effect of capital markets on financial development and
to improve corporate governance practices in Turkey, especially in the latest years after the
fiscal crises happening in US and the major corporate bankruptcies, several regulations have
been developed. The OECD Corporate Governance Principles that have been used as an
example by the World were also taken as basis in studies done in Turkey. But the existing
corporate structure in Turkey has many differences compared to its developed market
counterparts. Some of the significant differences are that (Arif Saldanlı, 2012):
Most corporations are run by families.
Big groups in different industries dominate markets with horizontal growth.
The number of publicly held firms is low.
The percentage of capital stock is low.
With these qualities, Corporate Governance in Turkey develops more slowly than the other
developed markets. However, the present increasing need for foreign investment has a positive
effect on Corporate Governance implementations.
According to the ‘’Investors in the Emerging Markets Survey’’ carried out by the consulting
firm McKinsey, investment criteria for an emerging market such as Turkey are;
Compatibility with Corporate Governance Principles
Transparency of reporting
Clear distinction between family relations and company management. (Cuhruk &
Özkan, 2004)
The concept of Corporate Governance was first introduced to Turkey by the Turkish
Industry & Business Association (TUSIAD) in 2002 as titled ‘‘Corporate Governance- Best
Application Code’’ based on the OECD’s Corporate Governance Principles. Because the board
of directors plays the biggest role in the well application and implementation of corporate
governance in Turkey, the formation of the board of directors, its independence and its agenda
were heavily focused on in the aforementioned study. This published code was aimed for
primarily the public corporations and others to voluntarily follow as guidance for the
management and structure of boards of directors (KAP, 2002). Even though Corporate
Governance- Best Application Code is limited to the board of directors, it started the discussion
8
of Corporate Governance in Turkey. Members of the study group founded the Corporate
Governance Association of Turkey (TKYD) in 2003. This association made an important
contribution to the recognition and the widespread of corporate governance in Turkey. In the
same year, Capital Markets Board of Turkey (CMB), in parallel with the applications around
the world, published ‘’Principles of Corporate Governance’’ aimed primarily at public
corporations and also at all anonymous firms operating in public and private sectors. This report
was also based on OECD’s ‘’Principles of Corporate Governance’’. (KAP 2002)
In February 2005, this report was revised in parallel with OECD’s updated version
published in July 2003. Principles consist of four main segments; shareholders, public
disclosure and transparency, stakeholders and the Board of directors. Public Corporations are
only expected to follow these rules voluntarily. In addition to this, ‘comply or explain’ principle
was adopted. This principle predicts whether or not the mentioned principles were applied
properly and if it is not applied, company should explain it.(TKYD, 2015)
In addition to this, these principles enforce the companies, whose shares are traded on
BIST, to prepare and publish the Corporate Governance Compliance Report from 2005. This
report is published in annual reports and on firms’ web sites every year and it aims to show the
firm behaviour across the corporate governance practices to investors. In this report, the
principles in CMB’s Principles of CG will be specified and shown if they are followed by firms
or not. Regarding the ones which are not followed, the reasons for not following and the
consequences of not following will be clarified. (TKYD, 2015) After these developments BIST
created the Corporate Governance Index in 2005 in order to help the application of CG,
encourage companies to reference each other, measure the CG level of public corporations and
to help investors make decisions (Kılıç, 2008). In 2006, in order to inspect CG applications
‘’Corporate Governance in Turkey: A Pilot Study’’ was published by OECD. It entailed points
regarding the development of CG in Turkey. Following this rearrangement CMB’s CG
evaluation principles were revised. Two innovations were introduced by a notification from
CMB in 2008 in order to resolve the problems with application and to increase the applicability
of CG. Following the 2008, CMB has published new communiques in 2011 and 2014 to have
better corporate governance application (See Table 1).
The concept of Corporate Governance was first included in the Turkish Commercial Code
as well in 2012. The code also includes some regulations concerning CG applications that are
obligatory for both public anonymous companies and some other types. Turkish Commercial
Code contributed to the notion of CG in the following points: CMB’s monopolistic authority
on regulations, board of directors’ management explanation, right to accession, conglomerate,
9
standards of financial reporting, inspection, board of directors, general board and protection of
shareholders.
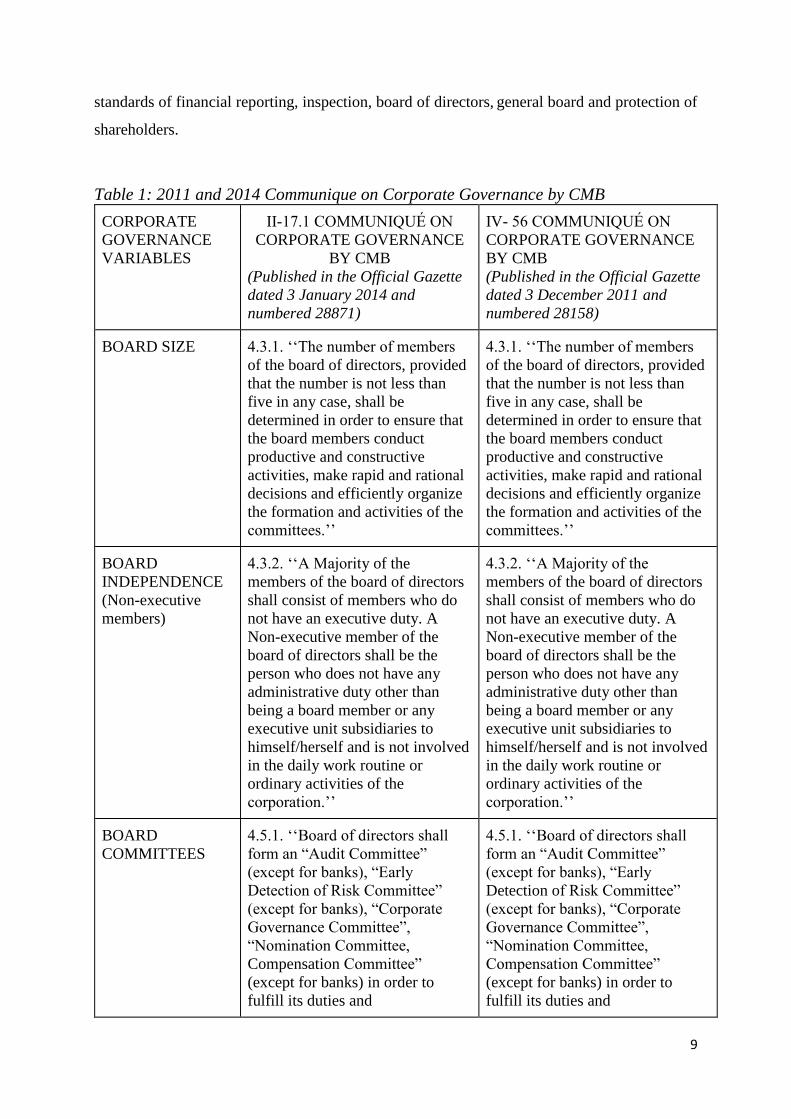
Table 1: 2011 and 2014 Communique on Corporate Governance by CMB
CORPORATE
GOVERNANCE
VARIABLES
II-17.1 COMMUNIQUÉ ON
CORPORATE GOVERNANCE
BY CMB
(Published in the Official Gazette
dated 3 January 2014 and
numbered 28871)
IV- 56 COMMUNIQUÉ ON
CORPORATE GOVERNANCE
BY CMB
(Published in the Official Gazette
dated 3 December 2011 and
numbered 28158)
BOARD SIZE 4.3.1. ‘‘The number of members
of the board of directors, provided
that the number is not less than
five in any case, shall be
determined in order to ensure that
the board members conduct
productive and constructive
activities, make rapid and rational
decisions and efficiently organize
the formation and activities of the
committees.’’
4.3.1. ‘‘The number of members
of the board of directors, provided
that the number is not less than
five in any case, shall be
determined in order to ensure that
the board members conduct
productive and constructive
activities, make rapid and rational
decisions and efficiently organize
the formation and activities of the
committees.’’
BOARD
INDEPENDENCE
(Non-executive
members)
4.3.2. ‘‘A Majority of the
members of the board of directors
shall consist of members who do
not have an executive duty. A
Non-executive member of the
board of directors shall be the
person who does not have any
administrative duty other than
being a board member or any
executive unit subsidiaries to
himself/herself and is not involved
in the daily work routine or
ordinary activities of the
corporation.’’
BOARD
COMMITTEES
4.5.1. ‘‘Board of directors shall
form an “Audit Committee”
(except for banks), “Early
Detection of Risk Committee”
(except for banks), “Corporate
Governance Committee”,
“Nomination Committee,
Compensation Committee”
(except for banks) in order to
fulfill its duties and
4.5.1. ‘‘Board of directors shall
form an “Audit Committee”
(except for banks), “Early
Detection of Risk Committee”
(except for banks), “Corporate
Governance Committee”,
“Nomination Committee,
Compensation Committee”
(except for banks) in order to
fulfill its duties and
10
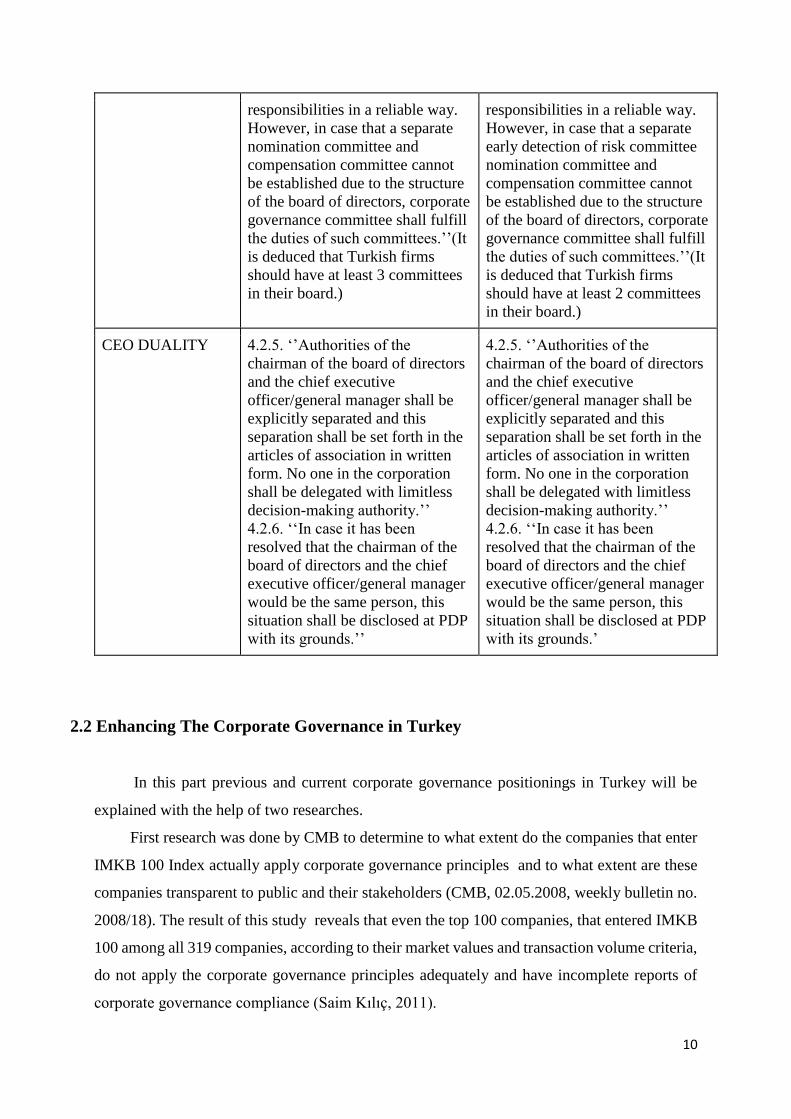
responsibilities in a reliable way.
However, in case that a separate
nomination committee and
compensation committee cannot
be established due to the structure
of the board of directors, corporate
governance committee shall fulfill
the duties of such committees.’’(It
is deduced that Turkish firms
should have at least 3 committees
in their board.)
responsibilities in a reliable way.
However, in case that a separate
early detection of risk committee
nomination committee and
compensation committee cannot
be established due to the structure
of the board of directors, corporate
governance committee shall fulfill
the duties of such committees.’’(It
is deduced that Turkish firms
should have at least 2 committees
in their board.)
CEO DUALITY 4.2.5. ‘’Authorities of the
chairman of the board of directors
and the chief executive
officer/general manager shall be
explicitly separated and this
separation shall be set forth in the
articles of association in written
form. No one in the corporation
shall be delegated with limitless
decision-making authority.’’
4.2.6. ‘‘In case it has been
resolved that the chairman of the
board of directors and the chief
executive officer/general manager
would be the same person, this
situation shall be disclosed at PDP
with its grounds.’’
4.2.5. ‘’Authorities of the
chairman of the board of directors
and the chief executive
officer/general manager shall be
explicitly separated and this
separation shall be set forth in the
articles of association in written
form. No one in the corporation
shall be delegated with limitless
decision-making authority.’’
4.2.6. ‘‘In case it has been
resolved that the chairman of the
board of directors and the chief
executive officer/general manager
would be the same person, this
situation shall be disclosed at PDP
with its grounds.’
2.2 Enhancing The Corporate Governance in Turkey
In this part previous and current corporate governance positionings in Turkey will be
explained with the help of two researches.
First research was done by CMB to determine to what extent do the companies that enter
IMKB 100 Index actually apply corporate governance principles and to what extent are these
companies transparent to public and their stakeholders (CMB, 02.05.2008, weekly bulletin no.
2008/18). The result of this study reveals that even the top 100 companies, that entered IMKB
100 among all 319 companies, according to their market values and transaction volume criteria,
do not apply the corporate governance principles adequately and have incomplete reports of
corporate governance compliance (Saim Kılıç, 2011).
11
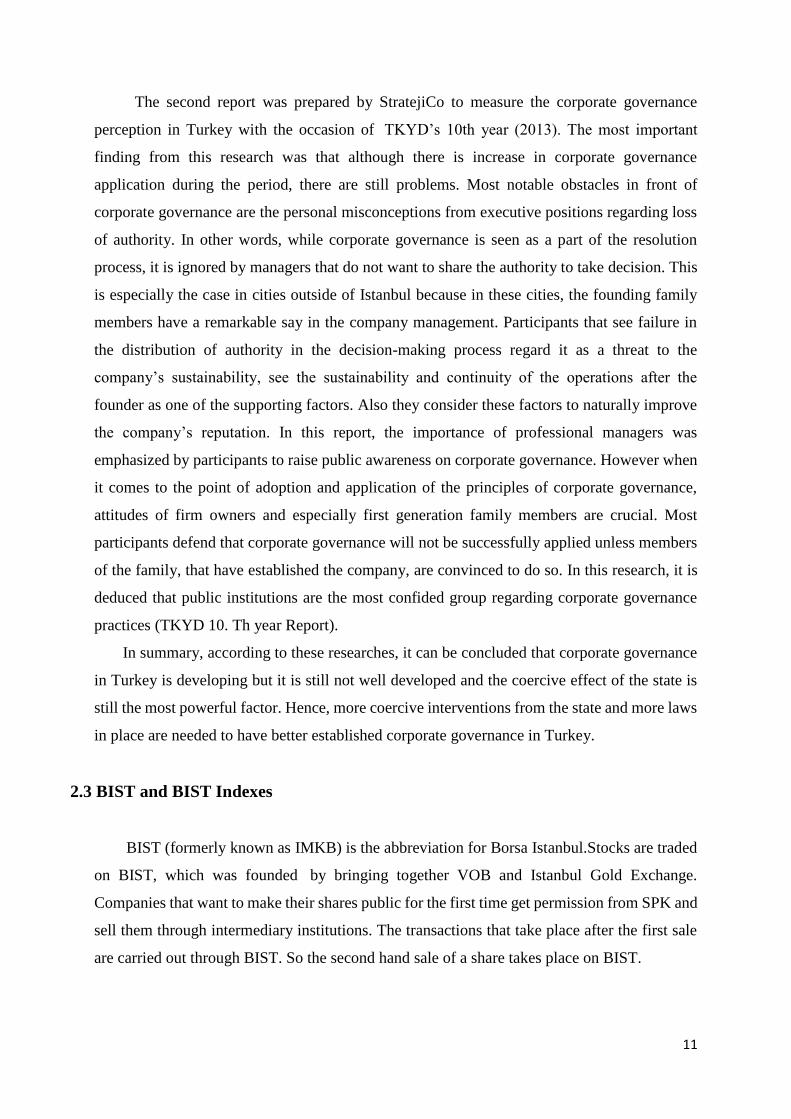
The second report was prepared by StratejiCo to measure the corporate governance
perception in Turkey with the occasion of TKYD’s 10th year (2013). The most important
finding from this research was that although there is increase in corporate governance
application during the period, there are still problems. Most notable obstacles in front of
corporate governance are the personal misconceptions from executive positions regarding loss
of authority. In other words, while corporate governance is seen as a part of the resolution
process, it is ignored by managers that do not want to share the authority to take decision. This
is especially the case in cities outside of Istanbul because in these cities, the founding family
members have a remarkable say in the company management. Participants that see failure in
the distribution of authority in the decision-making process regard it as a threat to the
company’s sustainability, see the sustainability and continuity of the operations after the
founder as one of the supporting factors. Also they consider these factors to naturally improve
the company’s reputation. In this report, the importance of professional managers was
emphasized by participants to raise public awareness on corporate governance. However when
it comes to the point of adoption and application of the principles of corporate governance,
attitudes of firm owners and especially first generation family members are crucial. Most
participants defend that corporate governance will not be successfully applied unless members
of the family, that have established the company, are convinced to do so. In this research, it is
deduced that public institutions are the most confided group regarding corporate governance
practices (TKYD 10. Th year Report).
In summary, according to these researches, it can be concluded that corporate governance
in Turkey is developing but it is still not well developed and the coercive effect of the state is
still the most powerful factor. Hence, more coercive interventions from the state and more laws
in place are needed to have better established corporate governance in Turkey.
2.3 BIST and BIST Indexes
BIST (formerly known as IMKB) is the abbreviation for Borsa Istanbul.Stocks are traded
on BIST, which was founded by bringing together VOB and Istanbul Gold Exchange.
Companies that want to make their shares public for the first time get permission from SPK and
sell them through intermediary institutions. The transactions that take place after the first sale
are carried out through BIST. So the second hand sale of a share takes place on BIST.
12
BIST 100 Index; is used as the main index for BIST. It consist of 100 firms, selected from
companies that are traded on the National Market, Real Estate Investment Companies and
Venture Capital Investment Trusts that are traded on Corporate Products Market
BIST 50 Index; consist of 50 firms, selected from companies that are traded on the National
Market, Real Estate Investment Companies and Venture Capital Investment Trusts that are
traded on Corporate Products Market.
BIST 30 Index; consists of 30 firms, selected from companies that are traded on the National
Market, Real Estate Investment Companies and Venture Capital Investment Trusts that are
traded on Corporate Products Market BIST 10 Bank Index: Includes 10 banks’ shares that are
traded on the National Market and have the highest liquidity and market value among others.
BIST Corporate Governance Index; consists of the shares of companies that are traded on
Istanbul Stock Exchange and that scored at least 7 points out of 10 according to the principles
of compliance with corporate governance.
BIST All Index; consists of shares of the companies that are traded on the National Market and
Second National Market, Real Estate Investment Companies and Venture Capital Investment
Trusts that are traded on Corporate Products Market.
3.LITERATURE REVIEW
Corporate governance is a modern management approach that is quite popular all over the
world for last 20 years. The dramatic rise of globalization in recent years has left companies
under pressure to expand in international markets. In addition, globalisation has brought with
changes in the structure of business management, strategy and major administration (Musteen
et al., 2009: 321).With the effect of globalisation, investor decisions, increasing expansion of
international trade, increased competition, rules implemented by stock exchanges, purchasing
and acquisitions and firm valuation criteria, the importance of corporate governance issue
continues to attract the attention of national and international organizations (Yavuz et al., 2015)
and gain widespread prominence in the capital market economy (Adiloglu et al., 2012). Because
of all these reasons, corporate governance has caught the attention of most scholars and
corporate governance is touched upon in many studies.

13
3.1 Corporate Governance Concept
To have better application and efficient results, corporate governance concept and its
legal system should be understood well. Corporate governance is an essential element of
modern business and management approach. Likewise, corporate governance is an integral
part of the strategic management. (Gürbüz&Ergincan, 2004:1).The main aim of the corporate
governance is to provide good relationship among stakeholders.
While in a narrow perspective corporate governance incorporated the relationships among
shareholders, managers, auditors and others related to business(Pandya, 2011), from a broader
perspective, corporate governance covers whole market as investor confidence, efficient capital
allocation and whole economy as wealth development and country welfare development that
are important for the company (Fülöp, 2014).
Corporate governance has another two different views as well. While from the restraint
view, corporate governance is seen as a law that helps the owners to accomplish their interests
(Cretu, 2012), from the large view corporate governance is seen as the mechanism that helps to
protect whole stakeholders’ interests (Cretu, 2012).
From TUSIAD’s viewpoint, in its broadest sense the concept of corporate governance is
the regulation of any organization’s management that people creates to achieve some aims. In
the narrow sense, corporate governance states all laws, regulations, codes of practice that enable
attracting human and financial capital. (TUSIAD Report, 2002).
3.2 Corporate Governance Definitions
Corporate governance is open concept so it has different meanings according to different
scholars. Generally, it is the system that is governed and controlled by organizations. In
particular it is related with the relationship between management and shareholders. While the
Cadbury report on the Committee of the financial Assets of Corporate governance that was led
by Sir Adrian Cadbury defines the phrase ‘corporate governance’ as the system by which
companies are guided and guarded, OECD defines "Corporate governance involves a set of
relationships between a company’s management, its board, its shareholders and other
stakeholders. Corporate governance also provides the structure through which the objectives of
the company are set, and the means of attaining those objectives and monitoring performance
are determined." (OECD Principles of Corporate Governance)

14
Generally it refers to the process and structure for inspecting the direction and management
of a business entity, so that it carries out its objectives effectively (Report on the observance of
standards and codes (ROSC) 2005; Bozec&Dia, 2007). As what O’Sullivan (2000) stated, one
can intensify and influence economic and financial performance with the proper corporate
governance practices. Accordingly, corporate governance plays an important role in the
allocation of resources and returns. OECD (1999) has defined the corporate governance as
‘‘Corporate governance is the system by which business corporations are directed and
controlled.’’ It means the practise of power on corporations through board of directors. (Tricker,
2000). Mac Millan and Downing (1999) have identified the corporate governance as directed
and controlled system to obtain high financial performance.
3.3 Theories Related to Corporate Governance
3.3.1Agency Theory
The origin of Agency theory come from economic theory that is revealed by Alchian and
Demsetz and it was developed by Jensen and Meckling (1976). The theory is specified as the
relationship between agents and principals in the business. It is relevant with solving the
problem between shareholders(principals) and managers(agents). Principals expect that
agents act and take decisions for the interests of shareholders and work for maximizing their
wealth. This agency problem can occur in two situations; when interests of agents and principals
don’t fall in line with each other and when principals and agents have different risk tolerances.
Hence, the agency problem will cause inefficiencies, financial losses and agency cost which is
determined by Jensen and Meckling (1976) as ‘’the sum of monitoring expenditure by the
principal to limit the aberrant activities of the agent; bonding expenditure by the agent which
will guarantee that certain actions of the agent will not harm the principal or to ensure the
principal is compensated if such actions occur; and the residual loss which is the dollar
equivalent to the reduction of welfare as a result of the divergence between the agents decisions
and those decisions that would maximize the welfare of the principal’’.
Many researches (Pearce&Zahra, 1992; Bhagat&Black, 1998; Daily & Dalton, 1994; Kiel
& Nicholson, 2003) have emphasized on board composition because according to agency
theory ,the first duty of board is maximizing shareholder value so within this framework agents
are seen as managers, principals are owners and board are perceived as monitoring mechanism
15
(Mallin, 2004). Ceo duality is another tool to minimize the agency problem as well. When the
positions of CEO and chairman of the board are held by different people, agency problem
decreases. This is because,in this case CEO is responsible for management and chairman is in
charge of monitoring. Hence, principals’ interests can be preserved from agents.
3.3.2 Stakeholder theory
Stakeholder theory was well incorporated in management routine in 1970 but Freeman
(1984) introduced corporate accountability to wider array of stakeholders.Contrary to agency
theory, here managers are working for and assisting stakeholders, Stakeholder theory suggested
that managers should have a system of associations among stakeholder. Also unlike agency
theory that give more significance to the association of owner,employee and manager
,for stakeholder theory the network of them is more important(Freeman, 1999). However,
according to Sundaram & Inkpen (2004),stakeholder theory refers to a group of stakeholder
who needs management’s interest. In addition, Donaldson & Preston (1995) mentioned that
stakeholder consists of a group involved in a business to take advantages. On the other
hand, Clarkson (1995) suggests that aim of companies is to generate wealth for their
stakeholders.
Freeman (1984) , network of associations among various groups may influence firm’s
decision making process since stakeholder theory focuses on the essence of these associations
regarding processes and consequences for companies and their stakeholders. Donaldson &
Preston (1995) stated that stakeholder theory concentrates on the interests of stakeholders as
well as managerial decision making processes.
3.4 Good Corporate Governance and Its Importance
Good corporate governance means setting up a well management structure within the
organisation to create and have a reassuring relations between company’s board of directors,
the management, employees and shareholders to service the interests of shareholders, not
ignoring all stakeholders’ interests (PTTPLC explanation) on the contrary ASX Principles of
Good Corporate Governance and Best Practices Recommendations (2003) defines good
corporate governance as ‘ the structure that encourages companies to create value and provide
accountability’.
16
Corporate governance becomes an important assessment tool for investment choices
because there are many empirical researches that show a positive correlation between corporate
governance and financial performance. In other words, when the investors are on the decision
process, they firstly look at corporate governance implications and its compliance with
regulations or advices .Therefore, corporate governance becomes an important key element of
investment decision.
When benefits of corporate governance are examined from the perspective of companies,
having high quality of corporate governance means low capital cost, increasing capacity of
financing and liquidity and not excluding of well managed companies from capital markets
(CMB, 2005:2).
On the other hand when this situation is analyzed through the perspective of Turkey, good
corporate governance causes an improvement on the prestige of the country, prevention of
outflow of capital, increase of foreign capital investments, increase of competitive power and
capital markets, overcoming of crisis with less loss, distributing of resources more effectively
and providing and maintaining of high prosperity (CMB, 2005:2).
3.5 Associations Between Independent Variables and Firm Performance
3.5.1 Board Size And Firm Performance
The size of board affects firm performance according to previous studies. A review of these
empirical studies shows mixed results. Lipton and Lorsch (1992) supports Jensen(1983) who
recommended the board size has optimal number of maximum of seven to eight members.
Concurring with this, Sulaiman et al. (2012 ) states that the board size should be standardized
and not should be too large or small. However, optimal board size should be determined in
terms of industries because Adams and Mehran (2003) state that banks should have large boards
while manufacturing firms must have less. According to Hackman (1990) Organizational
behavior researchers note that larger boards decrease total productivity. Forbes and Milliken
(1999) cite that if the board size become larger, the coordination will be difficult and value-
maximizing strategic decisions will be made hardly. According to Cheng (2008), large boards
cause lower profitability since they are conservative and they take less risks. Chan and Li (2008)
and De Andres, Azofra and Lopez (2005) cite that larger boards mean poor performance

17
because when board size increases, monitoring becomes infective. According to Yermack
(1996), there is inverse relationship between board size and firm performance.
On the other hand, there are also some findings about positive relationship between board
size and firm performance. Mohamed (2009) conducted a study on sample of 174 financial
institutions and savings-and-loan-holding companies between 1995 and 2002 and he states that
large boards do not reduce firm performance. In addition, Anderson, Mansi and Reeb (2004),
Klein (2002) and Monk and Minnow (1995) find that with the larger boards, quality of
monitoring can be increased. Dehaene et al. (2001) find that board size is positively related with
firm performance. Finally, Connelly and Limpaphayom (2004) notes that there is no
relationship between board size and firm performance.
H1: There is a negative relationship between the board size and financial performance
3.5.2 Ceo Duality and Firm Performance
Another dilemma experienced by companies is whether chairman of board of directors
and CEO should hold different positions or not. Koufopoulos et al. (2010) cites that since CEO
has an influential power on companies' strategic decisions, CEO that has dual role affect board's
decisions and firm performance negatively. Also, Syriopoulos et al. (2012) notes that dual role
has negative impact on monitoring and decisions of board of directors. According to Dar et al.
(2011), CEO and chairman might influence firm performance since if same person works for
both positions, agency problem increases. In addition , Baysinger and Hoskisson, 1990 ,Fama
and Jensen, (1983), Rechner and Dalton, (1991) stated that separation of responsibilities will
cause a rise in effectiveness of monitoring and increase in the level of separation between board
of directors and management. In addition, Brickley et al. (2005) showed that holding two
positions by one person will lead to conflict of interests and higher agency problem.
Other researchers found that when CEO has dual role, organizations will ; have
unequivocal and powerful leadership; extinguish possible conflict between CEO and chairman
and eliminate the confusion of two representatives from the perspective of stakeholder. (Davis,
Schoorman and Donaldson, 1997; Donaldson and Davis, 1991). Cannella and Lubatkin (1993)
also reported that there is positive relationship between dual leadership and firm performance.
Consistent with these arguments, Simpson and Gleason (1999) found that when CEO hold dual
leadership, they are less probable to face with financial distress. Also, the stewardship theory
18
states that having single leader for both positions may lead to good governance with positive
influence on financial performance due to combination of directions that accelerates decision-
making process. Feng, Goshan and Sirmans (2005) examined the relationship between BoD
and Real Estate Investment Trust (REIT) performance and they could not find any significant
link between dual role and firm performance. All in all ,both views were discussed and the link
between dual leadership and firm performance is mixed and indecisive.
H2: There is a negative association between CEO/Chairman Duality and firm performance.
3.5.3 Board Composition And Firm Performance
Another significant variable of corporate governance is board composition that means
formal organization of Board of Directors. Abdullah (2004) states that the board of director
consist of group of people who set strategic decisions and it has important roles to lead and
direct the firm in order to achieve company's goals. It is crucial to provide that boards are
independent from management. This is because, board composition can reduce principal–agent
problem since participation of non-executive directors ensures to keep competitiveness of
firms.
There have been many studies that examine the link between independent directors and
firm performance and they gave mixed results. Some authors (Ezzamel & Watson, 1993;
Hossain et al., 2001; Vance, 1964) reported a positive link between board composition and firm
performance. According to Chen (2011) ,companies should have more non executive directors
to provide efficient operations. Also, Lam and Lee (2012) noted that when boards have more
independent non-executive members, boards become effective. Fama and Jensen (1983) also
mentioned that non-executive directors can decrease agency problems and make effective
decisions. Bhojraj and Sengupta (2003) and Ashbaugh-Skaife, Collins and Kinney (2006)
suggested larger amount of independent directors that are assigned increase bond and credit
ratings. Moreover, O’ Sullivan (2000) analyzed a sample of 402 UK firms and found that non-
executive directors ensure comprehensive audit.
Some studies support the negative relationship between board composition and firm
performance. According to Yammeesri and Herath (2010) , if firm has more insider directors,
its firm value will increase compared with the board having more outside directors. Agrawal
and Knoeber (1996) and Yermack (1996) noted that there is a negative link between board
19
composition and firm performance measured by Tobin's Q. Klein (1998) also mentioned that
market value of equity is negatively related with proportion of independent directors in the
boards. Cornet et al. (2007) analyzed 100 largest firms in the U.S. as ranked by S&P and found
that increasing proportion of independent directors causes a decrease in earnings management.
In addition, the study conducted by Roodposhti and Chashmi (2010) in Iran found a negative
relationship between board independence and earnings management.
Some scholars could not find any significant relationships between these variables. For
example; Fogel and Geier (2007) stated that it is not guarantee that companies with large
number of non-executive directors on their boards achieve good corporate governance. Dalton
et al.,(2011) could not find any relationship between board independence and firm performance.
Also , According to Byrd & Hickman, (1992); Chin, Vos & Casey, (2003); Daily & Dalton,
(1992); Mace, (1986 ) , board composition and firm performance are not related significantly.
As understood from previous studies , there are different results and it is assumed that
increasing proportion of non executive directors can boost firm performance so the hypothesis
is ;
H3: There is a positive link between board composition and firm performance.
3.5.4 Board Committees And Firm Performance
Number of Board committees are also important measurement for firm performance
according to the past studies. McMullen, (1996 ) reported that firms which have audit
committees have less financial distress. Klein (2002b) mentions that independent audit
committees decrease probability of earnings management so it can increase transparency. On
the other hand , Baxter (2006) could not find any relationship between the quality of firm's
financial reports and presence of audit committees. Main and Johnston (1998) and Weir and
Laing (2000) argue that existence of remuneration committee leads to beneficial impact on firm
performance. According to Klein (1998) ,there is a positive link between remuneration
committee and firm performance but not significantly. Abbott et al., (2004) , the presence of
audit committees can decrease mistakes and abnormalities and Carcello and Neal, (2000), noted
that it affects the decisions of credit rating agencies in a positive way.
Comparing to other variables, studies related to link between board committees and firm
performance are few so it is assumed that there is positive relationship.

20
H4: There is positive link between the presence of board committees and firm performance.
3.5.5 Firm Size and Firm Performance
Some studies states that there is a positive relationship between firm size and firm’s
financial performance (Black et al., 2006) (Serrasqueiro&Nunes, 2008). This is because,when
the firm size increase,generating internal fund and accessing external capital become easier.
When the firm size increases, diversification in company’s operations increases as well and this
leads to confusion in management (Fama&Jensen, 1983; Boone et al., 2007). With this
confusion, larger firms require more counseling than smaller firms on board and this will lead
to more efficient and more diversified company strategies, hence larger companies might
generate a better financial performance than smaller companies.
On the other hand, there are some studies that show negative relationship between firm
size and financial performance. Larger firms need more monitoring (Nenova, 2003; Garen,
1994; Agrawal&Knoeber, 1996) which ends up creating extra costs for firms. (Nenova, 2003)
From different viewpoint, when the firm size increases, management might loss its control on
the strategic and operational decisions and this might be end up with less efficiency (Agrawal
and Knoeber, 1996). Lastly, it is argued that the probability of meeting with agency problem is
higher for large firms so it will cause a decrease in firm performance. Moreover, because large
firms should have more advanced internal control than small firms , the cost of auditing increase
to be able to act according to stakeholders’ interests.(Jensen and Meckling, 1976).
H5: There is a negative association between firm size and firm performance
3.5.6 Firm Age and Firm Performance
There are some researches that used the firm age as control variable when they analyzed
the its effect on firm financial performance. They emphasize on the importance of firm age in
terms of expected growth opportunity.
Old and large companies have better compliance with the advices of public authorities,
better reputation, more opportunities to access the external capital. Also, they have lower risk
of financial distress and less growth opportunities(Claessens et al., 2002). Nevertheless, young
21
and small companies might have better growth opportunities but higher risk for financial
distress. While old companies have more experience and skills, they are less dynamic and are
not good at adapting changes (Evans, 1987; Boone et al., 2007).
Small and young companies earn less profit than older and larger companies because they
are new in the market and they must spend more effort to show their presence in the market
Nevertheless, they are better than older firms in adapting new business
environments(Lipczinsky and Wilson, 2001). Since young companies are at the beginning of
growth stage,they might catch better growth opportunities(Black et al., 2006).
H6: There is negative relationship between firm age and firm performance
4. EMPIRICAL INVESTIGATION
4.1 Research Design
The aim of this study is to analyze the relationship between variables of corporate
governance and financial performance for Turkish listed companies. This section describes the
research methods to test the hypotheses presented above. Therefore analysis relies on
quantitative approach which is the most proper method to measure this relationship, to test the
hypotheses and answer the research questions. In this chapter, statistical analysis and tables are
used to support this study. The section follows with an explanation of the methodology used
for research design, data sources and collection, variable descriptions, model specification and
data analysis.
4.2 Sampling, Data Sources And Collection
The research has been conducted on 90 listed Turkish firms that are traded in BIST.
Companies were chosen from among the best 100 companies (BIST 100 index)
because findings and results of this study will be more readily comparable, reliable and more
informative. Furthermore, with the use of the best firms it is easier to obtain information about
their corporate governance practices due to the their well organized and extensive annual
22
reports. In the research, financial institutions and insurance companies were excluded because
financial institutions have different accounting standards which makes the results incomparable
with non financial firms and having many fluctuations in the financial position of financial
institutions creates volatile results. (Ferreira Caixe&Krauter, 2014; Moradi et al., 2012).
Therefore, financial institutions and insurance companies were excluded from the sample as
well as companies that do not have all the required information. However, after removing these
companies from the sample, 90 companies that is our aim for number of sampled data could
not be collected. In order to complete the sample, remaining companies were taken from other
BIST indices (See Appendix 14). The sampling period is decided to be between 2008-2014 in
the study because between these years we expect to see improvement in corporate governance
practices of firms in parallel with the revisions of CMB.
In our analysis we used secondary data which was obtained from BIST, KAP, TKYD and
CMB, firms’ web sites and annual reports to analyze and evaluate the variables which are firm’s
establishment year, book value of total assets, book value of total liabilities, share price, number
of issued shares, net income, number of board members, presence of ceo duality, number of
board committees and number of non executive directors.
4.3 Variable Descriptions
Three types of variables which are corporate governance (independent), control variables
(independent) and variables for financial performance (dependent), are conducted in this paper.
4.3.1 Corporate Governance Variables
In this paper, the variables below were used as corporate governance indicators because
they are the building blocks of corporate governance. While transforming the information in
annual reports of companies to our sampled data for analysis, we followed the same procedure
as the previous studies.
23
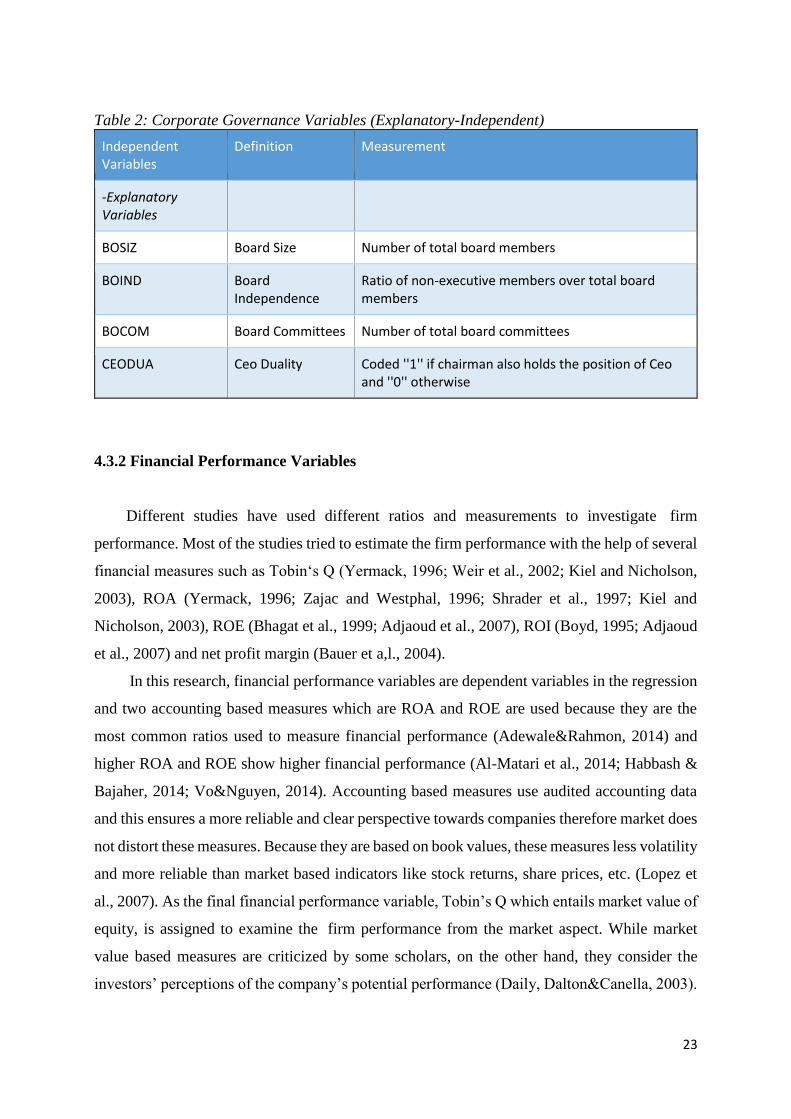
Table 2: Corporate Governance Variables (Explanatory-Independent)
Independent Variables
Definition Measurement
-Explanatory Variables
BOSIZ Board Size Number of total board members
BOIND Board Independence
Ratio of non-executive members over total board members
BOCOM Board Committees Number of total board committees
CEODUA Ceo Duality Coded ''1'' if chairman also holds the position of Ceo and ''0'' otherwise
4.3.2 Financial Performance Variables
Different studies have used different ratios and measurements to investigate firm
performance. Most of the studies tried to estimate the firm performance with the help of several
financial measures such as Tobin‘s Q (Yermack, 1996; Weir et al., 2002; Kiel and Nicholson,
2003), ROA (Yermack, 1996; Zajac and Westphal, 1996; Shrader et al., 1997; Kiel and
Nicholson, 2003), ROE (Bhagat et al., 1999; Adjaoud et al., 2007), ROI (Boyd, 1995; Adjaoud
et al., 2007) and net profit margin (Bauer et a,l., 2004).
In this research, financial performance variables are dependent variables in the regression
and two accounting based measures which are ROA and ROE are used because they are the
most common ratios used to measure financial performance (Adewale&Rahmon, 2014) and
higher ROA and ROE show higher financial performance (Al-Matari et al., 2014; Habbash &
Bajaher, 2014; Vo&Nguyen, 2014). Accounting based measures use audited accounting data
and this ensures a more reliable and clear perspective towards companies therefore market does
not distort these measures. Because they are based on book values, these measures less volatility
and more reliable than market based indicators like stock returns, share prices, etc. (Lopez et
al., 2007). As the final financial performance variable, Tobin’s Q which entails market value of
equity, is assigned to examine the firm performance from the market aspect. While market
value based measures are criticized by some scholars, on the other hand, they consider the
investors’ perceptions of the company’s potential performance (Daily, Dalton&Canella, 2003).
24
According to Haniffa&Hudaib (2006) there is no certain result that shows which measure is the
best when you examine firms’ financial performance.
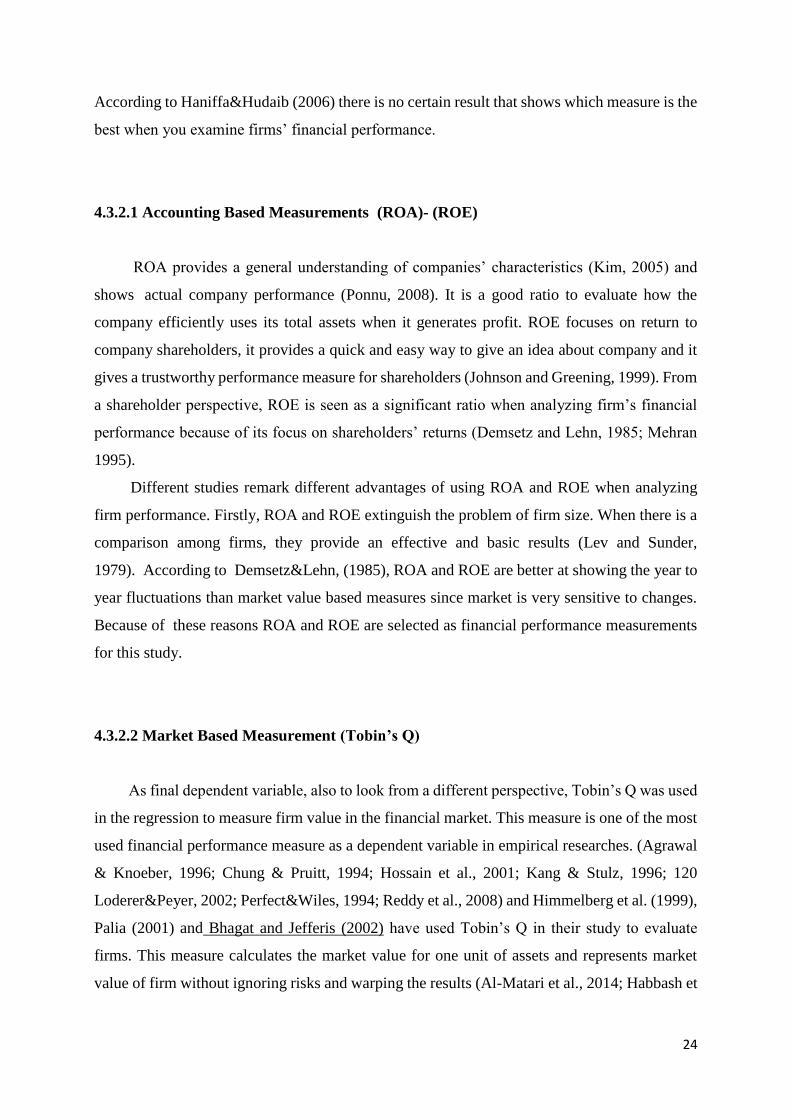
4.3.2.1 Accounting Based Measurements (ROA)- (ROE)
ROA provides a general understanding of companies’ characteristics (Kim, 2005) and
shows actual company performance (Ponnu, 2008). It is a good ratio to evaluate how the
company efficiently uses its total assets when it generates profit. ROE focuses on return to
company shareholders, it provides a quick and easy way to give an idea about company and it
gives a trustworthy performance measure for shareholders (Johnson and Greening, 1999). From
a shareholder perspective, ROE is seen as a significant ratio when analyzing firm’s financial
performance because of its focus on shareholders’ returns (Demsetz and Lehn, 1985; Mehran
1995).
Different studies remark different advantages of using ROA and ROE when analyzing
firm performance. Firstly, ROA and ROE extinguish the problem of firm size. When there is a
comparison among firms, they provide an effective and basic results (Lev and Sunder,
1979). According to Demsetz&Lehn, (1985), ROA and ROE are better at showing the year to
year fluctuations than market value based measures since market is very sensitive to changes.
Because of these reasons ROA and ROE are selected as financial performance measurements
for this study.
4.3.2.2 Market Based Measurement (Tobin’s Q)
As final dependent variable, also to look from a different perspective, Tobin’s Q was used
in the regression to measure firm value in the financial market. This measure is one of the most
used financial performance measure as a dependent variable in empirical researches. (Agrawal
& Knoeber, 1996; Chung & Pruitt, 1994; Hossain et al., 2001; Kang & Stulz, 1996; 120
Loderer&Peyer, 2002; Perfect&Wiles, 1994; Reddy et al., 2008) and Himmelberg et al. (1999),
Palia (2001) and Bhagat and Jefferis (2002) have used Tobin’s Q in their study to evaluate
firms. This measure calculates the market value for one unit of assets and represents market
value of firm without ignoring risks and warping the results (Al-Matari et al., 2014; Habbash et
25
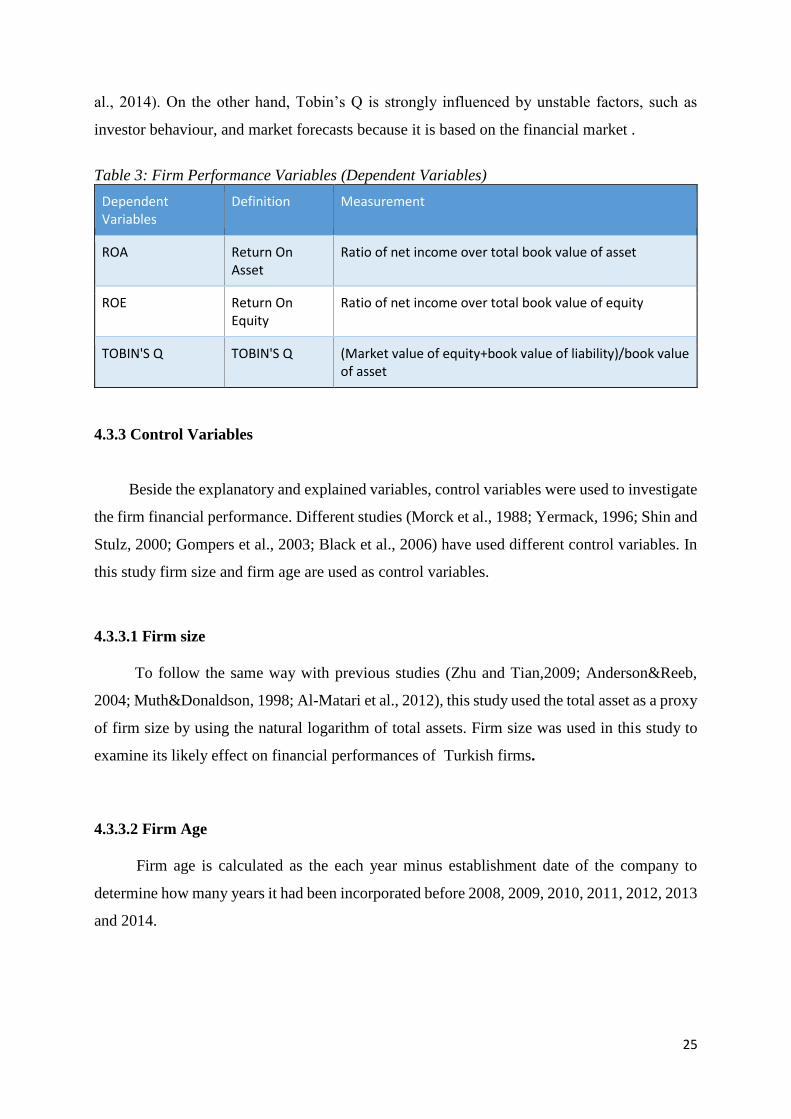
al., 2014). On the other hand, Tobin’s Q is strongly influenced by unstable factors, such as
investor behaviour, and market forecasts because it is based on the financial market .
Table 3: Firm Performance Variables (Dependent Variables)
Dependent Variables
Definition Measurement
ROA Return On Asset
Ratio of net income over total book value of asset
ROE Return On Equity
Ratio of net income over total book value of equity
TOBIN'S Q TOBIN'S Q (Market value of equity+book value of liability)/book value of asset
4.3.3 Control Variables
Beside the explanatory and explained variables, control variables were used to investigate
the firm financial performance. Different studies (Morck et al., 1988; Yermack, 1996; Shin and
Stulz, 2000; Gompers et al., 2003; Black et al., 2006) have used different control variables. In
this study firm size and firm age are used as control variables.
4.3.3.1 Firm size
To follow the same way with previous studies (Zhu and Tian,2009; Anderson&Reeb,
2004; Muth&Donaldson, 1998; Al-Matari et al., 2012), this study used the total asset as a proxy
of firm size by using the natural logarithm of total assets. Firm size was used in this study to
examine its likely effect on financial performances of Turkish firms.
4.3.3.2 Firm Age
Firm age is calculated as the each year minus establishment date of the company to
determine how many years it had been incorporated before 2008, 2009, 2010, 2011, 2012, 2013
and 2014.
26
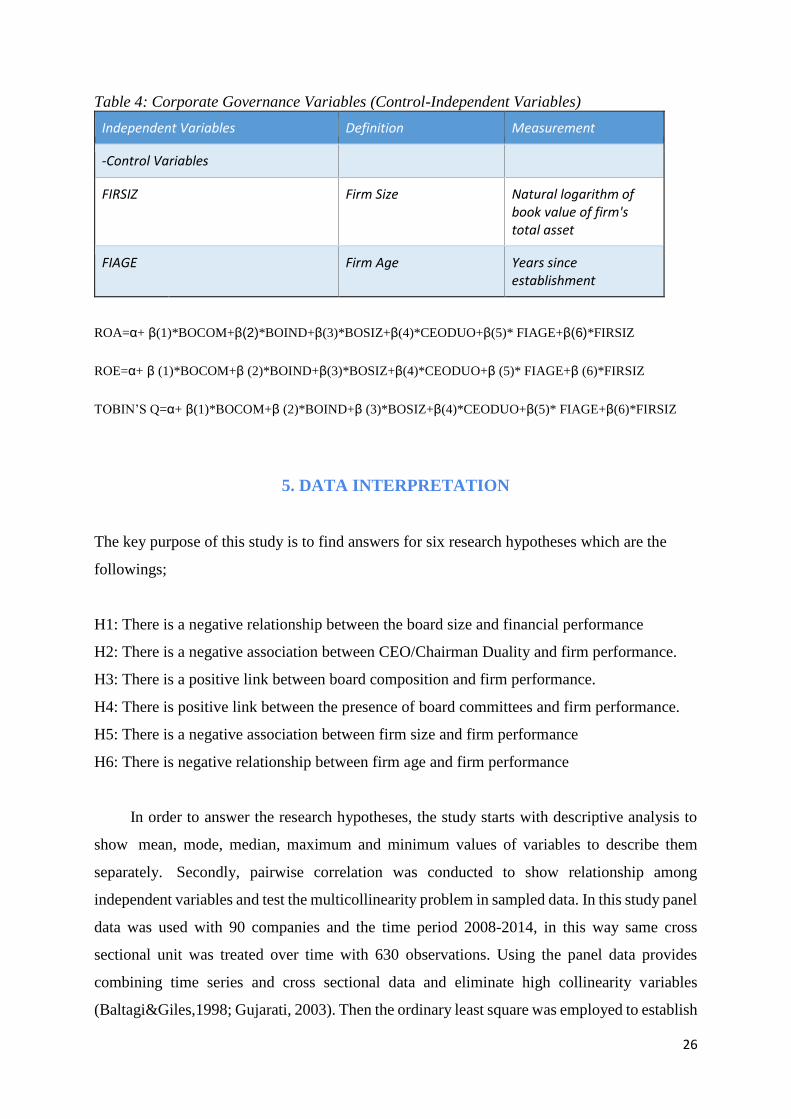
Table 4: Corporate Governance Variables (Control-Independent Variables)
Independent Variables Definition Measurement
-Control Variables
FIRSIZ Firm Size Natural logarithm of book value of firm's total asset
FIAGE Firm Age Years since establishment
ROA=α+ β(1)*BOCOM+β(2)*BOIND+β(3)*BOSIZ+β(4)*CEODUO+β(5)* FIAGE+β(6)*FIRSIZ
ROE=α+ β (1)*BOCOM+β (2)*BOIND+β(3)*BOSIZ+β(4)*CEODUO+β (5)* FIAGE+β (6)*FIRSIZ
TOBIN’S Q=α+ β(1)*BOCOM+β (2)*BOIND+β (3)*BOSIZ+β(4)*CEODUO+β(5)* FIAGE+β(6)*FIRSIZ
5. DATA INTERPRETATION
The key purpose of this study is to find answers for six research hypotheses which are the
followings;
H1: There is a negative relationship between the board size and financial performance
H2: There is a negative association between CEO/Chairman Duality and firm performance.
H3: There is a positive link between board composition and firm performance.
H4: There is positive link between the presence of board committees and firm performance.
H5: There is a negative association between firm size and firm performance
H6: There is negative relationship between firm age and firm performance
In order to answer the research hypotheses, the study starts with descriptive analysis to
show mean, mode, median, maximum and minimum values of variables to describe them
separately. Secondly, pairwise correlation was conducted to show relationship among
independent variables and test the multicollinearity problem in sampled data. In this study panel
data was used with 90 companies and the time period 2008-2014, in this way same cross
sectional unit was treated over time with 630 observations. Using the panel data provides
combining time series and cross sectional data and eliminate high collinearity variables
(Baltagi&Giles,1998; Gujarati, 2003). Then the ordinary least square was employed to establish
27
if corporate governance indicators have an effect on company financial performance. In
addition, white correlated standard errors is used to extinguish heteroscedasticity problem in
data set. This study’s analyses were run with the help of Excel and EViews programmes.
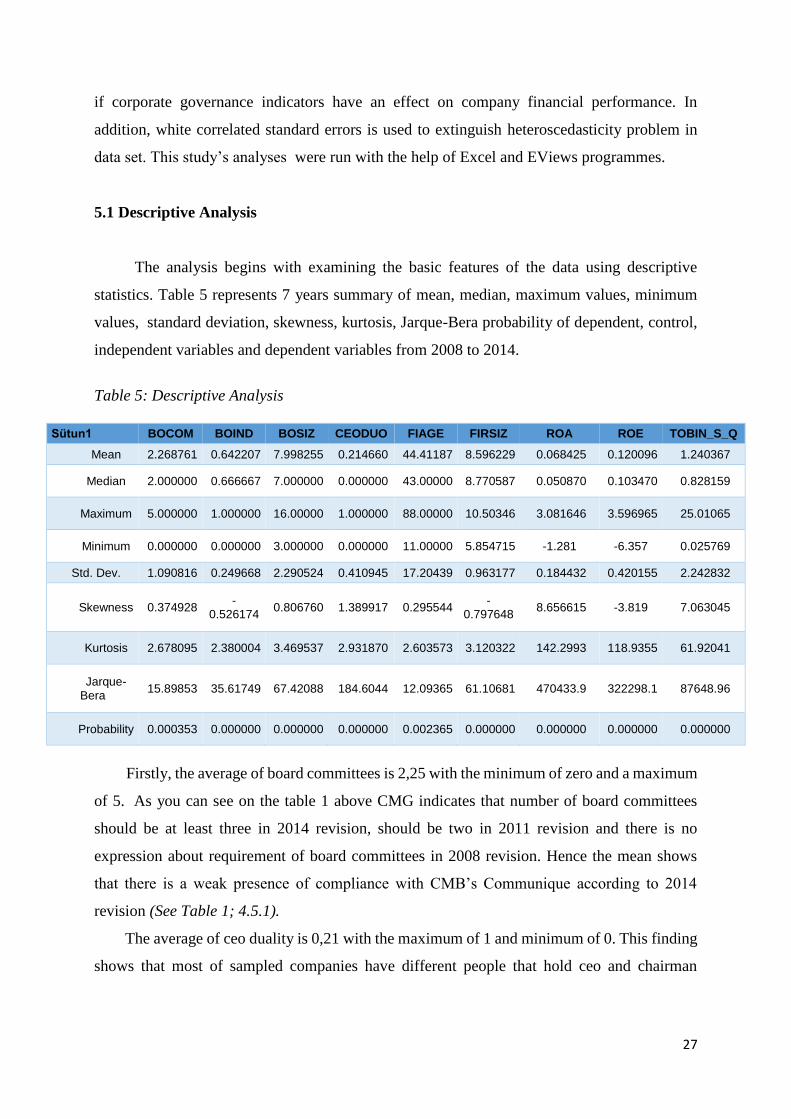
5.1 Descriptive Analysis
The analysis begins with examining the basic features of the data using descriptive
statistics. Table 5 represents 7 years summary of mean, median, maximum values, minimum
values, standard deviation, skewness, kurtosis, Jarque-Bera probability of dependent, control,
independent variables and dependent variables from 2008 to 2014.
Table 5: Descriptive Analysis
Sütun1 BOCOM BOIND BOSIZ CEODUO FIAGE FIRSIZ ROA ROE TOBIN_S_Q
Mean 2.268761 0.642207 7.998255 0.214660 44.41187 8.596229 0.068425 0.120096 1.240367
Median 2.000000 0.666667 7.000000 0.000000 43.00000 8.770587 0.050870 0.103470 0.828159
Maximum 5.000000 1.000000 16.00000 1.000000 88.00000 10.50346 3.081646 3.596965 25.01065
Minimum 0.000000 0.000000 3.000000 0.000000 11.00000 5.854715 -1.281 -6.357 0.025769
Std. Dev. 1.090816 0.249668 2.290524 0.410945 17.20439 0.963177 0.184432 0.420155 2.242832
Skewness 0.374928 -
0.526174 0.806760 1.389917 0.295544
-0.797648
8.656615 -3.819 7.063045
Kurtosis 2.678095 2.380004 3.469537 2.931870 2.603573 3.120322 142.2993 118.9355 61.92041
Jarque-Bera
15.89853 35.61749 67.42088 184.6044 12.09365 61.10681 470433.9 322298.1 87648.96
Probability 0.000353 0.000000 0.000000 0.000000 0.002365 0.000000 0.000000 0.000000 0.000000
Firstly, the average of board committees is 2,25 with the minimum of zero and a maximum
of 5. As you can see on the table 1 above CMG indicates that number of board committees
should be at least three in 2014 revision, should be two in 2011 revision and there is no
expression about requirement of board committees in 2008 revision. Hence the mean shows
that there is a weak presence of compliance with CMB’s Communique according to 2014
revision (See Table 1; 4.5.1).
The average of ceo duality is 0,21 with the maximum of 1 and minimum of 0. This finding
shows that most of sampled companies have different people that hold ceo and chairman

28
positions in the company. At the same time the mean shows that most of companies adapt to
the CMB’s recommendations (See Table 1; 4.2.5 and 4.2.6 )
Board independence has an average of 0,639, ranging from 0 to 1. Overall this result
implies that most of board of directors in sampled firms consist of non-executive members.
Since the mean is larger than 0,5 that is non-executive members over total board members, it is
understood that sampled companies complied with CMB’s recommendations about the board
independence principle (See Table 1; 4.3.2.).
The average of board size is 7,97 with the minimum of 3 and a maximum of 16.
Jensen(1983) and Lipton&Lorsh(1992) recommend the board size has optimal number of
maximum of seven to eight members and with the maximum number of 10 to be effective.
Mean of sample companies’ board size support their suggestion with the number of 7,97. But
the maximum number of board size from the descriptive statistics is 16 so this seems much
higher than their findings. Also it is seen that sampled firms complied with CMB’s communique
because mean of 7,97 is bigger than 5 that is suggested by CMB (See Table 1; 4.3.1)
As control variable, the mean of firm age is 44, ranging from 11 to 88. This result shows
that data from sample companies vary in different ages which may make the result more
accurate.
Firm size is a control variable which has a range 5,85 and 10,5 with the mean of 8,59. It is
possible to deduce that sampled companies vary in different sizes hence we get a reliable
conclusion.
The mean of ROA is 6,5% and the mean of ROE is 11%. Both financial performance
measures have positive numbers implying the majority of sampled firms have created
shareholder value over 2008-2014 period. However there is wide deviation between minimum
and maximum values of ROA and ROE. In addition, since ROA and ROE have negative
minimum values there might be a sign of economic downturn. While this paper was
being analysed, it is obviously seen that Turkey had experienced with global crisis during 2008
and 2009 through low ROA and ROE values. Also, TUSIAD clarifies this economic downturn
in its 2009 Economic Report.
‘‘The continuous growth of Turkey that lasted for seven years, decreased in 2009 with only
4.7% growth following the global crisis. All sectors suffered shrinkage except the financial
sector. Private sector had a problem with financial resources as well as loss of production. The
growing intuitive approach of the banks on risk and narrowing of foreign loans had a negative
29
impact on domestic credit volume. Therefore the slowing flow of credit towards real sector
caused a financial distress.’’
Moreover, mean of Tobin’s Q is 1,21 which is higher than 1 so firms have created value
for shareholders. Tobin’s Q of 1,21 might mean that market value of equity is higher than total
asset carrying value. Here the remarkable thing is maximum value of Tobin’s Q which is 25
because this measurement is based on the market value of firm and price of shares might change
incredibly.
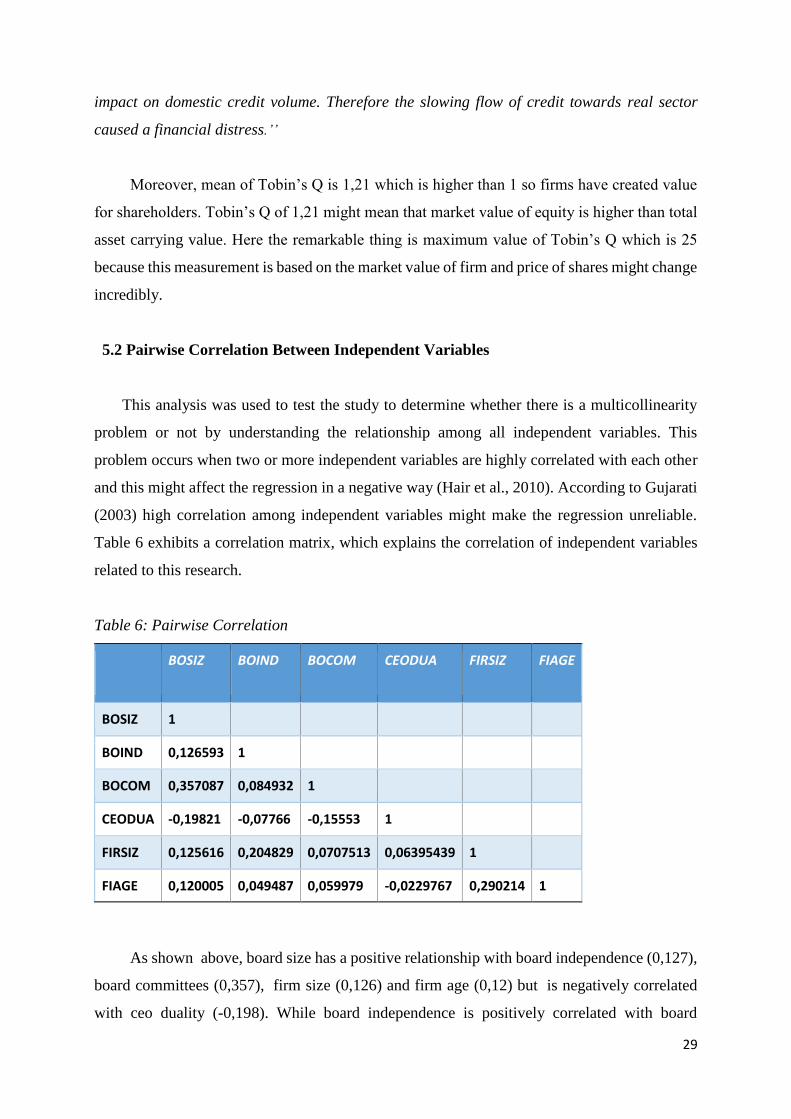
5.2 Pairwise Correlation Between Independent Variables
This analysis was used to test the study to determine whether there is a multicollinearity
problem or not by understanding the relationship among all independent variables. This
problem occurs when two or more independent variables are highly correlated with each other
and this might affect the regression in a negative way (Hair et al., 2010). According to Gujarati
(2003) high correlation among independent variables might make the regression unreliable.
Table 6 exhibits a correlation matrix, which explains the correlation of independent variables
related to this research.
Table 6: Pairwise Correlation
BOSIZ BOIND BOCOM CEODUA FIRSIZ FIAGE
BOSIZ 1
BOIND 0,126593 1
BOCOM 0,357087 0,084932 1
CEODUA -0,19821 -0,07766 -0,15553 1
FIRSIZ 0,125616 0,204829 0,0707513 0,06395439 1
FIAGE 0,120005 0,049487 0,059979 -0,0229767 0,290214 1
As shown above, board size has a positive relationship with board independence (0,127),
board committees (0,357), firm size (0,126) and firm age (0,12) but is negatively correlated
with ceo duality (-0,198). While board independence is positively correlated with board

30
committees (0,085), firm size (0,205) and firm age (0,049), board independence is negatively
correlated with ceo duality (-0,077). Board committees has negative relation with ceo duality
(-0,15,) but it is positively related with firm size (0,07) and firm age (0,059). Although firm
size has a positive association with firm age (0,29), ceo duality has a negative relationship with
firm age (-0,023) but positive association with firm size (0,06).
The highest correlation is between board size and board committees. This positive
correlation was expected since as the number of board of directors increase members that might
be nominated to board committees increase as well. In other words, more board committees can
be constituted with different board members.
Firm age and firm size have the second highest correlation among all independent variables
with the number of 0,29. It is also an expected result because older companies are able to have
more total assets over the period.
The lowest correlation is seen between firm age and ceo duality in a negative way. This
outcome means that when firm age increases, possibility of ceo and chairman that hold same
position in the company decreases. Because a certain portion of the aged companies are run by
families in Turkey, we expected that a person from family hold same position.
Firm size has positive relationships with all independent variables but we expected
that firm size and ceo duality to have negative relationship like the relationship between firm
age and ceo duality but surprisingly test shows that they are positively correlated.
Overall the all outcomes are smaller than 0,80 which is the critical level to determine the
multicollinearity problem (Hair et al., 2010) hence ,the findings show there is no
multicollinearity problem for this analysis.
5.3 Regression Analysis
5.3.1 Relationship between Corporate Governance Variables and Return On Asset
When this analysis is made, at first the Hausman test was run to test the hypothesis that;
Ho: Random effect is appropriate
H1: Fixed effect is appropriate
According to the Hausman test, p-value is 0,043 which is smaller than 0,05 (critical value to
reject or not) so Ho which is null hypothesis was rejected (See Appendix 1). Then by the use
of fixed effect OLS (See Appendix 2) test the hypothesis that;
31
Ho: All dummy variables are zero (Pooled regression model)
H1: All dummy variables are not zero (Fixed effect model)
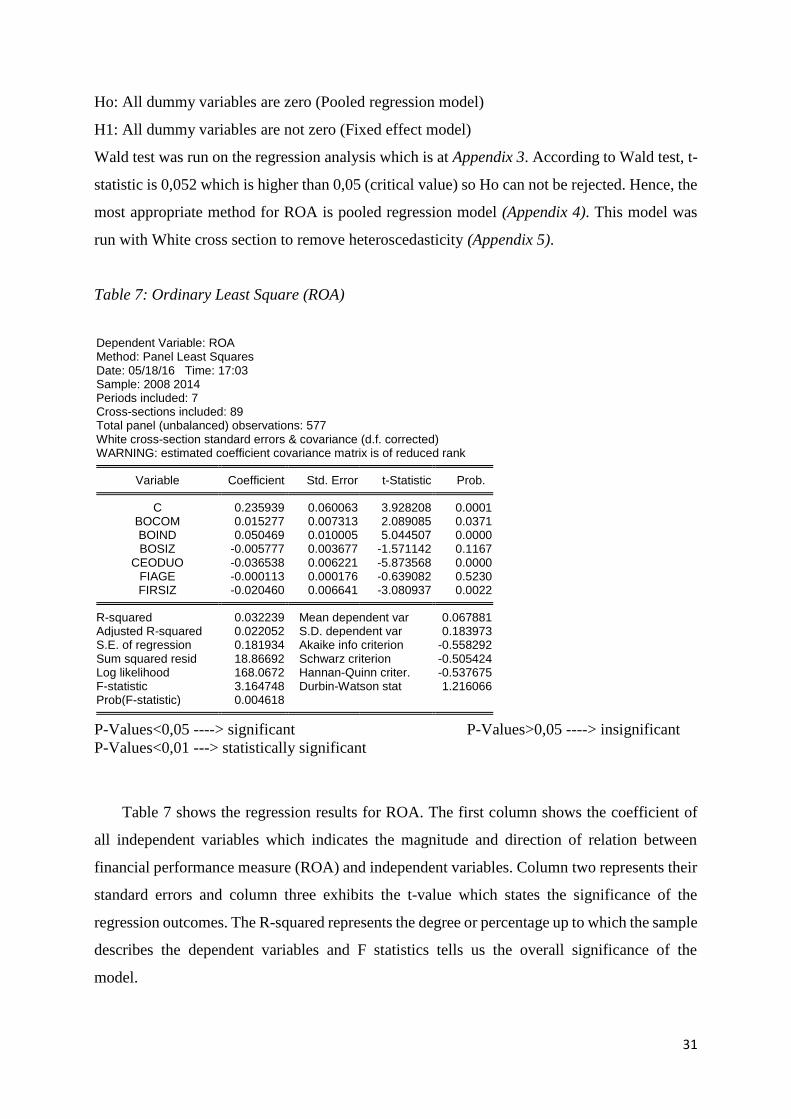
Wald test was run on the regression analysis which is at Appendix 3. According to Wald test, t-
statistic is 0,052 which is higher than 0,05 (critical value) so Ho can not be rejected. Hence, the
most appropriate method for ROA is pooled regression model (Appendix 4). This model was
run with White cross section to remove heteroscedasticity (Appendix 5).
Table 7: Ordinary Least Square (ROA)
Dependent Variable: ROA Method: Panel Least Squares Date: 05/18/16 Time: 17:03 Sample: 2008 2014 Periods included: 7 Cross-sections included: 89 Total panel (unbalanced) observations: 577 White cross-section standard errors & covariance (d.f. corrected) WARNING: estimated coefficient covariance matrix is of reduced rank
Variable Coefficient Std. Error t-Statistic Prob. C 0.235939 0.060063 3.928208 0.0001
BOCOM 0.015277 0.007313 2.089085 0.0371 BOIND 0.050469 0.010005 5.044507 0.0000 BOSIZ -0.005777 0.003677 -1.571142 0.1167
CEODUO -0.036538 0.006221 -5.873568 0.0000 FIAGE -0.000113 0.000176 -0.639082 0.5230 FIRSIZ -0.020460 0.006641 -3.080937 0.0022
R-squared 0.032239 Mean dependent var 0.067881
Adjusted R-squared 0.022052 S.D. dependent var 0.183973 S.E. of regression 0.181934 Akaike info criterion -0.558292 Sum squared resid 18.86692 Schwarz criterion -0.505424 Log likelihood 168.0672 Hannan-Quinn criter. -0.537675 F-statistic 3.164748 Durbin-Watson stat 1.216066 Prob(F-statistic) 0.004618
P-Values<0,05 ----> significant P-Values>0,05 ----> insignificant
P-Values<0,01 ---> statistically significant
Table 7 shows the regression results for ROA. The first column shows the coefficient of
all independent variables which indicates the magnitude and direction of relation between
financial performance measure (ROA) and independent variables. Column two represents their
standard errors and column three exhibits the t-value which states the significance of the
regression outcomes. The R-squared represents the degree or percentage up to which the sample
describes the dependent variables and F statistics tells us the overall significance of the
model.
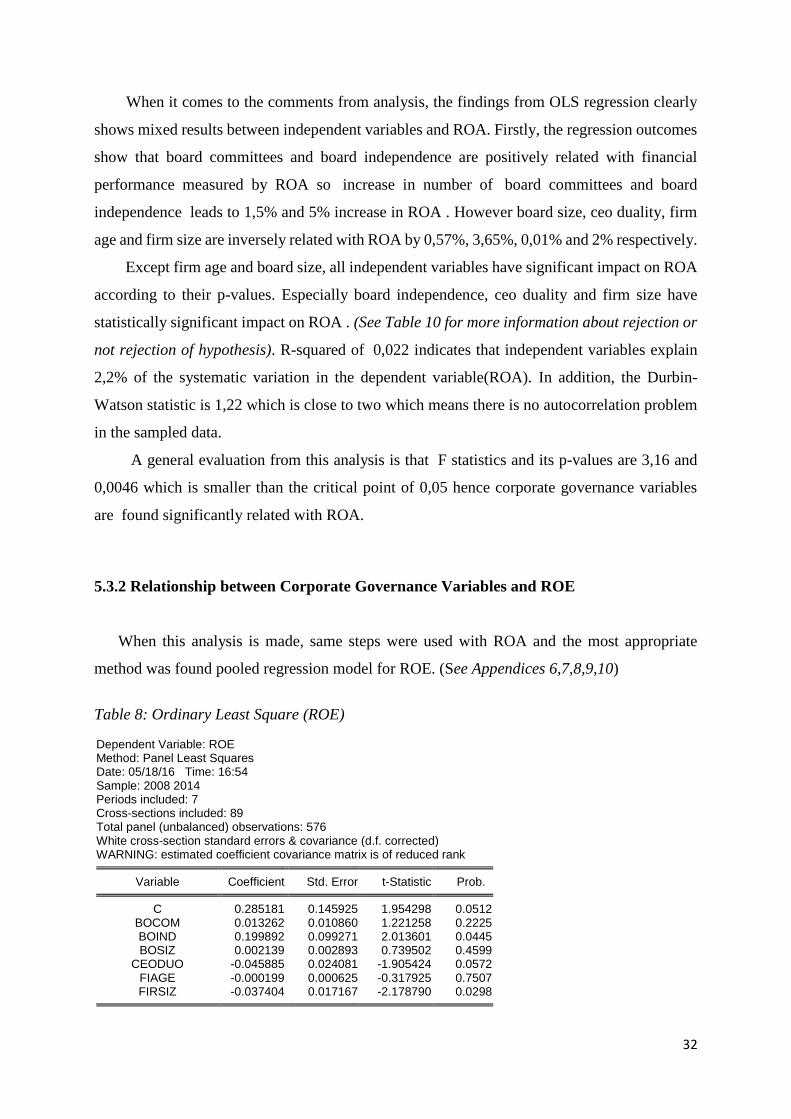
32
When it comes to the comments from analysis, the findings from OLS regression clearly
shows mixed results between independent variables and ROA. Firstly, the regression outcomes
show that board committees and board independence are positively related with financial
performance measured by ROA so increase in number of board committees and board
independence leads to 1,5% and 5% increase in ROA . However board size, ceo duality, firm
age and firm size are inversely related with ROA by 0,57%, 3,65%, 0,01% and 2% respectively.
Except firm age and board size, all independent variables have significant impact on ROA
according to their p-values. Especially board independence, ceo duality and firm size have
statistically significant impact on ROA . (See Table 10 for more information about rejection or
not rejection of hypothesis). R-squared of 0,022 indicates that independent variables explain
2,2% of the systematic variation in the dependent variable(ROA). In addition, the Durbin-
Watson statistic is 1,22 which is close to two which means there is no autocorrelation problem
in the sampled data.
A general evaluation from this analysis is that F statistics and its p-values are 3,16 and
0,0046 which is smaller than the critical point of 0,05 hence corporate governance variables
are found significantly related with ROA.
5.3.2 Relationship between Corporate Governance Variables and ROE
When this analysis is made, same steps were used with ROA and the most appropriate
method was found pooled regression model for ROE. (See Appendices 6,7,8,9,10)
Table 8: Ordinary Least Square (ROE) Dependent Variable: ROE Method: Panel Least Squares Date: 05/18/16 Time: 16:54 Sample: 2008 2014 Periods included: 7 Cross-sections included: 89 Total panel (unbalanced) observations: 576 White cross-section standard errors & covariance (d.f. corrected) WARNING: estimated coefficient covariance matrix is of reduced rank
Variable Coefficient Std. Error t-Statistic Prob. C 0.285181 0.145925 1.954298 0.0512
BOCOM 0.013262 0.010860 1.221258 0.2225 BOIND 0.199892 0.099271 2.013601 0.0445 BOSIZ 0.002139 0.002893 0.739502 0.4599
CEODUO -0.045885 0.024081 -1.905424 0.0572 FIAGE -0.000199 0.000625 -0.317925 0.7507 FIRSIZ -0.037404 0.017167 -2.178790 0.0298
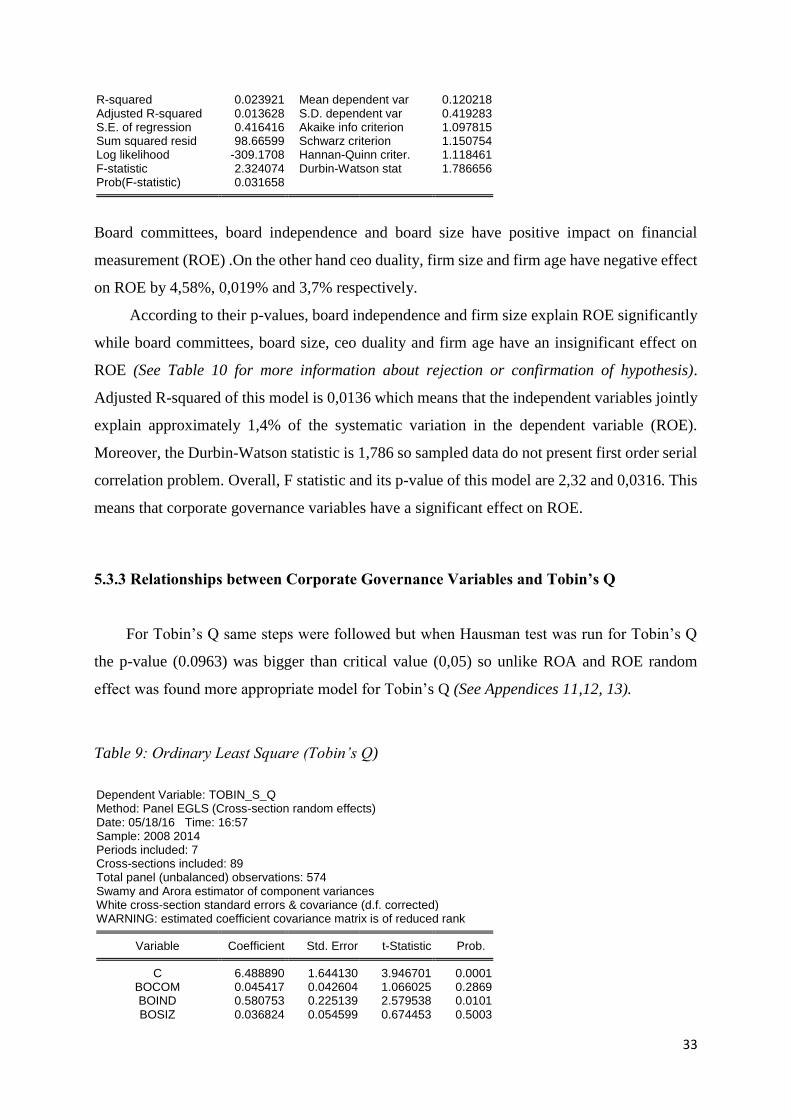
33
R-squared 0.023921 Mean dependent var 0.120218 Adjusted R-squared 0.013628 S.D. dependent var 0.419283 S.E. of regression 0.416416 Akaike info criterion 1.097815 Sum squared resid 98.66599 Schwarz criterion 1.150754 Log likelihood -309.1708 Hannan-Quinn criter. 1.118461 F-statistic 2.324074 Durbin-Watson stat 1.786656 Prob(F-statistic) 0.031658
Board committees, board independence and board size have positive impact on financial
measurement (ROE) .On the other hand ceo duality, firm size and firm age have negative effect
on ROE by 4,58%, 0,019% and 3,7% respectively.
According to their p-values, board independence and firm size explain ROE significantly
while board committees, board size, ceo duality and firm age have an insignificant effect on
ROE (See Table 10 for more information about rejection or confirmation of hypothesis).
Adjusted R-squared of this model is 0,0136 which means that the independent variables jointly
explain approximately 1,4% of the systematic variation in the dependent variable (ROE).
Moreover, the Durbin-Watson statistic is 1,786 so sampled data do not present first order serial
correlation problem. Overall, F statistic and its p-value of this model are 2,32 and 0,0316. This
means that corporate governance variables have a significant effect on ROE.
5.3.3 Relationships between Corporate Governance Variables and Tobin’s Q
For Tobin’s Q same steps were followed but when Hausman test was run for Tobin’s Q
the p-value (0.0963) was bigger than critical value (0,05) so unlike ROA and ROE random
effect was found more appropriate model for Tobin’s Q (See Appendices 11,12, 13).
Table 9: Ordinary Least Square (Tobin’s Q)
Dependent Variable: TOBIN_S_Q Method: Panel EGLS (Cross-section random effects) Date: 05/18/16 Time: 16:57 Sample: 2008 2014 Periods included: 7 Cross-sections included: 89 Total panel (unbalanced) observations: 574 Swamy and Arora estimator of component variances White cross-section standard errors & covariance (d.f. corrected) WARNING: estimated coefficient covariance matrix is of reduced rank
Variable Coefficient Std. Error t-Statistic Prob. C 6.488890 1.644130 3.946701 0.0001
BOCOM 0.045417 0.042604 1.066025 0.2869 BOIND 0.580753 0.225139 2.579538 0.0101 BOSIZ 0.036824 0.054599 0.674453 0.5003

34
CEODUO -0.342800 0.056346 -6.083830 0.0000 FIAGE -0.000800 0.005431 -0.147313 0.8829 FIRSIZ -0.686639 0.191595 -3.583804 0.0004
Effects Specification S.D. Rho Cross-section random 1.392240 0.3998
Idiosyncratic random 1.705912 0.6002 Weighted Statistics R-squared 0.044214 Mean dependent var 0.533329
Adjusted R-squared 0.034100 S.D. dependent var 1.743861 S.E. of regression 1.714126 Sum squared resid 1665.975 F-statistic 4.371539 Durbin-Watson stat 1.537074 Prob(F-statistic) 0.000250
Unweighted Statistics R-squared 0.051591 Mean dependent var 1.239949
Sum squared resid 2728.938 Durbin-Watson stat 0.938360
Board committees, board independence and board size have positive associations with
Tobin’s Q. On the other hand CEO duality, firm age and firm size are inversely correlated with
Tobin’s Q. In the analysis, the effects of board committees, board size and firm age are
insignificant on Tobin’s Q however board independence, ceo duality and firm size are
significant on Tobin’s Q (See Table 10 for more information about rejection or not rejection of
hypothesis). In order of importance, the regression outcomes also indicate that the most
significant relationship is between ceo duality and Tobin’s Q with beta of -0,343 and p value
of 0,000. According to analysis, adjusted R-squared (0,034) indicates approximately 3,4% of
the variability in Tobin’s Q. In addition, durbin watson test resulted with 1,53 which is close to
2 hence the sampled data do not present any presence of autocorrelation problem. F statistics
and its p-value which show overall significance level are 4,37 and 0,00026 which is smaller
than 0,01. This means that overall corporate governance variables have statistically significant
impact on Tobin’s Q.
In summary, these three tables try to explain the effect of corporate governance variables
on financial measurements which are ROA, ROE and Tobin’s Q. Although Tobin’s Q is
strongly influenced by unstable market factors, such as investor behaviour, and market forecasts
the outcomes show that Tobin’s Q is the best measurement for exploring impacts of corporate
governance variables on financial variables . This is because, it has the best adjusted R-squared
which gives the percentage of variation explained by only corporate governance variables that
in reality affect the financial measurements.
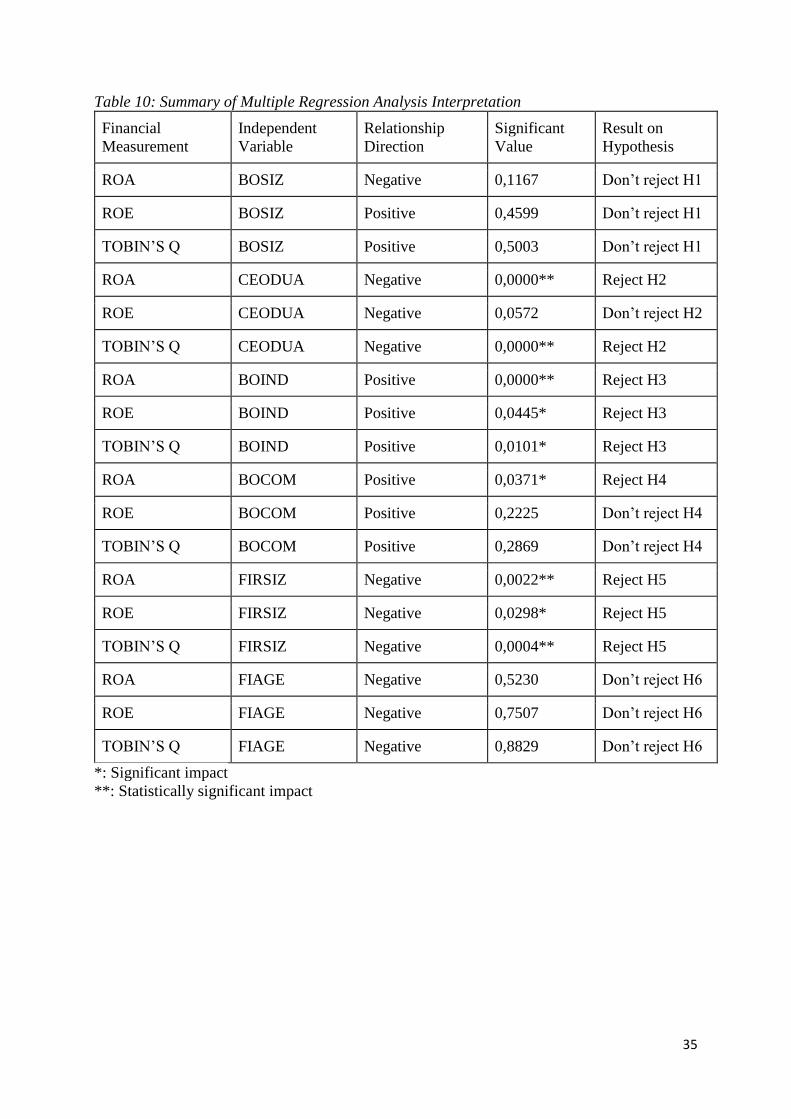
35
Table 10: Summary of Multiple Regression Analysis Interpretation
Financial
Measurement
Independent
Variable
Relationship
Direction
Significant
Value
Result on
Hypothesis
ROA BOSIZ Negative 0,1167 Don’t reject H1
ROE BOSIZ Positive 0,4599 Don’t reject H1
TOBIN’S Q BOSIZ Positive 0,5003 Don’t reject H1
ROA CEODUA Negative 0,0000** Reject H2
ROE CEODUA Negative 0,0572 Don’t reject H2
TOBIN’S Q CEODUA Negative 0,0000** Reject H2
ROA BOIND Positive 0,0000** Reject H3
ROE BOIND Positive 0,0445* Reject H3
TOBIN’S Q BOIND Positive 0,0101* Reject H3
ROA BOCOM Positive 0,0371* Reject H4
ROE BOCOM Positive 0,2225 Don’t reject H4
TOBIN’S Q BOCOM Positive 0,2869 Don’t reject H4
ROA FIRSIZ Negative 0,0022** Reject H5
ROE FIRSIZ Negative 0,0298* Reject H5
TOBIN’S Q FIRSIZ Negative 0,0004** Reject H5
ROA FIAGE Negative 0,5230 Don’t reject H6
ROE FIAGE Negative 0,7507 Don’t reject H6
TOBIN’S Q FIAGE Negative 0,8829 Don’t reject H6
*: Significant impact
**: Statistically significant impact
36
5.4 Discussion
Firstly, we found that when the number of board committees increases ROA, ROE and
Tobin’s Q also increase. Increasing number of committee members, which is an important
variable for corporate governance, means increasing disclosure of information, better protection
of rights and better supervision of decision so increasing number of committee members
improve the quality of good corporate governance. However, these relationships are not
significant for ROE and Tobin’s Q. Only the effect on ROA was found significant.
When we compare the results with previous studies, there are lots of findings that support
the presence of various board committees to increase firm performance. For example;
McMullen (1996) and John&Senbet (1998) stated that increasing number of board committees
ensure companies to have more powerful internal audit so that their financial distress can be
reduced. Also, according to Klein (1998), there is a positive association between remuneration
committee and firm performance but it is not significant. The reason behind insignificance may
that the members of these committees are not independent enough since not only having
different board committees is enough but also firms should give importance to their
independence level. As suggested by Lam et al. (2012), in general, the effectivity of the board
committees depend on the independence of their compositions. Since most of sampled Turkish
companies do not disclose their independence level of board committees in their annual reports,
we cannot confidently say that we found an insignificant relationship between the variables due
to the lack of independent members. Still, it may be the reason or the reason might be the
ineffectiveness of the risk management committee that CMB recommended firstly in 2014
which Turkish companies must have at least 3 committees including Auditing and Corporate
Governance and Early Detection of Risk Committees. In 2011 they required to have at least 2
committees including Auditing and Corporate Governance Committees(See Table 1). In terms
of carrying out this advice, while sampled data was being analyzed, it was clearly seen that
most observations comply with CMB’s recommendations. Hence, expected that after 2011
sampled companies would show better performance with the new committee requirements but
having new committees could not enhance their performance significantly regarding ROE and
Tobin’s Q. However, this finding is coherent with Tufano et al. (1996) stating that risk
management committee is more associated with risk aversion instead of creation of shareholder
value.
Secondly, the study shows that there is a positive and significant relationship between board
independence (board composition) and firm performance in terms of ROA, ROE and Tobin’s
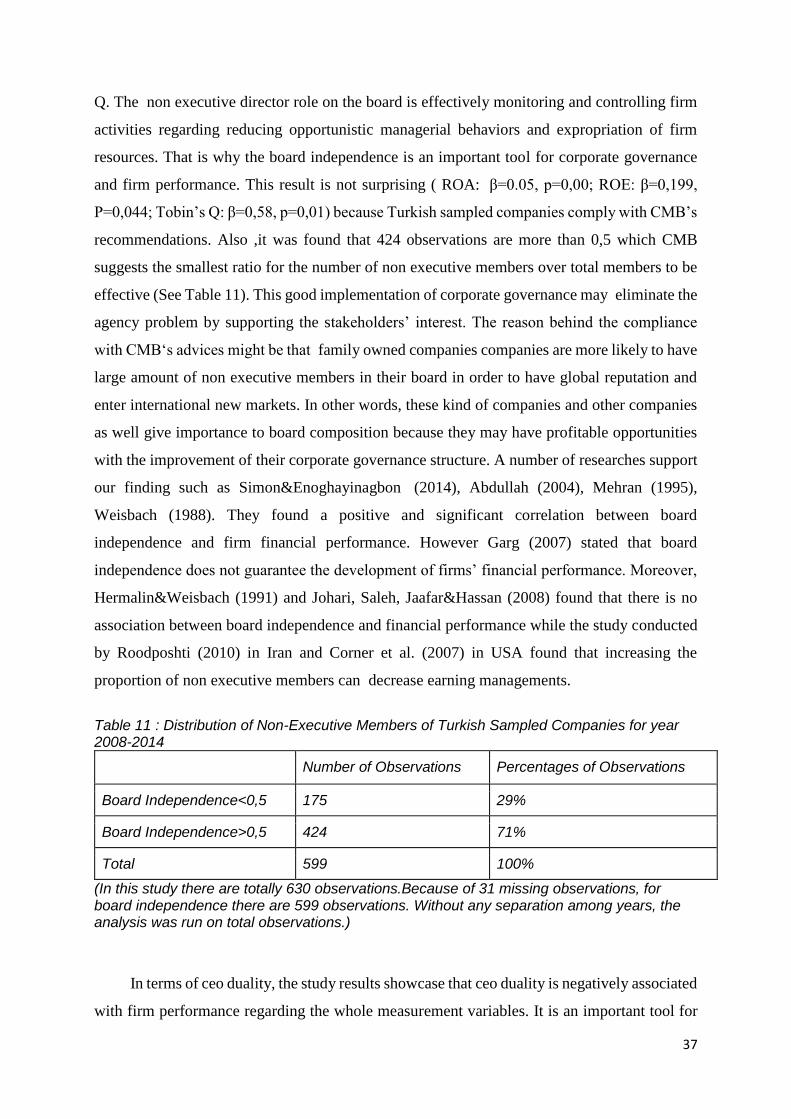
37
Q. The non executive director role on the board is effectively monitoring and controlling firm
activities regarding reducing opportunistic managerial behaviors and expropriation of firm
resources. That is why the board independence is an important tool for corporate governance
and firm performance. This result is not surprising ( ROA: β=0.05, p=0,00; ROE: β=0,199,
P=0,044; Tobin’s Q: β=0,58, p=0,01) because Turkish sampled companies comply with CMB’s
recommendations. Also ,it was found that 424 observations are more than 0,5 which CMB
suggests the smallest ratio for the number of non executive members over total members to be
effective (See Table 11). This good implementation of corporate governance may eliminate the
agency problem by supporting the stakeholders’ interest. The reason behind the compliance
with CMB‘s advices might be that family owned companies companies are more likely to have
large amount of non executive members in their board in order to have global reputation and
enter international new markets. In other words, these kind of companies and other companies
as well give importance to board composition because they may have profitable opportunities
with the improvement of their corporate governance structure. A number of researches support
our finding such as Simon&Enoghayinagbon (2014), Abdullah (2004), Mehran (1995),
Weisbach (1988). They found a positive and significant correlation between board
independence and firm financial performance. However Garg (2007) stated that board
independence does not guarantee the development of firms’ financial performance. Moreover,
Hermalin&Weisbach (1991) and Johari, Saleh, Jaafar&Hassan (2008) found that there is no
association between board independence and financial performance while the study conducted
by Roodposhti (2010) in Iran and Corner et al. (2007) in USA found that increasing the
proportion of non executive members can decrease earning managements.
Table 11 : Distribution of Non-Executive Members of Turkish Sampled Companies for year 2008-2014
Number of Observations Percentages of Observations
Board Independence<0,5 175 29%
Board Independence>0,5 424 71%
Total 599 100%
(In this study there are totally 630 observations.Because of 31 missing observations, for board independence there are 599 observations. Without any separation among years, the analysis was run on total observations.)
In terms of ceo duality, the study results showcase that ceo duality is negatively associated
with firm performance regarding the whole measurement variables. It is an important tool for

38
monitoring and protecting the rights for stakeholders. However negative impact of ceo duality
can be explained significantly by ROA and Tobin’s Q but not by ROE. This result was expected
because the majority of previous studies found a negative relationship. It is also understood
that sampled companies complied with CMB’s advice because for 78% of all observations ceo
and chairman hold different positions in the companies (See Table 12). Holding different
positions for CEO and chairman provide separation of roles and duties of the management and
board of directors. There are several past studies(Dar et al., 2011; Syriopoulos et al., 2012 and
Fama&Jensen, 1983) that also support our result. In addition, Yermack (1996) found that firms
that have different CEOs and chairman are more able to create value and according to
Koufopoulos et al. (2010), since a ceo has an influential power on companies strategic decision,
a ceo that has a dual role, affects board decisions and firm performance in a negative way.
Unlike Koufopoulos et al. (2010) and Yermack (1996), Simpson&Gleason (1999) found a
positive association between variables. This is because they stated that the dual role eliminates
possible conflict between CEO and chairman and the confusion of two representatives from the
perspective of stakeholders.
Table 12: Distribution of Ceo Duality of Turkish Sampled Companies for year 2008-2014
Number of Observations
Percentages of Observations
If the Chairman and CEO are same 132 21%
If the Chairman and CEO are not same
474 79%
Total 606 100%
(In this study there are totally 630 observations. Because of 24 missing observations ,for ceo duality there are 606 observations. Without any separation among years, the analysis was run on total observations.)
Fourthly, this study showcases that board size has insignificant effect on all measurements
but its directions are mixed for different financial variables. While board size is positively
correlated with ROE and Tobin’s Q, it is negatively associated with ROA. The result from
regression analysis was not expected because sampled companies complied CMB’s advice. It
is found that 94% of all observations that present board size are bigger than 5 that was set up
as critical size for board by CMB. It is a very surprising result for ROA since most companies
comply with CMB’s recommendations. (See Table 13).
Increasing board size might have two possible outcomes on financial measurement.
Increasing board size can cause either the diversification of present ideas or a clash of ideas

39
and poorer connection among members. So the reason for having an insignificant relation for
ROA, ROE and Tobin’s Q and the reason of having negative relation for ROA might be less
diversity, clash of ideas or poorer connection. Concurring with this study, Tze et al. (2015) also
found that there is a positive relationship between board size and financial performance for
Malaysian oil and gas companies like Simon et al. (2014), Mohamed (2009). However
Connelly&Limpaphayom (2004) could not find any relationship between board size and
financial performance.
Table 13 : Distribution Board Size of Turkish Sampled Companies for year 2008-2014
Number of Observations Percentages of Observations
Board Size<5 65 10%
Board Size>5 549 90%
Total 614 100%
(In this study there are totally 630 observations. Due to 16 missing observations ,for board size there are 614 observations. Without any separation among years, the analysis was run on total observations.)
The other implication from this study is that firm size is negatively and significantly
correlated with all financial measurements so financial measurements can be explained by firm
size variable. These findings are supported with several previous researches (Nenova, 2003;
Garen, 1994). They state that larger companies need more supervision which will lead to extra
costs for firms. Agrawal&Knoeber (1996) handle this subject with another perspective. When
company size increases, management might lose its control on decision-making and this will
lead to less efficiency for firms. Also Jensen and Meckling (1976) represent that large firms
might likely cause an agency problem which would make the agency cost increase. However
some studies (Black et al., 2006; Serrasqueiro&Nunes, 2008; Short&Keasey, 1999) show that
there is a positive relationship between firm size and financial performance.
Finally, This study found that firm age is negatively correlated with all financial
performance variables. This result shows that younger firms are better about fitting in the
business environment and catching growth opportunities and our findings are in line with
Lipczinsky and Wilson (2001) and Black et al. (2006) but not coherent with Claessens et al.
(2002), Evans (1987) and Boone et al. (2007).
40
6.CONCLUSION
This paper analyzed the effect of corporate governance among 90 Turkish listed companies
between 2008 and 2014. In order to measure corporate governance effects, six variables which
are board size, board composition (independence), board committees, ceo duality, firm size
(control variable) and firm age (control variable) were chosen. This is because, comparing the
same independent variables with previous studies was aimed and it was hoped that these
variables would have influence on firm performance. On the other hand ROA, ROE and Tobin’s
Q were selected as the tools to measure firm financial performance.
The aim of this study was to explore whether there was an association between corporate
governance variables and firm performance of Turkish listed companies or not. The result of
the study shows us good corporate governance practices significantly improve firm
performances of sampled companies as we can understand from p-values that represent general
significance of multiple regression analysis (P-values; ROA; 0.0046, ROE; 0.032, Tobin’s Q;
0.0003). From these findings, firms should understand that improving good corporate
governance applications is a significant tool to achieve financial sustainability, good financial
performance and market value.
The study provides an important insight into the Turkish financial market and Turkish
companies in terms of corporate governance practices. The findings in this study contribute to
various areas; the most importantly, the result may be a good guideline for stakeholders and
managers to understand whether companies have good corporate governance practices or not.
Secondly, because corporate governance contributes to country’s economy and company
performance, government might give more importance to improve the corporate governance by
making new regulations or recommendations. Finally, unlisted firms can improve its
compliance level with good corporate governance practices like listed sampled firms that
complied with CMB’s recommendations and showed better performance.
When it comes to the recommendations concluded from the results, they might support
company’s notion to develop firm performance in the following ways. Unlike most of previous
studies in this field, increasing board size improves firm market performance regarding to ROE
and Tobin’s Q so that Turkish firms should enlarge their number of board members to have a
more diverse ideas in order to have better financial performance. Also, the effect of board
independence was found the most significant variable since it is both related positively and
significantly to all measurements. Therefore, good corporate governance practices decrease
41
possible corporate issues by the help of non-executive directors in the monitoring and auditing
process. Thirdly, board committees have a positive association with all financial tools which
means that companies with large numbers of board committees can generate more profit than
companies with smaller number of committees. Finally, the positions of ceo and chairman of
board of directors should be held by different executives according to the results from the
analysis which remarks a negative correlation with all measurements to protect interests of
shareholders and enhance the firm value. Implementation of these advices can enhance firm’s
financial performance and market value by attracting more capital and forming a beneficial
business environment with a greater degree of investor confidence which might increase
stakeholders’ wealth and the country’s financial stability. Significance of corporate governance
will continue to increase in the following years as long as firms want to be in competition to
survive in the constantly changing market.
In conclusion, in this paper we firstly aimed to show the significant effect of corporate
governance practices on the company’s financial performance and market value. Hereby, with
this study we accomplished our goal. We hoped that this study will be beneficial for Turkish
companies to improve good corporate governance practices which in turn increase their firm
performance.
6.1 Future Directions For Research
This study might be extended in various aspects and some possible ways are identified
below.
Firstly, in this paper the time period was taken as 2008-2014. In order to be more accurate,
this time period might be extended to more than 8 years. When it comes to the other direction,
number of independent variables can be increased to be able to include most of the corporate
governance indicators. Thirdly, since this study was concentrated only on Turkey, future
research may include more than one country that is called as both developing and developed
country like Turkey. By including more than one country, corporate governance practices and
impacts of these countries can be displayed comparatively. Another recommendation for future
research could be using primary data to have more reliable results. Lastly, in this paper, 90
companies from BIST Indexes were used as sampled data however future studies may make
the analysis by using all companies in BIST indices to give a more reliable perspective and
generalize the findings. Another possibility to generalize the results could be using companies

42
from all sizes or all cities in Turkey. Because BIST Indices include large companies and large
companies are generally located in big cities, companies which are run in small cities could not
be analyzed. Hence, using various companies from different parts of Turkey would create a
more accurate outcome to understand general perspective of corporate governance practices on
Turkish firms.

43
REFERENCES
Abdullah, R., 2012, Oil and Gas Industry: Opportunities and Challenges
ahead, Malaysia Oil gas
Abdullah, S.N., 2004, Board Composition, Ceo Duality and Performance
Among Malaysian Listed Companies, Corporate Governance, 4(4): 47-61
Adams, R., & Mehran, H., 2003, Is Corporate Governance Different for Bank Holding
Companies? Economic Policy Review, 9, 123-142.
Adewale, Muritala Taiwo; Rahmon, Tella Adeniran, 2014, Does Corporate Social
Responsibility Improve an Organization's Financial Performance? - Evidence from Nigerian
Banking Sector, IUP Journal of Corporate Governance Vol. 13, No. 4
Adjaoud, F., D. Zeghal, and S. Andaleeb, 2007, The effect of board quality on performance:
A study of Canadian firms, Corporate Governance: An International Review 15, 623–635.
Agrawal, Anup and Charles R. Knoeber, 1996, Firm Performance and Mechanisms to
Control Agency Problems Between Managers and Shareholders, Journal of Financial and
Quantitative Analysis 31, 377-397.
Al-Matari, 2014, Asian Journal of Finance & Accounting, Vol. 6, No. 1
Ammar Ali Gull, Asif Saeed and Ammar Abid, 2013, African Journal of Business
Management
Andrei Shleifer, and Robert Vishny, 2000, Investor Protection and Corporate Governance,
Journal of Financial Economics 58 (1-2): 3-27.
Arif Saldanlı, 2012, Kurumsal Yönetim Endeks Performansının Analizi, Ekonomik ve
Sosyal Araştırmalar Dergisi, Cilt:8, Yıl:8, Özel Sayı, 8, 137-154
Bairathi, V., 2009, Corporate governance: A suggestive code. International Research Journal,
11(6), 753-754.
Baltagi, B. H, In A. Ullah and D. E. A. Giles 1998. Specification Testing For Panel Data
Models, Handbook of Applied Economic Statistics.
Bauer, Guenster and Otten, 2004, 'Empirical Evidence on Corporate Governance in Europe:
The Effect on Stock Returns, Firm Value and Performance', in Journal of Asset Management,
Vol. 5, No. 2, pp. 91-104.
Baydoun, N, Maguire, W, Ryan, N & Willett, R, 2013, Corporate governance in five Arabian
Gulf countries, Managerial Auditing Journal, vol. 28, no. 1, pp. 7-22.
Benjamin Fung, 2014, The Demand and Need for Transparency and Disclosure in Corporate
Governance, Universal Journal of Management 2(2): 72-80
44
Berle, A. A. and Means, G. C., 1932, The Modern Corporation and Private Property,
Macmillan, NY
Bernard Black Hasung Jang Woochan Kim, 2005, Does Corporate Governance Predict
Firms’ Market Values? Evidence From Korea, ECGI Working Paper Series in Finance,
Working Paper N°86/2005
Bhagat, Sanjai and Bernard Black, 2002, The non-correlation between board independence
and long term firm performance, Journal of Corporation Law 27, 231-274
Bhimani, A., 2008, Making Corporate Governance Count: The Fusion of Ethics and
Economic Rationality, Journal of Management and Governance, Vol. 12, No. 2, 135-147
Bhagat, S., & Black, B., 1998, Board Independence and Long-term Performance. University
of Colorado.
Black, B. S., Love, I., & Rachinsky, A., 2006, Corporate Governance Indices and Firms‘
Market Values: Time Series Evidence from Russia. Emerging Markets Review, 7(4), 361-
379.
Black, B. S., Jang, H., & Kim, W., 2006, Does Corporate Governance Predict Firms‘ Market
Values? Evidence from Korea.Journal of Law, Economics, and Organization, 22(2), 366-
413.
Bliss, M., 2011, Does CEO Duality Constrain Board Independence? Some
Evidence from Audit Pricing”, Accounting & Finance, 51(2): 361-380.
Bob Tricker Corporate Governance: An International Review, Volume 8, Issue 4, 289–296
Boone, A. L., Casares Field, L., Karpoff, J. M., & Raheja, C. G., 2007, The Determinants of
Corporate Board Size and Composition: An Empirical Analysis. Journal of Financial
Economics, 85(1), 66-101.
Bozec and Dia., 2007, Board Structure and Firm Technical Efficiency: Evidence from
Canadian State-owned Enterprises European Journal of Operational Research, 177, 1734–
1750
Brian K. Boyd, 1995, CEO duality and firm performance: A Contingency Model, Strategic
Management Journal: Volume 16, Issue 4, 301–312
Brown, S. and Hillegeist, S. A., 2005, Disclosure Quality and Information Asymmetry,
Working Paper, Emory University,
Burcu Adiloğlu, Bengü Vuran, 2012, The Relationship Between The Financial Ratios And
Transparency Levels Of Financial Information Disclosures Within The Scope Of Corporate
Governance: Evidence From Turkey The Journal of Applied Business Research –Volume 28,
Number 4
45
Claessens, S. Djankov, J. Fan & L. Lang, 2003, When Does Corporate Diversification Matter
to Productivity and Performance? Evidence from East Asia. Pacific-Basin Finance Journal,
11 (3), 365-392.
Claessens, S., Djankov, S., Fan, J. P., & Lang, L. H., 2002, Disentangling the Incentive and
Entrenchment Effects of Large Shareholdings.The Journal of Finance, 57(6), 2741-2771.
Chan, K. C. and Li, J., 2008, Audit Committee and Firm Value: Evidence
on Outside Top Executives as Expert Independent Directors, Corporate
Governance: An International Review, 16(1):16-31.
Charles P. Himmelberg, R. Glenn Hubbard & Darius Palia, 1999, Understanding the
determinants of managerial ownership and the link between ownership and performance,
Journal of Financial Economics 53, 353-384
Chen, H.L., 2011, Does Board Independence Influence the Top Management Team?
Evidence from Strategic Decisions Towards Internalisation, Corporate Governance: An
International Review, 19(4): 334-350.
Cheng, S., 2008, Board Size and the Variability of Corporate Performance.
Journal of Financial Economics, 87, 157-176
Clarkson, M. B. E., 1995, A Stakeholder Framework for Analyzing and Evaluating
Corporate Social Performance, Academy of Management Review, Vol. 20, No. 1, 92-117
CMB, website: http://www.cmb.gov.tr/
Connelly, J. T. and Limpaphayom, P., 2004, Board Characteristics and Firm Performance:
Evidence From The Life Insurance Industry in Thailand. Chulalongkorn Journal of
Economics, 16(2): 101-124.
Cretu, R. F., 2012, Corporate Governance and Corporate Diversification Srategies,
Revista de Management Comparat International, 13, 621-633.
Cuhruk, H., Özkan,A., 2004, Equity Research Turkey Special Report, Vol 9, s. 3-15
Daily, C. M., & Dalton, D. R., 1994, Bankruptcy and Corporate Governance: The Impact of
Board Composition and Structure. Academy of Management Journal, 37(6), 1603-1617.
Daily, M.D., Dalton, D.R., & Cannella, A.A., 2003, Corporate Governance: Decades of
Dialogue and Data, Academy of Management Review, 28(3), 371-382
Dalton, D.R., Hitt, M.A., Certo, S.T. and Dalton, C.M., 2008, The Fundamental Agency
Problem and Its Mitigation: Independence, Equity, and the Market For Corporate Control, in
J.P Walsh and A.P. Brief, Annals of the Academy Management, (1):1-64.
Dalton, D. R. and Dalton, C.M., 2011, Integration of Micro and Macro Studies in
Governance Research: Ceo Duality, Board Composition, and Financial Performance”,
Journal of Management, 37(2): 404-411.
46
Damodar N. Gujarati, 2003, Basic Econometrics, McGraw Hill, 1002
Dar L.A, Nassem M.A. and Rehman R.U., 2011, Corporate Governance and Firm
Performance a Case Study of Pakistan Oil and Gas Companies Listed in Karachi Stock
Exchange, Global Journal of Management and Business Research, (1):8.
De Andres, P., Azofra, V. and Lopez, F., 2005, Corporate Boards in OECD Countries: Size,
Composition, Functioning and Effectiveness”, International Review, 13(2): 197-210.
Demsetz, H., & Lehn, K., 1985, The Structure of Corporate Ownership: Causes and
Consequences. The Journal of Political Economy, 93(6), 1155-1177.
Donaldson, T. and Preston, L.E., 1995, The Stakeholder Theory of the Corporation:
Concepts, Evidence and Implications, Academy of Management Review, Vol. 20, No. 1, 65-
91
Dorothy A. McMullen, 1996, Audit Committee Performance: An Investigation of the
Consequences With Audit Committees’ Article in Auditing A Journal of Practice & Theory
15(1)
Eric Ernest Mang’unyi, 2011, Ownership Structure and Corporate Governance and Its
Effects on Performance: A Case of Selected Banks in Kenya
Evans, D. S., 1987, The Relationship between Firm Growth, Size, and Age: Estimates for
100 Manufacturing Industries. The Journal of Industrial Economics, 567-581.
Fama, E. F., & Jensen, M. C., 1983, Agency Problems and Residual Claims, Journal of Law
and Economics, 26(2), 327-349
Fama, E. F., & Jensen, M. C., 1983, Separation of Ownership and Control, Journal
of Law and Economics, 26(2), 301-325
Fama, E. F., & Jensen, M. C., 1983, Agency Problems and Residual Claims,
Journal of Law and Economics, XXVI, 327-347.
Feleaga, N., Feleaga L., Gragomir, V.D.,&Bigioi, A.FD, 2011, Corporate Governance In
Emerging Economies: The Case For Romania, Theoretical and Applied Economics, 18(9), 5-
16
FR Roodposhti, SAN Chashmi, 2010, The effect of board composition and ownership
concentration on earnings management: evidence from Iran, World Academy of Science,
Engineering and Technology 66, 165-171
Freeman, R. E., 1984, Strategic Management: A Stakeholder Approach, Pitman, London
Freeman, R.E., 1999, Response: Divergent Stakeholder Theory, Academy of Management
Review, Vol. 24, No. 2, 233-23
47
Fülöp, M., 2014, Why do we need effective corporate governance? International
Advances in Economic Research, 20, 227-228.
Garen, J. E., 1994, Executive Compensation and Principal-Agent Theory.Journal of Political
Economy, 1175-1199.
Garrett, A. D., 2004, Themes and Variations: The Convergence of Corporate Governance
Practices in Major World Markets. Denver Journal of International Law and Policy. 32,149.
Ghabayen, M., 2012, Board characteristics and firm performance: Case of Saudi Arabia.
International Journal of Accounting and Financial Reporting, 2(2), 168-200.
Gürbüz, A. Osman, Ergincan, 2004, Kurumsal Yönetim: Türkiye’deki Durumu ve
Geliştirilmesine Yönelik Öneriler, Literatür Yayıncılık, İstanbul.
Habbash, M., & Bajaher, M. S., 2014, An empirical analysis of the impact of board structure
on the performance of large Saudi firms. The Business Review, Cambridge, 22(1), 152-158.
Hackman, J. R., 1990, Groups that Work. San Francisco, CA: Jossey-Bas.
Jensen, M.C. and Meckling, W. H. (1976) Theory of the Firm: Managerial Behaviour,
Agency Costs and Ownership Structure, Journal of Financial Economics, 3(4): 305-360.
Hagat, S., D. C. Carey, and C. M. Elson, 1999, Director ownership, corporate performance,
and management turnover, Business Lawyer 54, 885–919.
Helen Wei Hu, On Kit Tam, Monica Guo-Sze Tan, Firm Performance in China”, Asia Pac
Journal Management, 27:727-749.
Hermalin and Weisbach, 1991, Boards of Directors as an Endogenously Determined
Institution: A Survey of the Economic Literature
Hossain, M., Prevost, A. K., & Rao, R. P., 2001, Corporate governance in New Zealand: The
effect of the 1993 Companies Act on the relation between board composition and firm
performance. Pacific-Basin Finance Journal, 9, 119–145.
Hutchinson and Gul, 2004,Investment opportunity set, corporate governance practices and
firm performance, Journal of Corporate Finance 10, 595-614
Hyun-Han Shin, Rene M. Stulz, 2000, Firm Value, Risk, and Growth Opportunities, National
Bureau of Economic Research, Working Paper 7808
Jackling and Johl, 2009, Board Structure and Firm Performance: Evidence from India's Top
Companies, Corporate Governance: An International Review, 17 (4), 492–509
Jensen, M. C., & Meckling, W. H., 1976, Theory of the Firm: Managerial Behaviour,
Agency Costs and Ownership Structure. Journal of Financial Economics, 3(4), 305-360.
John, K. & Senbet, L.W., 1998, Corporate Governance and Board Effectiveness, Journal of
Banking & Finance, 22, 371-403
48
Johnson and Greening, 1999, The Effects of Corporate Governance And Institutional
Ownership Types On Corporate Social Performance, Academy of Management Journal Vol
42 No:5 564-576
Joseph F. Hair , 2010, Multivariate Data Analysis (7.th edition)
Jun-Koo Kang&Rene M. Stulz, 1996, How Different Is Japanese Corporate Finance? An
Investigation of the Information Content of New Security Issues, Review of Economic
Studies, 9, 109-139
KAP, website: https://www.kap.gov.tr/en/home.aspx
Kee H Chung, Stephen W Pruitt, 1994, A simple Approximation Of Tobin’s Q, Financial
Management, 70-74
Kiel, G., & Nicholson, G., 2003, Board Composition and Corporate Performance: How the
Australian experience informs contrasting theories of corporate governance. Corporate
Governance: An International Review, 11(3), 189–205.
Klein, A., 1998, Firm performance and board committee structure 1, The Journal of Law and
Economics , Vol. 41 No. 1, pp. 275-304.
Klein, A., 2002, Audit committee, board of director characteristics, and earnings
management Journal of Accounting and Economics, 33, 375-400.
Koufopoulos, D., Lagoudis I., Theotokas, I. and Syriopoulos, T., 2010, Corporate
Governance and Board Practices by Greek Shipping Management Companies, Corporate
Governance: The International Journal of Business in Society, 10(3): 261-278.
Lam, T. Y. and Lee, S. K., 2012, Family ownership, Board Committees and
Firm Performance: Evidence from Hong Kong, Corporate Governance.
12(3): 353-366.
Lam, T. Y. and Lee, S. K., 2012, Family ownership, Board Committees and Firm
Performance : Evidence from Hong Kong, Corporate Governance. 12(3): 353-366.
La Porta, R., Lopez-De-Silanes, F. and Shleifer, A., 2000, Investor protection and corporate
governance, Journal of Financial Economics, vol. 58, no. 1-2, pp. 3-27.
Lev, B.B. & S. Sunder, 1979, Methodological issues in the use of financial ratios. Journal of
Accounting and Economics, 1(3), 187-210
Lipczynski, J. and J. Wilson, 2001, Industrial Organization: An Analysis of Competitive
Markets. Prentice Hall, UK.
Lipton, M., & Lorsch, J., 1992, A Modest Proposal for Improved Corporate
Governance. The Business Lawyer, 48(1), 59-77.
Loderer, C. and Peyer, U., 2002, Board Overlap, Seat Accumulation and Share Prices,
European Financial Management, 8, 165-192.
49
Lopez, M. V., Garcia, A., & Rodriguez, L., 2007, Sustainable Development and Corporate
Performance: A study based on the Dow Jones Sustainability Index. Journal of Business
Ethics, 75(3), 285-300.
MacMillan, K., and Downing, S., 1999, Governance and performance: Goodwill hunting,
Journal of General Management, 24(3): 11-21.
Mallin, C. A., 2004, Corporate Governance, Oxford University Press.
Marcus V. Braga-Alves and Kuldeep Shastri, 2011, Corporate Governance, Valuation and
Performance: Evidence from a Voluntary Market Reform in Brazil, Financial Management,
40 139-157.
Mashayekhi, B., & Bazaz, M. S., 2008, Corporate Governance and Firm Performance in Iran,
Journal of Contemporary Accounting & Economics, 4(2), 156–172.
Mcconomy, Bruce J; Bujaki, Merridee L., 2000, Corporate governance: enhancing
shareholder value, CMA Management, 47.8. 10-13
Mehran, H., 1995, Executive Compensation Structure, Ownership, and Firm
Performance.Journal of Financial Economics, 38(2), 163-184.
Michael S. Weisbach, 1988, Outside Directors And Ceo Turnover, Journal of Financial
Economics, 20, 431-460
M. Muth and L. Donaldson, 1998, Stewardship Theory and Board Structure: A Contingency
Approach, Corporate Governance, 6, 5–28
Mohamed .B., 2009, Board of Directors’ Size and Performance in the
Banking Industry, International Journal of Managerial Finance, 5(2), 201 – 221.
Monks and Minow, 1995, Corporate Governance
Musteen, Martina, Deepak K. Datta ve Pol Hermann, 2009, Ownership Structure and CEO
Compensation: Implications for the Choice Foreign Market Entry Modes, Journal of
International Business Studies, 40, 321-338.
Nandini Rajagopalan and Yan Zhang, 2009, Recurring Failures in Corporate Governance: A
global disease?, Business Horizons, 52, 545—552
Nenova, T., 2003, The Value of Corporate Voting Rights and Control: A Cross-Country
Analysis. Journal of Financial Economics, 68(3), 325-351.
N.H. Johari, N. Mohd Saleh, R. Jaffar, M.S. Hassan, 2008, The Influence of Board
Independence Competency and Ownership on Earnings Management in Malaysia.
International Journal of Economics and Business, 2 (2), 281–306
Padilla, A., 2002, “Can Agency Theory Justify The Regulation Of Insider Trading”. The
Quarterly Journal of Austrian Economics, Vol. 5, No. 1, 3-38

50
Pandya, H., 2011, Corporate governance structures and financial performance of
selected Indian banks. Journal of Management & Public Policy, 2(2), 4-21.
Paul Gompers, Joy Ishii and Andrew Metrick, 2003, Corporate Governance And Equity
Prices, The Quarterly Journal of Economics, 118 (1), 107-156.
Pearce, J. H. & Zahra, S. A., 1992, Board Composition from a Strategic Contingency
Perspective. Journal of Management Studies, 29(4), 411-38.
Perfect, Steven B. And Kenneth W. Wiles, 1994, Alternative Construction of Tobin’s Q. An
empirical Comparison, Journal and Empirical Finance, 313-341
Ponnu, C. Y., 2008, Corporate Governance Structures and the Performance of Malaysian
Public Listed Companies, International Review of Business Research Papers, 4(2), 217-230
Randall Morck, Andrei Shleifer & Robert W. Vıshny, 1988, Management Ownership And
Market Valuation An Empirical Analysis, Journal of Financial Economics 20, 293-315
RC Anderson, SA Mansi, DM Reeb, 2004, Board Characteristics, Accounting Report
Integrity, and the Cost of Debt, Journal of Accounting and Economics 37 (3), 315-342
RC Anderson, DM Reeb, 2004, Board Composition: Balancing Family Influence in S&P 500
Firms Administrative Science Quarterly 49 (2), 209-237
Reddy, K., Locke, S., Scrimgeour, F., & Gunasekarage, A., 2008, Corporate governance
practices of small cap companies and their financial performance: An empirical study in New
Zealand. International Journal of Business Governance and Ethics, 4, 51–78.
Roszaini Haniffa & Mohammad Hudaib, 2006, Corporate Governance Practices and Firm
Performance: Evidence from Top 100 Public Listed Companies in Malaysia, Journal of
Business Finance & Accounting Volume 33, Issue 7-8, 1034–1062
Saim Kılıç, 2008, Halka Açık Şirketlerin Kamuyu Aydınlatma, Şeffaflık ve Kurumsal
Yönetim İlkeleri Açısından Mevzuata Uyum Kapasitelerinin Geliştirilmesi, Active, Yıl:10,
Sayı:56.
Saim Kılıç, 2011, İMKB Kurumsal Yönetim Endeksine Dâhil Olan Şirketlerin Getiri
Performanslarının Ölçülmesi, Finans Politik & Ekonomik Yorumlar Cilt: 48 Sayı: 552
Selahattin Yavuz, Suat Yıldırım, Bekir Elmas, 2015, Kurumsal Yönetim Endeksi ile Şirket
Hisse Senedi Getiri İilişkisi: BIST’de Bir Uygulama, Erzincan Üniversitesi Sosyal Bilimler
Enstitüsü Dergisi (ERZSOSDER), VIII-II: 73-82
Serrasqueiro, Z. S., & Nunes, P. M., 2008. Performance and Size: Empirical Evidence from
Portuguese Smes. Small Business Economics, 31(2), 195-217.
Short, H., Keasey, K., Wright, M., & Hull, A., 1999,. Corporate Governance: from
Accountability To Enterprise. Accounting and Business Research, 29(4), 337-352.
51
Shrader, C. B., V. B. Blackburn, and P. Iles, 1997, Women in management and firm financial
value: An exploratory study, Journal of Managerial Issues 9, 355–372.
Simon Ayo Adekunle & Enoghayinagbon Maurice Aghedo Ph.D, Corporate Governance
And Financial Performance of Selected Quoted Companies in Nigeria European Journal of
Business and Management ISSN 2222-1905 (Paper) ISSN 2222-2839 (Online) Vol.6, No.9
Simpson, W. G. and Gleason, A. E., 1999, Board Structure, Ownership, and Financial
Distress in Banking Firms, International Review of Economics and Finance, Vol. 8(3), 281-
292.
SPK, 2005, Corporate Governance Principle, First published date July 2003 Revision:
February 2005, www.cmb.gov.tr
SPK, 2005, Kurumsal Yönetim İlkeleri, İlk Yayınlanma Tarihi: Temmuz 2003 Düzeltilmiş
İkinci Yayınlanma Tarihi: Şubat 2005, www.spk.gov.tr
Sundaram, A.K. and Inkpen, A.C., 2004, The Corporate Objective Revisited Organization
Science, Vol. 15, No. 3, 350-36
Sulaiman, A., 2012, What has Changed? The Development of Corporate Governance in
Malaysia, Journal of Risk Finance, 22.
Syriopoulos, T. and Tsatsaronis, M., 2012, Corporate Governance Mechanisms and Financial
Performance: Ceo Duality in Shipping Firms, Eurasian Business Review, 2(1): 1-30.
TKYD, web site: http://www.tkyd.org/en/default.html
Tricker, R. I., 1994, International Corporate Governance: Text readings and Cases.
Singapore: Prentice-Hall.
Tufano, P. 1996, Who Manages Risk? An Empirical Examination of Risk Management
Practices in the Gold Mining Industry, Journal of finance, 51 (4), 1097-1137
Vo, D. H., & Nguyen, T. M., 2014, The impact of corporate governance on firm
performance: Empirical study in Vietnam. International Journal of Economics and Finance,
6(6), 1-13
Wei, H., Tam, O. and Tan, M., 2010, Internal Governance Mechanisms And Firm
Performance in China, Asia Pac J Manag, 27, 727–749
Weir, C., D. Laing, and P. J. McKnight, 2002, Internal and external governance mechanisms:
Their impact on the performance of large UK public companies, Journal of Business
Finance & Accounting 29, 579–611.
Wei, Q.H., 2012, Petronas to go ‘Full Throttle’ on O&G Projects
Yermack, D., 1997, Good Timing: CEO Stock Option Awards and Company News
Announcements. Journal of Finance, 52(2), 449-476.
52
Yermack, D. (1996). Higher Market Valuation of Companies with a small Board of
Directors. Journal of Financial Economics, 40, 185-211
Zabihollah Rezaee, 2009, Corporate Governance and Ethics The International Journal of
Accounting, 2009, vol. 44, issue 3, 306-307
Zajac, E. J., and J. D. Westphal, 1996, Director reputation, CEO-Board power, and the
dynamics of board interlocks, Administrative Science Quarterly 41, 507–529.
Zhu, Y. and Tian, G. G., 2009, CEO Pay-Performance and Board Independence: The Impact
of Earnings Management in China.
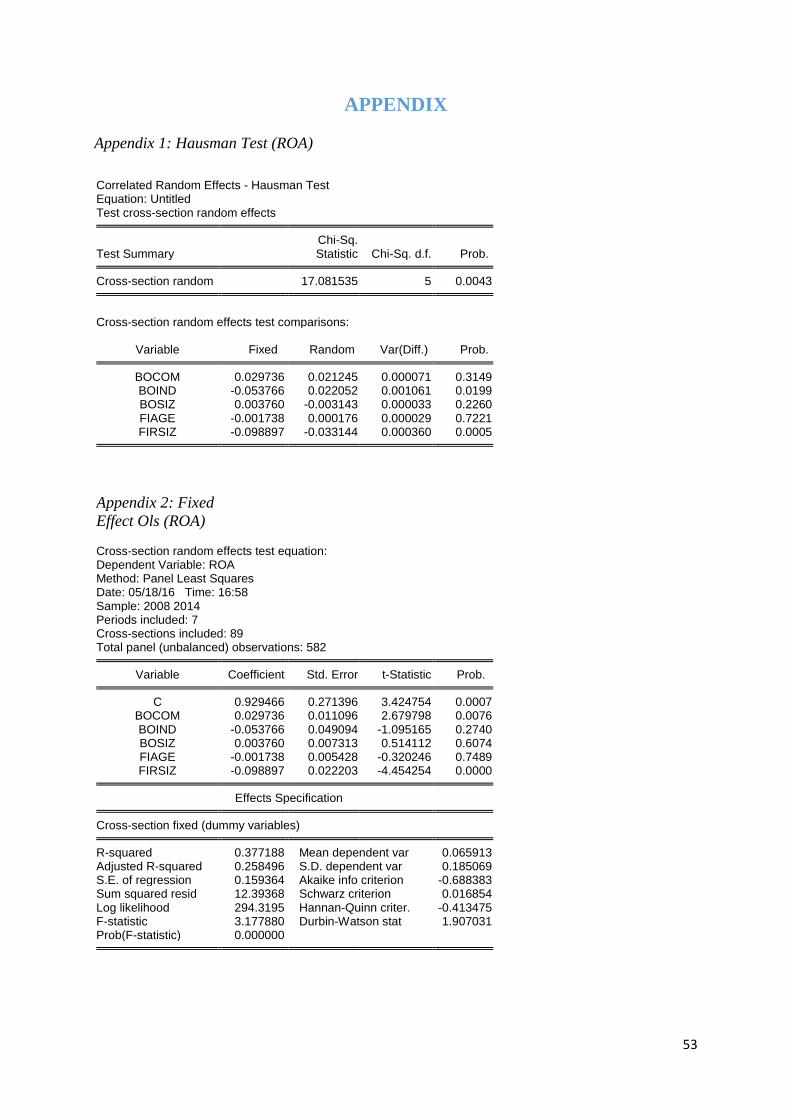
53
APPENDIX
Appendix 1: Hausman Test (ROA)
Correlated Random Effects - Hausman Test Equation: Untitled Test cross-section random effects
Test Summary Chi-Sq. Statistic Chi-Sq. d.f. Prob.
Cross-section random 17.081535 5 0.0043
Cross-section random effects test comparisons:
Variable Fixed Random Var(Diff.) Prob. BOCOM 0.029736 0.021245 0.000071 0.3149
BOIND -0.053766 0.022052 0.001061 0.0199 BOSIZ 0.003760 -0.003143 0.000033 0.2260 FIAGE -0.001738 0.000176 0.000029 0.7221 FIRSIZ -0.098897 -0.033144 0.000360 0.0005
Appendix 2: Fixed
Effect Ols (ROA) Cross-section random effects test equation: Dependent Variable: ROA Method: Panel Least Squares Date: 05/18/16 Time: 16:58 Sample: 2008 2014 Periods included: 7 Cross-sections included: 89 Total panel (unbalanced) observations: 582
Variable Coefficient Std. Error t-Statistic Prob. C 0.929466 0.271396 3.424754 0.0007
BOCOM 0.029736 0.011096 2.679798 0.0076 BOIND -0.053766 0.049094 -1.095165 0.2740 BOSIZ 0.003760 0.007313 0.514112 0.6074 FIAGE -0.001738 0.005428 -0.320246 0.7489 FIRSIZ -0.098897 0.022203 -4.454254 0.0000
Effects Specification Cross-section fixed (dummy variables) R-squared 0.377188 Mean dependent var 0.065913
Adjusted R-squared 0.258496 S.D. dependent var 0.185069 S.E. of regression 0.159364 Akaike info criterion -0.688383 Sum squared resid 12.39368 Schwarz criterion 0.016854 Log likelihood 294.3195 Hannan-Quinn criter. -0.413475 F-statistic 3.177880 Durbin-Watson stat 1.907031 Prob(F-statistic) 0.000000
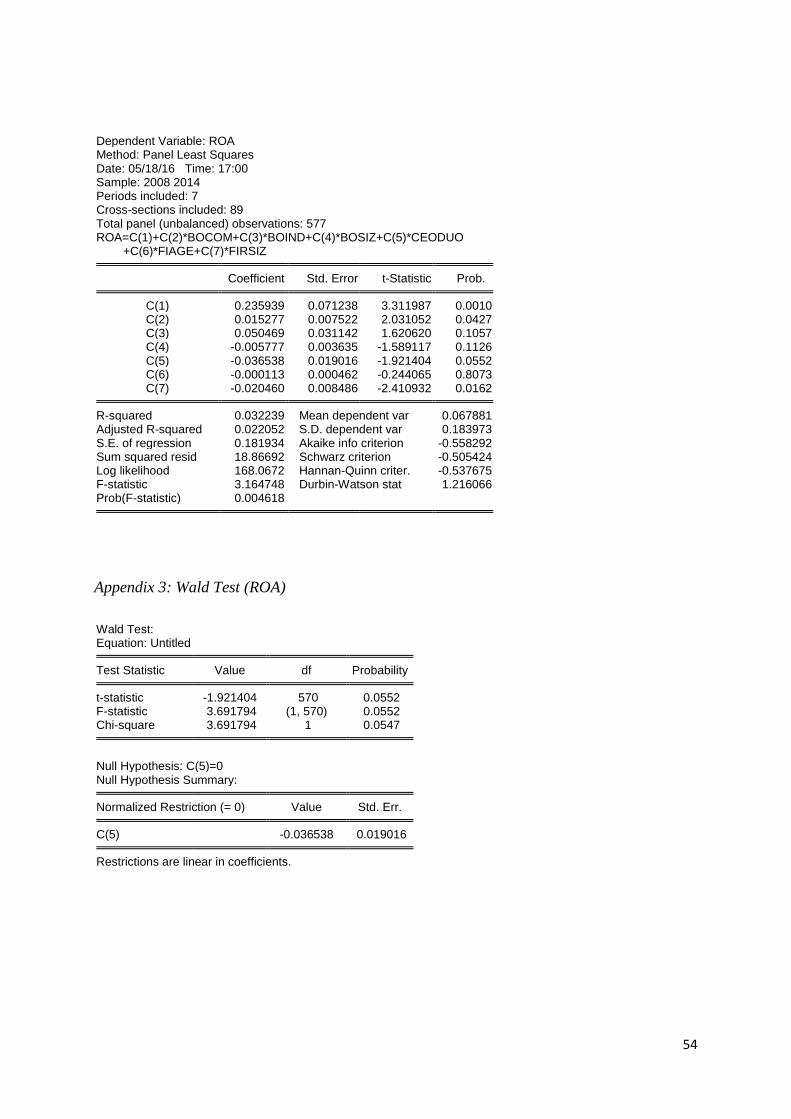
54
Dependent Variable: ROA Method: Panel Least Squares Date: 05/18/16 Time: 17:00 Sample: 2008 2014 Periods included: 7 Cross-sections included: 89 Total panel (unbalanced) observations: 577 ROA=C(1)+C(2)*BOCOM+C(3)*BOIND+C(4)*BOSIZ+C(5)*CEODUO +C(6)*FIAGE+C(7)*FIRSIZ
Coefficient Std. Error t-Statistic Prob. C(1) 0.235939 0.071238 3.311987 0.0010
C(2) 0.015277 0.007522 2.031052 0.0427 C(3) 0.050469 0.031142 1.620620 0.1057 C(4) -0.005777 0.003635 -1.589117 0.1126 C(5) -0.036538 0.019016 -1.921404 0.0552 C(6) -0.000113 0.000462 -0.244065 0.8073 C(7) -0.020460 0.008486 -2.410932 0.0162
R-squared 0.032239 Mean dependent var 0.067881
Adjusted R-squared 0.022052 S.D. dependent var 0.183973 S.E. of regression 0.181934 Akaike info criterion -0.558292 Sum squared resid 18.86692 Schwarz criterion -0.505424 Log likelihood 168.0672 Hannan-Quinn criter. -0.537675 F-statistic 3.164748 Durbin-Watson stat 1.216066 Prob(F-statistic) 0.004618
Appendix 3: Wald Test (ROA)
Wald Test: Equation: Untitled
Test Statistic Value df Probability t-statistic -1.921404 570 0.0552
F-statistic 3.691794 (1, 570) 0.0552 Chi-square 3.691794 1 0.0547
Null Hypothesis: C(5)=0 Null Hypothesis Summary:
Normalized Restriction (= 0) Value Std. Err. C(5) -0.036538 0.019016 Restrictions are linear in coefficients.
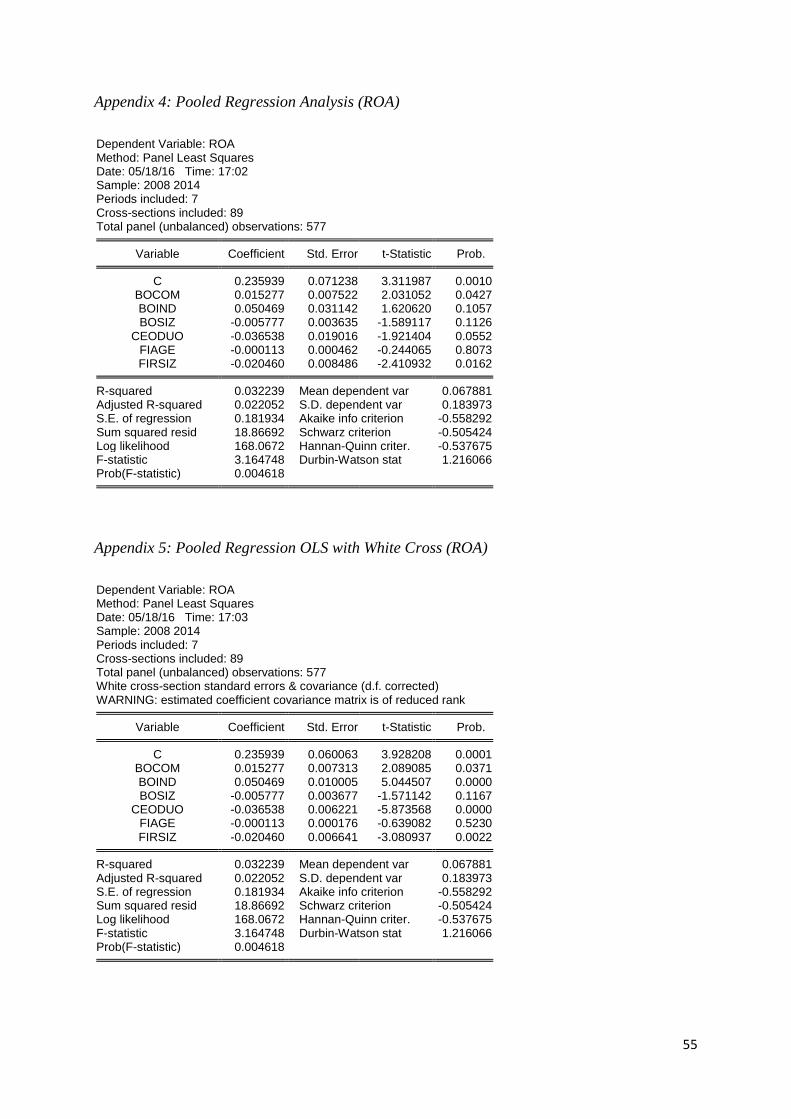
55
Appendix 4: Pooled Regression Analysis (ROA)
Dependent Variable: ROA Method: Panel Least Squares Date: 05/18/16 Time: 17:02 Sample: 2008 2014 Periods included: 7 Cross-sections included: 89 Total panel (unbalanced) observations: 577
Variable Coefficient Std. Error t-Statistic Prob. C 0.235939 0.071238 3.311987 0.0010
BOCOM 0.015277 0.007522 2.031052 0.0427 BOIND 0.050469 0.031142 1.620620 0.1057 BOSIZ -0.005777 0.003635 -1.589117 0.1126
CEODUO -0.036538 0.019016 -1.921404 0.0552 FIAGE -0.000113 0.000462 -0.244065 0.8073 FIRSIZ -0.020460 0.008486 -2.410932 0.0162
R-squared 0.032239 Mean dependent var 0.067881
Adjusted R-squared 0.022052 S.D. dependent var 0.183973 S.E. of regression 0.181934 Akaike info criterion -0.558292 Sum squared resid 18.86692 Schwarz criterion -0.505424 Log likelihood 168.0672 Hannan-Quinn criter. -0.537675 F-statistic 3.164748 Durbin-Watson stat 1.216066 Prob(F-statistic) 0.004618
Appendix 5: Pooled Regression OLS with White Cross (ROA)
Dependent Variable: ROA Method: Panel Least Squares Date: 05/18/16 Time: 17:03 Sample: 2008 2014 Periods included: 7 Cross-sections included: 89 Total panel (unbalanced) observations: 577 White cross-section standard errors & covariance (d.f. corrected) WARNING: estimated coefficient covariance matrix is of reduced rank
Variable Coefficient Std. Error t-Statistic Prob. C 0.235939 0.060063 3.928208 0.0001
BOCOM 0.015277 0.007313 2.089085 0.0371 BOIND 0.050469 0.010005 5.044507 0.0000 BOSIZ -0.005777 0.003677 -1.571142 0.1167
CEODUO -0.036538 0.006221 -5.873568 0.0000 FIAGE -0.000113 0.000176 -0.639082 0.5230 FIRSIZ -0.020460 0.006641 -3.080937 0.0022
R-squared 0.032239 Mean dependent var 0.067881
Adjusted R-squared 0.022052 S.D. dependent var 0.183973 S.E. of regression 0.181934 Akaike info criterion -0.558292 Sum squared resid 18.86692 Schwarz criterion -0.505424 Log likelihood 168.0672 Hannan-Quinn criter. -0.537675 F-statistic 3.164748 Durbin-Watson stat 1.216066 Prob(F-statistic) 0.004618
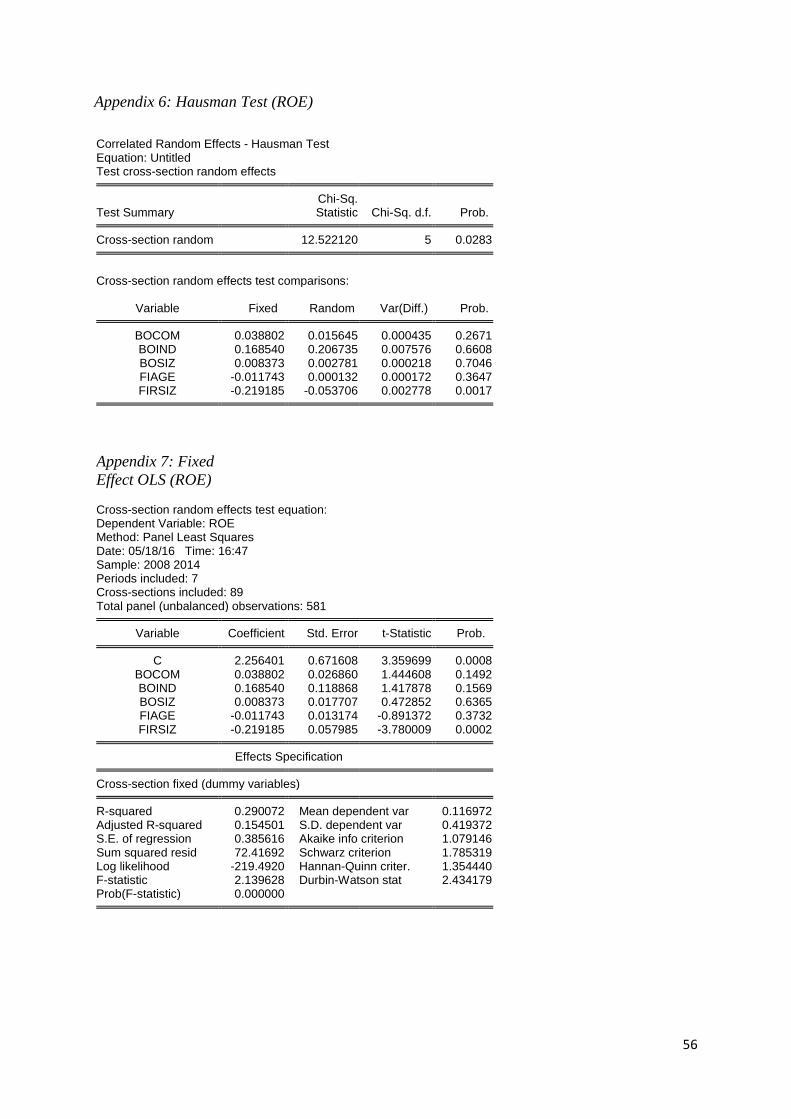
56
Appendix 6: Hausman Test (ROE)
Correlated Random Effects - Hausman Test Equation: Untitled Test cross-section random effects
Test Summary Chi-Sq. Statistic Chi-Sq. d.f. Prob.
Cross-section random 12.522120 5 0.0283
Cross-section random effects test comparisons:
Variable Fixed Random Var(Diff.) Prob. BOCOM 0.038802 0.015645 0.000435 0.2671
BOIND 0.168540 0.206735 0.007576 0.6608 BOSIZ 0.008373 0.002781 0.000218 0.7046 FIAGE -0.011743 0.000132 0.000172 0.3647 FIRSIZ -0.219185 -0.053706 0.002778 0.0017
Appendix 7: Fixed
Effect OLS (ROE)
Cross-section random effects test equation: Dependent Variable: ROE Method: Panel Least Squares Date: 05/18/16 Time: 16:47 Sample: 2008 2014 Periods included: 7 Cross-sections included: 89 Total panel (unbalanced) observations: 581
Variable Coefficient Std. Error t-Statistic Prob. C 2.256401 0.671608 3.359699 0.0008
BOCOM 0.038802 0.026860 1.444608 0.1492 BOIND 0.168540 0.118868 1.417878 0.1569 BOSIZ 0.008373 0.017707 0.472852 0.6365 FIAGE -0.011743 0.013174 -0.891372 0.3732 FIRSIZ -0.219185 0.057985 -3.780009 0.0002
Effects Specification Cross-section fixed (dummy variables) R-squared 0.290072 Mean dependent var 0.116972
Adjusted R-squared 0.154501 S.D. dependent var 0.419372 S.E. of regression 0.385616 Akaike info criterion 1.079146 Sum squared resid 72.41692 Schwarz criterion 1.785319 Log likelihood -219.4920 Hannan-Quinn criter. 1.354440 F-statistic 2.139628 Durbin-Watson stat 2.434179 Prob(F-statistic) 0.000000

57
Dependent Variable: ROE Method: Panel Least Squares Date: 05/18/16 Time: 16:50 Sample: 2008 2014 Periods included: 7 Cross-sections included: 89 Total panel (unbalanced) observations: 576 ROE=C(1)+C(2)*BOCOM+C(3)*BOIND+C(4)*BOSIZ+C(5)*CEODUO +C(6)*FIAGE+C(7)*FIRSIZ
Coefficient Std. Error t-Statistic Prob. C(1) 0.285181 0.163104 1.748463 0.0809
C(2) 0.013262 0.017228 0.769818 0.4417 C(3) 0.199892 0.071284 2.804149 0.0052 C(4) 0.002139 0.008321 0.257073 0.7972 C(5) -0.045885 0.043621 -1.051914 0.2933 C(6) -0.000199 0.001061 -0.187294 0.8515 C(7) -0.037404 0.019454 -1.922659 0.0550
R-squared 0.023921 Mean dependent var 0.120218
Adjusted R-squared 0.013628 S.D. dependent var 0.419283 S.E. of regression 0.416416 Akaike info criterion 1.097815 Sum squared resid 98.66599 Schwarz criterion 1.150754 Log likelihood -309.1708 Hannan-Quinn criter. 1.118461 F-statistic 2.324074 Durbin-Watson stat 1.786656 Prob(F-statistic) 0.031658
Appendix 8: Wald Test (ROE)
Wald Test: Equation: Untitled
Test Statistic Value df Probability t-statistic -1.051914 569 0.2933
F-statistic 1.106523 (1, 569) 0.2933 Chi-square 1.106523 1 0.2928
Null Hypothesis: C(5)=0 Null Hypothesis Summary:
Normalized Restriction (= 0) Value Std. Err. C(5) -0.045885 0.043621 Restrictions are linear in coefficients.
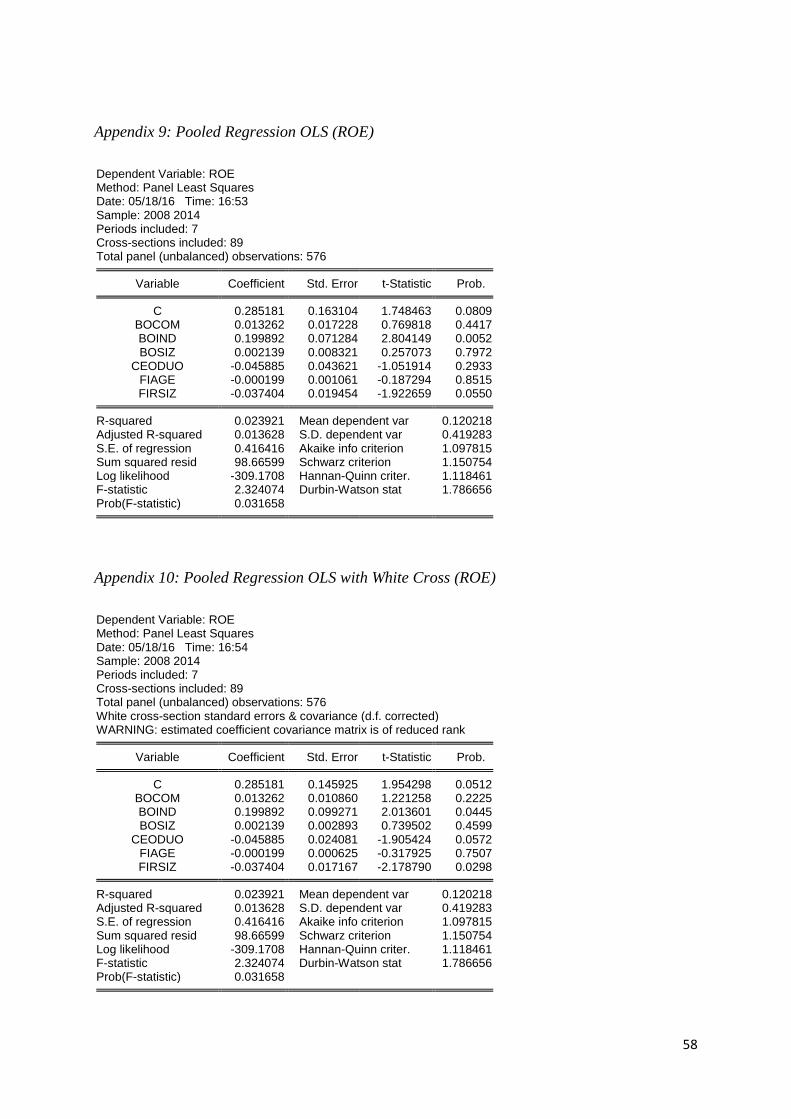
58
Appendix 9: Pooled Regression OLS (ROE)
Dependent Variable: ROE Method: Panel Least Squares Date: 05/18/16 Time: 16:53 Sample: 2008 2014 Periods included: 7 Cross-sections included: 89 Total panel (unbalanced) observations: 576
Variable Coefficient Std. Error t-Statistic Prob. C 0.285181 0.163104 1.748463 0.0809
BOCOM 0.013262 0.017228 0.769818 0.4417 BOIND 0.199892 0.071284 2.804149 0.0052 BOSIZ 0.002139 0.008321 0.257073 0.7972
CEODUO -0.045885 0.043621 -1.051914 0.2933 FIAGE -0.000199 0.001061 -0.187294 0.8515 FIRSIZ -0.037404 0.019454 -1.922659 0.0550
R-squared 0.023921 Mean dependent var 0.120218
Adjusted R-squared 0.013628 S.D. dependent var 0.419283 S.E. of regression 0.416416 Akaike info criterion 1.097815 Sum squared resid 98.66599 Schwarz criterion 1.150754 Log likelihood -309.1708 Hannan-Quinn criter. 1.118461 F-statistic 2.324074 Durbin-Watson stat 1.786656 Prob(F-statistic) 0.031658
Appendix 10: Pooled Regression OLS with White Cross (ROE)
Dependent Variable: ROE Method: Panel Least Squares Date: 05/18/16 Time: 16:54 Sample: 2008 2014 Periods included: 7 Cross-sections included: 89 Total panel (unbalanced) observations: 576 White cross-section standard errors & covariance (d.f. corrected) WARNING: estimated coefficient covariance matrix is of reduced rank
Variable Coefficient Std. Error t-Statistic Prob. C 0.285181 0.145925 1.954298 0.0512
BOCOM 0.013262 0.010860 1.221258 0.2225 BOIND 0.199892 0.099271 2.013601 0.0445 BOSIZ 0.002139 0.002893 0.739502 0.4599
CEODUO -0.045885 0.024081 -1.905424 0.0572 FIAGE -0.000199 0.000625 -0.317925 0.7507 FIRSIZ -0.037404 0.017167 -2.178790 0.0298
R-squared 0.023921 Mean dependent var 0.120218
Adjusted R-squared 0.013628 S.D. dependent var 0.419283 S.E. of regression 0.416416 Akaike info criterion 1.097815 Sum squared resid 98.66599 Schwarz criterion 1.150754 Log likelihood -309.1708 Hannan-Quinn criter. 1.118461 F-statistic 2.324074 Durbin-Watson stat 1.786656 Prob(F-statistic) 0.031658
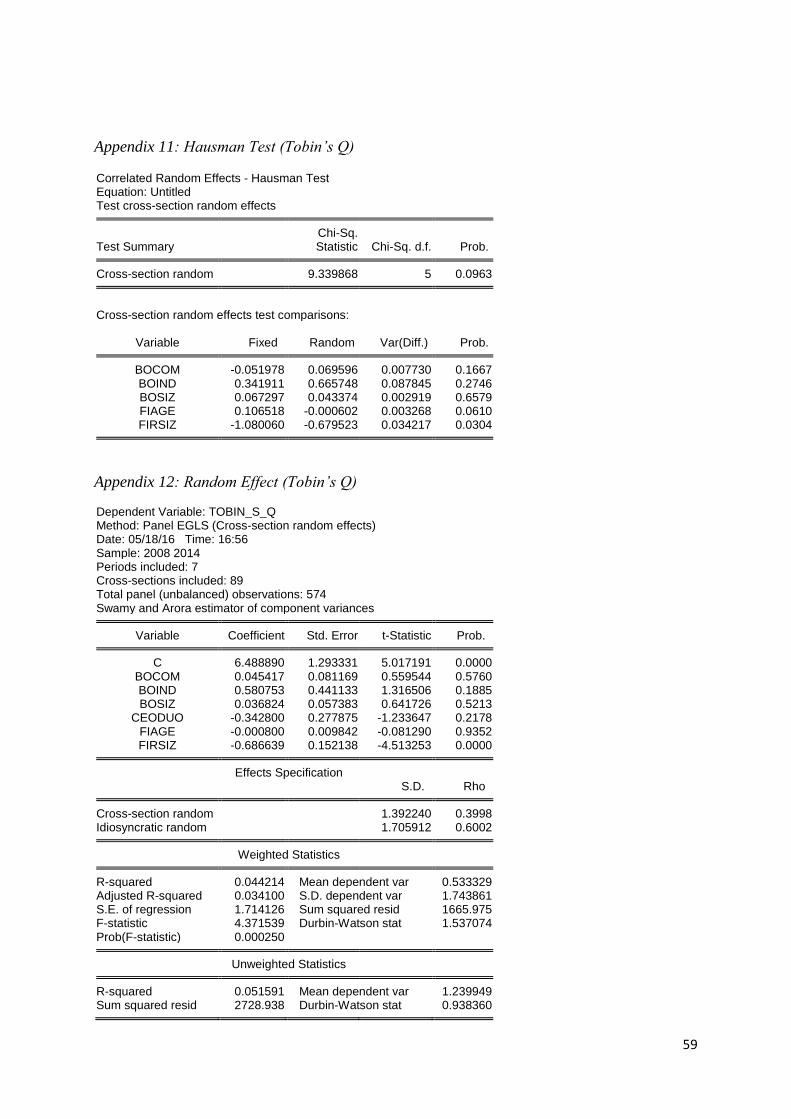
59
Appendix 11: Hausman Test (Tobin’s Q) Correlated Random Effects - Hausman Test Equation: Untitled Test cross-section random effects
Test Summary Chi-Sq. Statistic Chi-Sq. d.f. Prob.
Cross-section random 9.339868 5 0.0963
Cross-section random effects test comparisons:
Variable Fixed Random Var(Diff.) Prob. BOCOM -0.051978 0.069596 0.007730 0.1667
BOIND 0.341911 0.665748 0.087845 0.2746 BOSIZ 0.067297 0.043374 0.002919 0.6579 FIAGE 0.106518 -0.000602 0.003268 0.0610 FIRSIZ -1.080060 -0.679523 0.034217 0.0304
Appendix 12: Random Effect (Tobin’s Q) Dependent Variable: TOBIN_S_Q Method: Panel EGLS (Cross-section random effects) Date: 05/18/16 Time: 16:56 Sample: 2008 2014 Periods included: 7 Cross-sections included: 89 Total panel (unbalanced) observations: 574 Swamy and Arora estimator of component variances
Variable Coefficient Std. Error t-Statistic Prob. C 6.488890 1.293331 5.017191 0.0000
BOCOM 0.045417 0.081169 0.559544 0.5760 BOIND 0.580753 0.441133 1.316506 0.1885 BOSIZ 0.036824 0.057383 0.641726 0.5213
CEODUO -0.342800 0.277875 -1.233647 0.2178 FIAGE -0.000800 0.009842 -0.081290 0.9352 FIRSIZ -0.686639 0.152138 -4.513253 0.0000
Effects Specification S.D. Rho Cross-section random 1.392240 0.3998
Idiosyncratic random 1.705912 0.6002 Weighted Statistics R-squared 0.044214 Mean dependent var 0.533329
Adjusted R-squared 0.034100 S.D. dependent var 1.743861 S.E. of regression 1.714126 Sum squared resid 1665.975 F-statistic 4.371539 Durbin-Watson stat 1.537074 Prob(F-statistic) 0.000250
Unweighted Statistics R-squared 0.051591 Mean dependent var 1.239949
Sum squared resid 2728.938 Durbin-Watson stat 0.938360
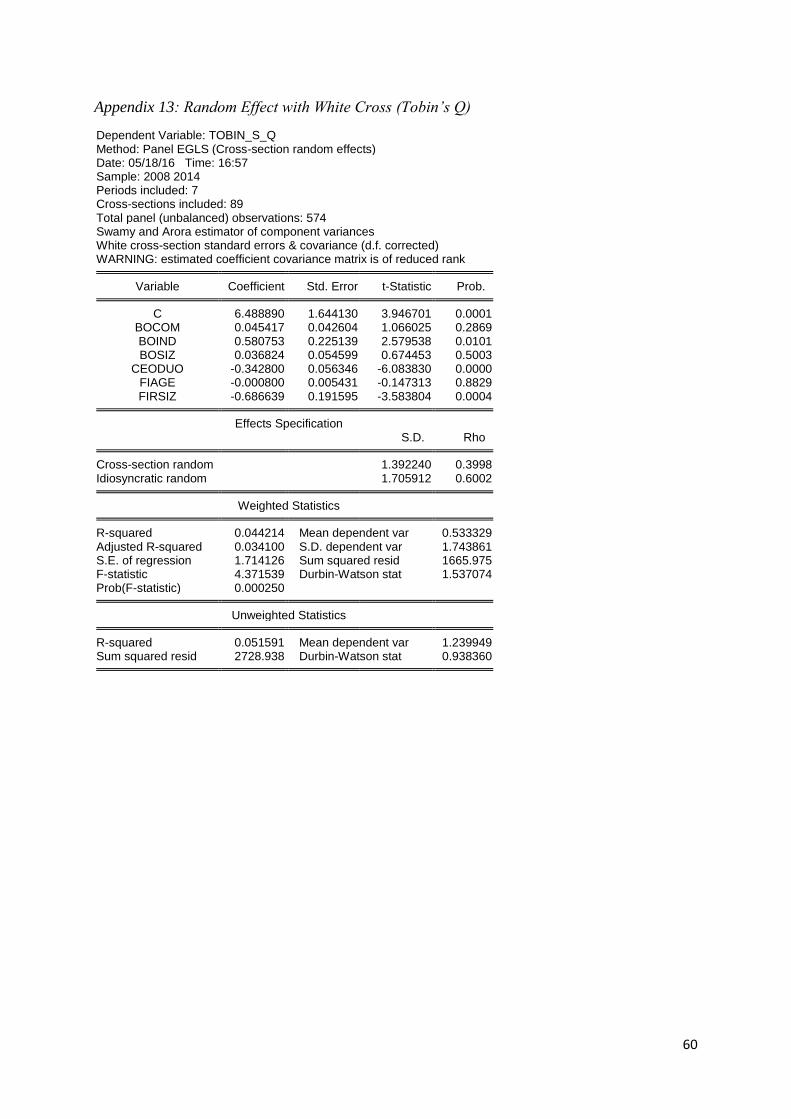
60
Appendix 13: Random Effect with White Cross (Tobin’s Q)
Dependent Variable: TOBIN_S_Q Method: Panel EGLS (Cross-section random effects) Date: 05/18/16 Time: 16:57 Sample: 2008 2014 Periods included: 7 Cross-sections included: 89 Total panel (unbalanced) observations: 574 Swamy and Arora estimator of component variances White cross-section standard errors & covariance (d.f. corrected) WARNING: estimated coefficient covariance matrix is of reduced rank
Variable Coefficient Std. Error t-Statistic Prob. C 6.488890 1.644130 3.946701 0.0001
BOCOM 0.045417 0.042604 1.066025 0.2869 BOIND 0.580753 0.225139 2.579538 0.0101 BOSIZ 0.036824 0.054599 0.674453 0.5003
CEODUO -0.342800 0.056346 -6.083830 0.0000 FIAGE -0.000800 0.005431 -0.147313 0.8829 FIRSIZ -0.686639 0.191595 -3.583804 0.0004
Effects Specification S.D. Rho Cross-section random 1.392240 0.3998
Idiosyncratic random 1.705912 0.6002 Weighted Statistics R-squared 0.044214 Mean dependent var 0.533329
Adjusted R-squared 0.034100 S.D. dependent var 1.743861 S.E. of regression 1.714126 Sum squared resid 1665.975 F-statistic 4.371539 Durbin-Watson stat 1.537074 Prob(F-statistic) 0.000250
Unweighted Statistics R-squared 0.051591 Mean dependent var 1.239949
Sum squared resid 2728.938 Durbin-Watson stat 0.938360

61
Appendix 14:
Sampled Companies
ANADOLU EFES PRYSMIAN KABLO FORD OTOSAN KARTONSAN SODA SANAYİİ YAZICILAR HOLDİNG
AFYON CIMENTO BRISA ASLAN ÇİMENTO KOÇ HOLDİNG TAT GIDA VESTEL
AKENERJI BORUSAN GÖLTAŞ CEMENT KONYA ÇİMENTO TAV HAVALİMANLARI ZORLU ENERJİ
AKSA ENERJI COCA COLA GOOD YEAR KORDSA GLOBAL TURKCELL DESA DERİ
AKSA ÇİMSA PINAR ET VE UN KOZA ALTIN TÜRK HAVA YOLLARI PINAR SU
ALARKO HOLDING ÇELEBİ GSD HOLDING KARDEMİR TEKFEN HOLDİNG PINAR SÜT
ALCATEL LUCEN TELETAS ALKIM KAGIT
GÜBRE FABRİKALARI LOGO YAZILIM
TOFAŞ OTOMOBİL FABRİKALARI İZOCAM
ALKIM ALKALI DEVA HOLDING ÇEMTAŞ METRO HOLDİNG TORUNLAR TURCAS PETROL
SISE CAM DOGUS OTOMATIV IHLAS HOLDING MIGROS TICARET TRAKYA CAM NET HOLDİNG
ANADOLU CAM DERİMOD ADEL KALEMCİLİK OTOKAR TÜRK TELEKOM BAK AMBALAJ
ARCELIK DOĞAN HOLDİNG BATI ÇİMENTO PARSAN TÜRK TRAKTÖR SELÇUK ECZA DEPOSU
ASELSAN ECZACIBAŞI İLAÇ HOLDİNG DOĞAN GAZATECİLİK PEGASUS TÜPRAŞ YEŞİL YAPI
AYEN ENERJI ECZACIBAŞI YATIRIM HOLDİNG ERBOSAN SABANCI HOLDİNG VAKKO ADANA ÇİMENTO
AYGAZ EGE ENDUSTRI KARSAN OTOMOTİV VESTEL BEYAZ EŞYA HÜRRİYET GAZETESİ SARKUYSAN
BAGFAS AKÇANSA ENKA İNŞAAT ERDEMIR BIM BOSCH FREN SİSTEMLERİ


![Corporate Governance: Theory and Some Insights into the ...journalarticle.ukm.my/4307/2/akademika65[02].pdfCorporate Governance: Theory and Some Insights 33 corporate sector. As such,](https://img.pdfslide.net/doc/110x75/5e3054e7ee3d3a4fc932074e/corporate-governance-theory-and-some-insights-into-the-02pdf-corporate-governance.jpg)