Embed Size (px)
Citation preview

October 26, 2016
Corporate Overview

2
Safe Harbor Disclosure This presentation contains forward-looking statements within the meaning of the U.S. Private Securities Litigation Reform Act of 1995. Specifically, forward-looking statements within the meaning of the Safe Harbor include statements concerning: future financial performance; projections on market share and market growth; future market opportunities; NETGEAR's products and technology and their expected performance characteristics, specifications and specific uses; and anticipated new product offerings and features. These statements are based on management's current expectations and are subject to certain risks and uncertainties, including, without limitation, the following: future demand for NETGEAR's products may be lower than anticipated; consumers may choose not to adopt NETGEAR's new product offerings or adopt competing products; the actual price, performance and ease of use of NETGEAR products may not meet the price, performance and ease of use requirements of customers; product performance may be adversely affected by real world operating conditions; new cyber threats may challenge the effectiveness of features in NETGEAR's products; the ability of NETGEAR to market and sell its products and technology, the impact and pricing of competing products, and the introduction of alternative technological solutions; NETGEAR may be unsuccessful or experience delays in manufacturing and distributing its new and existing products; telecommunications service providers may choose to slow their deployment of NETGEAR's products or utilize competing products; NETGEAR may be unable to collect receivables as they become due; and NETGEAR may fail to manage costs. Further, certain forward-looking statements are based on assumptions as to future events that may not prove to be accurate. Therefore, actual outcomes and results may differ materially from what is expressed or forecast in such forward-looking statements. Further information on potential risk factors that could affect NETGEAR and its business are detailed in the Company's periodic filings with the Securities and Exchange Commission, including, but not limited to, those risks and uncertainties listed in the section entitled “Part II - Item 1A. Risk Factors,” pages 42 through 62, in the Company's quarterly report on Form 10-Q for the fiscal quarter ended July 3, 2016, filed with the Securities and Exchange Commission on August 5, 2016. NETGEAR undertakes no obligation to release publicly any revisions to any forward-looking statements contained herein to reflect events or circumstances after the date hereof or to reflect the occurrence of unanticipated events.
All product and company names herein are or may be trademarks of their respective owners.

Mission
Be the innovative leader in connecting the world to the Internet.
3
4
Strategy for Growth
Superior
Worldwide
Distribution
Innovative
Technologies in
New Categories
Brand
Strength

5
Innovative Technologies in New Categories

2013 2014 2015 2015
Set the standard for premium WiFi
The industry’s first tri-band WiFi router
Designed specifically for fast-paced gaming
With patent-pending Active Antennas
The Original Nighthawk Nighthawk X6 Nighthawk X4S Nighthawk X8
Nighthawk - Innovation in Premium WiFi

Nighthawk X10
AD7200 Smart WiFi Router
®
Introducing the
New Ultra High Speed 802.11ad
1.7GHz Quad Core Processor
Plex Media Server Support
Ultimate 4K Streaming & VR Gaming
MSRP $499.99

2015 2015 2016
Delivers Nighthawk performance to cable subscribers
The first WiFi extender in the Nighthawk family
The first wall-plug extender with MU-MIMO
Nighthawk WiFi Cable Modem Nighthawk WiFi Range Extender Nighthawk X4 WiFi Range Extender
Nighthawk - Innovation in Premium WiFi

Every Angle Covered – Arlo Cameras
The World’s First Wire-Free Security Camera
Arlo™
Named 2016 “Best Security Camera Overall” By Tom’s Guide
Arlo Q™
Designed specifically for small businesses
Arlo Q Plus™
All with 7-days of free cloud storage!

Introducing Arlo Pro
All the great Arlo Wire-free features and more!
Simply add Arlo Pro cameras to your existing setup
Introducing Rechargeable Batteries
Wire-free with 2-way audio
100+ decibel siren in hub for full home security

Seamless mesh WiFi
Dedicated extra 5GHz
band for WiFi intelligence
WiFi speeds up to 2x
competing solutions
The World’s First Tri-Band WiFi System
Covers homes up
to 4,000 sq. ft.
Meet Orbi

Industry’s first Gigabit Unmanaged Switches
2000
A History of Innovation in
SMB Switching
World’s first Smart Switch
2003
World’s first Stackable Smart Switch
2005
First full featured Smart Switch
2007
Industry’s first Lightly Managed
Plus Switch
2010
First Smart Switch with 10-Gigabit
2011
First all 10-Gigabit Smart Switch
First all 10-Gigabit
Plus Switch
2013
World’s First Click Switch for Flexible Mounting
2014
First 28-Port 10-Gigabit Smart Switch
Captures #1 Position
in Web-Managed Ethernet Switching
2015

Leadership in 10-Gigabit Switching
Fully Managed
Switches
“Smart” Fully
Web Managed
Switches
“Plus” Lightly
Web Managed
Switches
10GbE for mobility, voice, video and virtualization!
PoE – one wire for power and connectivity!
Unique “Spine & Leaf” Stacking – increased scalability!
Easy mounting – flexible form factors!

14
Brand Strength

15
High End WiFi Router Market Share NPD, AC1800-AC3200, US 3Q16
46%
26%
17%
9% 1%
1% 0% 0% 0% NETGEAR
Linksys Group
ASUS
TP-LINK
D-Link
Belkin
Synology
TRENDnet
All Others
Source: The NPD Group / U.S. Weekly Retail Tracking Service, Routers, Multiband Transmission Speed: 1800 Mbps- 5334 Mbps,
Wireless Technology: 802.11ac, July 3, 2016- Oct. 1, 2016, based on dollar share

16
IP Camera Market Share NPD, US 3Q16
27%
13%
10% 9%
6%
6%
6%
1%
5%
3%
14% NETGEAR
Nest / Dropcam
Swann Communications
Samsung
Night Owl Security
Lorex
Amcrest Technologies
Guardzilla
Canary Communications
D-Link
All Others
Source: The NPD Group / U.S. Weekly Retail Tracking Service, July 3, 2016- Oct. 1,
2016, based on dollar share

17
Core Switches Market Share NPD, Retail, US 3Q16
58%
14%
5%
6%
5%
4%
3% 1% 0% 1%
2%
NETGEAR
TP-LINK
Ubiquiti Networks
Cisco Systems
Linksys Group
TRENDnet
D-Link
Zyxel
Buffalo Technology
Hewlett Packard
All Others
Source: The NPD Group / U.S. Weekly Retail Tracking Service, Networking Devices,
Hubs, Switches, July 3, 2016- Oct. 1, 2016, based on dollar share

18
Superior Worldwide
Distribution

Global Brand and Distribution Biggest Competitive Advantage
66% 18% 16%
WORLDWIDE: 28,000 retail outlets 27,000 VARs
Geographic net revenue breakdown for 3Q16
19

20
Financials
21
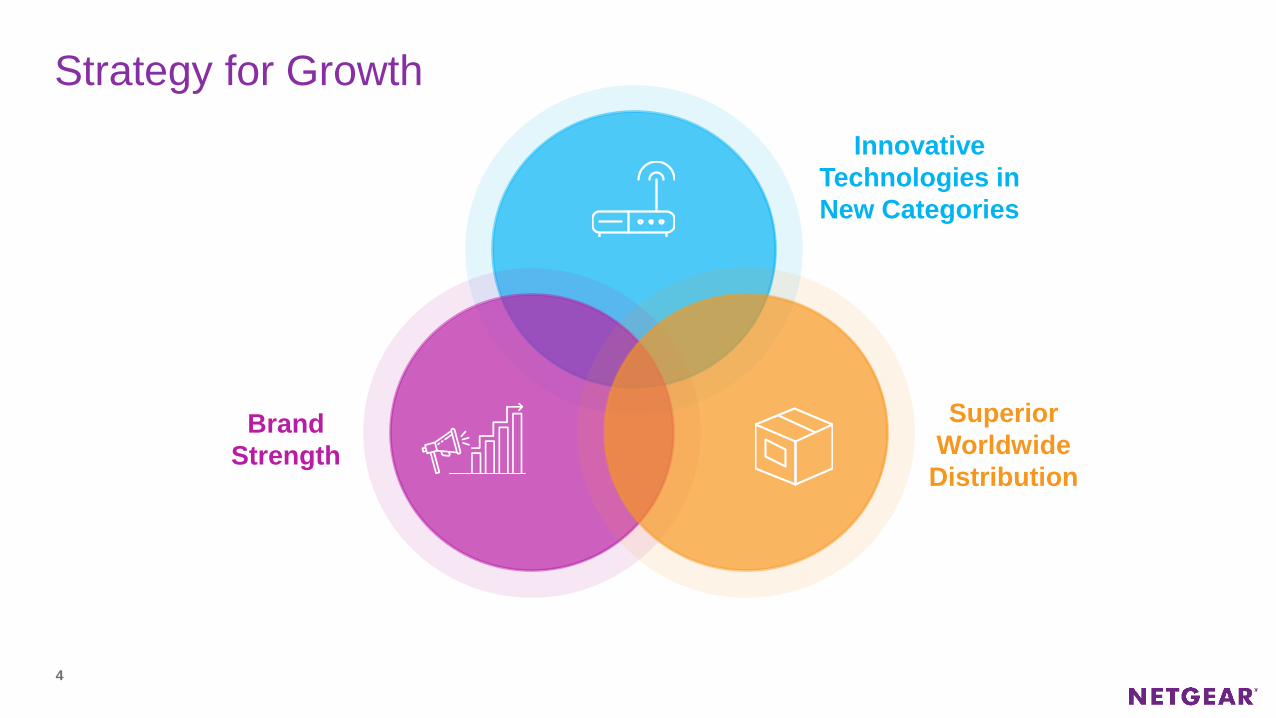
Quarterly Net Revenue Trend (Net Revenue, $ Millions)
$353 $353
$309
$289
$342 $361
$310 $312
$339
$0
$50
$100
$150
$200
$250
$300
$350
$400
Q3 Q4 Q1 Q2 Q3 Q4 Q1 Q2 Q3
2014 2015 2016

22
Segment Performance (Net Revenue, $ Millions)
$131
$148
$121 $132
$164
$198
$158 $171
$194
$0
$20
$40
$60
$80
$100
$120
$140
$160
$180
$200
$220
Q3 Q4 Q1 Q2 Q3 Q4 Q1 Q2 Q3
$150
$126 $115
$94
$113
$99
$84
$67 $71
$0
$20
$40
$60
$80
$100
$120
$140
$160
Q3 Q4 Q1 Q2 Q3 Q4 Q1 Q2 Q3
$72
$79 $73
$63 $65 $64 $68
$74 $73
$0
$20
$40
$60
$80
$100
Q3 Q4 Q1 Q2 Q3 Q4 Q1 Q2 Q3
Retail
Commercial
Service Provider
2014 2015 2016 2014 2015 2016
2014 2015 2016

23
Regional Net Revenue Performance (Net Revenue, $ Millions)
Americas
APAC
EMEA
2014 2015 2016 2014 2015 2016
2014 2015 2016
$194 $195
$174 $172
$220 $232
$194
$211 $225
$0
$40
$80
$120
$160
$200
$240
Q3 Q4 Q1 Q2 Q3 Q4 Q1 Q2 Q3
$108 $106
$89
$68
$78 $87
$65
$52 $60
$0
$20
$40
$60
$80
$100
$120
$140
Q3 Q4 Q1 Q2 Q3 Q4 Q1 Q2 Q3
$51 $52
$46 $48
$44 $42
$52 $49
$53
$0
$10
$20
$30
$40
$50
$60
Q3 Q4 Q1 Q2 Q3 Q4 Q1 Q2 Q3

24
Operating Margin (Non-GAAP, % of Revenue)
10.6% 10.1%
9.2%
7.1%
10.3% 10.8%
11.9% 11.6% 11.5%
0.0%
2.0%
4.0%
6.0%
8.0%
10.0%
12.0%
14.0%
Q3 Q4 Q1 Q2 Q3 Q4 Q1 Q2 Q3
2014 2015 2016

2014 2015 2016
$0.72
$0.65
$0.46
$0.29
$0.67
$0.83
$0.74 $0.72
$0.76
$0.00
$0.10
$0.20
$0.30
$0.40
$0.50
$0.60
$0.70
$0.80
$0.90
Q3 Q4 Q1 Q2 Q3 Q4 Q1 Q2 Q3
25
Earnings Per Share Trend (Non-GAAP, $ per Share)

26
Cash Balance (Cash, Cash Equivalents and ST Investments, $ Millions)
$243 $257
$247
$213
$264 $278
$333 $353
$403
$0
$50
$100
$150
$200
$250
$300
$350
$400
$450
3Q14 4Q14 1Q15 2Q15 3Q15 4Q15 1Q16 2Q16 3Q16

27
Return of Capital
29.0
30.0
31.0
32.0
33.0
34.0
35.0
36.0
37.0
38.0
39.0
$0.00
$20.00
$40.00
$60.00
$80.00
$100.00
$120.00
$140.00
FY'12 FY'13 FY'14 FY'15 YTD Q3'16
Sha
res, M
illion
s $
US
D, M
illio
ns
Share repurchase ($) FCF Common Stock Outstanding


![Company Overviews22.q4cdn.com/.../05/Vapotherm-Company-Presentation... · Company Overview. MAY 2020. Safe Harbor Statement [ 1 ] Certain statements in this presentation, including](https://img.pdfslide.net/doc/110x75/5fce4b3ba01a8177527c612d/company-overviews22q4cdncom05vapotherm-company-presentation-company.jpg)