Embed Size (px)
Citation preview
0
July, 2017
Corporate
Presentation
1 1
Disclaimer
This presentation may contain financial or business projections regarding recent acquisitions, their
financial or business impact, management expectations and objectives regarding such acquisitions and
current management expectations on the operating and financial performance of The Company, based
on assumptions that, as of today, are considered valid. Financial and business projections are
estimates and do not constitute any declaration of historical facts. Words such as “anticipates”,
“could”, “may”, “can”, “plans”, “believes”, “estimates”, “expects”, “projects”, “pretends”, “probable”,
“will”, “should”, and any other similar expression or word with a similar meaning pretend to identify
such expressions as projections. It is uncertain if the anticipated events will happen and in case they
happen, the impact they may have in Alicorp’s or The Consolidated Company’s operating and financial
results. Alicorp does not assume any obligation to update any financial or business projections
included in this presentation to reflect events or circumstances that may happen.
2
Index
5
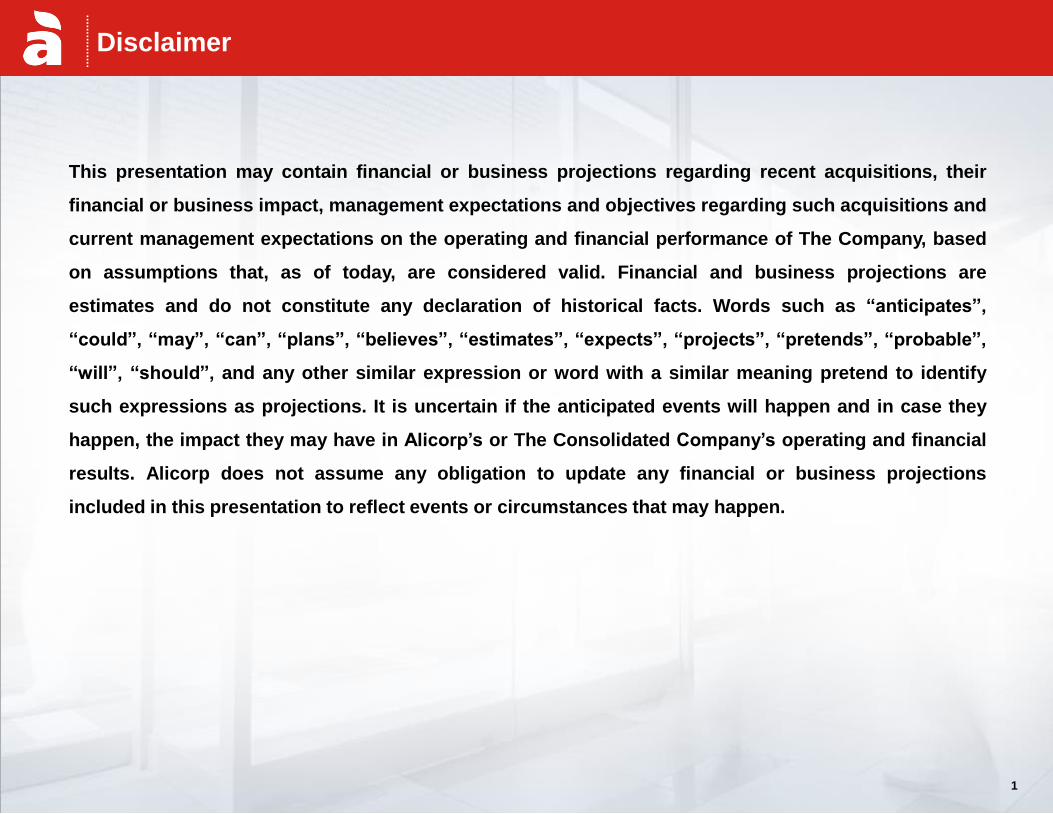
6 Guidance 2017
Q1 2017 Highlights
1
3
Financial Metrics
4 Q1 2017 Business & Operating Review
About Alicorp
2
Our Strategy for creating value 2
3
Index
5
6 Guidance 2017
Q1 2017 Highlights
1
3
Financial Metrics
4 Q1 2017 Business & Operating Review
About Alicorp
3
Our Strategy for creating value 2
4
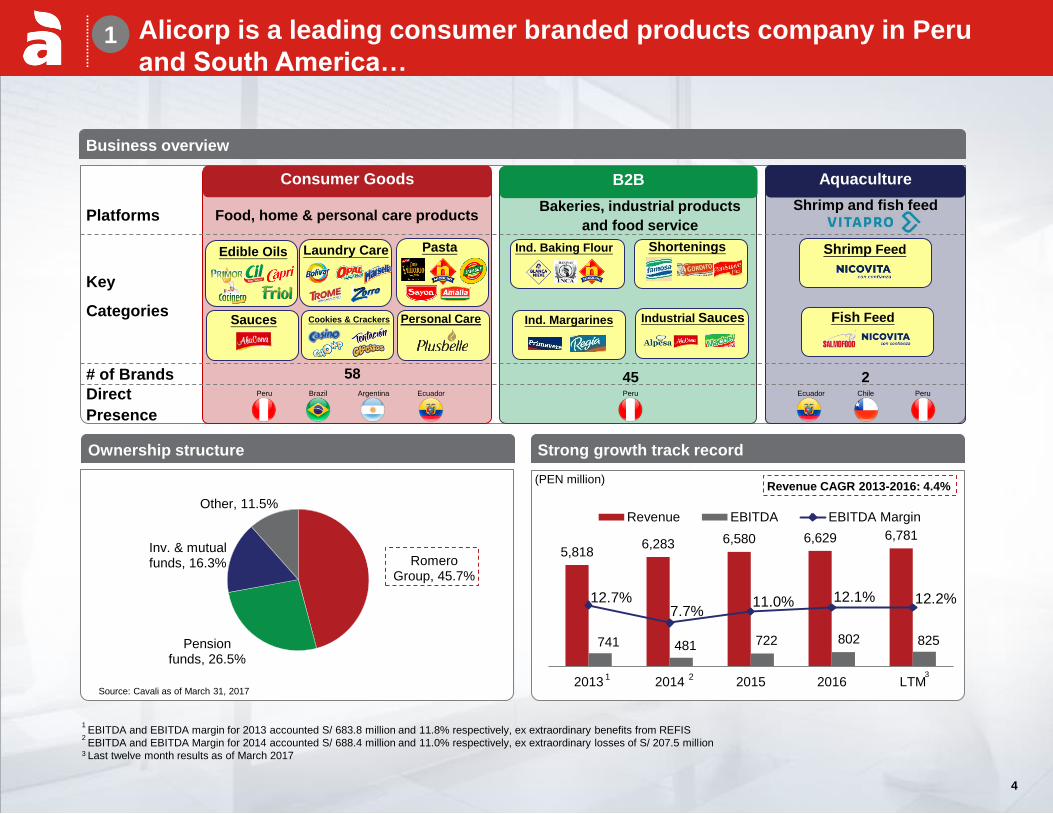
Romero Group, 45.7%
Pension funds, 26.5%
Inv. & mutual funds, 16.3%
Other, 11.5%
5,818 6,283 6,580 6,629 6,781
741 481 722 802 825
12.7% 7.7%
11.0% 12.1% 12.2%
2013 2014 2015 2016 LTM
Revenue EBITDA EBITDA Margin
Ownership structure
Business overview
Strong growth track record
(PEN million)
1 EBITDA and EBITDA margin for 2013 accounted S/ 683.8 million and 11.8% respectively, ex extraordinary benefits from REFIS
2 EBITDA and EBITDA Margin for 2014 accounted S/ 688.4 million and 11.0% respectively, ex extraordinary losses of S/ 207.5 million
3 Last twelve month results as of March 2017
Source: Cavali as of March 31, 2017
Key
Categories
Edible Oils Laundry Care
Sauces Cookies & Crackers
Platforms Food, home & personal care products
# of Brands
Direct
Presence
Consumer Goods
Bakeries, industrial products
and food service
Shrimp and fish feed
45 2
Ind. Baking Flour Shortenings
Ind. Margarines Industrial Sauces
Shrimp Feed
Fish Feed
B2B Aquaculture
Pasta
Peru Argentina Ecuador Brazil Ecuador Peru Chile Peru
Personal Care
Revenue CAGR 2013-2016: 4.4%
58
2 1 3
Alicorp is a leading consumer branded products company in Peru
and South America…
4
1
5
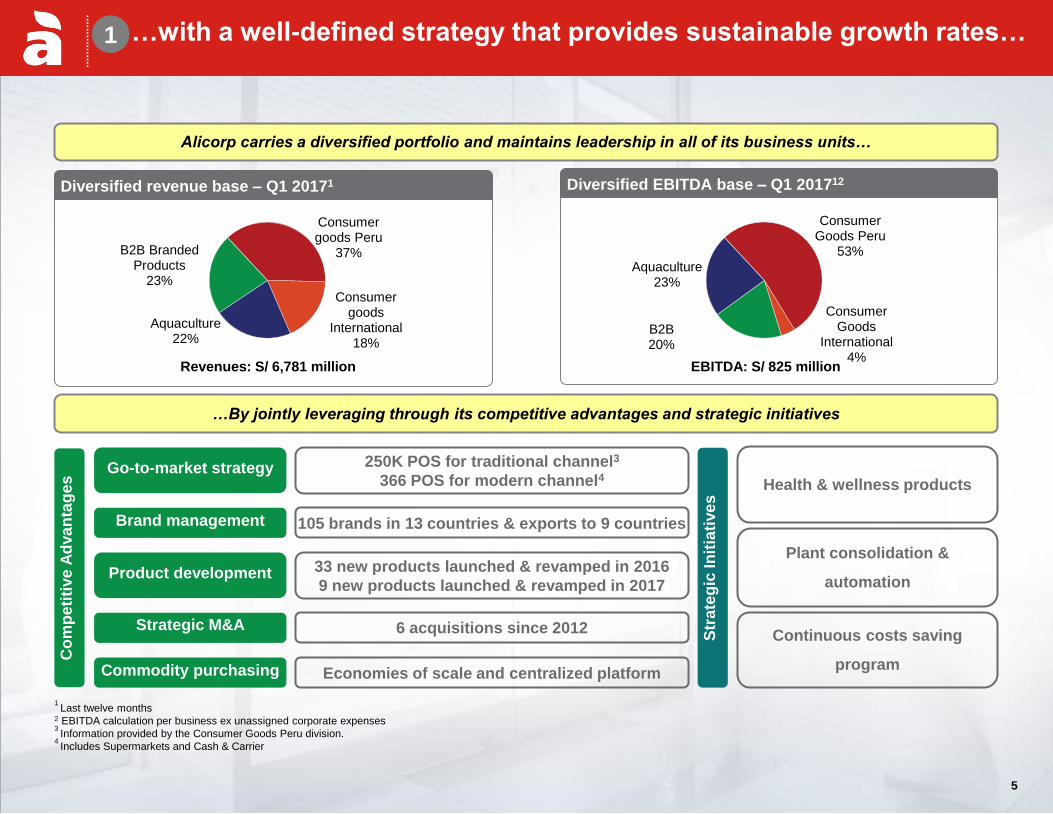
Consumer Goods Peru
53%
Consumer Goods
International 4%
B2B 20%
Aquaculture 23%
Consumer goods Peru
37%
Consumer goods
International 18%
Aquaculture 22%
B2B Branded Products
23%
Commodity purchasing
Go-to-market strategy
Brand management
Strategic M&A
Product development
105 brands in 13 countries & exports to 9 countries
33 new products launched & revamped in 2016
9 new products launched & revamped in 2017
Economies of scale and centralized platform
…By jointly leveraging through its competitive advantages and strategic initiatives
250K POS for traditional channel3
366 POS for modern channel4
6 acquisitions since 2012
Health & wellness products
Plant consolidation &
automation
Continuous costs saving
program
Co
mp
eti
tive
Ad
va
nta
ges
Str
ate
gic
In
itia
tive
s
Diversified revenue base – Q1 20171
Revenues: S/ 6,781 million EBITDA: S/ 825 million
Diversified EBITDA base – Q1 201712
Alicorp carries a diversified portfolio and maintains leadership in all of its business units…
1 Last twelve months
2 EBITDA calculation per business ex unassigned corporate expenses 3 Information provided by the Consumer Goods Peru division.
4 Includes Supermarkets and Cash & Carrier
…with a well-defined strategy that provides sustainable growth rates…
5
1
6
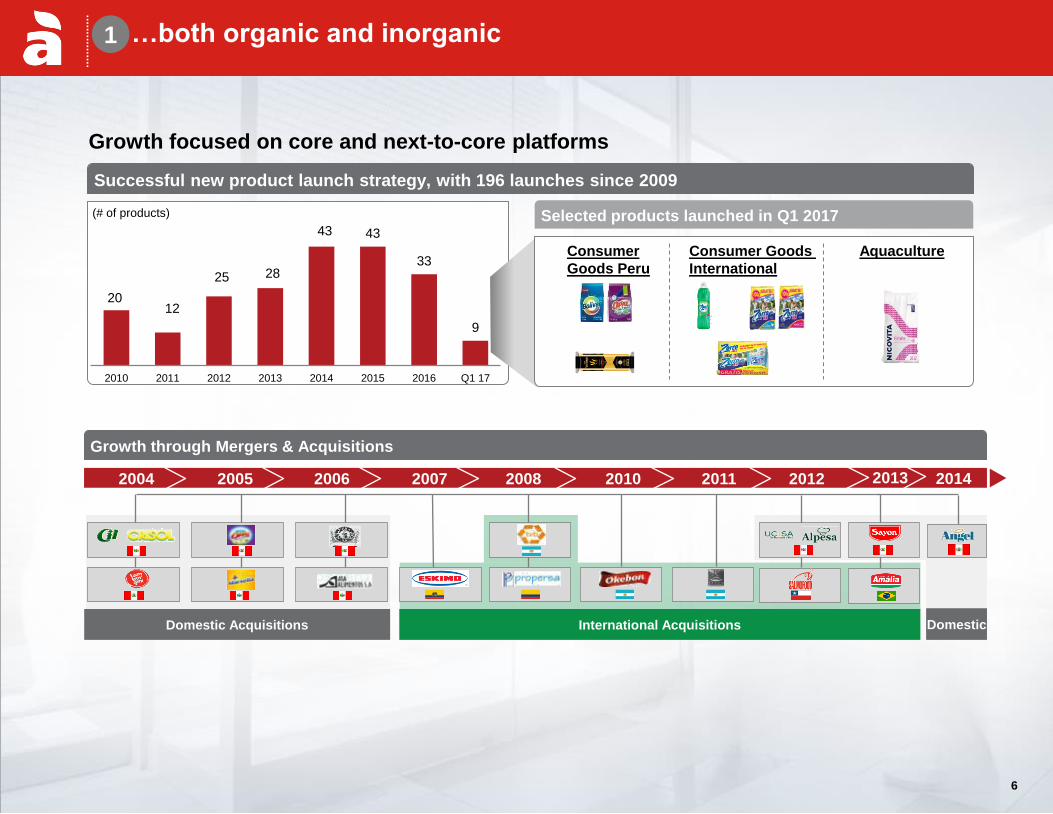
20 12
25 28
43 43
33
9
2010 2011 2012 2013 2014 2015 2016 Q1 17
Selected products launched in Q1 2017
Successful new product launch strategy, with 196 launches since 2009
Growth through Mergers & Acquisitions
International Acquisitions Domestic Acquisitions
2012 2004 2005 2006 2007 2008 2010 2011
Growth focused on core and next-to-core platforms
Consumer
Goods Peru
Consumer Goods
International
(# of products)
2013 2014
Domestic
…both organic and inorganic
Aquaculture
6
1
7
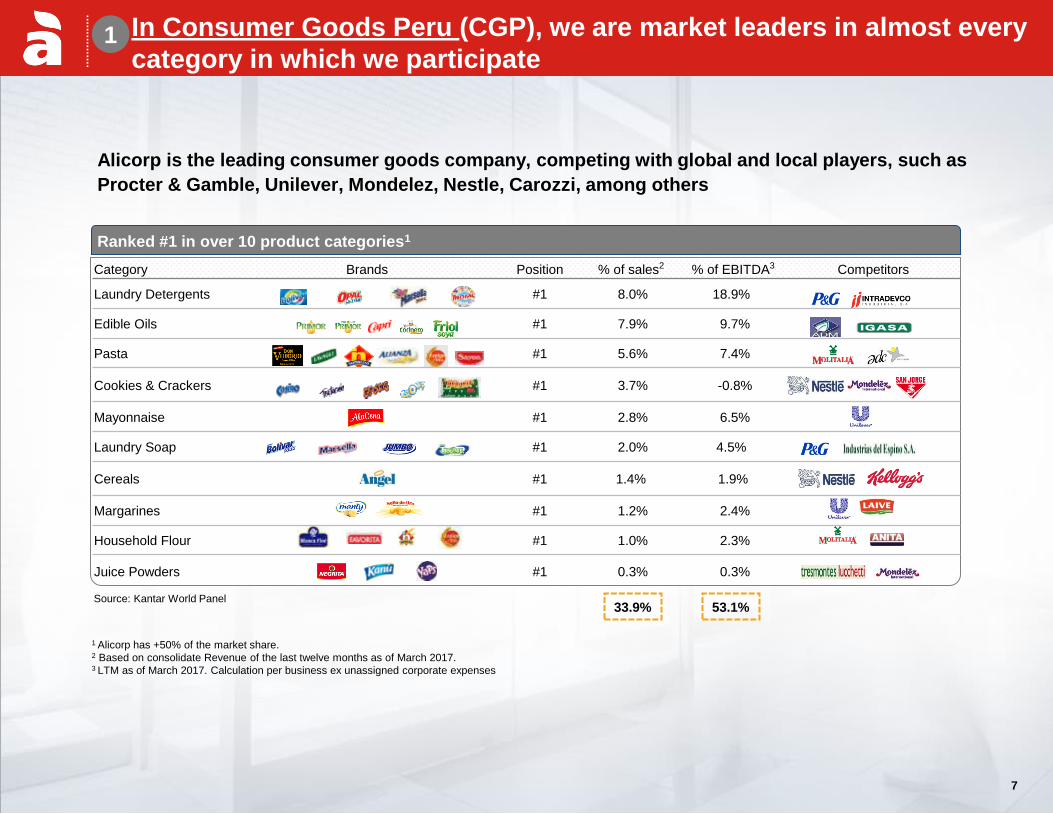
Alicorp is the leading consumer goods company, competing with global and local players, such as
Procter & Gamble, Unilever, Mondelez, Nestle, Carozzi, among others
1 Alicorp has +50% of the market share. 2 Based on consolidate Revenue of the last twelve months as of March 2017. 3 LTM as of March 2017. Calculation per business ex unassigned corporate expenses
Ranked #1 in over 10 product categories1
33.9% 53.1% Source: Kantar World Panel
In Consumer Goods Peru (CGP), we are market leaders in almost every
category in which we participate
Category Brands Position % of sales2 % of EBITDA3 Competitors
Laundry Detergents #1 8.0% 18.9%
Edible Oils #1 7.9% 9.7%
Pasta #1 5.6% 7.4%
Cookies & Crackers #1 3.7% -0.8%
Mayonnaise #1 2.8% 6.5%
Laundry Soap #1 2.0% 4.5%
Cereals #1 1.4% 1.9%
Margarines #1 1.2% 2.4%
Household Flour #1 1.0% 2.3%
Juice Powders #1 0.3% 0.3%
7
1
8
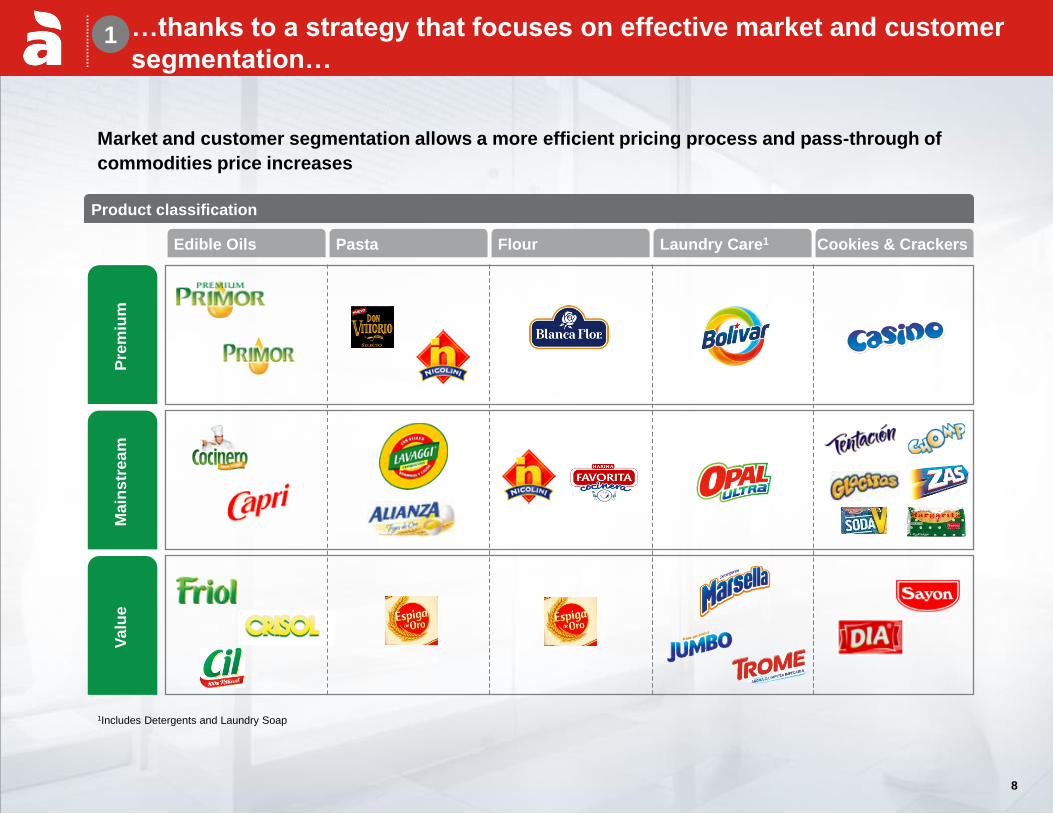
1Includes Detergents and Laundry Soap
Pre
miu
m
Ma
ins
trea
m
Va
lue
Market and customer segmentation allows a more efficient pricing process and pass-through of
commodities price increases
Product classification
Edible Oils Pasta Laundry Care1 Cookies & Crackers Flour
…thanks to a strategy that focuses on effective market and customer
segmentation…
8
1
9
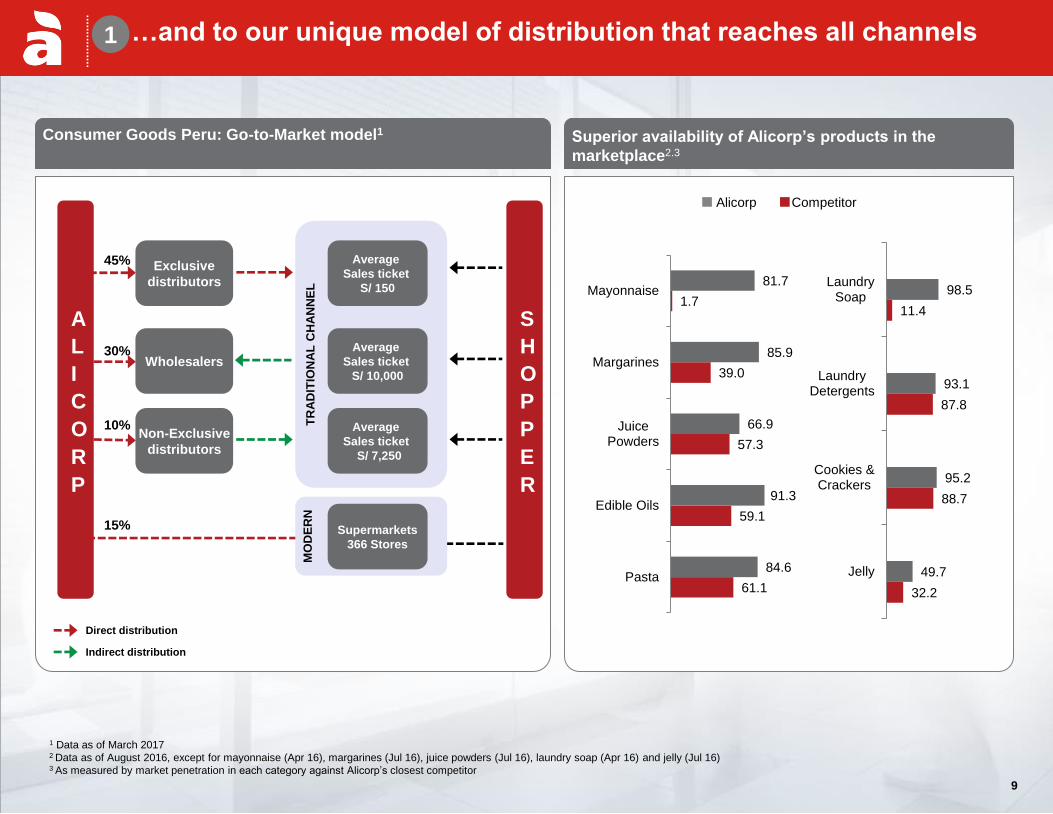
Consumer Goods Peru: Go-to-Market model1
Alicorp Competitor
1 Data as of March 2017
2 Data as of August 2016, except for mayonnaise (Apr 16), margarines (Jul 16), juice powders (Jul 16), laundry soap (Apr 16) and jelly (Jul 16) 3 As measured by market penetration in each category against Alicorp’s closest competitor
TR
AD
ITIO
NA
L C
HA
NN
EL
A
L
I
C
O
R
P
Average
Sales ticket
S/ 7,250
Average
Sales ticket
S/ 10,000
Non-Exclusive
distributors
Wholesalers
Direct distribution
Indirect distribution
S
H
O
P
P
E
R
30%
10%
15%
Superior availability of Alicorp’s products in the
marketplace2.3
MO
DE
RN
Supermarkets
366 Stores
61.1
59.1
57.3
39.0
1.7
84.6
91.3
66.9
85.9
81.7
Pasta
Edible Oils
JuicePowders
Margarines
Mayonnaise
32.2
88.7
87.8
11.4
49.7
95.2
93.1
98.5
Jelly
Cookies &Crackers
LaundryDetergents
LaundrySoap
Average
Sales ticket
S/ 150
Exclusive
distributors
45%
…and to our unique model of distribution that reaches all channels 1
9
10
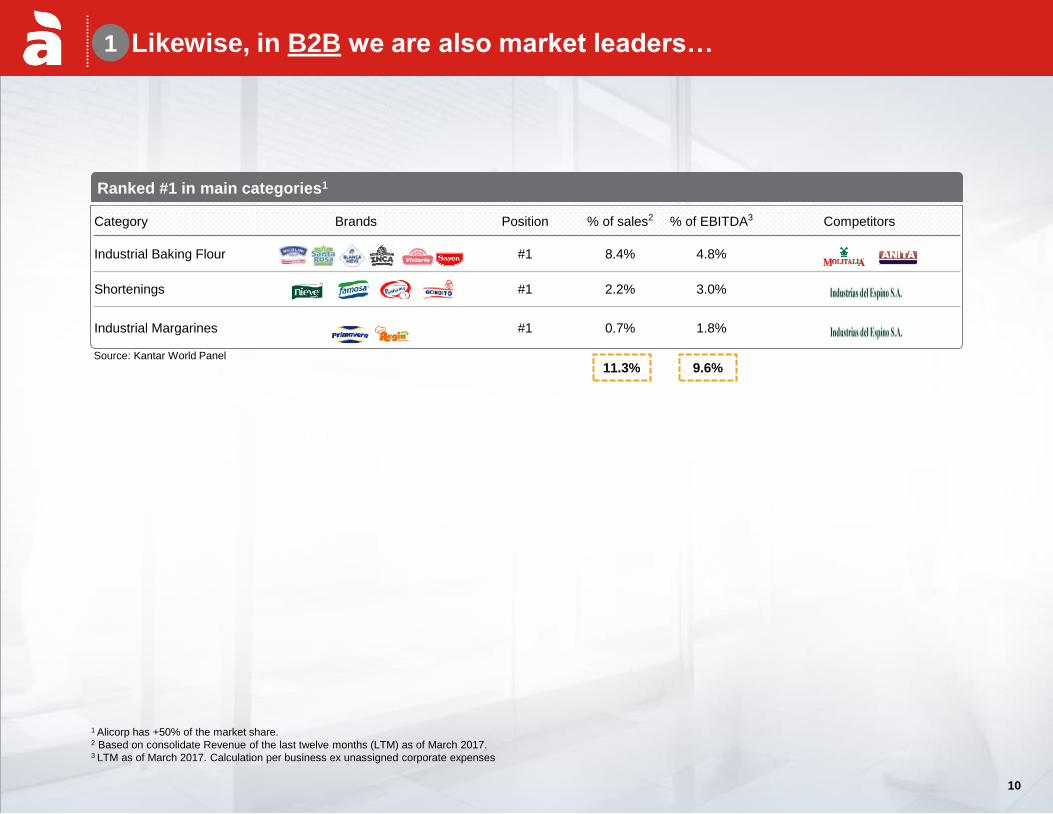
Category Brands Position % of sales2 % of EBITDA3 Competitors
Industrial Baking Flour #1 8.4% 4.8%
Shortenings #1 2.2% 3.0%
Industrial Margarines #1 0.7% 1.8%
Likewise, in B2B we are also market leaders…
Ranked #1 in main categories1
11.3% 9.6% Source: Kantar World Panel
1 Alicorp has +50% of the market share. 2 Based on consolidate Revenue of the last twelve months (LTM) as of March 2017. 3 LTM as of March 2017. Calculation per business ex unassigned corporate expenses
1
10
11
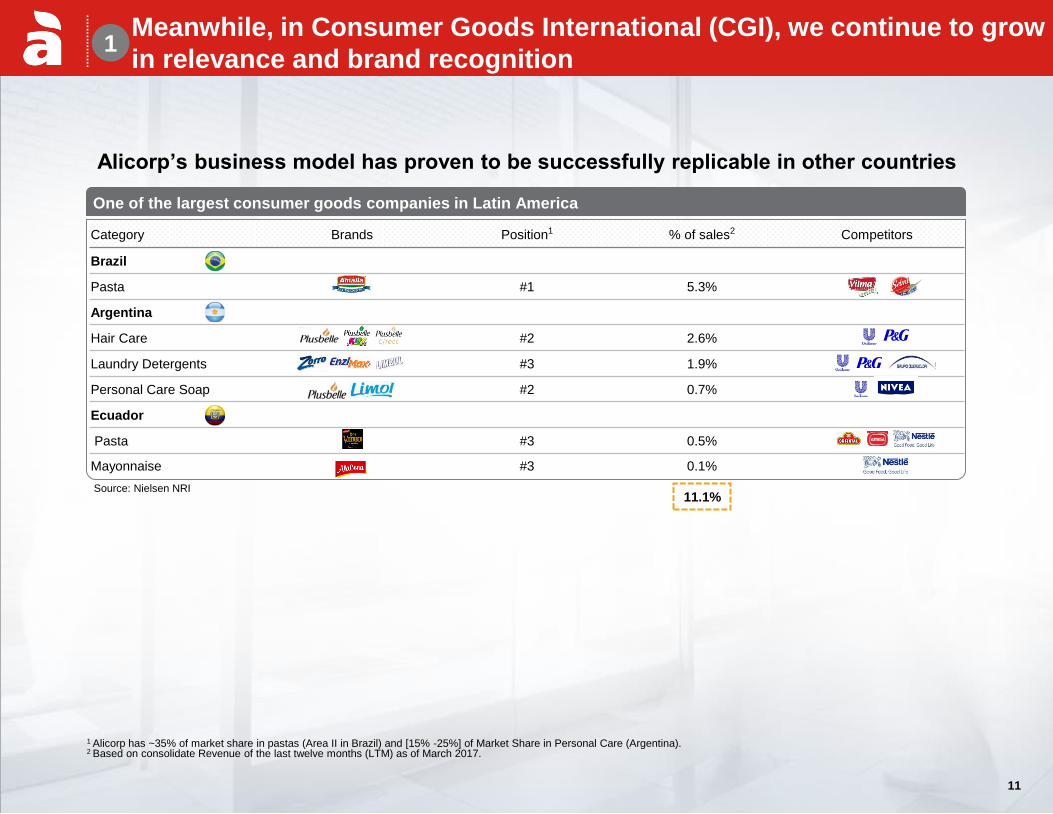
Category Brands Position1 % of sales2 Competitors
Brazil
Pasta #1 5.3%
Argentina
Hair Care #2 2.6%
Laundry Detergents #3 1.9%
Personal Care Soap #2 0.7%
Ecuador
Pasta #3 0.5%
Mayonnaise #3 0.1%
One of the largest consumer goods companies in Latin America
Alicorp’s business model has proven to be successfully replicable in other countries
11.1% Source: Nielsen NRI
Meanwhile, in Consumer Goods International (CGI), we continue to grow
in relevance and brand recognition
1 Alicorp has ~35% of market share in pastas (Area II in Brazil) and [15% -25%] of Market Share in Personal Care (Argentina). 2 Based on consolidate Revenue of the last twelve months (LTM) as of March 2017.
11
1
12
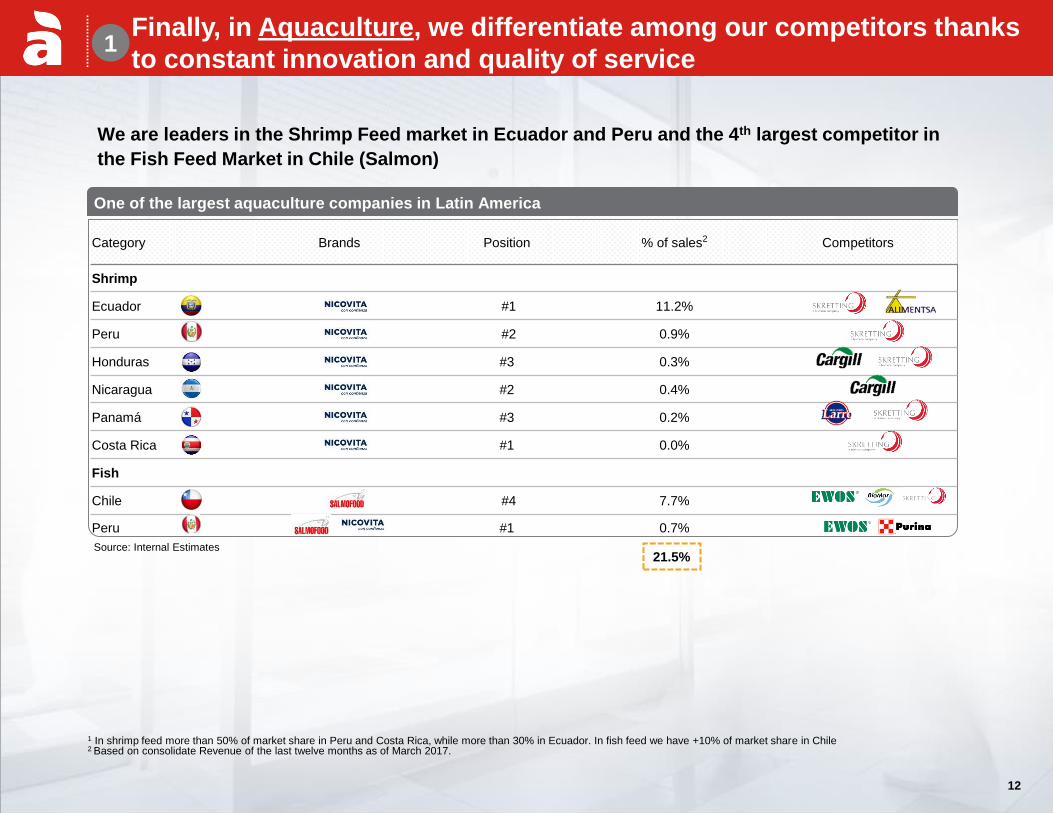
Category Brands Position % of sales2 Competitors
Shrimp
Ecuador #1 11.2%
Peru #2 0.9%
Honduras #3 0.3%
Nicaragua #2 0.4%
Panamá #3 0.2%
Costa Rica #1 0.0%
Fish
Chile #4 7.7%
Peru #1 0.7%
One of the largest aquaculture companies in Latin America
21.5%
1 In shrimp feed more than 50% of market share in Peru and Costa Rica, while more than 30% in Ecuador. In fish feed we have +10% of market share in Chile 2 Based on consolidate Revenue of the last twelve months as of March 2017.
Source: Internal Estimates
We are leaders in the Shrimp Feed market in Ecuador and Peru and the 4th largest competitor in
the Fish Feed Market in Chile (Salmon)
Finally, in Aquaculture, we differentiate among our competitors thanks
to constant innovation and quality of service
12
1
13
Index
5
6 Guidance 2017
Q1 2017 Highlights
1
3
Financial Metrics
4 Q1 2017 Business & Operating Review
About Alicorp
13
Our Strategy for creating value 2
14
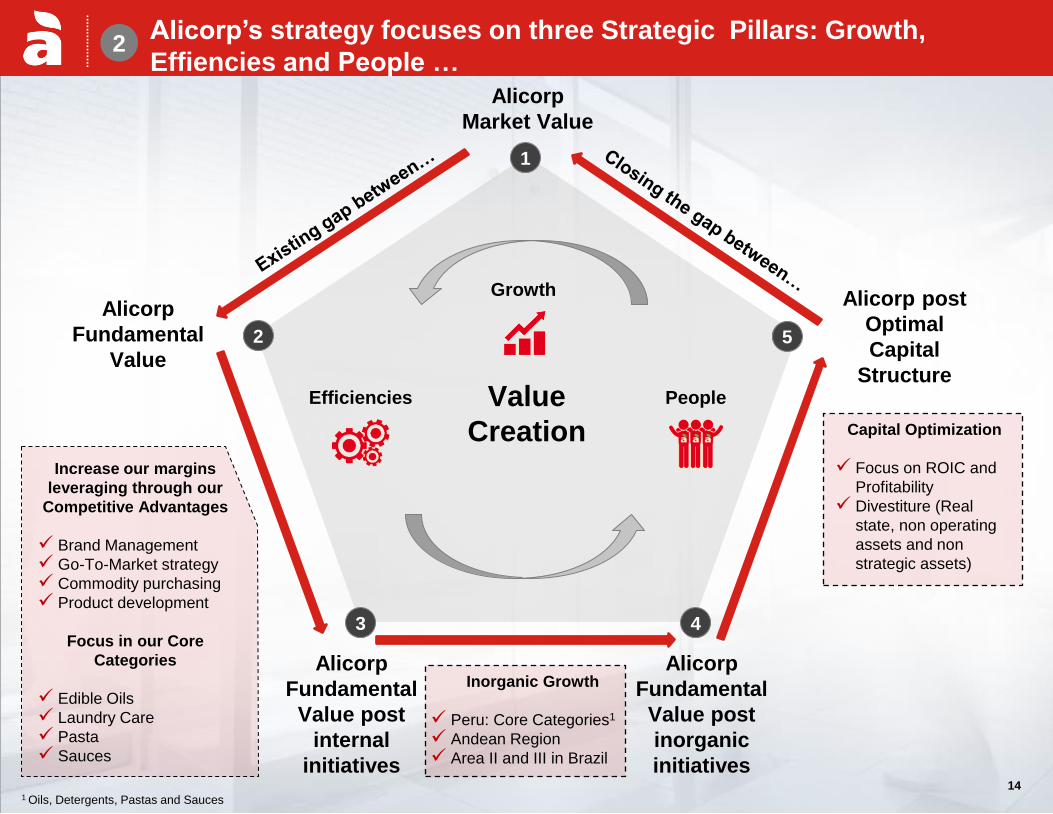
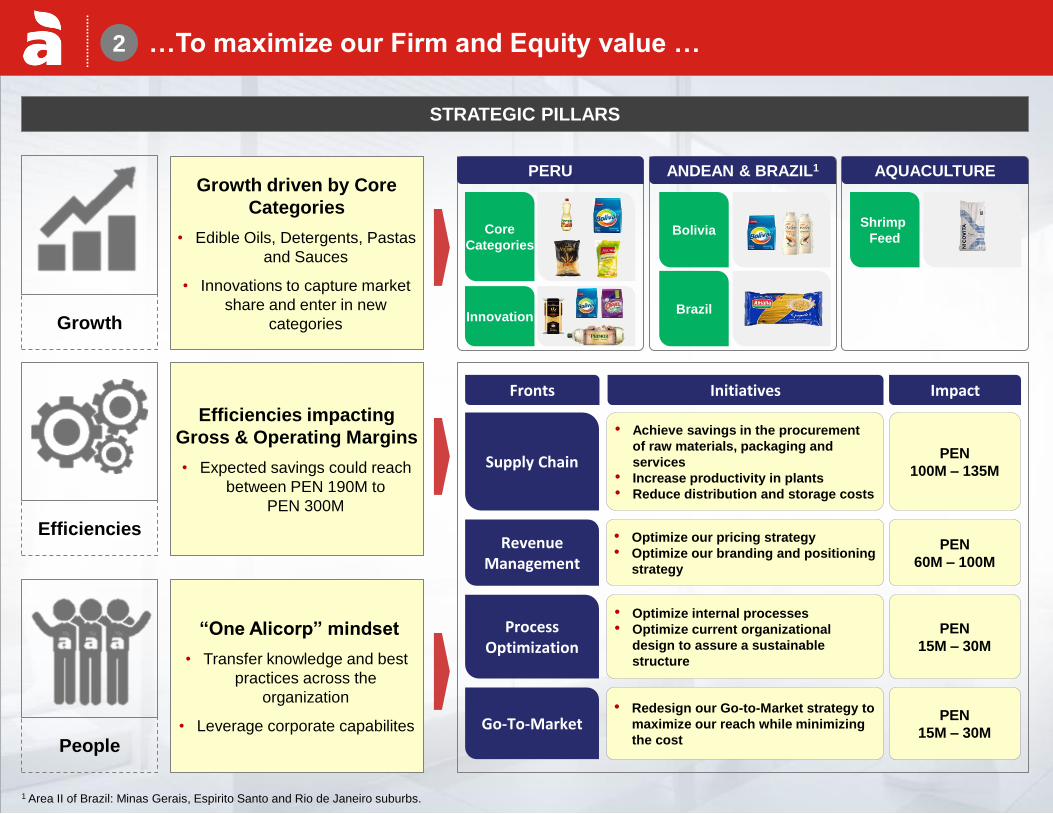
Alicorp’s strategy focuses on three Strategic Pillars: Growth,
Effiencies and People … 2
14
Value
Creation
1
2
3 4
5
Growth
Efficiencies People
Alicorp
Market Value
Alicorp
Fundamental
Value
Alicorp post
Optimal
Capital
Structure
Increase our margins
leveraging through our
Competitive Advantages
Brand Management
Go-To-Market strategy
Commodity purchasing
Product development
Focus in our Core
Categories
Edible Oils
Laundry Care
Pasta
Sauces
Alicorp
Fundamental
Value post
internal
initiatives
Alicorp
Fundamental
Value post
inorganic
initiatives
Inorganic Growth
Peru: Core Categories1
Andean Region
Area II and III in Brazil
Capital Optimization
Focus on ROIC and
Profitability
Divestiture (Real
state, non operating
assets and non
strategic assets)
1 Oils, Detergents, Pastas and Sauces
15
People
“One Alicorp” mindset
• Transfer knowledge and best
practices across the
organization
• Leverage corporate capabilites
STRATEGIC PILLARS
Growth
2
Growth driven by Core
Categories
• Edible Oils, Detergents, Pastas
and Sauces
• Innovations to capture market
share and enter in new
categories
Efficiencies
Efficiencies impacting
Gross & Operating Margins
• Expected savings could reach
between PEN 190M to
PEN 300M
PERU ANDEAN & BRAZIL1 AQUACULTURE
Shrimp
Feed Core
Categories
Innovation
Bolivia
Brazil
1 Area II of Brazil: Minas Gerais, Espirito Santo and Rio de Janeiro suburbs.
…To maximize our Firm and Equity value …
Initiatives Impact Fronts
Supply Chain
• Achieve savings in the procurement
of raw materials, packaging and
services
• Increase productivity in plants
• Reduce distribution and storage costs
PEN
100M – 135M
Process Optimization
• Optimize internal processes
• Optimize current organizational
design to assure a sustainable
structure
PEN
15M – 30M
Go-To-Market • Redesign our Go-to-Market strategy to
maximize our reach while minimizing
the cost
PEN
15M – 30M
Revenue Management
• Optimize our pricing strategy
• Optimize our branding and positioning
strategy
PEN
60M – 100M
16
NO
PA
T / IN
VE
ST
ED
CA
PIT
AL
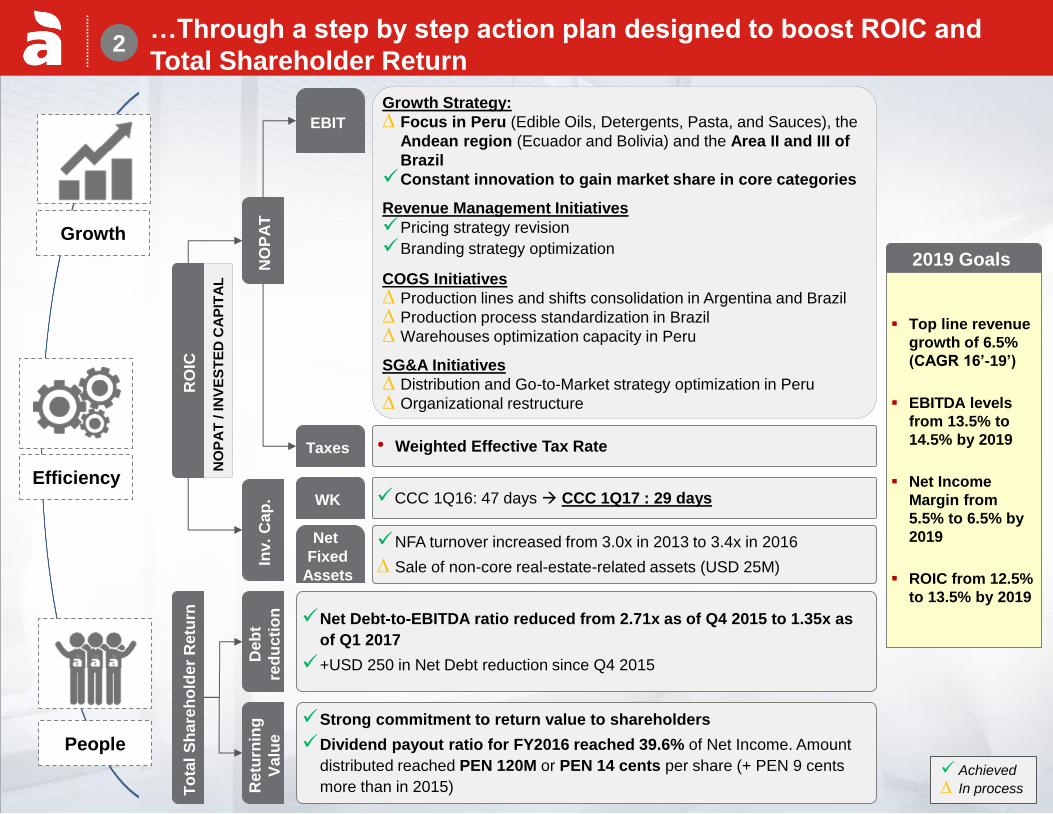
2 …Through a step by step action plan designed to boost ROIC and
Total Shareholder Return
NO
PA
T
Inv.
Cap
.
EBIT
Taxes
WK
Net
Fixed
Assets
Growth Strategy:
∆ Focus in Peru (Edible Oils, Detergents, Pasta, and Sauces), the
Andean region (Ecuador and Bolivia) and the Area II and III of
Brazil
Constant innovation to gain market share in core categories
Revenue Management Initiatives
Pricing strategy revision
Branding strategy optimization
COGS Initiatives
∆ Production lines and shifts consolidation in Argentina and Brazil
∆ Production process standardization in Brazil
∆ Warehouses optimization capacity in Peru
SG&A Initiatives
∆ Distribution and Go-to-Market strategy optimization in Peru
∆ Organizational restructure
CCC 1Q16: 47 days CCC 1Q17 : 29 days
• Weighted Effective Tax Rate
2019 Goals
Top line revenue
growth of 6.5%
(CAGR 16’-19’)
EBITDA levels
from 13.5% to
14.5% by 2019
Net Income
Margin from
5.5% to 6.5% by
2019
ROIC from 12.5%
to 13.5% by 2019
RO
IC
Efficiency
People
Growth
Achieved
∆ In process To
tal
Sh
are
ho
lde
r R
etu
rn
De
bt
red
ucti
on
Re
turn
ing
Va
lue
Net Debt-to-EBITDA ratio reduced from 2.71x as of Q4 2015 to 1.35x as
of Q1 2017
+USD 250 in Net Debt reduction since Q4 2015
Strong commitment to return value to shareholders
Dividend payout ratio for FY2016 reached 39.6% of Net Income. Amount
distributed reached PEN 120M or PEN 14 cents per share (+ PEN 9 cents
more than in 2015)
NFA turnover increased from 3.0x in 2013 to 3.4x in 2016
∆ Sale of non-core real-estate-related assets (USD 25M)
17
Index
5
6 Guidance 2017
Q1 2017 Highlights
1
3
Financial Metrics
4 Q1 2017 Business & Operating Review
About Alicorp
17
Our Strategy for creating value 2
18
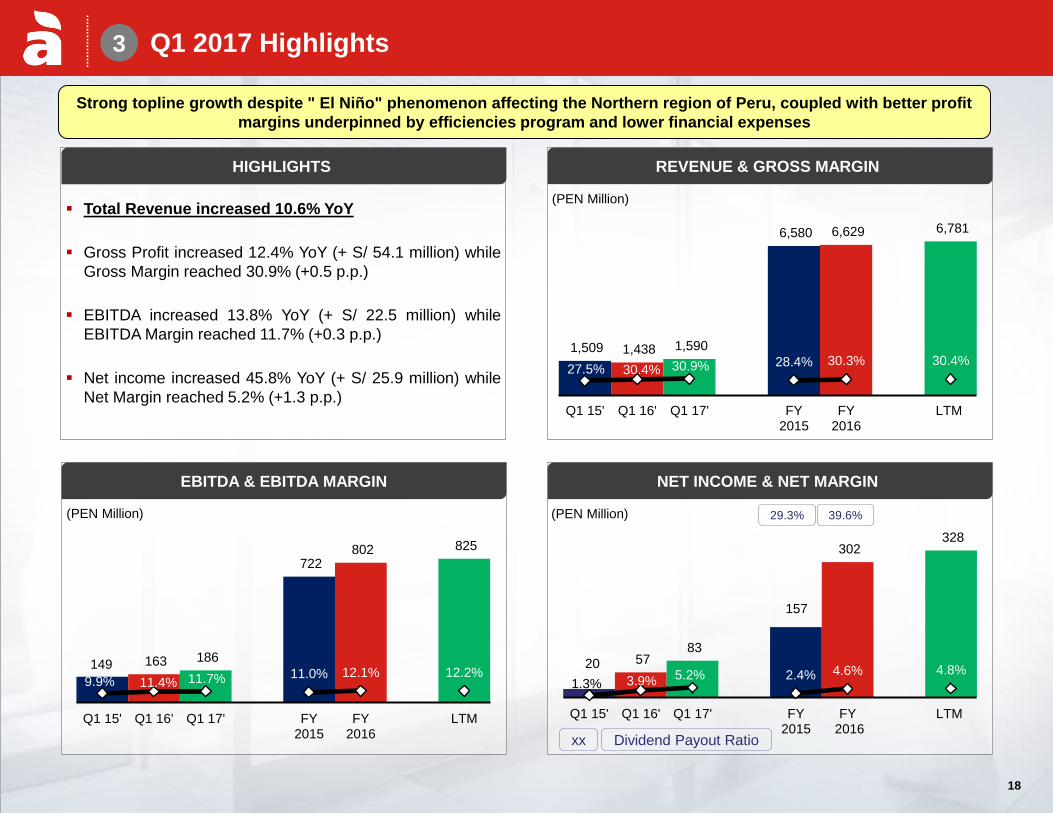
3 Q1 2017 Highlights
20 57 83
157
302 328
1.3% 3.9% 5.2% 2.4% 4.6% 4.8%
Q1 15' Q1 16' Q1 17' FY2015
FY 2016
LTM
149 163 186
722 802 825
9.9% 11.4% 11.7% 11.0% 12.1% 12.2%
Q1 15' Q1 16' Q1 17' FY2015
FY2016
LTM
1,509 1,438 1,590
6,580 6,629 6,781
27.5% 30.4% 30.9% 28.4% 30.3% 30.4%
Q1 15' Q1 16' Q1 17' FY2015
FY2016
LTM
Total Revenue increased 10.6% YoY
Gross Profit increased 12.4% YoY (+ S/ 54.1 million) while
Gross Margin reached 30.9% (+0.5 p.p.)
EBITDA increased 13.8% YoY (+ S/ 22.5 million) while
EBITDA Margin reached 11.7% (+0.3 p.p.)
Net income increased 45.8% YoY (+ S/ 25.9 million) while
Net Margin reached 5.2% (+1.3 p.p.)
HIGHLIGHTS
(PEN Million)
REVENUE & GROSS MARGIN
EBITDA & EBITDA MARGIN NET INCOME & NET MARGIN
(PEN Million) (PEN Million)
Strong topline growth despite " El Niño" phenomenon affecting the Northern region of Peru, coupled with better profit
margins underpinned by efficiencies program and lower financial expenses
39.6% 29.3%
xx Dividend Payout Ratio
18
19
Q1 2017 Operational Highlights 3
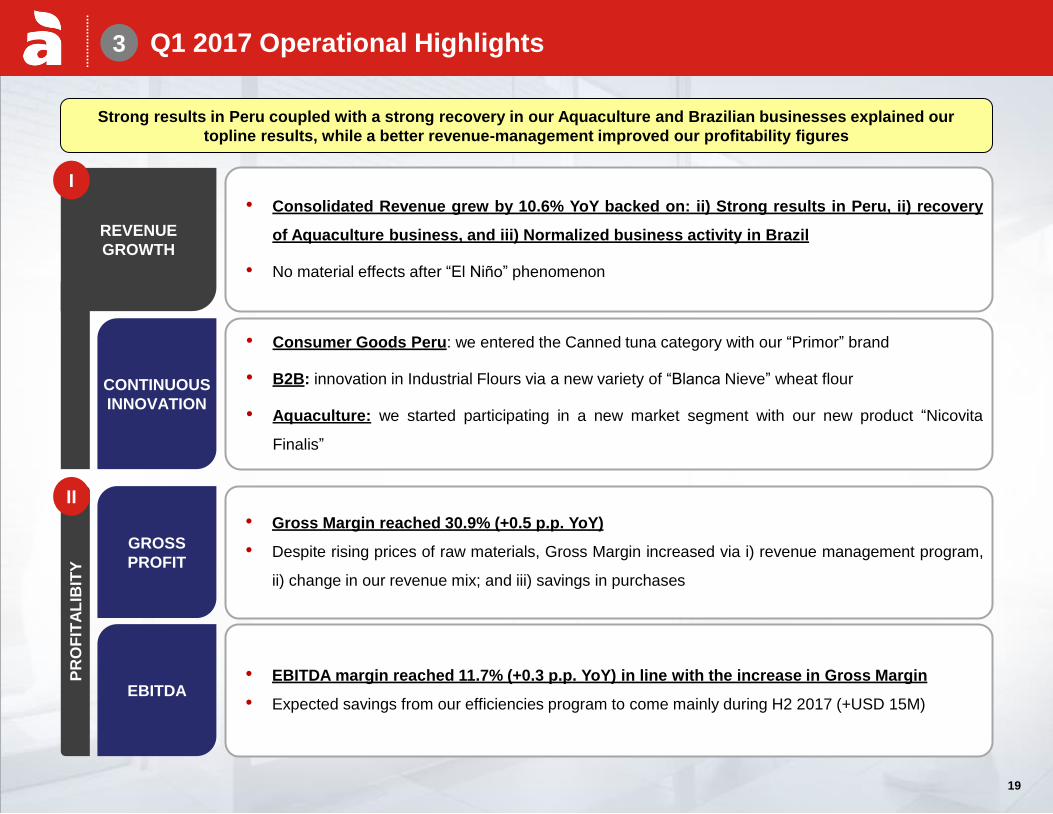
Strong results in Peru coupled with a strong recovery in our Aquaculture and Brazilian businesses explained our
topline results, while a better revenue-management improved our profitability figures
REVENUE
GROWTH
PR
OF
ITA
LIB
ITY
• Consolidated Revenue grew by 10.6% YoY backed on: ii) Strong results in Peru, ii) recovery
of Aquaculture business, and iii) Normalized business activity in Brazil
• No material effects after “El Niño” phenomenon
• Gross Margin reached 30.9% (+0.5 p.p. YoY)
• Despite rising prices of raw materials, Gross Margin increased via i) revenue management program,
ii) change in our revenue mix; and iii) savings in purchases
GROSS
PROFIT
EBITDA • EBITDA margin reached 11.7% (+0.3 p.p. YoY) in line with the increase in Gross Margin
• Expected savings from our efficiencies program to come mainly during H2 2017 (+USD 15M)
I
II
CONTINUOUS
INNOVATION
• Consumer Goods Peru: we entered the Canned tuna category with our “Primor” brand
• B2B: innovation in Industrial Flours via a new variety of “Blanca Nieve” wheat flour
• Aquaculture: we started participating in a new market segment with our new product “Nicovita
Finalis”
19
20
Q1 2017 Financial Highlights 3
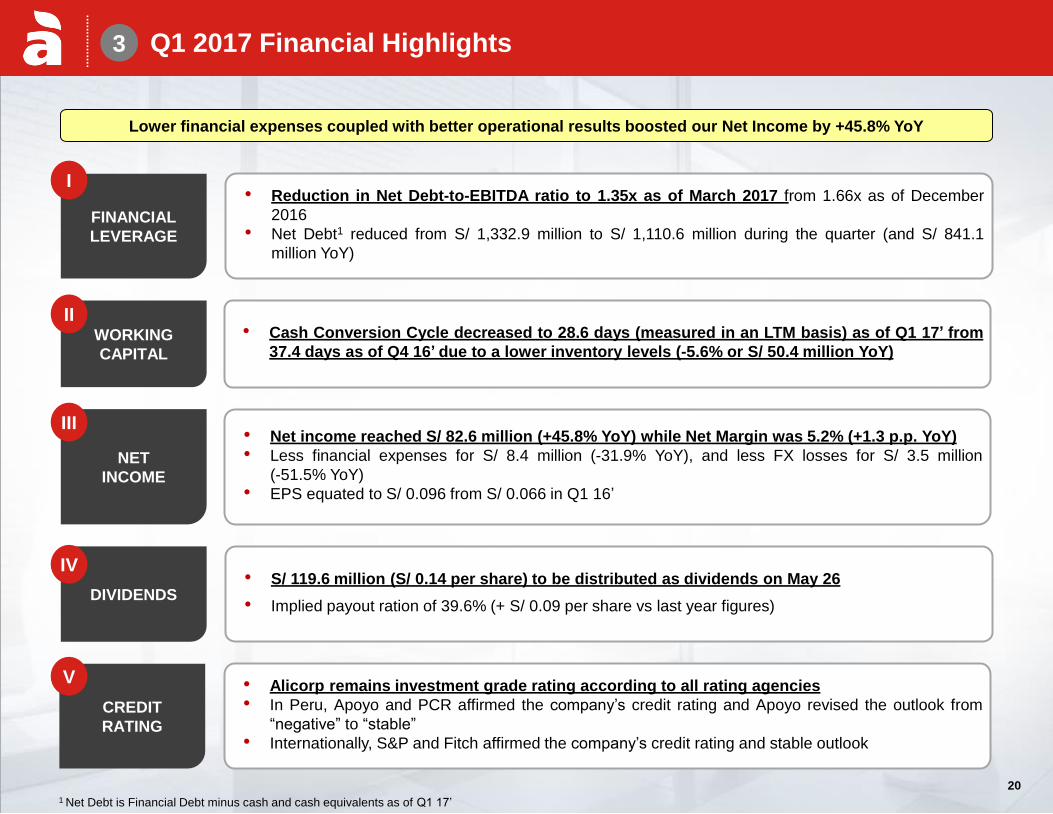
Lower financial expenses coupled with better operational results boosted our Net Income by +45.8% YoY
FINANCIAL
LEVERAGE
WORKING
CAPITAL
DIVIDENDS
• Reduction in Net Debt-to-EBITDA ratio to 1.35x as of March 2017 from 1.66x as of December
2016
• Net Debt1 reduced from S/ 1,332.9 million to S/ 1,110.6 million during the quarter (and S/ 841.1
million YoY)
• Cash Conversion Cycle decreased to 28.6 days (measured in an LTM basis) as of Q1 17’ from
37.4 days as of Q4 16’ due to a lower inventory levels (-5.6% or S/ 50.4 million YoY)
• S/ 119.6 million (S/ 0.14 per share) to be distributed as dividends on May 26
• Implied payout ration of 39.6% (+ S/ 0.09 per share vs last year figures)
I
II
IV
1 Net Debt is Financial Debt minus cash and cash equivalents as of Q1 17’
NET
INCOME
III • Net income reached S/ 82.6 million (+45.8% YoY) while Net Margin was 5.2% (+1.3 p.p. YoY)
• Less financial expenses for S/ 8.4 million (-31.9% YoY), and less FX losses for S/ 3.5 million
(-51.5% YoY)
• EPS equated to S/ 0.096 from S/ 0.066 in Q1 16’
20
CREDIT
RATING
• Alicorp remains investment grade rating according to all rating agencies
• In Peru, Apoyo and PCR affirmed the company’s credit rating and Apoyo revised the outlook from
“negative” to “stable”
• Internationally, S&P and Fitch affirmed the company’s credit rating and stable outlook
V
21
Index
5
6 Guidance 2017
Q1 2017 Highlights
1
3
Financial Metrics
4 Q1 2017 Business & Operating Review
About Alicorp
21
Our Strategy for creating value 2
22
Consumer Goods Peru
22
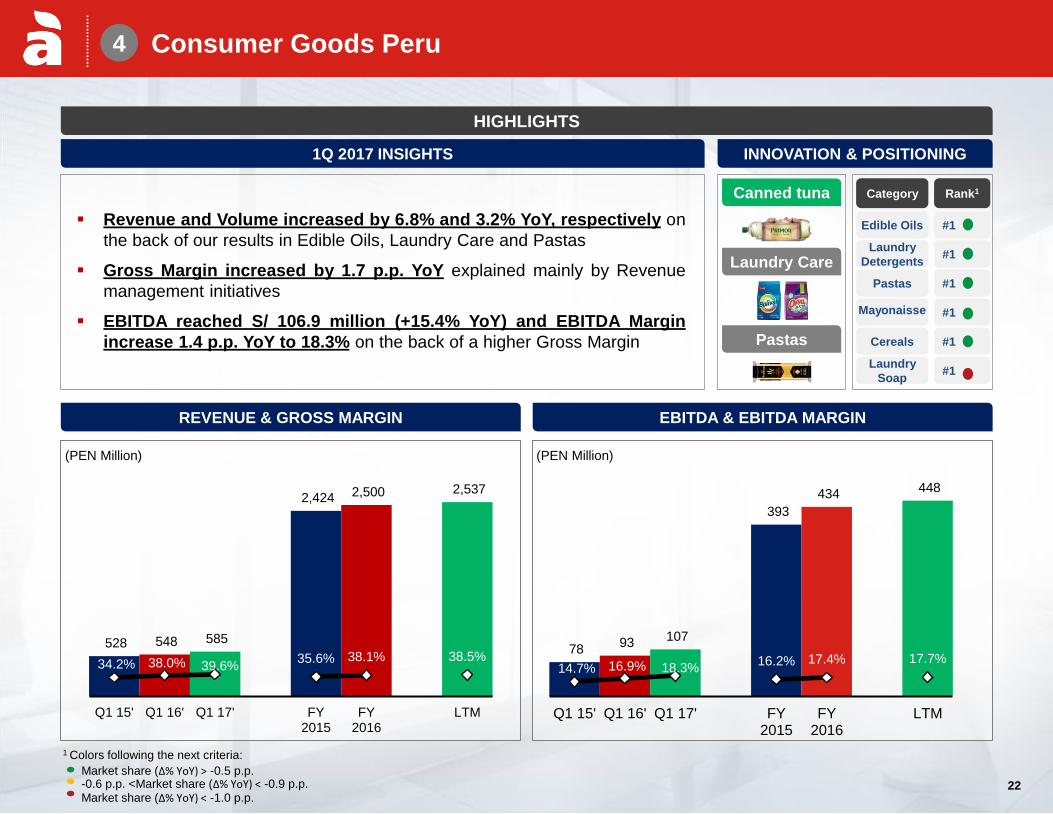
Revenue and Volume increased by 6.8% and 3.2% YoY, respectively on
the back of our results in Edible Oils, Laundry Care and Pastas
Gross Margin increased by 1.7 p.p. YoY explained mainly by Revenue
management initiatives
EBITDA reached S/ 106.9 million (+15.4% YoY) and EBITDA Margin
increase 1.4 p.p. YoY to 18.3% on the back of a higher Gross Margin
(PEN Million) (PEN Million)
78 93 107
393
434 448
14.7% 16.9% 18.3% 16.2% 17.4% 17.7%
Q1 15' Q1 16' Q1 17' FY2015
FY2016
LTM
HIGHLIGHTS
REVENUE & GROSS MARGIN
4
EBITDA & EBITDA MARGIN
INNOVATION & POSITIONING 1Q 2017 INSIGHTS
Canned tuna
Laundry Care
Pastas
528 548 585
2,424 2,500 2,537
34.2% 38.0% 39.6% 35.6% 38.1% 38.5%
Q1 15' Q1 16' Q1 17' FY2015
FY2016
LTM
Category Rank1
Edible Oils #1
Laundry
Detergents #1
Pastas #1
Mayonaisse #1
Cereals #1
Laundry
Soap #1
Market share (Δ% YoY) > -0.5 p.p. -0.6 p.p. <Market share (Δ% YoY) < -0.9 p.p. Market share (Δ% YoY) < -1.0 p.p.
1 Colors following the next criteria:
23
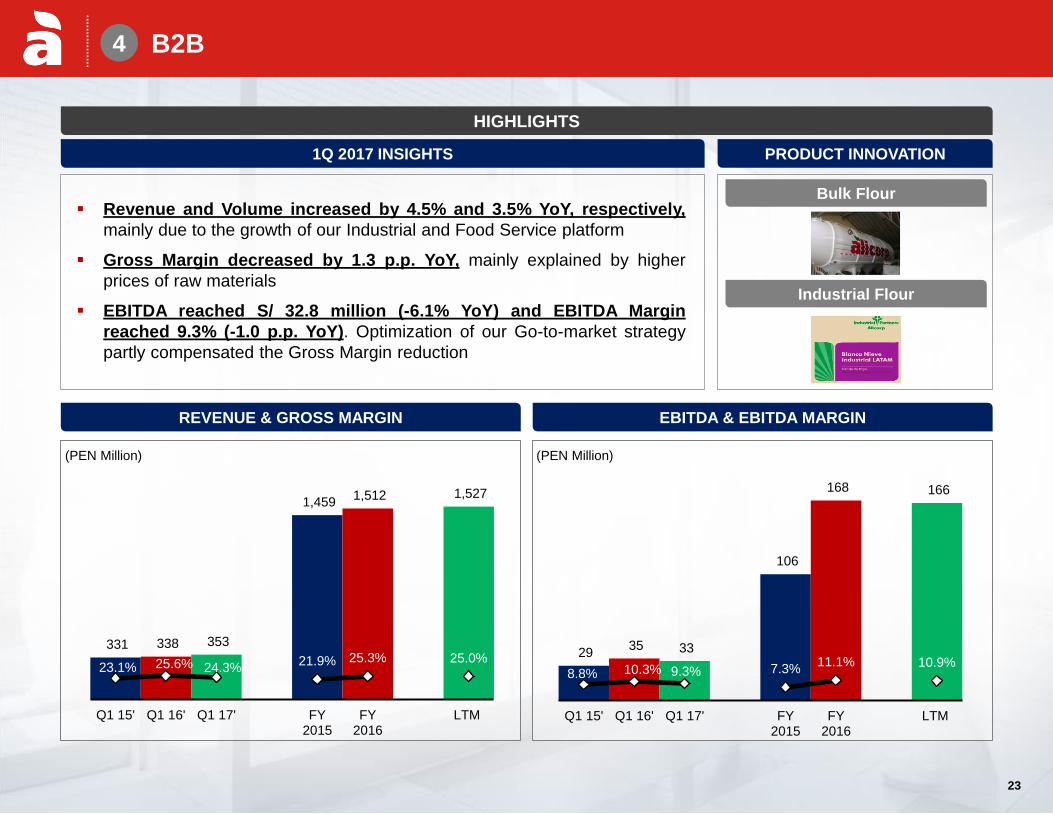
B2B
Revenue and Volume increased by 4.5% and 3.5% YoY, respectively,
mainly due to the growth of our Industrial and Food Service platform
Gross Margin decreased by 1.3 p.p. YoY, mainly explained by higher
prices of raw materials
EBITDA reached S/ 32.8 million (-6.1% YoY) and EBITDA Margin
reached 9.3% (-1.0 p.p. YoY). Optimization of our Go-to-market strategy
partly compensated the Gross Margin reduction
(PEN Million) (PEN Million)
HIGHLIGHTS
4
EBITDA & EBITDA MARGIN
PRODUCT INNOVATION 1Q 2017 INSIGHTS
331 338 353
1,459 1,512 1,527
23.1% 25.6% 24.3% 21.9% 25.3% 25.0%
Q1 15' Q1 16' Q1 17' FY2015
FY2016
LTM
Bulk Flour
Industrial Flour
REVENUE & GROSS MARGIN
29 35 33
106
168 166
8.8% 10.3% 9.3% 7.3% 11.1% 10.9%
Q1 15' Q1 16' Q1 17' FY2015
FY2016
LTM
23
24
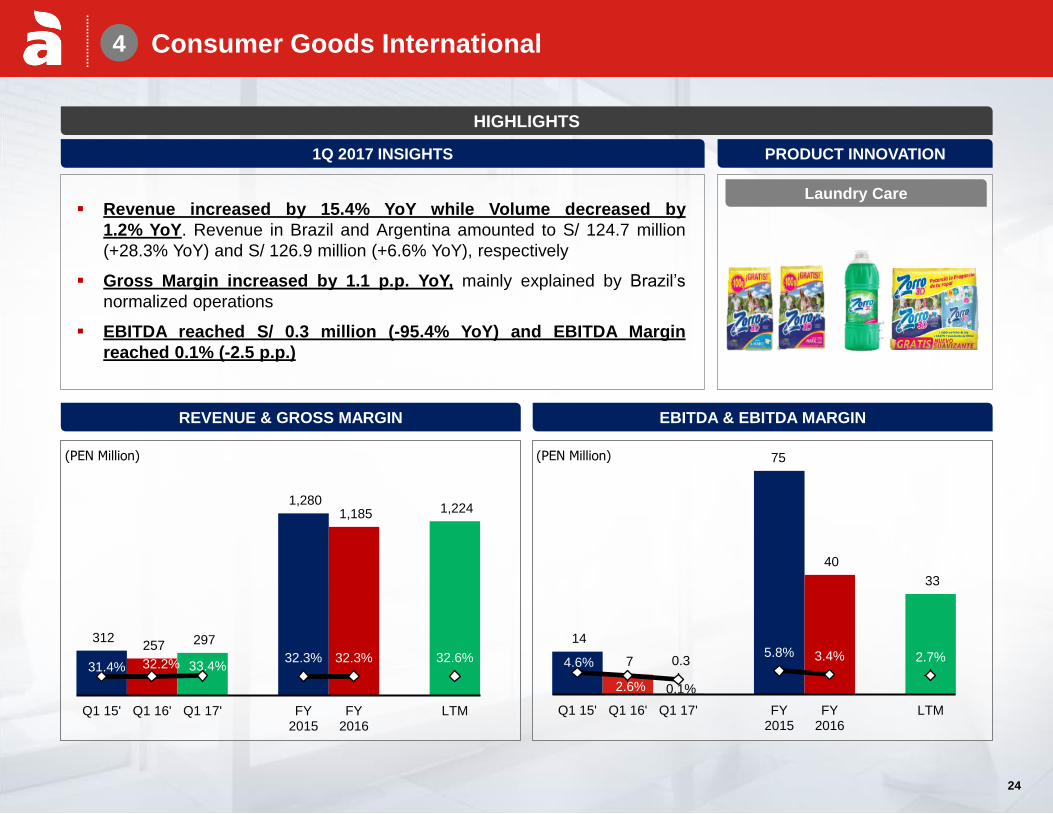
Consumer Goods International
Revenue increased by 15.4% YoY while Volume decreased by
1.2% YoY. Revenue in Brazil and Argentina amounted to S/ 124.7 million
(+28.3% YoY) and S/ 126.9 million (+6.6% YoY), respectively
Gross Margin increased by 1.1 p.p. YoY, mainly explained by Brazil’s
normalized operations
EBITDA reached S/ 0.3 million (-95.4% YoY) and EBITDA Margin
reached 0.1% (-2.5 p.p.)
(PEN Million) (PEN Million)
HIGHLIGHTS
4
EBITDA & EBITDA MARGIN
PRODUCT INNOVATION 1Q 2017 INSIGHTS
312 257 297
1,280 1,185 1,224
31.4% 32.2% 33.4% 32.3% 32.3% 32.6%
Q1 15' Q1 16' Q1 17' FY2015
FY2016
LTM
14
7 0.3
75
40
33
4.6%
2.6% 0.1%
5.8% 3.4% 2.7%
Q1 15' Q1 16' Q1 17' FY2015
FY2016
LTM
Laundry Care
REVENUE & GROSS MARGIN
24
25
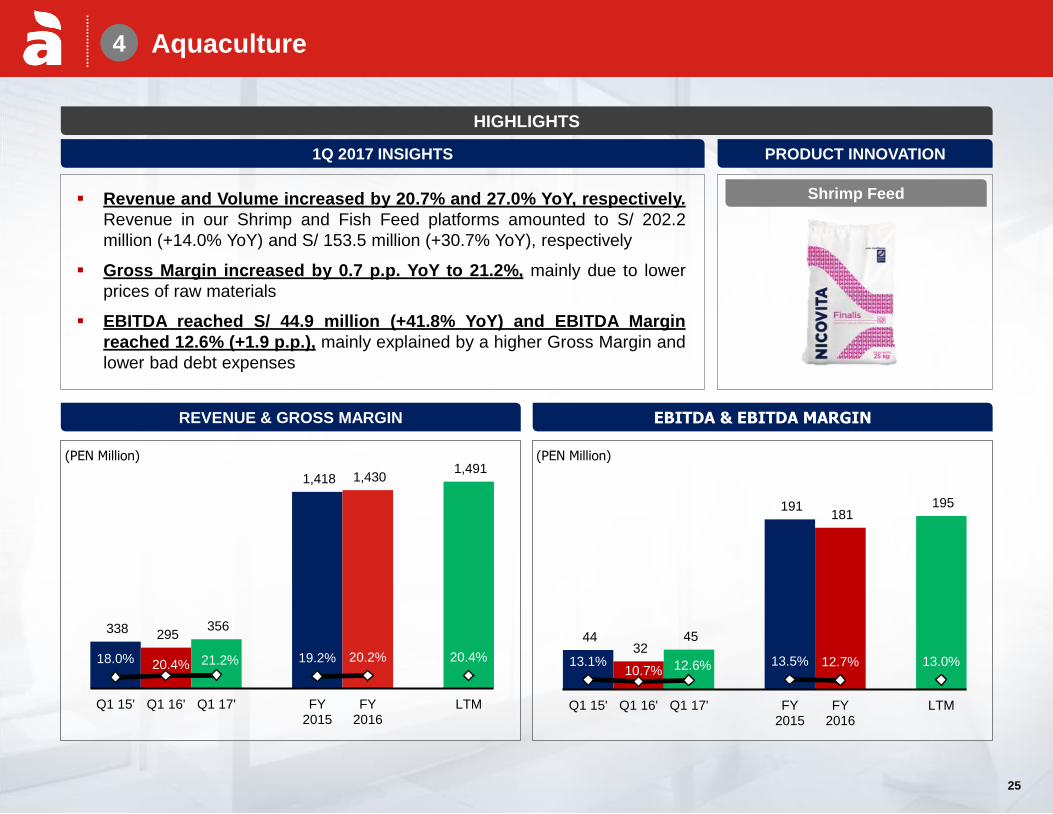
Aquaculture
Revenue and Volume increased by 20.7% and 27.0% YoY, respectively.
Revenue in our Shrimp and Fish Feed platforms amounted to S/ 202.2
million (+14.0% YoY) and S/ 153.5 million (+30.7% YoY), respectively
Gross Margin increased by 0.7 p.p. YoY to 21.2%, mainly due to lower
prices of raw materials
EBITDA reached S/ 44.9 million (+41.8% YoY) and EBITDA Margin
reached 12.6% (+1.9 p.p.), mainly explained by a higher Gross Margin and
lower bad debt expenses
(PEN Million) (PEN Million)
HIGHLIGHTS
4
EBITDA & EBITDA MARGIN
PRODUCT INNOVATION 1Q 2017 INSIGHTS
338 295 356
1,418 1,430 1,491
18.0% 20.4% 21.2% 19.2% 20.2% 20.4%
Q1 15' Q1 16' Q1 17' FY2015
FY2016
LTM
44 32
45
191 181
195
13.1% 10.7% 12.6% 13.5% 12.7% 13.0%
Q1 15' Q1 16' Q1 17' FY2015
FY2016
LTM
Shrimp Feed
REVENUE & GROSS MARGIN
25
26
Index
5
6 Guidance 2017
Q1 2017 Highlights
1
3
Financial Metrics
4 Q1 2017 Business & Operating Review
About Alicorp
26
Our Strategy for creating value 2
27
273.5
532.9
283.0
48.3 8.9 4.4
15.3
40.2 3.1
Net Cash onDec-16
Cash generatedfrom operations
Taxes Other expensesfrom operations
InvestmentActivities
Debt InterestPayment
DividentPayment
Other financialactivities
Net Cash onMar-17
1
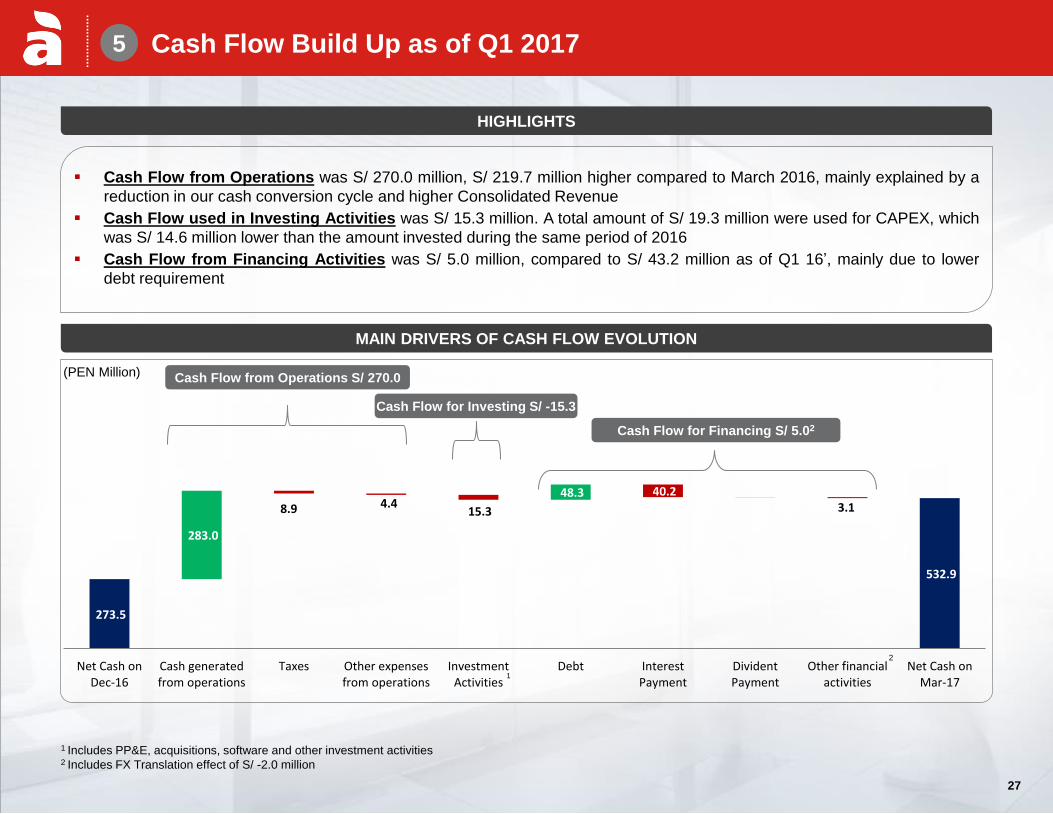
Cash Flow Build Up as of Q1 2017
Cash Flow from Operations was S/ 270.0 million, S/ 219.7 million higher compared to March 2016, mainly explained by a
reduction in our cash conversion cycle and higher Consolidated Revenue
Cash Flow used in Investing Activities was S/ 15.3 million. A total amount of S/ 19.3 million were used for CAPEX, which
was S/ 14.6 million lower than the amount invested during the same period of 2016
Cash Flow from Financing Activities was S/ 5.0 million, compared to S/ 43.2 million as of Q1 16’, mainly due to lower
debt requirement
1 Includes PP&E, acquisitions, software and other investment activities
2 Includes FX Translation effect of S/ -2.0 million
(PEN Million) Cash Flow from Operations S/ 270.0
Cash Flow for Financing S/ 5.02
Cash Flow for Investing S/ -15.3
2
MAIN DRIVERS OF CASH FLOW EVOLUTION
HIGHLIGHTS
1
5
27
28
55.9 54.4 52.2 50.3 48.9
83.5 81.1 77.0 72.1 66.6
92.2 88.0 86.7 84.9 87.0
Q1 16' Q2 16' Q3 16' Q4 16' Q1 17'
Accounts Receivable Inventories Accounts Payable
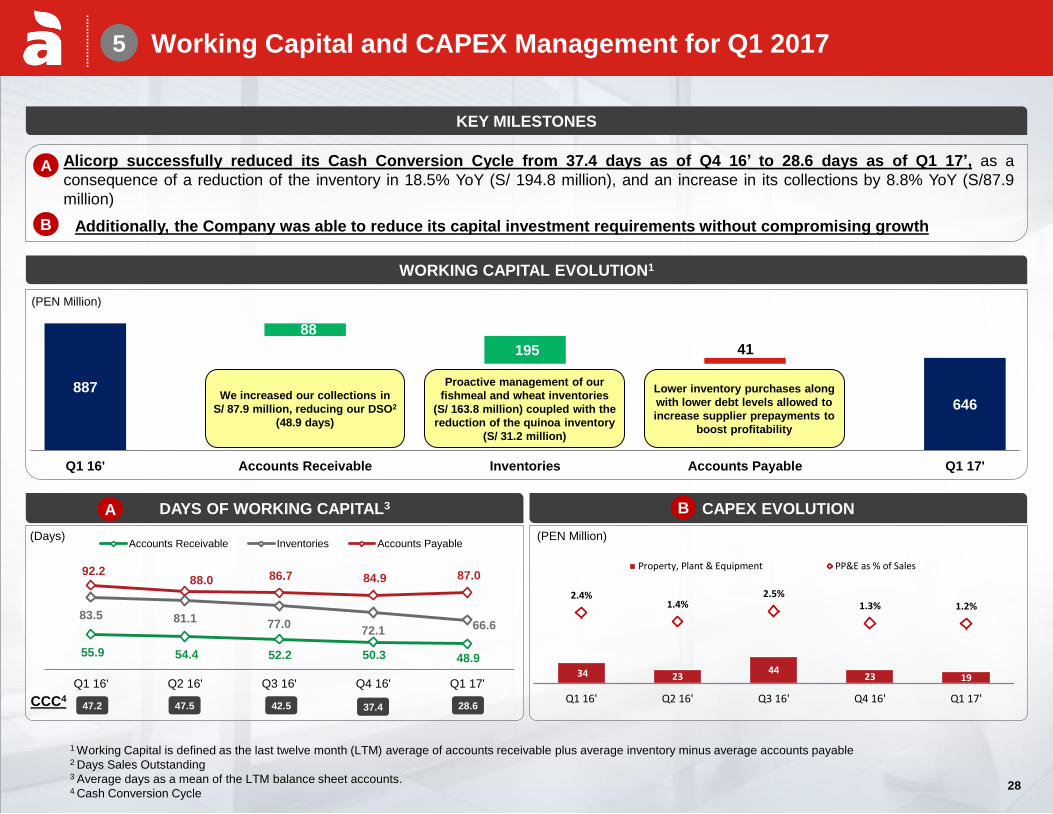
Working Capital and CAPEX Management for Q1 2017
KEY MILESTONES
• Alicorp successfully reduced its Cash Conversion Cycle from 37.4 days as of Q4 16’ to 28.6 days as of Q1 17’, as a
consequence of a reduction of the inventory in 18.5% YoY (S/ 194.8 million), and an increase in its collections by 8.8% YoY (S/87.9
million)
• DAdditionally, the Company was able to reduce its capital investment requirements without compromising growth
A
B
A
(PEN Million)
CAPEX EVOLUTION A B
1 Working Capital is defined as the last twelve month (LTM) average of accounts receivable plus average inventory minus average accounts payable
2 Days Sales Outstanding
3 Average days as a mean of the LTM balance sheet accounts. 4 Cash Conversion Cycle
(Days)
CCC4 47.5 47.2 42.5 28.6
(PEN Million)
WORKING CAPITAL EVOLUTION1
DAYS OF WORKING CAPITAL3 A
88
195 41
887
646
Q1 16' Accounts Receivable Inventories Accounts Payable Q1 17'
Mill
ares
34 23 44
23 19
2.4% 1.4%
2.5% 1.3% 1.2%
Q1 16' Q2 16' Q3 16' Q4 16' Q1 17'
Mill
ares
Property, Plant & Equipment PP&E as % of Sales
37.4
We increased our collections in
S/ 87.9 million, reducing our DSO2
(48.9 days)
Proactive management of our
fishmeal and wheat inventories
(S/ 163.8 million) coupled with the
reduction of the quinoa inventory
(S/ 31.2 million)
Lower inventory purchases along
with lower debt levels allowed to
increase supplier prepayments to
boost profitability
5
28
29
5.0%
89.5%
5.1% 0.4%
4.7%
90.9%
4.4%
USD
PEN
BRL
ARS
2.65x 2.43x
2.08x
1.66x 1.35x
Q1 16' Q2 16' Q3 16' Q4 16' Q1 17'
11.1%
8.9% 8.3% 8.4% 8.5%
207 201
845 845
532 314
22
284
Q4 16' Q1 17'
International Bond
Local Bonds
LT Bank Debt
ST Bank Debt
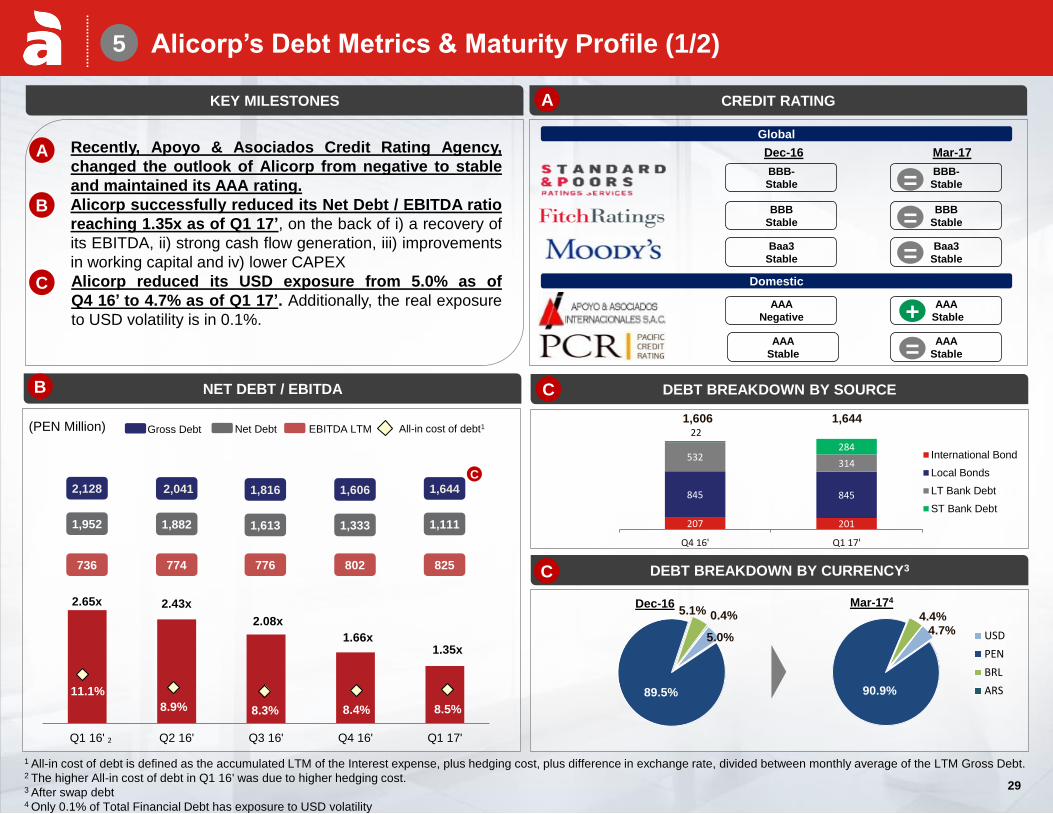
Alicorp’s Debt Metrics & Maturity Profile (1/2)
• Recently, Apoyo & Asociados Credit Rating Agency,
changed the outlook of Alicorp from negative to stable
and maintained its AAA rating.
• Alicorp successfully reduced its Net Debt / EBITDA ratio
reaching 1.35x as of Q1 17’, on the back of i) a recovery of
its EBITDA, ii) strong cash flow generation, iii) improvements
in working capital and iv) lower CAPEX
Alicorp reduced its USD exposure from 5.0% as of
Q4 16’ to 4.7% as of Q1 17’. Additionally, the real exposure
to USD volatility is in 0.1%.
A
B
A
Global
Domestic
BBB-
Stable
BBB
Stable
Baa3
Stable
AAA
Negative
AAA
Stable
KEY MILESTONES CREDIT RATING
DEBT BREAKDOWN BY SOURCE
5
C
C
NET DEBT / EBITDA
1,952
736
(PEN Million) Net Debt EBITDA LTM
1,882
774
1,613
776
1,333
802
1,111
825
B
Dec-16 Mar-17
DEBT BREAKDOWN BY CURRENCY3
Dec-16 Mar-174
1,606 1,644
A
C
BBB-
Stable
BBB
Stable
Baa3
Stable
AAA
Stable
AAA
Stable
All-in cost of debt1
+
=
2,128 2,041 1,816 1,606 1,644
=
=
=
Gross Debt
C
1 All-in cost of debt is defined as the accumulated LTM of the Interest expense, plus hedging cost, plus difference in exchange rate, divided between monthly average of the LTM Gross Debt.
2 The higher All-in cost of debt in Q1 16' was due to higher hedging cost.
3 After swap debt 4 Only 0.1% of Total Financial Debt has exposure to USD volatility
2
29
30
284
64
116
216
97
8
361
50 100 100 100 100
50
2017 2018 2019 2020 2023 2025 2026 2027 2028 2029 2030
Short-Term Bank Debt Long-Term Bank Debt Local Bonds International Bonds
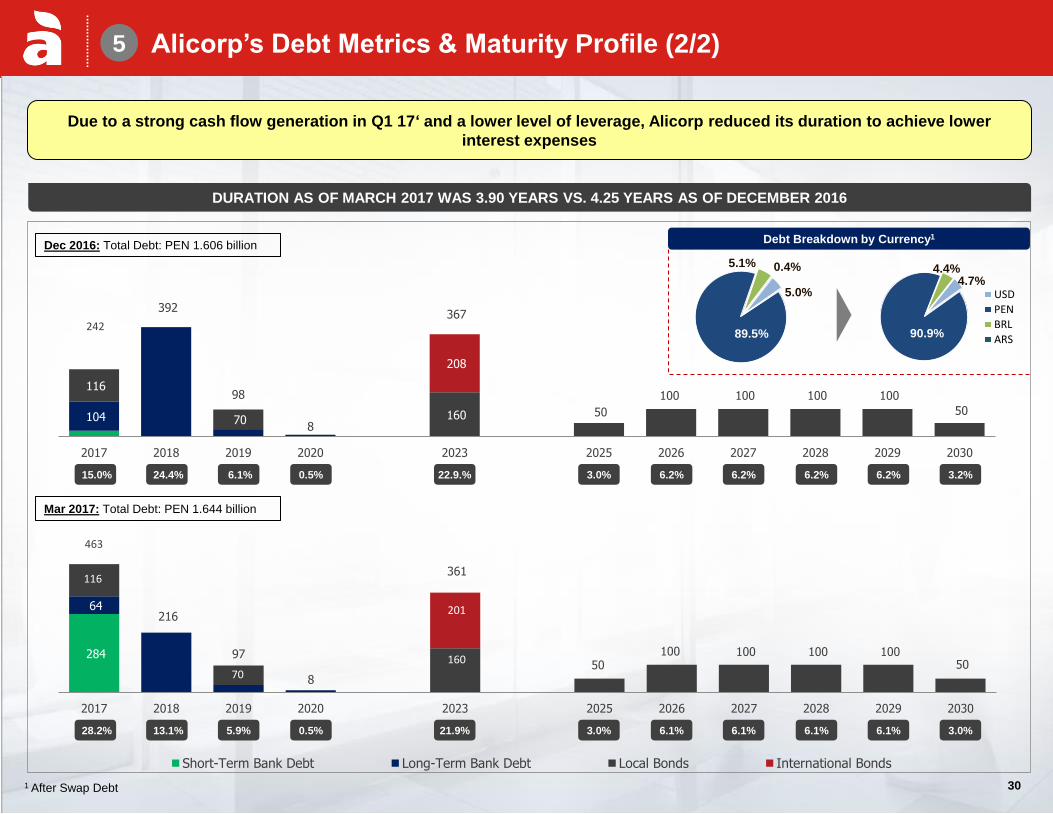
Alicorp’s Debt Metrics & Maturity Profile (2/2)
DURATION AS OF MARCH 2017 WAS 3.90 YEARS VS. 4.25 YEARS AS OF DECEMBER 2016
Mar 2017: Total Debt: PEN 1.644 billion
Dec 2016: Total Debt: PEN 1.606 billion
242
5
104
116
116
463
70
70
207
201
15.0% 24.4% 6.1% 0.5% 22.9.% 3.0% 6.2% 6.2% 6.2% 3.2% 6.2%
160
104
116
70 160
208
392
98
8
367
50
100 100 100 100
50
2017 2018 2019 2020 2023 2025 2026 2027 2028 2029 2030
70
201
160
28.2% 13.1% 5.9% 0.5% 21.9% 3.0% 6.1% 6.1% 6.1% 3.0% 6.1%
Debt Breakdown by Currency1
5.0%
89.5%
5.1% 0.4% 4.7%
90.9%
4.4%
USD
PEN
BRL
ARS
1 After Swap Debt
Due to a strong cash flow generation in Q1 17‘ and a lower level of leverage, Alicorp reduced its duration to achieve lower
interest expenses
30
31
Index
5
6 Guidance 2017
Q1 2017 Highlights
1
3
Financial Metrics
4 Q1 2017 Business & Operating Review
About Alicorp
31
Our Strategy for creating value 2
32
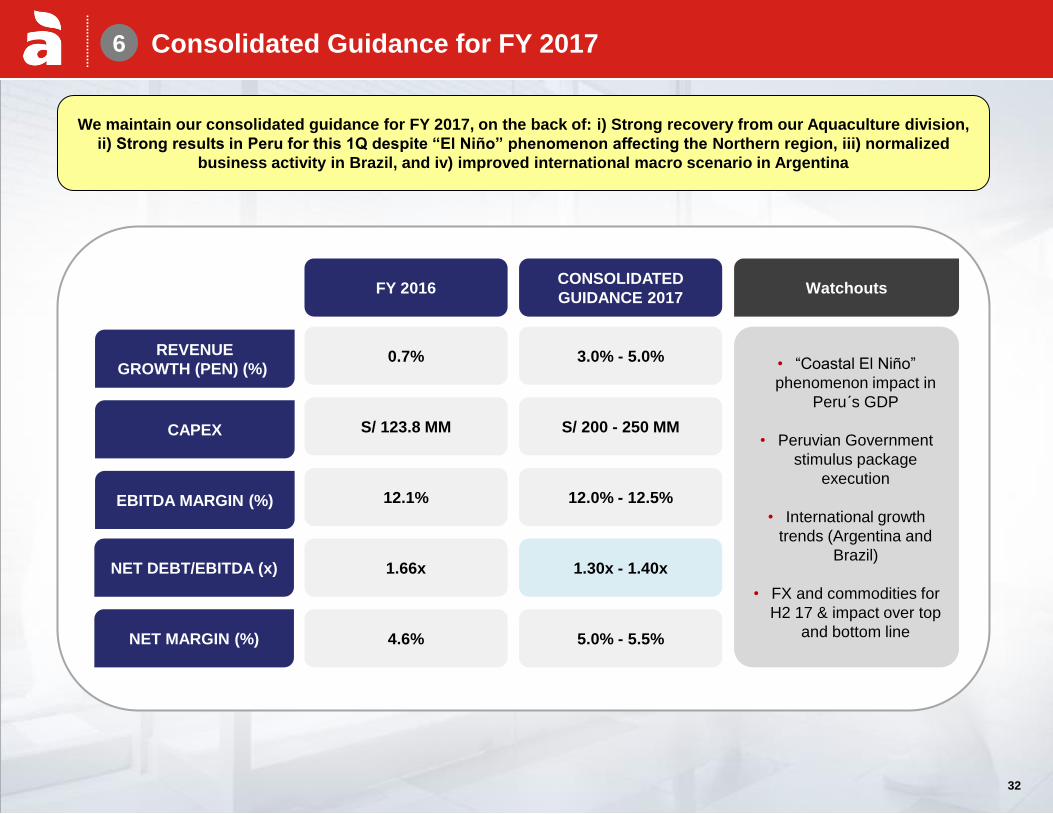
Consolidated Guidance for FY 2017
FY 2016
0.7%
12.1%
S/ 123.8 MM
1.66x NET DEBT/EBITDA (x)
CONSOLIDATED
GUIDANCE 2017
3.0% - 5.0%
12.0% - 12.5%
S/ 200 - 250 MM
1.30x - 1.40x
4.6% NET MARGIN (%) 5.0% - 5.5%
REVENUE
GROWTH (PEN) (%)
EBITDA MARGIN (%)
CAPEX
6
We maintain our consolidated guidance for FY 2017, on the back of: i) Strong recovery from our Aquaculture division,
ii) Strong results in Peru for this 1Q despite “El Niño” phenomenon affecting the Northern region, iii) normalized
business activity in Brazil, and iv) improved international macro scenario in Argentina
• “Coastal El Niño”
phenomenon impact in
Peru´s GDP
• Peruvian Government
stimulus package
execution
• International growth
trends (Argentina and
Brazil)
• FX and commodities for
H2 17 & impact over top
and bottom line
Watchouts
32
33
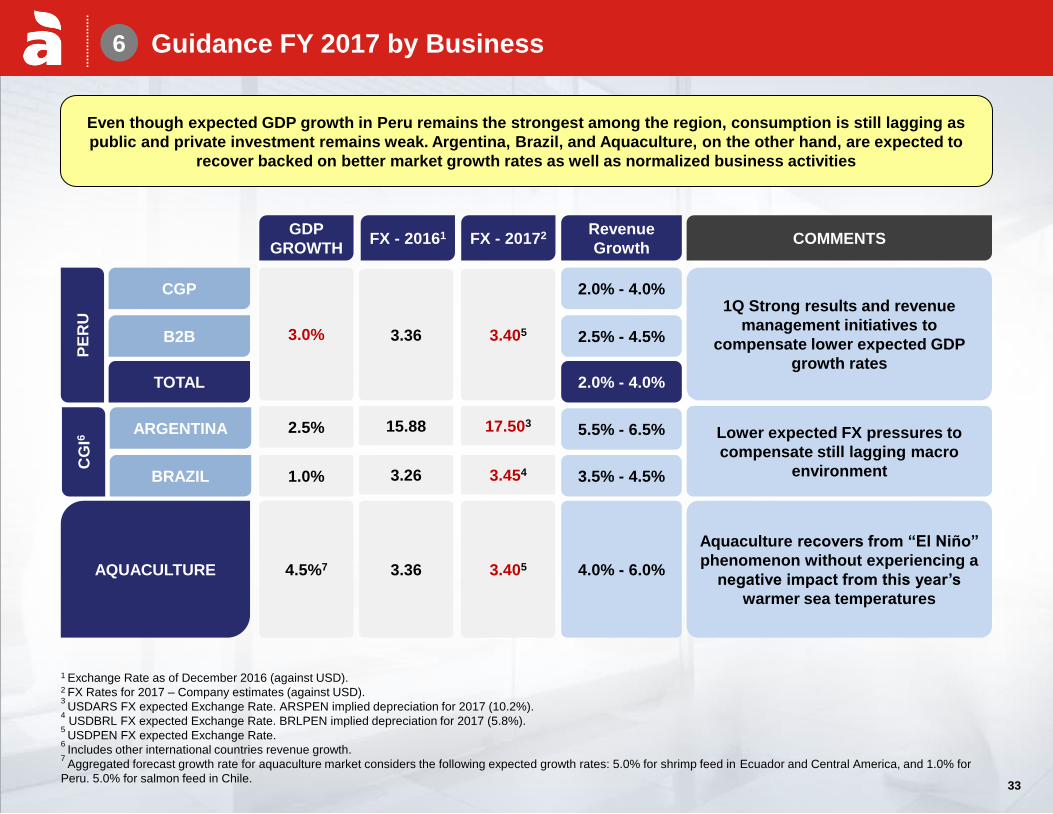
Guidance FY 2017 by Business
1 Exchange Rate as of December 2016 (against USD). 2 FX Rates for 2017 – Company estimates (against USD). 3 USDARS FX expected Exchange Rate. ARSPEN implied depreciation for 2017 (10.2%). 4 USDBRL FX expected Exchange Rate. BRLPEN implied depreciation for 2017 (5.8%).
5 USDPEN FX expected Exchange Rate. 6 Includes other international countries revenue growth. 7 Aggregated forecast growth rate for aquaculture market considers the following expected growth rates: 5.0% for shrimp feed in Ecuador and Central America, and 1.0% for
Peru. 5.0% for salmon feed in Chile.
6
FX - 20172
3.405
17.503
3.405
3.454
CGP
2.5% - 4.5%
PE
RU
2.0% - 4.0%
B2B
3.5% - 4.5%
5.5% - 6.5% ARGENTINA
CG
I6
BRAZIL
AQUACULTURE
3.0%
2.5%
1.0%
Revenue
Growth
GDP
GROWTH FX - 20161
3.36
15.88
4.5%7 3.36 4.0% - 6.0%
3.26
TOTAL 2.0% - 4.0%
Even though expected GDP growth in Peru remains the strongest among the region, consumption is still lagging as
public and private investment remains weak. Argentina, Brazil, and Aquaculture, on the other hand, are expected to
recover backed on better market growth rates as well as normalized business activities
COMMENTS
1Q Strong results and revenue
management initiatives to
compensate lower expected GDP
growth rates
Lower expected FX pressures to
compensate still lagging macro
environment
Aquaculture recovers from “El Niño”
phenomenon without experiencing a
negative impact from this year’s
warmer sea temperatures
33