Embed Size (px)
Citation preview
Corporate Presentation December 2011
1

Agenda
Introduction
Financial Summary
Retailing Overview
Marketing Strategy
Operations Review
Open Forum
2

Become the No.1 national beauty spa chain in China, in store growth, brand image and
attractiveness for franchisees
Recognized as
“Total Skincare Solutions Expert”
Strategic Objectives
3
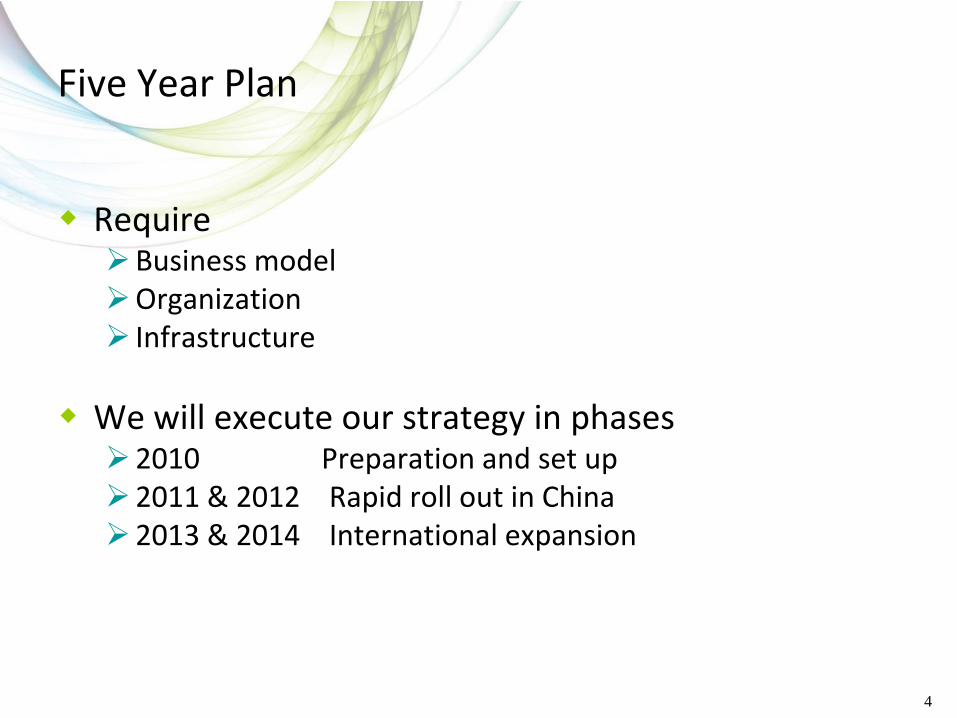
Five Year Plan
Require Business model Organization Infrastructure
We will execute our strategy in phases 2010 Preparation and set up 2011 & 2012 Rapid roll out in China 2013 & 2014 International expansion
4

Professional Spa service
Products with US patent
Distribution network
License training
Research & Development
Manufacture of beauty and skin care products
Distribution of products
Government certified beauty training schools
Training of 7 professional beautician licenses
Department Store Counters
SPAs
Franchised SPA
Self-owned SPA
ISO accredited Factories in
Shanghai & Taipei
4 Logistics centers in China
Core Business
5

• Build a world-class leadership team with proven track record
– CEO: John Tseng
• Corporate VP, Eastman Kodak
• MD of Goodyear Greater China
– CFO/COO: Jacky Chan
• GM of Kodak China
• GM of Evergreen Packaging China
– VP Retail Operation: Antonio Lee
• Kodak Senior VP Retail Operation, Greater Asia Region
• Developed and managed over 10,000 stores
– CMO: Shirley Tai
• GM of Estee Lauder HK
• GM of Clinique China
Organization & Team
6

Financial Summary
7

Summarized Results in 1H2011
Turnover increased by 25.6% to HK$288.5 million
Net profit surged by 280.9% to HK$60.4 million
Gross margin maintain at a high level of 78%
Net cash increased slightly to HK$577.1 million with no borrowing despite dividend paid out of HK$90 million during the first six months
Interim dividend of HK$0.035 per share (Div. payout at 115.9%), same as 1H2010
8

Financial Summary
HK$ Million Chg %
2010 2011
Turnover 229.6 288.5 25.6%
Gross profit 159.4 224.4 40.8%
Profit before tax 36.6 80.1 119.0%
Net profit 15.8 60.4 280.9%
Dividend per share (HK cents)
- Interim (HK cents) 3.50 3.50 0.0%
Dividend payout (%) 440.7 115.9 -324.8
Basic EPS (HK cents) 0.79 3.02 280.2%
For six months ended
30 June,
9

Waterfall Chart – Change in net profit
0
10,000
20,000
30,000
40,000
50,000
60,000
70,000
80,000
90,000
100,000
HK
$000
1H2010 NET PROFIT to 1H2011 NET PROFIT
10

-120%
-80%
-40%
0%
40%
80%
120%
160%
200%
240%
280%
-120,000
-80,000
-40,000
-
40,000
80,000
120,000
160,000
Net profit (HK$'000) Net profit yoy growth rate
Net Profit Changes
Net profit growth momentum restored.
House
Clean Up
11

Key Ratios For year ended For six months Good /
31 December, ended 30 June, Chg Improv't
2010 2011
A/R days * 14 days 14 days -
A/P days * 37 days 52 days 15 days
Inventory turnover days * 131 days 111 days -20 days
ROE * (%) 4.0 15.5 11.5 pts
ROA * (%) 3.3 12.8 9.5 pts
Cash (HK$ million) 575.5 577.1 0.3%
Gearing Ratio Net cash Net cash N/A
Dividend payout (%) 511.7 115.9 -395.8 pts
Basic EPS (HK cents) 1.56 3.02 93.0%
* Annualised for comparison purpose.
Cash represents 61.0% of total assets as of 30 June 2011.
12

Stable Dividends and High Dividend Payout History
Historic dividend payout ratio >70%
0%
100%
200%
300%
400%
500%
600%
-
20,000
40,000
60,000
80,000
100,000
120,000
140,000
160,000
180,000
FY2008 FY2009 FY2010 1H2011
Div
ide
nd
pay
ou
t ra
tio
(%
)
HK
$'0
00
Stable Dividends
Interim dividend Final dividend Dividend payout ratio
13

Turnover Analysis for 1H2011 By Region By Products / Service
-27.4% yoy
1.2%
37.3% yoy
-4.2% yoy
19.0%
79.8%
The PRC Taiwan Others (incl. Hong Kong, Macau & Malaysia)
1.3%
98.7%
- 18.8% yoy
26.6% yoy
Product Sales Service Income
14
Geographical Revenue Breakdown
Expressed in HK$'000 1H2011 % 1H2010 % Variance Var (%)
PRC 230,278 80% 167,730 73% 62,548 37.3%
Taiwan 54,828 19% 57,229 25% (2,402) -4.2%
Others 3,370 1% 4,646 2% (1,275) -27.4%
Total 288,476 100% 229,605 100% 58,871 25.6%
Revenue By Type Breakdown
Expressed in HK$'000 1H2011 % 1H2010 % Variance Var (%)
Product sales 284,681 99% 224,889 98% 59,792 26.6%
Services 3,795 1% 4,674 2% (878) -18.8%
Entrustment 0 0% 42 0% (43) -102.4%
Total 288,476 100% 229,605 100% 58,871 25.6%

Distribution Network in Greater China
As at 30 June 2011 Franchisee
owned Entrusted
Self-
owned
Self-
owned
Total Spas Counters Spas Counters
The PRC 1,132 1,079 18 2 33
Taiwan 352 347 - 5 -
HK 1 - - -
Macau - - 1 -
Malaysia 32 - - -
Total 1,518 1,459 18 8 33
Others 34
15

Group Profitability
Group gross margin stood at 78% despite high inflation & higher labor costs
Improving operating margin mainly due to:
Strong sales in PRC as a result of increase in New Concept Store (NCS)
0.0%
10.0%
20.0%
30.0%
40.0%
50.0%
60.0%
70.0%
80.0%
90.0%
100.0%
FY05 FY06 FY07 FY08 FY09 FY10 1H11
Gross margin
Gross margin (excl. non-cash inventory provision, Fonperi and Loss-Making Self-Owned Spas)
Operating margin
Operating margin (excl. one-off expenses & non-cash stock option expense)
16

Retailing Overview
17
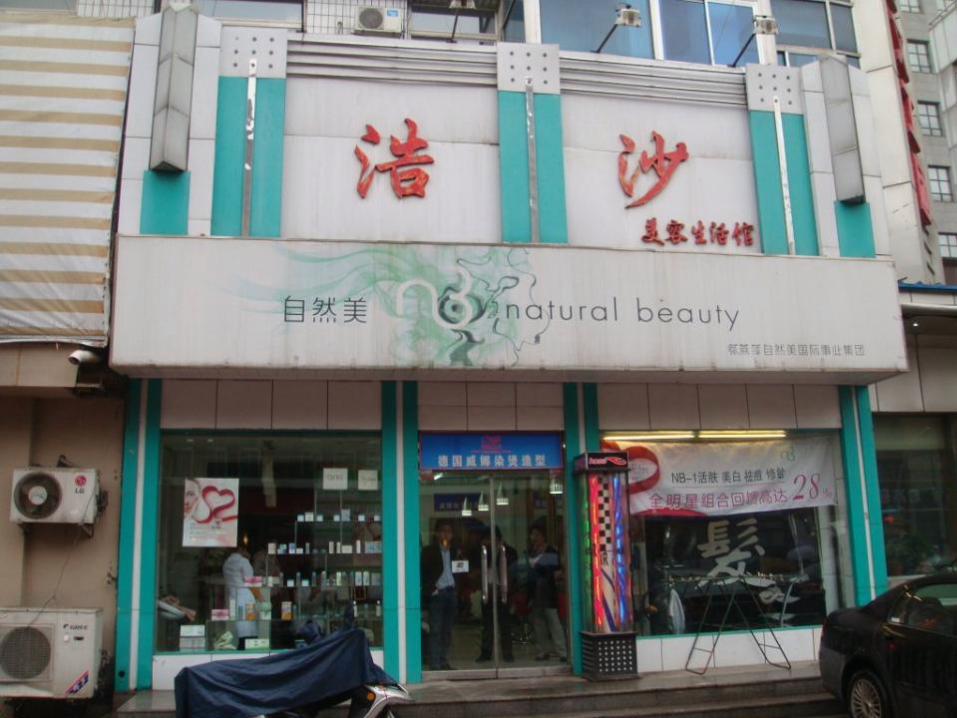
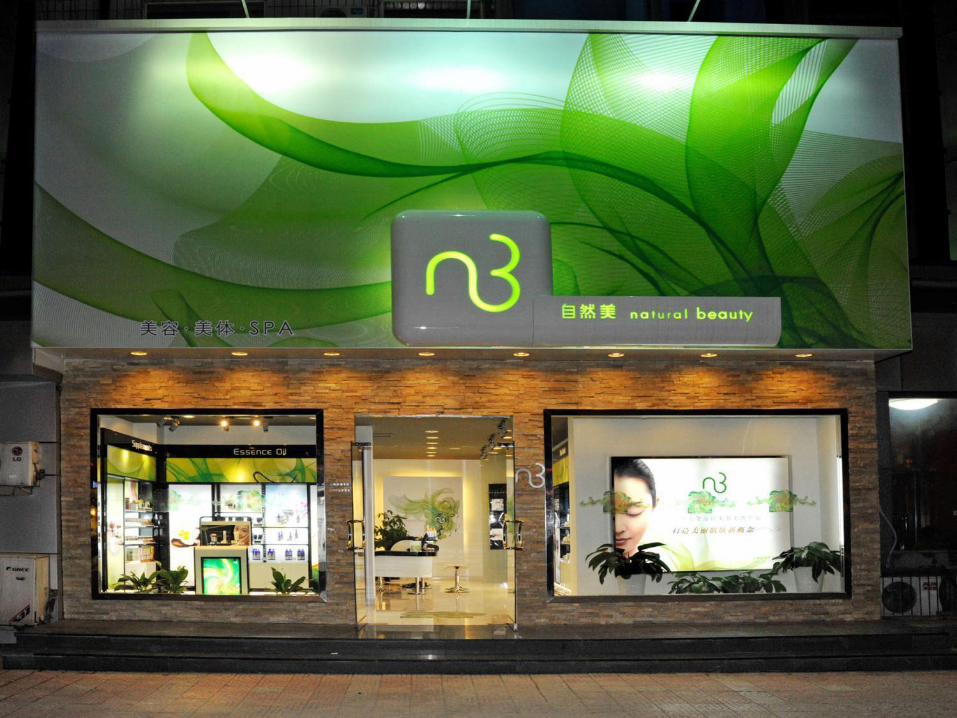


26


1st May , 2010
• NCS Pilot Test in Xian
Aug , 2010
• Rolled out NCS in China
30th June , 2011
• 137 NCS opened in China
– 85 Upgrade
– 52 New
29
New Concept Store (NCS) Development

May Jun Jul Aug Sep Oct Nov Dec Jan Feb Mar Apr May Jun
new 0 0 0 0 4 5 7 16 29 29 30 38 45 52
upgrading 1 1 2 7 18 23 27 42 56 57 57 73 82 85
0
10
20
30
40
50
60
70
80
90
(May 2010 ~ June 2011 ,Cumulative )
30
New Concept Store (NCS) Development

RMB’000
Store No
50 50 50 50 50 50 50 50 50 50 50 50 50 50 50 50 50 50
$377 $377 $380 $375$387
$359 $356$344
$363 $371 $379 $390 $388 $391$412
$433$454
$526
0
50
100
150
200
$250
$300
$350
$400
$450
$500
$550
Jan/10 Feb/10 Mar/10 Apr/10 May/10Jun/10 Jul/10 Aug/10 Sep/10 Oct/10 Nov/10 Dec/10 Jan/11 Feb/11 Mar/11 Apr/11 May/11Jun/11
NCS Stores No. & SPS-12 Month Rolling
Store No. SPS
638 638 638 638 638 638 638 638 638 638 638 638 638 638 638 638 638 638
$218 $213 $217 $216 $220$208 $209 $208 $216 $223 $222 $218
$228 $232$243 $245 $242
$264
0
500
1,000
1,500
2,000
$100
$150
$200
$250
$300
Jan/10 Feb/10 Mar/10 Apr/10 May/10 Jun/10 Jul/10 Aug/10 Sep/10 Oct/10 Nov/10 Dec/10 Jan/11 Feb/11 Mar/11 Apr/11 May/11 Jun/11
Non-NCS Stores No. & SPS-12 Month Rolling
Store No. SPS
+47%
+27%
31
Channel Sales Performance (12-month Rolling Sales per Store (PRC))
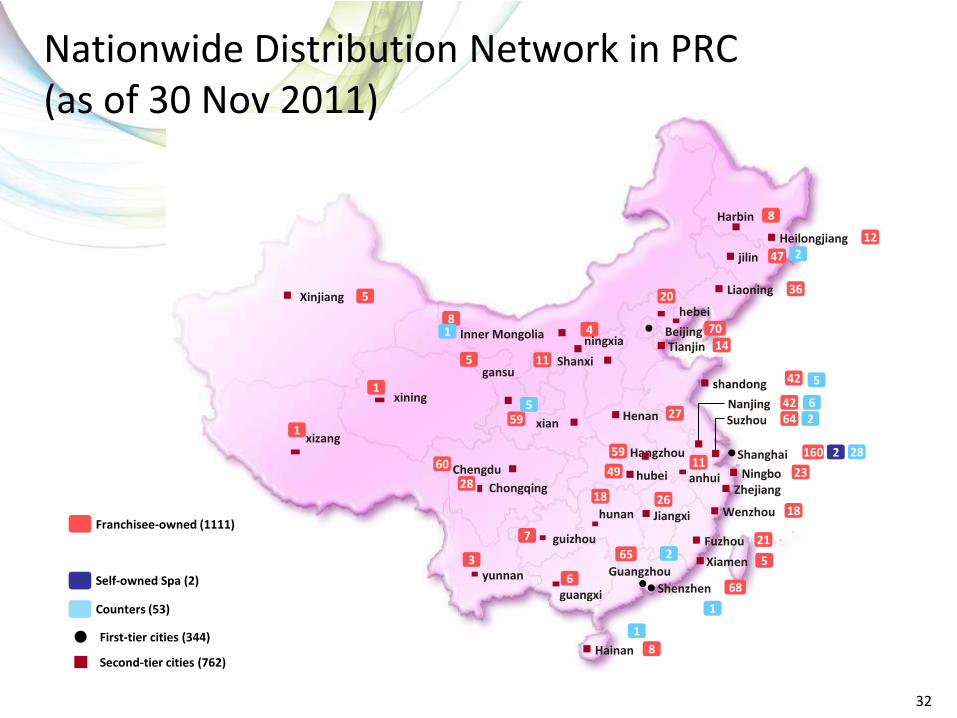
70 Beijing
47 jilin
Chengdu 60
21 Fuzhou 65
Guangzhou
8 Harbin
8 Hainan
59 Hangzhou
27 Henan
26 Jiangxi
Chongqing
4
5 Xinjiang
5 Xiamen
59 xian
49 hubei
18 Wenzhou
14 Tianjin
64 Suzhou
36 Liaoning
68 Shenzhen
11 Shanxi
42 shandong
23 Ningbo
160 2 Shanghai
42 Nanjing
12 Heilongjiang
5 gansu
28
2 6
2
Zhejiang
Franchisee-owned (1111)
Self-owned Spa (2)
First-tier cities (344)
Second-tier cities (762)
Counters (53)
2
Inner Mongolia
1
8
5
1
5
1
guizhou
yunnan
xizang
hebei
xining
1
3
ningxia
guangxi
hunan
18 28
7
1
20
11 anhui
6
Nationwide Distribution Network in PRC (as of 30 Nov 2011)
32

• New Concept Store (NCS) – Upgrade from existing: Over 100 NCS
– Cumulatively over 250 NCS by end of 2011
– Continue NCS expansion in Carrefour Shopping Mall
• Net Store increase: 100
• Enhance new franchisee recruiting program
• Further enhance technical and retail management training program on NCS
33
Retail Outlook

Marketing Strategy
34

• 2011 Most Valuable Franchise Network (最值得加盟美容连锁网络) by China Beauty Expo
• 2011 Excellent Total Solution Beauty Centre (优质全方位美容美体中心) by PC Lady.com (leading female website)
• 2011 Top Ten Best Entrepreneur Investment (十大最具吸引力创业投资项目) by BJ International Franchisee Expo
• 2011 Most Valuable Franchise Network (最值得加盟美容连锁网络) by National Franchisee Expo
• 2011 National Reliable Brand for Consumer & Gold Medal of Chinese Quality Brands (全国消费者信得过单位 & 中国名优品牌金奖) by 中国诚信企业合作促进会
• 2010 Most Healthy Total Solution Beauty Centre (最健康全方位美容美体中心) by Trends Health magazine
• 2007 Honor and 2006 Silver Winner of the World’s Best Annual Report by International ARC Awards, New York
• 2007 Best Asia Brand Innovation award
• 2007 Best Asia Brand Innovative Figure award
• 2006 and 2005 Outstanding Enterprise in Hong Kong
• 2006 Bronze Winner of Asia Marketing and Promotion Award
• 2006 Bronze Winner of Best Asia B2B Events Award
• 2006 Best Asia Interactive Media Application Award
• 2005 Top 10 most influential beauty brands in China
• 2005 Top 10 most influential beauty franchised salons in China
• 2005 Golin Awards in Corporate Branding / Reputation Management
• 2005 Best Franchisee Network in China (with the highest consumer recognition rate of 49.7% by 2005 China Beauty Economy Annual Report)
• 2005 London International Advertising Award
• 2005 New York Global Longshi Advertising Award
• 2005 6 Honors for Corporate Identity Design by Hong Kong Designer Award
• 2005 8 Honors by Asia Times Advertising Creative Award
• 2005 Asia Pacific Interior Design Award for Central SPA
Renowned Brand
35

Anmi Series RMB100~325
Herbal Yabai Series RMB100~440
Counter Channel
NB-1 SCT Series RMB500~5888
NB-1 Yam Series RMB500~1000
Bio-Tech Series RMB200~400
Herbal Series RMB100~300
Essence Oils RMB230~1300
NB-1 Supplements RMB500~1150
Health Supplements RMB150~500
Franchisee Channel
Professional Spa & Beauty Products
36

Aroma Hair-loss Preventive Scalp Treatment RMB190
Aroma Bust Treatment & Firming Wrap RMB400
Digestion Enhancing Treatment RMB190
Aroma PMS Treatment RMB190
Aroma Body Sculpturing & Firming Treatment RMB400~450
Ultra Lympho Slim Up Treatment [Waist/ Stomach/ Pregnant lines / Thigh/ Buttock/ Shoulder] RMB990
Aroma Oriental Massage/ Energetic Lymphomassage RMB550
Yin & Yang Jade Massage Therapy RMB190
Facial Treatment [NB-1/ Natural Hormone/ Bio-tech / Han Herbal Whitening / Professional ] RMB280~590
Aroma Lympho Lift-up Therapy [Whitening/ Balancing/ Refining/ Brightening/ Rejuvenating/ Dark Circle/ Firming] RMB190
Aroma Pores & Dark Spot Back Treatment RMB400
Aroma Firming Neck Treatment RMB190
Aroma Muscle-relieving
Shoulder Massage RMB190
Whitening Ocean Wrap
[Arm/Full Body] RMB390
Body Herbal Scrub RMB390
Unique Professional Products for Head-to-toe Spa Programs
37

High end department store brands:
SKII (0.6%), Lancome (2.3%), Shisedo (1.7%), Estee Lauder (1.9%),
Mass hypermarket brands:
Olay (10.2%), L’Oreal (4.8%), Vichy (2.1%) ;
Ponds - Unilever (1.8%), Nivea (1.2%) Garnier Mini Nurse (1.1%)
Direct selling:
Mary Kay (6.1%) , Artistry - Amway (5.2%), Avon (2.6%)
Cosmetic drugstores:
Aupres (4.8%), Dabao (1.1%)
Source: Euromonitor Report June 2011
Retail Competition (Market shares 2010):
38

26
10
6
3
6
3
3
2
3
3
0
2
2
1
6
Olay
L’Oreal Paris
Avon
Dabao
Tjoy
Lancome
Ponds
Estee Lauder
Shiseido
Aupres
Nivea
Johnsons Baby
Mary Kay
Artistry
Natural Beauty
Top of Mind
All Respondents (Radom) n (Wtd) = 2423 n = 2421
15
22
16
13
16
18
13
6
8
7
3
21
23
36
58
Unaided Awareness
71
70
68
65
59
57
49
48
47
46
45
35
33
28
89
Total Awareness
Brand Awareness – Top 15 brands in China
39

Note: 以上列出品牌为目前使用前15位的品牌, 并根据总体认知排序
19
19
7
5
3
2
2
3
5
3
1
0
1
0
12
35
22
25
25
33
21
9
9
5
10
1
29
43
48
58
84
84
82
81
70
67
67
65
58
51
44
40
39
35
87
Top of Mind
Unaided Awareness Total Awareness
Lancôme
Estee Lauder
L’Oreal Paris
Olay
Shiseido
Aupres
Guerlain
Avene
Arden
Chlitina
Clinique
Chanel
Christine Dior
Biotherm
Natural beauty
Brand Awareness – Top 15 brands in Premium Users
40

- New brand positioning kicked off in Mar 2011: Qi 细养之美
brand imagery building for new consumer and franchisee recruitment A unique brand positioning to promote spa channel and NB product portfolios in an integrated manner
- New Key Visuals by portfolio and by function to build power brands
- New packaging design to be kicked off in Q4 2011
Winning concept for NB-1, Bio-Tech and Herbal for both NB and non-NB users in Focus Group conducted in July
- New POP and in-store merchandising in Q4 2011
New Communications Programs
41
2011 Strategic Imperatives Building Blocks and 1H Achievements

- New Product Launch
Skin Care: 8 SKUs in Q3 Supplements: 1 SKUs in Q3 Essence Oils: 3 SKUs in Q4
- PR and Promotion
Mega launch of Yam NPD and NB-1 re-promote in Q3 Key account programs target at >1M franchisees in Q3
- Brand Revamp Program
New packaging launch target in Q4 Test market for new TVC and franchisee recruitment ad target in Q4
42

Operations Review
43

Oracle 甲骨文 (Standard Costing 标准成本)
Cognos (BI) 数据分析系统
e-Banking /e-Payment 电子银行
E-flow 电子签呈
e-Payroll 电子人事系统
Microsoft Exchange Server 电子邮件系统
POS/CRM 零售客户管理
Systems Implementation
44

$0
$20
$40
$60
2H2009 1H2010 2H2010 1H2011
$59
$36
$19 $22
Trade Receivables HK$M
$0
$20
$40
$60
$80
$100
2H2009 1H2010 2H2010 1H2011
$89
$64
$47 $39
Inventory HK$M
$0
$5
$10
$15
$20
2H2009 1H2010 2H2010 1H2011
$12
$10
$13
$18
Trade Payables HK$M
$480
$510
$540
$570
$600
2H2009 1H2010 2H2010 1H2011
$559
$532
$576 $577
Cash HK$M
Group Working Capital
45

0
10
20
30
40
50
2H2009 1H2010 2H2010 1H2011
50
43
25
17
Legal Entities (PRC)
2,760
2,184
1,248
928
0
700
1,400
2,100
2,800
3,500
2H2009 1H2010 2H2010 1H2011
SKUs (PRC)
0
5
10
15
20
2H2009 1H2010 2H2010 1H2011
8 8 6
3
Legal Entities (TW)
1,772
1,294
868 744
0
200
400
600
800
1,000
1,200
1,400
1,600
1,800
2,000
2H2009 1H2010 2H2010 1H2011
SKUs (TW)
PRC &TW Legal Entities and SKUs
46

0
100
200
300
400
500
600
700
800
900
1,000
2009 Dec 1H2010 2010Dec 1H2011
262
264, +1%
250, -5% 198,
-21%
232 228, -2%
230, +1% 237,
+3%
289 246, -15% 205,
-17% 169, -18%
210 220, +5% 263,
+20%
235, -11%
Distribution&Admin Production
Counter & SPA Sales, Retailing and Marketing
0
100
200
300
400
500
600
700
800
900
1,000
2009 Dec 1H2010 2010Dec 1H2011
777 770, -1%
782, +2%
686, -12%
198 169, -15%
157, -7%
143, -9%
18 19,+6% 9,-53%
10,+11%
China TW HK&Macau(includes Malaysia)
993 958, -4%
948,-1% 839,-11%
993
958,-4% 948,-1%
839,-11%
Group Headcount
47

Thank you! NB IR website: www.nblife.com/ir
48