Embed Size (px)
Citation preview

Corporate PresentationJanuary 2015

Cautionary statements
2
All monetary amounts in U.S. dollars unless otherwise stated
Total cash costs shown net of by-product sales unless otherwise stated
CAUTIONARY NOTE REGARDING FORWARD-LOOKING STATEMENTSCertain information contained in this presentation, including any information relating to New Gold’s future financial or operating performance are “forward looking”. All statements in this presentation,other than statements of historical fact, which address events or developments that New Gold expects to occur are “forward-looking statements”. Forward-looking statements are statements that arenot historical facts and are generally, but not always, identified by the use of forward-looking terminology such as “plans”, “expects”, “is expected”, “budget”, “scheduled”, “targeted”, “estimates”,“forecasts”, “intends”, “anticipates”, “projects”, “potential”, “believes” or variations of such words and phrases or statements that certain actions, events or results “may”, “could”, “would”, “should”,“might” or “will be taken”, “occur” or “be achieved” or the negative connotation of such terms. Forward-looking statements in this presentation include, among others, statements with respect to:guidance for production, total cash costs and all-in sustaining costs; the results of the Rainy River Feasibility Study, including the expected production and costs; production potential and costs atNew Gold’s other projects planned activities for 2014 and beyond at the company’s projects; the timing of permitting activities and environmental assessment processes; targeted throughput andrecovery increase at New Afton; and targeted timing for completion of the New Afton mill expansion.
All forward-looking statements in this presentation are based on the opinions and estimates of management as of the date such statements are made and are subject to important risk factors anduncertainties, many of which are beyond New Gold’s ability to control or predict. Certain material assumptions regarding our forward-looking statements are discussed in this presentation, NewGold’s MD&As, its Annual Information Form and its Technical Reports filed at www.sedar.com. In addition to, and subject to, such assumptions discussed in more detail elsewhere, the forward-looking statements in this presentation are also subject to the following assumptions: (1) there being no signification disruptions affecting New Gold’s operations; (2) political and legal developmentsin jurisdictions where New Gold operates, or may in the future operate, being consistent with New Gold’s current expectations; (3) the accuracy of New Gold’s current mineral reserve and resourceestimates; (4) the exchange rate between the Canadian dollar, Australian dollar, Mexican peso and U.S. dollar being approximately consistent with current levels; (5) prices for diesel, natural gas,fuel oil, electricity and other key supplies being approximately consistent with current levels; (6) labour and material costs increasing on a basis consistent with New Gold’s current expectations; (7)permitting and arrangements with First Nations and other Aboriginal groups in respect of Rainy River and Blackwater being consistent with New Gold’s current expectations; (8) all environmentalapprovals (including the environmental assessment process for the Blackwater and Rainy River projects), required permits, licenses and authorizations being obtained from the relevantgovernments and other relevant stakeholders within the expected timelines; and (9) the results of the feasibility studies for the Rainy River and Blackwater projects being realized.
Forward-looking statements are necessarily based on estimates and assumptions that are inherently subject to known and unknown risks, uncertainties and other factors that may cause actualresults, level of activity, performance or achievements to be materially different from those expressed or implied by such forward-looking statements. Such factors include, without limitation:significant capital requirements and the availability and management of capital resources; price volatility in the spot and forward markets for commodities; fluctuations in the international currencymarkets and in the rates of exchange of the currencies of Canada, the United States, Australia, Mexico and Chile; discrepancies between actual and estimated production, between actual andestimated reserves and resources and between actual and estimated metallurgical recoveries; changes in national and local government legislation in Canada, the United States, Australia, Mexicoand Chile or any other country in which New Gold currently or may in the future carry on business; taxation; controls, regulations and political or economic developments in the countries in whichNew Gold does or may carry on business; the speculative nature of mineral exploration and development, including the risks of obtaining and maintaining the validity and enforceability of thenecessary licenses and permits and complying with the permitting requirements of each jurisdiction in which New Gold operates, including, but not limited to: in Canada, obtaining the necessarypermits for the Blackwater and Rainy River projects; in Mexico, where Cerro San Pedro has a history of ongoing legal challenges related to our environmental authorization (EIS); and in Chile,where certain activities at El Morro have been delayed due to litigation relating to its environmental permit; the lack of certainty with respect to foreign legal systems, which may not be immune fromthe influence of political pressure, corruption or other factors that are inconsistent with the rule of law; the uncertainties inherent to current and future legal challenges New Gold is or may become aparty to; diminishing quantities or grades of reserves and resources; competition; loss of key employees; additional funding requirements; rising costs of labour, supplies, fuel and equipment; actualresults of current exploration or reclamation activities; uncertainties inherent to mining economic studies including the feasibility studies for Rainy River and Blackwater; the uncertainty with respectto prevailing market conditions necessary for a positive development or construction decision at each of Blackwater and Rainy River; changes in project parameters as plans continue to be refined;accidents; labour disputes; defective title to mineral claims or property or contests over claims to mineral properties; unexpected delays and costs inherent to consulting and accommodating rights ofFirst Nations and other Aboriginal groups; uncertainties with respect to obtaining all necessary surface and other land use rights or tenure for Rainy River; risks, uncertainties and unanticipateddelays associated with obtaining and maintaining necessary licenses, permits and authorizations and complying with permitting requirements, including those associated with the environmentalassessment processes for Blackwater and Rainy River. In addition, there are risks and hazards associated with the business of mineral exploration, development and mining, includingenvironmental events and hazards, industrial accidents, unusual or unexpected formations, pressures, cave-ins, flooding and gold bullion losses (and the risk of inadequate insurance or inability toobtain insurance to cover these risks) as well as “Risk Factors” included in New Gold’s disclosure documents filed on and available at www.sedar.com.
Forward-looking statements are not guarantees of future performance, and actual results and future events could materially differ from those anticipated in such statements. All of the forward-looking statements contained in this presentation are qualified by these cautionary statements. New Gold expressly disclaims any intention or obligation to update or revise any forward-lookingstatements whether as a result of new information, events or otherwise, except in accordance with applicable securities laws.
The footnotes and endnotes to this presentation contain important information. The endnotes are found at the end of the presentation.

Portfolio of assetsin top-ratedjurisdictions
Invested and experienced team
Amonglowest-cost producers with established track record
Peer-leading growth pipeline
A history of value creation
New Gold investment thesis
3
18.5 Moz gold
reserves(1)
~$90 million
investment by
Board &
Management
All-in sustaining
costs(2) of $754/oz
through first nine
months of 2014
~900 Koz annual
production
potential from
growth projects(3)
+175% increase
in share price
since March 2009
1. For a detailed breakdown of Mineral Resources and Reserves by category, refer to New Gold’s Annual Information Form for the financial year ended December 31, 2013 dated March 28, 2014.
Refer to Endnotes under the heading “Cautionary note to U.S. readers concerning estimates of Mineral Reserves and Mineral Resources” and “Technical Information”.
2. Refer to Endnote on all-in sustaining costs under the heading “Non-GAAP Measures”.
3. Based on ~325Koz annual production from Rainy River, ~485Koz annual production from Blackwater and ~90Koz annual production from El Morro, as outlined in the feasibility studies for the projects.
1. For a detailed breakdown of Mineral Resources and Reserves by category, refer to New Gold’s Annual Information Form for the financial year ended December 31, 2013 dated March 28, 2014. Refer to Endnotes under the heading “Cautionary note to
U.S. readers concerning estimates of Mineral Reserves and Mineral Resources” and “Technical Information”.
2. Refer to Endnote on all-in sustaining costs under the heading “Non-GAAP Measures”.
3. Based on ~325Koz annual production from Rainy River, ~485Koz annual production from Blackwater and ~90Koz annual production from El Morro, as outlined in the feasibility studies for the projects.
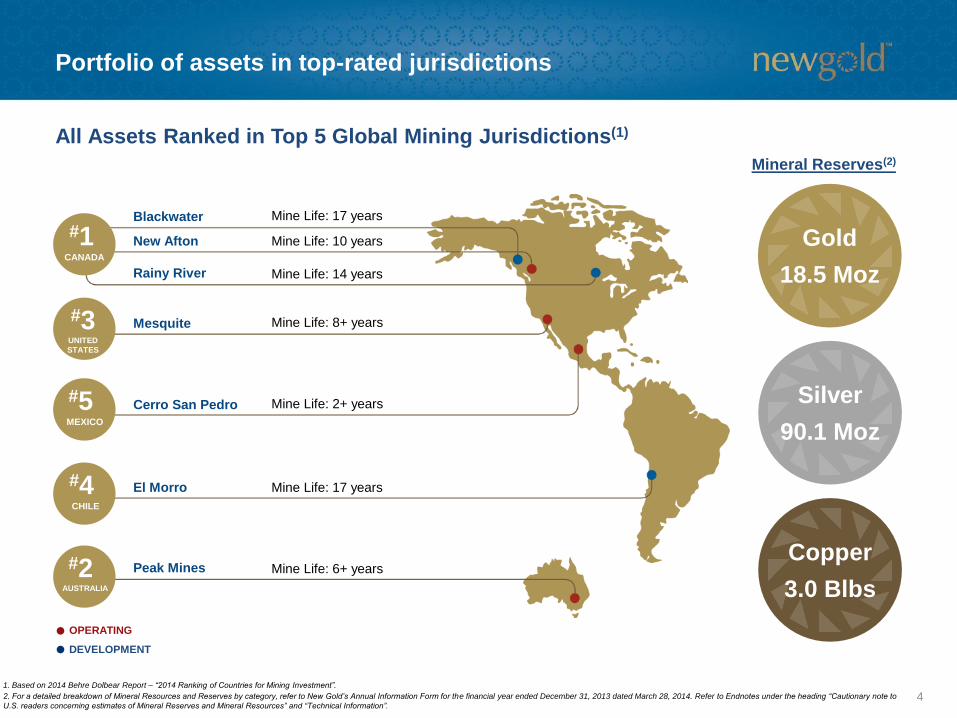
Portfolio of assets in top-rated jurisdictions
Blackwater
New Afton
Rainy River
Mesquite
Cerro San Pedro
El Morro
Peak Mines
Mine Life: 17 years
Mine Life: 10 years
Mine Life: 14 years
Mine Life: 8+ years
Mine Life: 2+ years
Mine Life: 17 years
Mine Life: 6+ years
#1CANADA
#3UNITED
STATES
#5MEXICO
#4CHILE
#2AUSTRALIA
OPERATING
DEVELOPMENT
4
All Assets Ranked in Top 5 Global Mining Jurisdictions(1)
1. Based on 2014 Behre Dolbear Report – “2014 Ranking of Countries for Mining Investment”.
2. For a detailed breakdown of Mineral Resources and Reserves by category, refer to New Gold’s Annual Information Form for the financial year ended December 31, 2013 dated March 28, 2014. Refer to Endnotes under the heading “Cautionary note to
U.S. readers concerning estimates of Mineral Reserves and Mineral Resources” and “Technical Information”.
Gold
18.5 Moz
Silver
90.1 Moz
Copper
3.0 Blbs
Mineral Reserves(2)

Experienced and invested team
5
BOARD OF DIRECTORS
David Emerson
Former Canadian Cabinet Minister
James Estey
Chairman, PrairieSky Royalty
Robert Gallagher
President & Chief Executive Officer
Vahan Kololian
Founder, TerraNova Partners
Martyn KonigFormer Executive Chairman, European Goldfields
Pierre Lassonde
Chairman, Franco-Nevada
Randall OliphantExecutive Chairman
Raymond Threlkeld
Chairman, Newmarket Gold
EXECUTIVE MANAGEMENT TEAM
Randall OliphantExecutive Chairman
Robert Gallagher
President & Chief Executive Officer
Brian Penny
Executive Vice President & Chief Financial Officer
David Schummer
Executive Vice President & Chief Operating Officer
Approximately 1 million shares purchased by insiders in 2014
~$90 millionCollectively invested in New Gold
Low cost producer
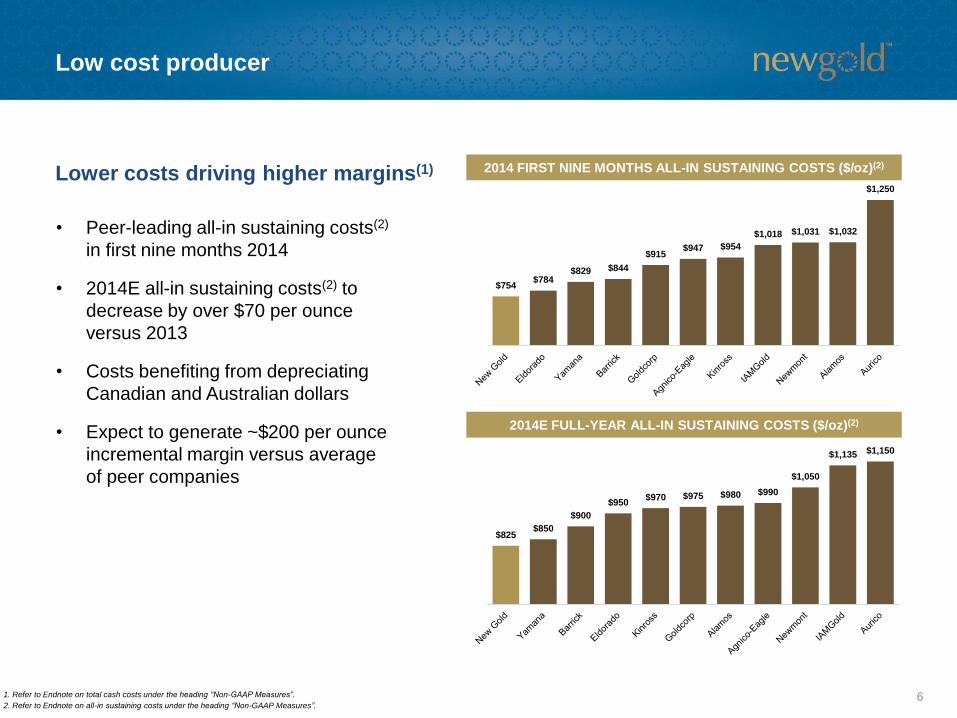
• Peer-leading all-in sustaining costs(2)
in first nine months 2014
• 2014E all-in sustaining costs(2) to
decrease by over $70 per ounce
versus 2013
• Costs benefiting from depreciating
Canadian and Australian dollars
• Expect to generate ~$200 per ounce
incremental margin versus average
of peer companies
6
Lower costs driving higher margins(1)
1. Refer to Endnote on total cash costs under the heading “Non-GAAP Measures”.
2. Refer to Endnote on all-in sustaining costs under the heading “Non-GAAP Measures”.
2014 FIRST NINE MONTHS ALL-IN SUSTAINING COSTS ($/oz)(2)
2014E FULL-YEAR ALL-IN SUSTAINING COSTS ($/oz)(2)
$754$784
$829 $844
$915$947 $954
$1,018 $1,031 $1,032
$1,250
$825$850
$900
$950$970 $975 $980 $990
$1,050
$1,135 $1,150
7
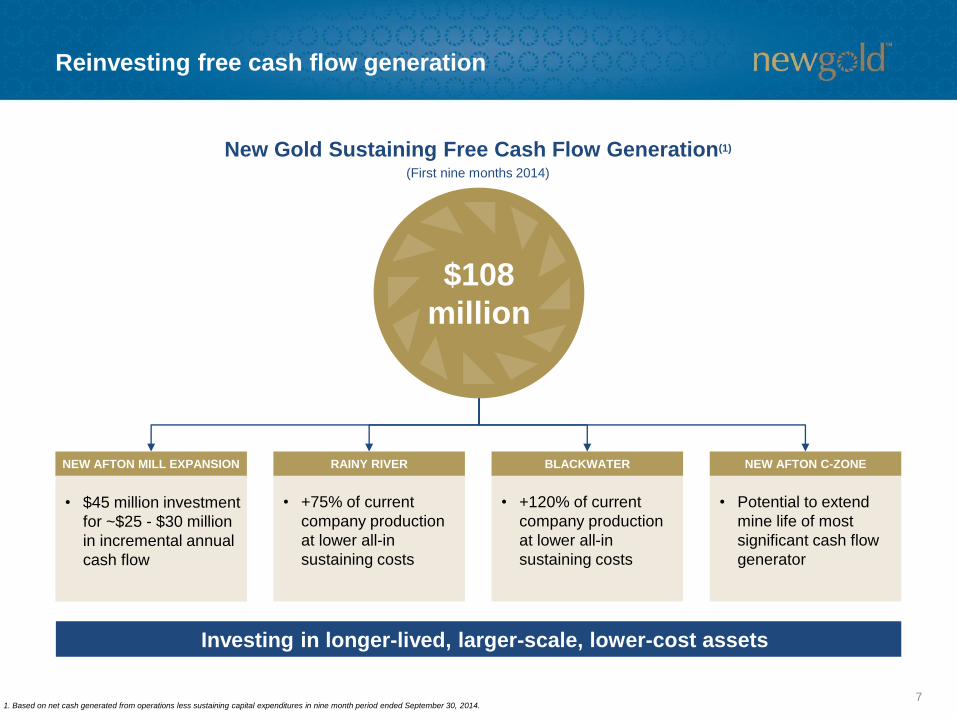
Reinvesting free cash flow generation
1. Based on net cash generated from operations less sustaining capital expenditures in nine month period ended September 30, 2014.
$108
million
New Gold Sustaining Free Cash Flow Generation(1)
(First nine months 2014)
• $45 million investment
for ~$25 - $30 million
in incremental annual
cash flow
NEW AFTON MILL EXPANSION
• +75% of current
company production
at lower all-in
sustaining costs
RAINY RIVER
• +120% of current
company production
at lower all-in
sustaining costs
BLACKWATER
• Potential to extend
mine life of most
significant cash flow
generator
NEW AFTON C-ZONE
Investing in longer-lived, larger-scale, lower-cost assets

8
New Afton – Unlocking options
87
102-112
Gold
(Koz)
72
78-84
Copper
(Mlbs)
2013 2014E
2013 2014E
+23%
+13%
• C-zone provides potential
to extend mine life
• Resource updated in
July 2014
• 4 drills actively exploring
C-zone M&I Resource(4)
35 Million Tonnes
First Nine Months 2014
Operating Margin(1)
$45 million
~12% increase in throughput
~2-3% increase in gold and
copper recoveries
+10 Koz per year gold(2)
+10 Mlbs per year copper(2)
1. Operating margin calculated as revenue less operating expenses. Through September 30, 2014.
2. Based on targeted increases in throughput and recovery and year-end 2013 gold and copper reserve grade.
3. Based on $1,300 per ounce gold and $3.25 per pound copper.
4. Mineral Resources are inclusive of Reserves. For detailed assumptions, risks and parameters relating to the above refer to New Gold’s Annual Information Form dated March 28, 2014. Refer also to Endnotes under the heading “Cautionary note to U.S.
readers concerning estimates of Mineral Reserves and Mineral Resources” and “Technical Information” and New Gold’s New Afton C-zone resource news release dated July 7, 2014 available at www.sedar.com.
Production Outperforming 2009
Technical Report Estimates
Mill Expansion Capital
CURRENT
PERFORMANCE
NEAR-TERM
GROWTH
FUTURE
POTENTIAL
• Mid-2015: Mill expansion
to be completed
Potential to increase annual
cash flow by ~$25-$30 million(3)$194 million
GOLD 0.77 g/t 0.9Moz
COPPER 0.87% 0.7Blbs
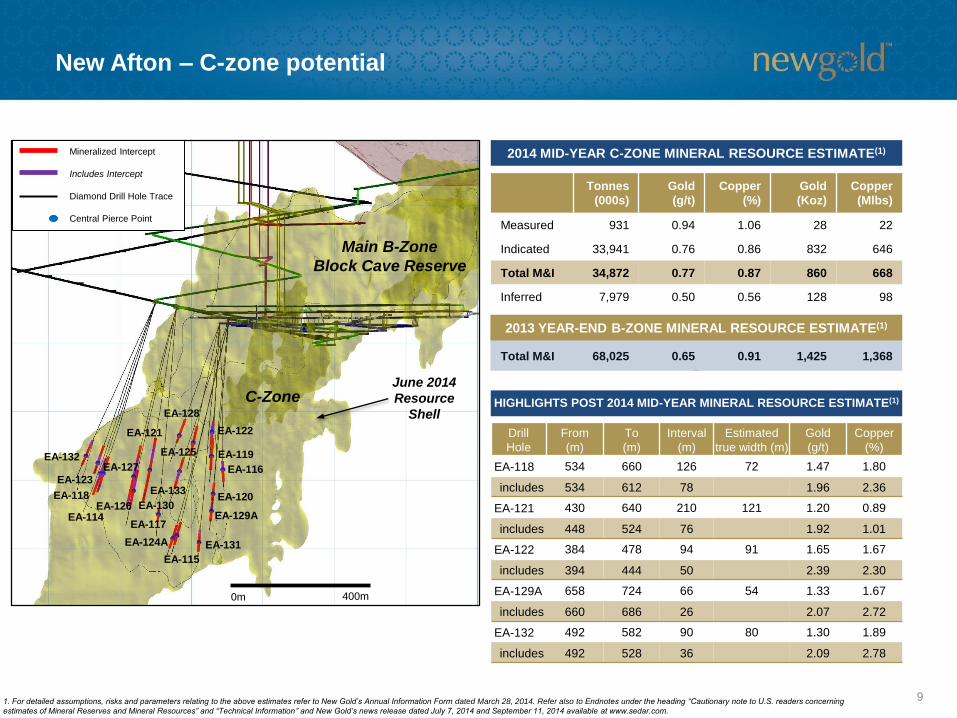
New Afton – C-zone potential
9
Tonnes
(000s)
Gold
(g/t)
Copper
(%)
Gold
(Koz)
Copper
(Mlbs)
Measured 931 0.94 1.06 28 22
Indicated 33,941 0.76 0.86 832 646
Total M&I 34,872 0.77 0.87 860 668
Inferred 7,979 0.50 0.56 128 98
Total M&I 68,025 0.65 0.91 1,425 1,368
2014 MID-YEAR C-ZONE MINERAL RESOURCE ESTIMATE(1)
1. For detailed assumptions, risks and parameters relating to the above estimates refer to New Gold’s Annual Information Form dated March 28, 2014. Refer also to Endnotes under the heading “Cautionary note to U.S. readers concerning
estimates of Mineral Reserves and Mineral Resources” and “Technical Information” and New Gold’s news release dated July 7, 2014 and September 11, 2014 available at www.sedar.com.
2013 YEAR-END B-ZONE MINERAL RESOURCE ESTIMATE(1)
Drill
Hole
From
(m)
To
(m)
Interval
(m)
Estimated
true width (m)
Gold
(g/t)
Copper
(%)
EA-118 534 660 126 72 1.47 1.80
includes 534 612 78 1.96 2.36
EA-121 430 640 210 121 1.20 0.89
includes 448 524 76 1.92 1.01
EA-122 384 478 94 91 1.65 1.67
includes 394 444 50 2.39 2.30
EA-129A 658 724 66 54 1.33 1.67
includes 660 686 26 2.07 2.72
EA-132 492 582 90 80 1.30 1.89
includes 492 528 36 2.09 2.78
HIGHLIGHTS POST 2014 MID-YEAR MINERAL RESOURCE ESTIMATE(1)
Mineralized Intercept
Includes Intercept
Diamond Drill Hole Trace
Central Pierce Point
EA-132
EA-123
EA-114
EA-118
EA-127
EA-121
EA-126
EA-128
EA-133
EA-125
EA-124A EA-131
EA-115
EA-129A
EA-120
EA-116
EA-122
EA-119
EA-117
C-Zone
Main B-Zone
Block Cave Reserve
June 2014
Resource
Shell
0m 400m
EA-130

10
Rainy River – Project overview
1. Mineral Resources are inclusive of Reserves. For a detailed breakdown of Mineral Resources and Reserves by category, refer to New Gold’s Annual Information Form for the financial year ended December 31, 2013 dated March 28, 2014. Refer to
Endnotes under the heading “Cautionary note to U.S. readers concerning estimates of Mineral Reserves and Mineral Resources” and “Techn ical Information”.
FIRST FIVE YEARS – GRADE AND PRODUCTION
JURISDICTION MANAGEABLE CAPITAL RESOURCE SCALE AND POTENTIAL
Ontario, Canada
17km tie-in to power/
close to regional
infrastructure
• $885 million at $0.95
US$/C$ exchange rate
• ~70% of capital
denominated in Canadian
dollars
• $0.05 change in exchange
rate ~$141 million in pre-tax
NAV
Reserves(1) +3.8 Moz
M&I Resources(1) +6.2 Moz
Land Package +190 km2
Average Mill Head Grade (g/t)
Underground
Grade (g/t)
Open Pit
Grade (g/t)
200
250
300
350
Open Pit Underground
1.4 1.5 1.5 1.4 1.4
Th
ou
san
d o
un
ces
1.4
--
1.5
4.7
1.4
4.5
1.3
5.1
1.1
5.5

11
Rainy River – Near-term focus
• Advancing permitting – both
Provincial and Federal comment
periods completed in fourth quarter
2014
• Permits expected early 2015
• Completing detail engineering and
mine planning
• January 2nd – closed acquisition of
Bayfield Ventures
12
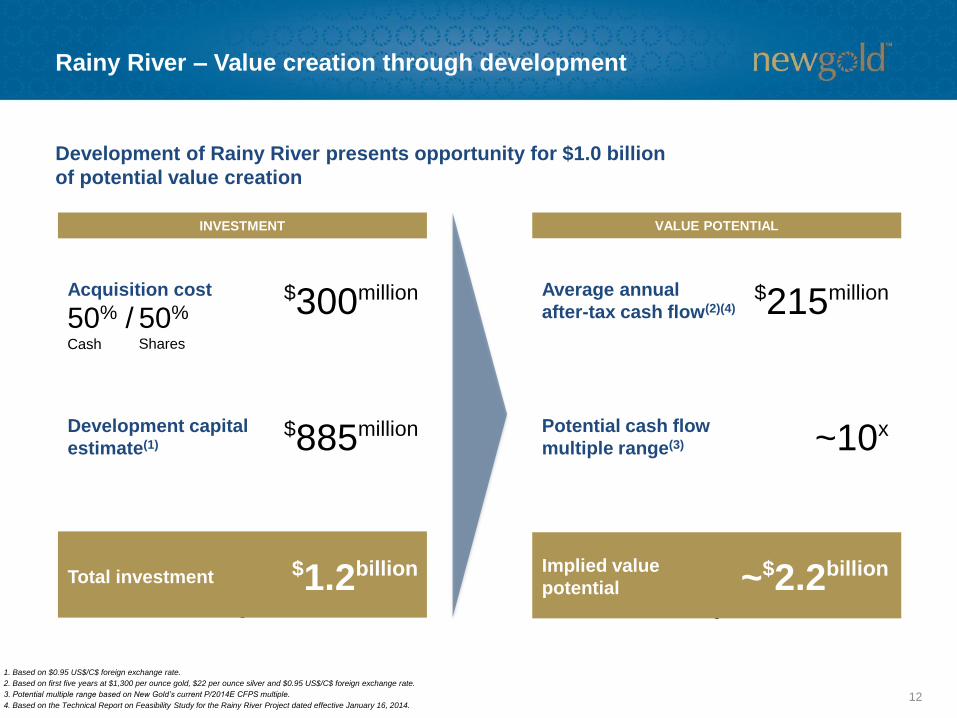
Rainy River – Value creation through development
INVESTMENT VALUE POTENTIAL
$300millionAcquisition cost
50% /Cash
50%
Shares
$885millionDevelopment capital
estimate(1)
$1.2billionTotal investment
Average annual
after-tax cash flow(2)(4)
Potential cash flow
multiple range(3)
Implied value
potential
$215million
~10x
Development of Rainy River presents opportunity for $1.0 billion
of potential value creation
~$2.2billion
1. Based on $0.95 US$/C$ foreign exchange rate.
2. Based on first five years at $1,300 per ounce gold, $22 per ounce silver and $0.95 US$/C$ foreign exchange rate.
3. Potential multiple range based on New Gold’s current P/2014E CFPS multiple.
4. Based on the Technical Report on Feasibility Study for the Rainy River Project dated effective January 16, 2014.

Blackwater
13
UPSIDEGOLD RESOURCE
British Columbia,
Canada
BLACKWATER
Regional UpsideSignificant Gold Resource
Jurisdiction
#1Country
Ranking(1)
~1,100 km2
Land Package
Initial resource at
Capoose
Multiple newly
identified targets
1. Based on 2014 Behre Dolbear Report – “2014 Ranking of Countries for Mining Investment”.
2. Development capital assumes $0.95 USD/CDN exchange rate.
3. Refer to Endnote on total cash costs under the heading “Non-GAAP Measures”. Total cash costs assume: Gold - $1,300/oz, Silver - $22.00/oz, USD/CDN - $0.95.
4. Refer to Endnote on all-in sustaining costs under the heading “Non-GAAP Measures”. All-in sustaining costs assume: Gold - $1,300/oz, Silver - $22.00/oz, USD/CDN - $0.95.
5. Mineral Resources are inclusive of Reserves. For a detailed breakdown of Mineral Resources and Reserves by category, refer to New Gold’s Annual Information Form for the financial year ended December 31, 2013 dated March 28, 2014. Refer to
Endnotes under the heading “Cautionary note to U.S. readers concerning estimates of Mineral Reserves and Mineral Resources” and “Technical Information”.
2013 Feasibility StudyFirst nine years:
485 KozAnnual Production
~$1,865 millionDevelopment Capital(2)
$555/ozTotal Cash Costs(3)
$685/ozAll-in Sustaining
Costs(4)
$0.05 change in exchange rate
~$270 million in pre-tax NAV
8.2 MozReserves(5)
17-yearMine Life
9.5 Moz M&I Resources(5)

El Morro
14
Chile
EL MORRO
Unique Joint Venture
Structure
Gold/Copper Reserve &
Resources (30%)
Jurisdiction 2011 Feasibility Study (30%)
#4Country
Ranking(1)
Goldcorp 70% partner
Funds 100% of capital
New Gold retains portion of
cash flow from mine start-up
2.7 Moz @ 0.5 g/t Gold
2.0 Blbs @ 0.5%Copper
Life of mine:
1. Based on 2014 Behre Dolbear Report – “2014 Ranking of Countries for Mining Investment”.
2. Refer to Endnote on total cash costs under the heading “Non-GAAP Measures”. Total cash costs assume: Gold - $1,200/oz, Copper - $2.75/lb, Chilean Peso/USD - $550.
3. For a detailed breakdown of Mineral Resources and Reserves by category, refer to New Gold’s Annual Information Form for the f inancial year ended December 31, 2013 dated March 28, 2014. Refer to Endnotes under the heading “Cautionary note to
U.S. readers concerning estimates of Mineral Reserves and Mineral Resources” and “Technical Information”.
Reserves(3) –
Open Pit
Inferred Resources(3) –
Potential Block Cave
1.1 Moz @ 1.0 g/t Gold
0.6 Blbs @ 0.8%Copper
85 MlbsAnnual Copper Production
($700/oz)Total Cash Costs(2)
90 KozAnnual Gold Production

Multiple growth initiatives
Construction
• New Afton mill expansion –
increased throughput and
recoveries
Permitting
• Rainy River – 325 Koz at all-in
sustaining costs of $736 per
ounce(1)
• Blackwater – 485 Koz at all-in
sustaining costs of $685 per
ounce(1)
Engineering/Planning
• 30% carried interest in El Morro
Rainy River
El Morro
15
2014E Gold
Production
Blackwater
New Afton
Expansion
1. Based on ~325Koz annual production from Rainy River (first nine years), ~485Koz annual production from Blackwater and ~90Koz annual production from El Morro as outlined in the feasibility studies for the projects. Refer to Endnote on all-in
sustaining costs under the heading “Non-GAAP Measures”. All-in sustaining costs assume: Gold - $1,300/oz, Silver - $22.00/oz, USD/CDN - $0.95.
380 – 420 Koz
New Gold has multiple organic growth options in its portfolio

Catalysts
16
2014 costs declining versus 2013
New Afton production and cash flow continues to increase
New Afton C-zone exploration
Rainy River regional exploration
Blackwater regional exploration
Rainy River permitting
C-zone engineering study
New Afton mill expansion
Blackwater permitting
Cash flow growth

A history of value creation
Performance since March 2009
New Gold/Western Goldfields
merger announcement
17
S&P/TSX Global
Gold Index(1)
Gold
Price
New Gold (NYSE)
1. S&P/TSX Global Gold Index includes 37 gold companies in various stages of development/production.
178%
32%
(40%)
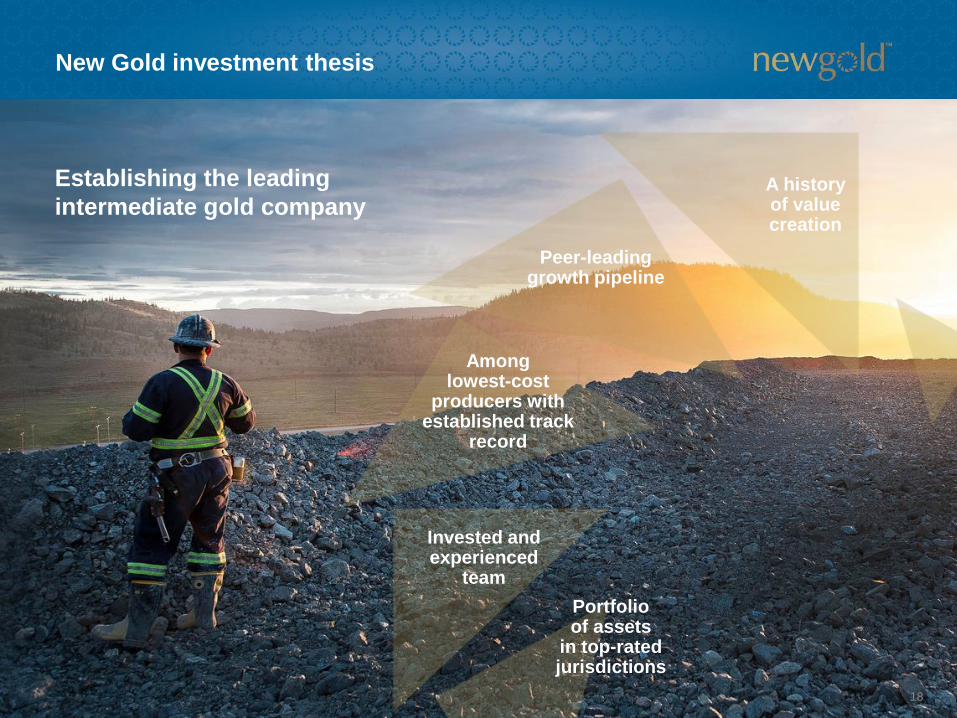
New Gold investment thesis
18
A history of value creation
Peer-leading growth pipeline
Amonglowest-cost
producers with established track
record
Invested and experienced
team
Portfolio of assets
in top-ratedjurisdictions
Establishing the leading
intermediate gold company

Appendices
19
Appendices
Page
1. Financial information 20
2. Consolidated operating performance 25
3. New Afton 32
4. Mesquite, Peak Mines, Cerro San Pedro 40
5. Rainy River 43
6. Blackwater 46
7. El Morro 47
8. Exploration 50
9. Reserves and Resources notes 54
10. Commodity price/foreign exchange assumptions 63

$416 mm
$257 mm
Liquidity
Position$673 mm
Cash and
Equivalents(1)
Undrawn Credit
Facility(2)
Strong balance sheet
20
1. Cash and equivalents as at September 30, 2014.
2. $43 million of total $300 million at September 30, 2014 used for Letters of Credit.
3. See Appendix 1 – Summary of debt for detailed breakdown of components of debt.
• Face value $887 million in
long-term debt(3)
• Face value $300 million,
7.00% notes due in 2020
• Face value $500 million,
6.25% notes due in 2022
• $87 million in carried El Morro
loan, payable out of El Morro
project cash flow
Appendix 1
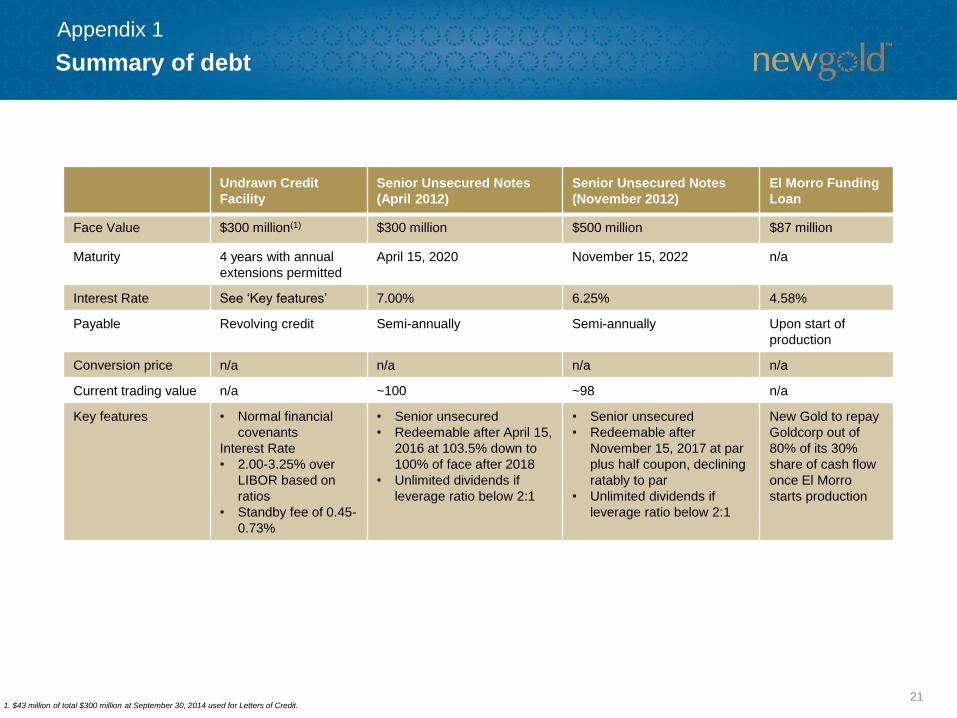
Summary of debt
21
Undrawn Credit
Facility
Senior Unsecured Notes
(April 2012)
Senior Unsecured Notes
(November 2012)
El Morro Funding
Loan
Face Value $300 million(1) $300 million $500 million $87 million
Maturity 4 years with annual
extensions permitted
April 15, 2020 November 15, 2022 n/a
Interest Rate See ‘Key features’ 7.00% 6.25% 4.58%
Payable Revolving credit Semi-annually Semi-annually Upon start of
production
Conversion price n/a n/a n/a n/a
Current trading value n/a ~100 ~98 n/a
Key features • Normal financial
covenants
Interest Rate
• 2.00-3.25% over
LIBOR based on
ratios
• Standby fee of 0.45-
0.73%
• Senior unsecured
• Redeemable after April 15,
2016 at 103.5% down to
100% of face after 2018
• Unlimited dividends if
leverage ratio below 2:1
• Senior unsecured
• Redeemable after
November 15, 2017 at par
plus half coupon, declining
ratably to par
• Unlimited dividends if
leverage ratio below 2:1
New Gold to repay
Goldcorp out of
80% of its 30%
share of cash flow
once El Morro
starts production
1. $43 million of total $300 million at September 30, 2014 used for Letters of Credit.
Appendix 1

22
2014 capital expenditures by category
New
Afton
~$290
million
Sustaining Capital: ~$145 million Growth Capital: ~$145 million
Mesquite
Peak
Mines
Cerro San
Pedro
Rainy
River
New Afton
Cerro San
Pedro
Blackwater
Total Capital
Appendix 1
First nine months 2014 - $91 million First nine months 2014 - $97 million

23
Growth capital
• Set out below is a breakdown of expected 2014 capital expenditures at each site divided into two
categories – sustaining capital and growth capital (future production growth and mine life extension)
New Afton - $100 million
Rainy River - $90 million
Mesquite - $40 million
Sustaining capital
48%52%
100%
100%
• $60 million – ~2,500 metre development, two new trucks, dam raise and
surface ventilation upgrade
• $20 million – mill expansion
• $20 million – C-zone scoping level engineering and capitalized exploration
• $50 million – property, plant and equipment
• $30 million – detailed engineering, studies, environmental monitoring and
permitting
• $10 million – capitalized exploration
• $28 million – four new trucks and leach pad expansion
• $12 million – major components/building and tank construction
2014 capital expenditures by category
Appendix 1

24
Peak Mines - $40 million
Cerro San Pedro - $28 million
100%
71%
• $20 million – two haul trucks and site maintenance
• $20 million – capitalized development and capitalized exploration
• $20 million – capitalized stripping
• $8 million – leach pad expansion
2014 capital expenditures by category
Growth capital Sustaining capital
New Gold’s 30% share of estimated 2014 El Morro capital costs of
$6 million fully carried by Goldcorp Inc.
Blackwater - $15 million
100%• $10 million – permitting
• $5 million – engineering studies
• Offset by $20 million exploration tax credit
29%
Appendix 1

2014 third quarter highlights
25
$848per oz
All-in sustaining costs(1)
Production Costs
$311per oz
Total cash costs(2)
Financial
Cash and Equivalents Rainy River Corporate
$416million
Cash balance at September 30, 2014
1. Refer to Endnote on all-in sustaining costs under the heading “Non-GAAP Measures”.
2. Refer to Endnote on total cash costs under the heading “Non-GAAP Measures”.
3. Refer to Endnote on adjusted net cash generated from operations before changes in working capital under the heading “Non-GAAP Measures”.
Positive Provincial and
Federal Environmental
Assessment reports
released
Further strengthened
management team –
David Schummer, Chief
Operating Officer
93,367oz - Gold
25.6mlbs - Copper $58million
Net cash generated from operations
$79million
Net cash generated from operations
before changes in working capital(3)
Appendix 2

New Afton 26 (1,245) (700) 79 (1,264) (680)
Mesquite 26 951 1,625 70 937 1,354
Peak Mines 28 568 873 77 641 955
Cerro San Pedro 13 1,604 1,701 47 1,185 1,317
93 311 848 274 272 754
Margin per ounce(4) 925 388 1,011 529
New Afton co-product costs(1)
Gold ($/oz) 383 560 413 612
Copper ($/lb) 1.04 1.51 0.99 1.47
Mine-by-mine operating results
26
1. Refer to Endnote on total cash costs under the heading “Non-GAAP Measures”.
2. Refer to Endnote on all-in sustaining costs under the heading “Non-GAAP Measures”.
3. Nine months ended September 30, 2014.
4. Based on third quarter average realized gold price of $1,236 per ounce and first nine months 2014 average realized gold pr ice of $1,283 per ounce.
2014 THIRD QUARTER
Gold production
(000s ounces)
Cash costs(1)
($/oz)
All-in Sustaining
costs(2) ($/oz)
2014 YEAR-TO-DATE(3)
Gold production
(000s ounces)
Cash costs(1)
($/oz)
All-in Sustaining
costs(2) ($/oz)
Co-product
cash costs(1)
Co-product all-in
sustaining costs(2)
NEW AFTON
2014 THIRD QUARTER
Co-product
cash costs(1)
Co-product all-in
sustaining costs(2)
NEW AFTON
2014 YEAR-TO-DATE(3)
Appendix 2

$465
$418
$446
$421
$377
$320 - $340
$478
$557
$643
$766 $767
27
Among lowest cost producers in industry
Industry
New Gold
2014E
Incremental
Benefit to NGD
Shareholder
2009
(2)
New Gold versus Industry Average Total Cash Costs,(1) Net of By-Product Credits
1. Refer to Endnote on total cash costs under the heading “Non-GAAP Measures”. New Gold total cash costs based on 2014 guidance.
2. Industry data per GFMS reports calculated net of by-product credits for the year ended December 31, 2013.
Appendix 2

28
2013
THIRD QUARTER
2014
THIRD QUARTER
Revenues ($ million) $169 $196 $538 $581
Operating margin(1) ($ million) 75 94 250 268
Adjusted net earnings(2) ($ million) 5 20 32 45
Adjusted net earnings per share(2) ($/share) 0.01 0.04 0.06 0.09
(Loss)/net earnings ($ million) (60) 12 (45) 64
(Loss)/net earnings per share ($/share) (0.12) 0.02 (0.09) 0.13
Adjusted net cash generated from operations before
changes in working capital(3) ($ million)79 68 241 187
Net cash generated from operations ($ million) 58 36 199 72
Average realized gold price ($ per ounce) 1,236 1,359 1,283 1,375
Average realized copper price ($ per pound) 3.11 3.25 3.06 3.24
Average realized silver price ($ per ounce) 19.66 21.15 19.90 24.13
2014 third quarter financial summary
Appendix 2
2013
FIRST NINE MONTHS
2014
FIRST NINE MONTHS
1. Refer to Endnote on operating margin under the heading “Non-GAAP Measures”.
2. Refer to Endnote on adjusted net earnings under the heading “Non-GAAP Measures”.
3. Refer to Endnote on adjusted net cash generated from operations before changes in working capital under the heading “Non-GAAP Measures”.

29
Detailed operating results and assumptions
Appendix 2
2013A 2013A 2013A 2013A
Tonnes processed (000 tonnes) 14,297 13,000 - 13,300 13,463 13,400 - 13,800 814 830 - 850 4,087 4,500 - 4,700
Tonnes mined (000 tonnes) 48,206 56,000 - 58,000 31,018 33,000 - 35,000 1,100 1,300 - 1,320 4,226 4,600 - 4,800
Strip ratio 2.37 3.31 - 3.36 1.30 1.46 - 1.54 -- -- - -- -- -- - --
Gold grade (g/t) 0.37 0.40 - 0.44 0.47 0.35 - 0.40 4.14 3.9 - 4.1 0.78 0.81 - 0.85
Silver grade (g/t) -- -- - -- 20.91 15.0 - 17.0 -- -- - -- -- -- - --
Copper grade (%) -- -- - -- -- -- - -- 0.85% 0.86% - 0.90% 0.93% 0.93% - 0.95%
Gold recovery (%) 63.0% 51.0% 92.9% 91.0% - 93.0% 85.1% 85.0% - 87.0%
Silver recovery (%) -- -- - -- 15.0% -- -- - -- -- -- - --
Copper recovery (%) -- -- - -- -- -- - -- 88.0% 91.0% - 93.0% 85.9% 86.0% - 88.0%
Production
Gold production (Koz) 107.0 113.0 - 123.0 102.8 70.0 - 80.0 100.7 95.0 - 105.0 87.2 102.0 - 112.0
Silver production (Koz) -- -- - -- 1,300.6 1,100.0 - 1,300.0 -- -- - -- -- -- - --
Copper production (Mlbs) -- -- - -- -- -- - -- 13.4 14.0 - 16.0 72.0 78.0 - 84.0
Reserve grade
Gold grade (g/t)
Silver grade (g/t)
Copper grade (%)
3.52
7.1
1.22%
0.56
2.2
0.84%
0.60
--
--
0.46
18.1
--
Mesquite
2014E2014E
New AftonCerro San Pedro
2014E
Peak Mines
2014E
~50%
~15%
~65%

30
2014 total cash cost sensitivities
Appendix 2
Category Copper Price Silver Price AUD/USD CDN/USD MXN/USD Diesel
Base Assumption $3.25 $20.00 $1.14 $1.11 $13.00 $3.25
Sensitivity +/- $0.25 +/- $1.00 +/- $0.05 +/- $0.05 +/- $1.00 +/- $0.25
Total Cash Costs(1)
- Impact
New Afton +/-$200 - - +/-$65 - -
Mesquite - - - - - +/-$15
Peak Mines +/-$40 - +/-$50 - - -
Cerro San Pedro - +/-$15 - - +/-$50 -
New Gold Consolidated +/-$60 +/-$5 +/-$15 +/-$15 +/-$10 +/-$5
Total Cash Costs(1)
- Sensitivities
1. Refer to Endnote on total cash costs under the heading “Non-GAAP Measures”.

31
1. Refer to Endnote on total cash costs under the heading “Non-GAAP Measures”.
2. General and administrative includes stock-based compensation and asset retirement obligation.
3. Sustaining capital based on New Gold’s total 2014 estimated capital expenditures excluding expenditures related to growth-related initiatives.
4. Refer to Endnote on all-in sustaining costs under the heading “Non-GAAP Measures”.
2014 estimated all-in sustaining costs
Total cash costs(1) ~$330/oz
General and administrative(2) ~$90/oz
Exploration expense ~$35/oz
Sustaining capital(3) ~$370/oz
ALL-IN SUSTAINING COSTS(4) ~$825/oz
Appendix 2

32
New Afton – 2014 guidance
GOLD PRODUCTION (Koz) COPPER PRODUCTION (Mlbs)
ALL-IN SUSTAINING COSTS(2) ($/oz)TOTAL CASH COSTS(1) ($/oz)
102 – 112 78 – 84
($1,260) –
($1,240)
($620) –
($600)
TOTAL CASH COSTS(1)
$440 –
$460
$1.10 –
$1.20
Co-Product Gold ($/oz) Co-Product Copper ($/lb)
• Copper price - $3.25 per pound
(2013A - $3.23 per pound)
• Canadian dollar: U.S. dollar exchange –
$1.11
• $0.25 per pound change in copper
equals ~$200 per ounce change in New
Afton total cash costs
• $0.01 change in Canadian dollar equals
~$15 per ounce change in New Afton
total cash costs
• Gold and copper production expected to
increase due to:
• Increase in average annual
throughput rate
• Increase in gold grades
• Costs benefit from targeted increase in
copper production, depreciating
Canadian dollar and decrease in
sustaining capital costs
OVERVIEW
KEY ASSUMPTIONS AND SENSITIVITIES
1. Refer to Endnote on total cash costs under the heading “Non-GAAP Measures”.
2. Refer to Endnote on all-in sustaining costs under the heading “Non-GAAP Measures”.
Appendix 3

New Facilities
To Tailings
Surface Stockpile
Mill schematic
33
North
Appendix 3
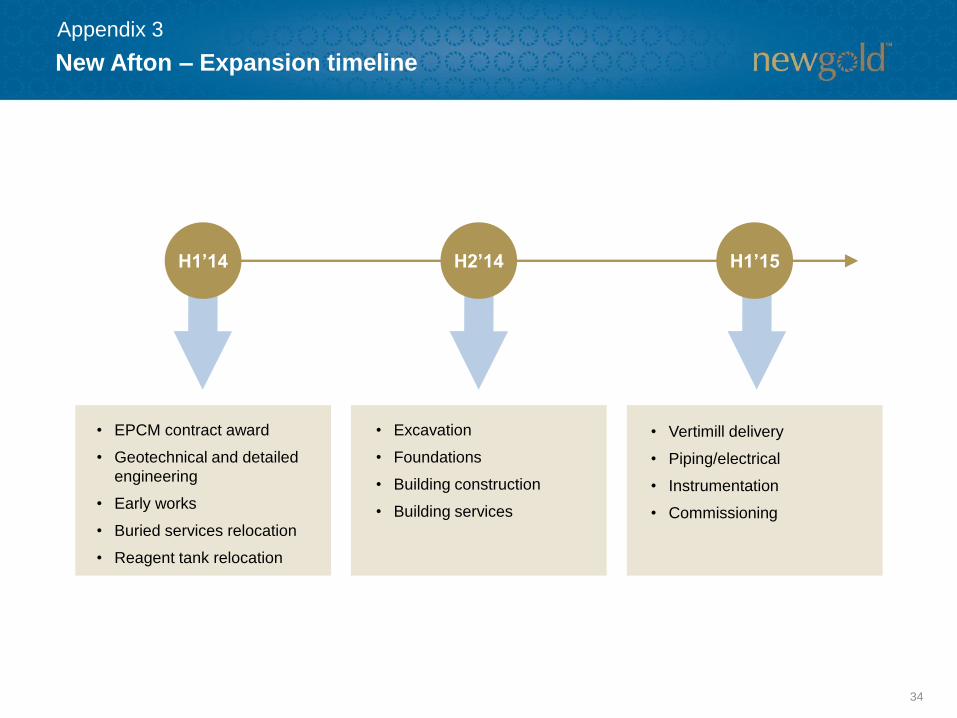
New Afton – Expansion timeline
34
• EPCM contract award
• Geotechnical and detailed
engineering
• Early works
• Buried services relocation
• Reagent tank relocation
H1’15
• Excavation
• Foundations
• Building construction
• Building services
• Vertimill delivery
• Piping/electrical
• Instrumentation
• Commissioning
H2’14H1’14
Appendix 3
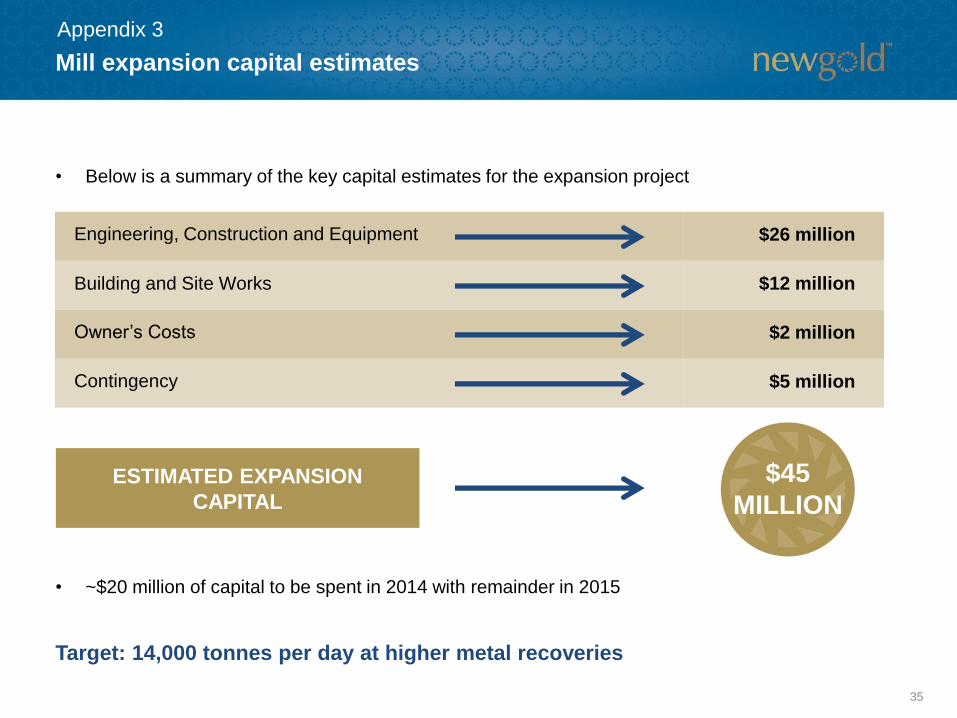
Mill expansion capital estimates
35
Engineering, Construction and Equipment $26 million
Building and Site Works $12 million
Owner’s Costs $2 million
Contingency $5 million
ESTIMATED EXPANSION
CAPITAL
$45
MILLION
• Below is a summary of the key capital estimates for the expansion project
Target: 14,000 tonnes per day at higher metal recoveries
• ~$20 million of capital to be spent in 2014 with remainder in 2015
Appendix 3

36
• C-zone originally identified through
limited deep holes drilled from surface
• Drilling from underground commenced
in second half of 2012
• During 2013 completed 41 holes totaling
26,800 metres and updated resource
• In July 2014, announced 24% increase
in Measured and Indicated resource
over year-end 2013 figures
• Mid-year resource includes an
additional 15,143 metres of drilling
in 20 core holes
Tonnes
(000s)
Gold
(g/t)
Copper
(%)
Gold
(Koz)
Copper
(Mlbs)
Measured 931 0.94 1.06 28 22
Indicated 33,941 0.76 0.86 832 646
Total M&I 34,872 0.77 0.87 860 668
Inferred 7,979 0.50 0.56 128 98
2014 MID-YEAR C-ZONE(1)
1. For a detailed breakdown of Mineral Resources and Reserves by category, refer to Appendix 2. Refer to Endnotes under the heading “Cautionary note to U.S. readers concerning estimates of Mineral Reserves and Mineral Resources” and
“Technical Information”. C-zone resource updated on July 7, 2014.
2. 2012 information per Annual Information Form dated March 27, 2013.
2012 YEAR-END C-ZONE(2)
Tonnes
(000s)
Gold
(g/t)
Copper
(%)
Gold
(Koz)
Copper
(Mlbs)
Measured 400 0.60 0.73 8 6
Indicated 2,900 0.63 0.68 58 43
Total M&I 3,300 0.62 0.68 66 49
Inferred 13,600 0.70 0.76 307 228
New Afton – C-zone resource expansion
Appendix 3
Tonnes
(000s)
Gold
(g/t)
Copper
(%)
Gold
(Koz)
Copper
(Mlbs)
Measured 618 0.75 0.91 15 12
Indicated 25,223 0.84 0.91 678 504
Total M&I 25,842 0.83 0.91 693 516
Inferred 11,288 0.63 0.64 227 159
2013 YEAR-END C-ZONE(1)

37
New Afton – C-zone September 2014 exploration update(1)
Appendix 3
1. For detailed assumptions, risks and parameters relating to the above estimates refer to New Gold’s Annual Information Form
dated March 28, 2014. Refer also to Endnotes under the heading “Cautionary note to U.S. readers concerning estimates of
Mineral Reserves and Mineral Resources” and “Technical Information” and New Gold’s news release dated July 7, 2014 and
September 11, 2014 available at www.sedar.com.
Drill Hole From (m) To (m) Interval (m) True Width (m) Au (g/t) Cu (%)
EA14-114 0 150 150 No assays
150 707 557 0.08 0.02
EA14-115 0 300 300 No assays
300 706 406 0.13 0.03
C-Zone 706 786 80 55 1.07 1.40
Includes 728 752 24 1.82 2.51
786 819 33 0.17 0.14
EA14-116 0 100 100 No assays
100 494 394 0.13 0.03
C-Zone 494 568 74 52 0.95 0.94
Includes 494 534 40 1.49 1.50
568 601 33 0.14 0.12
EA14-117 0 2 2 No assays
2 630 628 0.08 0.04
C-Zone 630 672 42 21 0.81 0.55
672 743 71 0.13 0.07
EA14-118 0 150 150 No assays
150 534 384 0.23 0.04
C-Zone 534 660 126 72 1.47 1.80
Includes 534 612 78 1.96 2.36
660 679 19 0.13 0.03
EA14-119 0 100 100 No assays
100 418 318 0.11 0.03
C-Zone 418 534 116 89 0.59 0.71
534 587 53 0.19 0.14
EA14-120 0 300 300 No assays
300 612 312 0.10 0.02
C-Zone 612 684 72 61 0.81 0.98
684 721 37 0.26 0.16
EA14-121 0 2 2 No assays
2 430 428 0.15 0.04
C-Zone 430 640 210 121 1.20 0.89
Includes 448 524 76 1.92 1.01
EA14-122 0 100 100 No assays
100 384 284 0.08 0.03
C-Zone 384 478 94 91 1.65 1.67
Includes 394 444 50 2.39 2.30
478 528 50 0.31 0.25
528 538 10 0.08 0.04
EA14-123 0 50 50 No assays
50 502 452 0.16 0.07
C-Zone 502 600 98 87 1.49 1.97
Includes 532 574 42 2.04 2.56
Drill Hole From (m) To (m) Interval (m) True Width (m) Au (g/t) Cu (%)
EA14-124A 0 300 300 No assays
300 714 414 0.15 0.03
C-Zone 714 792 78 58 1.07 1.25
792 825 33 0.08 0.12
EA14-125 0 100 100 No assays
100 392 292 0.08 0.03
C-Zone 392 502 110 78 1.35 1.73
Includes 392 428 36 2.26 3.34
502 561 59 0.10 0.04
EA14-126 0 456 456 0.17 0.06
C-Zone 456 650 194 98 0.85 0.75
Includes 490 556 66 1.47 0.93
Includes 624 650 26 0.96 1.53
650 654 4 0.11 0.05
EA14-127 0 150 150 No assays
150 526 376 0.13 0.03
526 648 122 72 0.98 1.28
Includes 570 596 26 1.61 1.78
Includes 620 648 28 1.22 1.63
EA14-128 0 100 100 No assays
100 382 282 0.05 0.03
C-Zone 382 476 94 86 1.78 1.96
Includes 384 444 60 2.49 2.69
476 522 46 0.26 0.32
444 548 104 0.07 0.09
EA14-129A 0 300 300 No assays
300 658 358 0.09 0.03
C-Zone 658 724 66 54 1.33 1.67
Includes 660 686 26 2.07 2.72
724 759 35 0.40 0.08
EA14-130 1 266 265 0.17 0.04
C-Zone 520 632 112 76 0.76 0.95
Includes 550 584 34 1.60 1.62
632 718 86 0.15 0.05
EA14-131 0 100 100 No assays
100 660 560 0.16 0.03
C-Zone 660 728 68 52 1.15 1.24
Includes 660 684 24 2.08 2.12
728 758 30 0.05 0.07
EA14-132 0 150 150 No assays
150 492 342 0.17 0.05
C-Zone 492 582 90 80 1.30 1.89
Includes 492 528 36 2.09 2.78
582 630 48 0.09 0.05
EA14-133 0 300 300 No assays
300 540 240 0.29 0.04
C-Zone 540 658 118 57 1.01 1.28
Includes 594 630 36 1.99 2.27
658 712 54 0.06 0.04

New Afton – 2014 C-zone program
38
Appendix 3
Ore Shell
Delineation & Infill
(Priority 1)
WesternExploration
Step-out(Priority 3)
Delineation & Infill(Priority 2)
~30,000-35,000 metres of drilling planned in C Zone for 2014
Extraction Level
C- Zone

39
New Gold has a track record of successful mine development
Mine development – Creating options
Once mines are in production – multiple options to further enhance value
Cerro San Pedro (April 2007) – ~35,000 tonne per day open pit/heap leach
Mesquite (January 2008) – ~40,000 tonne per day open pit/heap leach
New Afton (June 2012) – 11,000 tonne per day block cave/process facility
Mine life extension (Mesquite(1), Peak Mines(2), New Afton C-zone)
Increased production rate (Cerro San Pedro(3), New Afton)
1. Mesquite’s mine life has been extended beyond the 9.5 years that were estimated when the mine re-started production in January 2008.
2. The Peak Mines originally began production in 1992 with an approximate eight year life and have operated continuously since then and continue to have six or more years of mine life.
3. During 2011 and 2012, Cerro San Pedro operated at a rate above its design capacity to increase its annual gold and silver production.
Appendix 3

40
• Diesel comprises ~25% of Mesquite’s
total costs
• Rack diesel price most correlated to
Brent oil price
• Diesel price - $3.25 per gallon
• Every $0.25 per gallon change in diesel
price has ~$15 per ounce impact on
total cash costs
• Production increase driven by planned
mining of higher grades versus 2013
• Increase in costs attributable to
increase in total tonnes mined
• Peak year for sustaining capital at
Mesquite
Mesquite – 2014 guidance
GOLD PRODUCTION (Koz) OVERVIEW
KEY ASSUMPTIONS AND SENSITIVITIESALL-IN SUSTAINING COSTS(2) ($/oz)TOTAL CASH COSTS(1) ($/oz)
1. Refer to Endnote on total cash costs under the heading “Non-GAAP Measures”.
2. Refer to Endnote on all-in sustaining costs under the heading “Non-GAAP Measures”.
113 – 123
$930 –
$950
$1,310 –
$1,330
Appendix 4

41
• Copper price - $3.25 per pound
(2013A - $3.29 per pound)
• Australian dollar: U.S. dollar
exchange – $1.14
• $0.25 per pound change in copper
equals ~$40 per ounce change in Peak
Mines total cash costs
• $0.01 change in Australian dollar equals
~$10 per ounce change in Peak Mines
total cash costs
• Gold production in line with 2013
• Increase in copper production a result of
increased copper grade and recovery
• Decrease in total cash costs a result of
increased copper by-product revenue,
depreciating Australian dollar and
increased productivity through lower
turnover
Peak Mines – 2014 guidance
GOLD PRODUCTION (Koz) COPPER PRODUCTION (Mlbs) OVERVIEW
KEY ASSUMPTIONS AND SENSITIVITIESALL-IN SUSTAINING COSTS(2) ($/oz)TOTAL CASH COSTS(1) ($/oz)
1. Refer to Endnote on total cash costs under the heading “Non-GAAP Measures”.
2. Refer to Endnote on all-in sustaining costs under the heading “Non-GAAP Measures”.
95 – 105 14 – 16
$630 –
$650
$1,065 –
$1,085
Appendix 4

42
• Silver price - $20.00 per ounce
(2013A – $23.61 per ounce)
• Mexican peso: U.S. dollar exchange –
$13.00
• $1.00 per ounce change in silver equals
~$15 per ounce change in Cerro San
Pedro total cash costs
• $1.00 change in Mexican peso equals
~$50 per ounce change in Cerro San
Pedro total cash costs
• Decrease in production reflects the
increased strip ratio for Phase 5
pushback and mining of lower grade ore
• Increase in costs primarily driven by
lower gold production, lower silver by-
product revenue and increased volume
of processing reagents
Cerro San Pedro – 2014 guidance
GOLD PRODUCTION (Koz) SILVER PRODUCTION (Moz) OVERVIEW
KEY ASSUMPTIONS AND SENSITIVITIESALL-IN SUSTAINING COSTS(2) ($/oz)TOTAL CASH COSTS(1) ($/oz)
1. Refer to Endnote on total cash costs under the heading “Non-GAAP Measures”.
2. Refer to Endnote on all-in sustaining costs under the heading “Non-GAAP Measures”.
70 – 80 1.1 – 1.3
$1,030 –
$1,050
$1,125 –
$1,145
Appendix 4
43
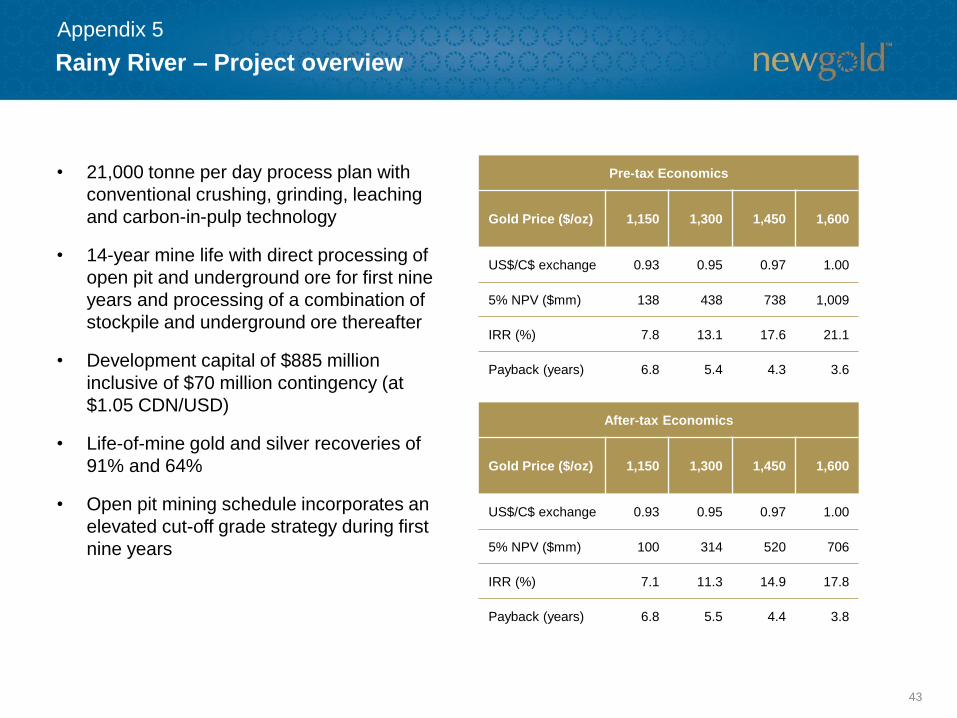
• 21,000 tonne per day process plan with
conventional crushing, grinding, leaching
and carbon-in-pulp technology
• 14-year mine life with direct processing of
open pit and underground ore for first nine
years and processing of a combination of
stockpile and underground ore thereafter
• Development capital of $885 million
inclusive of $70 million contingency (at
$1.05 CDN/USD)
• Life-of-mine gold and silver recoveries of
91% and 64%
• Open pit mining schedule incorporates an
elevated cut-off grade strategy during first
nine years
Rainy River – Project overview
Appendix 5
Pre-tax Economics
Gold Price ($/oz) 1,150 1,300 1,450 1,600
US$/C$ exchange 0.93 0.95 0.97 1.00
5% NPV ($mm) 138 438 738 1,009
IRR (%) 7.8 13.1 17.6 21.1
Payback (years) 6.8 5.4 4.3 3.6
After-tax Economics
Gold Price ($/oz) 1,150 1,300 1,450 1,600
US$/C$ exchange 0.93 0.95 0.97 1.00
5% NPV ($mm) 100 314 520 706
IRR (%) 7.1 11.3 14.9 17.8
Payback (years) 6.8 5.5 4.4 3.8

44
Rainy River – Progress update
Project Development Capital Costs
Description Cost ($ million)
Direct Costs
Process Equipment $127
Process Facilities – Construction $170
Site Development $111
Open Pit Mine Equipment $81
Overburden and Waste Stripping $80
Tailings and Water Management $48
Power Line and Roads $21
Total Direct Capital Costs $638
Owner's and Indirect Costs
Owner's Costs $76
EPCM $48
Other Indirects $53
Total Owner's & Indirect Capital Costs $177
Subtotal $815
Contingency $70
Total Project (at US$/C$ - 0.95) $885
1. Project development capital costs based on Rainy River Technical Report, entitled “Feasibility Study of the Rainy River Project, Ontario, Canada” dated February 14, 2014 and available on SEDAR.
~70% of capital costs denominated in Canadian dollars
Appendix 5

45
Bayfield location
Appendix 5
B Block
Burns Block
C Block

46
• Conventional truck and shovel open pit mine
with 60,000 tonne per day processing plant
• Simple, conventional flowsheet using whole
ore leach process
• Low grade stockpiling strategy
• Development capital of $1,865 million
inclusive of $190 million contingency (at
$1.05 CDN/USD)
• Life-of-mine operational strip ratio of 1.88 to 1
• Life-of-mine gold and silver recoveries of
87% and 49%
• Conventional waste rock and Tailings
Storage Facility
• Power supply from the hydroelectric power
grid, via 140-kilometre transmission line
• Minimal off-site infrastructure required
• Good existing access road; water supply
within 15 kilometres
• Low environmental risk and facility designed
for closure
Blackwater – Project overview
Appendix 6
Pre-tax Economics
Gold Price ($/oz) 1,150 1,300 1,450 1,600
US$/C$ exchange 0.93 0.95 0.97 1.00
5% NPV ($mm) 402 991 1,582 2,120
IRR (%) 7.8 11.3 14.4 16.8
Payback (years) 7.5 6.2 5.1 4.5

471. Capital estimates based on December 2011 Feasibility Study.
El Morro (30%) – Funding structure
Funded by
$1.2 billioninterest at 4.58%
~ $2.7 billion 70%
20% 80%
• New Gold’s 30% share of development capital 100% carried
• Interest fixed at 4.58%
30% 70%
30%
Total Capital100%
~ $3.9 billion(1)
100% Average annual
cash flow
Carried funding repayment
Appendix 7

48
2013 open pit Proven and
Probable reserves and Measured
and Indicated resources
Underground Inferred
resource with block
cave potential
500 metres
La Fortuna deposit
Appendix 7
Reserve Grade
Gold: 0.46 g/t
Copper: 0.49%
Inferred Grade
Gold: 0.97 g/t
Copper: 0.78%

491. All reserve information taken from Goldcorp’s December 31, 2013 year-end resource statements.
2. Gold equivalent calculated based on the following commodity prices: Gold - $1,300/oz; Silver - $22.00/oz; Copper - $3.00/lb; Lead - $0.90/lb; Zinc - $0.90/lb.
El Morro relative positioning(1)
EL MORRO WITHIN GOLDCORP PORTFOLIO
Asset Gold Reserves (Moz) Asset Gold Equivalent(2) (Moz)
Penasquito 11.6 Penasquito 30.6
Los Filos 8.0 El Morro 18.0
El Morro 6.7 Los Filos 8.9
Pueblo Viejo 6.5 Pueblo Viejo 7.5
Cerro Negro 5.7 Cerro Negro 6.6
Appendix 7

50
New Gold’s estimated exploration budget for 2014 is $50 million
• Capitalized: $30 million (included in sustaining capital total shown previously)
• Expensed: $20 million (approximately 70% related to current operations)
New Afton
30,000-35,000
metres
Peak Mines
45,000
metres
Blackwater
10,000-15,000
metres
2014 exploration program overview
Rainy River
35,000-40,000
metres
1. Circle proportions are representative of both capitalized and expensed exploration for each respective asset.
Appendix 8
$15 million
$15 million
$11 million
$9 million

Rainy River exploration
51
• Intrepid resource drilled off and incorporated into Feasibility Study
• Condemnation drilling program approximately 40% complete by year end
• Improved ability to predict prospective ore horizons beneath surface cover
2013 ACHIEVEMENTS
2014 PROGRAM
Targeting resource expansion in near-mine environment
• Complete condemnation drilling program
• Test potential to expand open pit resource to west
• Explore prospective trends south of main mine area and extending
from Intrepid Zone
Intrepid Zone
Appendix 8

Blackwater exploration
52
2013 Achievement
• Expanded exploration targeting coverage to ~50% of claim block
• 14 prospective target areas identified to date
• Seven new targets drill tested with favorable geology intercepted on six
and gold mineralization intercepted on three
• Acquired Key property immediately south of Blackwater deposit area
2014 Program
• Follow up favorable results at Van Tine, Fawn and earlier stage prospects
• Initiate exploration at Key
Appendix 8

Peak Mines exploration
53
• Near-mine exploration and resource conversion partially offset mine depletion
• Advanced earlier stage targets along regional Rookery fault trend
2013 ACHIEVEMENTS
2014 PROGRAM
Focus on reserves replacement in near-mine environment
• Convert Measured and Indicated resources to reserves to extend mine life
• Test newly emerging targets along mine corridor
• Continue to advance earlier stage regional targets
Appendix 8

541. 2012 information per Annual Information Form dated March 27, 2013
2. New Afton C-zone updated for July 7, 2014 news release.
Reserves and resources summary
Appendix 9
Gold
Koz
Silver
Koz
Copper
Mlbs
Gold
Koz
Silver
Koz
Copper
Mlbs
Proven and Probable Reserves 18,538 90,080 2,953 7,752 31,256 3,282
Measured and Indicated Resources (inclusive of Reserves) 27,672 125,018 4,505 21,403 131,847 4,061
Inferred Resources 4,062 30,145 1,759 4,383 84,620 1,114
M&I Resources (inclusive of Reserves)
New Afton 2,464 8,305 2,140 1,979 6,830 1,818
Mesquite 4,904 - - 5,684 - -
Peak Mines 810 1,380 158 880 1,350 146
Cerro San Pedro 397 15,948 - 1,703 57,980 -
Rainy River 6,236 14,635 - n/a n/a n/a
Blackwater 9,500 70,130 - 8,070 56,190 -
Capoose 320 14,620 - 196 9,497 -
El Morro 3,041 - 2,207 2,891 - 2,097
Total M&I 27,672 125,018 4,505 21,403 131,847 4,061
Mineral Reserves and Resources Summary
As at December 31, 2013 As at December 31, 2012(1)
55
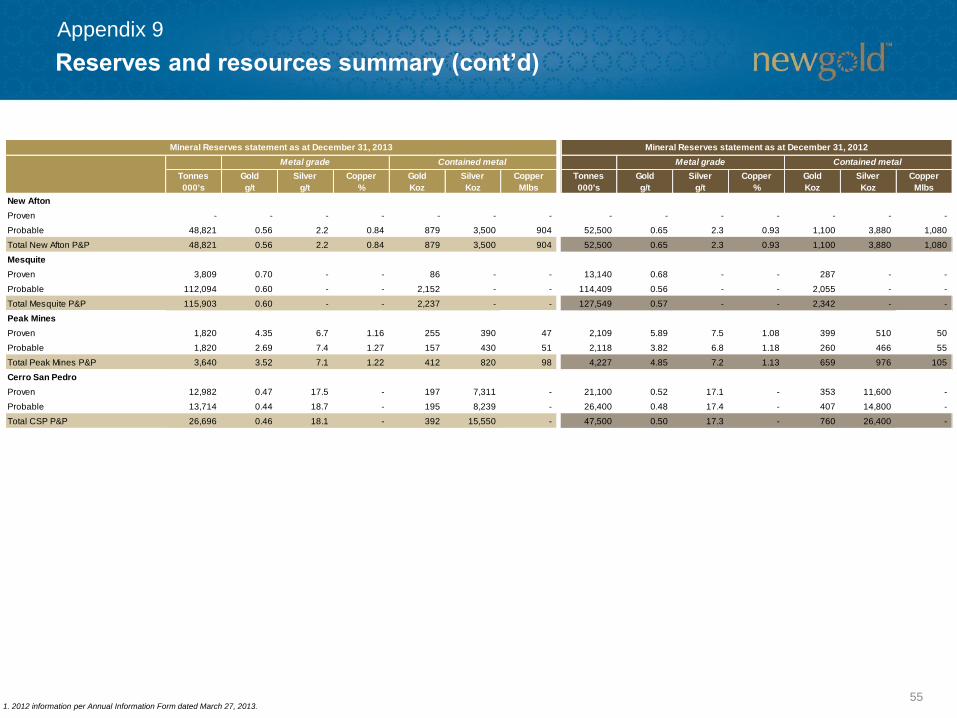
Reserves and resources summary (cont’d)
Appendix 9
1. 2012 information per Annual Information Form dated March 27, 2013.
Tonnes
000's
Gold
g/t
Silver
g/t
Copper
%
Gold
Koz
Silver
Koz
Copper
Mlbs
Tonnes
000's
Gold
g/t
Silver
g/t
Copper
%
Gold
Koz
Silver
Koz
Copper
Mlbs
New Afton
Proven - - - - - - - - - - - - - -
Probable 48,821 0.56 2.2 0.84 879 3,500 904 52,500 0.65 2.3 0.93 1,100 3,880 1,080
Total New Afton P&P 48,821 0.56 2.2 0.84 879 3,500 904 52,500 0.65 2.3 0.93 1,100 3,880 1,080
Mesquite
Proven 3,809 0.70 - - 86 - - 13,140 0.68 - - 287 - -
Probable 112,094 0.60 - - 2,152 - - 114,409 0.56 - - 2,055 - -
Total Mesquite P&P 115,903 0.60 - - 2,237 - - 127,549 0.57 - - 2,342 - -
Peak Mines
Proven 1,820 4.35 6.7 1.16 255 390 47 2,109 5.89 7.5 1.08 399 510 50
Probable 1,820 2.69 7.4 1.27 157 430 51 2,118 3.82 6.8 1.18 260 466 55
Total Peak Mines P&P 3,640 3.52 7.1 1.22 412 820 98 4,227 4.85 7.2 1.13 659 976 105
Cerro San Pedro
Proven 12,982 0.47 17.5 - 197 7,311 - 21,100 0.52 17.1 - 353 11,600 -
Probable 13,714 0.44 18.7 - 195 8,239 - 26,400 0.48 17.4 - 407 14,800 -
Total CSP P&P 26,696 0.46 18.1 - 392 15,550 - 47,500 0.50 17.3 - 760 26,400 -
Mineral Reserves statement as at December 31, 2013
Contained metalMetal grade Metal grade Contained metal
Mineral Reserves statement as at December 31, 2012

56
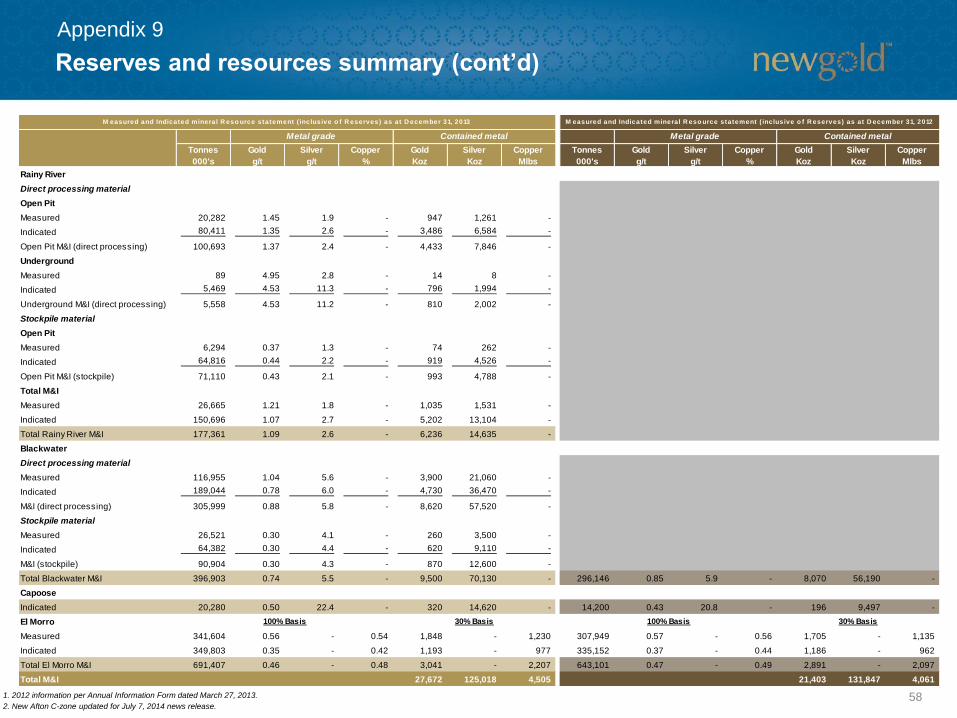
Reserves and resources summary (cont’d)
Appendix 9
1. 2012 information per Annual Information Form dated March 27, 2013.
Tonnes
000's
Gold
g/t
Silver
g/t
Copper
%
Gold
Koz
Silver
Koz
Copper
Mlbs
Tonnes
000's
Gold
g/t
Silver
g/t
Copper
%
Gold
Koz
Silver
Koz
Copper
Mlbs
Rainy River
Direct processing material
Open Pit
Proven 15,839 1.47 2.0 - 746 1,038 -
Probable 46,866 1.26 3.1 - 1,896 4,594 -
Open Pit P&P (direct processing) 62,705 1.31 2.8 - 2,642 5,632 -
Underground
Proven - - - - - - -
Probable 4,187 4.96 10.3 - 668 1,388 -
Underground P&P (direct processing) 4,187 4.96 10.3 - 668 1,388 -
Stockpile material
Open Pit
Proven 6,843 0.38 1.5 - 84 332 -
Probable 30,541 0.39 2.1 - 378 2,058 -
Open Pit P&P (stockpile) 37,384 0.38 2.0 - 462 2,390 -
Total P&P
Proven 22,681 1.14 1.9 - 830 1,370 -
Probable 81,594 1.12 3.1 - 2,943 8,040 -
Total Rainy River P&P 104,275 1.13 2.8 - 3,773 9,410 -
Blackwater
Direct processing material
Proven 124,500 0.95 5.5 - 3,790 22,100 -
Probable 169,700 0.68 4.1 - 3,730 22,300 -
P&P (direct processing) 294,300 0.79 4.7 - 7,510 44,400 -
Stockpile material
Proven 20,100 0.50 3.6 - 330 2,300 -
Probable 30,100 0.34 14.6 - 330 14,100 -
P&P (stockpile) 50,200 0.40 10.2 - 650 16,400 -
Total Blackwater P&P 344,400 0.74 5.5 - 8,170 60,800 -
El Morro 30% Basis
Proven 321,814 0.56 - 0.55 1,746 - 1,163 307,949 0.57 - 0.56 1,705 - 1,135
Probable 277,240 0.35 - 0.43 929 - 788 335,152 0.37 - 0.44 1,186 - 962
Total El Morro P&P 599,054 0.46 - 0.49 2,675 - 1,951 643,101 0.47 - 0.49 2,891 - 2,097
Total P&P 18,538 90,080 2,953 7,752 31,256 3,282
100% Basis 30% Basis 100% Basis
Mineral Reserves statement as at December 31, 2013
Contained metalMetal grade Metal grade Contained metal
Mineral Reserves statement as at December 31, 2012

57
Reserves and resources summary (cont’d)
Appendix 9
1. 2012 information per Annual Information Form dated March 27, 2013.
2. New Afton C-zone updated for July 7, 2014 news release.
Tonnes
000's
Gold
g/t
Silver
g/t
Copper
%
Gold
Koz
Silver
Koz
Copper
Mlbs
Tonnes
000's
Gold
g/t
Silver
g/t
Copper
%
Gold
Koz
Silver
Koz
Copper
Mlbs
New Afton
A&B Zones
Measured 41,059 0.79 2.7 1.09 1,041 3,624 984 33,500 0.86 2.9 1.18 929 3,160 873
Indicated 26,966 0.44 2.1 0.65 384 1,777 384 45,900 0.67 2.4 0.89 984 3,530 896
A&B Zone M&I 68,025 0.65 2.5 0.91 1,425 5,401 1,368 79,400 0.75 2.6 1.01 1,913 6,690 1,769
C-Zone
Measured 931 0.94 1.7 1.06 28 51 22 400 0.60 1.3 0.73 8 20 6
Indicated 33,941 0.76 1.9 0.86 832 2,084 646 2,900 0.63 1.3 0.68 58 120 43
C-Zone M&I 34,872 0.77 1.9 0.87 860 2,141 668 3,300 0.62 1.3 0.68 66 140 49
HW Lens
Measured - - - - - - - - - - - - - -
Indicated 11,035 0.50 2.2 0.43 179 763 104 - - - - - - -
HW Lens M&I 11,035 0.50 2.2 0.43 179 763 104 - - - - - - -
Total New Afton M&I 113,932 0.67 2.3 0.85 2,464 8,305 2,140 82,700 0.74 2.6 1.00 1,979 6,830 1,818
Mesquite
Measured 9,070 0.66 - - 191 - - 24,000 0.61 - - 452 - -
Indicated 304,081 0.48 - - 4,713 - - 370,100 0.45 - - 5,232 - -
Total Mesquite M&I 313,151 0.49 - - 4,904 - - 394,100 0.45 - - 5,684 - -
Peak Mines
Measured 3,000 4.69 6.7 1.06 450 650 70 2,700 5.74 7.5 1.05 494 647 62
Indicated 3,400 3.29 6.7 1.18 360 730 88 3,200 3.75 6.8 1.19 386 703 84
Peak Mines M&I 6,400 3.95 6.7 1.12 810 1,380 158 5,900 4.66 7.1 1.13 880 1,350 146
Cerro San Pedro
Measured 13,387 0.46 17.3 - 199 7,459 - 42,300 0.40 14.4 - 532 18,900 -
Indicated 14,311 0.43 18.4 - 198 8,489 - 109,400 0.34 11.5 - 1,171 39,080 -
Total CSP M&I 27,698 0.45 17.9 - 397 15,948 - 151,700 0.35 11.9 - 1,703 57,980 -
M easured and Indicated mineral R eso urce statement ( inclusive o f R eserves) as at D ecember 31, 2013
Contained metalMetal grade
M easured and Indicated mineral R eso urce statement ( inclusive o f R eserves) as at D ecember 31, 2012
Metal grade Contained metal
58
Reserves and resources summary (cont’d)
Appendix 9
1. 2012 information per Annual Information Form dated March 27, 2013.
2. New Afton C-zone updated for July 7, 2014 news release.
Tonnes
000's
Gold
g/t
Silver
g/t
Copper
%
Gold
Koz
Silver
Koz
Copper
Mlbs
Tonnes
000's
Gold
g/t
Silver
g/t
Copper
%
Gold
Koz
Silver
Koz
Copper
Mlbs
Rainy River
Direct processing material
Open Pit
Measured 20,282 1.45 1.9 - 947 1,261 -
Indicated 80,411 1.35 2.6 - 3,486 6,584 -
Open Pit M&I (direct processing) 100,693 1.37 2.4 - 4,433 7,846 -
Underground
Measured 89 4.95 2.8 - 14 8 -
Indicated 5,469 4.53 11.3 - 796 1,994 -
Underground M&I (direct processing) 5,558 4.53 11.2 - 810 2,002 -
Stockpile material
Open Pit
Measured 6,294 0.37 1.3 - 74 262 -
Indicated 64,816 0.44 2.2 - 919 4,526 -
Open Pit M&I (stockpile) 71,110 0.43 2.1 - 993 4,788 -
Total M&I
Measured 26,665 1.21 1.8 - 1,035 1,531 -
Indicated 150,696 1.07 2.7 - 5,202 13,104 -
Total Rainy River M&I 177,361 1.09 2.6 - 6,236 14,635 -
Blackwater
Direct processing material
Measured 116,955 1.04 5.6 - 3,900 21,060 -
Indicated 189,044 0.78 6.0 - 4,730 36,470 -
M&I (direct processing) 305,999 0.88 5.8 - 8,620 57,520 -
Stockpile material
Measured 26,521 0.30 4.1 - 260 3,500 -
Indicated 64,382 0.30 4.4 - 620 9,110 -
M&I (stockpile) 90,904 0.30 4.3 - 870 12,600 -
Total Blackwater M&I 396,903 0.74 5.5 - 9,500 70,130 - 296,146 0.85 5.9 - 8,070 56,190 -
Capoose
Indicated 20,280 0.50 22.4 - 320 14,620 - 14,200 0.43 20.8 - 196 9,497 -
El Morro
Measured 341,604 0.56 - 0.54 1,848 - 1,230 307,949 0.57 - 0.56 1,705 - 1,135
Indicated 349,803 0.35 - 0.42 1,193 - 977 335,152 0.37 - 0.44 1,186 - 962
Total El Morro M&I 691,407 0.46 - 0.48 3,041 - 2,207 643,101 0.47 - 0.49 2,891 - 2,097
Total M&I 27,672 125,018 4,505 21,403 131,847 4,061
M easured and Indicated mineral R eso urce statement ( inclusive o f R eserves) as at D ecember 31, 2013
Contained metal
100% Basis 30% Basis
Metal grade
M easured and Indicated mineral R eso urce statement ( inclusive o f R eserves) as at D ecember 31, 2012
Metal grade Contained metal
100% Basis 30% Basis

59
Reserves and resources summary (cont’d)
Appendix 9
1. 2012 information per Annual Information Form dated March 27, 2013.
2. New Afton C-zone updated for July 7, 2014 news release.
Tonnes
000's
Gold
g/t
Silver
g/t
Copper
%
Gold
Koz
Silver
Koz
Copper
Mlbs
Tonnes
000's
Gold
g/t
Silver
g/t
Copper
%
Gold
Koz
Silver
Koz
Copper
Mlbs
New Afton
A&B-Zone 5,607 0.32 1.5 0.38 59 272 46 14,900 0.45 2.0 0.65 216 940 212
C-Zone 7,979 0.50 1.5 0.56 128 387 98 13,600 0.70 1.5 0.76 307 670 228
HW Lens 818 0.56 1.3 0.42 15 33 7 - - - - - - -
New Afton Inferred 14,404 0.50 1.5 0.52 202 692 151 28,400 0.57 1.8 0.70 523 1,610 440
Mesquite 17,550 0.42 - - 238 - - 50,900 0.40 - - 651 - -
Peak Mines 2,000 2.34 4.7 1.17 150 300 51 1,700 2.64 4.8 1.13 144 261 42
CSP 1,174 0.34 11.6 - 13 436 - 103,900 0.25 8.8 - 850 29,200 -
Rainy River
Direct processing
Open Pit 9,388 0.97 2.3 - 292 687 -
Underground 2,641 4.46 8.3 - 379 707 -
Total Direct Processing 12,029 1.74 3.6 - 671 1,394 -
Stockpile
Open Pit 8,626 0.37 1.2 - 102 323 -
Rainy River Inferred 20,655 1.16 2.6 - 773 1,717 -
Blackwater
Direct processing 13,815 0.76 4.1 - 340 1,820 -
Stockpile 3,785 0.31 3.6 - 40 440 -
Blackwater Inferred 17,600 0.66 4.0 - 380 2,260 - 16,585 0.58 10.8 - 310 5,760 -
Capoose 29,263 0.39 26.3 - 370 24,740 - 64,070 0.29 23.2 - 595 47,789 -
El Morro - Open Pit 564,217 0.16 - 0.26 871 - 970 137,555 0.99 - 0.70 1,310 - 632
El Morro - Underground 113,840 0.97 - 0.78 1,065 - 587
Total Inferred 4,062 30,145 1,759 4,383 84,620 1,114
100% Basis 30% Basis30% Basis100% Basis
Inferred Resource statement as at December 31, 2013
Contained metalMetal grade
Inferred Resource statement as at December 31, 2012
Metal grade Contained metal

60
New Gold reports its Measured and Indicated mineral resources inclusive of its mineral reserves. Measured and Indicated mineral resources that are not mineral reserves do not have
demonstrated economic viability. Inferred mineral resources have a greater amount of uncertainty as to their existence and economic and legal feasibility, do not have demonstrated economic
viability, and are exclusive of mineral reserves. Mineral reserves have been estimated in accordance with the Canadian Institute of Mining, Metallurgy and Petroleum (“CIM”) definition
standards and National Instrument 43-101 (“NI 43-101”).
1) Mineral Reserves for the company’s mineral properties have been estimated based on the following metal prices and lower cut-off criteria:
Mineral Property Gold
(US$/oz)
Silver
(US$/oz)
Copper
(US$/lb)
Lower Cut-off
New Afton $1,300 $22.00 $3.00 US$21.00/t NSR
Mesquite $1,300 - - 0.21 g/t Au – Oxide and transition reserves
0.41 g/t Au – Non-oxide reserves
Peak Mines $1,300 $22.00 $3.00 A$88 – 134/t NSR
Cerro San Pedro $1,300 $22.00 - US$3.00/t
Rainy River $800
$1,300
$25.00
$22.00
- Open Pit: 0.3 – 0.7 g/t Au
Underground: 3.5 g/t Au
Blackwater $1,300 $22.00 - Direct processing: 0.26 – 0.38 g/t AuEq
Stockpile: 0.32 g/t AuEq
El Morro $1,300 - $3.00 0.20% Cu
Reserves and resources notes
Appendix 9

61
2) Mineral Resources for the company’s mineral properties have been estimated based on the following metal prices and lower cut-off criteria:
3) Mineral resources are classified as Measured, Indicated and Inferred resources and are reported based on technical and economic parameters consistent with the methods most suitable
for their potential commercial exploitation. Where different mining and/or processing methods might be applied to different portions of a mineral resource, the designators ‘open pit’ and
‘underground’ have been applied to indicate envisioned mining method. Likewise the designators ‘oxide’, ‘non-oxide’ and ‘sulphide’ have been applied to indicate the type of mineralization
as it relates to appropriate mineral processing method and expected payable metal recoveries. Additional details regarding mineral resource estimation, classification, reporting parameters,
key assumptions and associated risks for each of New Gold’s mineral properties, other than Rainy River, are provided in the respective NI 43-101 Technical Reports which are available at
www.sedar.com. Refer to the supplementary information below regarding the mineral reserve and mineral resource estimates for Rainy River.
Mineral Property Gold
(US$/oz)
Silver
(US$/oz)
Copper
(US$/lb)
Lower Cut-off
New Afton $1,400 $24.00 $3.25 0.40% CuEq
Mesquite $1,400 - - 0.11 g/t Au – Oxide and transition resources
0.22 g/t Au – Non-oxide resources
Peak Mines $1,400 $24.00 $3.25 A$92 - 125/t NSR
Cerro San Pedro $1,400 $24.00 - 0.10 g/t AuEq – Open pit oxide resources
0.30 g/t AuEq – Open pit sulphide resources
Rainy River $1,400 $24.00 - Open Pit: 0.3 – 0.45 g/t Au
Underground: 2.5 g/t Au
Blackwater $1,400 $24.00 - Direct processing: 0.40 g/t AuEq
Stockpile: 0.30 – 0.40 g/t AuEq
Capoose $1,400 $24.00 - 0.40 g/t AuEq
El Morro $1,300 - $3.00 0.20% Cu
Reserves and resources notes (cont’d)
Appendix 9

62
Rainy River Mineral Reserves:
1. Open pit mineral reserves have been estimated using an optimized pit shell based on metal prices of $800 per ounce gold and $25 per ounce silver, a foreign exchange rate of C$1.05 to
US$1.00, gold recovery of 89.9% (non-CAP Zone) and 74.3% (CAP Zone) and a silver recovery of 67.1% (non-CAP Zone) and 69.5% (CAP Zone). The cut-off grade is based on a gold
price of $1,200. Underground reserves have been estimated from mining shapes generated using a cut-off grade of 3.5 g/t gold-equivalent. Development material from stope access drives
above a cut-off grade of 1.5 g/t gold-equivalent is also assumed to be sent to the mill for processing. Underground breakeven cut-off grade is calculated at 2.75 g/t gold-equivalent based on
metal prices of $1,300 per ounce gold and $22 per ounce silver, a foreign exchange rate of CAD $1.05 to USD $1.00, gold recovery of 95% and a silver recovery of 75%.
2. Open pit reserves have been estimated using a dilution of 4% at 0.21 g/t Au and 1.19 g/t Ag, and underground reserves have been estimated using an overall dilution of 8.3%, inclusive of
both rock and backfill dilution. Open pit and underground reserves have been estimated using a mining recovery of 95% and 96.5%, respectively.
3. Open pit direct processing material is defined as mineralization likely to be mined and processed directly and above a variable cut-off grade ranging from 0.3-0.7 Au g/t.
4. Stockpile material includes all material within designed open pit between variable cut-offs described above in Note 3, as well as material within the CAP Zone (code 500) that is suitable for
stockpiling and future processing.
5. Mineral Reserves for the open pit are derived from the resource model effective November 2, 2013. Models for the underground reserves were derived from the August 2013 and
September 2013 models for the main ODM zone and Intrepid Zone, respectively. Models were prepared by Dorota El-Rassi, P.Eng. (APEO #100012348) and Glen Cole, P.Geo. (APGO
#1416), of SRK, both independent “Qualified Persons" as that term is defined in National Instrument 43-101. Rainy River’s exploration program in Richardson Township is being supervised
by Mark A. Petersen, (AIPG Certified Professional Geologist #10563), Vice President, Exploration for New Gold and a “Qualified Person” as defined in National Instrument 43-101. New Gold
continues to implement a rigorous QA/QC program to ensure best practices in drill core sampling, analysis and data management.
6. Qualified persons - The open pit portion of the mineral reserve statement was prepared under the supervision of Patrice Live (OIQ #38991) of BBA, and the underground portion of the
mineral reserve statement was prepared by Colm Keogh, P.Eng. (APEGBC #37433) of AMC Mining Consultants (Canada) Ltd., both independent “Qualified Persons" as that term is defined
in National Instrument 43-101.
7. The mineral reserve estimate may be materially affected by environmental, permitting, legal, title, taxation, sociopolitical, marketing, and other relevant issues.
Rainy River Mineral Resources:
1. Mineral resources are reported in relation to conceptual pit shells and are inclusive of the Intrepid zone. Vertical limit of -150m msl.
2. Open pit mineral resources are reported at a cut-off grade of 0.30 gpt gold, underground mineral resources are reported at a cut-off grade of 2.5 gpt gold based on a gold price of $1,400
per ounce, a silver price of $24.00 per ounce, a foreign exchange rate of C$1.10 to US$1.00, gold recovery of 88% for open pit resources and 90% for underground resources with silver
recovery at 75%.
3. Direct processing material is defined as mineralization above a cut-off of 0.45 g/t gold and likely to be mined and processed directly.
4. Stockpile material includes all material within conceptual pit shells in the gold grade range 0.30 – 0.45 gpt as well as all material within the CAP zone that is suitable for stockpiling and
future processing based on average metallurgical recoveries of 88% gold and 75% silver.
5. Qualified Persons – The mineral resource statement was prepared by Dorota El-Rassi, P. Eng. (APEO #100012348) and Glen Cole (APGO #1416) from SRK, both independent "Qualified
Persons" as that term is defined in National Instrument 43-101.
6. Mineral resources are inclusive of mineral reserves. Mineral resources that are not mineral reserves do not have demonstrated economic viability.
7. The mineral resource estimate may be materially affected by environmental, permitting, legal, title, taxation, sociopolitical, marketing and other relevant issues.
4) Qualified Person: The preparation of New Gold's mineral reserve and mineral resource statements has been done by Qualified Persons as defined under National Instrument 43-101 under
the supervision of Mark A. Petersen, a Qualified Person under National Instrument 43-101 and an officer of New Gold.
Reserves and resources notes (cont’d)
Appendix 9

63
2014 guidance assumptions
Spot:
2014
Gold price ($/oz) 1,300
Silver price ($/oz) 20.00
Copper price ($/oz) 3.25
AUD/USD 1.14
CDN/USD 1.11
MXN/USD 13.00
Spot
Gold price ($/oz) 1,220
Silver price ($/oz) 16.55
Copper price ($/oz) 2.80
AUD/USD 1.23
CDN/USD 1.18
MXN/USD 14.87
Commodity price/foreign exchange assumptions
Appendix 10

Endnotes
64
CAUTIONARY NOTE TO U.S. READERS CONCERNING ESTIMATES OF MINERAL RESERVES AND MINERAL RESOURCES
Information concerning the properties and operations of New Gold has been prepared in accordance with Canadian standards under applicable Canadian securities laws, and may not be
comparable to similar information for United States companies. The terms “Mineral Resource”, “Measured Mineral Resource”, “Indicated Mineral Resource” and “Inferred Mineral Resource”
used in this Report are Canadian mining terms as defined in the Canadian Institute of Mining, Metallurgy and Petroleum (“CIM”) Definition Standards for Mineral Resources and Mineral
Reserves adopted by CIM Council on November 27, 2010 and incorporated by reference in National Instrument 43-101 (“NI 43-101”). While the terms “Mineral Resource”, “Measured Mineral
Resource”, “Indicated Mineral Resource” and “Inferred Mineral Resource” are recognized and required by Canadian securities regulations, they are not defined terms under standards of the
United States Securities and Exchange Commission. As such, certain information contained in this Report concerning descriptions of mineralization and resources under Canadian standards
is not comparable to similar information made public by United States companies subject to the reporting and disclosure requirements of the United States Securities and Exchange
Commission.
An “Inferred Mineral Resource” has a great amount of uncertainty as to its existence and as to its economic and legal feasibility. Under Canadian rules, estimates of Inferred Mineral
Resources may not form the basis of feasibility or pre-feasibility studies. It cannot be assumed that all or any part of an “Inferred Mineral Resource” will ever be upgraded to a higher
confidence category. Readers are cautioned not to assume that all or any part of an “Inferred Mineral Resource” exists or is economically or legally mineable.
Under United States standards, mineralization may not be classified as a “Reserve” unless the determination has been made that the mineralization could be economically and legally
produced or extracted at the time the Reserve estimation is made. Readers are cautioned not to assume that all or any part of the Measured or Indicated Mineral Resources that are not
Mineral Reserves will ever be converted into Mineral Reserves. In addition, the definitions of “Proven Mineral Reserves” and “Probable Mineral Reserves” under CIM standards differ in certain
respects from the standards of the United States Securities and Exchange Commission.
TECHNICAL INFORMATION
The scientific and technical information in this presentation has been reviewed and approved by Mark A. Petersen, Vice President, Exploration of New Gold. Mr. Petersen is an AIPG Certified
Professional Geologist and a “qualified person” under National Instrument 43-101. For additional information with respect to our Mineral Resource and Reserve estimates and the Feasibility
Studies discussed herein, refer to our news release dated February 6, 2014, the Rainy River Technical Report, the Blackwater Technical Report and our other technical reports available at
www.sedar.com.

Endnotes (cont’d)
65
NON-GAAP MEASURES
(1) ALL-IN SUSTAINING COSTS
Consistent with guidance announced in 2013 by the World Gold Council, an association of various gold mining companies from around the world of which New Gold is a member, New Gold
defines “all-in sustaining costs” per ounce as the sum of total cash costs, capital expenditures that are sustaining in nature, corporate general and administrative costs, capitalized and
expensed exploration that is sustaining in nature and environmental reclamation costs, all divided by the ounces of gold sold to arrive at a per ounce figure. New Gold believes this non-GAAP
financial measure provides further transparency into costs associated with producing gold and will assist analysts, investors and other stakeholders of the company in assessing the company’s
operating performance, its ability to generate free cash flow from current operations and its overall value. This data is furnished to provide additional information and is a non-GAAP financial
measure. All-in sustaining costs presented do not have a standardized meaning under GAAP and may not be comparable to similar measures presented by other mining companies. It should
not be considered in isolation or as a substitute for measures of performance prepared in accordance with GAAP and is not necessarily indicative of cash flow from operations under GAAP or
operating costs presented under GAAP. Further details regarding all-in sustaining costs and a reconciliation to the nearest GAAP measures are provided in our MD&As accompanying our
financial statements filed from time to time on www.sedar.com.
(2) TOTAL CASH COSTS
“Total cash costs” per ounce figures are non-GAAP measures which are calculated in accordance with a standard developed by The Gold Institute, a worldwide association of suppliers of gold
and gold products that ceased operations in 2002. Adoption of the standard is voluntary and the cost measures presented may not be comparable to other similarly titled measures of other
companies. New Gold reports total cash costs on a sales basis. The company believes that certain investors use this information to evaluate the company’s ability to generate liquidity through
operating cash flow and that this measure, along with sales, is considered to be a key indicator of the company’s ability to generate operating earnings and cash flow from its mining
operations. Total cash costs include mine site operating costs such as mining, processing and administration costs, royalties, production taxes, and realized gains and losses on fuel contracts,
but are exclusive of amortization, reclamation, capital and exploration costs and net of by-product sales. Total cash costs are then divided by ounces of gold sold to arrive at a per ounce
figure. Co-product cash costs remove the impact of other metal sales that are produced as a by-product of gold production and apportion the cash costs to each metal produced on a
percentage of revenue basis, and subsequently divides the amount by the total ounces of gold or silver or pounds of copper sold, as the case may be, to arrive at per ounce or per pound
figures. Unless otherwise indicated, all total cash cost information in this presentation is net of by-product sales. These measures, along with sales, are considered to be a key indicator of a
company’s ability to generate operating earnings and cash flow from its mining operations. This data is furnished to provide additional information and is a non-GAAP financial measure. Total
cash costs and co-product cash costs presented do not have a standardized meaning under GAAP and may not be comparable to similar measures presented by other mining companies. It
should not be considered in isolation or as a substitute for measures of performance prepared in accordance with GAAP and is not necessarily indicative of cash flow from operations under
GAAP or operating costs presented under GAAP. Further details regarding total cash costs and a reconciliation to the nearest GAAP measures are provided in our MD&As accompanying our
financial statements filed from time to time on www.sedar.com.
(3) ADJUSTED NET EARNINGS
“Adjusted net earnings” and “adjusted net earnings per share” are non-GAAP financial measures. Net earnings have been adjusted and tax affected for the group of costs in “Other gains and
losses” on the condensed consolidated income statement. The adjusted entries are also impacted for tax to the extent that the underlying entries are impacted for tax in the unadjusted net
earnings from continuing operations. The company uses this measure for its own internal purposes. Management’s internal budgets and forecasts and public guidance do not reflect fair value
changes on senior notes and non-hedged derivatives, foreign currency translation and fair value through profit or loss and financial asset gains/losses. Consequently, the presentation of
adjusted net earnings and adjusted net earnings per share enables investors and analysts to better understand the underlying operating performance of our core mining business through the
eyes of management. Management periodically evaluates the components of adjusted net earnings and adjusted net earnings per share based on an internal assessment of performance
measures that are useful for evaluating the operating performance of our business and a review of the non-GAAP measures used by mining industry analysts and other mining companies.
Adjusted net earnings and adjusted net earnings per share are intended to provide additional information only and do not have any standardized definition under IFRS and may not be
comparable to similar measures presented by other companies. They should not be considered in isolation or as a substitute for measures of performance prepared in accordance with IFRS.
The measures are not necessarily indicative of operating profit or cash flows from operations as determined under IFRS.

Endnotes (cont’d)
66
(4) OPERATING MARGIN
“Operating margin” is a non-GAAP financial measure with no standard meaning under GAAP, which management uses to further evaluate the company’s results of operations in each
reporting period. Operating margin is calculated as revenue less operating expenses and therefore does not include depreciation and depletion. Operating margin is intended to provide
additional information only and does not have any standardized definition under IFRS; it should not be considered in isolation or as a substitute for measures of performance prepared in
accordance with IFRS. Other companies may calculate this measure differently and this measure is unlikely to be comparable to similar measures presented by other companies.
(5) ADJUSTED NET CASH GENERATED FROM OPERATIONS BEFORE CHANGES IN NON-CASH OPERATING WORKING CAPITAL
“Adjusted net cash generated from operations before changes in non-cash operating working capital” is a non-GAAP financial measure. Net cash generated from operations has been adjusted
for one-time charges incurred in the second quarter of 2013 related to the settlement of the company’s legacy gold hedge position and in the third quarter of 2013 related to the company’s
acquisition of the Rainy River project. There is also an adjustment to remove the impact of the change in non-cash operating working capital. The company believes the presentation of
adjusted net cash generated from operations before changes in non-cash operating working capital enables investors and analysts to better understand the underlying operating performance
of our core mining business. Adjusted net cash generated from operations before changes in non-cash operating working capital is intended to provide additional information only and does not
have any standardized meaning under IFRS. It should not be considered in isolation or as a substitute for measures of performance prepared in accordance with IFRS.

Contact information
67
Investor Relations
Hannes Portmann
Vice President, Corporate Development
416-324-6014