Embed Size (px)
Citation preview

12 March 2021
CorporatePresentation
Important noticeThis presentation shall be read in conjunction with Manulife US REIT’s financial results announcement dated 8 February 2021 published on SGXNet.
This presentation is for information purposes only and does not constitute or form part of an offer, invitation or solicitation of any offer to purchaseor subscribe for any securities of Manulife US REIT in Singapore or any other jurisdiction nor should it or any part of it form the basis of, or be reliedupon in connection with, any contract or commitment whatsoever. The value of units in Manulife US REIT (“Units”) and the income derived from themmay fall as well as rise. The Units are not obligations of, deposits in, or guaranteed by the Manager, DBS Trustee Limited (as trustee of Manulife USREIT) or any of their respective affiliates. The past performance of Manulife US REIT is not necessarily indicative of the future performance ofManulife US REIT.
This presentation may contain forward-looking statements that involve risks and uncertainties. Actual future performance, outcomes and resultsmay differ materially from those expressed in forward-looking statements as a result of a number of risks, uncertainties and assumptions. Theseforward-looking statements speak only as at the date of this presentation. No assurance can be given that future events will occur, that projectionswill be achieved, or that assumptions are correct. Representative examples of these factors include (without limitation) general industry andeconomic conditions, interest rate trends, cost of capital and capital availability, competition from similar developments, shifts in expected levels ofoffice rental revenue, changes in operating expenses, property expenses, governmental and public policy changes and the continued availability offinancing in the amounts and the terms necessary to support future business.
Investors are cautioned not to place undue reliance on these forward-looking statements, which are based on current view of management on futureevents.
Holders of Units (“Unitholders”) have no right to request that the Manager redeem or purchase their Units while the Units are listed. It is intendedthat Unitholders may only deal in their Units through trading on Singapore Exchange Securities Trading Limited (the “SGX-ST”). Listing of the Unitson the SGX-ST does not guarantee a liquid market for the Units.
Peachtree, Georgia
Key Highlights
Financial Highlights
Portfolio Performance
Looking Forward
Appendix: U.S. Outlook
Appendix: ESG Highlights
Appendix: About MUST
01
02
03
04
05
06
07
Content
Michelson, Irvine
5
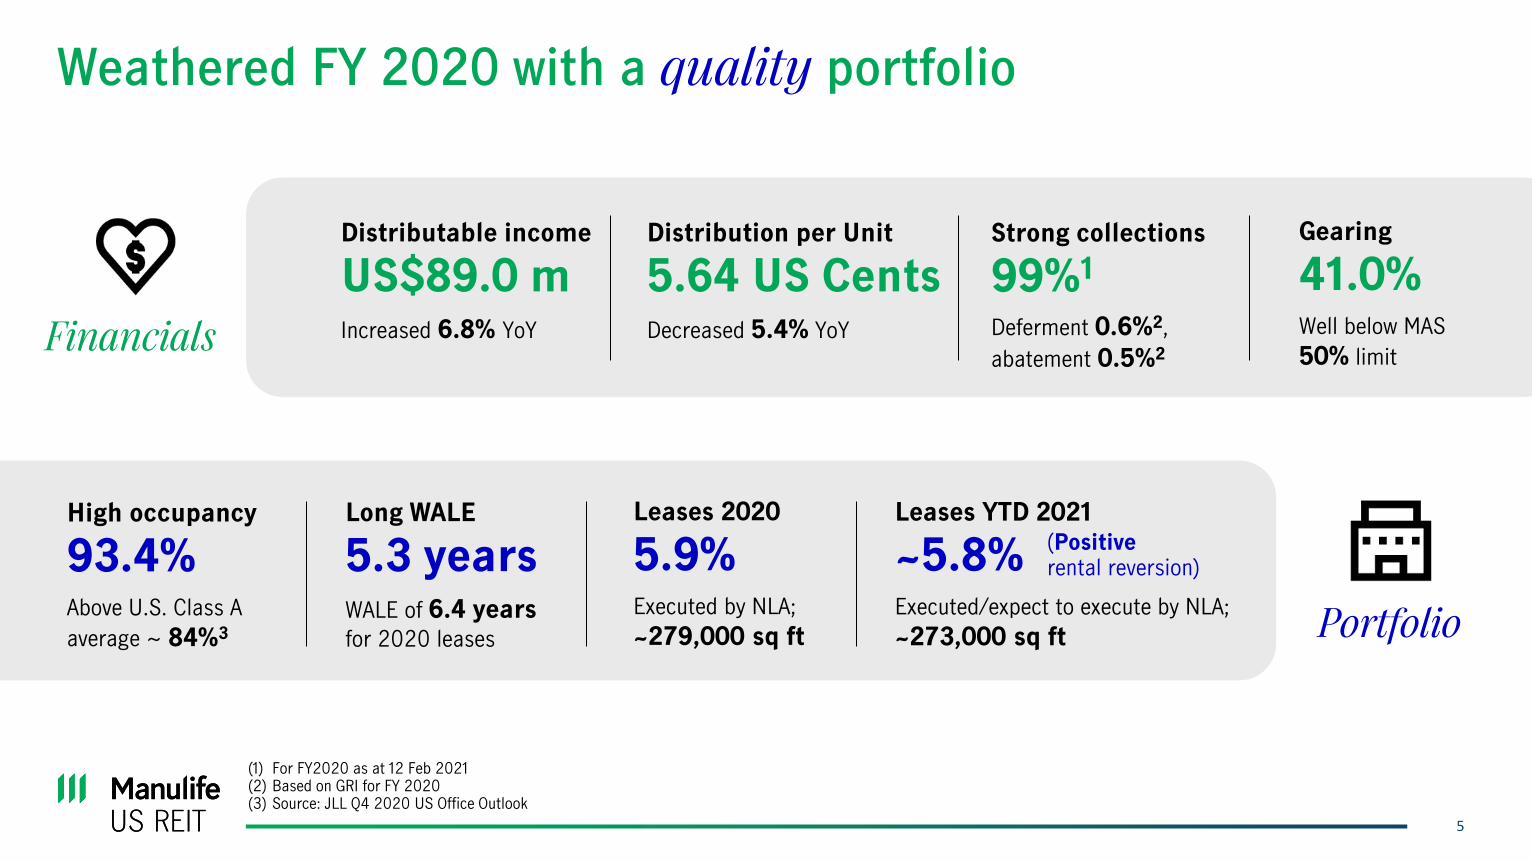
Weathered FY 2020 with a quality portfolio
(1) For FY2020 as at 12 Feb 2021(2) Based on GRI for FY 2020(3) Source: JLL Q4 2020 US Office Outlook
Long WALE
5.3 yearsWALE of 6.4 years for 2020 leases
High occupancy
93.4%Above U.S. Class A
average ~ 84%3
Distributable income
US$89.0 m Increased 6.8% YoY
Distribution per Unit
5.64 US CentsDecreased 5.4% YoY
Gearing
41.0%Well below MAS
50% limit
Strong collections
99%1
Deferment 0.6%2,
abatement 0.5%2Financials
Portfolio
Leases 2020
5.9%Executed by NLA;
~279,000 sq ft
Leases YTD 2021
~5.8%Executed/expect to execute by NLA;
~273,000 sq ft
(Positiverental reversion)

Centerpointe, Virginia

7
Higher FY 2020 NPI and DI YoY mainly due to:• Contributions from
Centerpointe and Capitol acquired in 2019
FY 2020 distributable income increased by 6.8% YoY
2H 2020(US$’000)
2H 2019(US$’000)
Change (%)
FY 2020(US$’000)
FY 2019(US$’000)
Change(%)
Gross Revenue
95,682 94,514 1.2 194,312 177,853 9.3
Net Property Income (NPI)
53,664 58,434 (8.2) 115,837 110,776 4.6
Distributable Income (DI)
40,989 43,374 (5.5) 88,967 83,341 6.8
DPU (US cents)
2.59 2.92 (11.3) 5.64 5.96 (5.4)
Note: Please refer to the FY 2020 financial statements dated 8 Feb 2021 published on SGXNet
Lower FY 2020 DPU due to 2H 2020:• Lower property income• Provision for expected credit
losses ✓ 50% recovered as at
10 Feb 2021

8
115.8
14.5 16.0 11.27.3
18.9
10.2 12.4 11.0 14.3
110.8
16.0 19.013.0
9.0
21.0
10.2 13.26.8
2.6
Portfolio Figueroa Michelson Peachtree Plaza Exchange Penn Phipps Centerpointe Capitol
FY 2020 FY 2019
Delivering robust income through fortified portfolio
NPI growth mainly due to contributions from Centerpointe and Capitol acquired in 2019, partially offset by:• Lower carpark income• Lower rental income due to higher vacancies in Michelson and Peachtree• Provision for expected credit losses on trade receivables
✓ 50% recovered as at 10 Feb 2021
(1) Centerpointe was acquired on 10 May 2019 (U.S. Time). Please refer to SGX announcement dated 13 May 2019 on completion of acquisition(2) Capitol was acquired on 29 Oct 2019 (U.S. Time). Please refer to SGX announcement dated 30 Oct 2019 on completion of acquisition
1 2
+4.6%
NPI (US$ m)
9
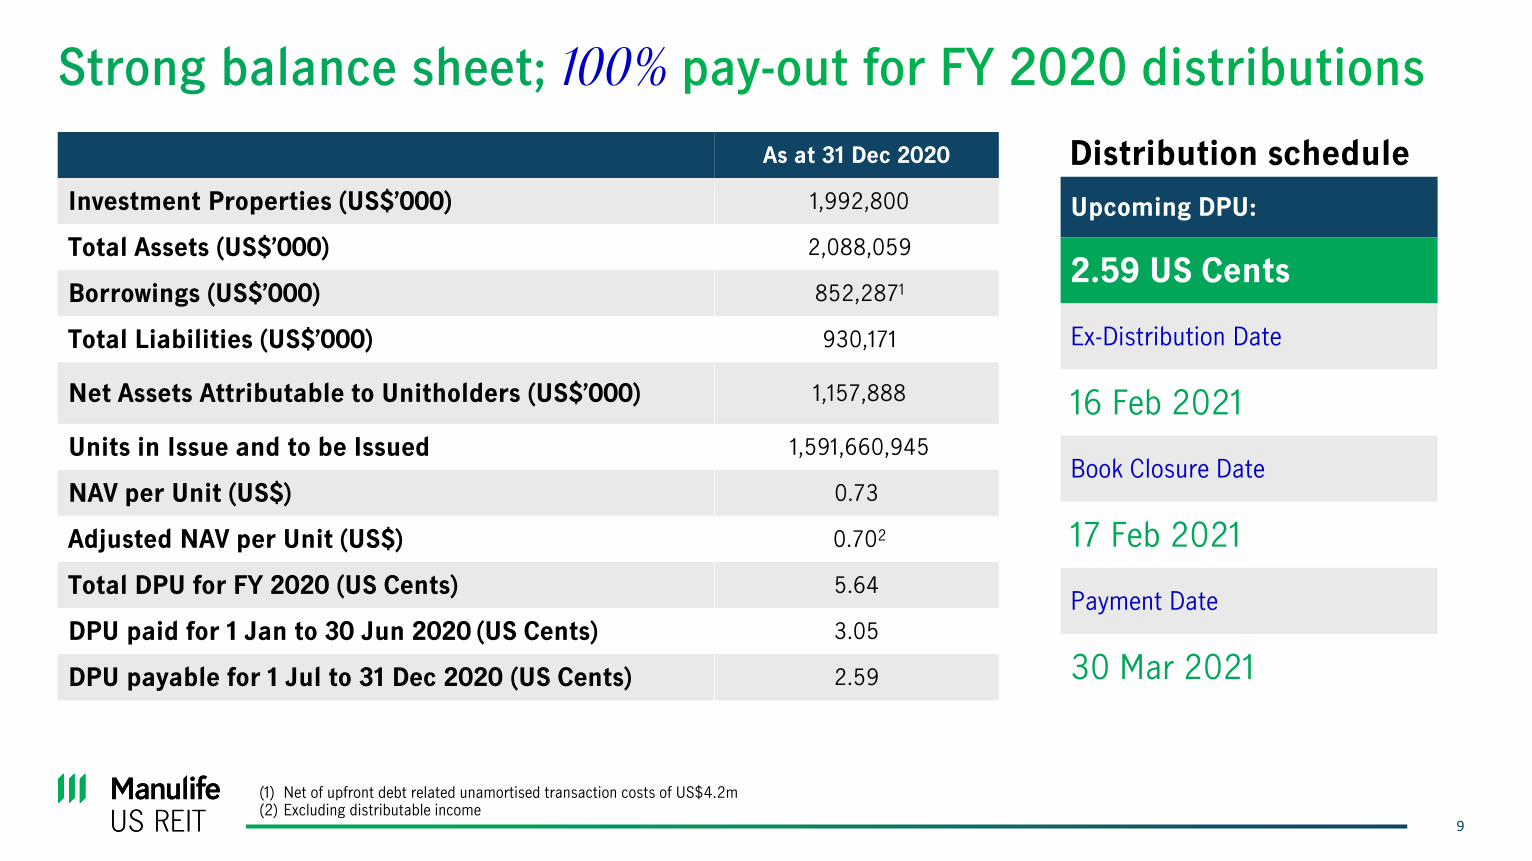
Strong balance sheet; 100% pay-out for FY 2020 distributions
As at 31 Dec 2020
Investment Properties (US$’000) 1,992,800
Total Assets (US$’000) 2,088,059
Borrowings (US$’000) 852,2871
Total Liabilities (US$’000) 930,171
Net Assets Attributable to Unitholders (US$’000) 1,157,888
Units in Issue and to be Issued 1,591,660,945
NAV per Unit (US$) 0.73
Adjusted NAV per Unit (US$) 0.702
Total DPU for FY 2020 (US Cents) 5.64
DPU paid for 1 Jan to 30 Jun 2020 (US Cents) 3.05
DPU payable for 1 Jul to 31 Dec 2020 (US Cents) 2.59
Distribution schedule
Upcoming DPU:
2.59 US Cents
Ex-Distribution Date
16 Feb 2021
Book Closure Date
17 Feb 2021
Payment Date
30 Mar 2021
(1) Net of upfront debt related unamortised transaction costs of US$4.2m(2) Excluding distributable income
10
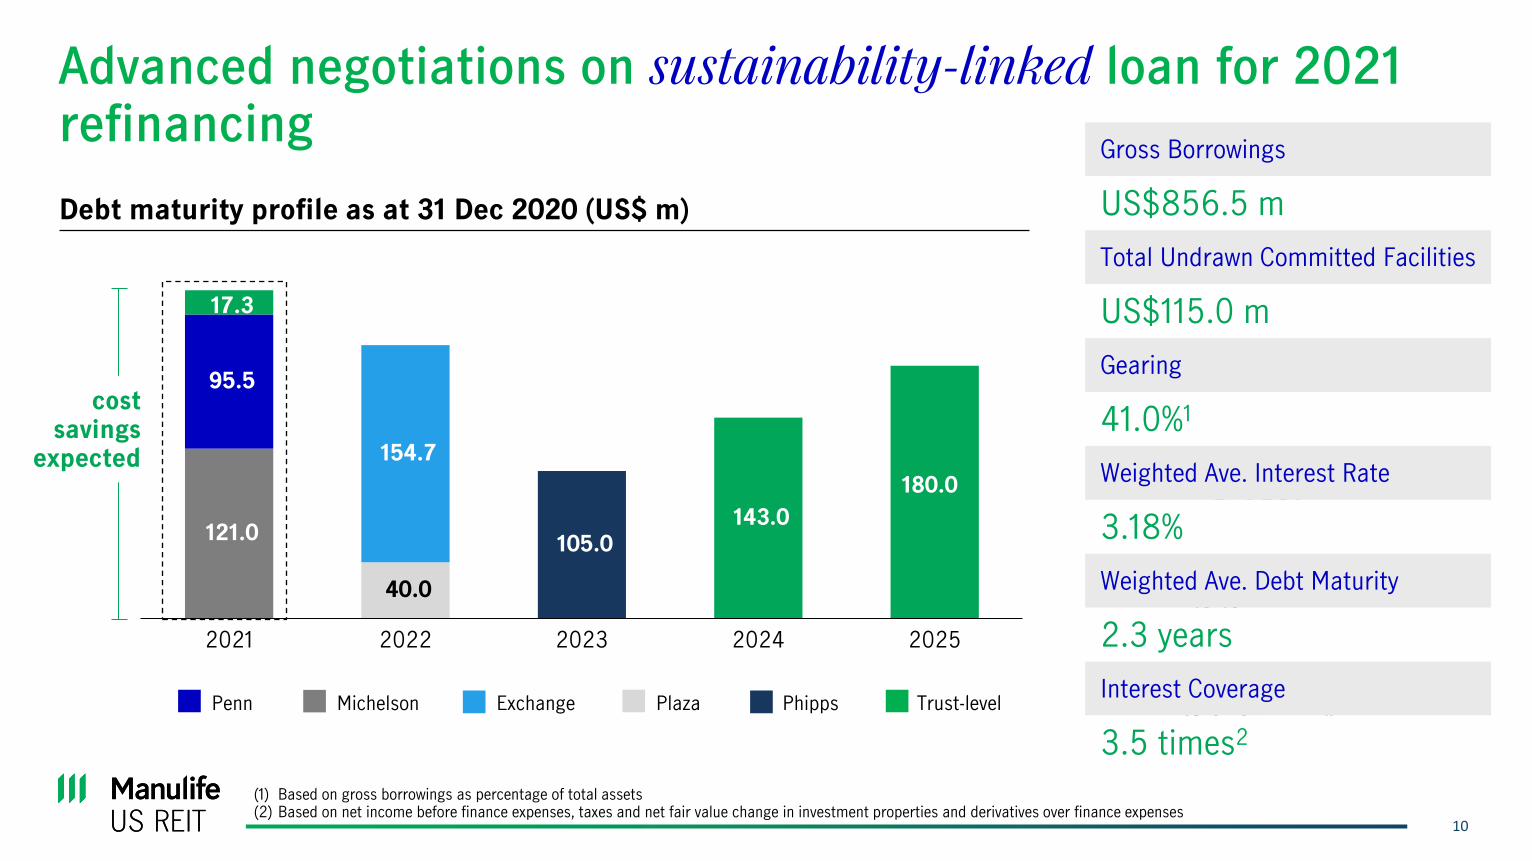
Advanced negotiations on sustainability-linked loan for 2021 refinancing
121.0
40.0
154.7
95.5
105.0
17.3
143.0
180.0
2021 2022 2023 2024 2025
(1) Based on gross borrowings as percentage of total assets(2) Based on net income before finance expenses, taxes and net fair value change in investment properties and derivatives over finance expenses
Debt maturity profile as at 31 Dec 2020 (US$ m)
Penn Michelson Exchange Plaza Phipps Trust-level
cost savings
expected
Gearing Ratio
41.0%3
Weighted Ave. Interest Rate
3.18%
Weighted Ave. Debt Maturity
2.3 years
Gross Borrowings
US$856.5 m
Interest Coverage
3.5 times4
Total Undrawn Facilities
US$115.0 m
Gross Borrowings
US$856.5 m
Total Undrawn Committed Facilities
US$115.0 m
Gearing
41.0%1
Weighted Ave. Interest Rate
3.18%
Weighted Ave. Debt Maturity
2.3 years
Interest Coverage
3.5 times2
Phipps, Georgia
12
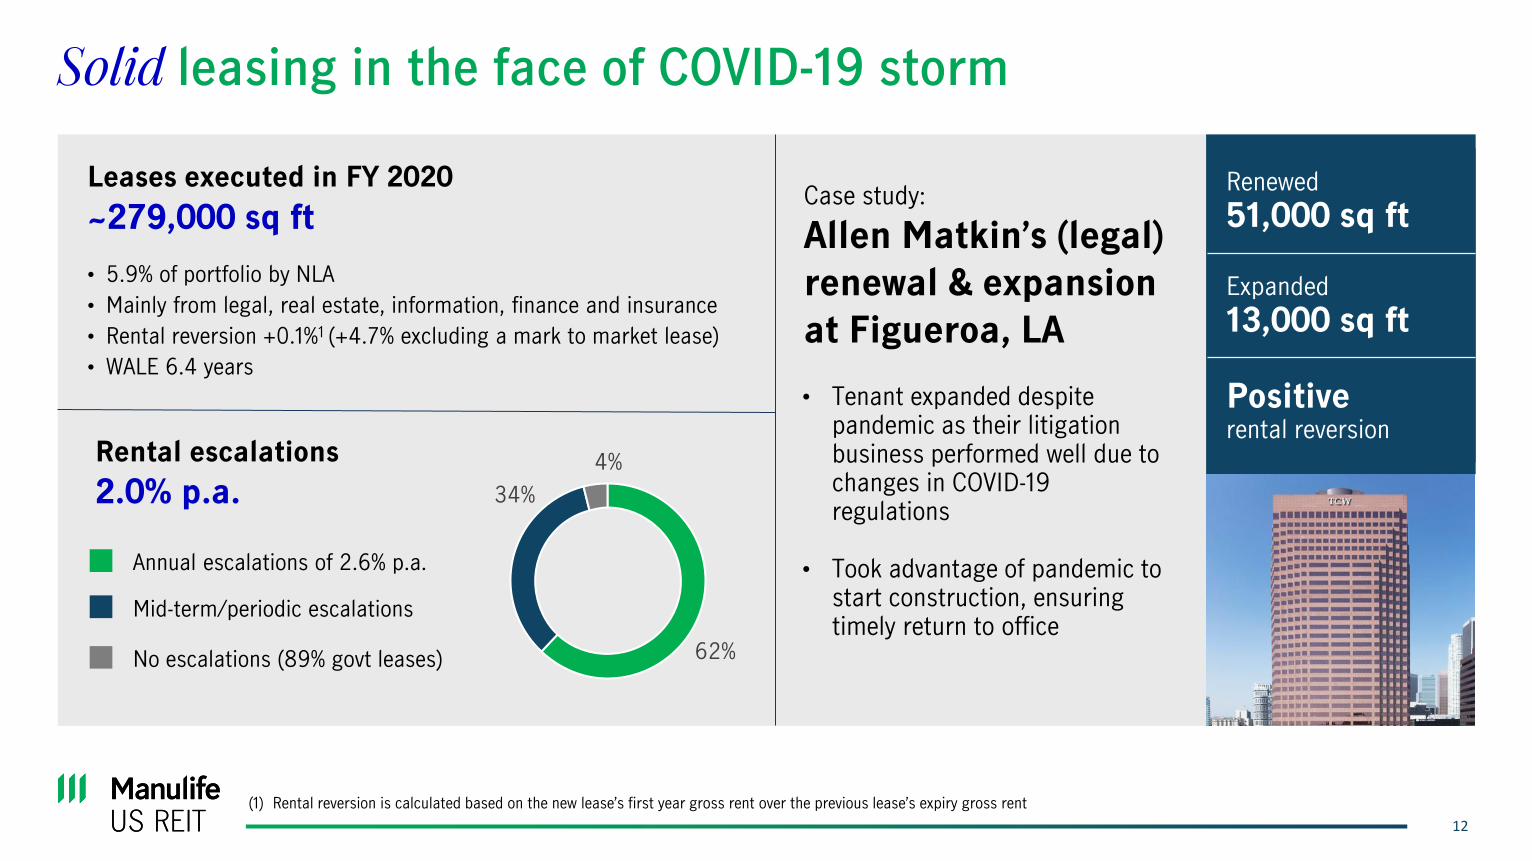
Solid leasing in the face of COVID-19 storm
Case study:
Allen Matkin’s (legal)
renewal & expansion
at Figueroa, LA
• Tenant expanded despite pandemic as their litigation business performed well due to changes in COVID-19 regulations
• Took advantage of pandemic to start construction, ensuring timely return to office
Leases executed in FY 2020
~279,000 sq ft
• 5.9% of portfolio by NLA
• Mainly from legal, real estate, information, finance and insurance
• Rental reversion +0.1%1 (+4.7% excluding a mark to market lease)
• WALE 6.4 years
Rental escalations
2.0% p.a.
Renewed
51,000 sq ft
Expanded
13,000 sq ft
Positive rental reversion
62%
34%
4%
Annual escalations of 2.6% p.a.
Mid-term/periodic escalations
No escalations (89% govt leases)
(1) Rental reversion is calculated based on the new lease’s first year gross rent over the previous lease’s expiry gross rent
13
9.5 10.2
48.1
9.5 10.7
47.3
2021 2022 2023 2024 2025 2026 and beyond
Gross Rental Income Net Lettable Area
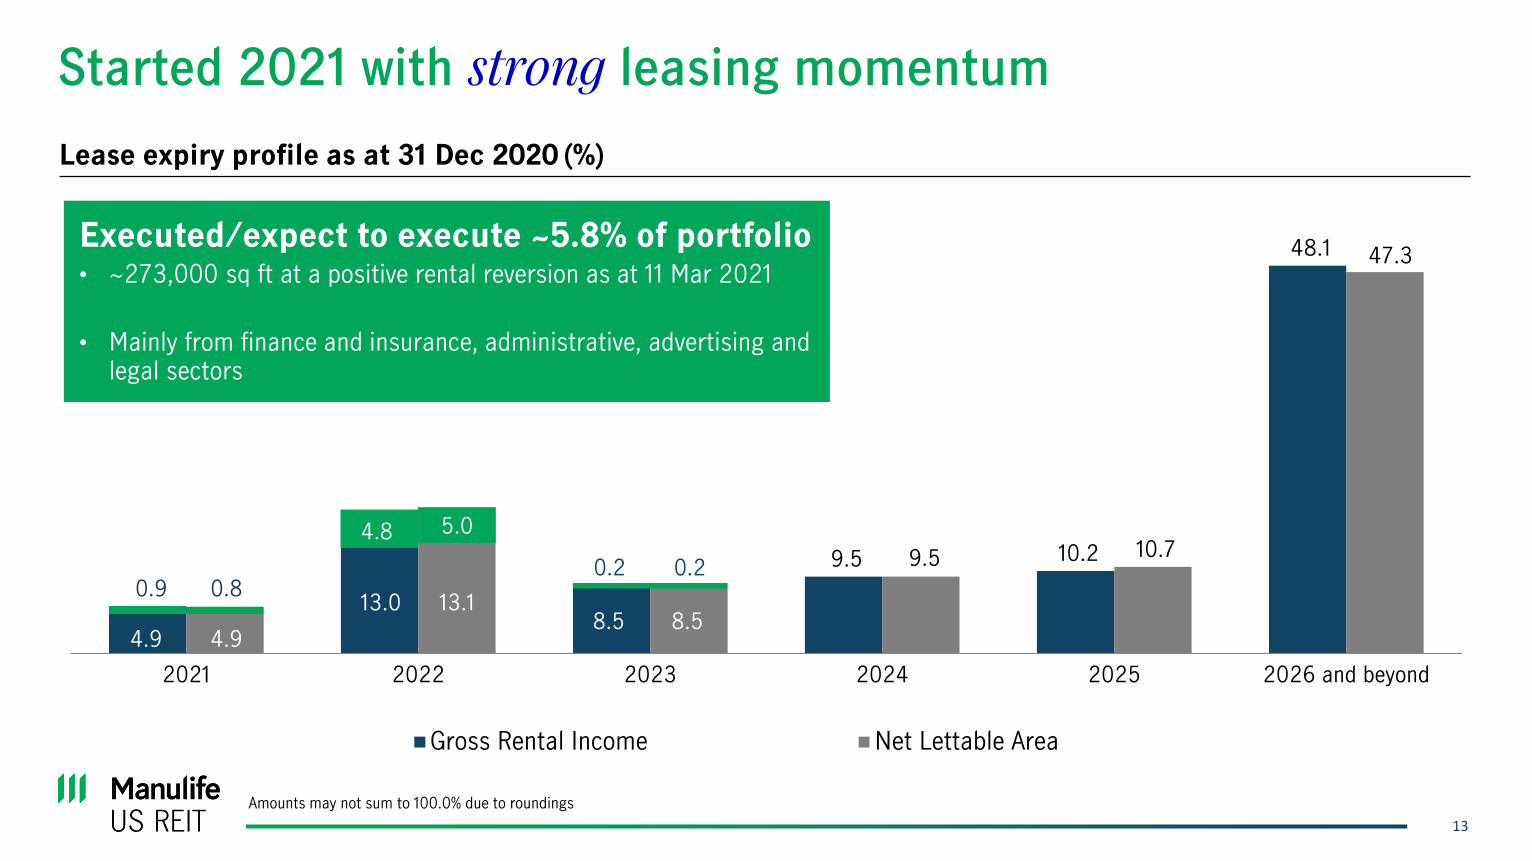
Lease expiry profile as at 31 Dec 2020 (%)
Started 2021 with strong leasing momentum
0.9
Executed/expect to execute ~5.8% of portfolio• ~273,000 sq ft at a positive rental reversion as at 11 Mar 2021
• Mainly from finance and insurance, administrative, advertising and legal sectors
4.9
0.8
4.9
4.8
13.0
5.0
13.1
0.2
8.5
0.2
8.5
Amounts may not sum to 100.0% due to roundings
14
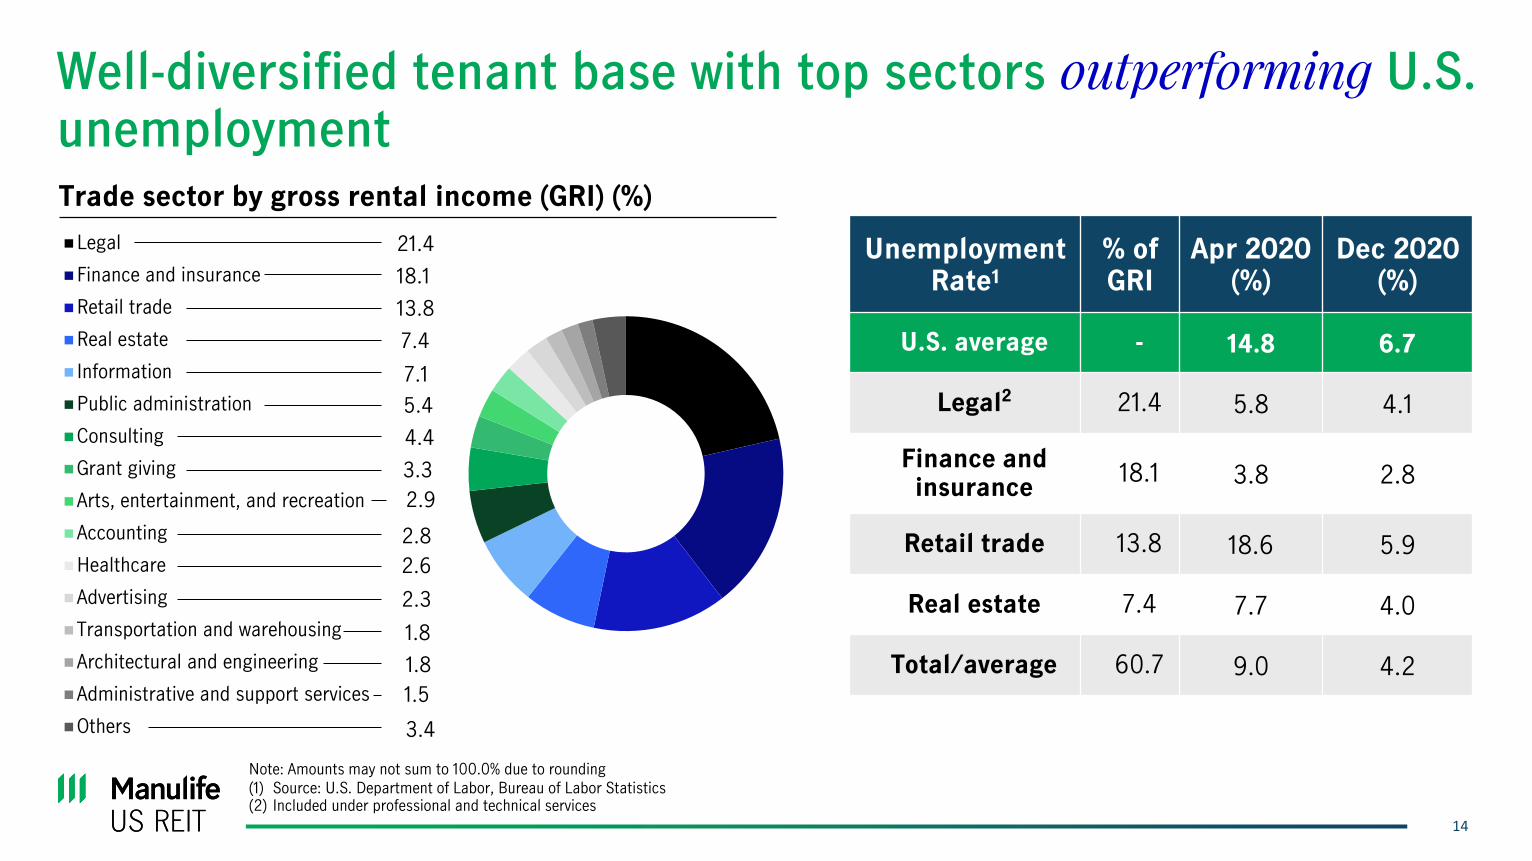
Well-diversified tenant base with top sectors outperforming U.S. unemployment
Legal
Finance and insurance
Retail trade
Real estate
Information
Public administration
Consulting
Grant giving
Arts, entertainment, and recreation
Accounting
Healthcare
Advertising
Transportation and warehousing
Architectural and engineering
Administrative and support services
Others
21.4
18.1
13.8
7.4
7.1
5.4
4.4
3.3
2.9
2.8
2.3
2.6
1.8
1.8
1.5
3.4
Note: Amounts may not sum to 100.0% due to rounding
Trade sector by gross rental income (GRI) (%)
Unemployment Rate1
% of GRI
Apr 2020 (%)
Dec 2020 (%)
U.S. average - 14.8 6.7
Legal2 21.4 5.8 4.1
Finance and insurance
18.1 3.8 2.8
Retail trade 13.8 18.6 5.9
Real estate 7.4 7.7 4.0
Total/average 60.7 9.0 4.2
(1) Source: U.S. Department of Labor, Bureau of Labor Statistics(2) Included under professional and technical services
15
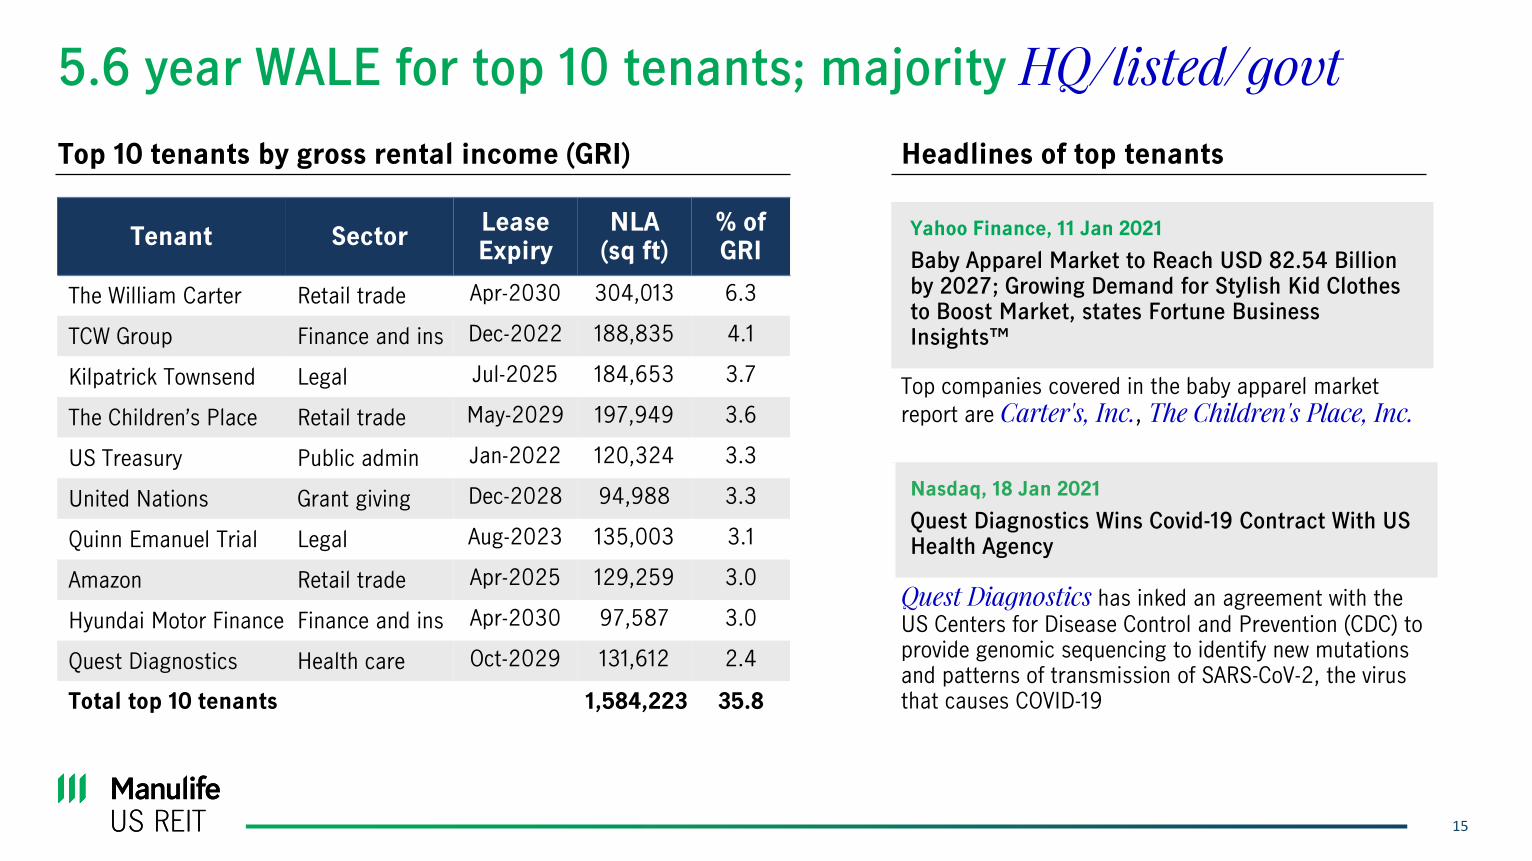
5.6 year WALE for top 10 tenants; majority HQ/listed/govt
Top 10 tenants by gross rental income (GRI)
Tenant SectorLease Expiry
NLA(sq ft)
% of GRI
The William Carter Retail trade Apr-2030 304,013 6.3
TCW Group Finance and ins Dec-2022 188,835 4.1
Kilpatrick Townsend Legal Jul-2025 184,653 3.7
The Children’s Place Retail trade May-2029 197,949 3.6
US Treasury Public admin Jan-2022 120,324 3.3
United Nations Grant giving Dec-2028 94,988 3.3
Quinn Emanuel Trial Legal Aug-2023 135,003 3.1
Amazon Retail trade Apr-2025 129,259 3.0
Hyundai Motor Finance Finance and ins Apr-2030 97,587 3.0
Quest Diagnostics Health care Oct-2029 131,612 2.4
Total top 10 tenants 1,584,223 35.8
Yahoo Finance, 11 Jan 2021
Baby Apparel Market to Reach USD 82.54 Billion by 2027; Growing Demand for Stylish Kid Clothes to Boost Market, states Fortune Business Insights™
Top companies covered in the baby apparel market
report are Carter's, Inc., The Children's Place, Inc.
Nasdaq, 18 Jan 2021
Quest Diagnostics Wins Covid-19 Contract With US Health Agency
Quest Diagnostics has inked an agreement with the US Centers for Disease Control and Prevention (CDC) to provide genomic sequencing to identify new mutations and patterns of transmission of SARS-CoV-2, the virus that causes COVID-19
Headlines of top tenants
16
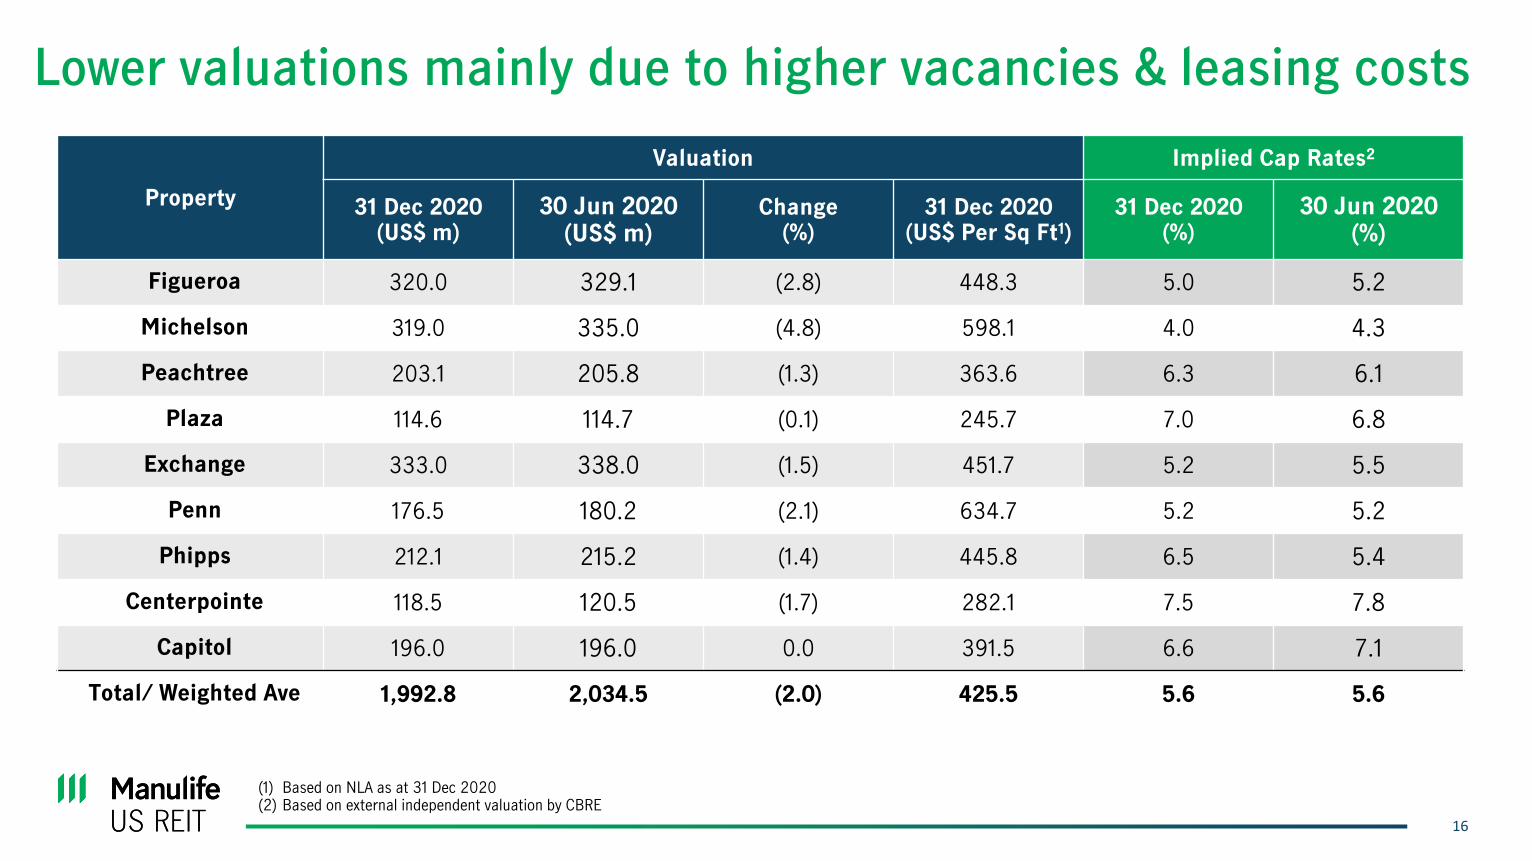
Lower valuations mainly due to higher vacancies & leasing costs
Property
Valuation Implied Cap Rates2
31 Dec 2020(US$ m)
30 Jun 2020(US$ m)
Change (%)
31 Dec 2020(US$ Per Sq Ft1)
31 Dec 2020(%)
30 Jun 2020(%)
Figueroa 320.0 329.1 (2.8) 448.3 5.0 5.2
Michelson 319.0 335.0 (4.8) 598.1 4.0 4.3
Peachtree 203.1 205.8 (1.3) 363.6 6.3 6.1
Plaza 114.6 114.7 (0.1) 245.7 7.0 6.8
Exchange 333.0 338.0 (1.5) 451.7 5.2 5.5
Penn 176.5 180.2 (2.1) 634.7 5.2 5.2
Phipps 212.1 215.2 (1.4) 445.8 6.5 5.4
Centerpointe 118.5 120.5 (1.7) 282.1 7.5 7.8
Capitol 196.0 196.0 0.0 391.5 6.6 7.1
Total/ Weighted Ave 1,992.8 2,034.5 (2.0) 425.5 5.6 5.6
(1) Based on NLA as at 31 Dec 2020(2) Based on external independent valuation by CBRE
17
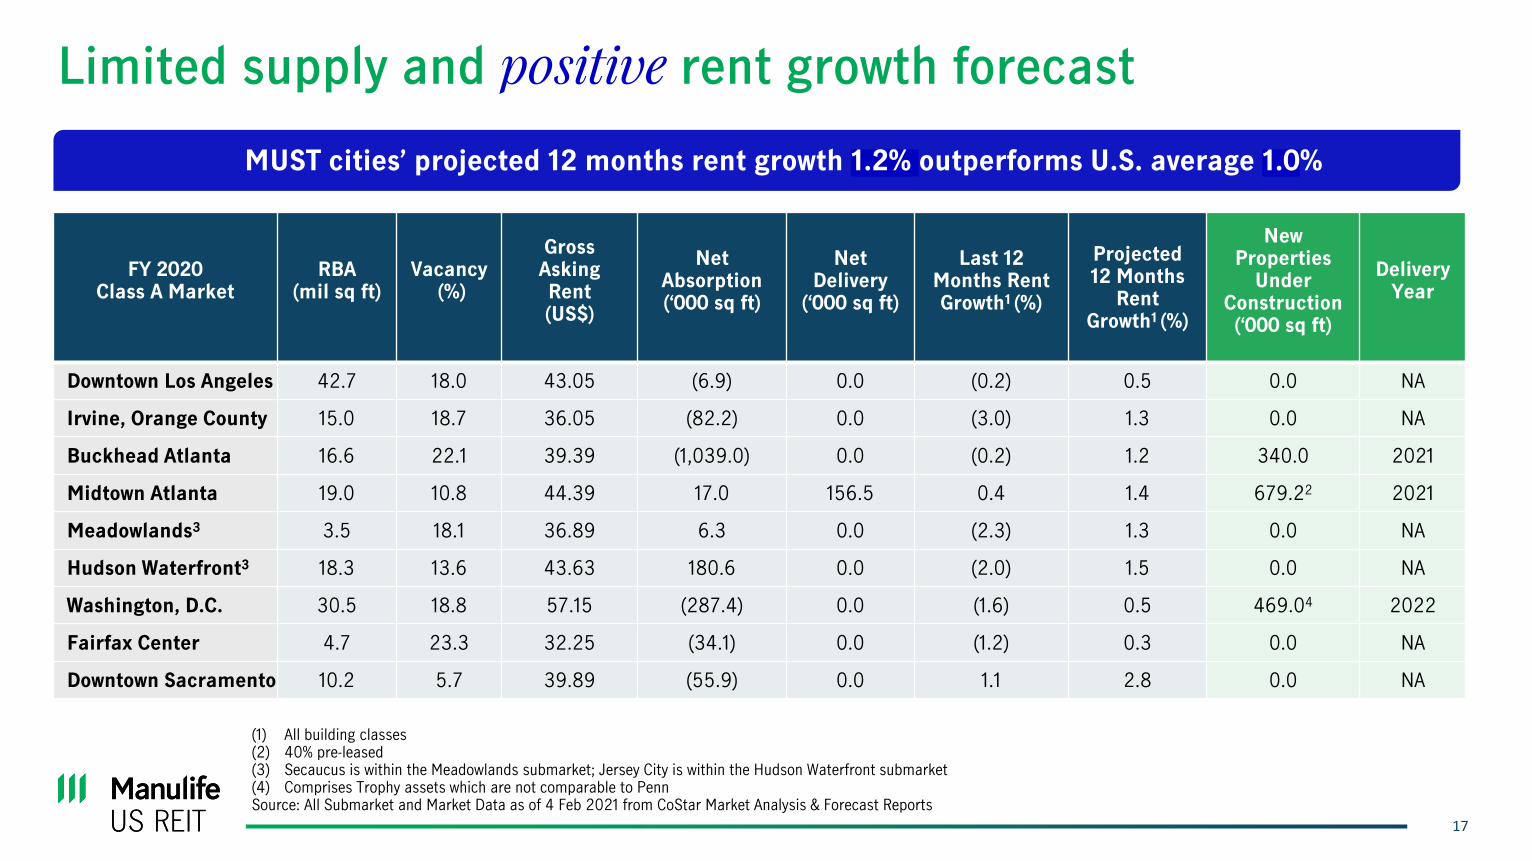
Limited supply and positive rent growth forecast
FY 2020Class A Market
RBA(mil sq ft)
Vacancy(%)
Gross Asking Rent(US$)
Net Absorption(‘000 sq ft)
Net Delivery
(‘000 sq ft)
Last 12Months Rent Growth1 (%)
Projected 12 Months
Rent Growth1 (%)
New Properties
Under Construction(‘000 sq ft)
Delivery Year
Downtown Los Angeles 42.7 18.0 43.05 (6.9) 0.0 (0.2) 0.5 0.0 NA
Irvine, Orange County 15.0 18.7 36.05 (82.2) 0.0 (3.0) 1.3 0.0 NA
Buckhead Atlanta 16.6 22.1 39.39 (1,039.0) 0.0 (0.2) 1.2 340.0 2021
Midtown Atlanta 19.0 10.8 44.39 17.0 156.5 0.4 1.4 679.22 2021
Meadowlands3 3.5 18.1 36.89 6.3 0.0 (2.3) 1.3 0.0 NA
Hudson Waterfront3 18.3 13.6 43.63 180.6 0.0 (2.0) 1.5 0.0 NA
Washington, D.C. 30.5 18.8 57.15 (287.4) 0.0 (1.6) 0.5 469.04 2022
Fairfax Center 4.7 23.3 32.25 (34.1) 0.0 (1.2) 0.3 0.0 NA
Downtown Sacramento 10.2 5.7 39.89 (55.9) 0.0 1.1 2.8 0.0 NA
(1) All building classes(2) 40% pre-leased(3) Secaucus is within the Meadowlands submarket; Jersey City is within the Hudson Waterfront submarket(4) Comprises Trophy assets which are not comparable to Penn Source: All Submarket and Market Data as of 4 Feb 2021 from CoStar Market Analysis & Forecast Reports
MUST cities’ projected 12 months rent growth 1.2% outperforms U.S. average 1.0%
18
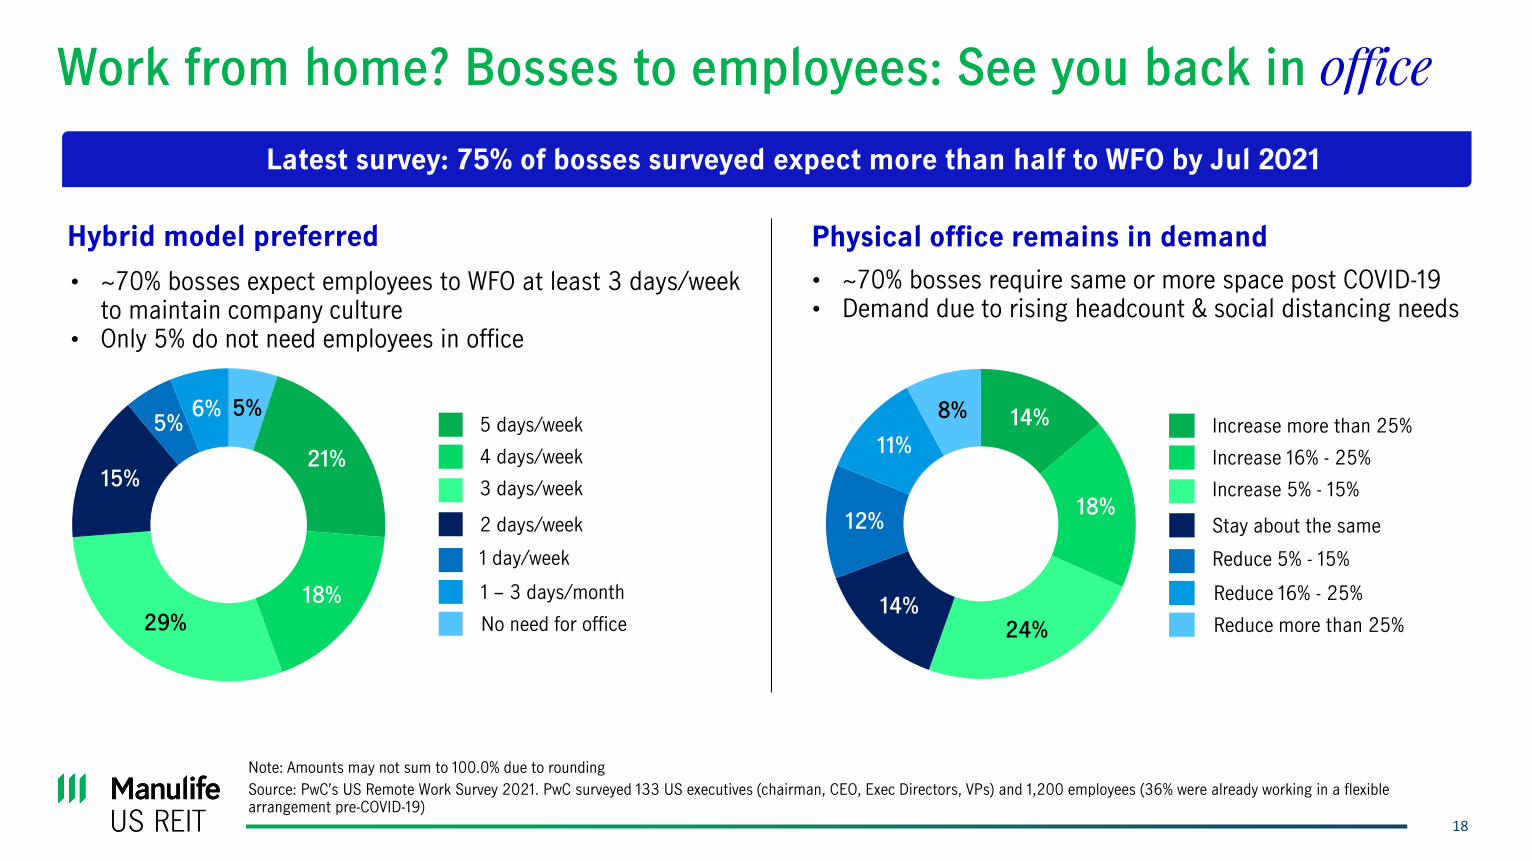
Work from home? Bosses to employees: See you back in office
Latest survey: 75% of bosses surveyed expect more than half to WFO by Jul 2021
Source: PwC’s US Remote Work Survey 2021. PwC surveyed 133 US executives (chairman, CEO, Exec Directors, VPs) and 1,200 employees (36% were already working in a flexible arrangement pre-COVID-19)
Physical office remains in demandHybrid model preferred
• ~70% bosses expect employees to WFO at least 3 days/week to maintain company culture
• Only 5% do not need employees in office
• ~70% bosses require same or more space post COVID-19• Demand due to rising headcount & social distancing needs
5%
21%
18%
29%
15%
5%6%
3 days/week
1 – 3 days/month
5 days/week
4 days/week
2 days/week
1 day/week
No need for office
14%
18%
24%14%
12%
11%
8%
Increase 5% - 15%
Reduce 16% - 25%
Increase more than 25%
Increase 16% - 25%
Stay about the same
Reduce 5% - 15%
Reduce more than 25%
Note: Amounts may not sum to 100.0% due to rounding
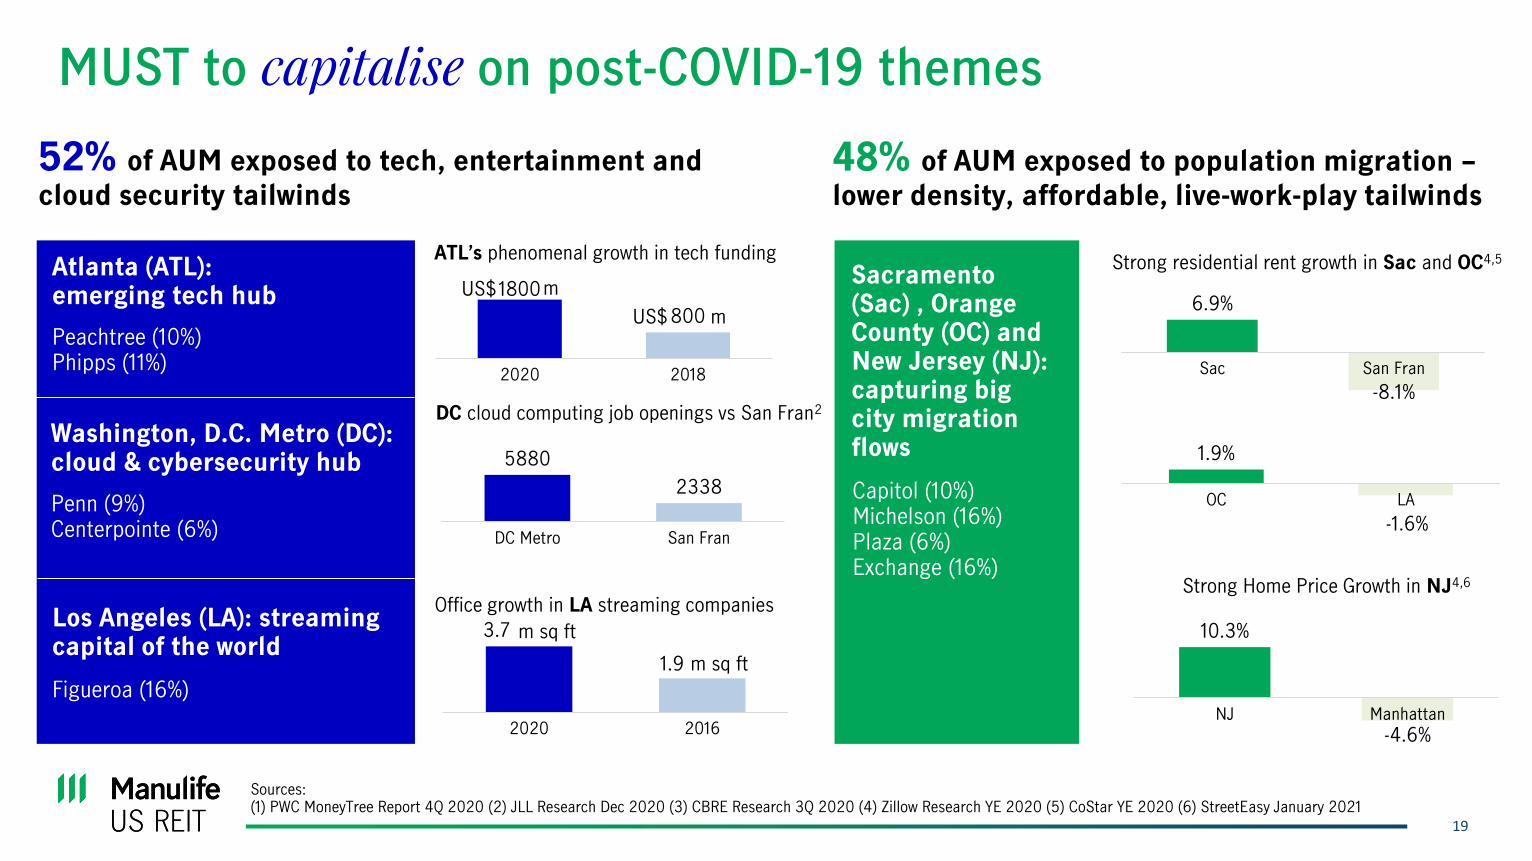
MUST to capitalise on post-COVID-19 themes
19
52% of AUM exposed to tech, entertainment and
cloud security tailwinds
48% of AUM exposed to population migration –
lower density, affordable, live-work-play tailwinds
1800
800
2020 2018
5880
2338
DC Metro San Fran
3.7
1.9
2020 2016
ATL’s phenomenal growth in tech funding
DC cloud computing job openings vs San Fran2
Office growth in LA streaming companies
Atlanta (ATL): emerging tech hub
Peachtree (10%)Phipps (11%)
Washington, D.C. Metro (DC): cloud & cybersecurity hub
Penn (9%)Centerpointe (6%)
Los Angeles (LA): streaming capital of the world
Figueroa (16%)
Sacramento (Sac) , Orange County (OC) and New Jersey (NJ): capturing big city migration flows
Capitol (10%)Michelson (16%)Plaza (6%)Exchange (16%)
Strong residential rent growth in Sac and OC4,5
Strong Home Price Growth in NJ4,6
6.9%
-8.1%
Sac San Fran
1.9%
-1.6%
OC LA
10.3%
-4.6%NJ Manhattan
Sources:(1) PWC MoneyTree Report 4Q 2020 (2) JLL Research Dec 2020 (3) CBRE Research 3Q 2020 (4) Zillow Research YE 2020 (5) CoStar YE 2020 (6) StreetEasy January 2021
US$ m
US$ m
m sq ft
m sq ft
Plaza, Secaucus
21
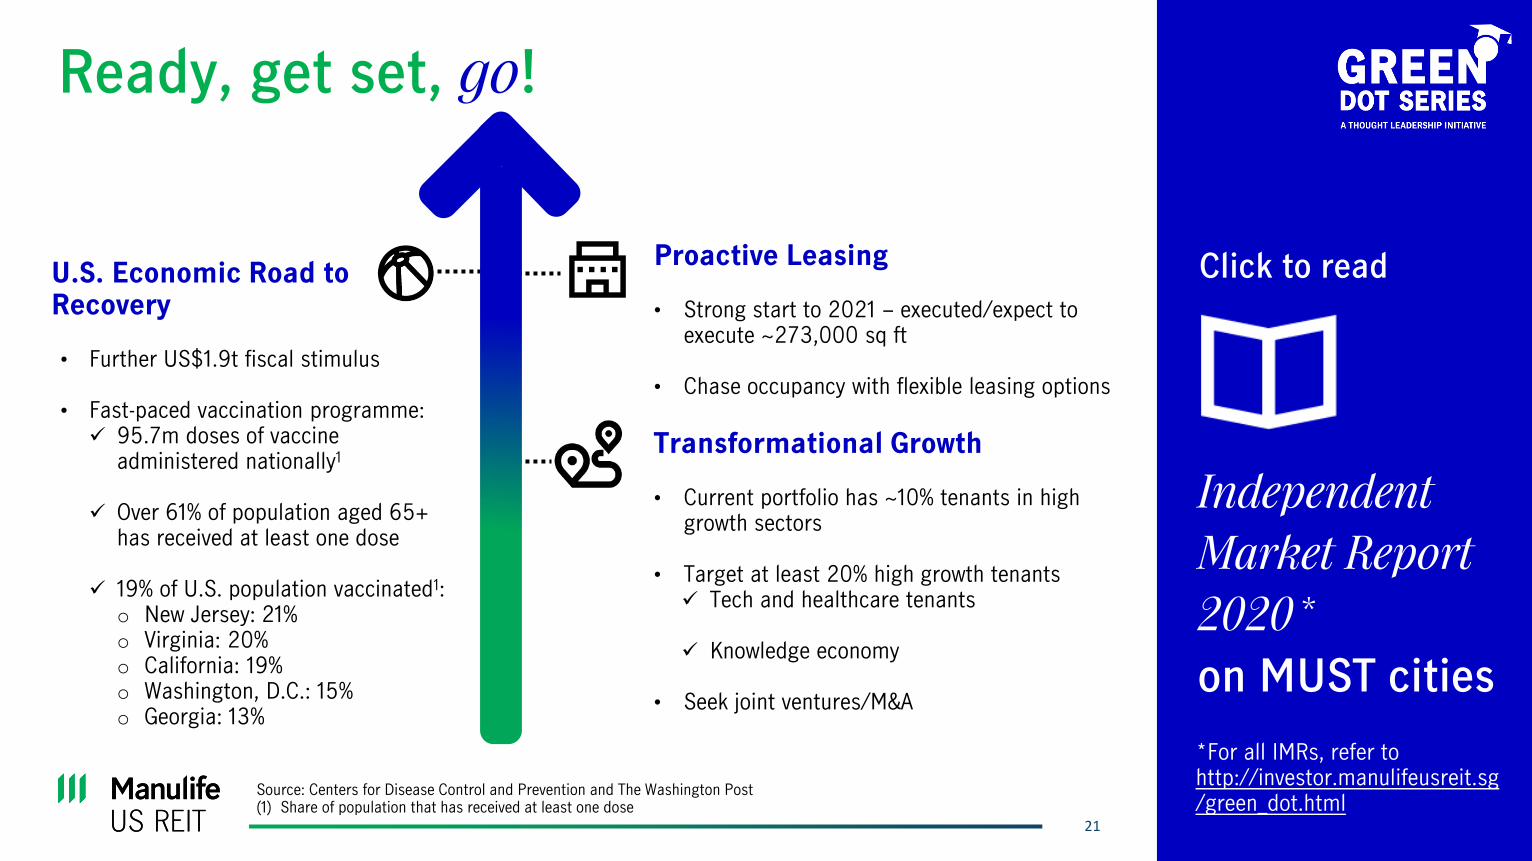
Ready, get set, go!
Independent
Market Report
2020*
on MUST cities
21
Click to readU.S. Economic Road to Recovery
• Further US$1.9t fiscal stimulus
• Fast-paced vaccination programme:✓ 95.7m doses of vaccine
administered nationally1
✓ Over 61% of population aged 65+ has received at least one dose
✓ 19% of U.S. population vaccinated1:o New Jersey: 21%o Virginia: 20%o California: 19%o Washington, D.C.: 15%o Georgia: 13%
Transformational Growth
• Current portfolio has ~10% tenants in high growth sectors
• Target at least 20% high growth tenants✓ Tech and healthcare tenants
✓ Knowledge economy
• Seek joint ventures/M&A
Proactive Leasing
• Strong start to 2021 – executed/expect to execute ~273,000 sq ft
• Chase occupancy with flexible leasing options
*For all IMRs, refer to http://investor.manulifeusreit.sg/green_dot.html
Source: Centers for Disease Control and Prevention and The Washington Post(1) Share of population that has received at least one dose
Michelson, Irvine
Thank You!
Manulife US Real Estate Management Pte. Ltd.
(Company registration no. 201503253R)
8 Cross Street, #16-03 Manulife Tower, Singapore 048424
http://www.manulifeusreit.sg
For enquiries, please contact:
Ms Caroline Fong
Chief Investor Relations and Capital Market Officer
(65) 6801 1066
Penn, Washington, D.C.
24
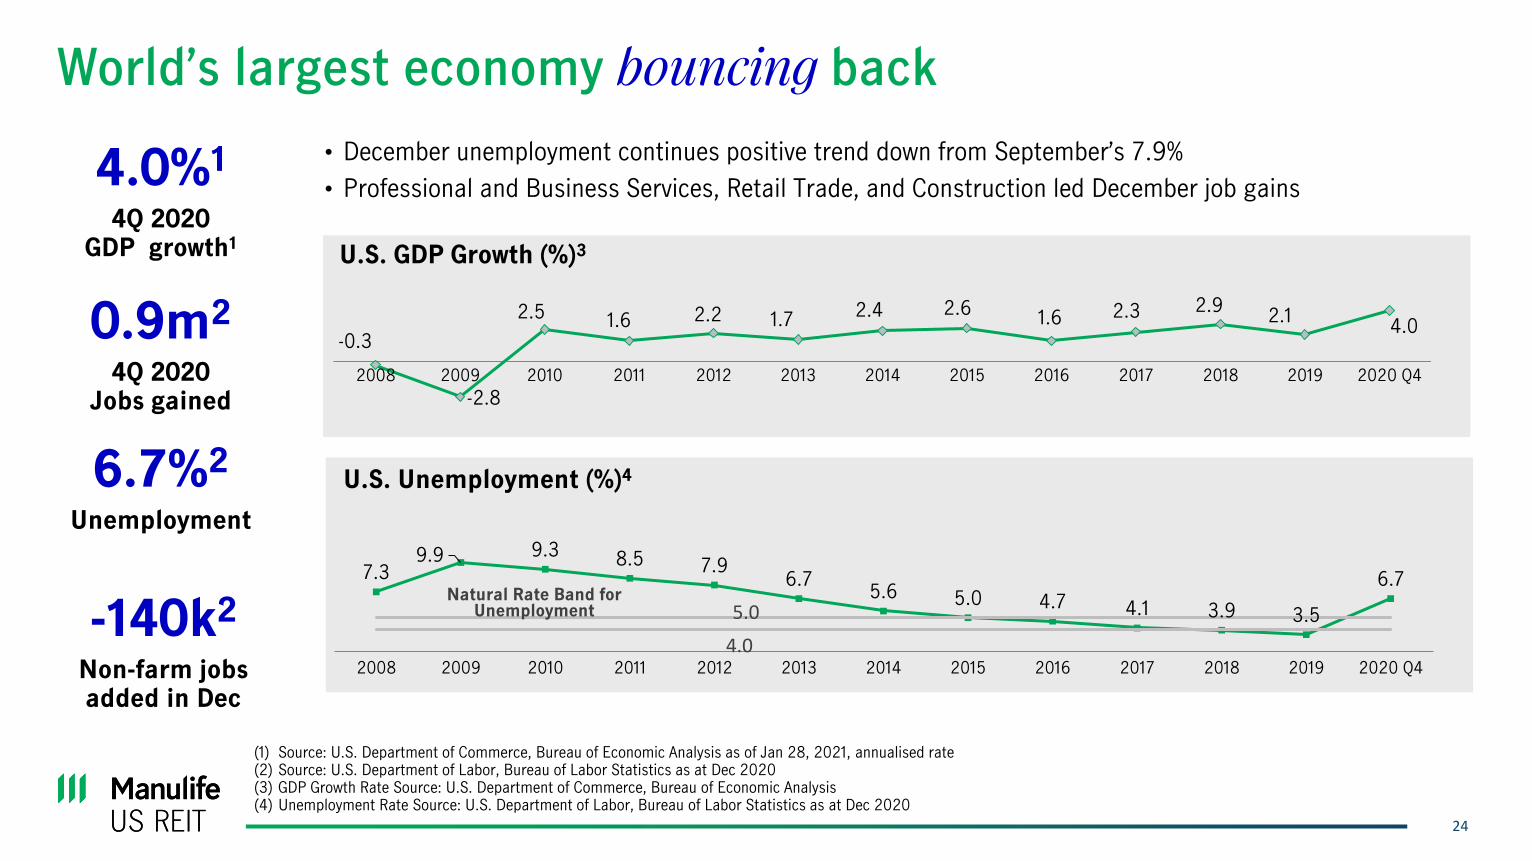
World’s largest economy bouncing back
• December unemployment continues positive trend down from September’s 7.9%
• Professional and Business Services, Retail Trade, and Construction led December job gains
(1) Source: U.S. Department of Commerce, Bureau of Economic Analysis as of Jan 28, 2021, annualised rate(2) Source: U.S. Department of Labor, Bureau of Labor Statistics as at Dec 2020(3) GDP Growth Rate Source: U.S. Department of Commerce, Bureau of Economic Analysis(4) Unemployment Rate Source: U.S. Department of Labor, Bureau of Labor Statistics as at Dec 2020
U.S. GDP Growth (%)3
U.S. Unemployment (%)4
7.39.9 9.3 8.5 7.9
6.75.6 5.0 4.7 4.1 3.9 3.5
6.7
2008 2009 2010 2011 2012 2013 2014 2015 2016 2017 2018 2019 2020 Q4
Natural Rate Band for Unemployment
4.0
5.0
-0.3
-2.8
2.5 1.6 2.2 1.7 2.4 2.61.6 2.3 2.9
2.14.0
2008 2009 2010 2011 2012 2013 2014 2015 2016 2017 2018 2019 2020 Q4
6.7%2
Unemployment
4.0%1
4Q 2020GDP growth1
0.9m2
4Q 2020 Jobs gained
-140k2
Non-farm jobsadded in Dec
25
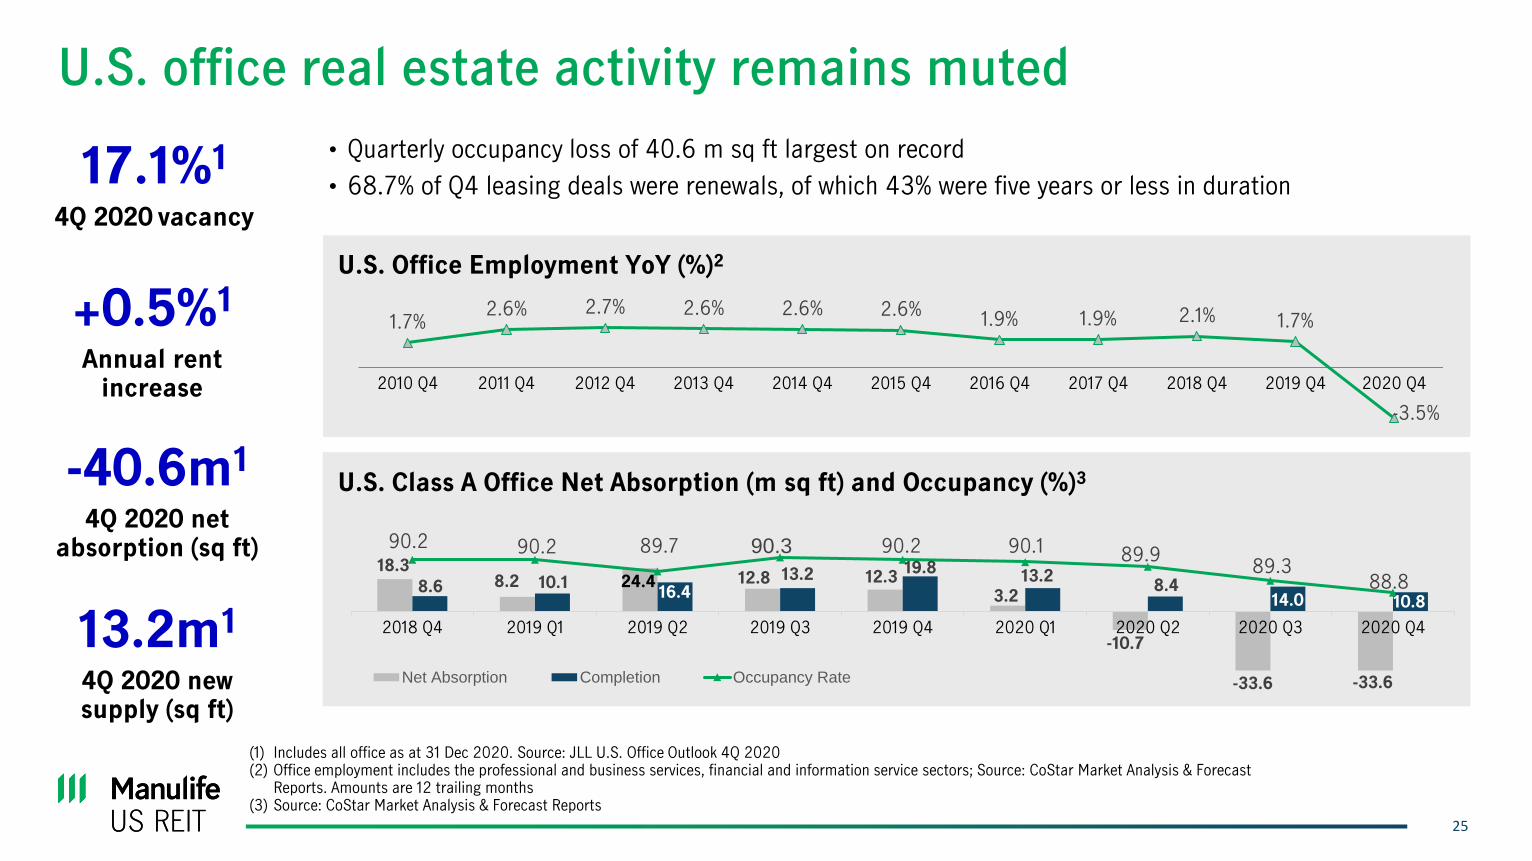
U.S. office real estate activity remains muted
• Quarterly occupancy loss of 40.6 m sq ft largest on record
• 68.7% of Q4 leasing deals were renewals, of which 43% were five years or less in duration
+0.5%1
Annual rent increase
17.1%1
4Q 2020 vacancy
13.2m1
4Q 2020 new supply (sq ft)
-40.6m1
4Q 2020 net absorption (sq ft)
U.S. Office Employment YoY (%)2
1.7%2.6% 2.7% 2.6% 2.6% 2.6%
1.9% 1.9% 2.1% 1.7%
-3.5%
2010 Q4 2011 Q4 2012 Q4 2013 Q4 2014 Q4 2015 Q4 2016 Q4 2017 Q4 2018 Q4 2019 Q4 2020 Q4
U.S. Class A Office Net Absorption (m sq ft) and Occupancy (%)3
18.38.2 24.4 12.8 12.3
3.2
-10.7
-33.6 -33.6
8.6 10.116.4
13.2 19.813.2
8.414.0 10.8
90.2 90.2 89.7 90.3 90.2 90.1 89.989.3
88.8
85. 0
86. 0
87. 0
88. 0
89. 0
90. 0
91. 0
-40.0
-30.0
-20.0
-10.0
0.0
10. 0
20. 0
30. 0
40. 0
2018 Q4 2019 Q1 2019 Q2 2019 Q3 2019 Q4 2020 Q1 2020 Q2 2020 Q3 2020 Q4
Net Absorption Completion Occupancy Rate
(1) Includes all office as at 31 Dec 2020. Source: JLL U.S. Office Outlook 4Q 2020(2) Office employment includes the professional and business services, financial and information service sectors; Source: CoStar Market Analysis & Forecast
Reports. Amounts are 12 trailing months(3) Source: CoStar Market Analysis & Forecast Reports
26
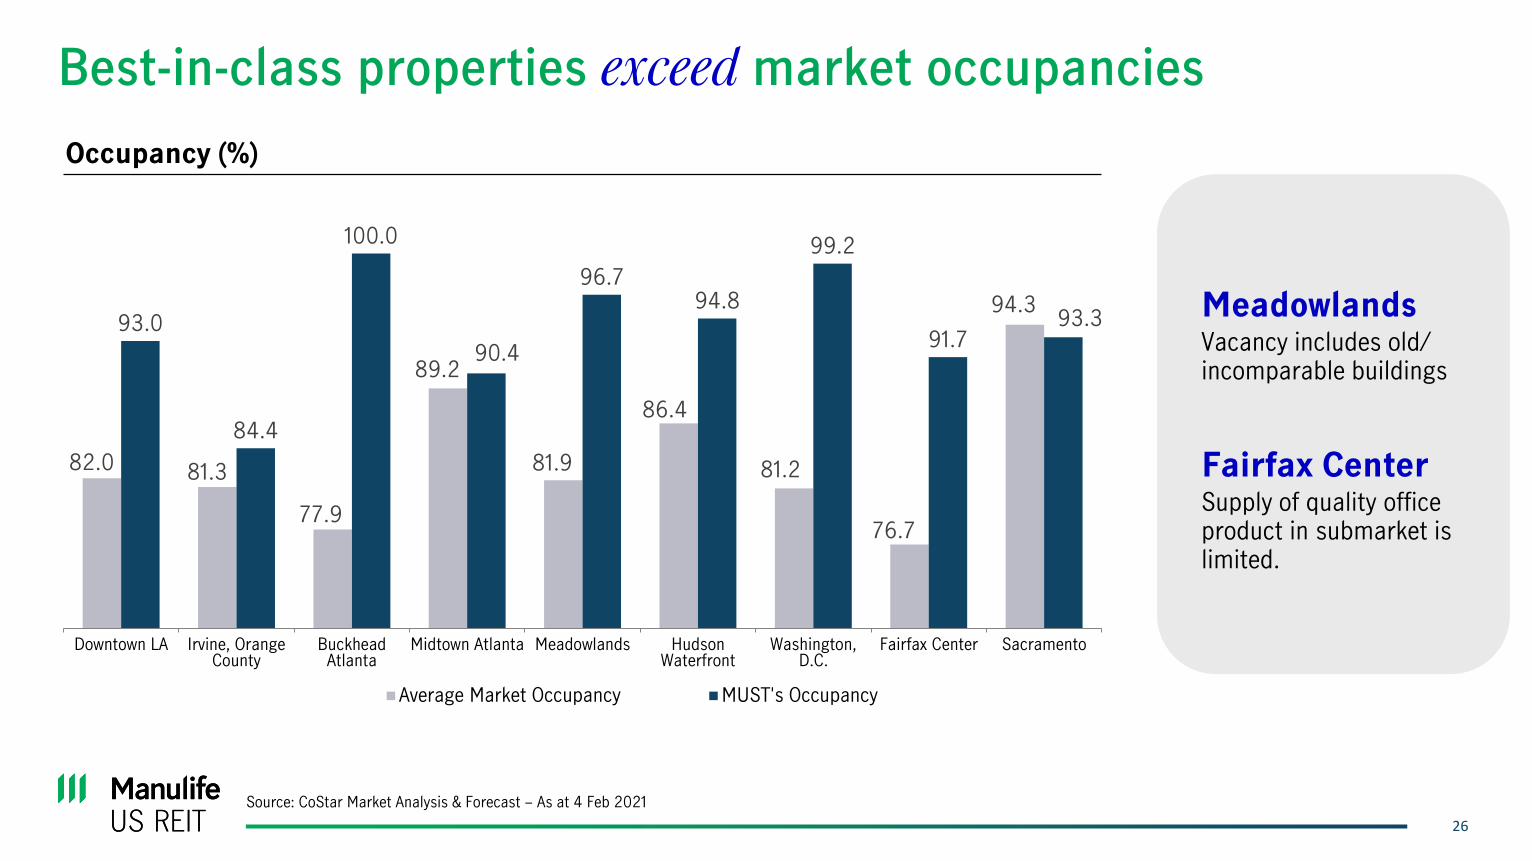
Best-in-class properties exceed market occupancies
82.0 81.3
77.9
89.2
81.9
86.4
81.2
76.7
94.393.0
84.4
100.0
90.4
96.794.8
99.2
91.793.3
Downtown LA Irvine, OrangeCounty
BuckheadAtlanta
Midtown Atlanta Meadowlands HudsonWaterfront
Washington,D.C.
Fairfax Center Sacramento
Average Market Occupancy MUST's Occupancy
Occupancy (%)
MeadowlandsVacancy includes old/ incomparable buildings
Fairfax CenterSupply of quality office product in submarket is limited.
Source: CoStar Market Analysis & Forecast – As at 4 Feb 2021
27
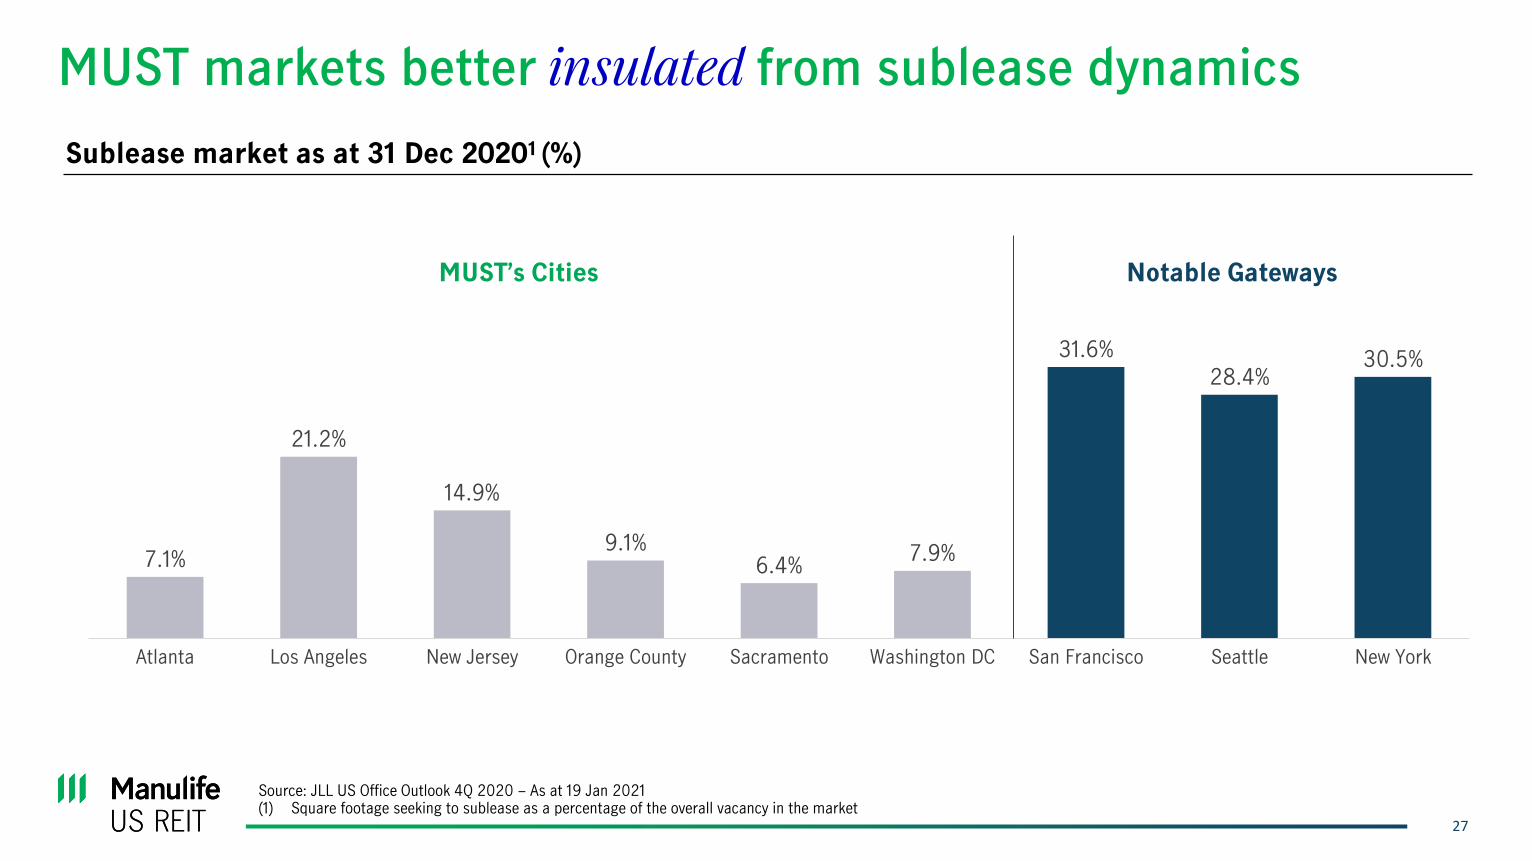
MUST markets better insulated from sublease dynamics
MUST’s Markets
7.1%
21.2%
14.9%
9.1%6.4%
7.9%
31.6%
28.4%30.5%
Atlanta Los Angeles New Jersey Orange County Sacramento Washington DC San Francisco Seattle New York
Notable GatewaysMUST’s Cities
Sublease market as at 31 Dec 20201 (%)
Source: JLL US Office Outlook 4Q 2020 – As at 19 Jan 2021(1) Square footage seeking to sublease as a percentage of the overall vacancy in the market
Capitol, Sacramento
29
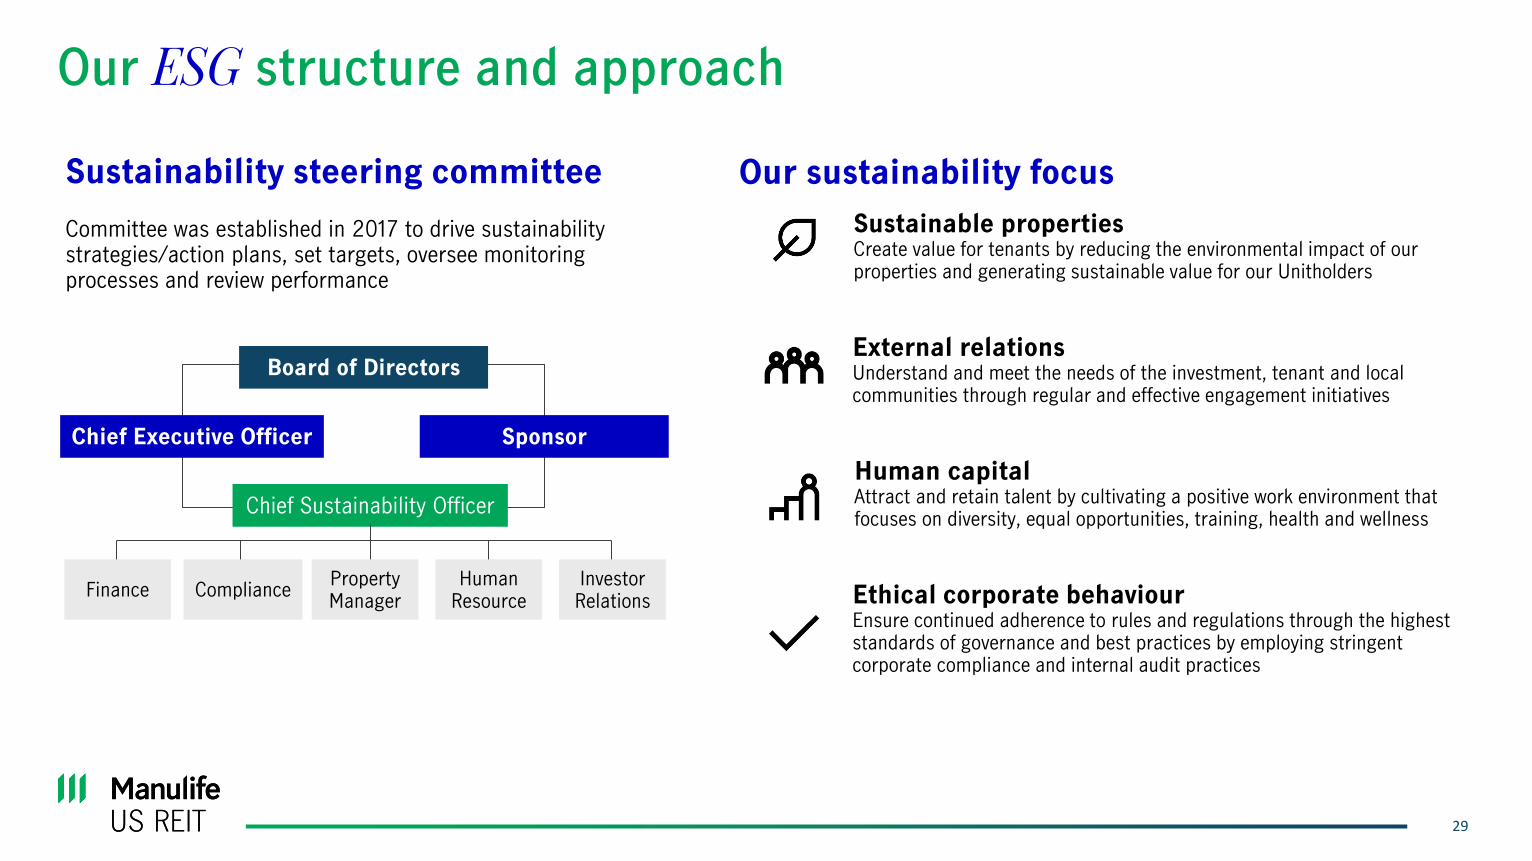
Our ESG structure and approach
Sustainability steering committee
Committee was established in 2017 to drive sustainability strategies/action plans, set targets, oversee monitoring processes and review performance
Our sustainability focus
Sustainable propertiesCreate value for tenants by reducing the environmental impact of our properties and generating sustainable value for our Unitholders
External relationsUnderstand and meet the needs of the investment, tenant and local communities through regular and effective engagement initiatives
Human capitalAttract and retain talent by cultivating a positive work environment that focuses on diversity, equal opportunities, training, health and wellness
Ethical corporate behaviourEnsure continued adherence to rules and regulations through the highest standards of governance and best practices by employing stringent corporate compliance and internal audit practices
Board of Directors
Chief Executive Officer Sponsor
Chief Sustainability Officer
Finance CompliancePropertyManager
HumanResource
InvestorRelations
30
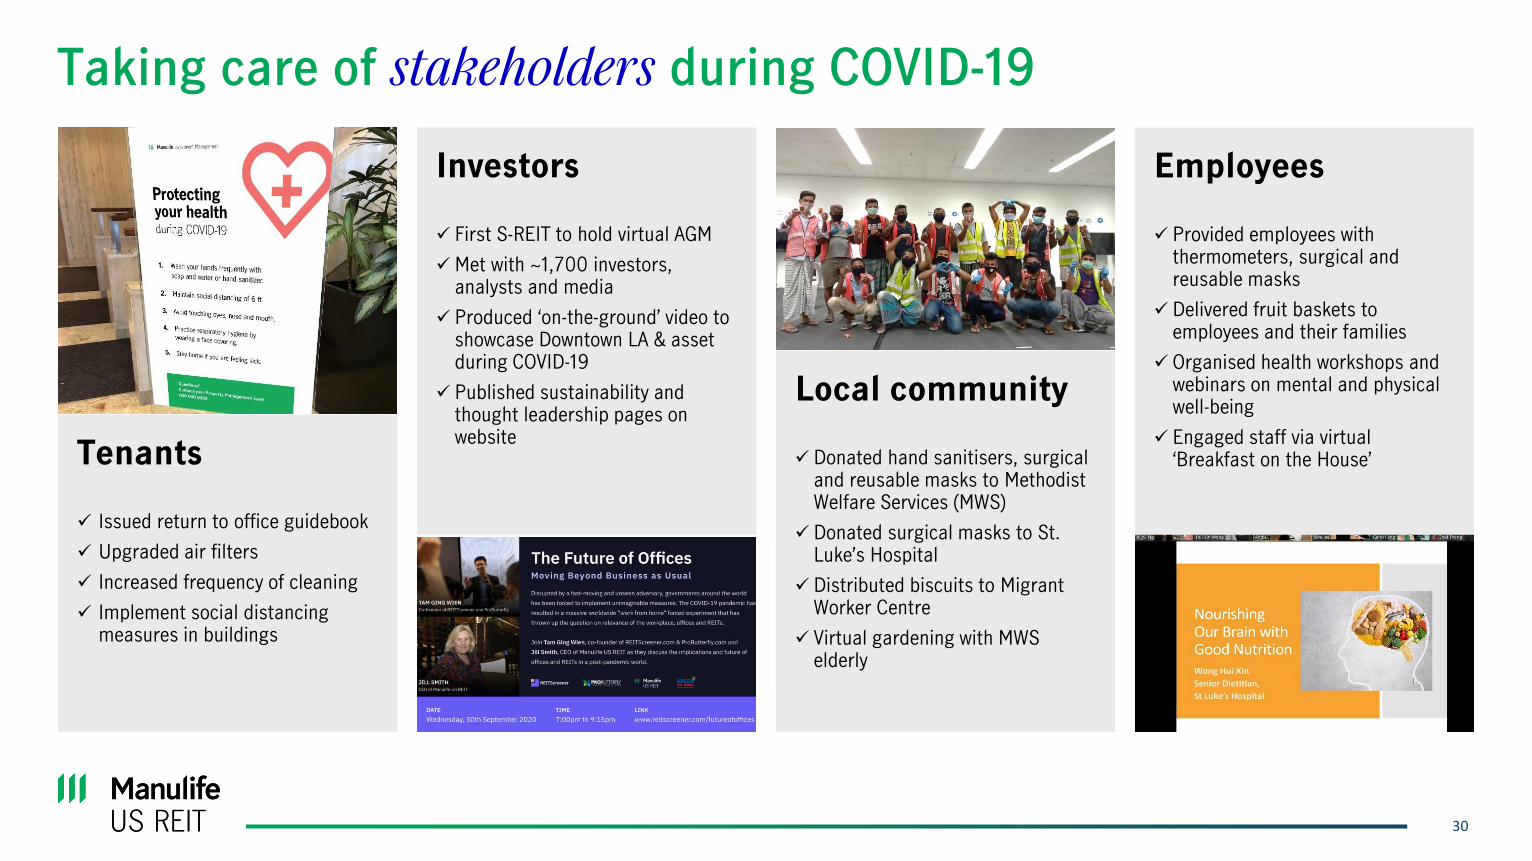
Taking care of stakeholders during COVID-19
Tenants
✓ Issued return to office guidebook
✓ Upgraded air filters
✓ Increased frequency of cleaning
✓ Implement social distancing measures in buildings
Investors
✓ First S-REIT to hold virtual AGM
✓Met with ~1,700 investors, analysts and media
✓ Produced ‘on-the-ground’ video to showcase Downtown LA & asset during COVID-19
✓ Published sustainability and thought leadership pages on website
Local community
✓ Donated hand sanitisers, surgical and reusable masks to Methodist Welfare Services (MWS)
✓ Donated surgical masks to St. Luke’s Hospital
✓ Distributed biscuits to Migrant Worker Centre
✓ Virtual gardening with MWS elderly
Employees
✓ Provided employees with thermometers, surgical and reusable masks
✓ Delivered fruit baskets to employees and their families
✓ Organised health workshops and webinars on mental and physical well-being
✓ Engaged staff via virtual ‘Breakfast on the House’
31
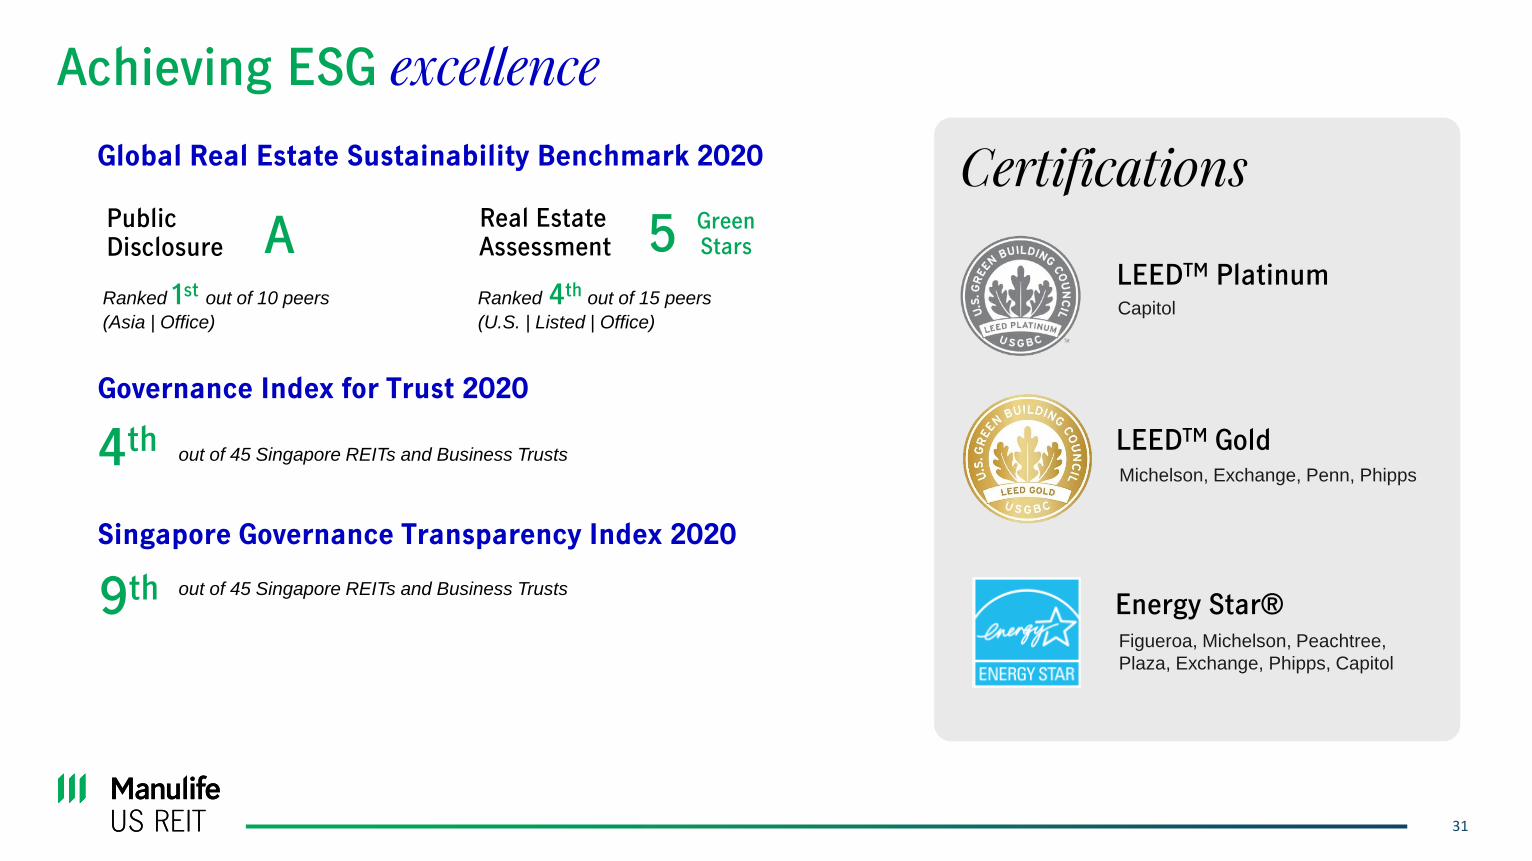
Achieving ESG excellence
Global Real Estate Sustainability Benchmark 2020
Public Disclosure
Governance Index for Trust 2020
Singapore Governance Transparency Index 2020
AReal Estate Assessment 5 Green
Stars
4th
9th
out of 45 Singapore REITs and Business Trusts
out of 45 Singapore REITs and Business Trusts
Ranked 1st out of 10 peers
(Asia | Office)
Ranked 4th out of 15 peers
(U.S. | Listed | Office)Capitol
Michelson, Exchange, Penn, Phipps
Figueroa, Michelson, Peachtree,
Plaza, Exchange, Phipps, Capitol
LEEDTM Gold
Energy Star®
LEEDTM Platinum
Certifications
Figueroa, Los Angeles
33
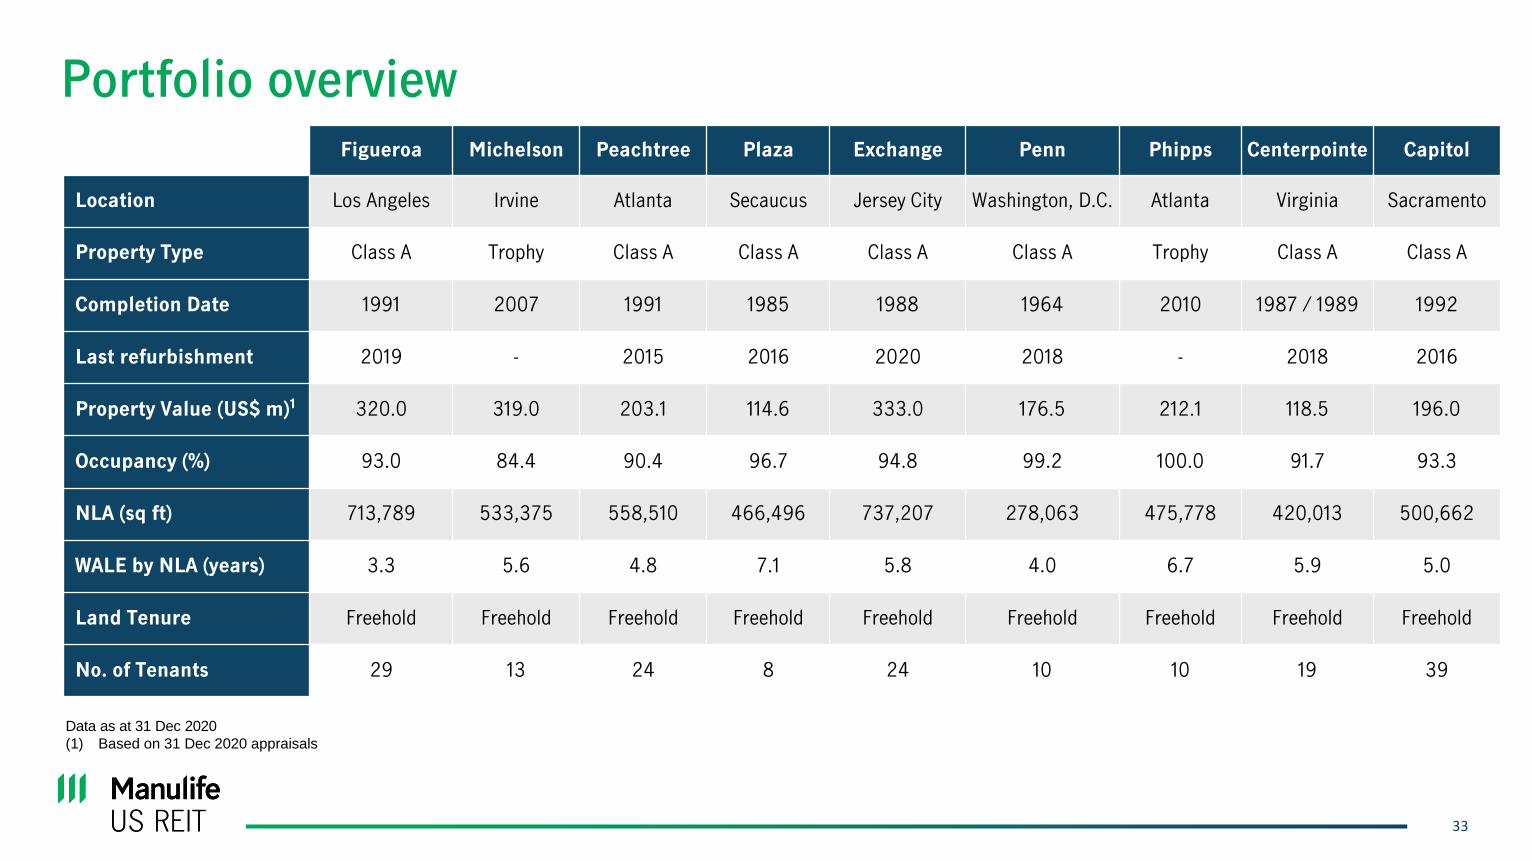
Portfolio overview
Data as at 31 Dec 2020
(1) Based on 31 Dec 2020 appraisals
Figueroa Michelson Peachtree Plaza Exchange Penn Phipps Centerpointe Capitol
Location Los Angeles Irvine Atlanta Secaucus Jersey City Washington, D.C. Atlanta Virginia Sacramento
Property Type Class A Trophy Class A Class A Class A Class A Trophy Class A Class A
Completion Date 1991 2007 1991 1985 1988 1964 2010 1987 / 1989 1992
Last refurbishment 2019 - 2015 2016 2020 2018 - 2018 2016
Property Value (US$ m)1 320.0 319.0 203.1 114.6 333.0 176.5 212.1 118.5 196.0
Occupancy (%) 93.0 84.4 90.4 96.7 94.8 99.2 100.0 91.7 93.3
NLA (sq ft) 713,789 533,375 558,510 466,496 737,207 278,063 475,778 420,013 500,662
WALE by NLA (years) 3.3 5.6 4.8 7.1 5.8 4.0 6.7 5.9 5.0
Land Tenure Freehold Freehold Freehold Freehold Freehold Freehold Freehold Freehold Freehold
No. of Tenants 29 13 24 8 24 10 10 19 39

34
Figueroa:
US$10 m Lobby Renovation
New ceiling, lighting, flooring, access control system, cameras, security desk and entrance signage, + new café opening soon
Exchange:
US$8 m Lobby Renovation
New ceiling, lighting, flooring, access control system & turnstiles, front security desk, entrance signage, revolving doors
Keeping Figueroa and Exchange relevant and refreshed with AEIs
Old New
Old New
35
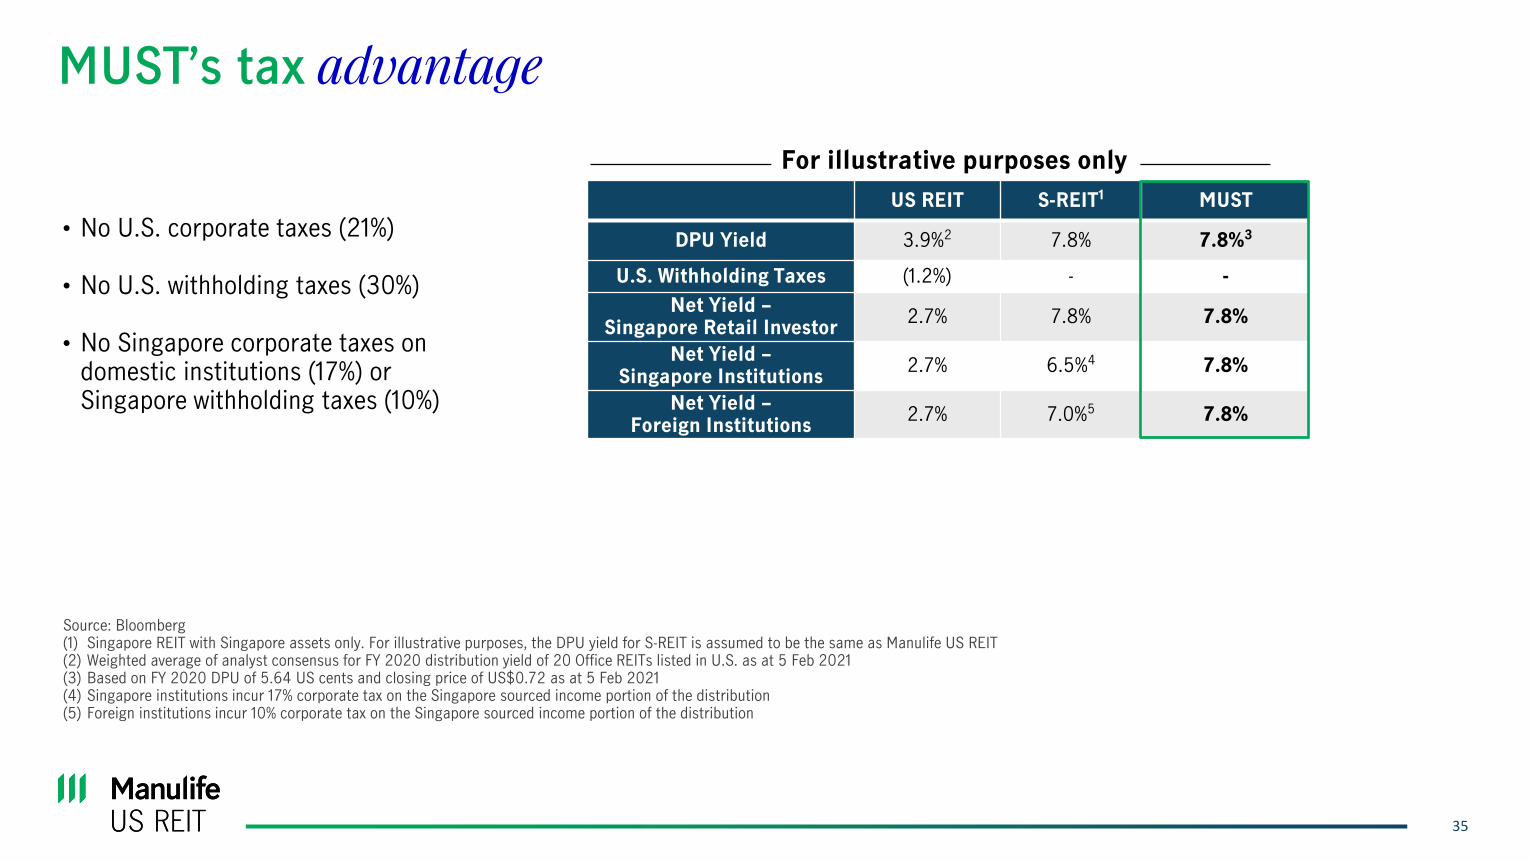
US REIT S-REIT1 MUST
DPU Yield 3.9%2 7.8% 7.8%3
U.S. Withholding Taxes (1.2%) - -
Net Yield –Singapore Retail Investor
2.7% 7.8% 7.8%
Net Yield –Singapore Institutions
2.7% 6.5%4 7.8%
Net Yield –Foreign Institutions
2.7% 7.0%5 7.8%
MUST’s tax advantage
• No U.S. corporate taxes (21%)
• No U.S. withholding taxes (30%)
• No Singapore corporate taxes on domestic institutions (17%) or Singapore withholding taxes (10%)
Source: Bloomberg(1) Singapore REIT with Singapore assets only. For illustrative purposes, the DPU yield for S-REIT is assumed to be the same as Manulife US REIT(2) Weighted average of analyst consensus for FY 2020 distribution yield of 20 Office REITs listed in U.S. as at 5 Feb 2021(3) Based on FY 2020 DPU of 5.64 US cents and closing price of US$0.72 as at 5 Feb 2021(4) Singapore institutions incur 17% corporate tax on the Singapore sourced income portion of the distribution(5) Foreign institutions incur 10% corporate tax on the Singapore sourced income portion of the distribution
For illustrative purposes only
36
Additional Disclaimer
CoStarPS does not purport that the CoStarPS Materials herein are comprehensive, and, while they are believed to be accurate, the CoStarPS
Materials are not guaranteed to be free from error, omission or misstatement. CoStarPS has no obligation to update any of the CoStarPS Materials
included in this document, Any user of any such CoStarPS Materials accepts them “AS IS” WITHOUT ANY WARRANTIES WHATSOEVER, EITHER
EXPRESS OR IMPLIED, INCLUDING BUT NOT LIMITED TO THE IMPLIED WARRANTIES OF MERCHANTABILITY, NON-INFRINGEMENT, TITLE
AND FITNESS FOR ANY PARTICULAR PURPOSE. UNDER NO CIRCUMSTANCES SHALL COSTARPS OR ANY OF ITS AFFILIATES, OR ANY
OF THEIR DIRECTORS, OFFICERS, EMPLOYEES OR AGENTS, BE LIABLE FOR ANY INDIRECT, INCIDENTAL OR CONSEQUENTIAL
DAMAGES WHATSOEVER ARISING OUT OF THE COSTARPS MATERIALS, EVEN IF COSTARPS OR ANY OF ITS AFFILIATES HAS BEEN
ADVISED AS TO THE POSSIBILITY OF SUCH DAMAGES.
The CoStarPS Materials do not purport to contain all the information that may be required to evaluate the business and prospects of Manulife US
REIT or any purchase or sale of Manulife US REIT units. Any potential investor should conduct his, her or its own independent investigation and
analysis of the merits and risks of an investment in Manulife US REIT. CoStarPS does not sponsor, endorse, offer or promote an investment in
Manulife US REIT. The user of any such CoStarPS Materials accepts full responsibility for his, her or its own investment decisions and for the
consequences of those decisions.