Embed Size (px)
Citation preview
Corporate Presentation
May 2020
Driving growth, profitability and responsibility in the
Trinidad oil and gas industry
TSX / LSE: TXP
Unless otherwise stated, all financial amounts herein are presented in United States dollars (“$”). The Company may also reference Canadian dollars (“C$”), Trinidad and Tobago dollars
(“TT$”) and Pounds Sterling (“£”) herein.
Certain information regarding Touchstone Exploration Inc. (“Touchstone” or the “Company”) set forth in this presentation, including assessments by the Company’s Management of theCompany’s plans and future operations contains forward-looking statements that involve substantial known and unknown risks and uncertainties. All statements other than statements ofhistorical fact may be forward-looking statements. Forward-looking statements are often, but not always, identified by the use of words such as “seek”, “anticipate”, “plan”, “continue”,“estimate”, “expect”, “may”, “will”, “project”, “predict”, “potential”, “targeting”, “intend”, “could”, “might”, “should”, “believe” and other similar expressions. Statements relating to“reserves” and “resources” are deemed to be forward-looking statements, as they involve the implied assessment, based on certain estimates and assumptions, that the reserves andresources described exist in the quantities predicted or estimated and can be profitably produced in the future. The Company has a reasonable basis for disclosing such statements, whichrepresent the Company’s internal projections, estimates or beliefs concerning future growth, and results of operations. With respect to forward-looking information contained in thispresentation, the Company has made assumptions regarding: production rates and production decline rates; the success of exploration opportunities; the magnitude of and ability torecover oil and gas reserves and resources; plans for and results of drilling activity; well abandonment costs; the ability to secure necessary personnel, equipment, production licences andservices; environmental matters; future commodity prices; changes to prevailing regulatory, royalty, tax and environmental laws and regulations; the impact of competition, future capitaland other expenditures (including the amount, nature and sources of funding thereof); future financing sources; and business prospects and opportunities, among other things.
Many of the foregoing assumptions are subject to change and are beyond the Company's control. Some of the risks that could affect the Company's future results and could cause results todiffer materially from those expressed in the forward-looking information are described under the heading “Advisories: Business Risks” in this presentation. New factors emerge from timeto time, and it is not possible for Management to predict all of such factors and to assess in advance the impact of each such factor on Touchstone’s business or the extent to which anyfactor, or combination of factors, may cause actual results to differ materially from those contained in any forward-looking statements.
In particular, forward-looking statements contained in this presentation may include, but are not limited to, statements with respect to: exploration, development and associatedoperational plans (including drilling and recompletion programs) and the anticipated costs and timing thereof; type well characteristics and forecast rates of return; projected productionvolumes; estimated reserves and resources (including the quantity, commerciality and net present value thereof); and general business strategies and objectives.
Investors should not place undue reliance on any such forward-looking statements or information. Further, any forward-looking statement or information speaks only as of the date onwhich such statement is made, and Touchstone undertakes no obligation to update any forward-looking statements or information except as required by law, including securities laws. Allforward-looking statements and information contained in this presentation are qualified by such cautionary statements.
Forward-looking Information
2

Why invest in Trinidad?
➢ Proven oil reserves of approximately 200 million barrels as at year-end 2018(1)
➢ Largest oil and gas producer in the Caribbean, generating 87,000 bbls of crude oil per day and 3.3 Bcf of natural gas per day in 2018(1)
➢ The 8th largest exporter of liquified natural gas in the world(2)
➢ Mature infrastructure as a result of exposure to major oil companies including Shell, BP and ENI
➢ 11 kilometres from Venezuela, the largest oil reserves in the world(1)
➢ Oxford University ranked Trinidad 2nd in a list of countries for how prepared the country is to lift physical distancing measures due to COVID-19
3

Why invest in Touchstone?
➢ Proven and experienced management team
➢ Focused strategy onshore Trinidad oil and gas
➢ Positive operating cash flows from current producing properties
➢ Significant exploration opportunities providing upside potential
4
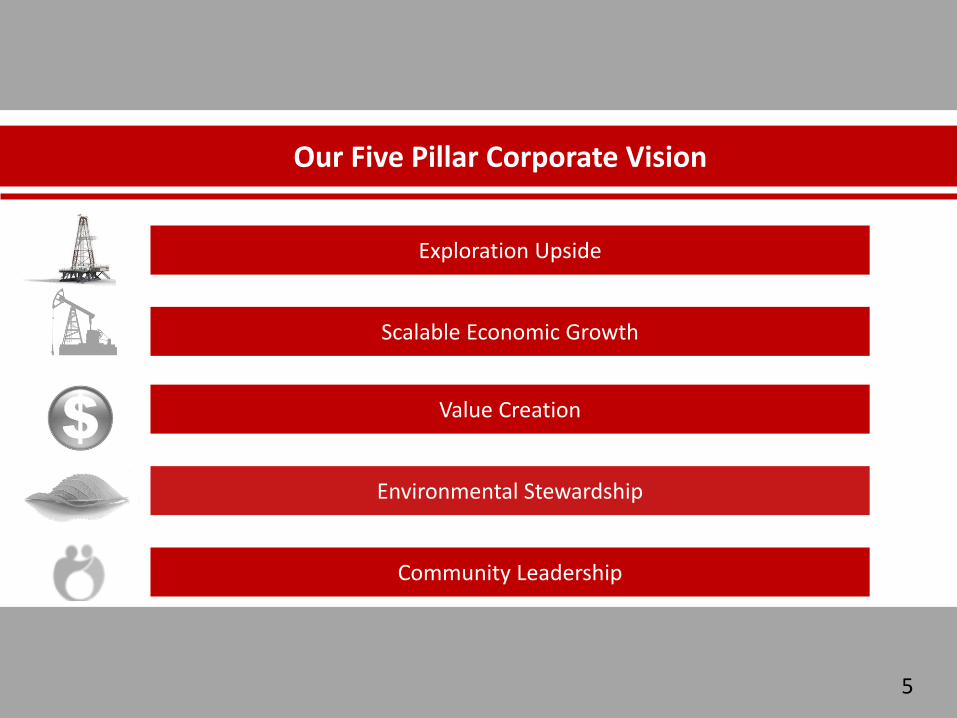
Scalable Economic Growth
Exploration Upside
Value Creation
Environmental Stewardship
Community Leadership
Our Five Pillar Corporate Vision
5
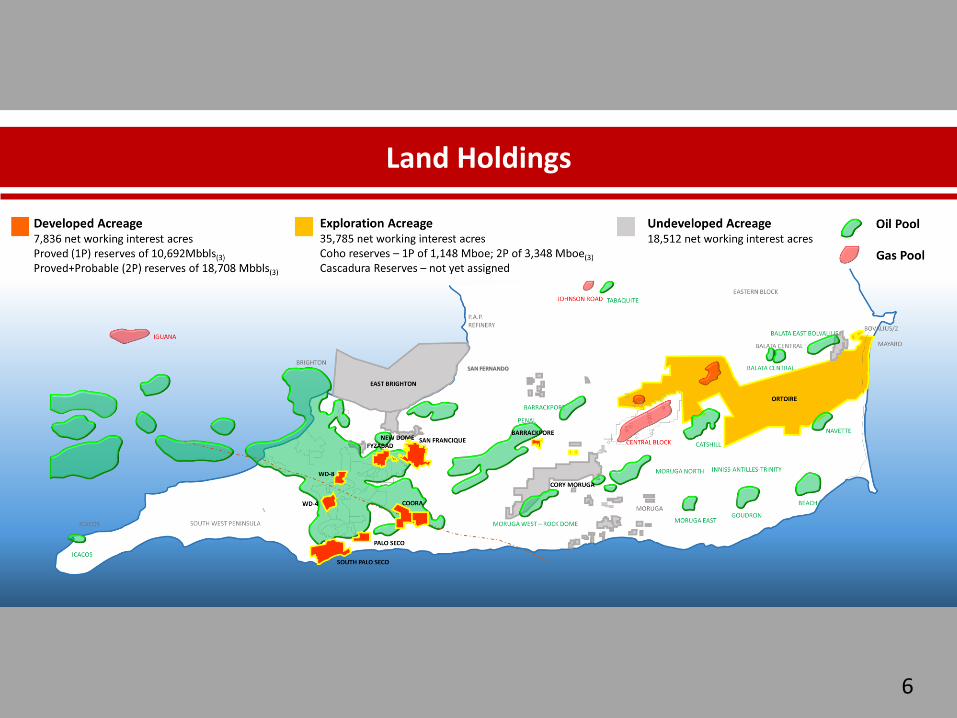
Land Holdings
6
Scalable Economic Growth
Value Creation
Environmental Stewardship
Community Leadership
Exploration Upside
7

Ortoire Block80% working interest and 35,785 net working interest acres
8
GASPIPELINE
Balata East10 MMbbls
OILPIPELINE
OILPIPELINE
OilPoolPipeline
GasDiscoveryPoolPipelineWellFacility
COHO
ROYSTON
CAS-1ST1
CASCADURA
ROYSTON-1
CHINOOK-1
CHINOOK
Navette57 MMbbls
Catshill30 MMbbls
Carapal Ridge
Baraka
Baraka
East
COHO-1
Central Block500 Bcf natural gas, 25 MMboe NGL
Central Block Gas Plantc. 80 MMcf/d Capacityc. 40 MMcf/d Throughput
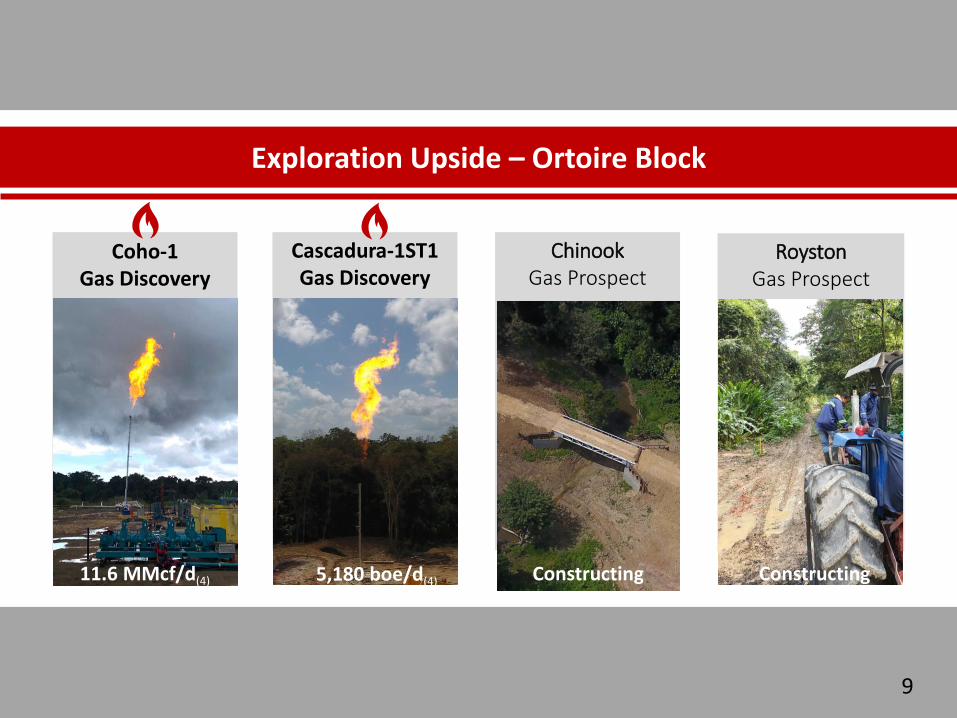
Exploration Upside – Ortoire Block
RoystonGas Prospect
Cascadura-1ST1Gas Discovery
Coho-1Gas Discovery
ChinookGas Prospect
9
11.6 MMcf/d(4) ConstructingConstructing5,180 boe/d(4) Constructing
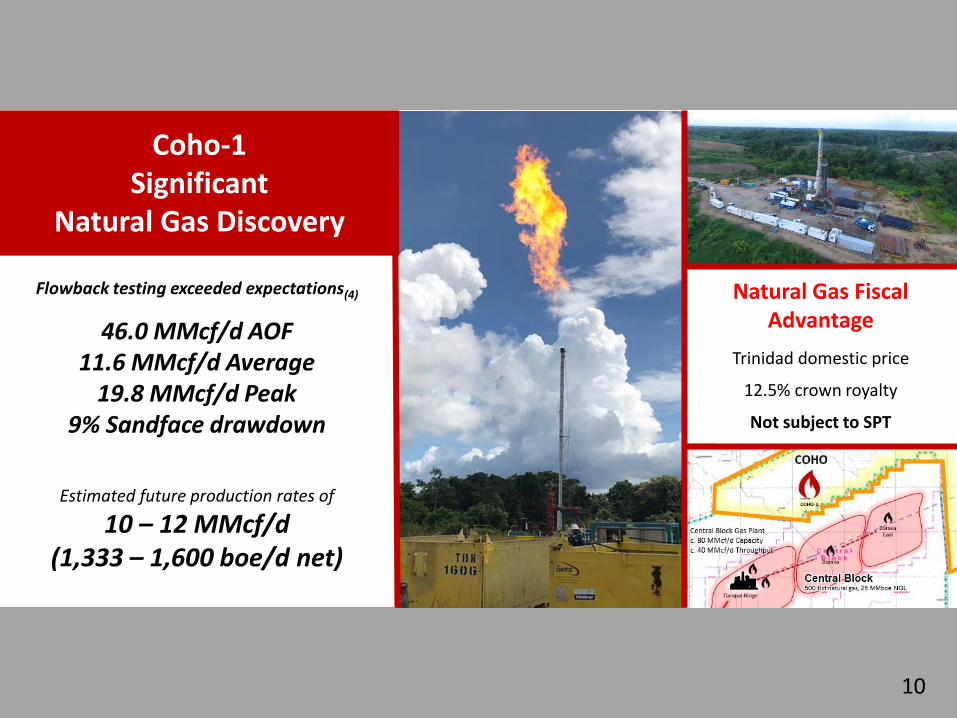
Natural Gas Fiscal Advantage
Trinidad domestic price
12.5% crown royalty
Not subject to SPT
Flowback testing exceeded expectations(4)
46.0 MMcf/d AOF11.6 MMcf/d Average
19.8 MMcf/d Peak9% Sandface drawdown
Estimated future production rates of
10 – 12 MMcf/d (1,333 – 1,600 boe/d net)
Coho-1Significant
Natural Gas Discovery
10
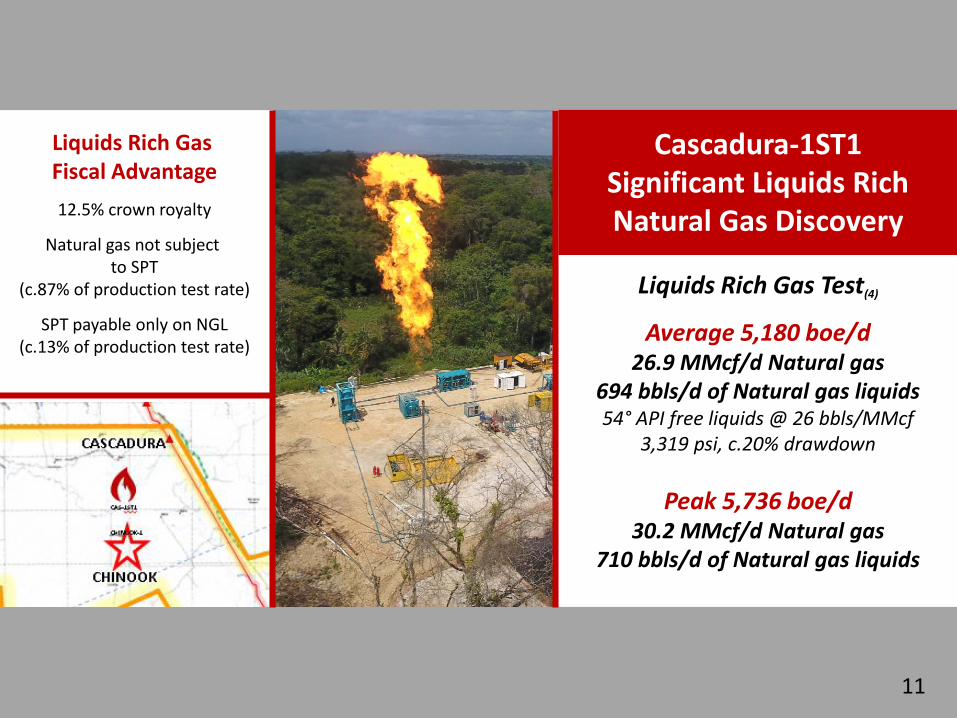
Liquids Rich Gas Test(4)
Average 5,180 boe/d26.9 MMcf/d Natural gas
694 bbls/d of Natural gas liquids54° API free liquids @ 26 bbls/MMcf
3,319 psi, c.20% drawdown
Peak 5,736 boe/d30.2 MMcf/d Natural gas
710 bbls/d of Natural gas liquids
Cascadura-1ST1Significant Liquids Rich Natural Gas Discovery
11
Liquids Rich Gas Fiscal Advantage
12.5% crown royalty
Natural gas not subject to SPT
(c.87% of production test rate)
SPT payable only on NGL(c.13% of production test rate)

Shell Trinidad LimitedBalata West 7 (BW-7)
Spud: May 20, 1959
Chinook-1 was originally an oil
prospect, however, due to the results at
CAS-1ST1 the Company now has strong belief that
Chinook-1 will be a liquid rich gas well
The original well was drilled in 1959, and encountered oil on core and oil while
drilling.
BW-9
BW-7, 7X & CHIN-1
BW-7
BW-7X CHINOOK-1
• 1,552’ Gross Herrera thickness• Free oil while drilling• Severe tectonics (bed angles) • Not tested
• 1,172’ Gross Herrera thickness• Oil observed on core• Interpreted to be uneconomic at
time and sidetracked• Not tested
Shell Trinidad LimitedBW-7X Sidetrack
TD: August 18, 1959Chinook-1
Natural Gas Prospect
12
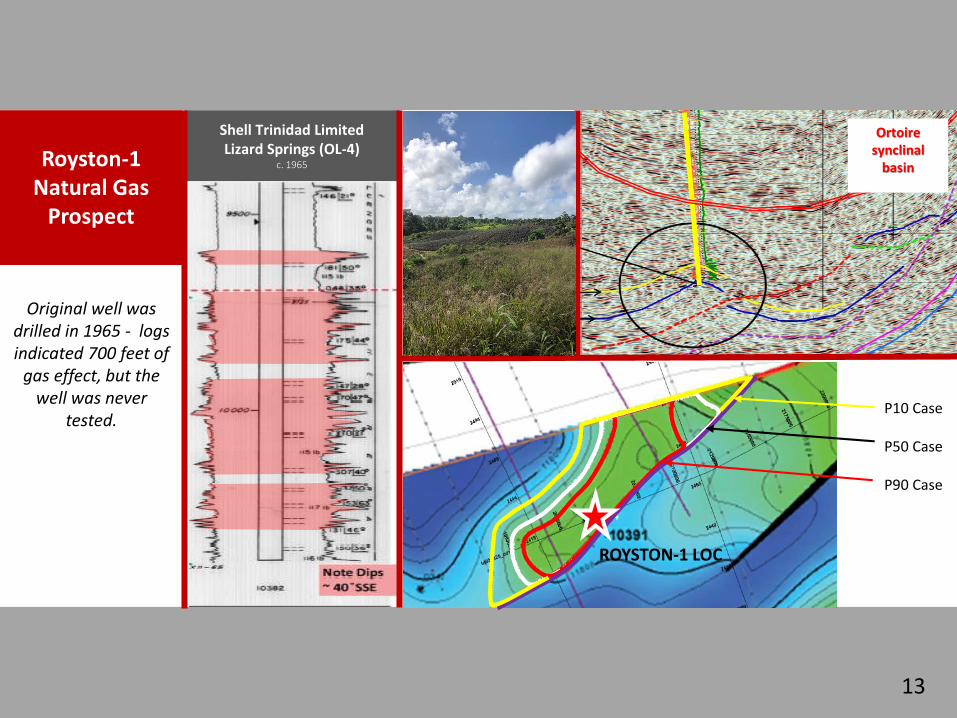
Original well was drilled in 1965 - logs indicated 700 feet of
gas effect, but the well was never
tested.
Shell Trinidad LimitedLizard Springs (OL-4)
c. 1965
ROYSTON-1 LOC
P10 Case
P50 Case
P90 Case
Ortoire synclinal
basinRoyston-1Natural Gas
Prospect
13

➢ Bring Coho-1 onto production to increase cash flows and decrease our sole reliance on volatile crude oil forward pricing
➢ Drill and evaluate at least one commitment well on the Ortoire block subject to maintaining liquidity targets
➢ Formulate a design and plan for production from the Cascadura-1ST1 well
➢ Negotiate and formalize a natural gas contract with NGC for the Ortoireblock
14
2020 Corporate Goals on the Ortoire Block

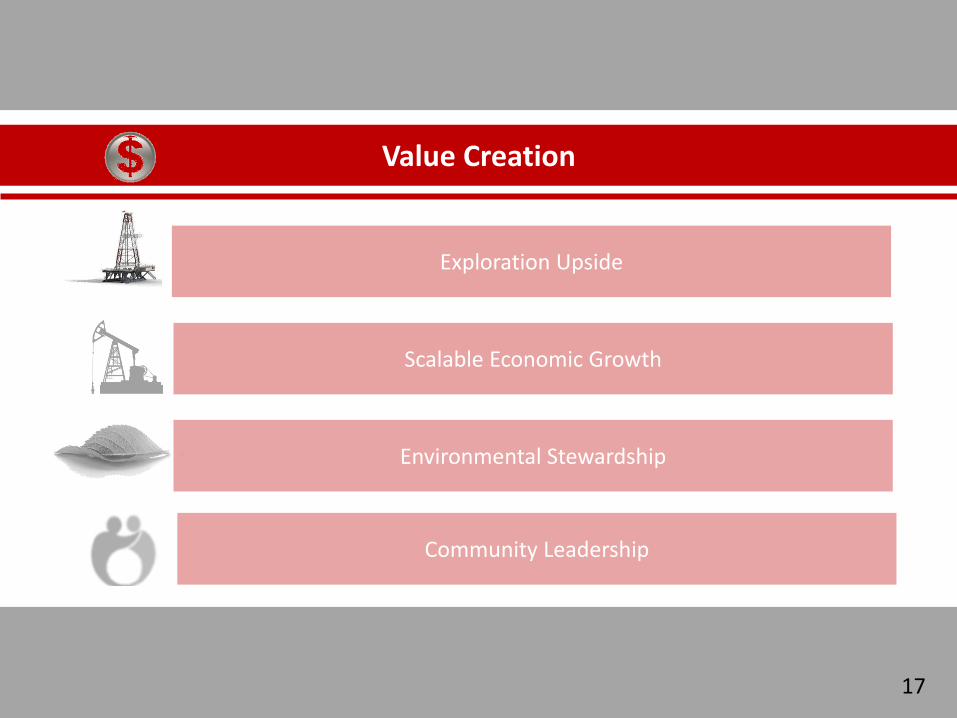
Exploration Upside
Value Creation
Environmental Stewardship
Community Leadership
Scalable Economic Growth
15
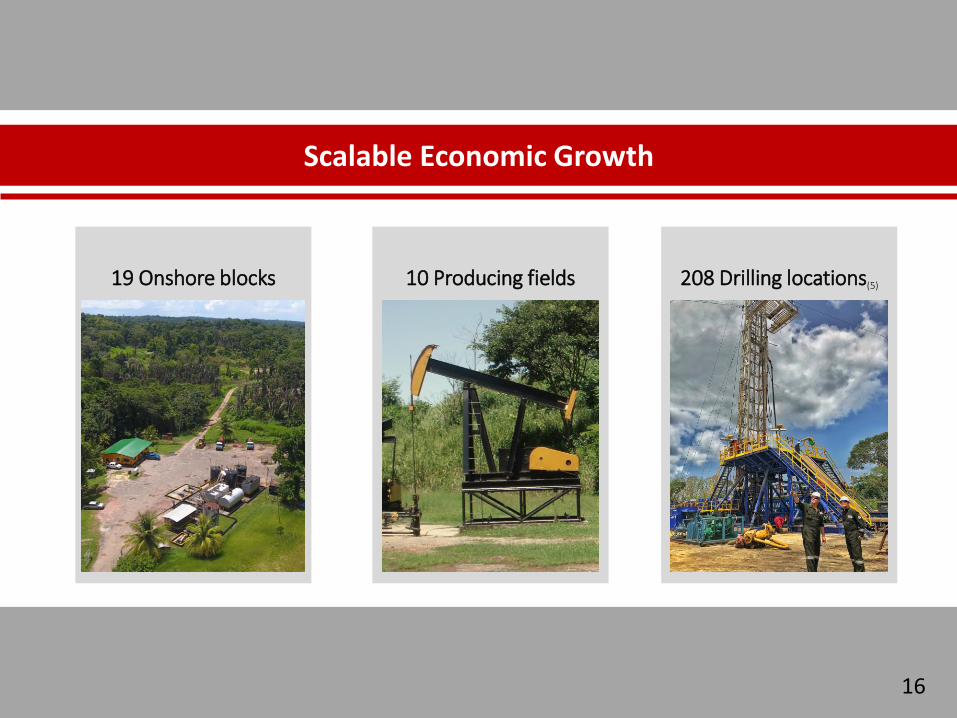
208 Drilling locations(5)10 Producing fields
Scalable Economic Growth
19 Onshore blocks
16
Scalable Economic Growth
Exploration Upside
Environmental Stewardship
Community Leadership
Value Creation
17

First Quarter 2020 Results
Capital Structure at May 25, 2020Common Shares Outstanding
183,590,795Market Capitalization(9)
C$134,021,280
Cash
$12,219,000Working Capital Surplus(6)(8)
$8,094,000
Term Credit Facility
C$20,000,000
Petroleum Sales
$6,698,000
Average Crude Oil Production
1,589 bbls/d
Operating Netback(6)(7)
$18.61/bbl
Funds Flow From Operations(6)
$1,257,000Capital Expenditures
$2,043,000
A Snapshot of Touchstone
18
19
Apr Jul Oct 2020 Apr
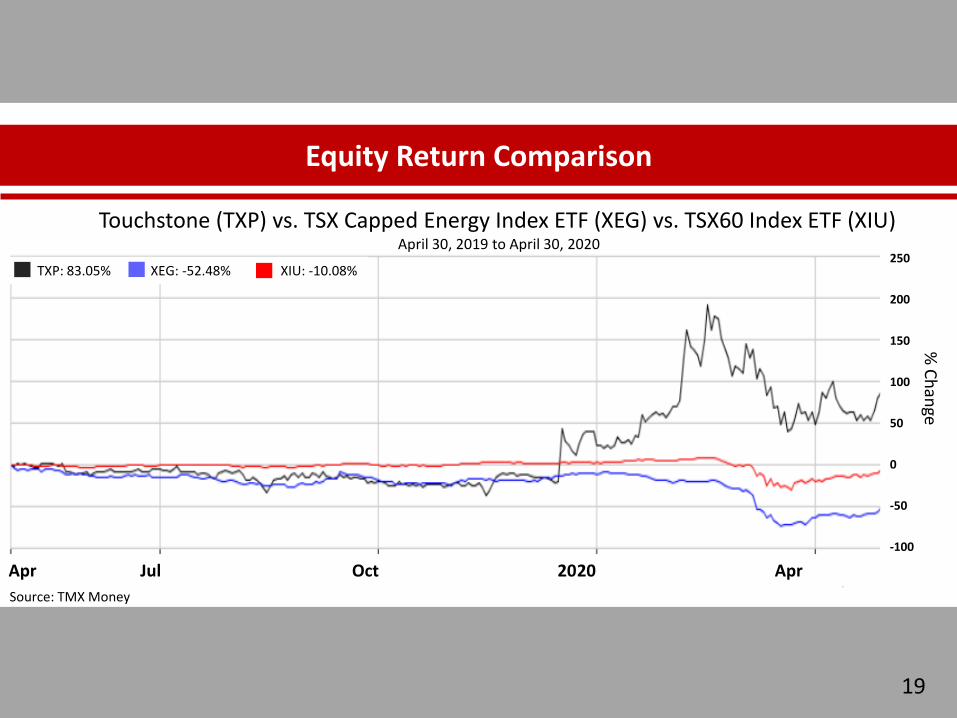
TXP: 83.05% XEG: -52.48% XIU: -10.08% 250
200
150
100
50
0
-50
-100
Equity Return Comparison
Touchstone (TXP) vs. TSX Capped Energy Index ETF (XEG) vs. TSX60 Index ETF (XIU)April 30, 2019 to April 30, 2020
Source: TMX Money
% C
han
ge
Scalable Economic Growth
Exploration Upside
Value Creation
Community Leadership
Environmental Stewardship
20

Environmental StewardshipTaking care of the environment is not a requirement; it is a privilege.
“Touchstone is committed to working with our partners at both national and local levels to ensure we set the benchmark for high environmental standards in Trinidad.”
World environment day
Annual beach cleanup
International water a flower day
Becoming an influential leader
in recycling
21

What’s Current: Water Disposal
Progressing towards becoming the first company in Trinidad to have no
surface released water
Result:Implemented the first water disposal well in Trinidad
Current water disposal well reduces surface effluent release by
100 bbls/d.
22
Goal: Eliminate surface release of produced water
Goal: Our next initiative is to capture all solution gas from our wells and sales
facilities to sell or use in our operations.
What’s Next: Mitigating Natural Gas
Release

Scalable Economic Growth
Exploration Upside
Value Creation
Environmental Stewardship
Community Leadership
23

Community Leadership
➢ Strong culture and history of engagement with local communities.
➢ Touchstone is dedicated to enhancing the livelihood of its employees andimproving our local communities through a series of investments inphysical activities and infrastructure projects.
24
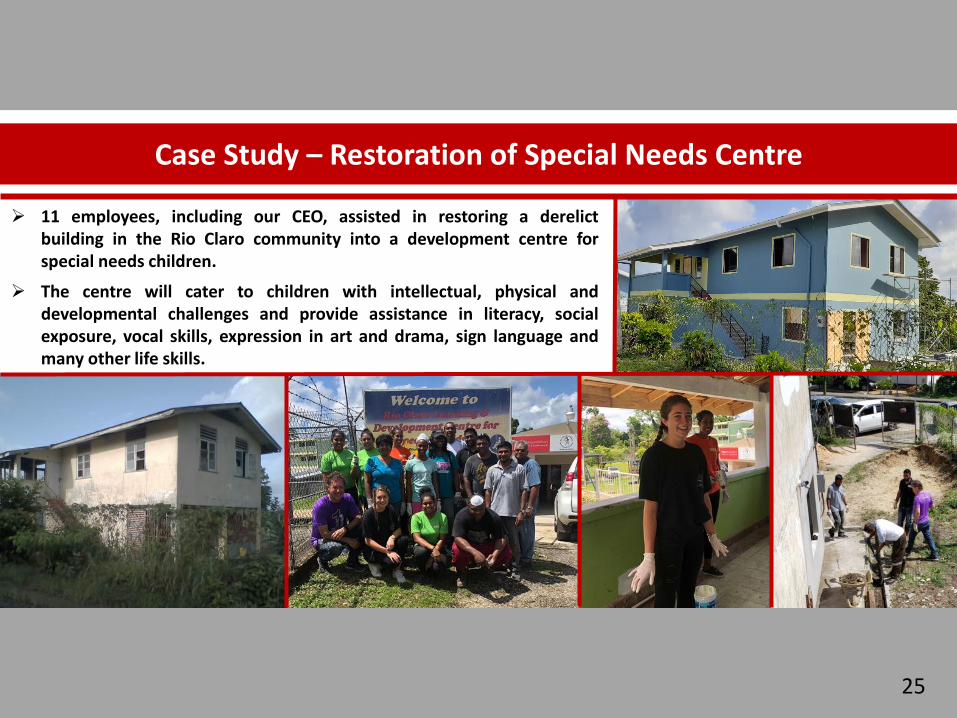
Case Study – Restoration of Special Needs Centre
➢ 11 employees, including our CEO, assisted in restoring a derelictbuilding in the Rio Claro community into a development centre forspecial needs children.
➢ The centre will cater to children with intellectual, physical anddevelopmental challenges and provide assistance in literacy, socialexposure, vocal skills, expression in art and drama, sign language andmany other life skills.
25
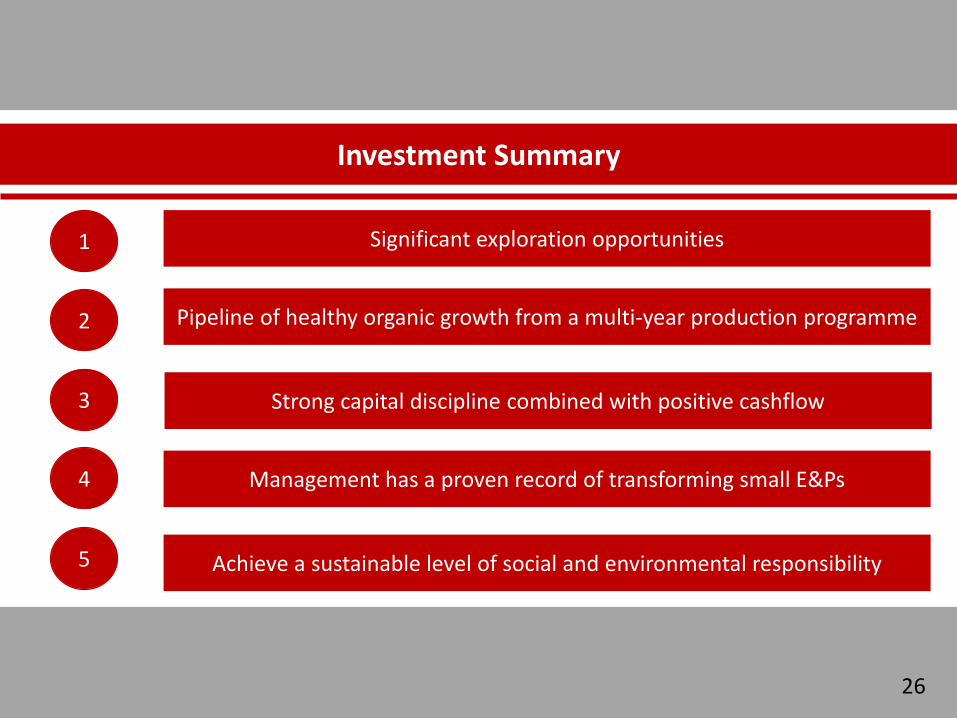
Investment Summary
Significant exploration opportunities
Pipeline of healthy organic growth from a multi-year production programme
Strong capital discipline combined with positive cashflow
Management has a proven record of transforming small E&Ps
1
2
3
4
Achieve a sustainable level of social and environmental responsibility5
26
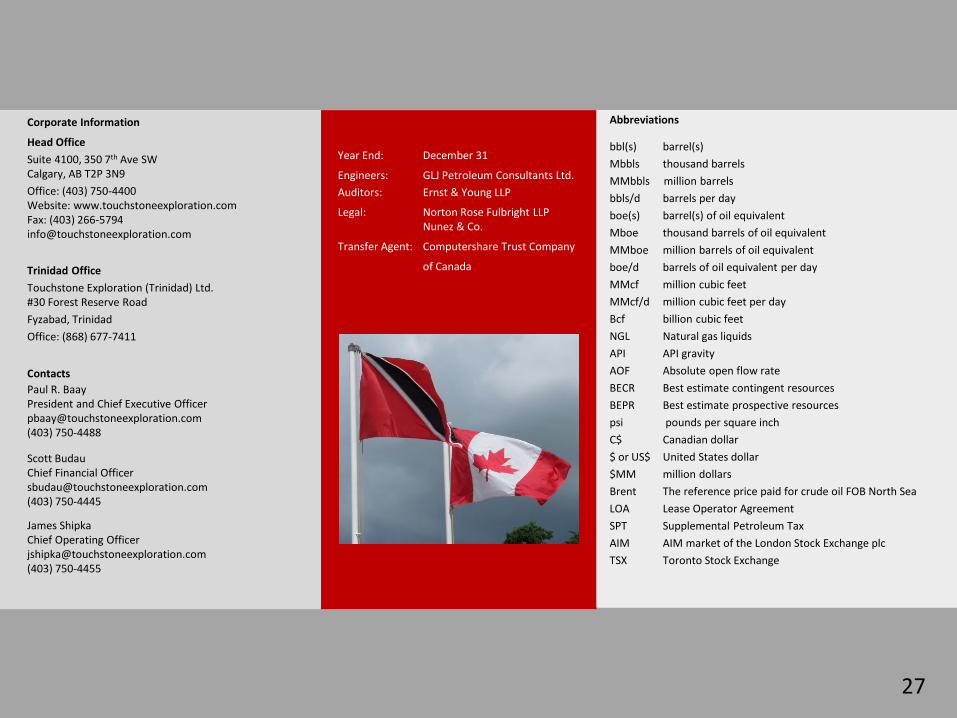
Abbreviations
bbl(s) barrel(s)
Mbbls thousand barrels
MMbbls million barrels
bbls/d barrels per day
boe(s) barrel(s) of oil equivalent
Mboe thousand barrels of oil equivalent
MMboe million barrels of oil equivalent
boe/d barrels of oil equivalent per day
MMcf million cubic feet
MMcf/d million cubic feet per day
Bcf billion cubic feet
NGL Natural gas liquids
API API gravity
AOF Absolute open flow rate
BECR Best estimate contingent resources
BEPR Best estimate prospective resources
psi pounds per square inch
C$ Canadian dollar
$ or US$ United States dollar
$MM million dollars
Brent The reference price paid for crude oil FOB North Sea
LOA Lease Operator Agreement
SPT Supplemental Petroleum Tax
AIM AIM market of the London Stock Exchange plc
TSX Toronto Stock Exchange
Corporate Information
Head Office
Suite 4100, 350 7th Ave SWCalgary, AB T2P 3N9
Office: (403) 750-4400Website: www.touchstoneexploration.com Fax: (403) [email protected]
Trinidad Office
Touchstone Exploration (Trinidad) Ltd.#30 Forest Reserve Road
Fyzabad, Trinidad
Office: (868) 677-7411
Contacts
Paul R. BaayPresident and Chief Executive [email protected](403) 750-4488
Scott BudauChief Financial [email protected](403) 750-4445
James ShipkaChief Operating [email protected](403) 750-4455
Year End: December 31
Engineers: GLJ Petroleum Consultants Ltd.
Auditors: Ernst & Young LLP
Legal: Norton Rose Fulbright LLPNunez & Co.
Transfer Agent: Computershare Trust Company
of Canada
27
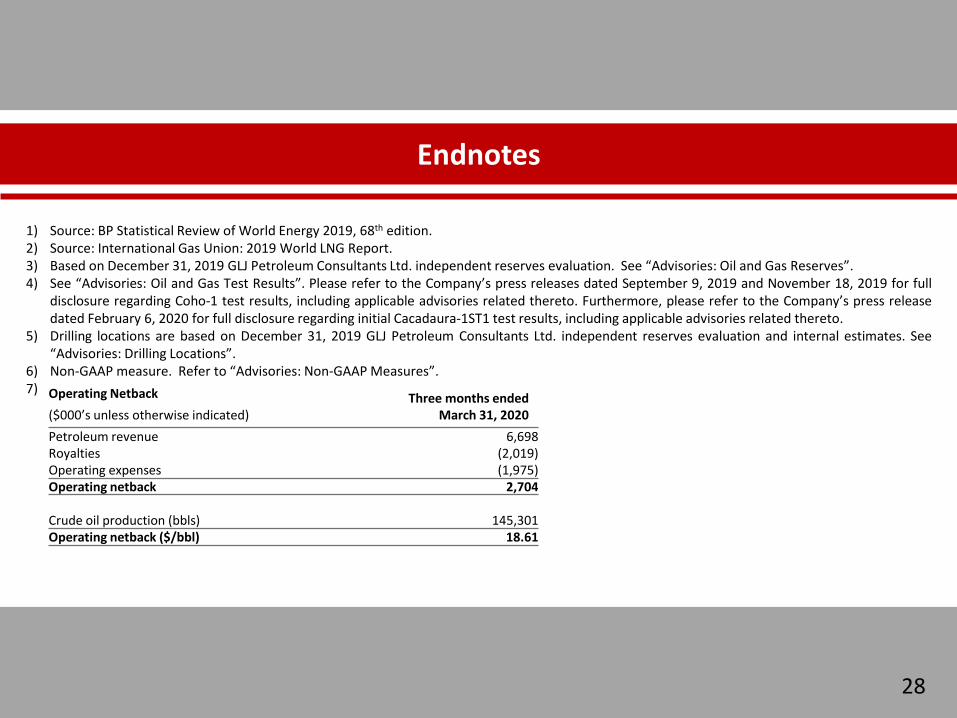
1) Source: BP Statistical Review of World Energy 2019, 68th edition.2) Source: International Gas Union: 2019 World LNG Report.3) Based on December 31, 2019 GLJ Petroleum Consultants Ltd. independent reserves evaluation. See “Advisories: Oil and Gas Reserves”.4) See “Advisories: Oil and Gas Test Results”. Please refer to the Company’s press releases dated September 9, 2019 and November 18, 2019 for full
disclosure regarding Coho-1 test results, including applicable advisories related thereto. Furthermore, please refer to the Company’s press releasedated February 6, 2020 for full disclosure regarding initial Cacadaura-1ST1 test results, including applicable advisories related thereto.
5) Drilling locations are based on December 31, 2019 GLJ Petroleum Consultants Ltd. independent reserves evaluation and internal estimates. See“Advisories: Drilling Locations”.
6) Non-GAAP measure. Refer to “Advisories: Non-GAAP Measures”.7) .
Endnotes
28
Operating Netback Three months ended March 31, 2020($000’s unless otherwise indicated)
Petroleum revenue 6,698Royalties (2,019)Operating expenses (1,975)Operating netback 2,704
Crude oil production (bbls) 145,301Operating netback ($/bbl) 18.61
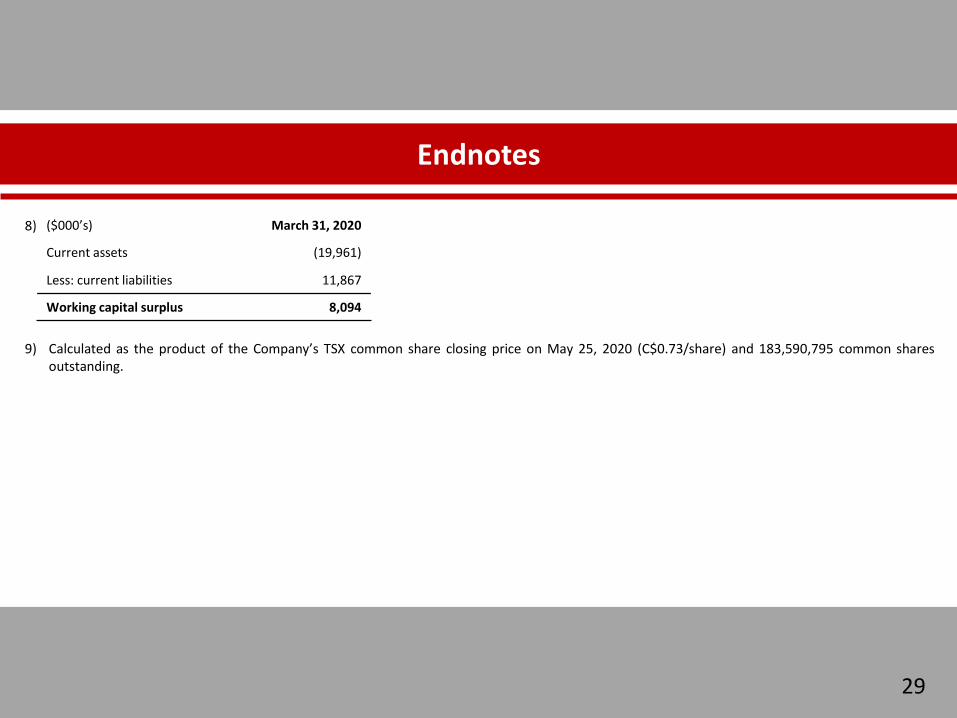
8)
9) Calculated as the product of the Company’s TSX common share closing price on May 25, 2020 (C$0.73/share) and 183,590,795 common sharesoutstanding.
($000’s) March 31, 2020
Current assets (19,961)
Less: current liabilities 11,867
Working capital surplus 8,094
Endnotes
29
Advisories
This presentation is for information purposes only and is not under any circumstances to be construed as a prospectus or an advertisement for a public offering of such securities. No securitiescommission or similar authority in Canada or elsewhere or the Toronto Stock Exchange has in any way passed upon this presentation, or the merits of any securities of Touchstone ExplorationInc., and any representation to the contrary is an offence. An investment in Touchstone Exploration Inc.’s securities should be considered highly speculative due to the nature of the proposedinvolvement in the exploration for and production of oil and natural gas.
This presentation and the information contained herein does not constitute an offer to sell or a solicitation of an offer to buy any securities in the United States. The securities of TouchstoneExploration Inc. have not been registered under the United States Securities Act of 1933, as amended (the “U.S. Securities Act”) or any state securities laws and may not be offered or soldwithin the United States or to U.S. Persons unless registered under the U.S. Securities Act and applicable state securities laws or an exemption from such registration is available.
Business Risks
The Company is exposed to numerous operational, technical, financial and regulatory risks and uncertainties, many of which are beyond its control and may significantly affect anticipatedfuture results. The Company is exposed to risks associated with negotiating with foreign governments as well as country risk associated with conducting international activities. Operations maybe unsuccessful or delayed as a result of competition for services, supplies and equipment, mechanical and technical difficulties, ability to attract and retain qualified employees on a cost-effective basis, commodity and marketing risk. The Company is subject to significant drilling risks and uncertainties including the ability to find oil and gas reserves on an economic basis and thepotential for technical problems that could lead to well blow-outs and environmental damage. The Company is exposed to risks relating to the inability to obtain timely regulatory approvals,surface access, access to third-party gathering and processing facilities, transportation and other third-party related operation risks. The Company is subject to industry conditions includingchanges in laws and regulations, including the adoption of new environmental laws and regulations and changes in how they are interpreted and enforced. There are uncertainties in estimatingthe Company’s reserve and resource base due to the complexities in estimated future production, costs and timing of expenses and future capital. The Company is subject to the risk that it willnot be able to fulfill the contractual obligations required to retain its rights to explore, develop and exploit any of its properties. The financial risks the Company is exposed to include, but arenot limited to, the impact of general economic conditions in Canada and Trinidad, continued volatility in market prices for oil and gas, the impact of significant declines in market prices for oiland gas, the ability to access sufficient capital from internal and external sources, changes in income tax laws, royalties and incentive programs relating to the oil and gas industry, fluctuations ininterest rates, the C$ to US$ exchange rate and the US$ to Trinidad and Tobago dollar exchange rate. The Company is subject to local regulatory legislation, the compliance with which mayrequire significant expenditures and non-compliance with which may result in fines, penalties or production restrictions or the termination of licence, LOA or farm-in rights related to theCompany’s oil and gas interests in Trinidad. Certain of these risks are set out in more detail in the Company’s 2019 Annual Information Form dated March 25, 2020 which has been filed onSEDAR and can be accessed at www.sedar.com.
Advisories
30
Oil and Gas Reserves
The reserves information summarized in this presentation are from the Company’s December 31, 2019 independent reserve report prepared by Touchstone’s independent reserves evaluator,GLJ Petroleum Consultants Ltd. (“GLJ”), dated March 4, 2020. This report was prepared in accordance with definitions, standards and procedures contained in the Canadian Oil and GasEvaluation Handbook (“COGEH”) and National Instrument 51-101 - Standards of Disclosure for Oil and Gas Activities (“NI 51-101”). All December 31, 2019 reserves presented are based on GLJ’sforecast pricing dated January 1, 2020 and estimated costs effective December 31, 2019. Additional reserves information as required under NI 51-101 is included in the Company’s 2019 AnnualInformation Form dated March 25, 2020.
Oil and Gas Measures
Where applicable, natural gas has been converted to barrels of oil equivalent based on six thousand cubic feet to one barrel of oil. The barrel of oil equivalent rate is based on an energyequivalent conversion method primarily applicable at the burner tip, and given that the value ratio based on the current price of crude oil as compared to natural gas is significantly differentthan the energy equivalency of the 6:1 conversion ratio, utilizing the 6:1 conversion ratio may be misleading as an indication of value.
Oil and Gas Metrics
This presentation may contain certain oil and gas metrics that are commonly used in the oil and gas industry such as finding and development costs and recycle ratio. These metrics do not havestandardized meanings or standardized methods of calculation and therefore such measures may not be comparable to similar measures presented by other companies. Such metrics havebeen included herein to provide readers with additional metrics to evaluate the Company’s performance; however, such measures are not reliable indicators of the future performance of theCompany, and future performance may not compare to the performance in prior periods and therefore such metrics should not be unduly relied upon. The Company uses these oil and gasmetrics for its own performance measurements and to provide shareholders with measures to compare the Company’s operations over time. Readers are cautioned that the informationprovided by these metrics, or that can be derived from the metrics presented in this presentation, should not be relied upon for investment purposes.
Finding and development costs are the sum of capital expenditures excluding capitalized general and administrative costs and corporate capital expenditures incurred in the period and thechange in future development costs required to develop those reserves. Finding and development costs per barrel is determined by dividing current period net reserve additions to thecorresponding period’s finding and development cost. The aggregate of the exploration and development costs incurred in the most recent financial year and the change during that year inestimated future development costs generally will not reflect total finding and development costs related to reserves additions for that year.
Recycle ratios are calculated by dividing the current period finding and development costs per barrel to operating netbacks before hedging in the corresponding period (see “Non-GAAPMeasures”). The recycle ratio compares netbacks from existing reserves to the cost of finding new reserves and may not accurately indicate the investment success unless the replacement ofreserves are of equivalent quality as the produced reserves.
Advisories
31
Oil and Gas Test Results
References in this presentation to production test rates and initial flow rates are useful in confirming the presence of hydrocarbons; however, such rates are not determinative of the rates atwhich such wells will commence production and decline thereafter and are not indicative of long-term performance or of ultimate recovery. Additionally, such rates may also include recovered"load oil" fluids used in well completion stimulation. While encouraging, readers are cautioned not to place reliance on such rates in calculating the aggregate production for the Company. With
A pressure transient analysis or well-test interpretation has not been carried out in respect of the Cacadura-1ST1. Accordingly, the Company cautions that the Cascadura-1ST1 test results should be considered preliminary.
Drilling Locations
This presentation discloses total drilling locations. Drilling locations are classified into three categories: (i) proved locations; (ii) probable locations; and (iii) unbooked locations. Proved locationsand probable locations are derived from the Company's reserves evaluation of GLJ Petroleum Consultants Ltd. effective December 31, 2018 and account for locations that have associatedproved and/or probable reserves, as applicable. Unbooked locations are internal estimates based on the prospective acreage associated with the Company’s assets and an assumption as to thenumber of wells that can be drilled based on industry practice and internal review. Unbooked locations do not have attributed reserves. Of the approximately 208 (net) drilling locationsidentified herein, 61 are proved locations, 29 are probable locations, and the remaining are unbooked locations. Unbooked locations have been identified by Management as an estimation ofpotential multi-year drilling activities based on evaluation of applicable geologic, seismic, engineering, production and reserves information. There is no certainty that the Company will drill allunbooked drilling locations, and if drilled there is no certainty that such locations will result in additional oil and gas reserves or production. The locations on which the Company will drill wellswill ultimately depend upon the availability of capital, regulatory approvals, crude oil prices, costs, actual drilling results, additional reservoir information that can be obtained and other factors.
While certain of the unbooked drilling locations have been de-risked by drilling existing wells in relative close proximity to such unbooked drilling locations, other unbooked drilling locationsare farther away from existing wells where Management has less information about the characteristics of the reservoir and therefore there is more uncertainty whether wells will be drilled insuch locations, and if drilled there is more uncertainty that such wells will result in additional oil and gas reserves or production.
Non-GAAP Measures
This presentation may contain terms commonly used in the oil and natural gas industry, such as funds flow from operations, working capital, and operating netback. These terms do not have astandardized meaning under International Financial Reporting Standards (“IFRS”) and may not be comparable to similar measures presented by other companies. Shareholders and investorsare cautioned that these measures should not be construed as alternatives to cash provided by operating activities, net income, or other measures of financial performance as determined inaccordance with GAAP. Management uses these non-GAAP measures for its own performance measurement and to provide stakeholders with measures to compare the Company’s operationsover time.
Advisories
32

Advisories
Non-GAAP Measures (Continued)
Funds flow from operations is an additional GAAP measure included in the Company’s consolidated statements of cash flows. The Company uses operating netback as a key performanceindicator of field results. Operating netback is presented on a total and per barrel basis and is calculated by deducting royalties and operating expenses from petroleum sales. If applicable, theCompany also discloses operating netback both prior to realized gains or losses on derivatives and after the impacts of derivatives are included. Realized gains or losses represent the portion ofrisk management contracts that have settled in cash during the period, and disclosing this impact provides Management and investors with transparent measures that reflect how theCompany’s risk management program can impact netback metrics. The Company considers operating netback to be a key measure as it demonstrates Touchstone’s profitability relative tocurrent commodity prices. This measurement assists Management and investors with evaluating operating results on a historical basis. Working capital is calculated as current assets minuscurrent liabilities as they appear on the consolidated statements of financial position.
The Company uses operating netback as a key performance indicator of field results. Operating netback is presented on a total and per barrel basis and is calculated by deducting royalties andoperating expenses from petroleum sales. The Company considers operating netback to be a key measure as it demonstrates Touchstone’s profitability relative to current commodity prices.This measurement assists Management and investors with evaluating operating results on a historical basis.
The Company closely monitors its capital structure with a goal of maintaining a strong financial position in order to fund current operations and the future growth of the Company. TheCompany monitors working capital and net debt as part of its capital structure to assess its true debt and liquidity position and to manage capital and liquidity risk. Working capital is calculatedas current assets minus current liabilities as they appear on the consolidated statements of financial position. Net debt is calculated by summing the Company’s working capital and the principal(undiscounted) amounts of long-term debt.
33