Embed Size (px)
Citation preview
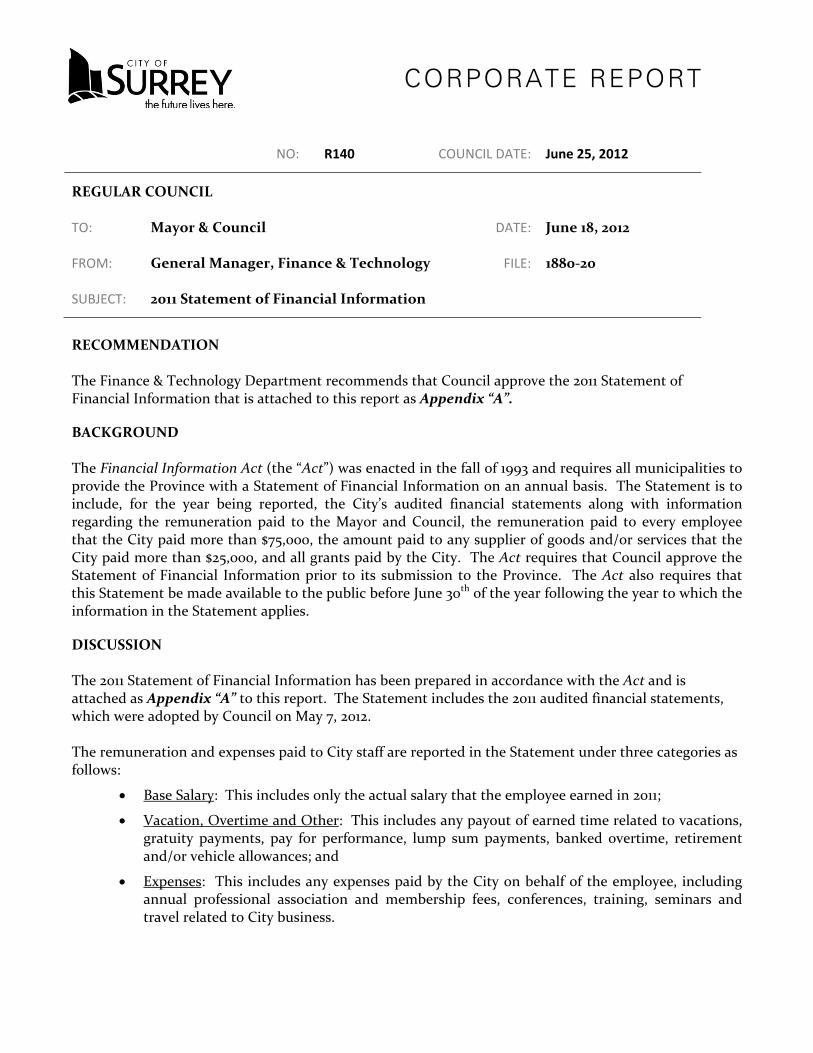
CORPORATE REPORT
NO: R140 COUNCIL DATE: June 25, 2012
REGULAR COUNCIL TO: Mayor & Council DATE: June 18, 2012 FROM: General Manager, Finance & Technology FILE: 1880‐20 SUBJECT: 2011 Statement of Financial Information
RECOMMENDATION The Finance & Technology Department recommends that Council approve the 2011 Statement of Financial Information that is attached to this report as Appendix “A”.
BACKGROUND The Financial Information Act (the “Act”) was enacted in the fall of 1993 and requires all municipalities to provide the Province with a Statement of Financial Information on an annual basis. The Statement is to include, for the year being reported, the City’s audited financial statements along with information regarding the remuneration paid to the Mayor and Council, the remuneration paid to every employee that the City paid more than $75,000, the amount paid to any supplier of goods and/or services that the City paid more than $25,000, and all grants paid by the City. The Act requires that Council approve the Statement of Financial Information prior to its submission to the Province. The Act also requires that this Statement be made available to the public before June 30th of the year following the year to which the information in the Statement applies.
DISCUSSION The 2011 Statement of Financial Information has been prepared in accordance with the Act and is attached as Appendix “A” to this report. The Statement includes the 2011 audited financial statements, which were adopted by Council on May 7, 2012. The remuneration and expenses paid to City staff are reported in the Statement under three categories as follows:
• Base Salary: This includes only the actual salary that the employee earned in 2011;
• Vacation, Overtime and Other: This includes any payout of earned time related to vacations, gratuity payments, pay for performance, lump sum payments, banked overtime, retirement and/or vehicle allowances; and
• Expenses: This includes any expenses paid by the City on behalf of the employee, including annual professional association and membership fees, conferences, training, seminars and travel related to City business.
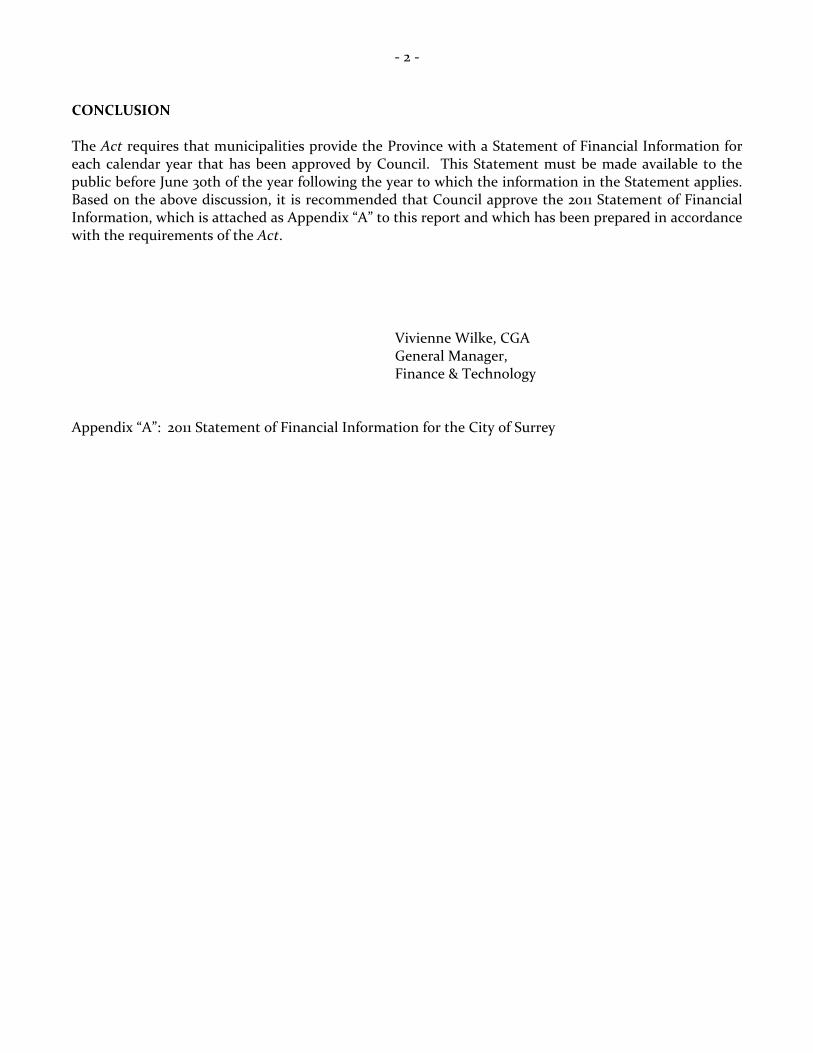
‐ 2 ‐ CONCLUSION The Act requires that municipalities provide the Province with a Statement of Financial Information for each calendar year that has been approved by Council. This Statement must be made available to the public before June 30th of the year following the year to which the information in the Statement applies. Based on the above discussion, it is recommended that Council approve the 2011 Statement of Financial Information, which is attached as Appendix “A” to this report and which has been prepared in accordance with the requirements of the Act.
Vivienne Wilke, CGA General Manager, Finance & Technology Appendix “A”: 2011 Statement of Financial Information for the City of Surrey
CITY OF SURREY
STATEMENT OF FINANCIAL INFORMATION
Year Ended December 31, 2011
(In Compliance with the Public Bodies Financial Information Act Statutes of British Columbia, Chapter 140)
City of Surrey Table of Contents
2011 Statement of Financial Information
Section Section Number
Statement of Financial Information Approval…………………………………………………….1 Management Report………………………………………………………………………….……2 Financial Statements………………………………………………………………………………3 Schedule of Debts…………………………………………………………………………………4 Schedule of Guarantee and Indemnity Agreements………………………….…………………...5 Schedule of Remuneration and Expenses…………………….…………………………...….…...6 Statement of Severance Agreements……………………………………………………………...7 Schedule of Suppliers of Goods or Services………………………………………………….…...8 Schedule of Grants…………………………………………………………………………….…..9
City of Surrey Statement of Financial Information Approval Section 1
2011 Statement of Financial Information
The undersigned, as authorized by the Financial Information Regulation, Schedule 1, subsection 9(2), approves all the statements and schedules included in this Statement of Financial Information, produced under the Financial Information Act. ___________________________________ ___________________________________ Dianne L. Watts Vivienne Wilke, CGA Mayor, City of Surrey General Manager, Finance & Technology June 25, 2012
City of Surrey Management Report Section 2
2011 Statement of Financial Information
The Financial Statements contained in this Statement of Financial Information have been prepared by management in accordance with Canadian generally accepted accounting principles as prescribed by the Public Sector Accounting Board (“PSAB”) of the Canadian Institute of Chartered Accountants. The integrity and objectivity of these statements are management’s responsibility. Management is also responsible for all statements and schedules and for ensuring that this information is consistent with the information contained in the audited financial statements. Management is also responsible for implementing and maintaining a system of internal controls to provide reasonable assurance that reliable financial information is produced. The Audit Committee is responsible for ensuring that management fulfils its responsibilities for financial reporting and internal controls. The Audit Committee meets with management, the internal auditor and the external auditors as required. The external auditors, KPMG, conduct an independent examination, in accordance with generally accepted auditing standards, and express their opinion on the financial statements. Their examination does not relate to the other schedules and statements required by the Financial Information Act. Their examination includes a review and evaluation of the City’s system of internal controls and appropriate tests and procedures to provide reasonable assurance that the financial statements are presented fairly. The external auditors have full and fair access to the Audit Committee. On behalf of The City of Surrey
Vivienne Wilke, CGA General Manager, Finance & Technology June 18, 2012

City of Surrey Financial Statements Section 3
2011 Statement of Financial Information
financial statements
f o r t h e y e a r e n d e d d e c e m b e r 3 1 , 2 0 1 1

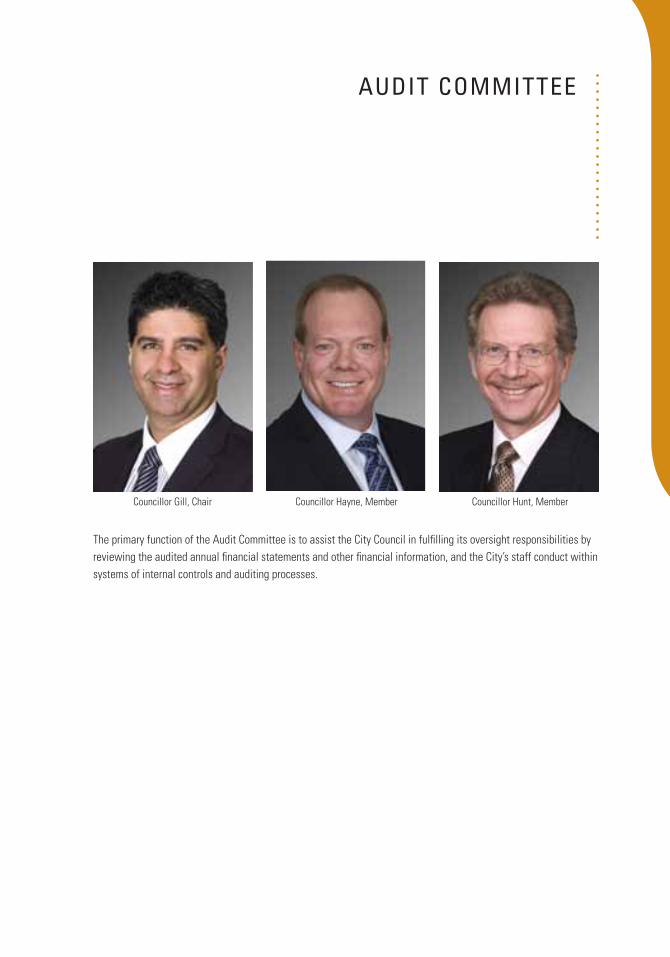
the primary function of the audit committee is to assist the city council in fulfilling its oversight responsibilities by reviewing the audited annual financial statements and other financial information, and the city’s staff conduct within systems of internal controls and auditing processes.
councillor Gill, chair councillor hayne, member councillor hunt, member
AUDIT COMMITTEE
2
May 7, 2012
To Mayor Dianne L. Watts and Members of Council
In accordance with Sections 98 and 167 of the community charter, I am pleased to submit the annual financial report for the city of Surrey for the year ended december 31, 2011. the report includes both the consolidated financial statements and the auditors’ report.
the consolidated financial statements were prepared in accordance with canadian Generally accepted accounting Principles (GaaP) as prescribed by the Public Sector accounting board (PSab) of the canadian Institute of chartered accountants (cIca). the city continues to maintain a comprehensive system of internal controls to safeguard city assets and to provide reliable financial information.
city council appointed the accounting firm of KPmG to conduct an audit and to express an opinion as to whether the consolidated financial statements present fairly the financial position of the city of Surrey as at december 31, 2011 and the result of its operations and its cash flows for the year then ended.
FINANCIAL OVERVIEW
2011 in ReviewSurrey continued to experience strong growth through 2011. the implementation of the build Surrey Program was a strong focus of activities in 2011 and is being undertaken to prepare the city for continued growth and development in the next decade. citizens saw the opening of a new state-of-the-art library in city centre and a multi-purpose recreation centre in cloverdale. the construction of the new city hall commenced in 2011 as part of the on-going transformation of the city centre core that is becoming metro Vancouver’s next metropolitan centre.
the global economy remains unstable; however, Surrey continues to grow with its population expanding by approximately 12,000 residents in 2011. residential construction in Surrey continues to shift from single family homes to multi-family dwellings with affordability driving this shift.
the city’s revenues totalled $654.8 million in 2011, which is down from $699.1 million in 2010. this reduction was attributable to a decrease in developer-contributed assets and a reduction in capital contributions from the federal and Provincial governments for infrastructure-related projects. the 2011 financial Plan included a budgeted $4.0 million transfer from surplus. the actual transfer from surplus was less than budgeted at $1.9 million due to reduced operating expenditures and increased fee revenue.
the city remains in financially-sound condition. the city of Surrey received an “a” rating by the c.d. howe Institute for budget management and financial reporting; being one of only three cities across canada to receive this top rating.
the Surrey city development corporation (Scdc) converted its financial reporting framework in 2011 to Public Sector accounting Standards. during the year, Scdc entered into three separate partnership agreements for the development of properties. the year 2011 marked a turning point for the Scdc with the company generating its first operating profit and moving towards self-sufficiency.
Investmentsthe city’s investment policy, which complies with community charter requirements, outlines how city funds are invested to blend reasonable returns and with investment security while meeting the city’s daily cash flow requirements. the average portfolio balance invested during the year was $649.5 million, which earned interest of $24.5 million, of which $3.7 million was allocated to deferred development cost charges. the average rate of return on the city’s investment portfolio was 3.39%.
REpORT from the General Manager, Finance & Technology
3
Reserve Fundsthe city’s statutory reserve funds have decreased to $100.6 million ($106.5 million in 2010). this is mainly due to internal borrowing for the purpose of funding build Surrey projects. deferred development cost charges at the end of 2011 have remained relatively stable with a balance of $183.9 million ($184.4 million in 2010) as Surrey continues to experience steady development. these funds will be used for capital projects identified in the current five-year financial Plan.
Financial positionthe city continues to maintain a strong financial position. cash and investments have increased to $719.4 million in 2011 from $644.0 million in 2010, as a result of the city entering into a borrowing arrangement with the municipal finance authority to fund projects being constructed under the build Surrey Program.
THE FUTURE
the city will continue to be subject to change; including the implementation of a new financial system on January 1, 2013, the move to a new city hall in September 2013, the implementation of an electronic content management System, ongoing infrastructure development under the build Surrey Program, including two new pools, and continuing population growth. these are just a glimpse of the myriad of activities with which city staff is involved, in addition to the on-going day-to-day delivery of municipal services such as water, sewer, drainage, roads, waste collection, etc.
Staff continues to stay abreast of new accounting standards as mandated by PSab. Staff are currently in the process of identifying the impact of proposed changes in relation to accounting for Government transfers, tax revenue, Liability for contaminated Sites, financial Instruments and foreign currency translation. the changes related to these standards will be implemented between 2012 and 2015.
efforts by the Surrey city development corporation, growth in areas such as city centre, campbell heights and Grandview heights, as well as the construction of new facilities identified as part of the build Surrey Program will continue to attract additional business activity to the city.
Population projections show that Surrey will continue to welcome an average of 10,000 to 12,000 residents each year. Staff will continue to work efficiently and effectively in delivering quality services with modest revenue increases. the city’s continued growth and expansion will require careful financial planning but will also offer opportunities in the months and years to come.
Sustainability, crime reduction, transportation, homelessness, social well-being and city beautification, continue to be a high priority for the city. city staff will continue to pursue new revenue opportunities and leverage the use of technology to recognize efficiencies that technology can deliver in the on-going delivery of services. this will allow the city to maintain property taxes at a level amongst the lowest in the region.
Under the leadership of city council, the strong efforts of the city’s employees and the numerous volunteers and benefactor organizations that contribute to the city’s health and vitality, the city of Surrey is well positioned for continuing vibrancy into the future.
respectfully submitted,
Vivienne Wilke, cGa General manager, finance & technology

CITy OF sURREy
ABCD
KPMG LLP Chartered Accountants Metrotower II Suite 2400 - 4720 Kingsway Burnaby BC V5H 4N2 Canada
Telephone (604) 527-3600 Fax (604) 527-3636 Internet www.kpmg.ca
KPMG LLP is a Canadian limited liability partnership and a member firm of the KPMG network of independent member firms affiliated with KPMG International Cooperative (“KPMG International”), a Swiss entity. KPMG Canada provides services to KPMG LLP.
INDEPENDENT AUDITORS' REPORT
To the Mayor and Council
We have audited the accompanying consolidated financial statements of the City of Surrey, which comprise the consolidated statement of financial position as at December 31, 2011 and the consolidated statements of operations, changes in net financial assets and cash flows for the year then ended, and notes, comprising a summary of significant accounting policies and other explanatory information.
Management's Responsibility for the Consolidated Financial Statements
Management is responsible for the preparation and fair presentation of these consolidated financial statements in accordance with Canadian public sector accounting standards, and for such internal control as management determines is necessary to enable the preparation of consolidated financial statements that are free from material misstatement, whether due to fraud or error.
Auditors’ Responsibility
Our responsibility is to express an opinion on these consolidated financial statements based on our audit. We conducted our audit in accordance with Canadian generally accepted auditing standards. Those standards require that we comply with ethical requirements and plan and perform the audit to obtain reasonable assurance about whether the consolidated financial statements are free from material misstatement.
An audit involves performing procedures to obtain audit evidence about the amounts and disclosures in the consolidated financial statements. The procedures selected depend on our judgment, including the assessment of the risks of material misstatement of the consolidated financial statements, whether due to fraud or error. In making those risk assessments, we consider internal control relevant to the entity's preparation and fair presentation of the consolidated financial statements in order to design audit procedures that are appropriate in the circumstances, but not for the purpose of expressing an opinion on the effectiveness of the entity's internal control. An audit also includes evaluating the appropriateness of accounting policies used and the reasonableness of accounting estimates made by management, as well as evaluating the overall presentation of the consolidated financial statements.
We believe that the audit evidence we have obtained is sufficient and appropriate to provide a basis for our audit opinion.
Opinion
In our opinion, the consolidated financial statements present fairly, in all material respects, the consolidated financial position of the City of Surrey as at December 31, 2011, and its consolidated results of operations, its changes in net consolidated financial assets and its consolidated cash flows for the year then ended in accordance with Canadian public sector accounting standards.
Other Matters
Our audit was conducted for the purpose of forming an opinion on the consolidated financial statements taken as a whole. The current year’s supplementary information included in schedules 1 through 9 is presented for purposes of additional analysis and is not a required part of the consolidated financial statements. Such supplementary information has been subjected to the auditing procedures applied in the audit of the consolidated financial statements and, in our opinion, is fairly stated in all material respects in relation to the consolidated financial statements taken as a whole.
Chartered Accountants
May 7, 2012
Burnaby, Canada
As at December 31, 2011, with comparative figures for 2010[in thousands of dollars]
To be read in conjunction with the Notes to the Consolidated Financial Statements
6
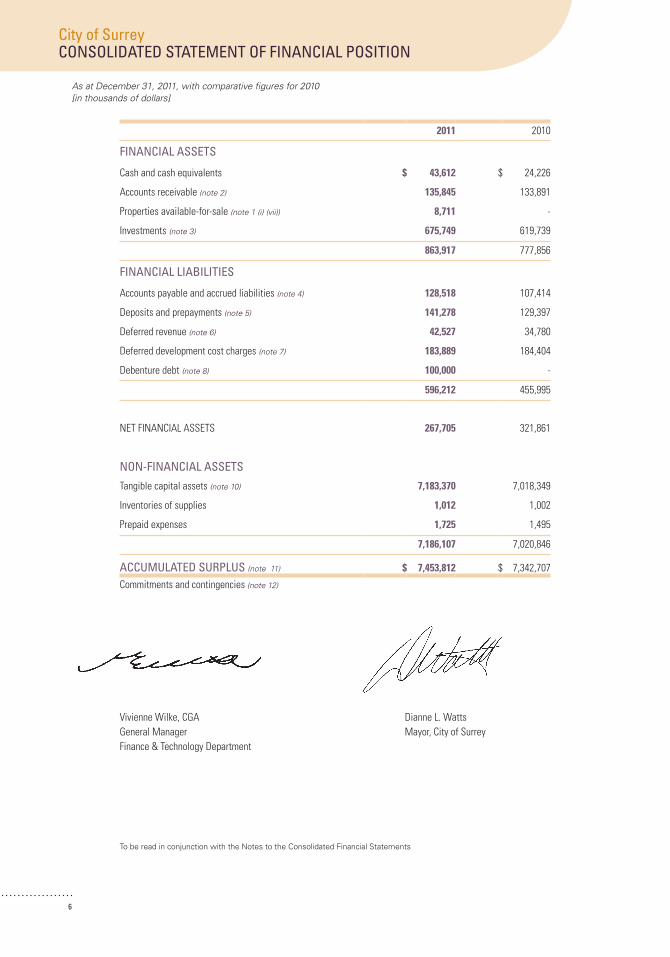
City of surreyCONsOLIDATED sTATEMENT OF FINANCIAL pOsITION
2011 2010
FINANCIAL AssETs
cash and cash equivalents $ 43,612 $ 24,226
accounts receivable (note 2) 135,845 133,891
Properties available-for-sale (note 1 (i) (vii)) 8,711 -
Investments (note 3) 675,749 619,739
863,917 777,856
FINANCIAL LIABILITIEs
accounts payable and accrued liabilities (note 4) 128,518 107,414
deposits and prepayments (note 5) 141,278 129,397
deferred revenue (note 6) 42,527 34,780
deferred development cost charges (note 7) 183,889 184,404
debenture debt (note 8) 100,000 -
596,212 455,995
net fInancIaL aSSetS 267,705 321,861
NON-FINANCIAL AssETs
tangible capital assets (note 10) 7,183,370 7,018,349
Inventories of supplies 1,012 1,002
Prepaid expenses 1,725 1,495
7,186,107 7,020,846
ACCUMULATED sURpLUs (note 11) $ 7,453,812 $ 7,342,707
commitments and contingencies (note 12)
Vivienne Wilke, cGaGeneral managerfinance & technology department
dianne L. Wattsmayor, city of Surrey

To be read in conjunction with the Notes to the Consolidated Financial Statements
For the year ended December 31, 2011, with comparative figures for 2010[in thousands of dollars]
7
City of surreyCONsOLIDATED sTATEMENT OF OpERATIONs
2011 budget 2011 2010
(unaudited notes 1(h) and 21)
(note 22)
REVENUEs
taxation revenue (note 14) $ 260,182 $ 259,526 $ 244,552
Sales of goods and services 153,209 159,469 152,822
development cost charges (note 7) 97,400 57,045 56,899
developer contributions 57,241 81,914 126,053
Investment income 28,334 20,890 21,940
transfers from other governments (note 20) 30,313 34,695 61,417
other 43,100 41,298 35,403
669,779 654,837 699,086
EXpENsEsfire services 50,507 52,073 48,510
Police services 106,038 107,127 97,011
Water, sewer & drainage 127,546 141,507 119,654
Parks, recreation and culture 66,044 72,198 81,134
General government 54,270 54,292 57,651
Public works 49,011 55,441 43,315
environment and health 25,835 25,582 21,821
Planning and development 21,366 20,638 18,144
Library services 15,253 14,874 13,852
515,870 543,732 501,092
annual Surplus 153,909 111,105 197,994
accumulated Surplus, beginning of year 7,342,707 7,342,707 7,144,713
accumulated Surplus, end of year $ 7,496,616 $ 7,453,812 $ 7,342,707
As at December 31, 2011, with comparative figures for 2010[in thousands of dollars]
To be read in conjunction with the Notes to the Consolidated Financial Statements
8
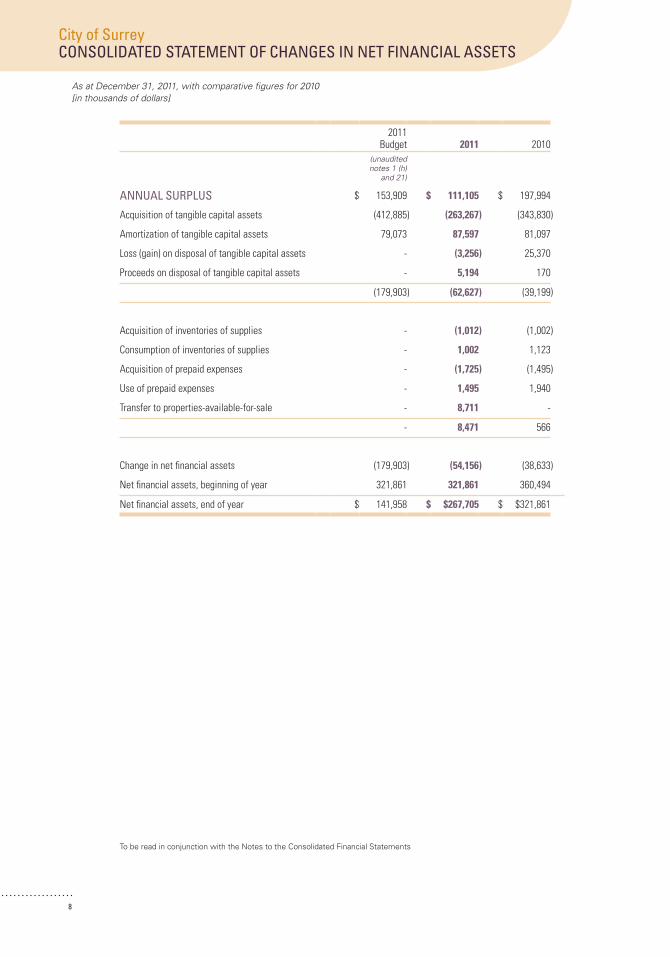
City of surreyCONsOLIDATED sTATEMENT OF CHANGEs IN NET FINANCIAL AssETs
2011 budget 2011 2010
(unauditednotes 1 (h)
and 21)
ANNUAL sURpLUs $ 153,909 $ 111,105 $ 197,994
acquisition of tangible capital assets (412,885) (263,267) (343,830)
amortization of tangible capital assets 79,073 87,597 81,097
Loss (gain) on disposal of tangible capital assets - (3,256) 25,370
Proceeds on disposal of tangible capital assets - 5,194 170
(179,903) (62,627) (39,199)
acquisition of inventories of supplies - (1,012) (1,002)
consumption of inventories of supplies - 1,002 1,123
acquisition of prepaid expenses - (1,725) (1,495)
Use of prepaid expenses - 1,495 1,940
transfer to properties-available-for-sale - 8,711 -
- 8,471 566
change in net financial assets (179,903) (54,156) (38,633)
net financial assets, beginning of year 321,861 321,861 360,494
net financial assets, end of year $ 141,958 $ $267,705 $ $321,861
To be read in conjunction with the Notes to the Consolidated Financial Statements
For the year ended December 31, 2011, with comparative figures for 2010[in thousands of dollars]
9
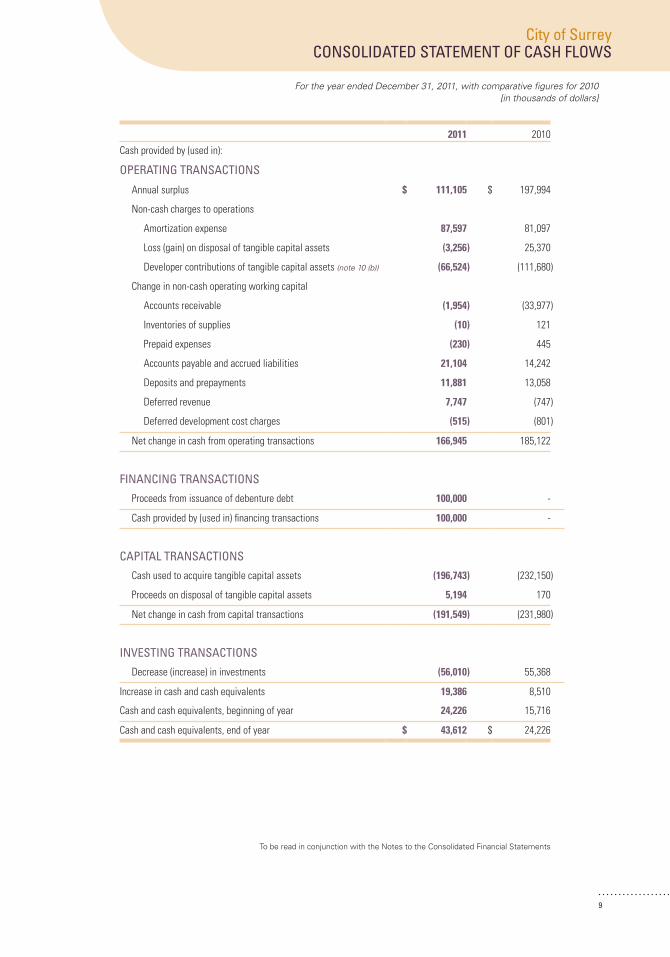
City of surreyCONsOLIDATED sTATEMENT OF CAsH FLOWs
2011 2010
cash provided by (used in):
OpERATING TRANsACTIONs
annual surplus $ 111,105 $ 197,994
non-cash charges to operations
amortization expense 87,597 81,097
Loss (gain) on disposal of tangible capital assets (3,256) 25,370
developer contributions of tangible capital assets (note 10 (b)) (66,524) (111,680)
change in non-cash operating working capital
accounts receivable (1,954) (33,977)
Inventories of supplies (10) 121
Prepaid expenses (230) 445
accounts payable and accrued liabilities 21,104 14,242
deposits and prepayments 11,881 13,058
deferred revenue 7,747 (747)
deferred development cost charges (515) (801)
net change in cash from operating transactions 166,945 185,122
FINANCING TRANsACTIONs
Proceeds from issuance of debenture debt 100,000 -
cash provided by (used in) financing transactions 100,000 -
CApITAL TRANsACTIONs
cash used to acquire tangible capital assets (196,743) (232,150)
Proceeds on disposal of tangible capital assets 5,194 170
net change in cash from capital transactions (191,549) (231,980)
INVEsTING TRANsACTIONs
decrease (increase) in investments (56,010) 55,368
Increase in cash and cash equivalents 19,386 8,510
cash and cash equivalents, beginning of year 24,226 15,716
cash and cash equivalents, end of year $ 43,612 $ 24,226
NOTEs TO THE CONsOLIDATED FINANCIAL sTATEMENTs
For the year ended December 31, 2011 [tabular amounts in thousands of dollars]
10
City of surrey
GENERAL
the city of Surrey (the “city”) is incorporated under the Local Government act of british columbia. the city’s principal activities include the provision of local government services to residents of the incorporated area. these include administrative, protective, infrastructure, environmental, recreational, water and sewer services.
1. sIGNIFICANT ACCOUNTING pOLICIEs
the consolidated financial statements of the city are prepared in accordance with canadian generally accepted accounting principles as prescribed by the Public Sector accounting board (“PSab”) of the canadian Institute of chartered accountants.
a) Basis of consolidation the consolidated financial statements are comprised of the city’s operating, capital and reserve funds consolidated with the Surrey Public Library (the “Library”), Surrey city development corporation (“Scdc”) and Surrey homelessness and housing Society (“ShhS”). the Library, ShhS and Scdc are consolidated as they are considered to be controlled by the city by virtue of their board being appointed by the city. Inter-fund transactions, fund balances and activities are eliminated on consolidation.
the Library Services activities are maintained in separate operating and capital funds.
i) Operating Funds these funds include the General, Water, and Sewer & drainage operating funds as well as the Surrey Public Library. they are used to record the operating costs of the services provided by the city.
ii) Capital Funds these funds include the General, Water, and Sewer & drainage capital funds and Library Services. they are used to record the acquisition costs of tangible capital assets and any related debt outstanding.
iii) Reserve Funds Under the community charter of british columbia, city council may, by by-law, establish reserve funds for specified purposes. money in a reserve fund, and interest earned thereon, must be expended only for the purpose for which the fund was established. If the amount in a reserve fund is greater than required for the purposes for which it was established, city council may transfer all or part of the amount to another reserve fund.
NOTEs TO THE CONsOLIDATED FINANCIAL sTATEMENTs
For the year ended December 31, 2011 [tabular amounts in thousands of dollars]
11
City of surrey
1. sIGNIFICANT ACCOUNTING pOLICIEs (CONTINUED):
a) Basis of consolidation (continued):
iv) Other Entities Funds these funds include the operations of Surrey city development corporation and Surrey homelessness and housing Society. the consolidated financial statements reflect the assets, liabilities, revenues and expenses of the organizations listed below. all inter-departmental and inter-entity accounts and transactions between these organizations are eliminated upon consolidation.
Surrey city development corporation (“Scdc”) has the following government partnerships:
i) Surrey City Investment Corporation (“SCIC”) - (100% owned and fully consolidated by SCDC)
ScIc has a 50% ownership in nine holding companies that are proportionately consolidated and referred to as the “tower holdings”.
ScIc has a 29.4% ownership in the following entities (proportionately consolidated) referred to as the “Surrey centre Limited Partnerships”: • Surrey Centre Office Limited Partnership • Surrey Centre Hotel Limited Partnership • Surrey Centre Residential Partnership
ii) Grove Limited Partnership and Grove (G.P.) Inc. - (50% owned and proportionately consolidated)
iii) The Croydon Drive Development Limited Liability Partnership (“Croydon”) - (50% owned and proportionately consolidated)
v) Trust Funds these funds account for assets which must be administered as directed by agreement or statute for certain beneficiaries. In accordance with PSab recommendations on financial statement presentation for local governments, trust funds are not included in the city’s consolidated financial statements. trust funds administered by the city are presented in note 16.
NOTEs TO THE CONsOLIDATED FINANCIAL sTATEMENTs
For the year ended December 31, 2011 [tabular amounts in thousands of dollars]
12
City of surrey
1. sIGNIFICANT ACCOUNTING pOLICIEs (CONTINUED):
b) Basis of accounting the city follows the accrual method of accounting for revenues and expenses. revenues are normally recognized in the year in which they are earned and measurable. the city is required to act as the agent for the collection of certain taxes and fees imposed by other authorities. collections for other authorities are excluded from the city’s taxation revenues. expenses are recognized as they are incurred and measurable as a result of receipt of goods or services and/or the creation of a legal obligation to pay. Interest expense is accrued as the obligation is incurred.
c) Government transfers restricted transfers from governments are deferred and recognized as revenue in the year in which the related expenditures are incurred. Unrestricted transfers are recognized as revenue when received.
d) Revenue recognition revenues are recognized in the period in which the transactions or events occurred that gave rise to the revenues. all revenues are recorded on an accrual basis, except when the accruals cannot be determined with a reasonable degree of certainty or when their estimation is impracticable.
revenue recognition on sale of properties occurs when the city has transferred the significant risks and rewards of ownership. Property lease revenue includes all amounts earned from tenants including property tax and operating cost recoveries. Lease revenues are recognized on a straight-line basis over the term of the lease.
e) Deferred revenue the city defers the portion of the revenue collected from permits, licenses and other fees relating to services not yet rendered. this revenue is recognized in the year in which related inspections are performed or other related services are provided.
f) Investment income Investment income is reported as revenue in the period earned.
NOTEs TO THE CONsOLIDATED FINANCIAL sTATEMENTs
For the year ended December 31, 2011 [tabular amounts in thousands of dollars]
13
City of surrey
1. sIGNIFICANT ACCOUNTING pOLICIEs (CONTINUED):
g) Properties available-for-sale Properties available for sale include real estate properties which are ready and available to be sold and for which there is a market. they are valued at the lower of cost or expected net realizable value.
h) Investments Investments consist of demand deposits, short-term investments, bonds and debentures and are recorded at amortized cost. discounts and premiums arising on the purchase of these investments are amortized over the term of the investments on a straight line basis.
i) Employee future benefits the city and its employees participate in a municipal Pension Plan. the municipal Pension Plan is a multi-employer contributory defined benefit pension plan. Payments in the year are expensed.
Sick leave and post-employment benefits also accrue to the city’s employees. the liability relating to these benefits is actuarially determined based on length of service, best estimates of retirement ages and expected future salary and wage increases. the liabilities under these benefit plans are accrued based on projected benefits pro-rated as employees render services necessary to earn the future benefits.
the liability for event driven benefits, such as disability benefits, is calculated after the event occurs.
j) Budget data the unaudited budget data presented in these consolidated financial statements was included in the city of Surrey 2011 – 2015 consolidated financial Plan and was adopted through by-law #17299 on January 10, 2011.
NOTEs TO THE CONsOLIDATED FINANCIAL sTATEMENTs
For the year ended December 31, 2011 [tabular amounts in thousands of dollars]
14
City of surrey
1 sIGNIFICANT ACCOUNTING pOLICIEs (CONTINUED):
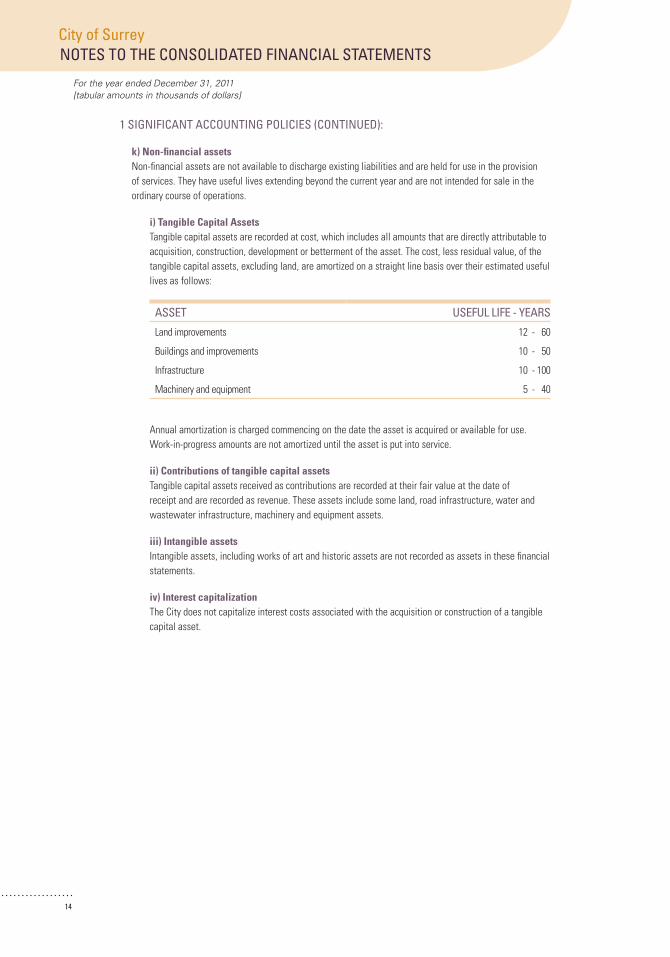
k) Non-financial assets non-financial assets are not available to discharge existing liabilities and are held for use in the provision of services. they have useful lives extending beyond the current year and are not intended for sale in the ordinary course of operations.
i) Tangible Capital Assets tangible capital assets are recorded at cost, which includes all amounts that are directly attributable to acquisition, construction, development or betterment of the asset. the cost, less residual value, of the tangible capital assets, excluding land, are amortized on a straight line basis over their estimated useful lives as follows:
AssET UsEFUL LIFE - yEARs
Land improvements 12 - 60
buildings and improvements 10 - 50
Infrastructure 10 - 100
machinery and equipment 5 - 40
annual amortization is charged commencing on the date the asset is acquired or available for use. Work-in-progress amounts are not amortized until the asset is put into service.
ii) Contributions of tangible capital assets tangible capital assets received as contributions are recorded at their fair value at the date of receipt and are recorded as revenue. these assets include some land, road infrastructure, water and wastewater infrastructure, machinery and equipment assets.
iii) Intangible assets Intangible assets, including works of art and historic assets are not recorded as assets in these financial statements.
iv) Interest capitalization the city does not capitalize interest costs associated with the acquisition or construction of a tangible capital asset.

NOTEs TO THE CONsOLIDATED FINANCIAL sTATEMENTs
For the year ended December 31, 2011 [tabular amounts in thousands of dollars]
15
City of surrey
1. sIGNIFICANT ACCOUNTING pOLICIEs (CONTINUED):
k) Non-financial assets (continued):
v) Leases Leases are classified as capital or operating leases. Leases which transfer substantially all the benefits and risks incidental to ownership of the property are accounted for as capital leases and the related asset and obligation are recorded on the statement of financial position. all other leases are accounted for as operating leases and the related lease payments are charged to expenses as incurred.
vi) Inventories of supplies Inventories of supplies held for consumption are recorded at the lower of cost and replacement cost.
vii) Work-in-progress Work-in-progress are costs related to projects currently under planning, development or construction that will result in a finished asset at a future date. costs related to planning, development or construction are capitalized until such time as the property is ready for use or sale.
viii) Impairment of properties available for sale and tangible capital assets Properties available for sale and tangible capital assets are written down when conditions indicate that they no longer contribute to the city’s ability to provide goods and services, or when the value of future economic benefits are less than their net book value. any impairment is accounted for as an expense in the consolidated statement of operations. no impairments were identified or recorded during the year ended december 31, 2011 and 2010.
l) Use of estimates the preparation of financial statements requires management to make estimates and assumptions that affect the reported amounts of assets and liabilities, the disclosure of contingent assets and liabilities at the date of the financial statements, and the reported amounts of revenues and expenses during the period. Significant estimates include assumptions used in estimating contributed tangible capital assets, developer contributions, useful life for amortization, provisions for accrued liabilities, contingencies and in performing actuarial valuations of employee future benefits.
actual results could differ from these estimates.
m) Segment disclosure a segment is defined as a distinguishable activity or group of activities of a government for which it is appropriate to separately report financial information to achieve the objectives of the standard. the city of Surrey has provided definitions of segments used by the city (note1(a)) as well as presented financial information in segmented format (note 19).
NOTEs TO THE CONsOLIDATED FINANCIAL sTATEMENTs
For the year ended December 31, 2011 [tabular amounts in thousands of dollars]
16
City of surrey
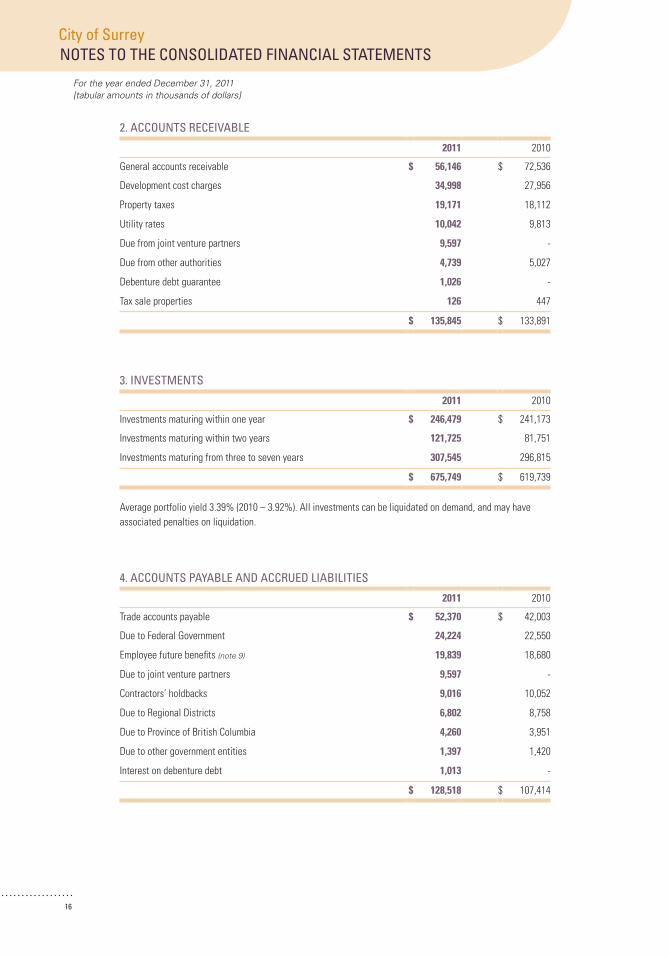
2. ACCOUNTs RECEIVABLE
2011 2010
General accounts receivable $ 56,146 $ 72,536
development cost charges 34,998 27,956
Property taxes 19,171 18,112
Utility rates 10,042 9,813
due from joint venture partners 9,597 -
due from other authorities 4,739 5,027
debenture debt guarantee 1,026 -
tax sale properties 126 447
$ 135,845 $ 133,891
3. INVEsTMENTs
2011 2010
Investments maturing within one year $ 246,479 $ 241,173
Investments maturing within two years 121,725 81,751
Investments maturing from three to seven years 307,545 296,815
$ 675,749 $ 619,739
average portfolio yield 3.39% (2010 – 3.92%). all investments can be liquidated on demand, and may have associated penalties on liquidation.
4. ACCOUNTs pAyABLE AND ACCRUED LIABILITIEs
2011 2010
trade accounts payable $ 52,370 $ 42,003
due to federal Government 24,224 22,550
employee future benefits (note 9) 19,839 18,680
due to joint venture partners 9,597 -
contractors’ holdbacks 9,016 10,052
due to regional districts 6,802 8,758
due to Province of british columbia 4,260 3,951
due to other government entities 1,397 1,420
Interest on debenture debt 1,013 -
$ 128,518 $ 107,414

NOTEs TO THE CONsOLIDATED FINANCIAL sTATEMENTs
For the year ended December 31, 2011 [tabular amounts in thousands of dollars]
17
City of surrey
5. DEpOsITs AND pREpAyMENTs
2011 2010
Deposits
future works $ 31,552 $ 28,383
Planning and permits 30,832 26,815
engineering 22,661 21,642
capital deposits 14,174 13,624
Pavement cuts 4,121 3,500
boulevard trees 2,699 2,703
Latecomer 1,563 542
other deposits 1,357 1,087
developer works agreement 1,315 514
amenities 271 252
Total Deposits $ 110,545 $ 99,062
Prepaids
taxes $ 28,286 $ 26,891
Utilities 1,859 2,074
tax sale private purchase payment 586 1,368
other prepaids 2 2
Total Prepaids 30,733 30,335
Total Deposits and Prepaids $ 141,278 $ 129,397
6. DEFERRED REVENUE
2011 2010
neighbourhood concept Plans $ 20,657 $ 19,460
development/building Permits 16,205 13,822
other 5,665 1,498
$ 42,527 $ 34,780
NOTEs TO THE CONsOLIDATED FINANCIAL sTATEMENTs
For the year ended December 31, 2011 [tabular amounts in thousands of dollars]
18
City of surrey
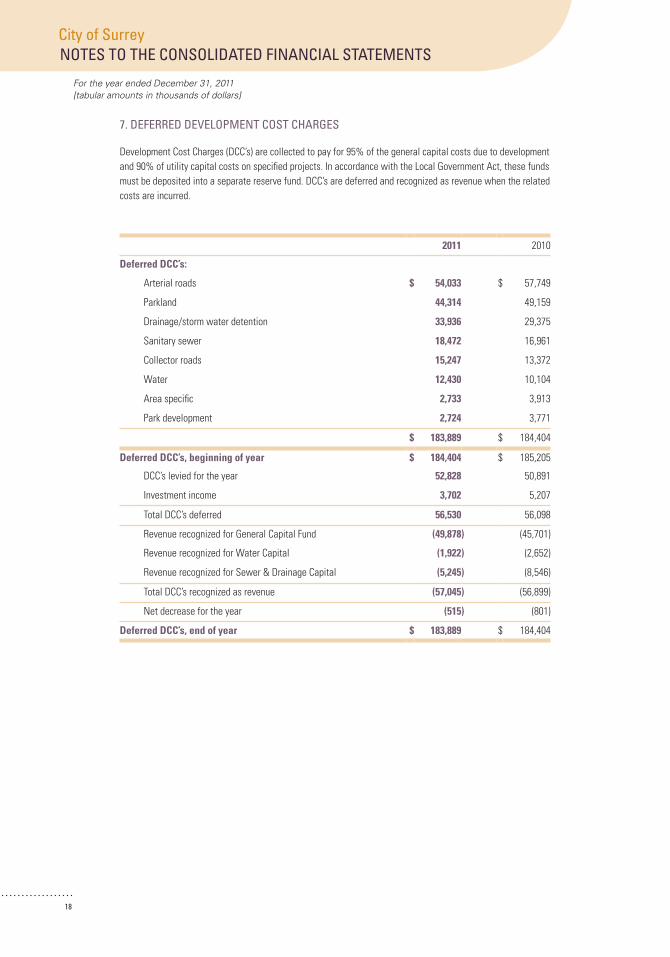
7. DEFERRED DEVELOpMENT COsT CHARGEs
development cost charges (dcc’s) are collected to pay for 95% of the general capital costs due to development and 90% of utility capital costs on specified projects. In accordance with the Local Government act, these funds must be deposited into a separate reserve fund. dcc’s are deferred and recognized as revenue when the related costs are incurred.
2011 2010
Deferred DCC’s:
arterial roads $ 54,033 $ 57,749
Parkland 44,314 49,159
drainage/storm water detention 33,936 29,375
Sanitary sewer 18,472 16,961
collector roads 15,247 13,372
Water 12,430 10,104
area specific 2,733 3,913
Park development 2,724 3,771
$ 183,889 $ 184,404
Deferred DCC’s, beginning of year $ 184,404 $ 185,205
dcc’s levied for the year 52,828 50,891
Investment income 3,702 5,207
total dcc’s deferred 56,530 56,098
revenue recognized for General capital fund (49,878) (45,701)
revenue recognized for Water capital (1,922) (2,652)
revenue recognized for Sewer & drainage capital (5,245) (8,546)
total dcc’s recognized as revenue (57,045) (56,899)
net decrease for the year (515) (801)
Deferred DCC’s, end of year $ 183,889 $ 184,404
NOTEs TO THE CONsOLIDATED FINANCIAL sTATEMENTs
For the year ended December 31, 2011 [tabular amounts in thousands of dollars]
19
City of surrey
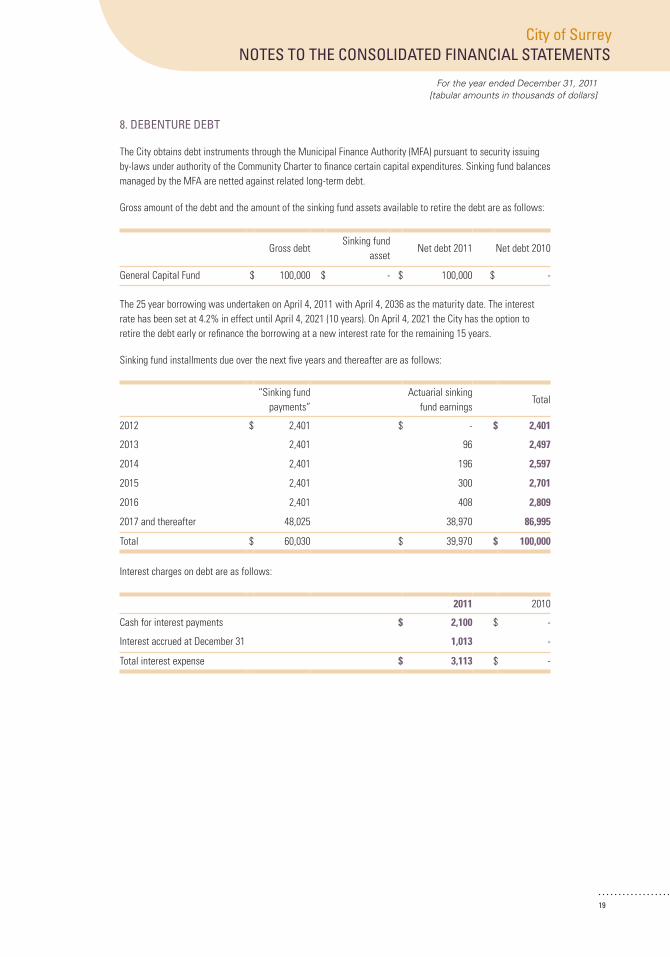
8. DEBENTURE DEBT
the city obtains debt instruments through the municipal finance authority (mfa) pursuant to security issuing by-laws under authority of the community charter to finance certain capital expenditures. Sinking fund balances managed by the mfa are netted against related long-term debt.
Gross amount of the debt and the amount of the sinking fund assets available to retire the debt are as follows:
Gross debtSinking fund
assetnet debt 2011 net debt 2010
General capital fund $ 100,000 $ - $ 100,000 $ -
the 25 year borrowing was undertaken on april 4, 2011 with april 4, 2036 as the maturity date. the interest rate has been set at 4.2% in effect until april 4, 2021 (10 years). on april 4, 2021 the city has the option to retire the debt early or refinance the borrowing at a new interest rate for the remaining 15 years.
Sinking fund installments due over the next five years and thereafter are as follows:
“Sinking fund payments”
actuarial sinking fund earnings
total
2012 $ 2,401 $ - $ 2,401
2013 2,401 96 2,497
2014 2,401 196 2,597
2015 2,401 300 2,701
2016 2,401 408 2,809
2017 and thereafter 48,025 38,970 86,995
total $ 60,030 $ 39,970 $ 100,000
Interest charges on debt are as follows:
2011 2010
cash for interest payments $ 2,100 $ -
Interest accrued at december 31 1,013 -
total interest expense $ 3,113 $ -
NOTEs TO THE CONsOLIDATED FINANCIAL sTATEMENTs
For the year ended December 31, 2011 [tabular amounts in thousands of dollars]
20
City of surrey
9. EMpLOyEE FUTURE BENEFITs
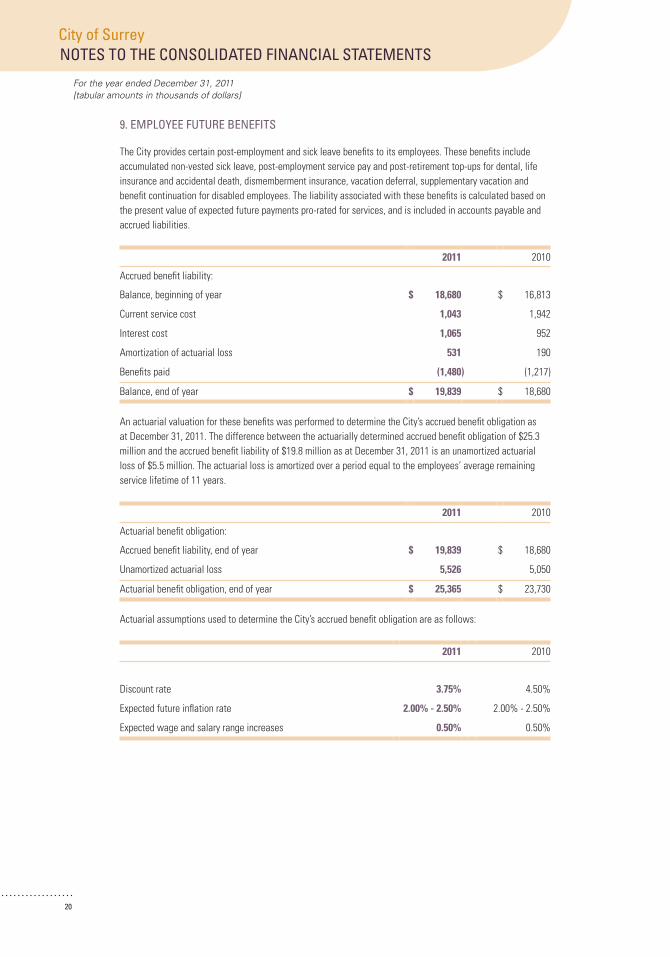
the city provides certain post-employment and sick leave benefits to its employees. these benefits include accumulated non-vested sick leave, post-employment service pay and post-retirement top-ups for dental, life insurance and accidental death, dismemberment insurance, vacation deferral, supplementary vacation and benefit continuation for disabled employees. the liability associated with these benefits is calculated based on the present value of expected future payments pro-rated for services, and is included in accounts payable and accrued liabilities.
2011 2010
accrued benefit liability:
balance, beginning of year $ 18,680 $ 16,813
current service cost 1,043 1,942
Interest cost 1,065 952
amortization of actuarial loss 531 190
benefits paid (1,480) (1,217)
balance, end of year $ 19,839 $ 18,680
an actuarial valuation for these benefits was performed to determine the city’s accrued benefit obligation as at december 31, 2011. the difference between the actuarially determined accrued benefit obligation of $25.3 million and the accrued benefit liability of $19.8 million as at december 31, 2011 is an unamortized actuarial loss of $5.5 million. the actuarial loss is amortized over a period equal to the employees’ average remaining service lifetime of 11 years.
2011 2010
actuarial benefit obligation:
accrued benefit liability, end of year $ 19,839 $ 18,680
Unamortized actuarial loss 5,526 5,050
actuarial benefit obligation, end of year $ 25,365 $ 23,730
actuarial assumptions used to determine the city’s accrued benefit obligation are as follows:
2011 2010
discount rate 3.75% 4.50%
expected future inflation rate 2.00% - 2.50% 2.00% - 2.50%
expected wage and salary range increases 0.50% 0.50%

NOTEs TO THE CONsOLIDATED FINANCIAL sTATEMENTs
For the year ended December 31, 2011 [tabular amounts in thousands of dollars]
21
City of surrey
10. TANGIBLE CApITAL AssETs
Costbalance at
december 31, 2010 additionsdisposals / WIP
allocationsBalance at
December 31, 2011Land and land improvements $ 1,660,727 $ 54,179 $ 9,722 $ 1,705,184
buildings 247,470 54,535 1,407 300,598
Infrastructure 3,771,527 83,640 2,254 3,852,913
machinery and equipment 125,800 22,950 5,701 143,049
Land under road 2,392,460 47,714 - 2,440,174
Work-in-Progress 192,554 263,267 263,018 192,803
total $ 8,390,538 $ 526,285 $ 282,102 $ 8,634,721
Accumulated Amortizationbalance at
december 31, 2010 amortization
accumulated amortization on
disposalsBalance at
December 31, 2011Land and land improvements $ 58,559 $ 3,604 $ 646 $ 61,517
buildings 142,750 7,632 1,182 149,200
Infrastructure 1,104,390 62,099 1,076 1,165,413
machinery and equipment 66,490 14,262 5,531 75,221
total $ 1,372,189 $ 87,597 $ 8,435 $ 1,451,351
Net Book Value december 31, 2010 December 31, 2011Land and land improvements $ 1,602,168 $ 1,643,667
buildings 104,720 151,398
Infrastructure 2,667,137 2,687,500
machinery and equipment 59,310 67,828
Land under road 2,392,460 2,440,174
Work-in-Progress 192,554 192,803
total $ 7,018,349 $ 7,183,370

NOTEs TO THE CONsOLIDATED FINANCIAL sTATEMENTs
For the year ended December 31, 2011 [tabular amounts in thousands of dollars]
22
City of surrey
10. TANGIBLE CApITAL AssETs (CONTINUED):
a) Work-in-progress Work-in-progress having a value of $192.8 million (2010 - $192.6 million) has not been amortized. amortization of these assets will commence when each specific asset is put into service.
b) Contributed Tangible Capital Assets contributed capital assets have been recognized at fair market value at the date of contribution. the value of contributed assets received during the year is $66.5 million (2010 - $111.7 million) comprised of roads infrastructure in the amount of $56 million (2010 - $63.5 million), water and wastewater infrastructure in the amount of $7.9 million (2010 - $44.7 million) and land and improvements in the amount of $2.6 million (2010 - $3.5 million).
c) Tangible Capital Assets Disclosed at Nominal Values Where an estimate of fair value could not be made, the tangible capital asset was recognized at a nominal value.
d) Intangible assets the city manages and controls various works of art and non-operational historical cultural assets including buildings, artifacts, paintings and sculptures located at city sites and public display areas. these assets are not recorded as tangible capital assets and are not amortized.
e) Write-down of Tangible Capital Assets there were no write downs of tangible capital assets during the year (2010 $nil).
NOTEs TO THE CONsOLIDATED FINANCIAL sTATEMENTs
For the year ended December 31, 2011 [tabular amounts in thousands of dollars]
23
City of surrey
11. ACCUMULATED sURpLUs
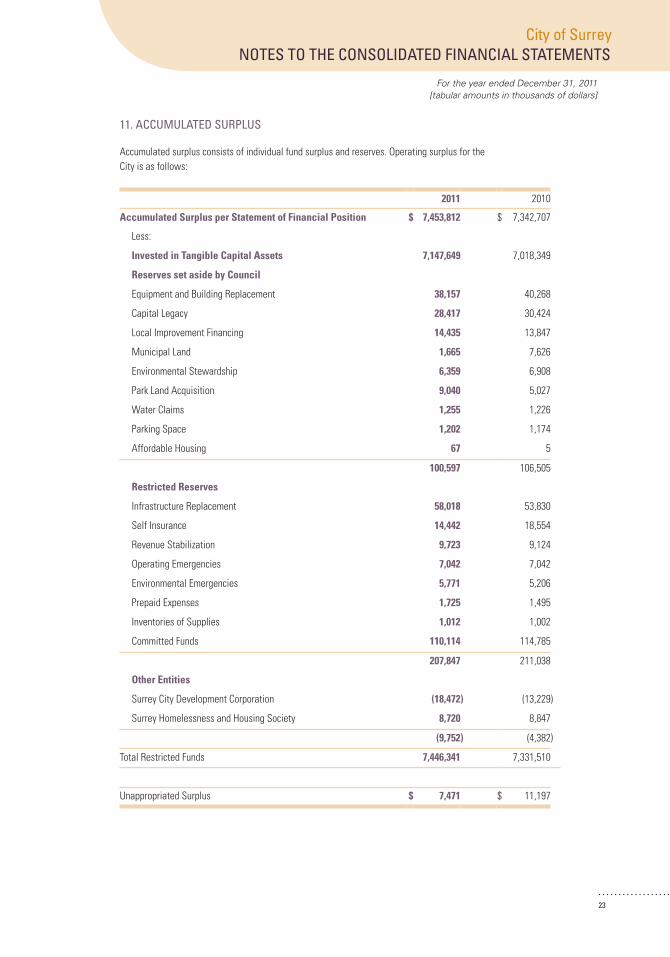
accumulated surplus consists of individual fund surplus and reserves. operating surplus for the city is as follows:
2011 2010
Accumulated Surplus per Statement of Financial Position $ 7,453,812 $ 7,342,707
Less:
Invested in Tangible Capital Assets 7,147,649 7,018,349
Reserves set aside by Council
equipment and building replacement 38,157 40,268
capital Legacy 28,417 30,424
Local Improvement financing 14,435 13,847
municipal Land 1,665 7,626
environmental Stewardship 6,359 6,908
Park Land acquisition 9,040 5,027
Water claims 1,255 1,226
Parking Space 1,202 1,174
affordable housing 67 5
100,597 106,505
Restricted Reserves
Infrastructure replacement 58,018 53,830
Self Insurance 14,442 18,554
revenue Stabilization 9,723 9,124
operating emergencies 7,042 7,042
environmental emergencies 5,771 5,206
Prepaid expenses 1,725 1,495
Inventories of Supplies 1,012 1,002
committed funds 110,114 114,785
207,847 211,038
Other Entities
Surrey city development corporation (18,472) (13,229)
Surrey homelessness and housing Society 8,720 8,847
(9,752) (4,382)
total restricted funds 7,446,341 7,331,510
Unappropriated Surplus $ 7,471 $ 11,197
NOTEs TO THE CONsOLIDATED FINANCIAL sTATEMENTs
For the year ended December 31, 2011 [tabular amounts in thousands of dollars]
24
City of surrey
12. COMMITMENTs AND CONTINGENCIEs
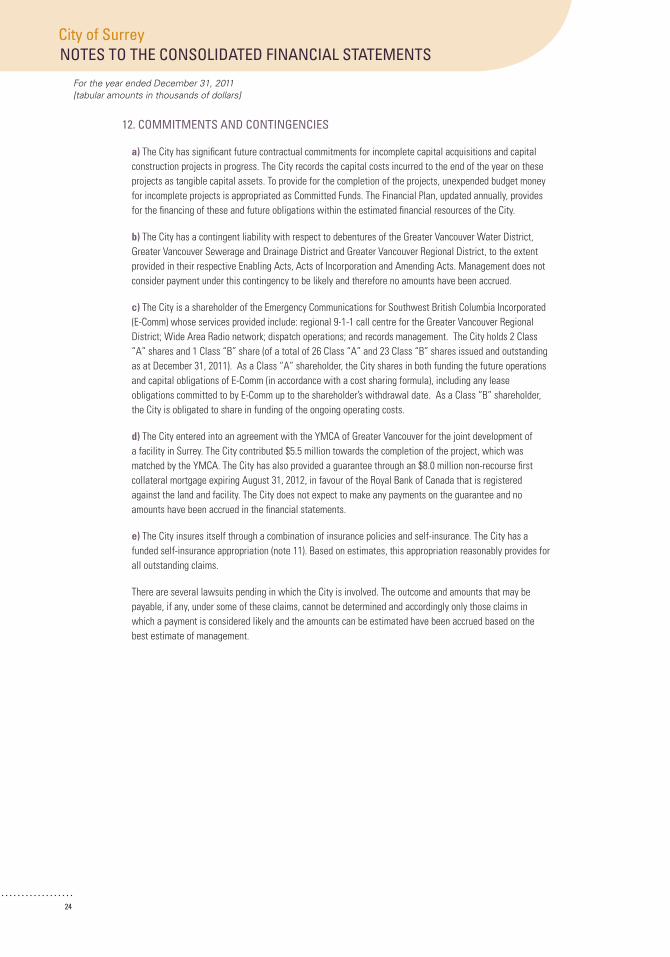
a) the city has significant future contractual commitments for incomplete capital acquisitions and capital construction projects in progress. the city records the capital costs incurred to the end of the year on these projects as tangible capital assets. to provide for the completion of the projects, unexpended budget money for incomplete projects is appropriated as committed funds. the financial Plan, updated annually, provides for the financing of these and future obligations within the estimated financial resources of the city.
b) the city has a contingent liability with respect to debentures of the Greater Vancouver Water district, Greater Vancouver Sewerage and drainage district and Greater Vancouver regional district, to the extent provided in their respective enabling acts, acts of Incorporation and amending acts. management does not consider payment under this contingency to be likely and therefore no amounts have been accrued.
c) the city is a shareholder of the emergency communications for Southwest british columbia Incorporated (e-comm) whose services provided include: regional 9-1-1 call centre for the Greater Vancouver regional district; Wide area radio network; dispatch operations; and records management. the city holds 2 class “a” shares and 1 class “b” share (of a total of 26 class “a” and 23 class “b” shares issued and outstanding as at december 31, 2011). as a class “a” shareholder, the city shares in both funding the future operations and capital obligations of e-comm (in accordance with a cost sharing formula), including any lease obligations committed to by e-comm up to the shareholder’s withdrawal date. as a class “b” shareholder, the city is obligated to share in funding of the ongoing operating costs.
d) the city entered into an agreement with the ymca of Greater Vancouver for the joint development of a facility in Surrey. the city contributed $5.5 million towards the completion of the project, which was matched by the ymca. the city has also provided a guarantee through an $8.0 million non-recourse first collateral mortgage expiring august 31, 2012, in favour of the royal bank of canada that is registered against the land and facility. the city does not expect to make any payments on the guarantee and no amounts have been accrued in the financial statements.
e) the city insures itself through a combination of insurance policies and self-insurance. the city has a funded self-insurance appropriation (note 11). based on estimates, this appropriation reasonably provides for all outstanding claims.
there are several lawsuits pending in which the city is involved. the outcome and amounts that may be payable, if any, under some of these claims, cannot be determined and accordingly only those claims in which a payment is considered likely and the amounts can be estimated have been accrued based on the best estimate of management.
NOTEs TO THE CONsOLIDATED FINANCIAL sTATEMENTs
For the year ended December 31, 2011 [tabular amounts in thousands of dollars]
25
City of surrey
12. COMMITMENTs AND CONTINGENCIEs (CONTINUED):
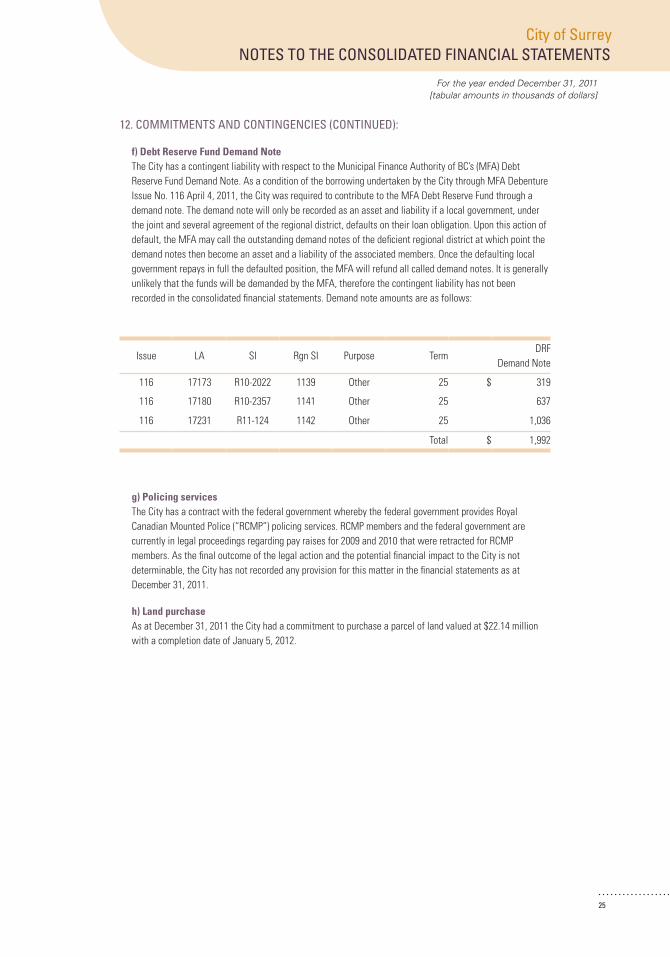
f) Debt Reserve Fund Demand Note the city has a contingent liability with respect to the municipal finance authority of bc’s (mfa) debt reserve fund demand note. as a condition of the borrowing undertaken by the city through mfa debenture Issue no. 116 april 4, 2011, the city was required to contribute to the mfa debt reserve fund through a demand note. the demand note will only be recorded as an asset and liability if a local government, under the joint and several agreement of the regional district, defaults on their loan obligation. Upon this action of default, the mfa may call the outstanding demand notes of the deficient regional district at which point the demand notes then become an asset and a liability of the associated members. once the defaulting local government repays in full the defaulted position, the mfa will refund all called demand notes. It is generally unlikely that the funds will be demanded by the mfa, therefore the contingent liability has not been recorded in the consolidated financial statements. demand note amounts are as follows:
Issue La SI rgn SI Purpose termdrf
demand note
116 17173 r10-2022 1139 other 25 $ 319
116 17180 r10-2357 1141 other 25 637
116 17231 r11-124 1142 other 25 1,036
total $ 1,992
g) Policing services the city has a contract with the federal government whereby the federal government provides royal canadian mounted Police (“rcmP”) policing services. rcmP members and the federal government are currently in legal proceedings regarding pay raises for 2009 and 2010 that were retracted for rcmP members. as the final outcome of the legal action and the potential financial impact to the city is not determinable, the city has not recorded any provision for this matter in the financial statements as at december 31, 2011.
h) Land purchase as at december 31, 2011 the city had a commitment to purchase a parcel of land valued at $22.14 million with a completion date of January 5, 2012.
NOTEs TO THE CONsOLIDATED FINANCIAL sTATEMENTs
For the year ended December 31, 2011 [tabular amounts in thousands of dollars]
26
City of surrey
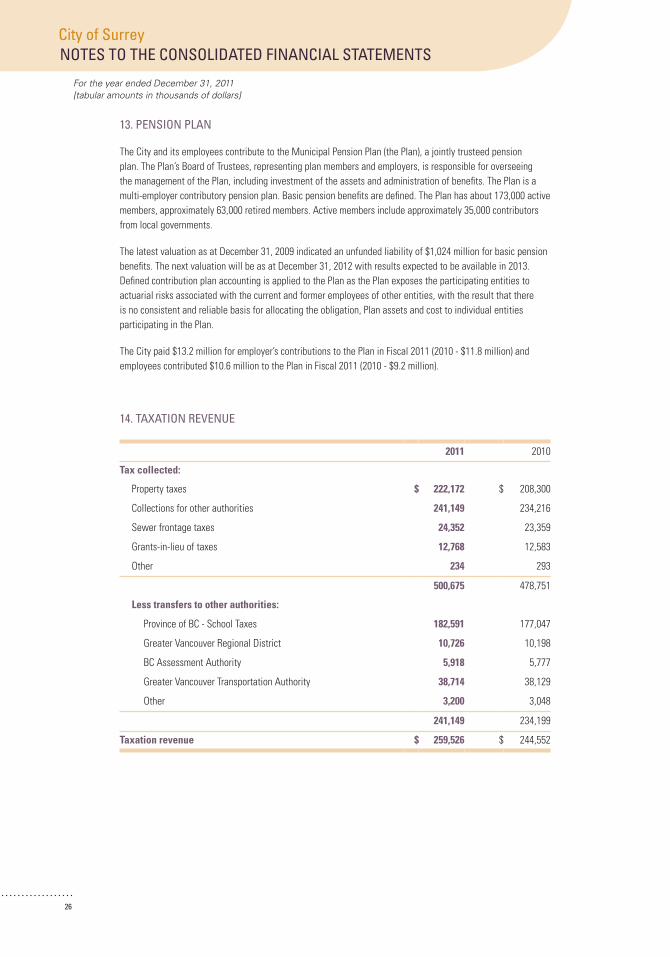
13. pENsION pLAN
the city and its employees contribute to the municipal Pension Plan (the Plan), a jointly trusteed pension plan. the Plan’s board of trustees, representing plan members and employers, is responsible for overseeing the management of the Plan, including investment of the assets and administration of benefits. the Plan is a multi-employer contributory pension plan. basic pension benefits are defined. the Plan has about 173,000 active members, approximately 63,000 retired members. active members include approximately 35,000 contributors from local governments.
the latest valuation as at december 31, 2009 indicated an unfunded liability of $1,024 million for basic pension benefits. the next valuation will be as at december 31, 2012 with results expected to be available in 2013. defined contribution plan accounting is applied to the Plan as the Plan exposes the participating entities to actuarial risks associated with the current and former employees of other entities, with the result that there is no consistent and reliable basis for allocating the obligation, Plan assets and cost to individual entities participating in the Plan.
the city paid $13.2 million for employer’s contributions to the Plan in fiscal 2011 (2010 - $11.8 million) and employees contributed $10.6 million to the Plan in fiscal 2011 (2010 - $9.2 million).
14. TAXATION REVENUE
2011 2010
Tax collected:
Property taxes $ 222,172 $ 208,300
collections for other authorities 241,149 234,216
Sewer frontage taxes 24,352 23,359
Grants-in-lieu of taxes 12,768 12,583
other 234 293
500,675 478,751
Less transfers to other authorities:
Province of bc - School taxes 182,591 177,047
Greater Vancouver regional district 10,726 10,198
bc assessment authority 5,918 5,777
Greater Vancouver transportation authority 38,714 38,129
other 3,200 3,048
241,149 234,199
Taxation revenue $ 259,526 $ 244,552
NOTEs TO THE CONsOLIDATED FINANCIAL sTATEMENTs
For the year ended December 31, 2011 [tabular amounts in thousands of dollars]
27
City of surrey
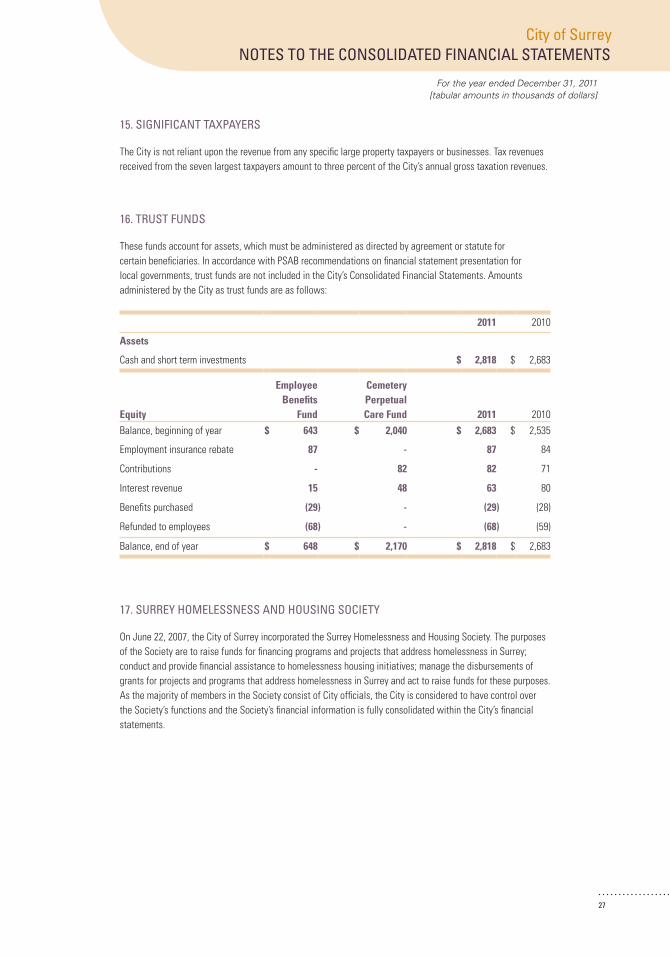
15. sIGNIFICANT TAXpAyERs
the city is not reliant upon the revenue from any specific large property taxpayers or businesses. tax revenues received from the seven largest taxpayers amount to three percent of the city’s annual gross taxation revenues.
16. TRUsT FUNDs
these funds account for assets, which must be administered as directed by agreement or statute for certain beneficiaries. In accordance with PSab recommendations on financial statement presentation for local governments, trust funds are not included in the city’s consolidated financial Statements. amounts administered by the city as trust funds are as follows:
2011 2010
Assets
cash and short term investments $ 2,818 $ 2,683
Equity
Employee Benefits
Fund
Cemetery Perpetual Care Fund 2011 2010
balance, beginning of year $ 643 $ 2,040 $ 2,683 $ 2,535
employment insurance rebate 87 - 87 84
contributions - 82 82 71
Interest revenue 15 48 63 80
benefits purchased (29) - (29) (28)
refunded to employees (68) - (68) (59)
balance, end of year $ 648 $ 2,170 $ 2,818 $ 2,683
17. sURREy HOMELEssNEss AND HOUsING sOCIETy
on June 22, 2007, the city of Surrey incorporated the Surrey homelessness and housing Society. the purposes of the Society are to raise funds for financing programs and projects that address homelessness in Surrey; conduct and provide financial assistance to homelessness housing initiatives; manage the disbursements of grants for projects and programs that address homelessness in Surrey and act to raise funds for these purposes. as the majority of members in the Society consist of city officials, the city is considered to have control over the Society’s functions and the Society’s financial information is fully consolidated within the city’s financial statements.
NOTEs TO THE CONsOLIDATED FINANCIAL sTATEMENTs
For the year ended December 31, 2011 [tabular amounts in thousands of dollars]
28
City of surrey
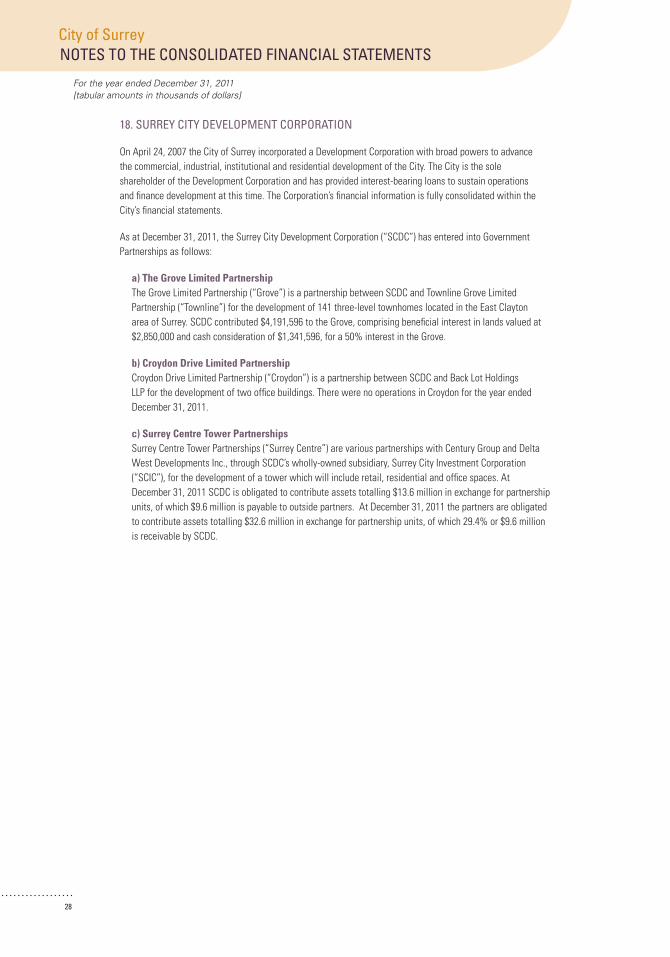
18. sURREy CITy DEVELOpMENT CORpORATION
on april 24, 2007 the city of Surrey incorporated a development corporation with broad powers to advance the commercial, industrial, institutional and residential development of the city. the city is the sole shareholder of the development corporation and has provided interest-bearing loans to sustain operations and finance development at this time. the corporation’s financial information is fully consolidated within the city’s financial statements.
as at december 31, 2011, the Surrey city development corporation (“Scdc”) has entered into Government Partnerships as follows:
a) The Grove Limited Partnership the Grove Limited Partnership (“Grove”) is a partnership between Scdc and townline Grove Limited Partnership (“townline”) for the development of 141 three-level townhomes located in the east clayton area of Surrey. Scdc contributed $4,191,596 to the Grove, comprising beneficial interest in lands valued at $2,850,000 and cash consideration of $1,341,596, for a 50% interest in the Grove.
b) Croydon Drive Limited Partnership croydon drive Limited Partnership (“croydon”) is a partnership between Scdc and back Lot holdings LLP for the development of two office buildings. there were no operations in croydon for the year ended december 31, 2011.
c) Surrey Centre Tower Partnerships Surrey centre tower Partnerships (“Surrey centre”) are various partnerships with century Group and delta West developments Inc., through Scdc’s wholly-owned subsidiary, Surrey city Investment corporation (“ScIc”), for the development of a tower which will include retail, residential and office spaces. at december 31, 2011 Scdc is obligated to contribute assets totalling $13.6 million in exchange for partnership units, of which $9.6 million is payable to outside partners. at december 31, 2011 the partners are obligated to contribute assets totalling $32.6 million in exchange for partnership units, of which 29.4% or $9.6 million is receivable by Scdc.
NOTEs TO THE CONsOLIDATED FINANCIAL sTATEMENTs
For the year ended December 31, 2011 [tabular amounts in thousands of dollars]
29
City of surrey
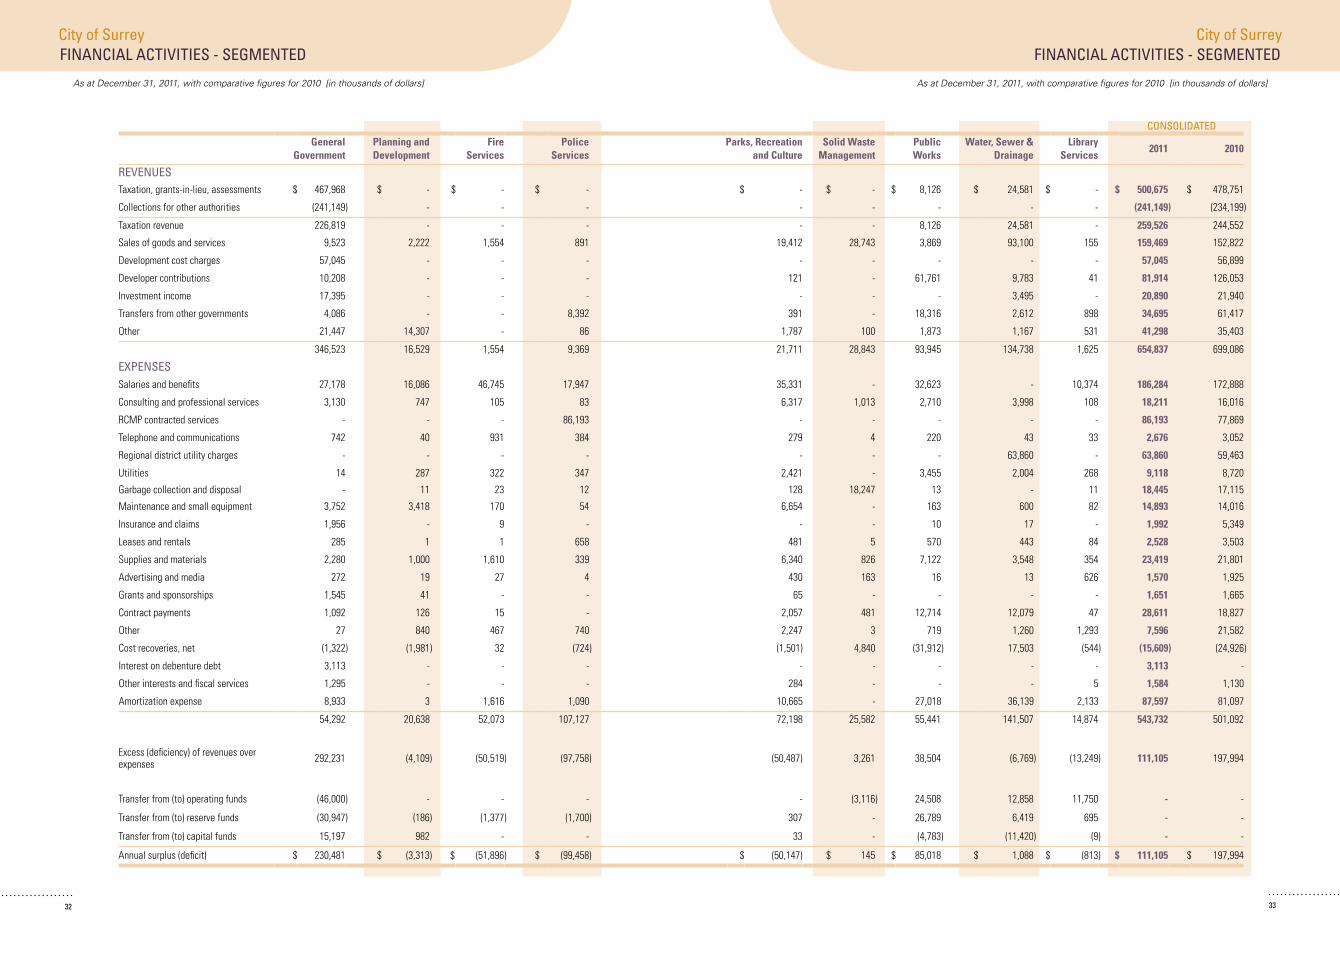
19. sEGMENTED INFORMATION
the city of Surrey is a diversified municipal government institution that provides a wide range of services to the citizens of Surrey, including fire and Police Services; Parks, recreation and culture Services; General Government Services; Public Works Services; Solid Waste management Services; Planning and development Services; Water, Sewer and drainage Services; and Surrey Public Library Services. for management reporting purposes the Government’s operations and activities are organized and reported by Service area. Service areas were created for the purpose of recording specific activities and related objectives in accordance with legislated requirements.
city departments and the activities for which they are responsible are reported in these Service areas. the departments listed in the Segmented Information, along with the services that each department provides are listed below:
Fire Services the mandate of the fire department is to enforce codes and maintain security by protecting life, property and the environment through the provision of emergency response services.
Police Services the mandate of the Police department includes enforcing laws, preventing crime, and maintaining peace, order and security.
Parks, Recreation and Culture Services – Parks, Recreation and Culture Department the Parks, recreation and culture department is responsible for planning, facilitating the development of, operating and maintaining high quality parks, recreation facilities, and cultural services.
General Government Services – Mayor & Councillors’ Department, City Manager’s Department, Finance & Technology Department, Human Resources Department, Surrey City Development Corporation and Surrey Homelessness and Housing Society General Government Services includes those elements of the organization with responsibility for adopting by-laws, adopting administrative policy, levying taxes, acquiring, disposing and managing city assets, ensuring effective financial management, monitoring performance and ensuring that high quality city service standards are met. General Government Services also include the Surrey city development corporation, which engages in the provision of consulting services, land development activities, property acquisition/disposal and asset management. General Government Services also includes the Surrey homelessness and housing Society, which focuses on addressing homelessness in Surrey through raising funds and the provision of grants to worthy projects.

NOTEs TO THE CONsOLIDATED FINANCIAL sTATEMENTs
For the year ended December 31, 2011 [tabular amounts in thousands of dollars]
30
City of surrey
19. sEGMENTED INFORMATION (CONTINUED):
Public Works Services and Solid Waste Management Services – Engineering Department the engineering department is responsible for the delivery of municipal services (garbage collection, recycling, and transportation systems).
Planning and Development Services – Planning and Development Department the Planning and development department is responsible for preparing land use plans, by-laws and policies for sustainable development of the city and for reviewing and approving new land and building development.
Water, Sewer & Drainage Services – Water Department and Sewer & Drainage Department the Water, Sewer & drainage Utilities operate the water system to distribute water, operate the network of sewer mains, to collect sewage and convey such sewage to treatment plants and to operate the network of storm sewers and pump stations for stormwater management.
Surrey Public Library Services the Surrey Public Library provides access to local and global information through its nine Library branches located throughout the city.

NOTEs TO THE CONsOLIDATED FINANCIAL sTATEMENTs
For the year ended December 31, 2011 [tabular amounts in thousands of dollars]
31
City of surrey
32 33
City of surrey City of surrey
As at December 31, 2011, with comparative figures for 2010 [in thousands of dollars]As at December 31, 2011, with comparative figures for 2010 [in thousands of dollars]
FINANCIAL ACTIVITIEs - sEGMENTEDFINANCIAL ACTIVITIEs - sEGMENTED
CONsOLIDATEDGeneral
GovernmentPlanning and Development
Fire Services
Police Services
Parks, Recreation and Culture
Solid Waste Management
Public Works
Water, Sewer & Drainage
Library Services
2011 2010
REVENUEstaxation, grants-in-lieu, assessments $ 467,968 $ - $ - $ - $ - $ - $ 8,126 $ 24,581 $ - $ 500,675 $ 478,751
collections for other authorities (241,149) - - - - - - - - (241,149) (234,199)
taxation revenue 226,819 - - - - - 8,126 24,581 - 259,526 244,552
Sales of goods and services 9,523 2,222 1,554 891 19,412 28,743 3,869 93,100 155 159,469 152,822
development cost charges 57,045 - - - - - - - - 57,045 56,899
developer contributions 10,208 - - - 121 - 61,761 9,783 41 81,914 126,053
Investment income 17,395 - - - - - - 3,495 - 20,890 21,940
transfers from other governments 4,086 - - 8,392 391 - 18,316 2,612 898 34,695 61,417
other 21,447 14,307 - 86 1,787 100 1,873 1,167 531 41,298 35,403
346,523 16,529 1,554 9,369 21,711 28,843 93,945 134,738 1,625 654,837 699,086
EXPENsEsSalaries and benefits 27,178 16,086 46,745 17,947 35,331 - 32,623 - 10,374 186,284 172,888
consulting and professional services 3,130 747 105 83 6,317 1,013 2,710 3,998 108 18,211 16,016
rcmP contracted services - - - 86,193 - - - - - 86,193 77,869
telephone and communications 742 40 931 384 279 4 220 43 33 2,676 3,052
regional district utility charges - - - - - - - 63,860 - 63,860 59,463
Utilities 14 287 322 347 2,421 - 3,455 2,004 268 9,118 8,720
Garbage collection and disposal - 11 23 12 128 18,247 13 - 11 18,445 17,115
maintenance and small equipment 3,752 3,418 170 54 6,654 - 163 600 82 14,893 14,016
Insurance and claims 1,956 - 9 - - - 10 17 - 1,992 5,349
Leases and rentals 285 1 1 658 481 5 570 443 84 2,528 3,503
Supplies and materials 2,280 1,000 1,610 339 6,340 826 7,122 3,548 354 23,419 21,801
advertising and media 272 19 27 4 430 163 16 13 626 1,570 1,925
Grants and sponsorships 1,545 41 - - 65 - - - - 1,651 1,665
contract payments 1,092 126 15 - 2,057 481 12,714 12,079 47 28,611 18,827
other 27 840 467 740 2,247 3 719 1,260 1,293 7,596 21,582
cost recoveries, net (1,322) (1,981) 32 (724) (1,501) 4,840 (31,912) 17,503 (544) (15,609) (24,926)
Interest on debenture debt 3,113 - - - - - - - - 3,113 -
other interests and fiscal services 1,295 - - - 284 - - - 5 1,584 1,130
amortization expense 8,933 3 1,616 1,090 10,665 - 27,018 36,139 2,133 87,597 81,097
54,292 20,638 52,073 107,127 72,198 25,582 55,441 141,507 14,874 543,732 501,092
excess (deficiency) of revenues over expenses 292,231 (4,109) (50,519) (97,758) (50,487) 3,261 38,504 (6,769) (13,249) 111,105 197,994
transfer from (to) operating funds (46,000) - - - - (3,116) 24,508 12,858 11,750 - -
transfer from (to) reserve funds (30,947) (186) (1,377) (1,700) 307 - 26,789 6,419 695 - -
transfer from (to) capital funds 15,197 982 - - 33 - (4,783) (11,420) (9) - -
annual surplus (deficit) $ 230,481 $ (3,313) $ (51,896) $ (99,458) $ (50,147) $ 145 $ 85,018 $ 1,088 $ (813) $ 111,105 $ 197,994
NOTEs TO THE CONsOLIDATED FINANCIAL sTATEMENTs
34
City of surrey
For the year ended December 31, 2011 [tabular amounts in thousands of dollars]
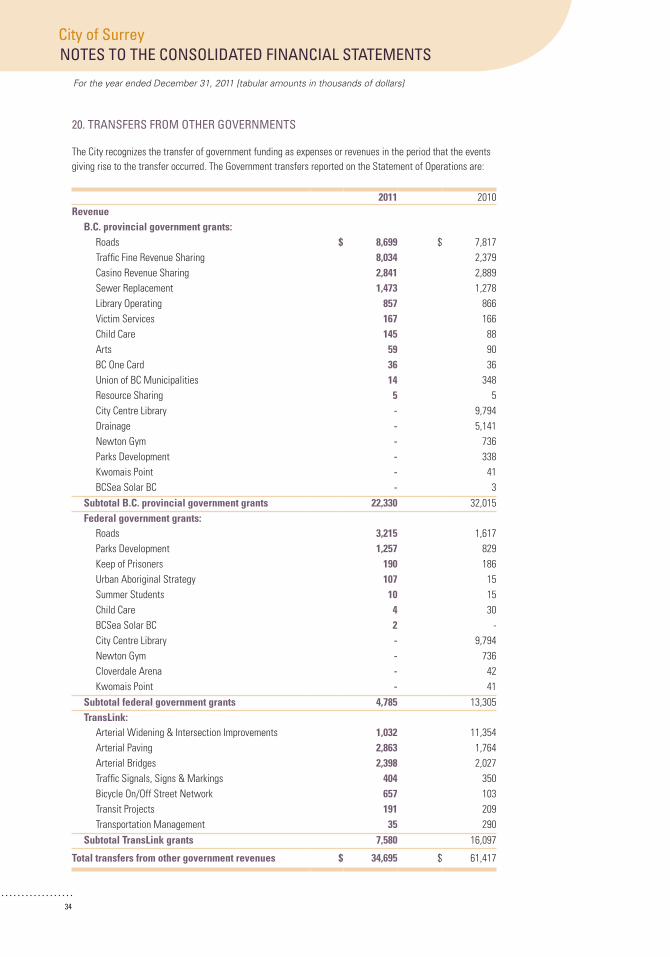
20. TRANsFERs FROM OTHER GOVERNMENTs
the city recognizes the transfer of government funding as expenses or revenues in the period that the events giving rise to the transfer occurred. the Government transfers reported on the Statement of operations are:
2011 2010Revenue
B.C. provincial government grants:roads $ 8,699 $ 7,817 traffic fine revenue Sharing 8,034 2,379 casino revenue Sharing 2,841 2,889 Sewer replacement 1,473 1,278 Library operating 857 866 Victim Services 167 166 child care 145 88 arts 59 90 bc one card 36 36Union of bc municipalities 14 348 resource Sharing 5 5 city centre Library - 9,794 drainage - 5,141 newton Gym - 736 Parks development - 338 Kwomais Point - 41bcSea Solar bc - 3
Subtotal B.C. provincial government grants 22,330 32,015 Federal government grants:
roads 3,215 1,617 Parks development 1,257 829 Keep of Prisoners 190 186 Urban aboriginal Strategy 107 15 Summer Students 10 15 child care 4 30 bcSea Solar bc 2 - city centre Library - 9,794 newton Gym - 736 cloverdale arena - 42 Kwomais Point - 41
Subtotal federal government grants 4,785 13,305 TransLink:
arterial Widening & Intersection Improvements 1,032 11,354 arterial Paving 2,863 1,764 arterial bridges 2,398 2,027 traffic Signals, Signs & markings 404 350 bicycle on/off Street network 657 103 transit Projects 191 209 transportation management 35 290
Subtotal TransLink grants 7,580 16,097
Total transfers from other government revenues $ 34,695 $ 61,417
NOTEs TO THE CONsOLIDATED FINANCIAL sTATEMENTs
For the year ended December 31, 2011 [tabular amounts in thousands of dollars]
35
City of surrey
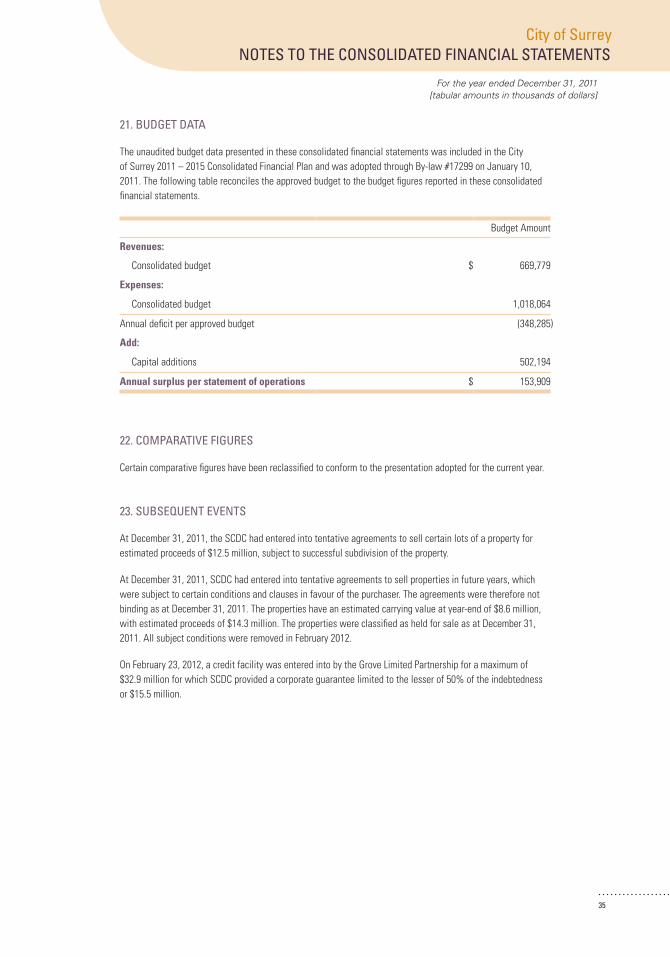
21. BUDGET DATA
the unaudited budget data presented in these consolidated financial statements was included in the city of Surrey 2011 – 2015 consolidated financial Plan and was adopted through by-law #17299 on January 10, 2011. the following table reconciles the approved budget to the budget figures reported in these consolidated financial statements.
budget amount
Revenues:
consolidated budget $ 669,779
Expenses:
consolidated budget 1,018,064
annual deficit per approved budget (348,285)
Add:
capital additions 502,194
Annual surplus per statement of operations $ 153,909
22. COMpARATIVE FIGUREs
certain comparative figures have been reclassified to conform to the presentation adopted for the current year.
23. sUBsEqUENT EVENTs
at december 31, 2011, the Scdc had entered into tentative agreements to sell certain lots of a property for estimated proceeds of $12.5 million, subject to successful subdivision of the property.
at december 31, 2011, Scdc had entered into tentative agreements to sell properties in future years, which were subject to certain conditions and clauses in favour of the purchaser. the agreements were therefore not binding as at december 31, 2011. the properties have an estimated carrying value at year-end of $8.6 million, with estimated proceeds of $14.3 million. the properties were classified as held for sale as at december 31, 2011. all subject conditions were removed in february 2012.
on february 23, 2012, a credit facility was entered into by the Grove Limited Partnership for a maximum of $32.9 million for which Scdc provided a corporate guarantee limited to the lesser of 50% of the indebtedness or $15.5 million.
NOTEs TO THE CONsOLIDATED FINANCIAL sTATEMENTs
For the year ended December 31, 2011 [tabular amounts in thousands of dollars]
36
City of surrey
sUppLEMENTARy FINANCIAL INFORMATION

NOTEs TO THE CONsOLIDATED FINANCIAL sTATEMENTs
For the year ended December 31, 2011 [tabular amounts in thousands of dollars]
37
City of surrey
3938
As at December 31, 2011, with comparative figures for 2010[in thousands of dollars]
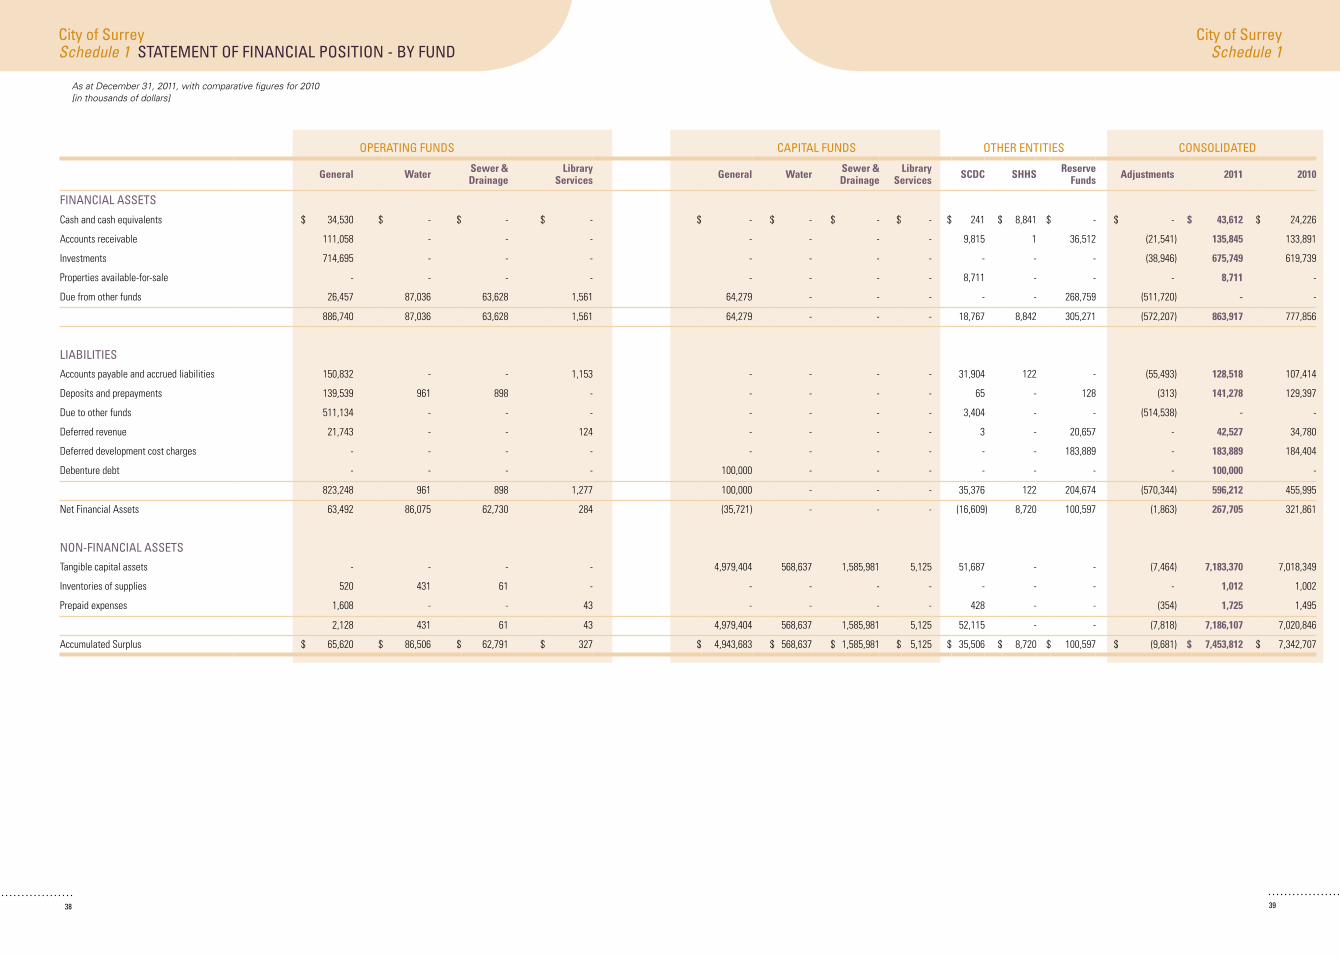
City of surrey City of surrey Schedule 1Schedule 1 sTATEMENT OF FINANCIAL POsITION - By FUND
OPERATING FUNDs CAPITAL FUNDs OTHER ENTITIEs CONsOLIDATED
General Water Sewer & Drainage
Library Services General Water Sewer &
DrainageLibrary
Services SCDC SHHS Reserve Funds Adjustments 2011 2010
FINANCIAL AssETs
cash and cash equivalents $ 34,530 $ - $ - $ - $ - $ - $ - $ - $ 241 $ 8,841 $ - $ - $ 43,612 $ 24,226
accounts receivable 111,058 - - - - - - - 9,815 1 36,512 (21,541) 135,845 133,891
Investments 714,695 - - - - - - - - - - (38,946) 675,749 619,739
Properties available-for-sale - - - - - - - - 8,711 - - - 8,711 -
due from other funds 26,457 87,036 63,628 1,561 64,279 - - - - - 268,759 (511,720) - -
886,740 87,036 63,628 1,561 64,279 - - - 18,767 8,842 305,271 (572,207) 863,917 777,856
LIABILITIEs
accounts payable and accrued liabilities 150,832 - - 1,153 - - - - 31,904 122 - (55,493) 128,518 107,414
deposits and prepayments 139,539 961 898 - - - - - 65 - 128 (313) 141,278 129,397
due to other funds 511,134 - - - - - - - 3,404 - - (514,538) - -
deferred revenue 21,743 - - 124 - - - - 3 - 20,657 - 42,527 34,780
deferred development cost charges - - - - - - - - - - 183,889 - 183,889 184,404
debenture debt - - - - 100,000 - - - - - - - 100,000 -
823,248 961 898 1,277 100,000 - - - 35,376 122 204,674 (570,344) 596,212 455,995
net financial assets 63,492 86,075 62,730 284 (35,721) - - - (16,609) 8,720 100,597 (1,863) 267,705 321,861
NON-FINANCIAL AssETs
tangible capital assets - - - - 4,979,404 568,637 1,585,981 5,125 51,687 - - (7,464) 7,183,370 7,018,349
Inventories of supplies 520 431 61 - - - - - - - - - 1,012 1,002
Prepaid expenses 1,608 - - 43 - - - - 428 - - (354) 1,725 1,495
2,128 431 61 43 4,979,404 568,637 1,585,981 5,125 52,115 - - (7,818) 7,186,107 7,020,846
accumulated Surplus $ 65,620 $ 86,506 $ 62,791 $ 327 $ 4,943,683 $ 568,637 $ 1,585,981 $ 5,125 $ 35,506 $ 8,720 $ 100,597 $ (9,681) $ 7,453,812 $ 7,342,707
4140
As at December 31, 2011, with comparative figures for 2010[in thousands of dollars]
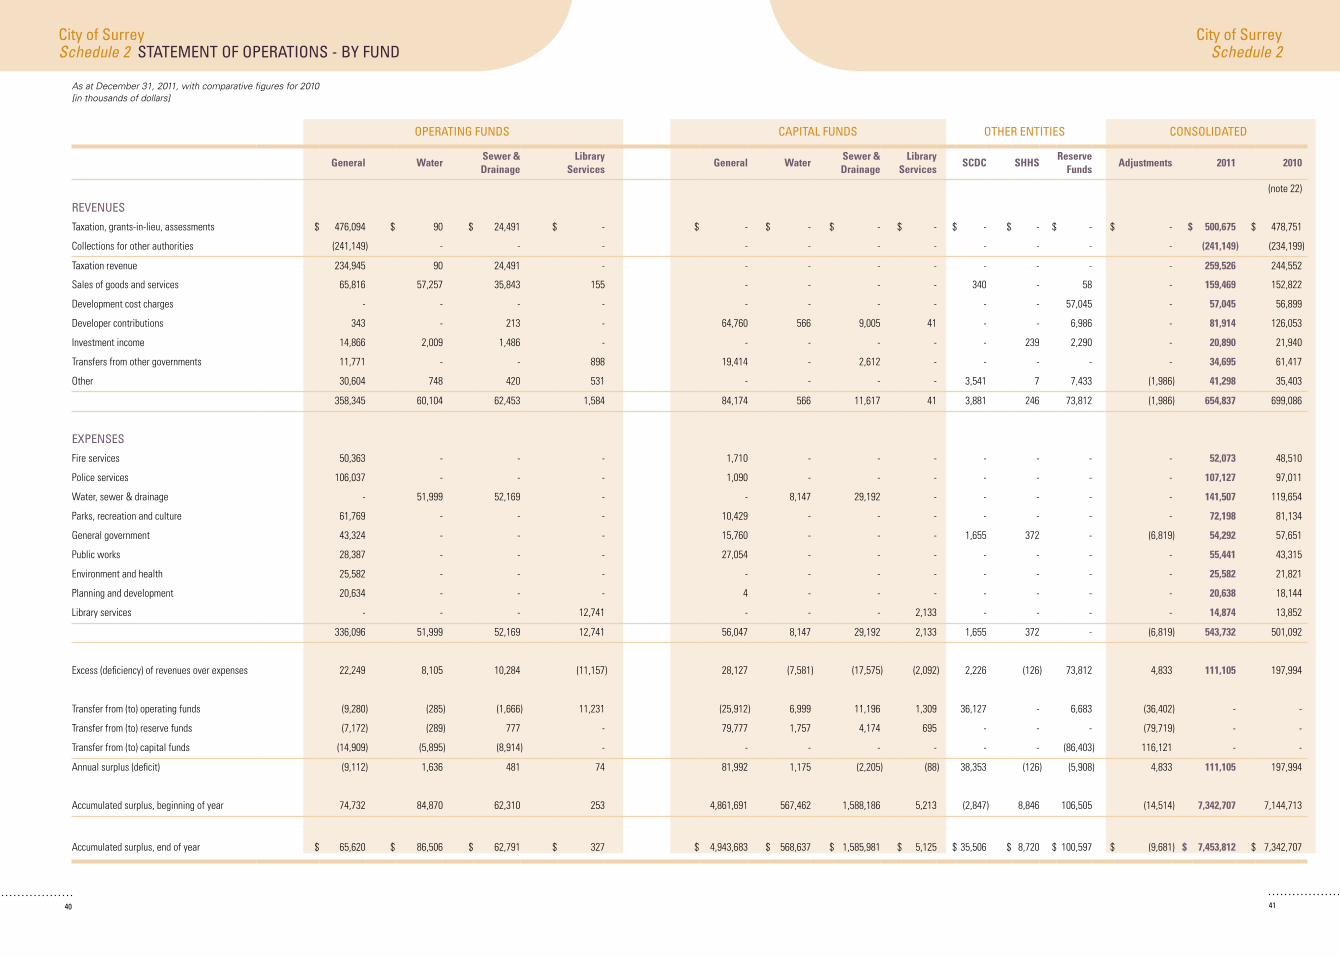
City of surrey City of surreySchedule 2Schedule 2 sTATEMENT OF OPERATIONs - By FUND
OPERATING FUNDs CAPITAL FUNDs OTHER ENTITIEs CONsOLIDATED
General WaterSewer & Drainage
Library Services
General WaterSewer & Drainage
Library Services
SCDC SHHSReserve
FundsAdjustments 2011 2010
(note 22)
REVENUEs
taxation, grants-in-lieu, assessments $ 476,094 $ 90 $ 24,491 $ - $ - $ - $ - $ - $ - $ - $ - $ - $ 500,675 $ 478,751
collections for other authorities (241,149) - - - - - - - - - - - (241,149) (234,199)
taxation revenue 234,945 90 24,491 - - - - - - - - - 259,526 244,552
Sales of goods and services 65,816 57,257 35,843 155 - - - - 340 - 58 - 159,469 152,822
development cost charges - - - - - - - - - - 57,045 - 57,045 56,899
developer contributions 343 - 213 - 64,760 566 9,005 41 - - 6,986 - 81,914 126,053
Investment income 14,866 2,009 1,486 - - - - - - 239 2,290 - 20,890 21,940
transfers from other governments 11,771 - - 898 19,414 - 2,612 - - - - - 34,695 61,417
other 30,604 748 420 531 - - - - 3,541 7 7,433 (1,986) 41,298 35,403
358,345 60,104 62,453 1,584 84,174 566 11,617 41 3,881 246 73,812 (1,986) 654,837 699,086
EXPENsEs
fire services 50,363 - - - 1,710 - - - - - - - 52,073 48,510
Police services 106,037 - - - 1,090 - - - - - - - 107,127 97,011
Water, sewer & drainage - 51,999 52,169 - - 8,147 29,192 - - - - - 141,507 119,654
Parks, recreation and culture 61,769 - - - 10,429 - - - - - - - 72,198 81,134
General government 43,324 - - - 15,760 - - - 1,655 372 - (6,819) 54,292 57,651
Public works 28,387 - - - 27,054 - - - - - - - 55,441 43,315
environment and health 25,582 - - - - - - - - - - - 25,582 21,821
Planning and development 20,634 - - - 4 - - - - - - - 20,638 18,144
Library services - - - 12,741 - - - 2,133 - - - - 14,874 13,852
336,096 51,999 52,169 12,741 56,047 8,147 29,192 2,133 1,655 372 - (6,819) 543,732 501,092
excess (deficiency) of revenues over expenses 22,249 8,105 10,284 (11,157) 28,127 (7,581) (17,575) (2,092) 2,226 (126) 73,812 4,833 111,105 197,994
transfer from (to) operating funds (9,280) (285) (1,666) 11,231 (25,912) 6,999 11,196 1,309 36,127 - 6,683 (36,402) - -
transfer from (to) reserve funds (7,172) (289) 777 - 79,777 1,757 4,174 695 - - - (79,719) - -
transfer from (to) capital funds (14,909) (5,895) (8,914) - - - - - - - (86,403) 116,121 - -
annual surplus (deficit) (9,112) 1,636 481 74 81,992 1,175 (2,205) (88) 38,353 (126) (5,908) 4,833 111,105 197,994
accumulated surplus, beginning of year 74,732 84,870 62,310 253 4,861,691 567,462 1,588,186 5,213 (2,847) 8,846 106,505 (14,514) 7,342,707 7,144,713
accumulated surplus, end of year $ 65,620 $ 86,506 $ 62,791 $ 327 $ 4,943,683 $ 568,637 $ 1,585,981 $ 5,125 $ 35,506 $ 8,720 $ 100,597 $ (9,681) $ 7,453,812 $ 7,342,707
42
As at December 31, 2011, with comparative figures for 2010[in thousands of dollars]
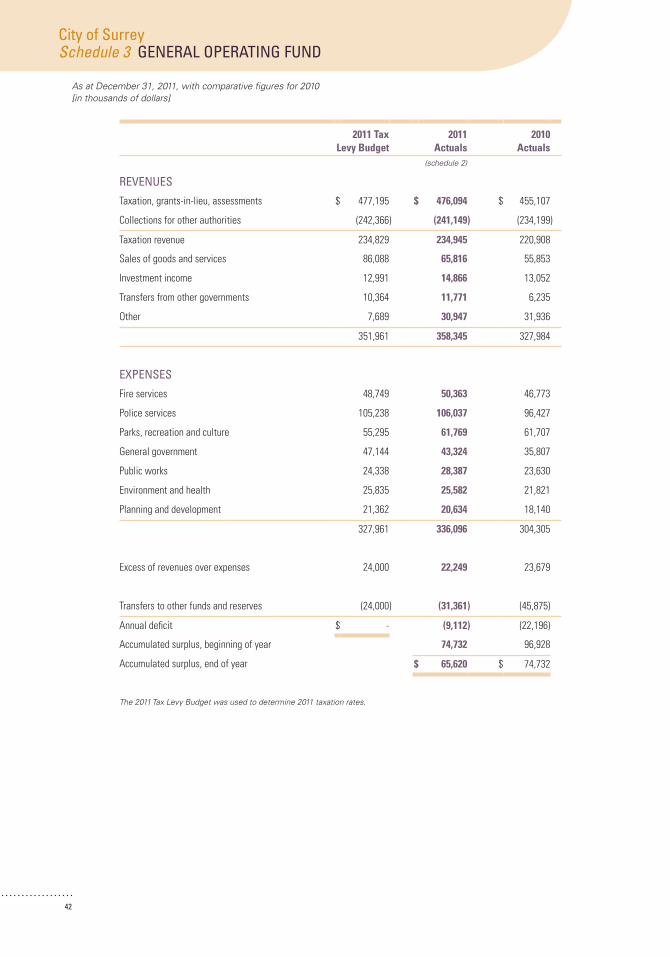
City of surreySchedule 3 GENERAL OpERATING FUND
2011 Tax Levy Budget
2011 Actuals
2010 Actuals
(schedule 2)
REVENUEs
taxation, grants-in-lieu, assessments $ 477,195 $ 476,094 $ 455,107
collections for other authorities (242,366) (241,149) (234,199)
taxation revenue 234,829 234,945 220,908
Sales of goods and services 86,088 65,816 55,853
Investment income 12,991 14,866 13,052
transfers from other governments 10,364 11,771 6,235
other 7,689 30,947 31,936
351,961 358,345 327,984
EXpENsEs
fire services 48,749 50,363 46,773
Police services 105,238 106,037 96,427
Parks, recreation and culture 55,295 61,769 61,707
General government 47,144 43,324 35,807
Public works 24,338 28,387 23,630
environment and health 25,835 25,582 21,821
Planning and development 21,362 20,634 18,140
327,961 336,096 304,305
excess of revenues over expenses 24,000 22,249 23,679
transfers to other funds and reserves (24,000) (31,361) (45,875)
annual deficit $ - (9,112) (22,196)
accumulated surplus, beginning of year 74,732 96,928
accumulated surplus, end of year $ 65,620 $ 74,732
The 2011 Tax Levy Budget was used to determine 2011 taxation rates.

43
For the year ended December 31, 2011, with comparative figures for 2010 [in thousands of dollars]
City of surreyWATER OpERATING FUND Schedule 4
2011 Utility Rates Budget
2011 Actuals
2010 Actuals
(schedule 2)
REVENUEs
taxation, grants-in-lieu, assessments $ 122 $ 90 $ 154
Sales of goods and services 55,114 57,257 60,435
Investment income 2,750 2,009 2,391
other 545 748 703
58,531 60,104 63,683
EXpENsEs
Water operations 49,585 51,999 46,288
49,585 51,999 46,288
excess of revenues over expenses 8,946 8,105 17,395
transfers to other funds and reserves (8,946) (6,469) (6,350)
annual surplus (deficit) $ - 1,636 11,045
accumulated surplus, beginning of year 84,870 73,825
accumulated surplus, end of year $ 86,506 $ 84,870
The 2011 Tax Levy Budget was used to determine 2011 taxation rates.
44
As at December 31, 2011, with comparative figures for 2010[in thousands of dollars]
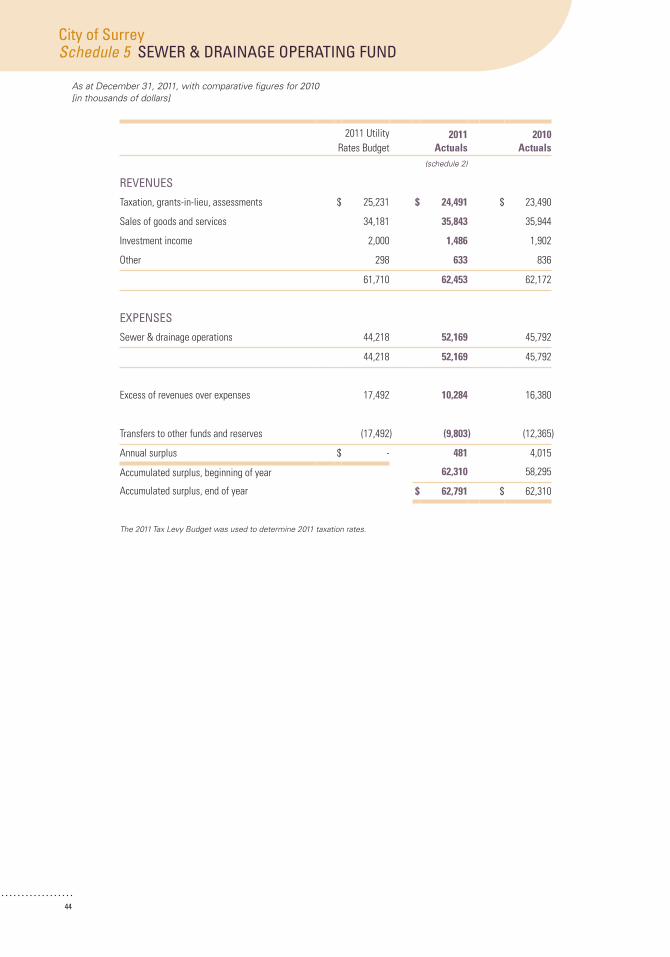
City of surreySchedule 5 sEWER & DRAINAGE OpERATING FUND
2011 Utility rates budget
2011 Actuals
2010 Actuals
(schedule 2)
REVENUEs
taxation, grants-in-lieu, assessments $ 25,231 $ 24,491 $ 23,490
Sales of goods and services 34,181 35,843 35,944
Investment income 2,000 1,486 1,902
other 298 633 836
61,710 62,453 62,172
EXpENsEs
Sewer & drainage operations 44,218 52,169 45,792
44,218 52,169 45,792
excess of revenues over expenses 17,492 10,284 16,380
transfers to other funds and reserves (17,492) (9,803) (12,365)
annual surplus $ - 481 4,015
accumulated surplus, beginning of year 62,310 58,295
accumulated surplus, end of year $ 62,791 $ 62,310
The 2011 Tax Levy Budget was used to determine 2011 taxation rates.

45
TITLE Schedule X
For the year ended December 31, 2011, with comparative figures for 2010 [in thousands of dollars]
City of surrey

4746
As at December 31, 2011, with comparative figures for 2010[in thousands of dollars]
City of surrey City of surrey Schedule 6Schedule 6 REsERVE FUNDs
Equipment and Building
Replacement***Municipal
LandPark Land
Acquisition*Capital
LegacyEnvironmental
Stewardship
**Local Improvement
FinancingWater
ClaimsAffordable
HousingParking
SpaceReservesSubtotal
balance, beginning of year $ 40,268 $ 7,626 $ 5,027 $ 30,424 $ 6,908 $ 13,847 $ 1,226 $ 5 $ 1,174 $ 106,505
Investment income 946 35 118 715 162 257 29 - 28 2,290
asset disposals 2 7,369 - - - - - 62 - 7,433
other revenue - 58 3,895 - - - - - - 3,953
948 7,462 4,013 715 162 257 29 62 28 13,676
transfers from (to)
operating funds 6,534 2,826 - 2,071 (74) 331 - - - 11,688
capital funds (9,593) (16,249) - (4,793) (637) - - - - (31,272)
(3,059) (13,423) - (2,722) (711) 331 - - - (19,584)
balance, end of year $ 38,157 $ 1,665 $ 9,040 $ 28,417 $ 6,359 $ 14,435 $ 1,255 $ 67 $ 1,202 $ 100,597
ADDITIONAL INFORMATION:
* Capital Legacy Reserve Fund (created by Bylaw in 1999):
the city borrows from this fund to finance capital projects. Principal and interest repayment schedules are based upon reasonable business case plans approved by city council. the debt costs are provided for annually within the operating budget of each capital project.
capital Legacy fund Prior to borrowing $ 49,330
Principal repayable, tom binnie/chuck bailey multi-purpose centre Loan (6,196)
Principal repayable, fraser heights fitness facility Loan (5,261)
Principal repayable, artificial turf fields - tamanawis Loan (2,902)
Principal repayable, artificial turf fields - hjorth & newton Loan (2,444)
Principal repayable, SPca Shared facility Loan (2,180)
Principal repayable, tom binnie covered youth Park Loan (900)
Principal repayable, newton athletic Park cricket Pitches Loan (541)
Principal repayable, Parking meters Loan (404)
Principal repayable, newton athletic Park master Plan Loan (65)
Principal repayable, Grandview heights Pool Loan (20)
funds on hand for financing Projects $ 28,417
** Local Improvement Financing Reserve Fund:the city borrows from this fund to finance local improvement projects. the property owners’ share, repayable with interest over 10 years, is levied against the benefiting properties. the city’s share, repayable with interest over 10 years, is provided for annually within General operating fund debt costs.
equity, december 31, 2011 $ 14,435
receivable from Property owners (2,923)
funds on hand for financing Projects $ 11,512
*** Municipal Land Reserve Fund:the city borrows from this fund to finance specified projects. Principal and interest repayment schedules are based upon reasonable business case plans approved by city council.
municipal Land fund Prior to borrowing $ 54,095
Principal repayable, campbell height Land acquisition Loan (31,387)
Principal repayable, city centre Land Loan (12,547)
Principal repayable, city centre Social Lands Loan (3,705)
Principal repayable, city centre development Loan (2,235)
Principal repayable, Social housing Loan (1,311)
Principal repayable, heritage railway Loan (1,243)
Principal repayable, bio-fuel facility Loan (2)
funds on hand for financing Projects $ 1,665
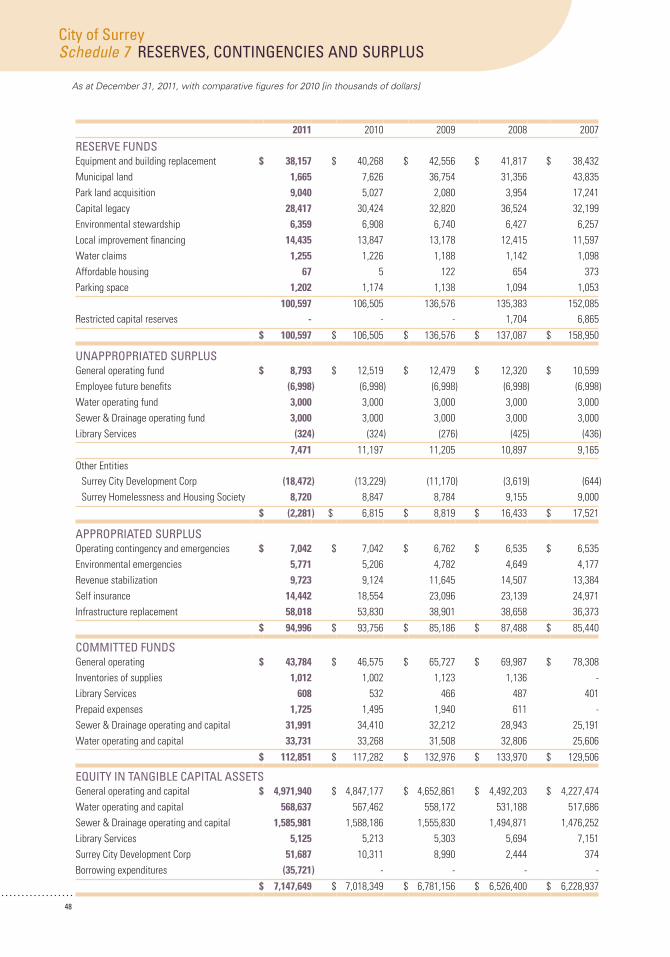
48
City of surrey
As at December 31, 2011, with comparative figures for 2010 [in thousands of dollars]
Schedule 7 REsERVEs, CONTINGENCIEs AND sURpLUs
2011 2010 2009 2008 2007
REsERVE FUNDsequipment and building replacement $ 38,157 $ 40,268 $ 42,556 $ 41,817 $ 38,432 municipal land 1,665 7,626 36,754 31,356 43,835 Park land acquisition 9,040 5,027 2,080 3,954 17,241 capital legacy 28,417 30,424 32,820 36,524 32,199 environmental stewardship 6,359 6,908 6,740 6,427 6,257 Local improvement financing 14,435 13,847 13,178 12,415 11,597 Water claims 1,255 1,226 1,188 1,142 1,098 affordable housing 67 5 122 654 373 Parking space 1,202 1,174 1,138 1,094 1,053
100,597 106,505 136,576 135,383 152,085 restricted capital reserves - - - 1,704 6,865
$ 100,597 $ 106,505 $ 136,576 $ 137,087 $ 158,950
UNAppROpRIATED sURpLUsGeneral operating fund $ 8,793 $ 12,519 $ 12,479 $ 12,320 $ 10,599 employee future benefits (6,998) (6,998) (6,998) (6,998) (6,998)Water operating fund 3,000 3,000 3,000 3,000 3,000 Sewer & drainage operating fund 3,000 3,000 3,000 3,000 3,000 Library Services (324) (324) (276) (425) (436)
7,471 11,197 11,205 10,897 9,165 other entities
Surrey city development corp (18,472) (13,229) (11,170) (3,619) (644)Surrey homelessness and housing Society 8,720 8,847 8,784 9,155 9,000
$ (2,281) $ 6,815 $ 8,819 $ 16,433 $ 17,521
AppROpRIATED sURpLUsoperating contingency and emergencies $ 7,042 $ 7,042 $ 6,762 $ 6,535 $ 6,535 environmental emergencies 5,771 5,206 4,782 4,649 4,177 revenue stabilization 9,723 9,124 11,645 14,507 13,384 Self insurance 14,442 18,554 23,096 23,139 24,971 Infrastructure replacement 58,018 53,830 38,901 38,658 36,373
$ 94,996 $ 93,756 $ 85,186 $ 87,488 $ 85,440
COMMITTED FUNDsGeneral operating $ 43,784 $ 46,575 $ 65,727 $ 69,987 $ 78,308 Inventories of supplies 1,012 1,002 1,123 1,136 - Library Services 608 532 466 487 401 Prepaid expenses 1,725 1,495 1,940 611 - Sewer & drainage operating and capital 31,991 34,410 32,212 28,943 25,191 Water operating and capital 33,731 33,268 31,508 32,806 25,606
$ 112,851 $ 117,282 $ 132,976 $ 133,970 $ 129,506
EqUITy IN TANGIBLE CApITAL AssETsGeneral operating and capital $ 4,971,940 $ 4,847,177 $ 4,652,861 $ 4,492,203 $ 4,227,474 Water operating and capital 568,637 567,462 558,172 531,188 517,686 Sewer & drainage operating and capital 1,585,981 1,588,186 1,555,830 1,494,871 1,476,252 Library Services 5,125 5,213 5,303 5,694 7,151 Surrey city development corp 51,687 10,311 8,990 2,444 374 borrowing expenditures (35,721) - - - -
$ 7,147,649 $ 7,018,349 $ 6,781,156 $ 6,526,400 $ 6,228,937
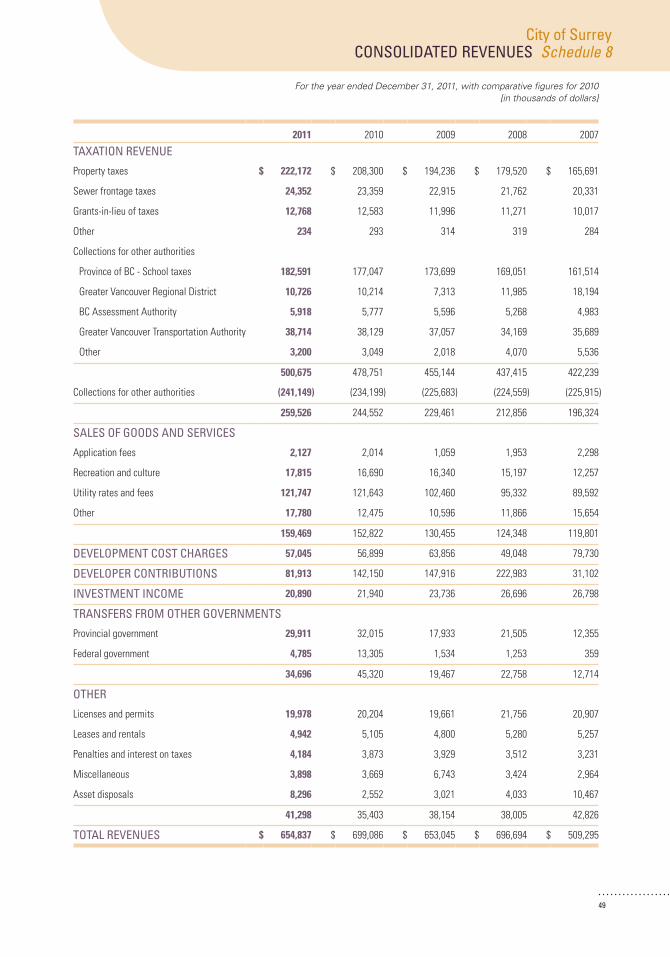
49
For the year ended December 31, 2011, with comparative figures for 2010 [in thousands of dollars]
City of surreyCONsOLIDATED REVENUEs Schedule 8
2011 2010 2009 2008 2007
TAXATION REVENUE
Property taxes $ 222,172 $ 208,300 $ 194,236 $ 179,520 $ 165,691
Sewer frontage taxes 24,352 23,359 22,915 21,762 20,331
Grants-in-lieu of taxes 12,768 12,583 11,996 11,271 10,017
other 234 293 314 319 284
collections for other authorities
Province of bc - School taxes 182,591 177,047 173,699 169,051 161,514
Greater Vancouver regional district 10,726 10,214 7,313 11,985 18,194
bc assessment authority 5,918 5,777 5,596 5,268 4,983
Greater Vancouver transportation authority 38,714 38,129 37,057 34,169 35,689
other 3,200 3,049 2,018 4,070 5,536
500,675 478,751 455,144 437,415 422,239
collections for other authorities (241,149) (234,199) (225,683) (224,559) (225,915)
259,526 244,552 229,461 212,856 196,324
sALEs OF GOODs AND sERVICEs
application fees 2,127 2,014 1,059 1,953 2,298
recreation and culture 17,815 16,690 16,340 15,197 12,257
Utility rates and fees 121,747 121,643 102,460 95,332 89,592
other 17,780 12,475 10,596 11,866 15,654
159,469 152,822 130,455 124,348 119,801
DEVELOpMENT COsT CHARGEs 57,045 56,899 63,856 49,048 79,730
DEVELOpER CONTRIBUTIONs 81,913 142,150 147,916 222,983 31,102
INVEsTMENT INCOME 20,890 21,940 23,736 26,696 26,798
TRANsFERs FROM OTHER GOVERNMENTs
Provincial government 29,911 32,015 17,933 21,505 12,355
federal government 4,785 13,305 1,534 1,253 359
34,696 45,320 19,467 22,758 12,714
OTHER
Licenses and permits 19,978 20,204 19,661 21,756 20,907
Leases and rentals 4,942 5,105 4,800 5,280 5,257
Penalties and interest on taxes 4,184 3,873 3,929 3,512 3,231
miscellaneous 3,898 3,669 6,743 3,424 2,964
asset disposals 8,296 2,552 3,021 4,033 10,467
41,298 35,403 38,154 38,005 42,826
TOTAL REVENUEs $ 654,837 $ 699,086 $ 653,045 $ 696,694 $ 509,295
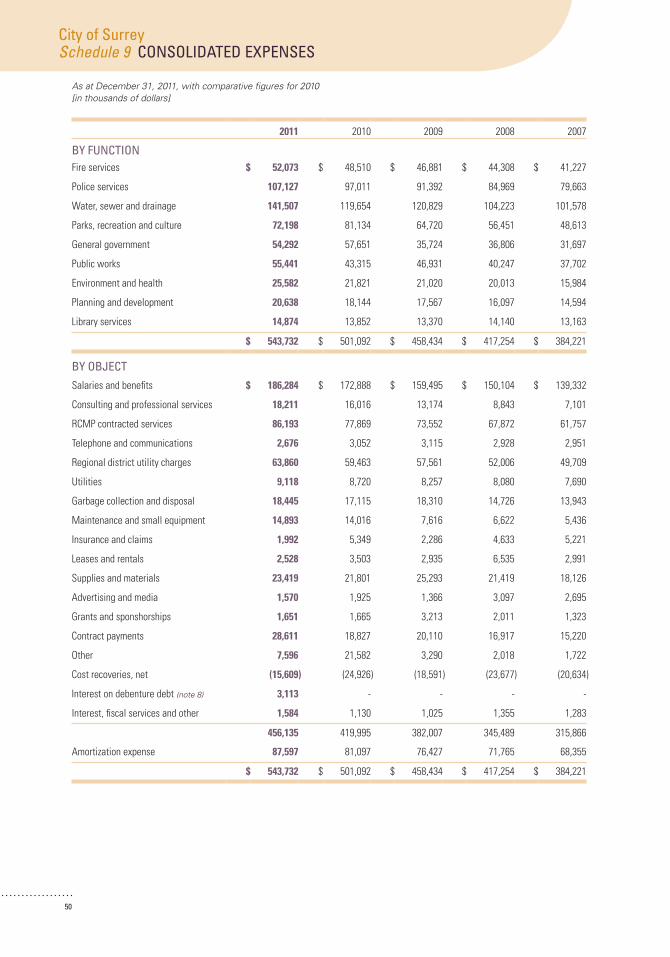
50
As at December 31, 2011, with comparative figures for 2010[in thousands of dollars]
City of surreySchedule 9 CONsOLIDATED EXpENsEs
2011 2010 2009 2008 2007
By FUNCTIONfire services $ 52,073 $ 48,510 $ 46,881 $ 44,308 $ 41,227
Police services 107,127 97,011 91,392 84,969 79,663
Water, sewer and drainage 141,507 119,654 120,829 104,223 101,578
Parks, recreation and culture 72,198 81,134 64,720 56,451 48,613
General government 54,292 57,651 35,724 36,806 31,697
Public works 55,441 43,315 46,931 40,247 37,702
environment and health 25,582 21,821 21,020 20,013 15,984
Planning and development 20,638 18,144 17,567 16,097 14,594
Library services 14,874 13,852 13,370 14,140 13,163
$ 543,732 $ 501,092 $ 458,434 $ 417,254 $ 384,221
By OBjECTSalaries and benefits $ 186,284 $ 172,888 $ 159,495 $ 150,104 $ 139,332
consulting and professional services 18,211 16,016 13,174 8,843 7,101
rcmP contracted services 86,193 77,869 73,552 67,872 61,757
telephone and communications 2,676 3,052 3,115 2,928 2,951
regional district utility charges 63,860 59,463 57,561 52,006 49,709
Utilities 9,118 8,720 8,257 8,080 7,690
Garbage collection and disposal 18,445 17,115 18,310 14,726 13,943
maintenance and small equipment 14,893 14,016 7,616 6,622 5,436
Insurance and claims 1,992 5,349 2,286 4,633 5,221
Leases and rentals 2,528 3,503 2,935 6,535 2,991
Supplies and materials 23,419 21,801 25,293 21,419 18,126
advertising and media 1,570 1,925 1,366 3,097 2,695
Grants and sponshorships 1,651 1,665 3,213 2,011 1,323
contract payments 28,611 18,827 20,110 16,917 15,220
other 7,596 21,582 3,290 2,018 1,722
cost recoveries, net (15,609) (24,926) (18,591) (23,677) (20,634)
Interest on debenture debt (note 8) 3,113 - - - -
Interest, fiscal services and other 1,584 1,130 1,025 1,355 1,283
456,135 419,995 382,007 345,489 315,866
amortization expense 87,597 81,097 76,427 71,765 68,355
$ 543,732 $ 501,092 $ 458,434 $ 417,254 $ 384,221
City of Surrey Schedule of Debts Section 4
2011 Statement of Financial Information
Information on the City of Surrey’s outstanding debt is included in Note 8 to the Financial Statements. Prepared under the Financial Information Regulation, Schedule 1, section 4
City of Surrey Schedule of Guarantee and Indemnity Agreements Section 5
2011 Statement of Financial Information
Information on all guarantees and indemnities for the City of Surrey is included in Note 12 (d) to the Financial Statements. Prepared under the Financial Information Regulation, Schedule 1, section 5
City of Surrey Schedule of Remuneration and Expenses Section 6
2011 Statement of Financial Information
Regulations require the City of Surrey to report the total amount of remuneration for each employee that exceeds $75,000 in the year reported. However, certain exceptions have been noted below:
1. Certain employees were hired part way through the year and their remuneration does not reflect a full years cost.
2. Some employees terminated their employment part way through the year and their
remuneration does not reflect a full years cost.
Prepared under the Financial Information Regulation, Schedule 1, subsection 6(2)
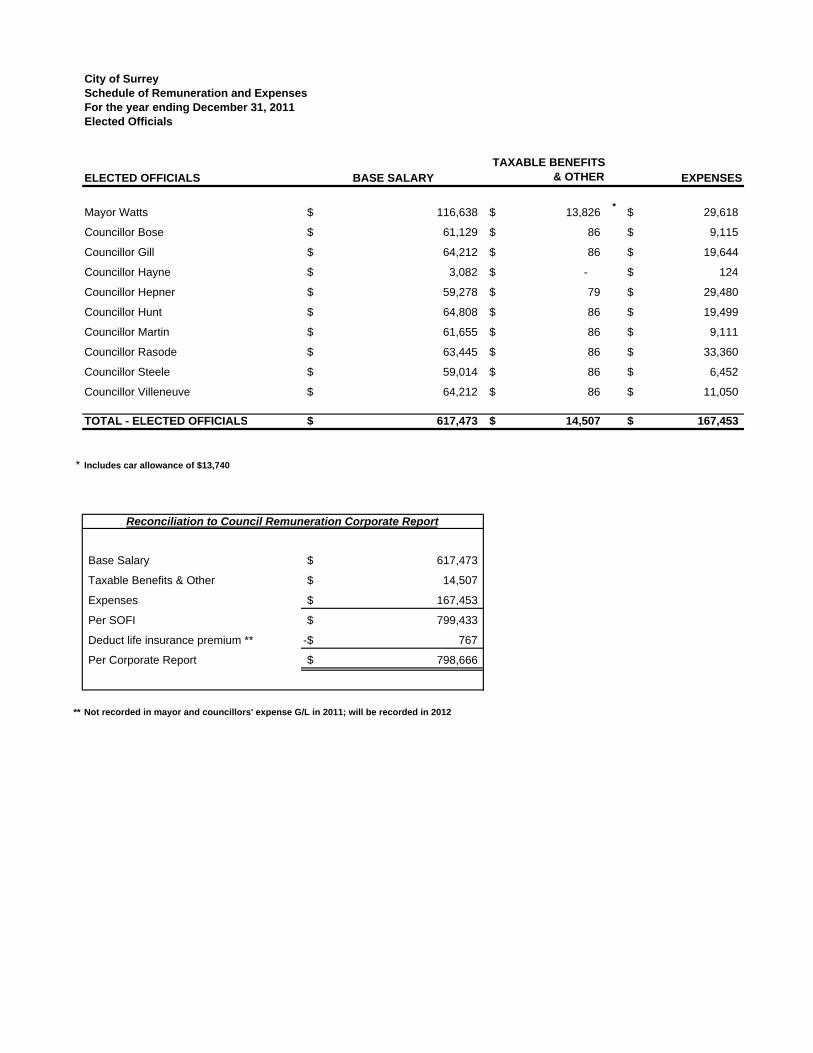
City of SurreySchedule of Remuneration and ExpensesFor the year ending December 31, 2011Elected Officials
ELECTED OFFICIALS BASE SALARYTAXABLE BENEFITS
& OTHER EXPENSES
Mayor Watts 116,638$ 13,826$ * 29,618$
Councillor Bose 61,129$ 86$ 9,115$
Councillor Gill 64,212$ 86$ 19,644$
Councillor Hayne 3,082$ -$ 124$
Councillor Hepner 59,278$ 79$ 29,480$
Councillor Hunt 64,808$ 86$ 19,499$
Councillor Martin 61,655$ 86$ 9,111$
Councillor Rasode 63,445$ 86$ 33,360$
Councillor Steele 59,014$ 86$ 6,452$
Councillor Villeneuve 64,212$ 86$ 11,050$
TOTAL - ELECTED OFFICIALS 617,473$ 14,507$ 167,453$
* Includes car allowance of $13,740
Base Salary 617,473$
Taxable Benefits & Other 14,507$
Expenses 167,453$
Per SOFI 799,433$
Deduct life insurance premium ** 767-$
Per Corporate Report 798,666$
** Not recorded in mayor and councillors' expense G/L in 2011; will be recorded in 2012
Reconciliation to Council Remuneration Corporate Report
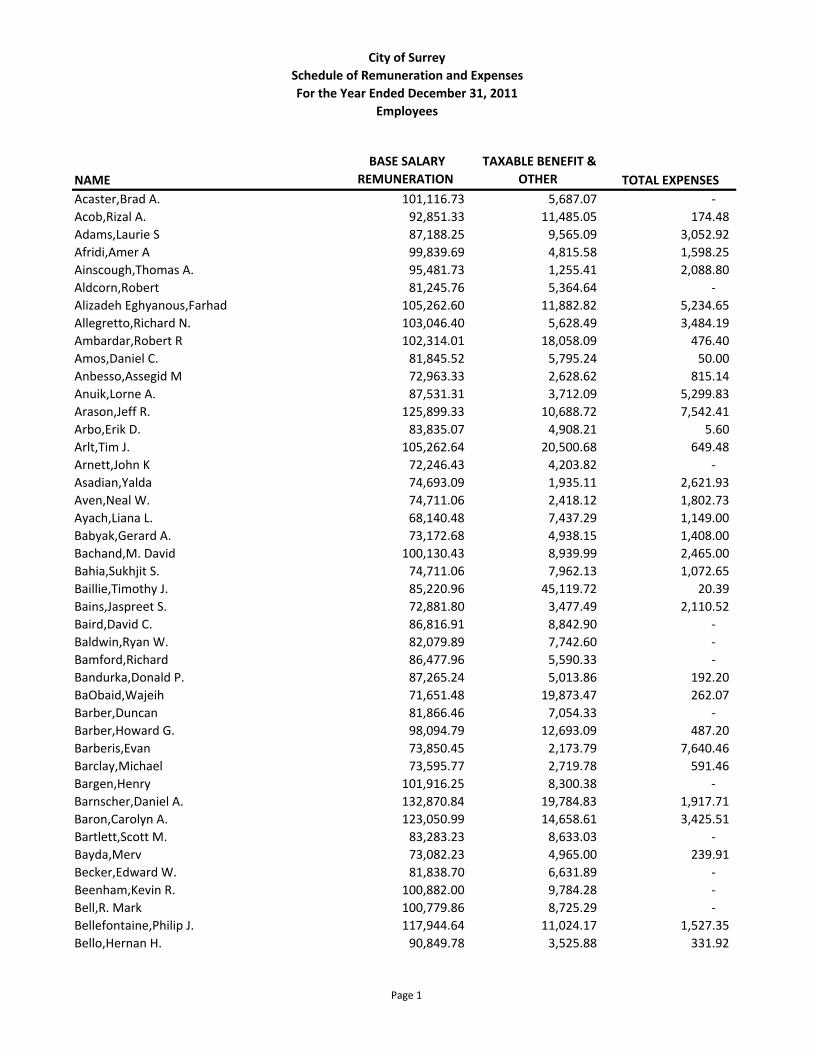
City of SurreySchedule of Remuneration and ExpensesFor the Year Ended December 31, 2011
Employees
NAME BASE SALARY
REMUNERATION TAXABLE BENEFIT &
OTHER TOTAL EXPENSESAcaster,Brad A. 101,116.73 5,687.07 ‐ Acob,Rizal A. 92,851.33 11,485.05 174.48 Adams,Laurie S 87,188.25 9,565.09 3,052.92 Afridi,Amer A 99,839.69 4,815.58 1,598.25 Ainscough,Thomas A. 95,481.73 1,255.41 2,088.80 Aldcorn,Robert 81,245.76 5,364.64 ‐ Alizadeh Eghyanous,Farhad 105,262.60 11,882.82 5,234.65 Allegretto,Richard N. 103,046.40 5,628.49 3,484.19 Ambardar,Robert R 102,314.01 18,058.09 476.40 Amos,Daniel C. 81,845.52 5,795.24 50.00 Anbesso,Assegid M 72,963.33 2,628.62 815.14 Anuik,Lorne A. 87,531.31 3,712.09 5,299.83 Arason,Jeff R. 125,899.33 10,688.72 7,542.41 Arbo,Erik D. 83,835.07 4,908.21 5.60 Arlt,Tim J. 105,262.64 20,500.68 649.48 Arnett,John K 72,246.43 4,203.82 ‐ Asadian,Yalda 74,693.09 1,935.11 2,621.93 Aven,Neal W. 74,711.06 2,418.12 1,802.73 Ayach,Liana L. 68,140.48 7,437.29 1,149.00 Babyak,Gerard A. 73,172.68 4,938.15 1,408.00 Bachand,M. David 100,130.43 8,939.99 2,465.00 Bahia,Sukhjit S. 74,711.06 7,962.13 1,072.65 Baillie,Timothy J. 85,220.96 45,119.72 20.39 Bains,Jaspreet S. 72,881.80 3,477.49 2,110.52 Baird,David C. 86,816.91 8,842.90 ‐ Baldwin,Ryan W. 82,079.89 7,742.60 ‐ Bamford,Richard 86,477.96 5,590.33 ‐ Bandurka,Donald P. 87,265.24 5,013.86 192.20 BaObaid,Wajeih 71,651.48 19,873.47 262.07 Barber,Duncan 81,866.46 7,054.33 ‐ Barber,Howard G. 98,094.79 12,693.09 487.20 Barberis,Evan 73,850.45 2,173.79 7,640.46 Barclay,Michael 73,595.77 2,719.78 591.46 Bargen,Henry 101,916.25 8,300.38 ‐ Barnscher,Daniel A. 132,870.84 19,784.83 1,917.71 Baron,Carolyn A. 123,050.99 14,658.61 3,425.51 Bartlett,Scott M. 83,283.23 8,633.03 ‐ Bayda,Merv 73,082.23 4,965.00 239.91 Becker,Edward W. 81,838.70 6,631.89 ‐ Beenham,Kevin R. 100,882.00 9,784.28 ‐ Bell,R. Mark 100,779.86 8,725.29 ‐ Bellefontaine,Philip J. 117,944.64 11,024.17 1,527.35 Bello,Hernan H. 90,849.78 3,525.88 331.92
Page 1
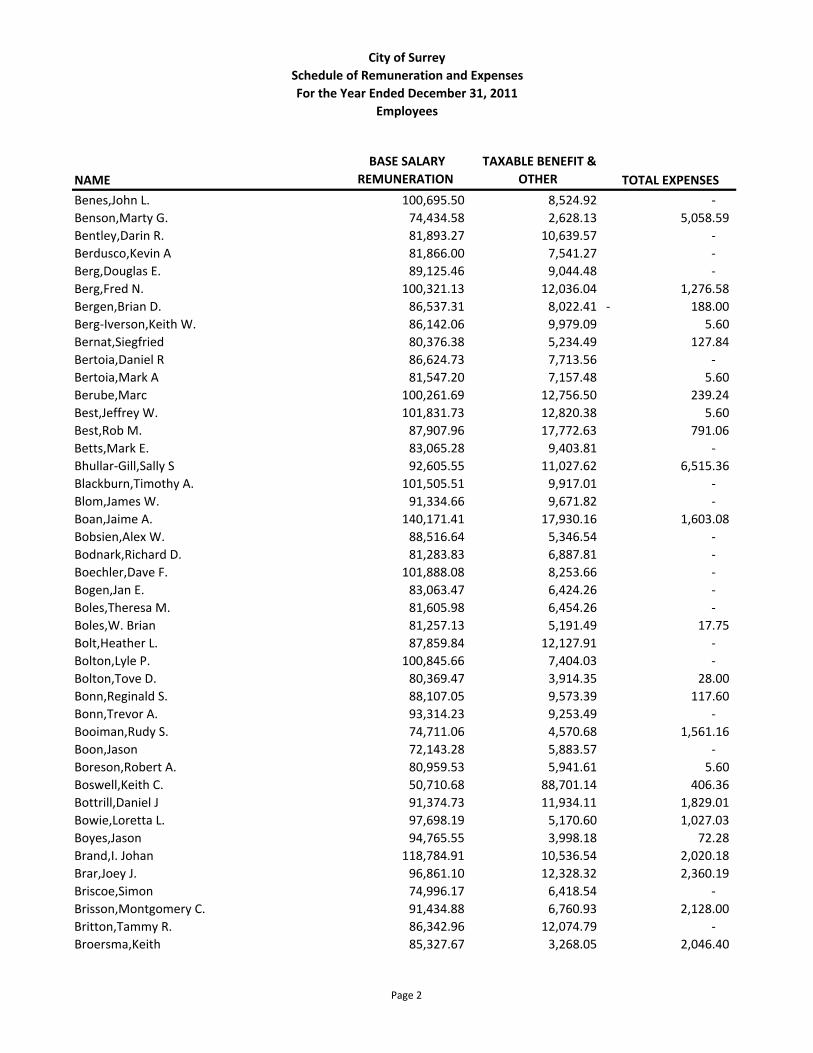
City of SurreySchedule of Remuneration and ExpensesFor the Year Ended December 31, 2011
Employees
NAME BASE SALARY
REMUNERATION TAXABLE BENEFIT &
OTHER TOTAL EXPENSES
Benes,John L. 100,695.50 8,524.92 ‐ Benson,Marty G. 74,434.58 2,628.13 5,058.59 Bentley,Darin R. 81,893.27 10,639.57 ‐ Berdusco,Kevin A 81,866.00 7,541.27 ‐ Berg,Douglas E. 89,125.46 9,044.48 ‐ Berg,Fred N. 100,321.13 12,036.04 1,276.58 Bergen,Brian D. 86,537.31 8,022.41 188.00‐ Berg‐Iverson,Keith W. 86,142.06 9,979.09 5.60 Bernat,Siegfried 80,376.38 5,234.49 127.84 Bertoia,Daniel R 86,624.73 7,713.56 ‐ Bertoia,Mark A 81,547.20 7,157.48 5.60 Berube,Marc 100,261.69 12,756.50 239.24 Best,Jeffrey W. 101,831.73 12,820.38 5.60 Best,Rob M. 87,907.96 17,772.63 791.06 Betts,Mark E. 83,065.28 9,403.81 ‐ Bhullar‐Gill,Sally S 92,605.55 11,027.62 6,515.36 Blackburn,Timothy A. 101,505.51 9,917.01 ‐ Blom,James W. 91,334.66 9,671.82 ‐ Boan,Jaime A. 140,171.41 17,930.16 1,603.08 Bobsien,Alex W. 88,516.64 5,346.54 ‐ Bodnark,Richard D. 81,283.83 6,887.81 ‐ Boechler,Dave F. 101,888.08 8,253.66 ‐ Bogen,Jan E. 83,063.47 6,424.26 ‐ Boles,Theresa M. 81,605.98 6,454.26 ‐ Boles,W. Brian 81,257.13 5,191.49 17.75 Bolt,Heather L. 87,859.84 12,127.91 ‐ Bolton,Lyle P. 100,845.66 7,404.03 ‐ Bolton,Tove D. 80,369.47 3,914.35 28.00 Bonn,Reginald S. 88,107.05 9,573.39 117.60 Bonn,Trevor A. 93,314.23 9,253.49 ‐ Booiman,Rudy S. 74,711.06 4,570.68 1,561.16 Boon,Jason 72,143.28 5,883.57 ‐ Boreson,Robert A. 80,959.53 5,941.61 5.60 Boswell,Keith C. 50,710.68 88,701.14 406.36 Bottrill,Daniel J 91,374.73 11,934.11 1,829.01 Bowie,Loretta L. 97,698.19 5,170.60 1,027.03 Boyes,Jason 94,765.55 3,998.18 72.28 Brand,I. Johan 118,784.91 10,536.54 2,020.18 Brar,Joey J. 96,861.10 12,328.32 2,360.19 Briscoe,Simon 74,996.17 6,418.54 ‐ Brisson,Montgomery C. 91,434.88 6,760.93 2,128.00 Britton,Tammy R. 86,342.96 12,074.79 ‐ Broersma,Keith 85,327.67 3,268.05 2,046.40
Page 2
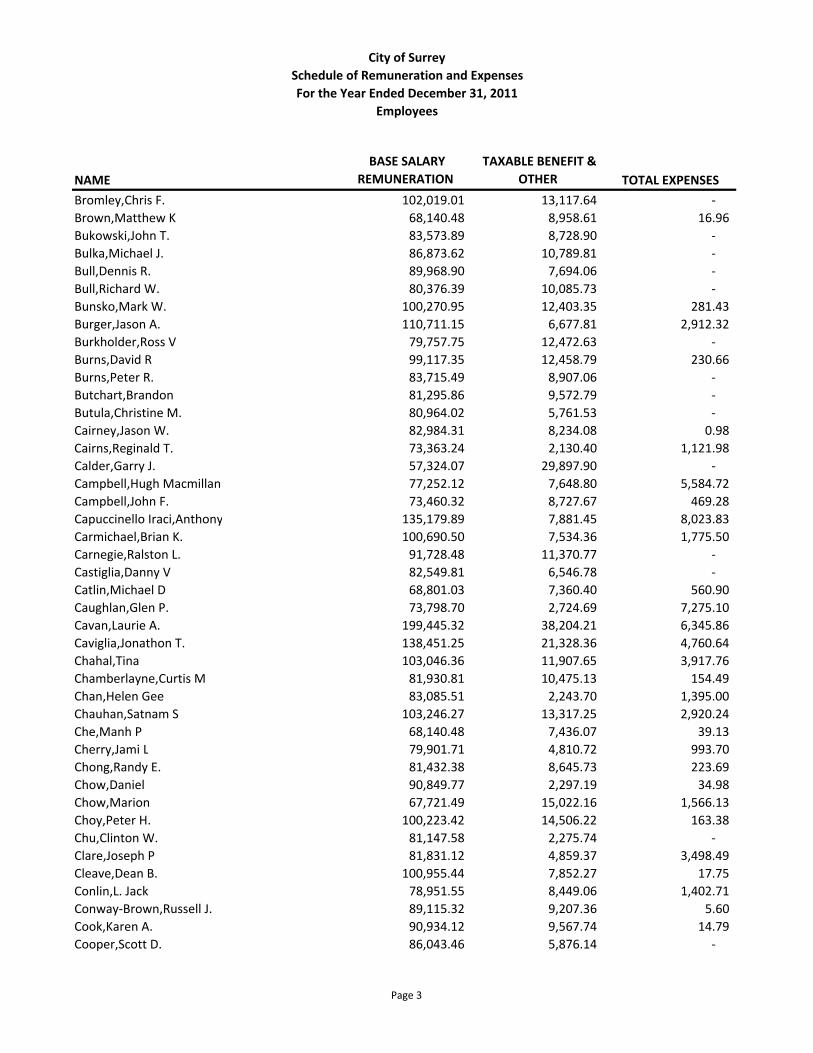
City of SurreySchedule of Remuneration and ExpensesFor the Year Ended December 31, 2011
Employees
NAME BASE SALARY
REMUNERATION TAXABLE BENEFIT &
OTHER TOTAL EXPENSES
Bromley,Chris F. 102,019.01 13,117.64 ‐ Brown,Matthew K 68,140.48 8,958.61 16.96 Bukowski,John T. 83,573.89 8,728.90 ‐ Bulka,Michael J. 86,873.62 10,789.81 ‐ Bull,Dennis R. 89,968.90 7,694.06 ‐ Bull,Richard W. 80,376.39 10,085.73 ‐ Bunsko,Mark W. 100,270.95 12,403.35 281.43 Burger,Jason A. 110,711.15 6,677.81 2,912.32 Burkholder,Ross V 79,757.75 12,472.63 ‐ Burns,David R 99,117.35 12,458.79 230.66 Burns,Peter R. 83,715.49 8,907.06 ‐ Butchart,Brandon 81,295.86 9,572.79 ‐ Butula,Christine M. 80,964.02 5,761.53 ‐ Cairney,Jason W. 82,984.31 8,234.08 0.98 Cairns,Reginald T. 73,363.24 2,130.40 1,121.98 Calder,Garry J. 57,324.07 29,897.90 ‐ Campbell,Hugh Macmillan 77,252.12 7,648.80 5,584.72 Campbell,John F. 73,460.32 8,727.67 469.28 Capuccinello Iraci,Anthony 135,179.89 7,881.45 8,023.83 Carmichael,Brian K. 100,690.50 7,534.36 1,775.50 Carnegie,Ralston L. 91,728.48 11,370.77 ‐ Castiglia,Danny V 82,549.81 6,546.78 ‐ Catlin,Michael D 68,801.03 7,360.40 560.90 Caughlan,Glen P. 73,798.70 2,724.69 7,275.10 Cavan,Laurie A. 199,445.32 38,204.21 6,345.86 Caviglia,Jonathon T. 138,451.25 21,328.36 4,760.64 Chahal,Tina 103,046.36 11,907.65 3,917.76 Chamberlayne,Curtis M 81,930.81 10,475.13 154.49 Chan,Helen Gee 83,085.51 2,243.70 1,395.00 Chauhan,Satnam S 103,246.27 13,317.25 2,920.24 Che,Manh P 68,140.48 7,436.07 39.13 Cherry,Jami L 79,901.71 4,810.72 993.70 Chong,Randy E. 81,432.38 8,645.73 223.69 Chow,Daniel 90,849.77 2,297.19 34.98 Chow,Marion 67,721.49 15,022.16 1,566.13 Choy,Peter H. 100,223.42 14,506.22 163.38 Chu,Clinton W. 81,147.58 2,275.74 ‐ Clare,Joseph P 81,831.12 4,859.37 3,498.49 Cleave,Dean B. 100,955.44 7,852.27 17.75 Conlin,L. Jack 78,951.55 8,449.06 1,402.71 Conway‐Brown,Russell J. 89,115.32 9,207.36 5.60 Cook,Karen A. 90,934.12 9,567.74 14.79 Cooper,Scott D. 86,043.46 5,876.14 ‐
Page 3
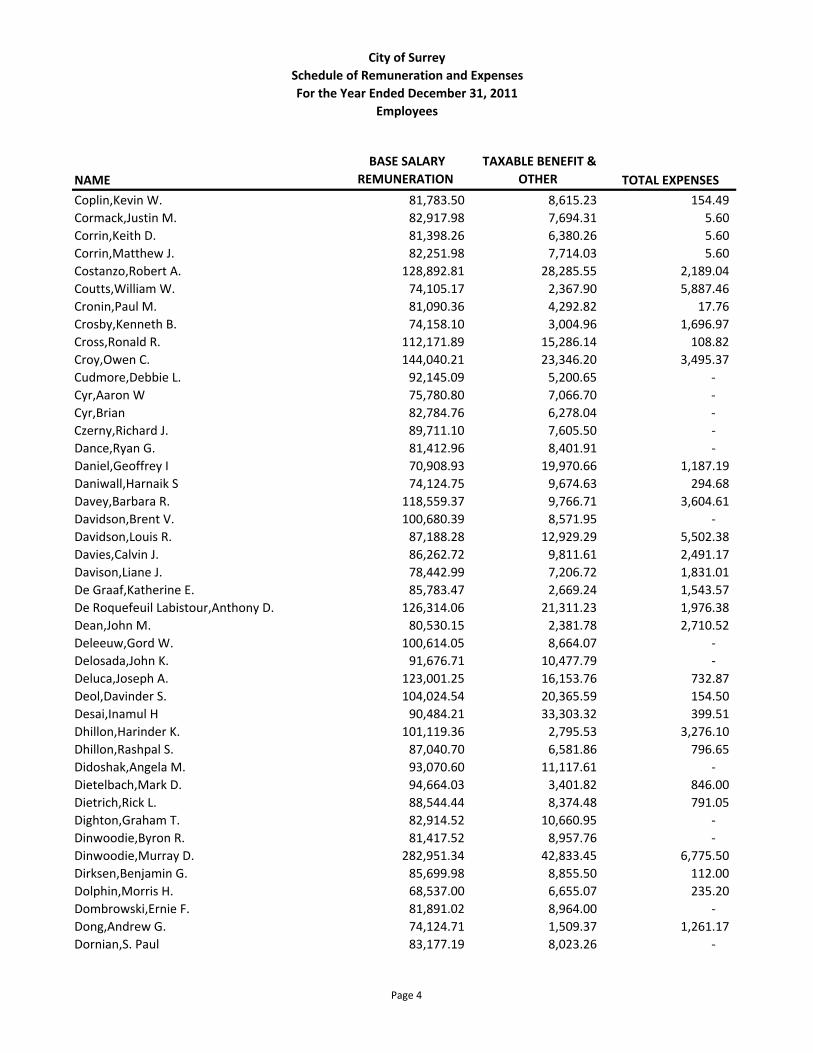
City of SurreySchedule of Remuneration and ExpensesFor the Year Ended December 31, 2011
Employees
NAME BASE SALARY
REMUNERATION TAXABLE BENEFIT &
OTHER TOTAL EXPENSES
Coplin,Kevin W. 81,783.50 8,615.23 154.49 Cormack,Justin M. 82,917.98 7,694.31 5.60 Corrin,Keith D. 81,398.26 6,380.26 5.60 Corrin,Matthew J. 82,251.98 7,714.03 5.60 Costanzo,Robert A. 128,892.81 28,285.55 2,189.04 Coutts,William W. 74,105.17 2,367.90 5,887.46 Cronin,Paul M. 81,090.36 4,292.82 17.76 Crosby,Kenneth B. 74,158.10 3,004.96 1,696.97 Cross,Ronald R. 112,171.89 15,286.14 108.82 Croy,Owen C. 144,040.21 23,346.20 3,495.37 Cudmore,Debbie L. 92,145.09 5,200.65 ‐ Cyr,Aaron W 75,780.80 7,066.70 ‐ Cyr,Brian 82,784.76 6,278.04 ‐ Czerny,Richard J. 89,711.10 7,605.50 ‐ Dance,Ryan G. 81,412.96 8,401.91 ‐ Daniel,Geoffrey I 70,908.93 19,970.66 1,187.19 Daniwall,Harnaik S 74,124.75 9,674.63 294.68 Davey,Barbara R. 118,559.37 9,766.71 3,604.61 Davidson,Brent V. 100,680.39 8,571.95 ‐ Davidson,Louis R. 87,188.28 12,929.29 5,502.38 Davies,Calvin J. 86,262.72 9,811.61 2,491.17 Davison,Liane J. 78,442.99 7,206.72 1,831.01 De Graaf,Katherine E. 85,783.47 2,669.24 1,543.57 De Roquefeuil Labistour,Anthony D. 126,314.06 21,311.23 1,976.38 Dean,John M. 80,530.15 2,381.78 2,710.52 Deleeuw,Gord W. 100,614.05 8,664.07 ‐ Delosada,John K. 91,676.71 10,477.79 ‐ Deluca,Joseph A. 123,001.25 16,153.76 732.87 Deol,Davinder S. 104,024.54 20,365.59 154.50 Desai,Inamul H 90,484.21 33,303.32 399.51 Dhillon,Harinder K. 101,119.36 2,795.53 3,276.10 Dhillon,Rashpal S. 87,040.70 6,581.86 796.65 Didoshak,Angela M. 93,070.60 11,117.61 ‐ Dietelbach,Mark D. 94,664.03 3,401.82 846.00 Dietrich,Rick L. 88,544.44 8,374.48 791.05 Dighton,Graham T. 82,914.52 10,660.95 ‐ Dinwoodie,Byron R. 81,417.52 8,957.76 ‐ Dinwoodie,Murray D. 282,951.34 42,833.45 6,775.50 Dirksen,Benjamin G. 85,699.98 8,855.50 112.00 Dolphin,Morris H. 68,537.00 6,655.07 235.20 Dombrowski,Ernie F. 81,891.02 8,964.00 ‐ Dong,Andrew G. 74,124.71 1,509.37 1,261.17 Dornian,S. Paul 83,177.19 8,023.26 ‐
Page 4

City of SurreySchedule of Remuneration and ExpensesFor the Year Ended December 31, 2011
Employees
NAME BASE SALARY
REMUNERATION TAXABLE BENEFIT &
OTHER TOTAL EXPENSES
Dosanjh,Balraj S. 82,771.81 6,262.29 ‐ Dougan,Cameron D 81,089.46 6,010.55 14.79 Drew,Gregory A. 100,644.83 7,282.68 2,465.00 Dube,Remi 112,895.18 12,880.12 35.84 Duncan,Andrew J 81,860.73 9,196.05 154.50 Dunn,Peter S. 101,730.92 10,870.26 ‐ Dyck,Thomas A. 90,665.16 10,037.03 ‐ Dykeman,Tim 80,411.39 6,373.76 209.85 Dykes,Tammy I. 83,892.59 8,985.72 ‐ Easton,Jay R. 88,033.33 13,557.72 791.06 Eaton,Wesley D. 100,603.50 12,060.01 ‐ Eddy,Brent D 81,661.08 8,989.12 ‐ Ellard,Allan 68,368.87 8,045.47 ‐ Ellis,Richard M. 101,059.34 11,427.17 2,465.00 Elving,Donald A. 87,188.28 6,074.20 4,703.03 Enns,Eleanor C. 80,376.38 1,967.77 939.52 Enns,Lois M 102,452.38 6,337.63 8,658.67 Ens,Carl A. 101,694.14 8,440.44 ‐ Epp,Randall M. 80,376.36 3,783.41 1,486.55 Evans,Brice A 81,421.00 9,256.06 ‐ Ewert,Dean W. 86,405.00 10,998.14 5.60 Fahimi,Farah 74,966.72 6,583.02 427.82 Fiddler,Michael L. 82,040.34 6,303.74 ‐ Fillion,Suzanne 135,140.44 12,262.28 2,311.93 Fisher,Victor J. 86,237.55 9,861.86 ‐ Foley,Duane W. 72,506.73 9,059.29 ‐ Foslien,Tara 74,115.69 5,710.22 8,710.32 Fournier,Marc G. 89,701.05 15,714.19 ‐ Fraser,Chris E. 81,894.84 8,415.19 ‐ Friesen,Larry J. 100,250.46 7,377.34 38.55 Fry,Karen L. 138,460.24 17,538.25 2,632.98 Fujii,George T. 126,314.05 16,710.92 5,720.71 Fulop,Perry 85,977.60 6,137.44 2,400.10 Fulton,Christopher R. 72,391.66 4,775.99 ‐ Fung,Edward 86,819.54 2,990.57 ‐ Furber,D. Paul 81,006.98 8,844.87 ‐ Gagnaux,David A 68,576.34 8,779.98 ‐ Gahr,Gary A. 90,849.76 6,176.28 742.55 Gain,Chris I 101,524.71 6,345.19 1,109.83 Gardiner,Norman M 81,236.34 7,399.50 ‐ Garis,Leonard W 179,494.50 24,977.88 6,155.53 George,Andrew R. 101,439.13 12,131.13 791.05 Gerllays,Leagh 72,845.71 6,069.09 708.95
Page 5
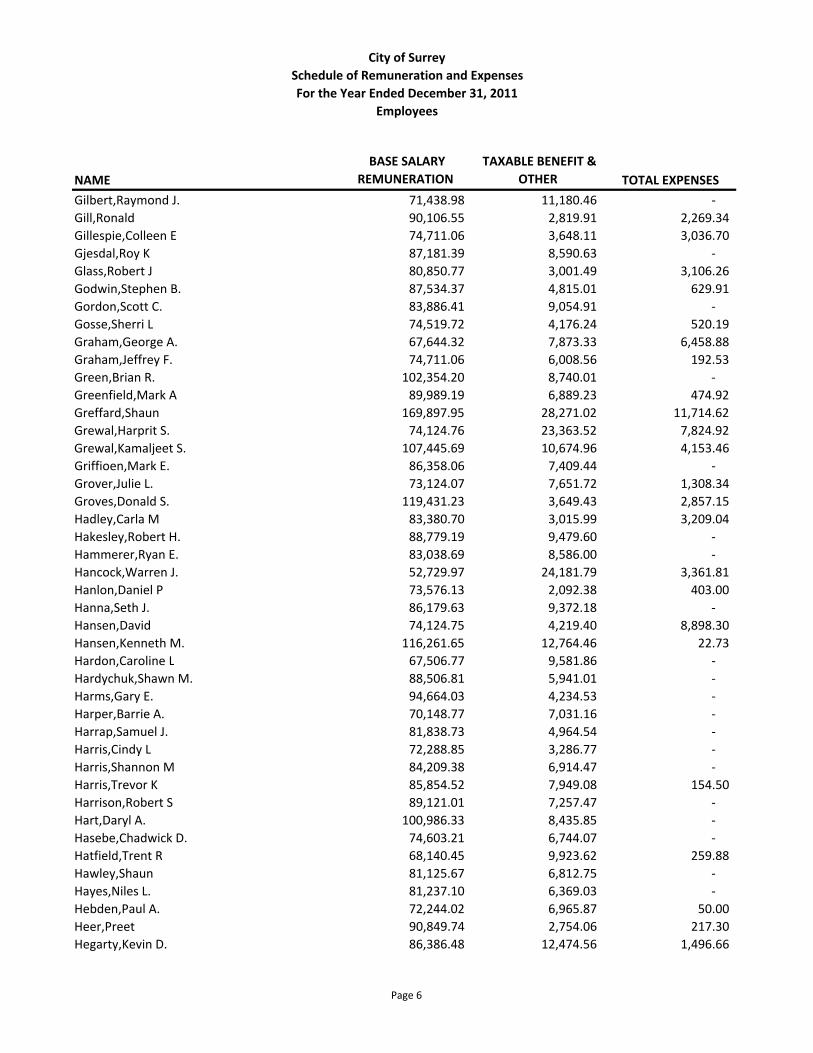
City of SurreySchedule of Remuneration and ExpensesFor the Year Ended December 31, 2011
Employees
NAME BASE SALARY
REMUNERATION TAXABLE BENEFIT &
OTHER TOTAL EXPENSES
Gilbert,Raymond J. 71,438.98 11,180.46 ‐ Gill,Ronald 90,106.55 2,819.91 2,269.34 Gillespie,Colleen E 74,711.06 3,648.11 3,036.70 Gjesdal,Roy K 87,181.39 8,590.63 ‐ Glass,Robert J 80,850.77 3,001.49 3,106.26 Godwin,Stephen B. 87,534.37 4,815.01 629.91 Gordon,Scott C. 83,886.41 9,054.91 ‐ Gosse,Sherri L 74,519.72 4,176.24 520.19 Graham,George A. 67,644.32 7,873.33 6,458.88 Graham,Jeffrey F. 74,711.06 6,008.56 192.53 Green,Brian R. 102,354.20 8,740.01 ‐ Greenfield,Mark A 89,989.19 6,889.23 474.92 Greffard,Shaun 169,897.95 28,271.02 11,714.62 Grewal,Harprit S. 74,124.76 23,363.52 7,824.92 Grewal,Kamaljeet S. 107,445.69 10,674.96 4,153.46 Griffioen,Mark E. 86,358.06 7,409.44 ‐ Grover,Julie L. 73,124.07 7,651.72 1,308.34 Groves,Donald S. 119,431.23 3,649.43 2,857.15 Hadley,Carla M 83,380.70 3,015.99 3,209.04 Hakesley,Robert H. 88,779.19 9,479.60 ‐ Hammerer,Ryan E. 83,038.69 8,586.00 ‐ Hancock,Warren J. 52,729.97 24,181.79 3,361.81 Hanlon,Daniel P 73,576.13 2,092.38 403.00 Hanna,Seth J. 86,179.63 9,372.18 ‐ Hansen,David 74,124.75 4,219.40 8,898.30 Hansen,Kenneth M. 116,261.65 12,764.46 22.73 Hardon,Caroline L 67,506.77 9,581.86 ‐ Hardychuk,Shawn M. 88,506.81 5,941.01 ‐ Harms,Gary E. 94,664.03 4,234.53 ‐ Harper,Barrie A. 70,148.77 7,031.16 ‐ Harrap,Samuel J. 81,838.73 4,964.54 ‐ Harris,Cindy L 72,288.85 3,286.77 ‐ Harris,Shannon M 84,209.38 6,914.47 ‐ Harris,Trevor K 85,854.52 7,949.08 154.50 Harrison,Robert S 89,121.01 7,257.47 ‐ Hart,Daryl A. 100,986.33 8,435.85 ‐ Hasebe,Chadwick D. 74,603.21 6,744.07 ‐ Hatfield,Trent R 68,140.45 9,923.62 259.88 Hawley,Shaun 81,125.67 6,812.75 ‐ Hayes,Niles L. 81,237.10 6,369.03 ‐ Hebden,Paul A. 72,244.02 6,965.87 50.00 Heer,Preet 90,849.74 2,754.06 217.30 Hegarty,Kevin D. 86,386.48 12,474.56 1,496.66
Page 6
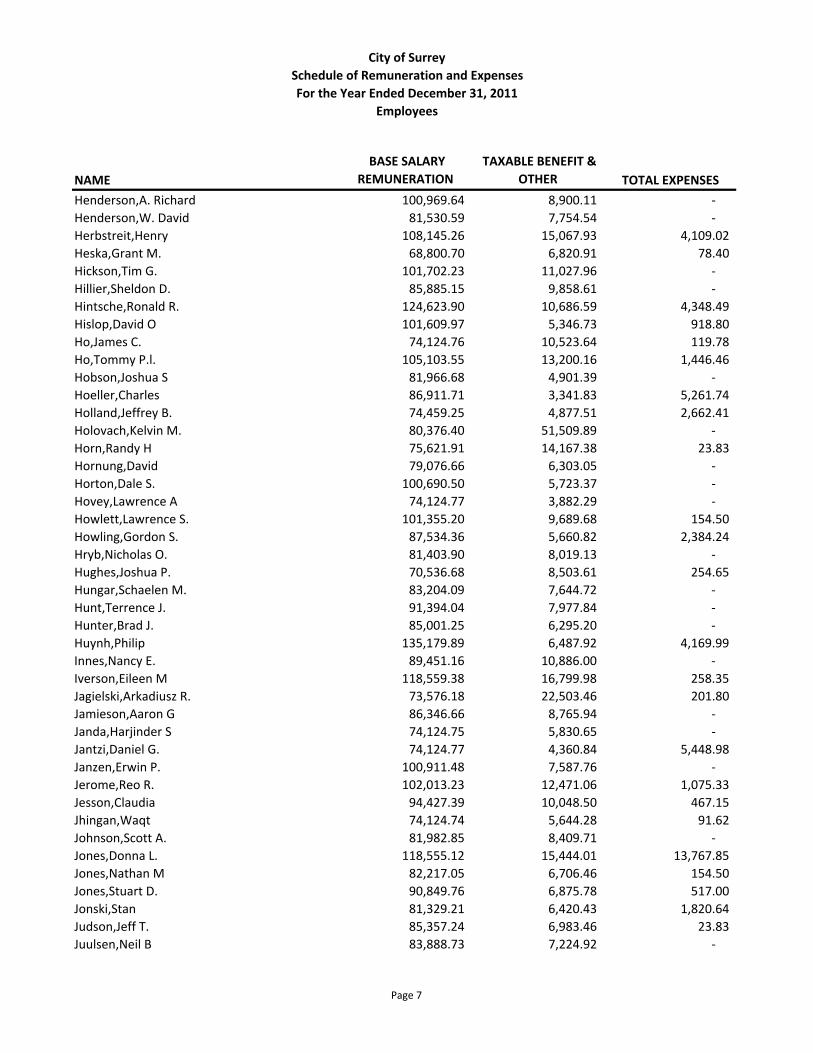
City of SurreySchedule of Remuneration and ExpensesFor the Year Ended December 31, 2011
Employees
NAME BASE SALARY
REMUNERATION TAXABLE BENEFIT &
OTHER TOTAL EXPENSES
Henderson,A. Richard 100,969.64 8,900.11 ‐ Henderson,W. David 81,530.59 7,754.54 ‐ Herbstreit,Henry 108,145.26 15,067.93 4,109.02 Heska,Grant M. 68,800.70 6,820.91 78.40 Hickson,Tim G. 101,702.23 11,027.96 ‐ Hillier,Sheldon D. 85,885.15 9,858.61 ‐ Hintsche,Ronald R. 124,623.90 10,686.59 4,348.49 Hislop,David O 101,609.97 5,346.73 918.80 Ho,James C. 74,124.76 10,523.64 119.78 Ho,Tommy P.l. 105,103.55 13,200.16 1,446.46 Hobson,Joshua S 81,966.68 4,901.39 ‐ Hoeller,Charles 86,911.71 3,341.83 5,261.74 Holland,Jeffrey B. 74,459.25 4,877.51 2,662.41 Holovach,Kelvin M. 80,376.40 51,509.89 ‐ Horn,Randy H 75,621.91 14,167.38 23.83 Hornung,David 79,076.66 6,303.05 ‐ Horton,Dale S. 100,690.50 5,723.37 ‐ Hovey,Lawrence A 74,124.77 3,882.29 ‐ Howlett,Lawrence S. 101,355.20 9,689.68 154.50 Howling,Gordon S. 87,534.36 5,660.82 2,384.24 Hryb,Nicholas O. 81,403.90 8,019.13 ‐ Hughes,Joshua P. 70,536.68 8,503.61 254.65 Hungar,Schaelen M. 83,204.09 7,644.72 ‐ Hunt,Terrence J. 91,394.04 7,977.84 ‐ Hunter,Brad J. 85,001.25 6,295.20 ‐ Huynh,Philip 135,179.89 6,487.92 4,169.99 Innes,Nancy E. 89,451.16 10,886.00 ‐ Iverson,Eileen M 118,559.38 16,799.98 258.35 Jagielski,Arkadiusz R. 73,576.18 22,503.46 201.80 Jamieson,Aaron G 86,346.66 8,765.94 ‐ Janda,Harjinder S 74,124.75 5,830.65 ‐ Jantzi,Daniel G. 74,124.77 4,360.84 5,448.98 Janzen,Erwin P. 100,911.48 7,587.76 ‐ Jerome,Reo R. 102,013.23 12,471.06 1,075.33 Jesson,Claudia 94,427.39 10,048.50 467.15 Jhingan,Waqt 74,124.74 5,644.28 91.62 Johnson,Scott A. 81,982.85 8,409.71 ‐ Jones,Donna L. 118,555.12 15,444.01 13,767.85 Jones,Nathan M 82,217.05 6,706.46 154.50 Jones,Stuart D. 90,849.76 6,875.78 517.00 Jonski,Stan 81,329.21 6,420.43 1,820.64 Judson,Jeff T. 85,357.24 6,983.46 23.83 Juulsen,Neil B 83,888.73 7,224.92 ‐
Page 7
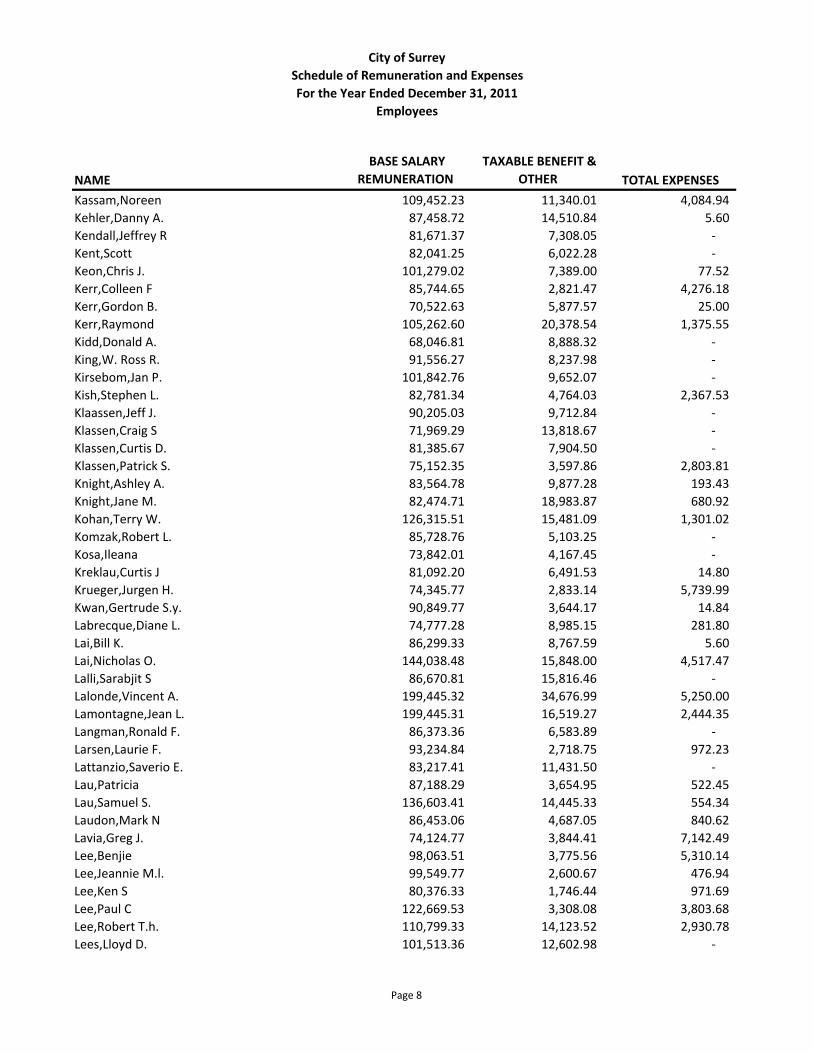
City of SurreySchedule of Remuneration and ExpensesFor the Year Ended December 31, 2011
Employees
NAME BASE SALARY
REMUNERATION TAXABLE BENEFIT &
OTHER TOTAL EXPENSES
Kassam,Noreen 109,452.23 11,340.01 4,084.94 Kehler,Danny A. 87,458.72 14,510.84 5.60 Kendall,Jeffrey R 81,671.37 7,308.05 ‐ Kent,Scott 82,041.25 6,022.28 ‐ Keon,Chris J. 101,279.02 7,389.00 77.52 Kerr,Colleen F 85,744.65 2,821.47 4,276.18 Kerr,Gordon B. 70,522.63 5,877.57 25.00 Kerr,Raymond 105,262.60 20,378.54 1,375.55 Kidd,Donald A. 68,046.81 8,888.32 ‐ King,W. Ross R. 91,556.27 8,237.98 ‐ Kirsebom,Jan P. 101,842.76 9,652.07 ‐ Kish,Stephen L. 82,781.34 4,764.03 2,367.53 Klaassen,Jeff J. 90,205.03 9,712.84 ‐ Klassen,Craig S 71,969.29 13,818.67 ‐ Klassen,Curtis D. 81,385.67 7,904.50 ‐ Klassen,Patrick S. 75,152.35 3,597.86 2,803.81 Knight,Ashley A. 83,564.78 9,877.28 193.43 Knight,Jane M. 82,474.71 18,983.87 680.92 Kohan,Terry W. 126,315.51 15,481.09 1,301.02 Komzak,Robert L. 85,728.76 5,103.25 ‐ Kosa,Ileana 73,842.01 4,167.45 ‐ Kreklau,Curtis J 81,092.20 6,491.53 14.80 Krueger,Jurgen H. 74,345.77 2,833.14 5,739.99 Kwan,Gertrude S.y. 90,849.77 3,644.17 14.84 Labrecque,Diane L. 74,777.28 8,985.15 281.80 Lai,Bill K. 86,299.33 8,767.59 5.60 Lai,Nicholas O. 144,038.48 15,848.00 4,517.47 Lalli,Sarabjit S 86,670.81 15,816.46 ‐ Lalonde,Vincent A. 199,445.32 34,676.99 5,250.00 Lamontagne,Jean L. 199,445.31 16,519.27 2,444.35 Langman,Ronald F. 86,373.36 6,583.89 ‐ Larsen,Laurie F. 93,234.84 2,718.75 972.23 Lattanzio,Saverio E. 83,217.41 11,431.50 ‐ Lau,Patricia 87,188.29 3,654.95 522.45 Lau,Samuel S. 136,603.41 14,445.33 554.34 Laudon,Mark N 86,453.06 4,687.05 840.62 Lavia,Greg J. 74,124.77 3,844.41 7,142.49 Lee,Benjie 98,063.51 3,775.56 5,310.14 Lee,Jeannie M.l. 99,549.77 2,600.67 476.94 Lee,Ken S 80,376.33 1,746.44 971.69 Lee,Paul C 122,669.53 3,308.08 3,803.68 Lee,Robert T.h. 110,799.33 14,123.52 2,930.78 Lees,Lloyd D. 101,513.36 12,602.98 ‐
Page 8
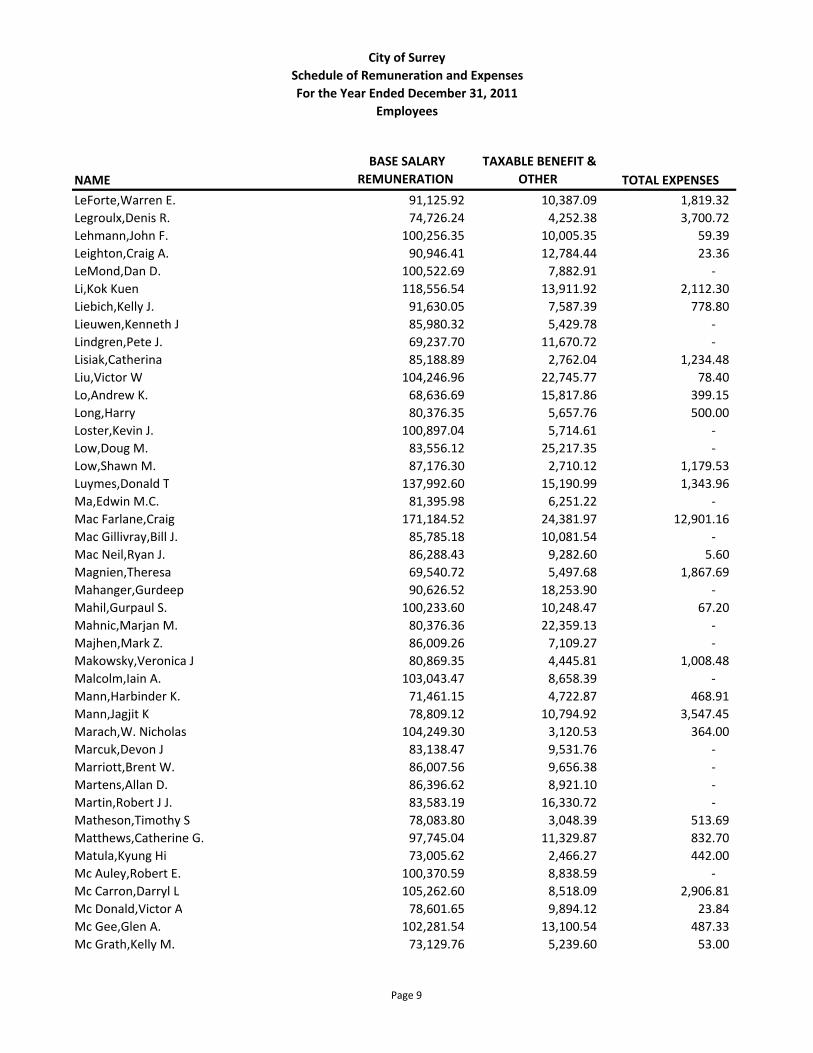
City of SurreySchedule of Remuneration and ExpensesFor the Year Ended December 31, 2011
Employees
NAME BASE SALARY
REMUNERATION TAXABLE BENEFIT &
OTHER TOTAL EXPENSES
LeForte,Warren E. 91,125.92 10,387.09 1,819.32 Legroulx,Denis R. 74,726.24 4,252.38 3,700.72 Lehmann,John F. 100,256.35 10,005.35 59.39 Leighton,Craig A. 90,946.41 12,784.44 23.36 LeMond,Dan D. 100,522.69 7,882.91 ‐ Li,Kok Kuen 118,556.54 13,911.92 2,112.30 Liebich,Kelly J. 91,630.05 7,587.39 778.80 Lieuwen,Kenneth J 85,980.32 5,429.78 ‐ Lindgren,Pete J. 69,237.70 11,670.72 ‐ Lisiak,Catherina 85,188.89 2,762.04 1,234.48 Liu,Victor W 104,246.96 22,745.77 78.40 Lo,Andrew K. 68,636.69 15,817.86 399.15 Long,Harry 80,376.35 5,657.76 500.00 Loster,Kevin J. 100,897.04 5,714.61 ‐ Low,Doug M. 83,556.12 25,217.35 ‐ Low,Shawn M. 87,176.30 2,710.12 1,179.53 Luymes,Donald T 137,992.60 15,190.99 1,343.96 Ma,Edwin M.C. 81,395.98 6,251.22 ‐ Mac Farlane,Craig 171,184.52 24,381.97 12,901.16 Mac Gillivray,Bill J. 85,785.18 10,081.54 ‐ Mac Neil,Ryan J. 86,288.43 9,282.60 5.60 Magnien,Theresa 69,540.72 5,497.68 1,867.69 Mahanger,Gurdeep 90,626.52 18,253.90 ‐ Mahil,Gurpaul S. 100,233.60 10,248.47 67.20 Mahnic,Marjan M. 80,376.36 22,359.13 ‐ Majhen,Mark Z. 86,009.26 7,109.27 ‐ Makowsky,Veronica J 80,869.35 4,445.81 1,008.48 Malcolm,Iain A. 103,043.47 8,658.39 ‐ Mann,Harbinder K. 71,461.15 4,722.87 468.91 Mann,Jagjit K 78,809.12 10,794.92 3,547.45 Marach,W. Nicholas 104,249.30 3,120.53 364.00 Marcuk,Devon J 83,138.47 9,531.76 ‐ Marriott,Brent W. 86,007.56 9,656.38 ‐ Martens,Allan D. 86,396.62 8,921.10 ‐ Martin,Robert J J. 83,583.19 16,330.72 ‐ Matheson,Timothy S 78,083.80 3,048.39 513.69 Matthews,Catherine G. 97,745.04 11,329.87 832.70 Matula,Kyung Hi 73,005.62 2,466.27 442.00 Mc Auley,Robert E. 100,370.59 8,838.59 ‐ Mc Carron,Darryl L 105,262.60 8,518.09 2,906.81 Mc Donald,Victor A 78,601.65 9,894.12 23.84 Mc Gee,Glen A. 102,281.54 13,100.54 487.33 Mc Grath,Kelly M. 73,129.76 5,239.60 53.00
Page 9
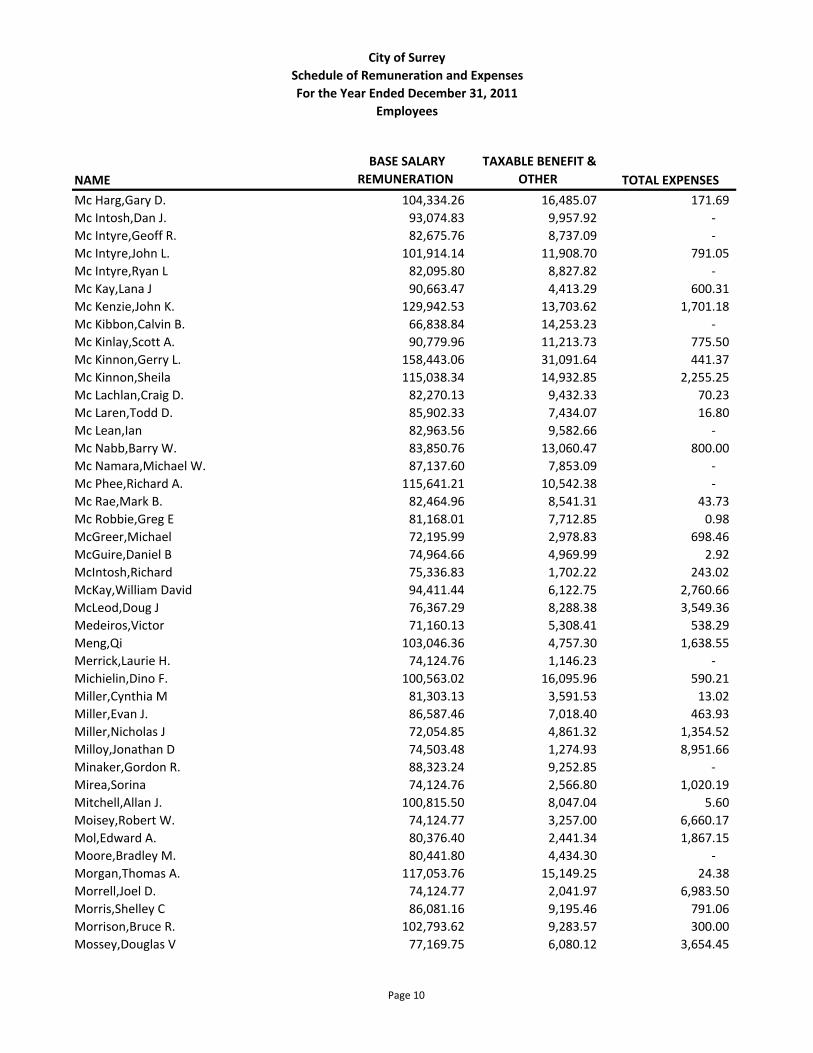
City of SurreySchedule of Remuneration and ExpensesFor the Year Ended December 31, 2011
Employees
NAME BASE SALARY
REMUNERATION TAXABLE BENEFIT &
OTHER TOTAL EXPENSES
Mc Harg,Gary D. 104,334.26 16,485.07 171.69 Mc Intosh,Dan J. 93,074.83 9,957.92 ‐ Mc Intyre,Geoff R. 82,675.76 8,737.09 ‐ Mc Intyre,John L. 101,914.14 11,908.70 791.05 Mc Intyre,Ryan L 82,095.80 8,827.82 ‐ Mc Kay,Lana J 90,663.47 4,413.29 600.31 Mc Kenzie,John K. 129,942.53 13,703.62 1,701.18 Mc Kibbon,Calvin B. 66,838.84 14,253.23 ‐ Mc Kinlay,Scott A. 90,779.96 11,213.73 775.50 Mc Kinnon,Gerry L. 158,443.06 31,091.64 441.37 Mc Kinnon,Sheila 115,038.34 14,932.85 2,255.25 Mc Lachlan,Craig D. 82,270.13 9,432.33 70.23 Mc Laren,Todd D. 85,902.33 7,434.07 16.80 Mc Lean,Ian 82,963.56 9,582.66 ‐ Mc Nabb,Barry W. 83,850.76 13,060.47 800.00 Mc Namara,Michael W. 87,137.60 7,853.09 ‐ Mc Phee,Richard A. 115,641.21 10,542.38 ‐ Mc Rae,Mark B. 82,464.96 8,541.31 43.73 Mc Robbie,Greg E 81,168.01 7,712.85 0.98 McGreer,Michael 72,195.99 2,978.83 698.46 McGuire,Daniel B 74,964.66 4,969.99 2.92 McIntosh,Richard 75,336.83 1,702.22 243.02 McKay,William David 94,411.44 6,122.75 2,760.66 McLeod,Doug J 76,367.29 8,288.38 3,549.36 Medeiros,Victor 71,160.13 5,308.41 538.29 Meng,Qi 103,046.36 4,757.30 1,638.55 Merrick,Laurie H. 74,124.76 1,146.23 ‐ Michielin,Dino F. 100,563.02 16,095.96 590.21 Miller,Cynthia M 81,303.13 3,591.53 13.02 Miller,Evan J. 86,587.46 7,018.40 463.93 Miller,Nicholas J 72,054.85 4,861.32 1,354.52 Milloy,Jonathan D 74,503.48 1,274.93 8,951.66 Minaker,Gordon R. 88,323.24 9,252.85 ‐ Mirea,Sorina 74,124.76 2,566.80 1,020.19 Mitchell,Allan J. 100,815.50 8,047.04 5.60 Moisey,Robert W. 74,124.77 3,257.00 6,660.17 Mol,Edward A. 80,376.40 2,441.34 1,867.15 Moore,Bradley M. 80,441.80 4,434.30 ‐ Morgan,Thomas A. 117,053.76 15,149.25 24.38 Morrell,Joel D. 74,124.77 2,041.97 6,983.50 Morris,Shelley C 86,081.16 9,195.46 791.06 Morrison,Bruce R. 102,793.62 9,283.57 300.00 Mossey,Douglas V 77,169.75 6,080.12 3,654.45
Page 10
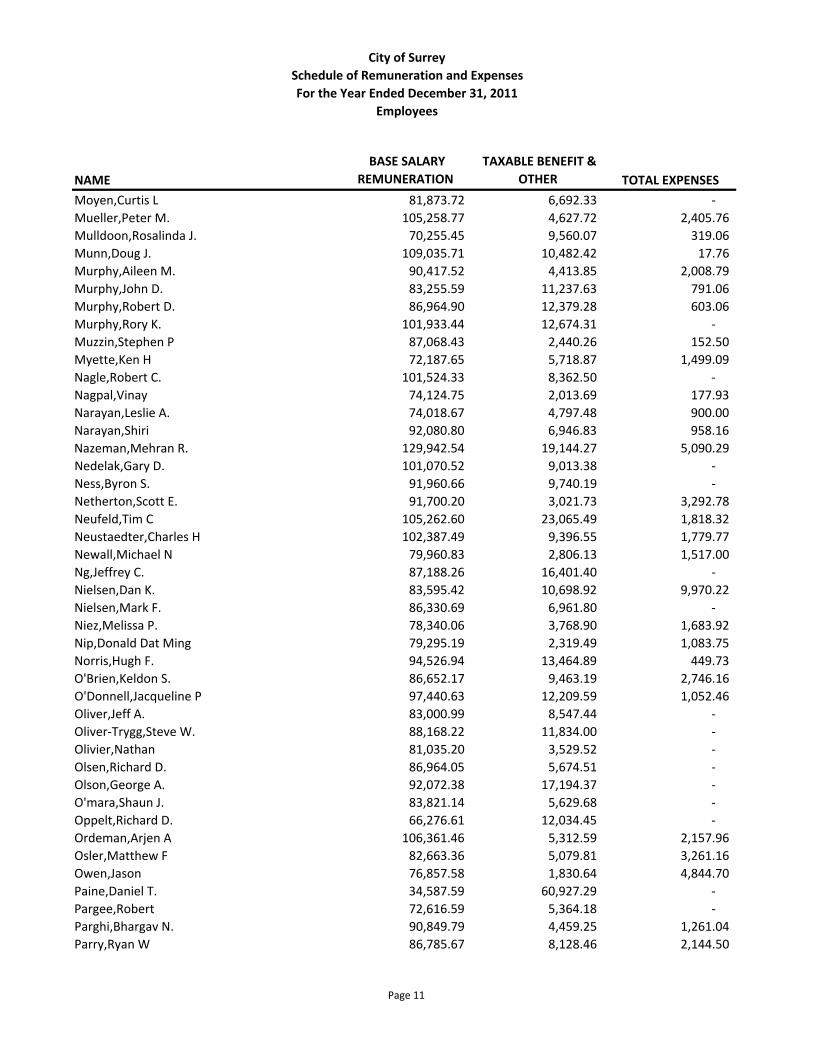
City of SurreySchedule of Remuneration and ExpensesFor the Year Ended December 31, 2011
Employees
NAME BASE SALARY
REMUNERATION TAXABLE BENEFIT &
OTHER TOTAL EXPENSES
Moyen,Curtis L 81,873.72 6,692.33 ‐ Mueller,Peter M. 105,258.77 4,627.72 2,405.76 Mulldoon,Rosalinda J. 70,255.45 9,560.07 319.06 Munn,Doug J. 109,035.71 10,482.42 17.76 Murphy,Aileen M. 90,417.52 4,413.85 2,008.79 Murphy,John D. 83,255.59 11,237.63 791.06 Murphy,Robert D. 86,964.90 12,379.28 603.06 Murphy,Rory K. 101,933.44 12,674.31 ‐ Muzzin,Stephen P 87,068.43 2,440.26 152.50 Myette,Ken H 72,187.65 5,718.87 1,499.09 Nagle,Robert C. 101,524.33 8,362.50 ‐ Nagpal,Vinay 74,124.75 2,013.69 177.93 Narayan,Leslie A. 74,018.67 4,797.48 900.00 Narayan,Shiri 92,080.80 6,946.83 958.16 Nazeman,Mehran R. 129,942.54 19,144.27 5,090.29 Nedelak,Gary D. 101,070.52 9,013.38 ‐ Ness,Byron S. 91,960.66 9,740.19 ‐ Netherton,Scott E. 91,700.20 3,021.73 3,292.78 Neufeld,Tim C 105,262.60 23,065.49 1,818.32 Neustaedter,Charles H 102,387.49 9,396.55 1,779.77 Newall,Michael N 79,960.83 2,806.13 1,517.00 Ng,Jeffrey C. 87,188.26 16,401.40 ‐ Nielsen,Dan K. 83,595.42 10,698.92 9,970.22 Nielsen,Mark F. 86,330.69 6,961.80 ‐ Niez,Melissa P. 78,340.06 3,768.90 1,683.92 Nip,Donald Dat Ming 79,295.19 2,319.49 1,083.75 Norris,Hugh F. 94,526.94 13,464.89 449.73 O'Brien,Keldon S. 86,652.17 9,463.19 2,746.16 O'Donnell,Jacqueline P 97,440.63 12,209.59 1,052.46 Oliver,Jeff A. 83,000.99 8,547.44 ‐ Oliver‐Trygg,Steve W. 88,168.22 11,834.00 ‐ Olivier,Nathan 81,035.20 3,529.52 ‐ Olsen,Richard D. 86,964.05 5,674.51 ‐ Olson,George A. 92,072.38 17,194.37 ‐ O'mara,Shaun J. 83,821.14 5,629.68 ‐ Oppelt,Richard D. 66,276.61 12,034.45 ‐ Ordeman,Arjen A 106,361.46 5,312.59 2,157.96 Osler,Matthew F 82,663.36 5,079.81 3,261.16 Owen,Jason 76,857.58 1,830.64 4,844.70 Paine,Daniel T. 34,587.59 60,927.29 ‐ Pargee,Robert 72,616.59 5,364.18 ‐ Parghi,Bhargav N. 90,849.79 4,459.25 1,261.04 Parry,Ryan W 86,785.67 8,128.46 2,144.50
Page 11
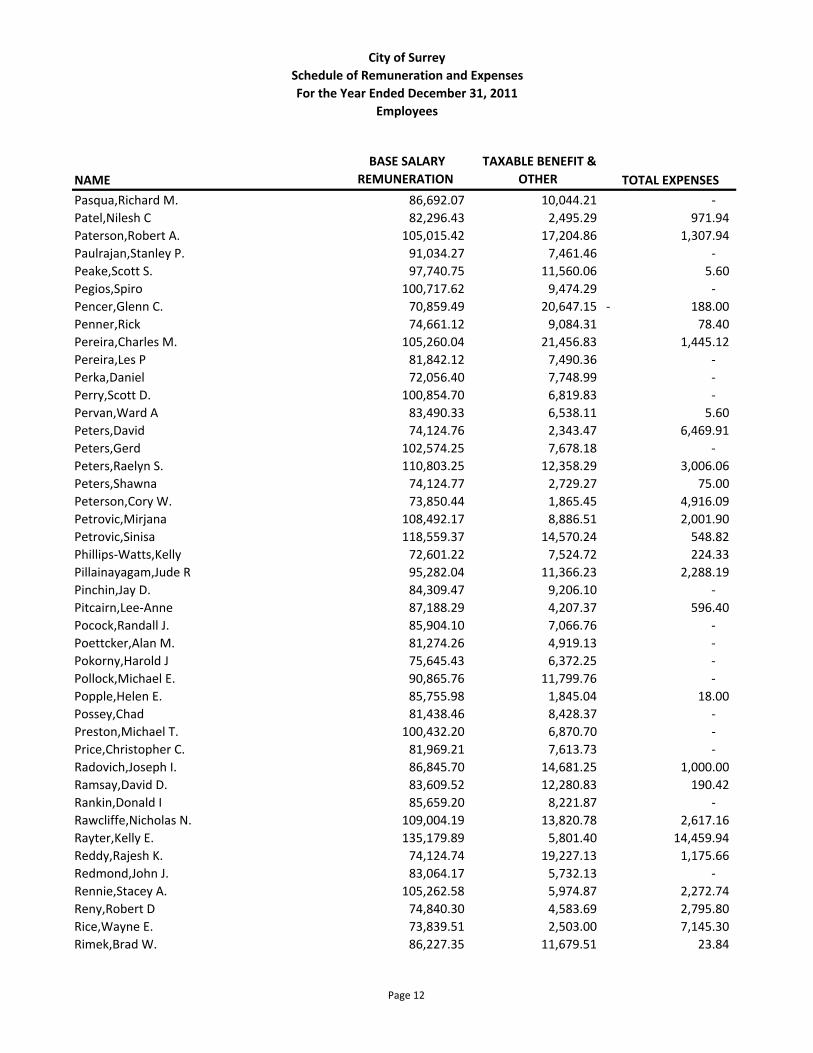
City of SurreySchedule of Remuneration and ExpensesFor the Year Ended December 31, 2011
Employees
NAME BASE SALARY
REMUNERATION TAXABLE BENEFIT &
OTHER TOTAL EXPENSES
Pasqua,Richard M. 86,692.07 10,044.21 ‐ Patel,Nilesh C 82,296.43 2,495.29 971.94 Paterson,Robert A. 105,015.42 17,204.86 1,307.94 Paulrajan,Stanley P. 91,034.27 7,461.46 ‐ Peake,Scott S. 97,740.75 11,560.06 5.60 Pegios,Spiro 100,717.62 9,474.29 ‐ Pencer,Glenn C. 70,859.49 20,647.15 188.00‐ Penner,Rick 74,661.12 9,084.31 78.40 Pereira,Charles M. 105,260.04 21,456.83 1,445.12 Pereira,Les P 81,842.12 7,490.36 ‐ Perka,Daniel 72,056.40 7,748.99 ‐ Perry,Scott D. 100,854.70 6,819.83 ‐ Pervan,Ward A 83,490.33 6,538.11 5.60 Peters,David 74,124.76 2,343.47 6,469.91 Peters,Gerd 102,574.25 7,678.18 ‐ Peters,Raelyn S. 110,803.25 12,358.29 3,006.06 Peters,Shawna 74,124.77 2,729.27 75.00 Peterson,Cory W. 73,850.44 1,865.45 4,916.09 Petrovic,Mirjana 108,492.17 8,886.51 2,001.90 Petrovic,Sinisa 118,559.37 14,570.24 548.82 Phillips‐Watts,Kelly 72,601.22 7,524.72 224.33 Pillainayagam,Jude R 95,282.04 11,366.23 2,288.19 Pinchin,Jay D. 84,309.47 9,206.10 ‐ Pitcairn,Lee‐Anne 87,188.29 4,207.37 596.40 Pocock,Randall J. 85,904.10 7,066.76 ‐ Poettcker,Alan M. 81,274.26 4,919.13 ‐ Pokorny,Harold J 75,645.43 6,372.25 ‐ Pollock,Michael E. 90,865.76 11,799.76 ‐ Popple,Helen E. 85,755.98 1,845.04 18.00 Possey,Chad 81,438.46 8,428.37 ‐ Preston,Michael T. 100,432.20 6,870.70 ‐ Price,Christopher C. 81,969.21 7,613.73 ‐ Radovich,Joseph I. 86,845.70 14,681.25 1,000.00 Ramsay,David D. 83,609.52 12,280.83 190.42 Rankin,Donald I 85,659.20 8,221.87 ‐ Rawcliffe,Nicholas N. 109,004.19 13,820.78 2,617.16 Rayter,Kelly E. 135,179.89 5,801.40 14,459.94 Reddy,Rajesh K. 74,124.74 19,227.13 1,175.66 Redmond,John J. 83,064.17 5,732.13 ‐ Rennie,Stacey A. 105,262.58 5,974.87 2,272.74 Reny,Robert D 74,840.30 4,583.69 2,795.80 Rice,Wayne E. 73,839.51 2,503.00 7,145.30 Rimek,Brad W. 86,227.35 11,679.51 23.84
Page 12
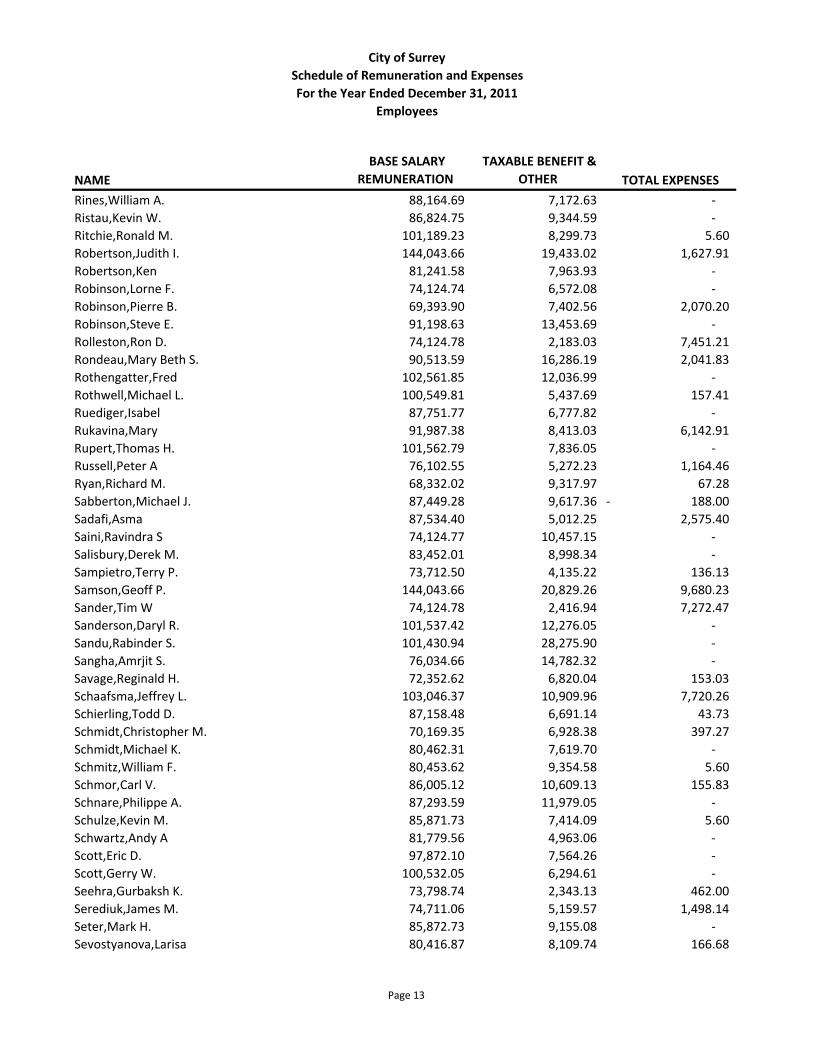
City of SurreySchedule of Remuneration and ExpensesFor the Year Ended December 31, 2011
Employees
NAME BASE SALARY
REMUNERATION TAXABLE BENEFIT &
OTHER TOTAL EXPENSES
Rines,William A. 88,164.69 7,172.63 ‐ Ristau,Kevin W. 86,824.75 9,344.59 ‐ Ritchie,Ronald M. 101,189.23 8,299.73 5.60 Robertson,Judith I. 144,043.66 19,433.02 1,627.91 Robertson,Ken 81,241.58 7,963.93 ‐ Robinson,Lorne F. 74,124.74 6,572.08 ‐ Robinson,Pierre B. 69,393.90 7,402.56 2,070.20 Robinson,Steve E. 91,198.63 13,453.69 ‐ Rolleston,Ron D. 74,124.78 2,183.03 7,451.21 Rondeau,Mary Beth S. 90,513.59 16,286.19 2,041.83 Rothengatter,Fred 102,561.85 12,036.99 ‐ Rothwell,Michael L. 100,549.81 5,437.69 157.41 Ruediger,Isabel 87,751.77 6,777.82 ‐ Rukavina,Mary 91,987.38 8,413.03 6,142.91 Rupert,Thomas H. 101,562.79 7,836.05 ‐ Russell,Peter A 76,102.55 5,272.23 1,164.46 Ryan,Richard M. 68,332.02 9,317.97 67.28 Sabberton,Michael J. 87,449.28 9,617.36 188.00‐ Sadafi,Asma 87,534.40 5,012.25 2,575.40 Saini,Ravindra S 74,124.77 10,457.15 ‐ Salisbury,Derek M. 83,452.01 8,998.34 ‐ Sampietro,Terry P. 73,712.50 4,135.22 136.13 Samson,Geoff P. 144,043.66 20,829.26 9,680.23 Sander,Tim W 74,124.78 2,416.94 7,272.47 Sanderson,Daryl R. 101,537.42 12,276.05 ‐ Sandu,Rabinder S. 101,430.94 28,275.90 ‐ Sangha,Amrjit S. 76,034.66 14,782.32 ‐ Savage,Reginald H. 72,352.62 6,820.04 153.03 Schaafsma,Jeffrey L. 103,046.37 10,909.96 7,720.26 Schierling,Todd D. 87,158.48 6,691.14 43.73 Schmidt,Christopher M. 70,169.35 6,928.38 397.27 Schmidt,Michael K. 80,462.31 7,619.70 ‐ Schmitz,William F. 80,453.62 9,354.58 5.60 Schmor,Carl V. 86,005.12 10,609.13 155.83 Schnare,Philippe A. 87,293.59 11,979.05 ‐ Schulze,Kevin M. 85,871.73 7,414.09 5.60 Schwartz,Andy A 81,779.56 4,963.06 ‐ Scott,Eric D. 97,872.10 7,564.26 ‐ Scott,Gerry W. 100,532.05 6,294.61 ‐ Seehra,Gurbaksh K. 73,798.74 2,343.13 462.00 Serediuk,James M. 74,711.06 5,159.57 1,498.14 Seter,Mark H. 85,872.73 9,155.08 ‐ Sevostyanova,Larisa 80,416.87 8,109.74 166.68
Page 13
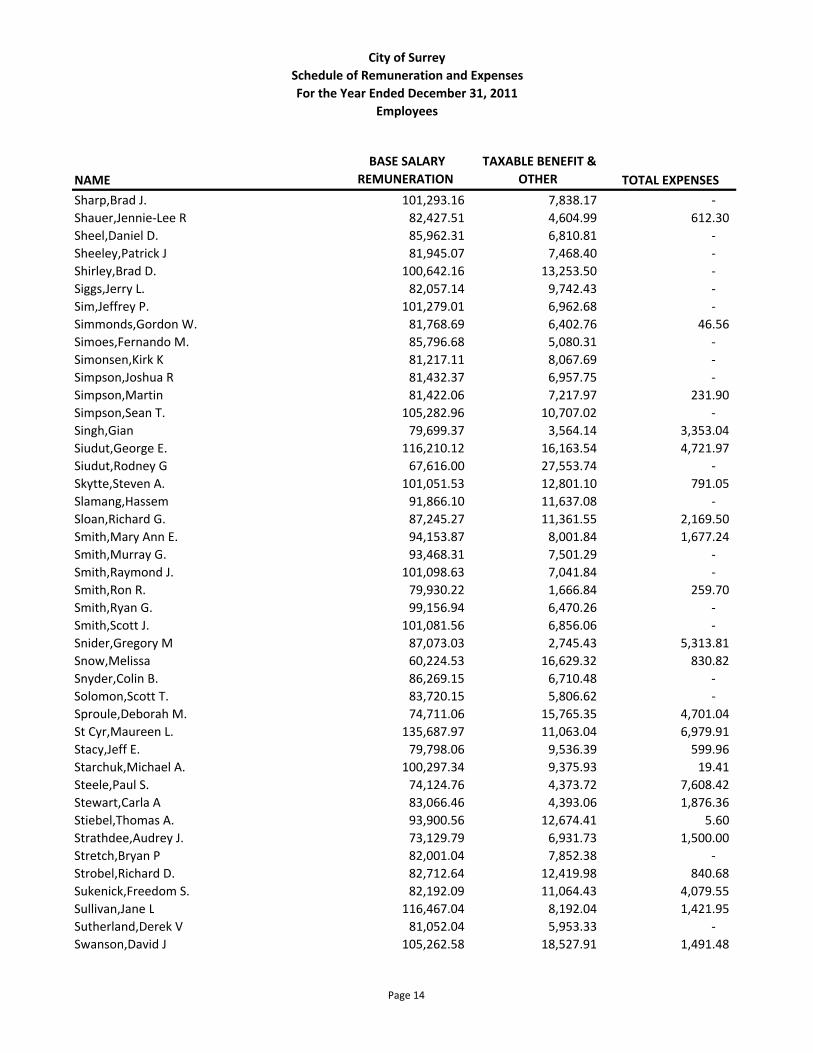
City of SurreySchedule of Remuneration and ExpensesFor the Year Ended December 31, 2011
Employees
NAME BASE SALARY
REMUNERATION TAXABLE BENEFIT &
OTHER TOTAL EXPENSES
Sharp,Brad J. 101,293.16 7,838.17 ‐ Shauer,Jennie‐Lee R 82,427.51 4,604.99 612.30 Sheel,Daniel D. 85,962.31 6,810.81 ‐ Sheeley,Patrick J 81,945.07 7,468.40 ‐ Shirley,Brad D. 100,642.16 13,253.50 ‐ Siggs,Jerry L. 82,057.14 9,742.43 ‐ Sim,Jeffrey P. 101,279.01 6,962.68 ‐ Simmonds,Gordon W. 81,768.69 6,402.76 46.56 Simoes,Fernando M. 85,796.68 5,080.31 ‐ Simonsen,Kirk K 81,217.11 8,067.69 ‐ Simpson,Joshua R 81,432.37 6,957.75 ‐ Simpson,Martin 81,422.06 7,217.97 231.90 Simpson,Sean T. 105,282.96 10,707.02 ‐ Singh,Gian 79,699.37 3,564.14 3,353.04 Siudut,George E. 116,210.12 16,163.54 4,721.97 Siudut,Rodney G 67,616.00 27,553.74 ‐ Skytte,Steven A. 101,051.53 12,801.10 791.05 Slamang,Hassem 91,866.10 11,637.08 ‐ Sloan,Richard G. 87,245.27 11,361.55 2,169.50 Smith,Mary Ann E. 94,153.87 8,001.84 1,677.24 Smith,Murray G. 93,468.31 7,501.29 ‐ Smith,Raymond J. 101,098.63 7,041.84 ‐ Smith,Ron R. 79,930.22 1,666.84 259.70 Smith,Ryan G. 99,156.94 6,470.26 ‐ Smith,Scott J. 101,081.56 6,856.06 ‐ Snider,Gregory M 87,073.03 2,745.43 5,313.81 Snow,Melissa 60,224.53 16,629.32 830.82 Snyder,Colin B. 86,269.15 6,710.48 ‐ Solomon,Scott T. 83,720.15 5,806.62 ‐ Sproule,Deborah M. 74,711.06 15,765.35 4,701.04 St Cyr,Maureen L. 135,687.97 11,063.04 6,979.91 Stacy,Jeff E. 79,798.06 9,536.39 599.96 Starchuk,Michael A. 100,297.34 9,375.93 19.41 Steele,Paul S. 74,124.76 4,373.72 7,608.42 Stewart,Carla A 83,066.46 4,393.06 1,876.36 Stiebel,Thomas A. 93,900.56 12,674.41 5.60 Strathdee,Audrey J. 73,129.79 6,931.73 1,500.00 Stretch,Bryan P 82,001.04 7,852.38 ‐ Strobel,Richard D. 82,712.64 12,419.98 840.68 Sukenick,Freedom S. 82,192.09 11,064.43 4,079.55 Sullivan,Jane L 116,467.04 8,192.04 1,421.95 Sutherland,Derek V 81,052.04 5,953.33 ‐ Swanson,David J 105,262.58 18,527.91 1,491.48
Page 14
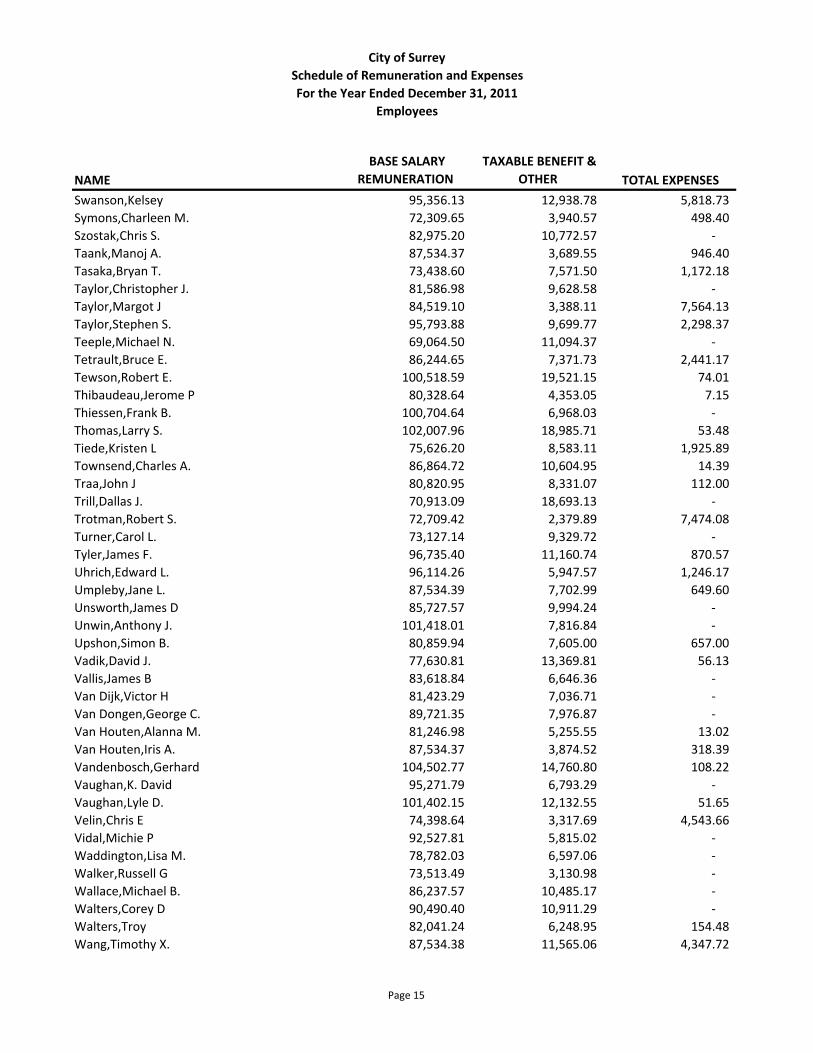
City of SurreySchedule of Remuneration and ExpensesFor the Year Ended December 31, 2011
Employees
NAME BASE SALARY
REMUNERATION TAXABLE BENEFIT &
OTHER TOTAL EXPENSES
Swanson,Kelsey 95,356.13 12,938.78 5,818.73 Symons,Charleen M. 72,309.65 3,940.57 498.40 Szostak,Chris S. 82,975.20 10,772.57 ‐ Taank,Manoj A. 87,534.37 3,689.55 946.40 Tasaka,Bryan T. 73,438.60 7,571.50 1,172.18 Taylor,Christopher J. 81,586.98 9,628.58 ‐ Taylor,Margot J 84,519.10 3,388.11 7,564.13 Taylor,Stephen S. 95,793.88 9,699.77 2,298.37 Teeple,Michael N. 69,064.50 11,094.37 ‐ Tetrault,Bruce E. 86,244.65 7,371.73 2,441.17 Tewson,Robert E. 100,518.59 19,521.15 74.01 Thibaudeau,Jerome P 80,328.64 4,353.05 7.15 Thiessen,Frank B. 100,704.64 6,968.03 ‐ Thomas,Larry S. 102,007.96 18,985.71 53.48 Tiede,Kristen L 75,626.20 8,583.11 1,925.89 Townsend,Charles A. 86,864.72 10,604.95 14.39 Traa,John J 80,820.95 8,331.07 112.00 Trill,Dallas J. 70,913.09 18,693.13 ‐ Trotman,Robert S. 72,709.42 2,379.89 7,474.08 Turner,Carol L. 73,127.14 9,329.72 ‐ Tyler,James F. 96,735.40 11,160.74 870.57 Uhrich,Edward L. 96,114.26 5,947.57 1,246.17 Umpleby,Jane L. 87,534.39 7,702.99 649.60 Unsworth,James D 85,727.57 9,994.24 ‐ Unwin,Anthony J. 101,418.01 7,816.84 ‐ Upshon,Simon B. 80,859.94 7,605.00 657.00 Vadik,David J. 77,630.81 13,369.81 56.13 Vallis,James B 83,618.84 6,646.36 ‐ Van Dijk,Victor H 81,423.29 7,036.71 ‐ Van Dongen,George C. 89,721.35 7,976.87 ‐ Van Houten,Alanna M. 81,246.98 5,255.55 13.02 Van Houten,Iris A. 87,534.37 3,874.52 318.39 Vandenbosch,Gerhard 104,502.77 14,760.80 108.22 Vaughan,K. David 95,271.79 6,793.29 ‐ Vaughan,Lyle D. 101,402.15 12,132.55 51.65 Velin,Chris E 74,398.64 3,317.69 4,543.66 Vidal,Michie P 92,527.81 5,815.02 ‐ Waddington,Lisa M. 78,782.03 6,597.06 ‐ Walker,Russell G 73,513.49 3,130.98 ‐ Wallace,Michael B. 86,237.57 10,485.17 ‐ Walters,Corey D 90,490.40 10,911.29 ‐ Walters,Troy 82,041.24 6,248.95 154.48 Wang,Timothy X. 87,534.38 11,565.06 4,347.72
Page 15
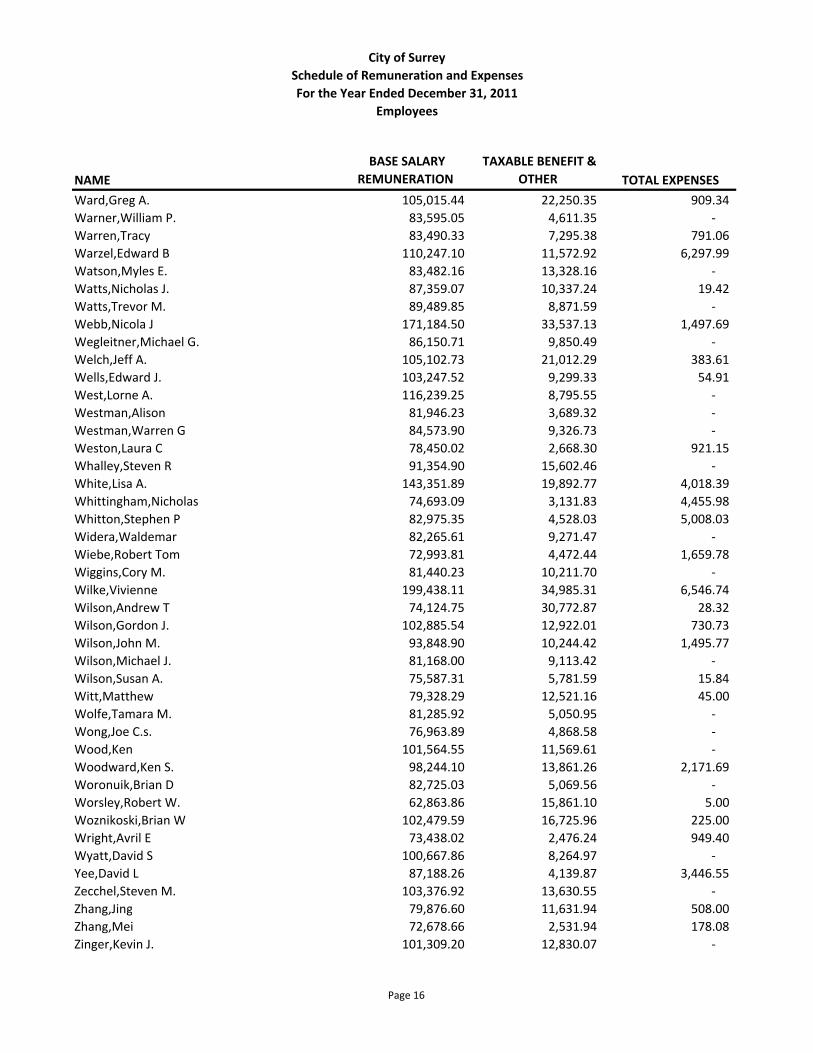
City of SurreySchedule of Remuneration and ExpensesFor the Year Ended December 31, 2011
Employees
NAME BASE SALARY
REMUNERATION TAXABLE BENEFIT &
OTHER TOTAL EXPENSES
Ward,Greg A. 105,015.44 22,250.35 909.34 Warner,William P. 83,595.05 4,611.35 ‐ Warren,Tracy 83,490.33 7,295.38 791.06 Warzel,Edward B 110,247.10 11,572.92 6,297.99 Watson,Myles E. 83,482.16 13,328.16 ‐ Watts,Nicholas J. 87,359.07 10,337.24 19.42 Watts,Trevor M. 89,489.85 8,871.59 ‐ Webb,Nicola J 171,184.50 33,537.13 1,497.69 Wegleitner,Michael G. 86,150.71 9,850.49 ‐ Welch,Jeff A. 105,102.73 21,012.29 383.61 Wells,Edward J. 103,247.52 9,299.33 54.91 West,Lorne A. 116,239.25 8,795.55 ‐ Westman,Alison 81,946.23 3,689.32 ‐ Westman,Warren G 84,573.90 9,326.73 ‐ Weston,Laura C 78,450.02 2,668.30 921.15 Whalley,Steven R 91,354.90 15,602.46 ‐ White,Lisa A. 143,351.89 19,892.77 4,018.39 Whittingham,Nicholas 74,693.09 3,131.83 4,455.98 Whitton,Stephen P 82,975.35 4,528.03 5,008.03 Widera,Waldemar 82,265.61 9,271.47 ‐ Wiebe,Robert Tom 72,993.81 4,472.44 1,659.78 Wiggins,Cory M. 81,440.23 10,211.70 ‐ Wilke,Vivienne 199,438.11 34,985.31 6,546.74 Wilson,Andrew T 74,124.75 30,772.87 28.32 Wilson,Gordon J. 102,885.54 12,922.01 730.73 Wilson,John M. 93,848.90 10,244.42 1,495.77 Wilson,Michael J. 81,168.00 9,113.42 ‐ Wilson,Susan A. 75,587.31 5,781.59 15.84 Witt,Matthew 79,328.29 12,521.16 45.00 Wolfe,Tamara M. 81,285.92 5,050.95 ‐ Wong,Joe C.s. 76,963.89 4,868.58 ‐ Wood,Ken 101,564.55 11,569.61 ‐ Woodward,Ken S. 98,244.10 13,861.26 2,171.69 Woronuik,Brian D 82,725.03 5,069.56 ‐ Worsley,Robert W. 62,863.86 15,861.10 5.00 Woznikoski,Brian W 102,479.59 16,725.96 225.00 Wright,Avril E 73,438.02 2,476.24 949.40 Wyatt,David S 100,667.86 8,264.97 ‐ Yee,David L 87,188.26 4,139.87 3,446.55 Zecchel,Steven M. 103,376.92 13,630.55 ‐ Zhang,Jing 79,876.60 11,631.94 508.00 Zhang,Mei 72,678.66 2,531.94 178.08 Zinger,Kevin J. 101,309.20 12,830.07 ‐
Page 16
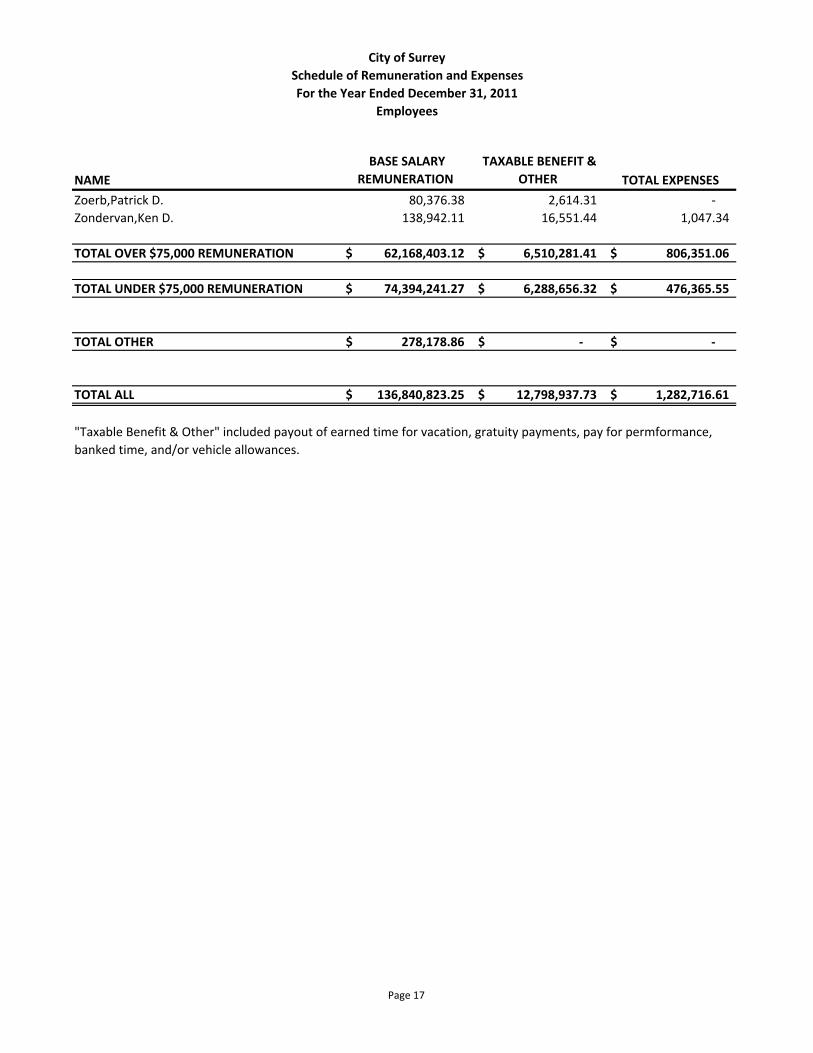
City of SurreySchedule of Remuneration and ExpensesFor the Year Ended December 31, 2011
Employees
NAME BASE SALARY
REMUNERATION TAXABLE BENEFIT &
OTHER TOTAL EXPENSES
Zoerb,Patrick D. 80,376.38 2,614.31 ‐ Zondervan,Ken D. 138,942.11 16,551.44 1,047.34
TOTAL OVER $75,000 REMUNERATION 62,168,403.12$ 6,510,281.41$ 806,351.06$
TOTAL UNDER $75,000 REMUNERATION 74,394,241.27$ 6,288,656.32$ 476,365.55$
TOTAL OTHER 278,178.86$ ‐$ ‐$
TOTAL ALL 136,840,823.25$ 12,798,937.73$ 1,282,716.61$
"Taxable Benefit & Other" included payout of earned time for vacation, gratuity payments, pay for permformance, banked time, and/or vehicle allowances.
Page 17

City of SurreySchedule of Remuneration and ExpensesFor the year ended December 31, 2011 (in thousands of dollars)Reconciliation of Remuneration to Financial Statements
Base salary remuneration 136,841$ Taxable benefit and other 12,799 Total remuneration ‐ all employees 149,640 Reconciling items:
Add: Other Benefit overhead 28,911 Less: Prior‐year accrual 3,927‐ Add: Current‐year accrual 3,518 Less: Instructors included under consulting 3,156‐
Total City Salary and Benefits 174,985$
Total per Consolidated Statement of Expenses, Schedule 9 186,284$ Less: Library Salaries and Benefits per Statement of Operations 10,374‐ Less: SCDC Salaries and Benefits per Statement of Operations 925‐
Total City Salary and Benefits 174,985$
City of Surrey Statement of Severance Agreements Section 7
2011 Statement of Financial Information
During the fiscal year ending December 31, 2011, the City of Surrey entered into four severance agreements ranging from 1 month to 12 months in duration. Prepared under the Financial Information Regulation, Schedule 1, subsection 6(7)
City of Surrey Schedule of Suppliers of Goods or Services Section 8
2011 Statement of Financial Information
Regulations require the City of Surrey to report the total amount paid to each supplier for goods and services that exceeds $25,000 in the year reported. Prepared under the Financial Information Regulation, Schedule 1, subsection 7(1)
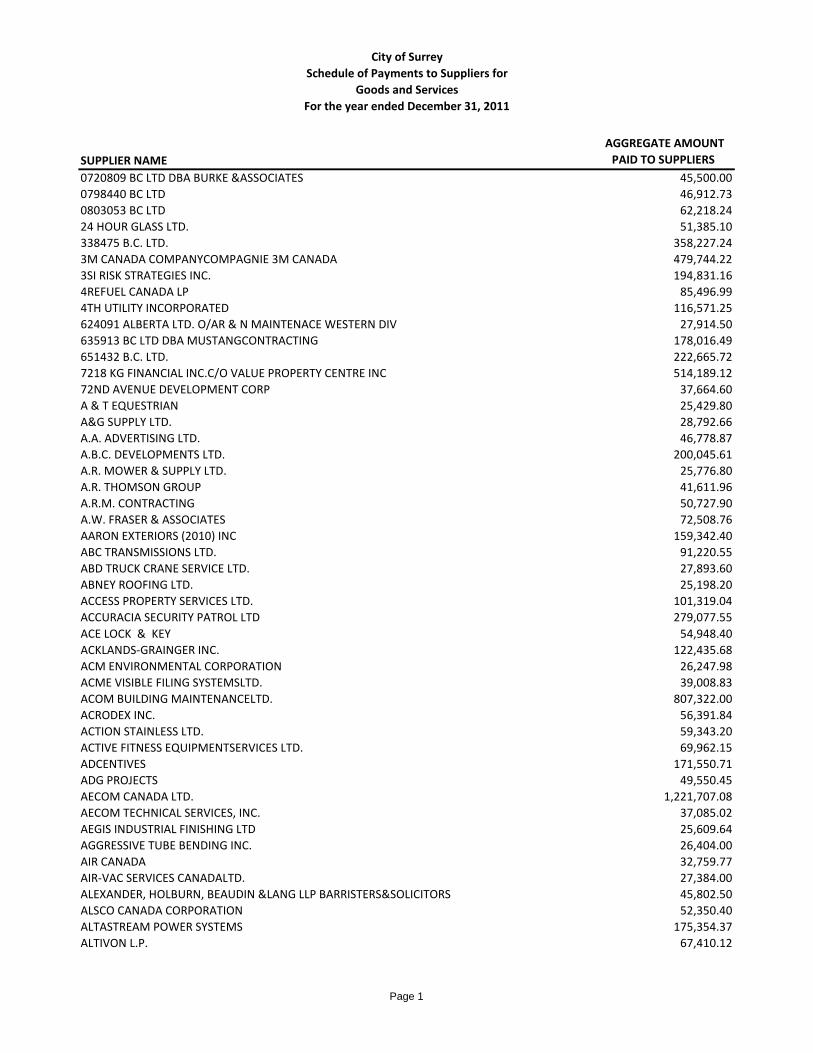
City of SurreySchedule of Payments to Suppliers for
Goods and ServicesFor the year ended December 31, 2011
SUPPLIER NAME AGGREGATE AMOUNT PAID TO SUPPLIERS
0720809 BC LTD DBA BURKE &ASSOCIATES 45,500.000798440 BC LTD 46,912.730803053 BC LTD 62,218.2424 HOUR GLASS LTD. 51,385.10338475 B.C. LTD. 358,227.243M CANADA COMPANYCOMPAGNIE 3M CANADA 479,744.223SI RISK STRATEGIES INC. 194,831.164REFUEL CANADA LP 85,496.994TH UTILITY INCORPORATED 116,571.25624091 ALBERTA LTD. O/AR & N MAINTENACE WESTERN DIV 27,914.50635913 BC LTD DBA MUSTANGCONTRACTING 178,016.49651432 B.C. LTD. 222,665.727218 KG FINANCIAL INC.C/O VALUE PROPERTY CENTRE INC 514,189.1272ND AVENUE DEVELOPMENT CORP 37,664.60A & T EQUESTRIAN 25,429.80A&G SUPPLY LTD. 28,792.66A.A. ADVERTISING LTD. 46,778.87A.B.C. DEVELOPMENTS LTD. 200,045.61A.R. MOWER & SUPPLY LTD. 25,776.80A.R. THOMSON GROUP 41,611.96A.R.M. CONTRACTING 50,727.90A.W. FRASER & ASSOCIATES 72,508.76AARON EXTERIORS (2010) INC 159,342.40ABC TRANSMISSIONS LTD. 91,220.55ABD TRUCK CRANE SERVICE LTD. 27,893.60ABNEY ROOFING LTD. 25,198.20ACCESS PROPERTY SERVICES LTD. 101,319.04ACCURACIA SECURITY PATROL LTD 279,077.55ACE LOCK & KEY 54,948.40ACKLANDS‐GRAINGER INC. 122,435.68ACM ENVIRONMENTAL CORPORATION 26,247.98ACME VISIBLE FILING SYSTEMSLTD. 39,008.83ACOM BUILDING MAINTENANCELTD. 807,322.00ACRODEX INC. 56,391.84ACTION STAINLESS LTD. 59,343.20ACTIVE FITNESS EQUIPMENTSERVICES LTD. 69,962.15ADCENTIVES 171,550.71ADG PROJECTS 49,550.45AECOM CANADA LTD. 1,221,707.08AECOM TECHNICAL SERVICES, INC. 37,085.02AEGIS INDUSTRIAL FINISHING LTD 25,609.64AGGRESSIVE TUBE BENDING INC. 26,404.00AIR CANADA 32,759.77AIR‐VAC SERVICES CANADALTD. 27,384.00ALEXANDER, HOLBURN, BEAUDIN &LANG LLP BARRISTERS&SOLICITORS 45,802.50ALSCO CANADA CORPORATION 52,350.40ALTASTREAM POWER SYSTEMS 175,354.37ALTIVON L.P. 67,410.12
Page 1
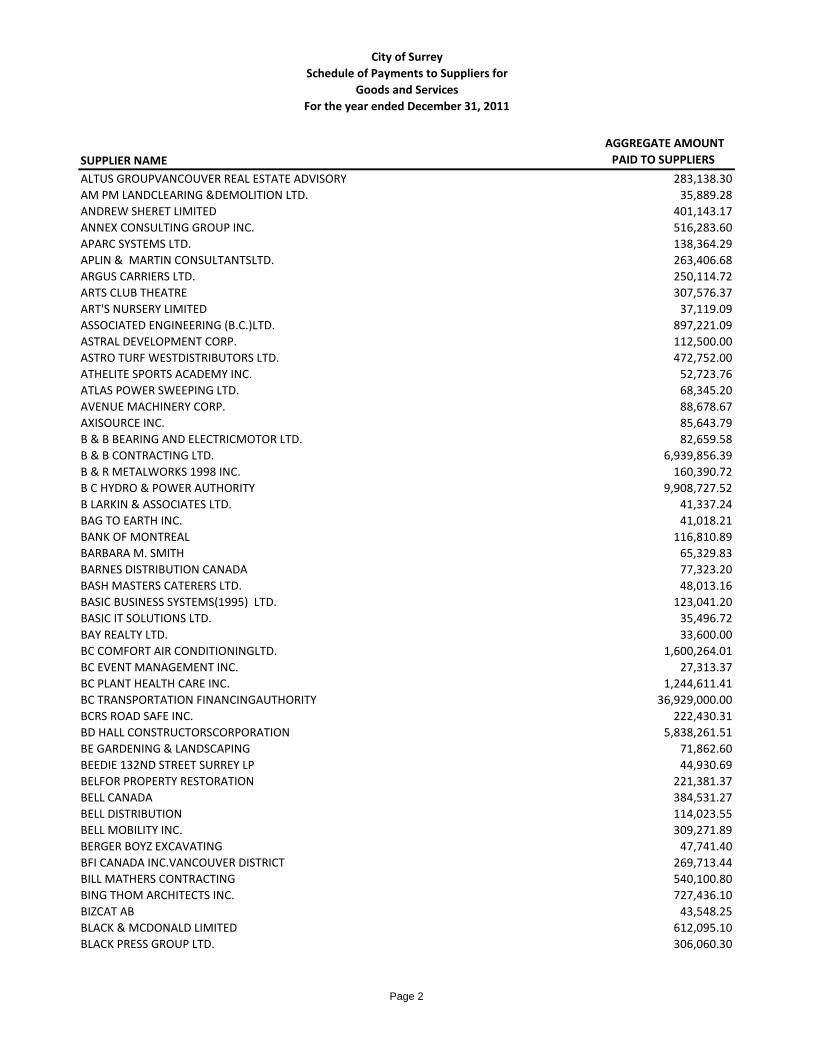
City of SurreySchedule of Payments to Suppliers for
Goods and ServicesFor the year ended December 31, 2011
SUPPLIER NAME AGGREGATE AMOUNT PAID TO SUPPLIERS
ALTUS GROUPVANCOUVER REAL ESTATE ADVISORY 283,138.30AM PM LANDCLEARING &DEMOLITION LTD. 35,889.28ANDREW SHERET LIMITED 401,143.17ANNEX CONSULTING GROUP INC. 516,283.60APARC SYSTEMS LTD. 138,364.29APLIN & MARTIN CONSULTANTSLTD. 263,406.68ARGUS CARRIERS LTD. 250,114.72ARTS CLUB THEATRE 307,576.37ART'S NURSERY LIMITED 37,119.09ASSOCIATED ENGINEERING (B.C.)LTD. 897,221.09ASTRAL DEVELOPMENT CORP. 112,500.00ASTRO TURF WESTDISTRIBUTORS LTD. 472,752.00ATHELITE SPORTS ACADEMY INC. 52,723.76ATLAS POWER SWEEPING LTD. 68,345.20AVENUE MACHINERY CORP. 88,678.67AXISOURCE INC. 85,643.79B & B BEARING AND ELECTRICMOTOR LTD. 82,659.58B & B CONTRACTING LTD. 6,939,856.39B & R METALWORKS 1998 INC. 160,390.72B C HYDRO & POWER AUTHORITY 9,908,727.52B LARKIN & ASSOCIATES LTD. 41,337.24BAG TO EARTH INC. 41,018.21BANK OF MONTREAL 116,810.89BARBARA M. SMITH 65,329.83BARNES DISTRIBUTION CANADA 77,323.20BASH MASTERS CATERERS LTD. 48,013.16BASIC BUSINESS SYSTEMS(1995) LTD. 123,041.20BASIC IT SOLUTIONS LTD. 35,496.72BAY REALTY LTD. 33,600.00BC COMFORT AIR CONDITIONINGLTD. 1,600,264.01BC EVENT MANAGEMENT INC. 27,313.37BC PLANT HEALTH CARE INC. 1,244,611.41BC TRANSPORTATION FINANCINGAUTHORITY 36,929,000.00BCRS ROAD SAFE INC. 222,430.31BD HALL CONSTRUCTORSCORPORATION 5,838,261.51BE GARDENING & LANDSCAPING 71,862.60BEEDIE 132ND STREET SURREY LP 44,930.69BELFOR PROPERTY RESTORATION 221,381.37BELL CANADA 384,531.27BELL DISTRIBUTION 114,023.55BELL MOBILITY INC. 309,271.89BERGER BOYZ EXCAVATING 47,741.40BFI CANADA INC.VANCOUVER DISTRICT 269,713.44BILL MATHERS CONTRACTING 540,100.80BING THOM ARCHITECTS INC. 727,436.10BIZCAT AB 43,548.25BLACK & MCDONALD LIMITED 612,095.10BLACK PRESS GROUP LTD. 306,060.30
Page 2
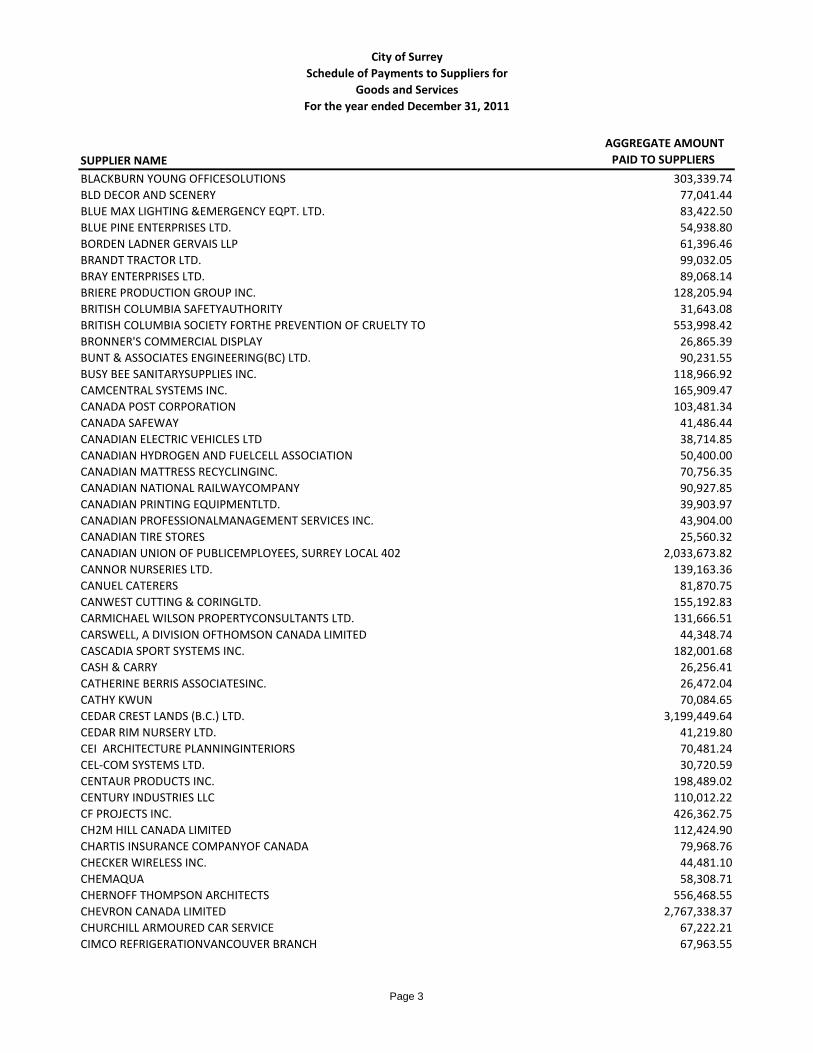
City of SurreySchedule of Payments to Suppliers for
Goods and ServicesFor the year ended December 31, 2011
SUPPLIER NAME AGGREGATE AMOUNT PAID TO SUPPLIERS
BLACKBURN YOUNG OFFICESOLUTIONS 303,339.74BLD DECOR AND SCENERY 77,041.44BLUE MAX LIGHTING &EMERGENCY EQPT. LTD. 83,422.50BLUE PINE ENTERPRISES LTD. 54,938.80BORDEN LADNER GERVAIS LLP 61,396.46BRANDT TRACTOR LTD. 99,032.05BRAY ENTERPRISES LTD. 89,068.14BRIERE PRODUCTION GROUP INC. 128,205.94BRITISH COLUMBIA SAFETYAUTHORITY 31,643.08BRITISH COLUMBIA SOCIETY FORTHE PREVENTION OF CRUELTY TO 553,998.42BRONNER'S COMMERCIAL DISPLAY 26,865.39BUNT & ASSOCIATES ENGINEERING(BC) LTD. 90,231.55BUSY BEE SANITARYSUPPLIES INC. 118,966.92CAMCENTRAL SYSTEMS INC. 165,909.47CANADA POST CORPORATION 103,481.34CANADA SAFEWAY 41,486.44CANADIAN ELECTRIC VEHICLES LTD 38,714.85CANADIAN HYDROGEN AND FUELCELL ASSOCIATION 50,400.00CANADIAN MATTRESS RECYCLINGINC. 70,756.35CANADIAN NATIONAL RAILWAYCOMPANY 90,927.85CANADIAN PRINTING EQUIPMENTLTD. 39,903.97CANADIAN PROFESSIONALMANAGEMENT SERVICES INC. 43,904.00CANADIAN TIRE STORES 25,560.32CANADIAN UNION OF PUBLICEMPLOYEES, SURREY LOCAL 402 2,033,673.82CANNOR NURSERIES LTD. 139,163.36CANUEL CATERERS 81,870.75CANWEST CUTTING & CORINGLTD. 155,192.83CARMICHAEL WILSON PROPERTYCONSULTANTS LTD. 131,666.51CARSWELL, A DIVISION OFTHOMSON CANADA LIMITED 44,348.74CASCADIA SPORT SYSTEMS INC. 182,001.68CASH & CARRY 26,256.41CATHERINE BERRIS ASSOCIATESINC. 26,472.04CATHY KWUN 70,084.65CEDAR CREST LANDS (B.C.) LTD. 3,199,449.64CEDAR RIM NURSERY LTD. 41,219.80CEI ARCHITECTURE PLANNINGINTERIORS 70,481.24CEL‐COM SYSTEMS LTD. 30,720.59CENTAUR PRODUCTS INC. 198,489.02CENTURY INDUSTRIES LLC 110,012.22CF PROJECTS INC. 426,362.75CH2M HILL CANADA LIMITED 112,424.90CHARTIS INSURANCE COMPANYOF CANADA 79,968.76CHECKER WIRELESS INC. 44,481.10CHEMAQUA 58,308.71CHERNOFF THOMPSON ARCHITECTS 556,468.55CHEVRON CANADA LIMITED 2,767,338.37CHURCHILL ARMOURED CAR SERVICE 67,222.21CIMCO REFRIGERATIONVANCOUVER BRANCH 67,963.55
Page 3
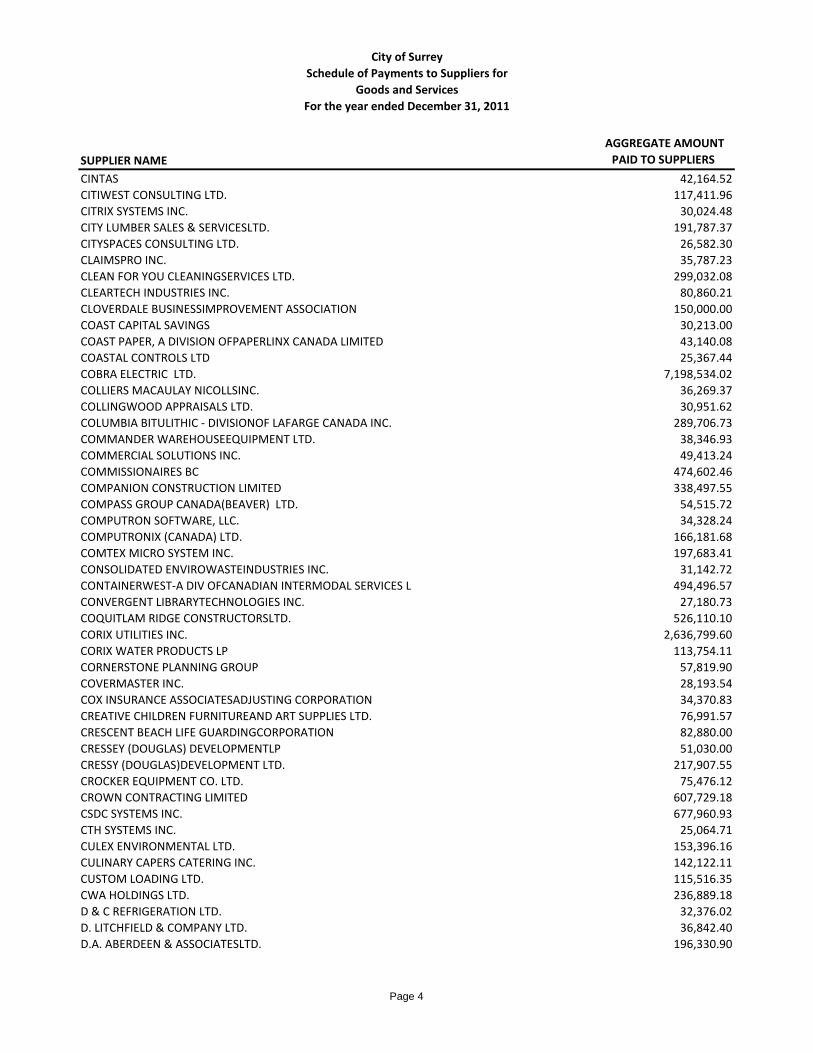
City of SurreySchedule of Payments to Suppliers for
Goods and ServicesFor the year ended December 31, 2011
SUPPLIER NAME AGGREGATE AMOUNT PAID TO SUPPLIERS
CINTAS 42,164.52CITIWEST CONSULTING LTD. 117,411.96CITRIX SYSTEMS INC. 30,024.48CITY LUMBER SALES & SERVICESLTD. 191,787.37CITYSPACES CONSULTING LTD. 26,582.30CLAIMSPRO INC. 35,787.23CLEAN FOR YOU CLEANINGSERVICES LTD. 299,032.08CLEARTECH INDUSTRIES INC. 80,860.21CLOVERDALE BUSINESSIMPROVEMENT ASSOCIATION 150,000.00COAST CAPITAL SAVINGS 30,213.00COAST PAPER, A DIVISION OFPAPERLINX CANADA LIMITED 43,140.08COASTAL CONTROLS LTD 25,367.44COBRA ELECTRIC LTD. 7,198,534.02COLLIERS MACAULAY NICOLLSINC. 36,269.37COLLINGWOOD APPRAISALS LTD. 30,951.62COLUMBIA BITULITHIC ‐ DIVISIONOF LAFARGE CANADA INC. 289,706.73COMMANDER WAREHOUSEEQUIPMENT LTD. 38,346.93COMMERCIAL SOLUTIONS INC. 49,413.24COMMISSIONAIRES BC 474,602.46COMPANION CONSTRUCTION LIMITED 338,497.55COMPASS GROUP CANADA(BEAVER) LTD. 54,515.72COMPUTRON SOFTWARE, LLC. 34,328.24COMPUTRONIX (CANADA) LTD. 166,181.68COMTEX MICRO SYSTEM INC. 197,683.41CONSOLIDATED ENVIROWASTEINDUSTRIES INC. 31,142.72CONTAINERWEST‐A DIV OFCANADIAN INTERMODAL SERVICES L 494,496.57CONVERGENT LIBRARYTECHNOLOGIES INC. 27,180.73COQUITLAM RIDGE CONSTRUCTORSLTD. 526,110.10CORIX UTILITIES INC. 2,636,799.60CORIX WATER PRODUCTS LP 113,754.11CORNERSTONE PLANNING GROUP 57,819.90COVERMASTER INC. 28,193.54COX INSURANCE ASSOCIATESADJUSTING CORPORATION 34,370.83CREATIVE CHILDREN FURNITUREAND ART SUPPLIES LTD. 76,991.57CRESCENT BEACH LIFE GUARDINGCORPORATION 82,880.00CRESSEY (DOUGLAS) DEVELOPMENTLP 51,030.00CRESSY (DOUGLAS)DEVELOPMENT LTD. 217,907.55CROCKER EQUIPMENT CO. LTD. 75,476.12CROWN CONTRACTING LIMITED 607,729.18CSDC SYSTEMS INC. 677,960.93CTH SYSTEMS INC. 25,064.71CULEX ENVIRONMENTAL LTD. 153,396.16CULINARY CAPERS CATERING INC. 142,122.11CUSTOM LOADING LTD. 115,516.35CWA HOLDINGS LTD. 236,889.18D & C REFRIGERATION LTD. 32,376.02D. LITCHFIELD & COMPANY LTD. 36,842.40D.A. ABERDEEN & ASSOCIATESLTD. 196,330.90
Page 4
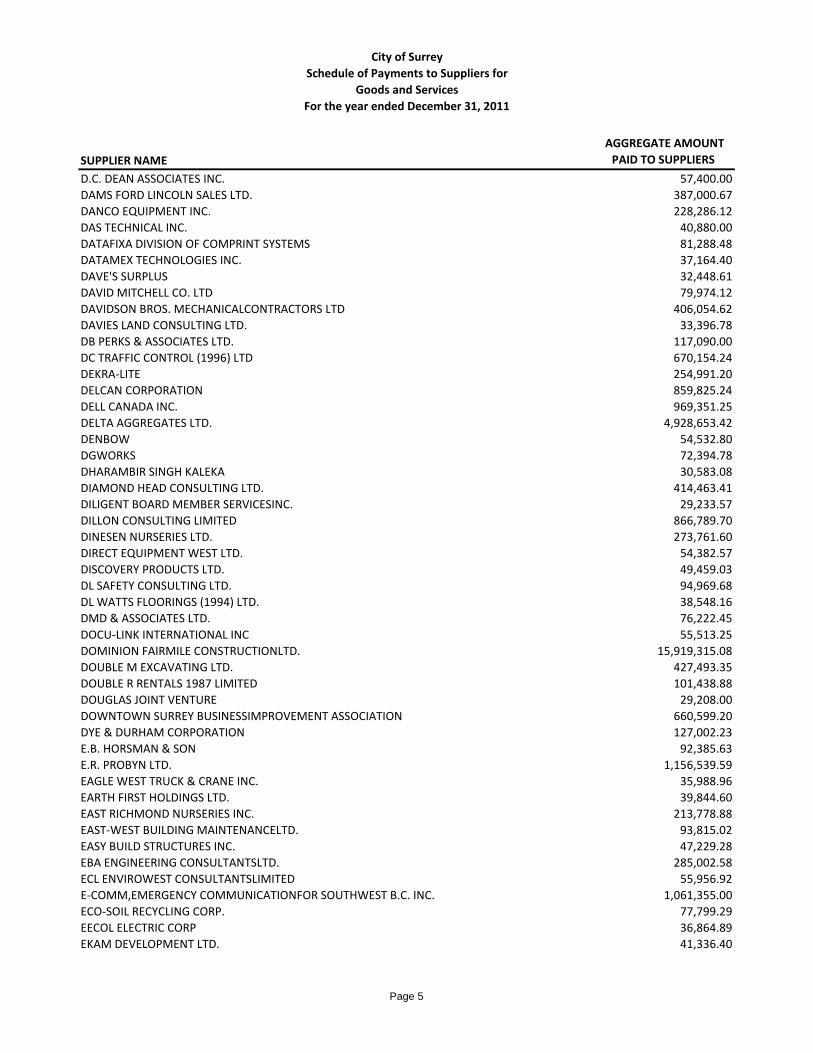
City of SurreySchedule of Payments to Suppliers for
Goods and ServicesFor the year ended December 31, 2011
SUPPLIER NAME AGGREGATE AMOUNT PAID TO SUPPLIERS
D.C. DEAN ASSOCIATES INC. 57,400.00DAMS FORD LINCOLN SALES LTD. 387,000.67DANCO EQUIPMENT INC. 228,286.12DAS TECHNICAL INC. 40,880.00DATAFIXA DIVISION OF COMPRINT SYSTEMS 81,288.48DATAMEX TECHNOLOGIES INC. 37,164.40DAVE'S SURPLUS 32,448.61DAVID MITCHELL CO. LTD 79,974.12DAVIDSON BROS. MECHANICALCONTRACTORS LTD 406,054.62DAVIES LAND CONSULTING LTD. 33,396.78DB PERKS & ASSOCIATES LTD. 117,090.00DC TRAFFIC CONTROL (1996) LTD 670,154.24DEKRA‐LITE 254,991.20DELCAN CORPORATION 859,825.24DELL CANADA INC. 969,351.25DELTA AGGREGATES LTD. 4,928,653.42DENBOW 54,532.80DGWORKS 72,394.78DHARAMBIR SINGH KALEKA 30,583.08DIAMOND HEAD CONSULTING LTD. 414,463.41DILIGENT BOARD MEMBER SERVICESINC. 29,233.57DILLON CONSULTING LIMITED 866,789.70DINESEN NURSERIES LTD. 273,761.60DIRECT EQUIPMENT WEST LTD. 54,382.57DISCOVERY PRODUCTS LTD. 49,459.03DL SAFETY CONSULTING LTD. 94,969.68DL WATTS FLOORINGS (1994) LTD. 38,548.16DMD & ASSOCIATES LTD. 76,222.45DOCU‐LINK INTERNATIONAL INC 55,513.25DOMINION FAIRMILE CONSTRUCTIONLTD. 15,919,315.08DOUBLE M EXCAVATING LTD. 427,493.35DOUBLE R RENTALS 1987 LIMITED 101,438.88DOUGLAS JOINT VENTURE 29,208.00DOWNTOWN SURREY BUSINESSIMPROVEMENT ASSOCIATION 660,599.20DYE & DURHAM CORPORATION 127,002.23E.B. HORSMAN & SON 92,385.63E.R. PROBYN LTD. 1,156,539.59EAGLE WEST TRUCK & CRANE INC. 35,988.96EARTH FIRST HOLDINGS LTD. 39,844.60EAST RICHMOND NURSERIES INC. 213,778.88EAST‐WEST BUILDING MAINTENANCELTD. 93,815.02EASY BUILD STRUCTURES INC. 47,229.28EBA ENGINEERING CONSULTANTSLTD. 285,002.58ECL ENVIROWEST CONSULTANTSLIMITED 55,956.92E‐COMM,EMERGENCY COMMUNICATIONFOR SOUTHWEST B.C. INC. 1,061,355.00ECO‐SOIL RECYCLING CORP. 77,799.29EECOL ELECTRIC CORP 36,864.89EKAM DEVELOPMENT LTD. 41,336.40
Page 5
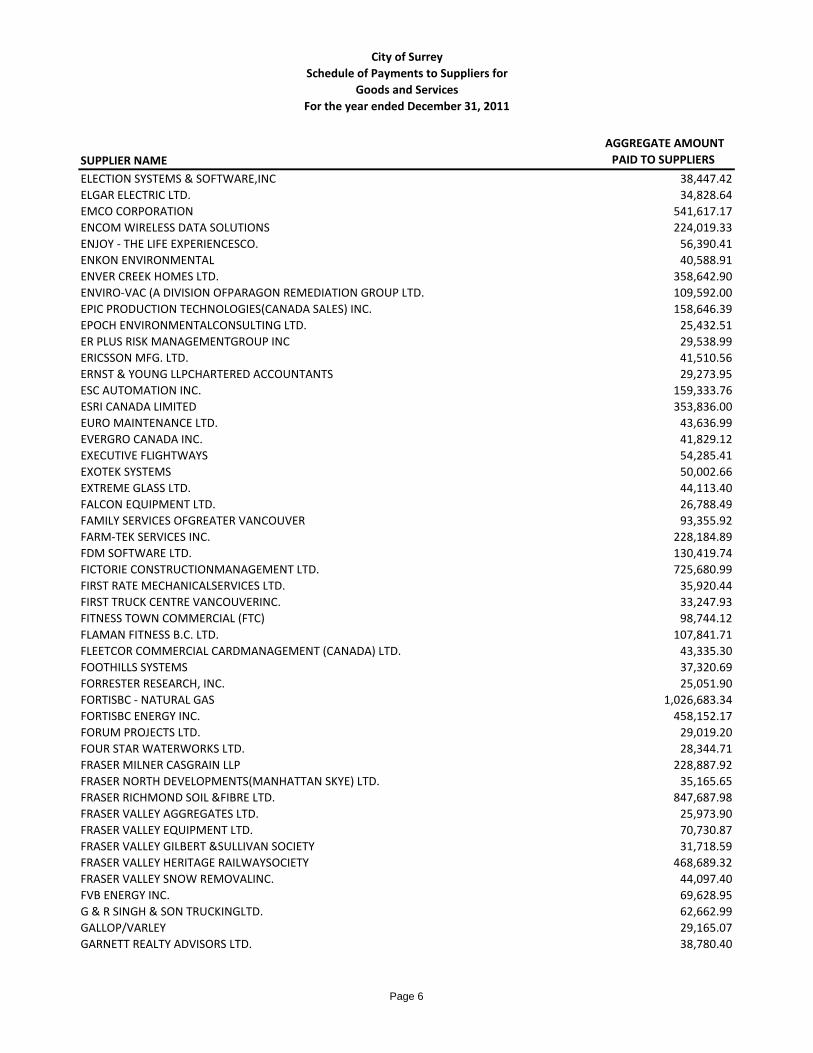
City of SurreySchedule of Payments to Suppliers for
Goods and ServicesFor the year ended December 31, 2011
SUPPLIER NAME AGGREGATE AMOUNT PAID TO SUPPLIERS
ELECTION SYSTEMS & SOFTWARE,INC 38,447.42ELGAR ELECTRIC LTD. 34,828.64EMCO CORPORATION 541,617.17ENCOM WIRELESS DATA SOLUTIONS 224,019.33ENJOY ‐ THE LIFE EXPERIENCESCO. 56,390.41ENKON ENVIRONMENTAL 40,588.91ENVER CREEK HOMES LTD. 358,642.90ENVIRO‐VAC (A DIVISION OFPARAGON REMEDIATION GROUP LTD. 109,592.00EPIC PRODUCTION TECHNOLOGIES(CANADA SALES) INC. 158,646.39EPOCH ENVIRONMENTALCONSULTING LTD. 25,432.51ER PLUS RISK MANAGEMENTGROUP INC 29,538.99ERICSSON MFG. LTD. 41,510.56ERNST & YOUNG LLPCHARTERED ACCOUNTANTS 29,273.95ESC AUTOMATION INC. 159,333.76ESRI CANADA LIMITED 353,836.00EURO MAINTENANCE LTD. 43,636.99EVERGRO CANADA INC. 41,829.12EXECUTIVE FLIGHTWAYS 54,285.41EXOTEK SYSTEMS 50,002.66EXTREME GLASS LTD. 44,113.40FALCON EQUIPMENT LTD. 26,788.49FAMILY SERVICES OFGREATER VANCOUVER 93,355.92FARM‐TEK SERVICES INC. 228,184.89FDM SOFTWARE LTD. 130,419.74FICTORIE CONSTRUCTIONMANAGEMENT LTD. 725,680.99FIRST RATE MECHANICALSERVICES LTD. 35,920.44FIRST TRUCK CENTRE VANCOUVERINC. 33,247.93FITNESS TOWN COMMERCIAL (FTC) 98,744.12FLAMAN FITNESS B.C. LTD. 107,841.71FLEETCOR COMMERCIAL CARDMANAGEMENT (CANADA) LTD. 43,335.30FOOTHILLS SYSTEMS 37,320.69FORRESTER RESEARCH, INC. 25,051.90FORTISBC ‐ NATURAL GAS 1,026,683.34FORTISBC ENERGY INC. 458,152.17FORUM PROJECTS LTD. 29,019.20FOUR STAR WATERWORKS LTD. 28,344.71FRASER MILNER CASGRAIN LLP 228,887.92FRASER NORTH DEVELOPMENTS(MANHATTAN SKYE) LTD. 35,165.65FRASER RICHMOND SOIL &FIBRE LTD. 847,687.98FRASER VALLEY AGGREGATES LTD. 25,973.90FRASER VALLEY EQUIPMENT LTD. 70,730.87FRASER VALLEY GILBERT &SULLIVAN SOCIETY 31,718.59FRASER VALLEY HERITAGE RAILWAYSOCIETY 468,689.32FRASER VALLEY SNOW REMOVALINC. 44,097.40FVB ENERGY INC. 69,628.95G & R SINGH & SON TRUCKINGLTD. 62,662.99GALLOP/VARLEY 29,165.07GARNETT REALTY ADVISORS LTD. 38,780.40
Page 6

City of SurreySchedule of Payments to Suppliers for
Goods and ServicesFor the year ended December 31, 2011
SUPPLIER NAME AGGREGATE AMOUNT PAID TO SUPPLIERS
GARTNER CANADA, CO. 40,992.00GCL CONTRACTING ANDENGINEERING INC. 2,817,418.64GE INTELLIGENT PLATFORMSCANADA 33,401.53GENERAL PAINTAFFILIATE OF WILLIAMS HLDG INC 75,141.51GESCAN, DIVISION OF SONEPARCANADA INC. 57,367.90GFS BRITISH COLUMBIA INC. 83,546.54GIBRALTAR HOLDINGS LTD. 168,474.76GIBSON ECONOMICS, INC. 25,514.29GLEN CHUA 52,405.00GLOBAL KNOWLEDGE NETWORKCANADA INC #B9268 54,188.71GOLDER ASSOCIATES LTD. 252,320.86GOODBYE GRAFFITI SURREY 106,720.31GORANSON CONSTRUCTION LTD. 357,150.96GRAFFITI BE GONE INC. 106,078.78GRAHAM DESIGN BUILDERS LP(BYITS GENERAL PARTNER GRAHAM 195,477.15GRAHAM DESIGN BUILDERS, A JV 1,558,458.39GRAHAM INFRASTRUCTURE A JV 2,021,149.41GRANDVIEW BLACKTOP LTD. 475,521.85GREAT CANADIAN CASINOS INC. 37,996.57GREATER VANCOUVER REGIONALDISTRICT 4,279,553.04GREATER VANCOUVER SEWERAGEAND DRAINAGE DISTRICT 5,904,844.45GREATER VANCOUVER WATERDISTRICT 29,759,677.14GREEN OVER GREY LIVING WALLSAND DESIGN INC. 54,635.84GREEN TIMBERS HERITAGESOCIETY 159,735.00GREER SPRAY FOAM LTD. 48,664.00GREGG DISTRIBUTORS (B.C.) LTD. 37,650.22GROUND FORCE EXCAVATION LTD. 35,378.91H.Y. ENGINEERING LTD. 94,797.25HABITAT SYSTEMS INC. 70,642.38HALCROW CONSULTING INC. 162,142.40HALTON RECYCLING LTD, DBAEMTERRA GROUP & EMTERRA ENVIRO 12,072,850.87HANLEY AGENCIES LTD. 408,656.84HARLAN FAIRBANKS CO. LTD. 30,109.51HARRIS CANADA SYSTEMS, INC. 36,595.81HARRY WALKER AGENCY 102,453.67HATCH MOTT MACDONALD LTD 77,086.84HATFIELD CONSULTANTS 113,141.19HAZCO ENVIRONMENTAL SERVICES,A DIV OF CCS CORPORATION 36,786.12HAZICO HOLDINGS 26,523.68HAZMASTERS INC. 30,279.50HB LANARC CONSULTANTS LTD. 152,000.32HEARD CONSULTING SERVICES INC. 54,321.40HEMMERA ENVIROCHEM INC. 60,065.01HERITAGE OFFICE FURNISHINGSLTD. 59,694.99HI PRO SPORTING GOODS 26,363.73HOOKER CRAIG LUM GARNETTREAL ESTATE ADVISORS LTD. 165,883.28HORIZON LANDSCAPE CONTRACTORSINC. 1,143,860.87HRC CONSTRUCTION INC. 5,352,337.87
Page 7
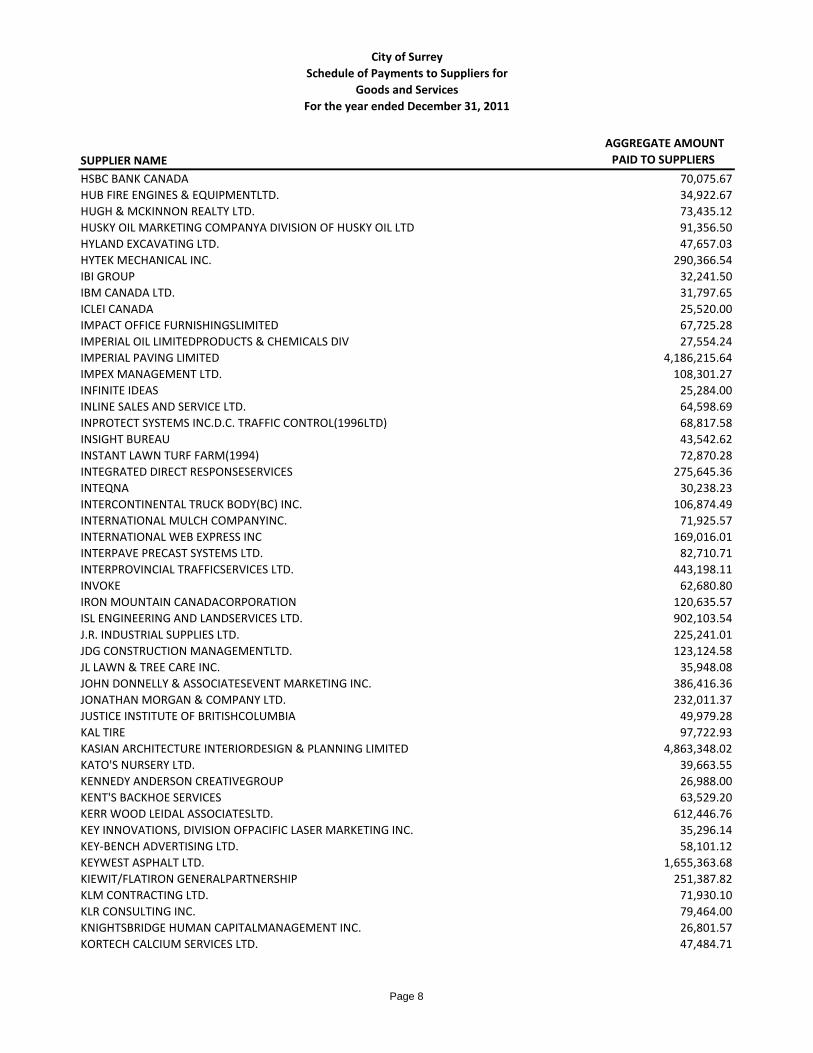
City of SurreySchedule of Payments to Suppliers for
Goods and ServicesFor the year ended December 31, 2011
SUPPLIER NAME AGGREGATE AMOUNT PAID TO SUPPLIERS
HSBC BANK CANADA 70,075.67HUB FIRE ENGINES & EQUIPMENTLTD. 34,922.67HUGH & MCKINNON REALTY LTD. 73,435.12HUSKY OIL MARKETING COMPANYA DIVISION OF HUSKY OIL LTD 91,356.50HYLAND EXCAVATING LTD. 47,657.03HYTEK MECHANICAL INC. 290,366.54IBI GROUP 32,241.50IBM CANADA LTD. 31,797.65ICLEI CANADA 25,520.00IMPACT OFFICE FURNISHINGSLIMITED 67,725.28IMPERIAL OIL LIMITEDPRODUCTS & CHEMICALS DIV 27,554.24IMPERIAL PAVING LIMITED 4,186,215.64IMPEX MANAGEMENT LTD. 108,301.27INFINITE IDEAS 25,284.00INLINE SALES AND SERVICE LTD. 64,598.69INPROTECT SYSTEMS INC.D.C. TRAFFIC CONTROL(1996LTD) 68,817.58INSIGHT BUREAU 43,542.62INSTANT LAWN TURF FARM(1994) 72,870.28INTEGRATED DIRECT RESPONSESERVICES 275,645.36INTEQNA 30,238.23INTERCONTINENTAL TRUCK BODY(BC) INC. 106,874.49INTERNATIONAL MULCH COMPANYINC. 71,925.57INTERNATIONAL WEB EXPRESS INC 169,016.01INTERPAVE PRECAST SYSTEMS LTD. 82,710.71INTERPROVINCIAL TRAFFICSERVICES LTD. 443,198.11INVOKE 62,680.80IRON MOUNTAIN CANADACORPORATION 120,635.57ISL ENGINEERING AND LANDSERVICES LTD. 902,103.54J.R. INDUSTRIAL SUPPLIES LTD. 225,241.01JDG CONSTRUCTION MANAGEMENTLTD. 123,124.58JL LAWN & TREE CARE INC. 35,948.08JOHN DONNELLY & ASSOCIATESEVENT MARKETING INC. 386,416.36JONATHAN MORGAN & COMPANY LTD. 232,011.37JUSTICE INSTITUTE OF BRITISHCOLUMBIA 49,979.28KAL TIRE 97,722.93KASIAN ARCHITECTURE INTERIORDESIGN & PLANNING LIMITED 4,863,348.02KATO'S NURSERY LTD. 39,663.55KENNEDY ANDERSON CREATIVEGROUP 26,988.00KENT'S BACKHOE SERVICES 63,529.20KERR WOOD LEIDAL ASSOCIATESLTD. 612,446.76KEY INNOVATIONS, DIVISION OFPACIFIC LASER MARKETING INC. 35,296.14KEY‐BENCH ADVERTISING LTD. 58,101.12KEYWEST ASPHALT LTD. 1,655,363.68KIEWIT/FLATIRON GENERALPARTNERSHIP 251,387.82KLM CONTRACTING LTD. 71,930.10KLR CONSULTING INC. 79,464.00KNIGHTSBRIDGE HUMAN CAPITALMANAGEMENT INC. 26,801.57KORTECH CALCIUM SERVICES LTD. 47,484.71
Page 8
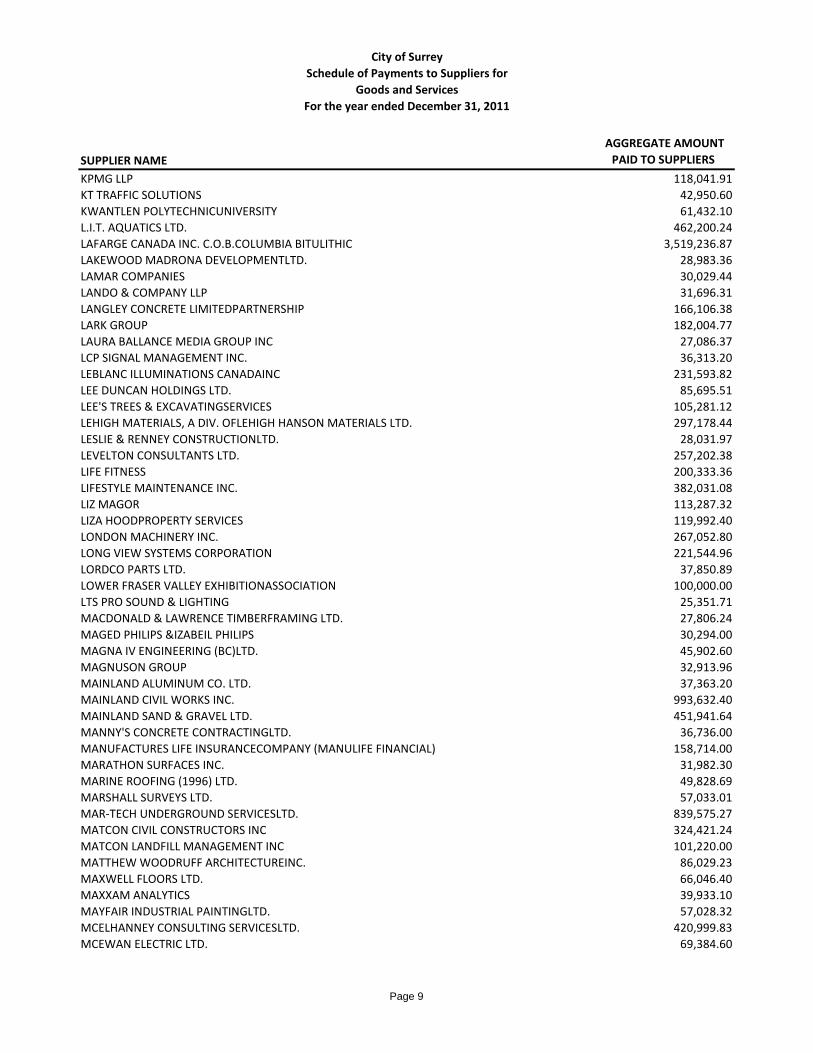
City of SurreySchedule of Payments to Suppliers for
Goods and ServicesFor the year ended December 31, 2011
SUPPLIER NAME AGGREGATE AMOUNT PAID TO SUPPLIERS
KPMG LLP 118,041.91KT TRAFFIC SOLUTIONS 42,950.60KWANTLEN POLYTECHNICUNIVERSITY 61,432.10L.I.T. AQUATICS LTD. 462,200.24LAFARGE CANADA INC. C.O.B.COLUMBIA BITULITHIC 3,519,236.87LAKEWOOD MADRONA DEVELOPMENTLTD. 28,983.36LAMAR COMPANIES 30,029.44LANDO & COMPANY LLP 31,696.31LANGLEY CONCRETE LIMITEDPARTNERSHIP 166,106.38LARK GROUP 182,004.77LAURA BALLANCE MEDIA GROUP INC 27,086.37LCP SIGNAL MANAGEMENT INC. 36,313.20LEBLANC ILLUMINATIONS CANADAINC 231,593.82LEE DUNCAN HOLDINGS LTD. 85,695.51LEE'S TREES & EXCAVATINGSERVICES 105,281.12LEHIGH MATERIALS, A DIV. OFLEHIGH HANSON MATERIALS LTD. 297,178.44LESLIE & RENNEY CONSTRUCTIONLTD. 28,031.97LEVELTON CONSULTANTS LTD. 257,202.38LIFE FITNESS 200,333.36LIFESTYLE MAINTENANCE INC. 382,031.08LIZ MAGOR 113,287.32LIZA HOODPROPERTY SERVICES 119,992.40LONDON MACHINERY INC. 267,052.80LONG VIEW SYSTEMS CORPORATION 221,544.96LORDCO PARTS LTD. 37,850.89LOWER FRASER VALLEY EXHIBITIONASSOCIATION 100,000.00LTS PRO SOUND & LIGHTING 25,351.71MACDONALD & LAWRENCE TIMBERFRAMING LTD. 27,806.24MAGED PHILIPS &IZABEIL PHILIPS 30,294.00MAGNA IV ENGINEERING (BC)LTD. 45,902.60MAGNUSON GROUP 32,913.96MAINLAND ALUMINUM CO. LTD. 37,363.20MAINLAND CIVIL WORKS INC. 993,632.40MAINLAND SAND & GRAVEL LTD. 451,941.64MANNY'S CONCRETE CONTRACTINGLTD. 36,736.00MANUFACTURES LIFE INSURANCECOMPANY (MANULIFE FINANCIAL) 158,714.00MARATHON SURFACES INC. 31,982.30MARINE ROOFING (1996) LTD. 49,828.69MARSHALL SURVEYS LTD. 57,033.01MAR‐TECH UNDERGROUND SERVICESLTD. 839,575.27MATCON CIVIL CONSTRUCTORS INC 324,421.24MATCON LANDFILL MANAGEMENT INC 101,220.00MATTHEW WOODRUFF ARCHITECTUREINC. 86,029.23MAXWELL FLOORS LTD. 66,046.40MAXXAM ANALYTICS 39,933.10MAYFAIR INDUSTRIAL PAINTINGLTD. 57,028.32MCELHANNEY CONSULTING SERVICESLTD. 420,999.83MCEWAN ELECTRIC LTD. 69,384.60
Page 9
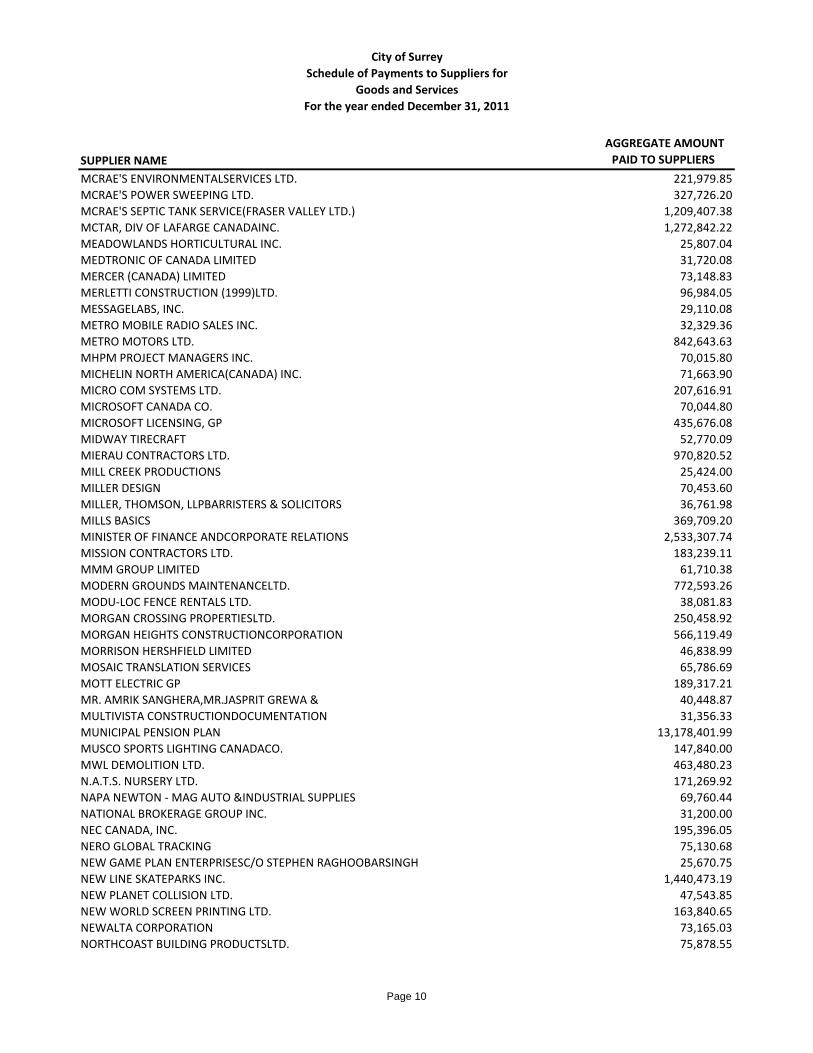
City of SurreySchedule of Payments to Suppliers for
Goods and ServicesFor the year ended December 31, 2011
SUPPLIER NAME AGGREGATE AMOUNT PAID TO SUPPLIERS
MCRAE'S ENVIRONMENTALSERVICES LTD. 221,979.85MCRAE'S POWER SWEEPING LTD. 327,726.20MCRAE'S SEPTIC TANK SERVICE(FRASER VALLEY LTD.) 1,209,407.38MCTAR, DIV OF LAFARGE CANADAINC. 1,272,842.22MEADOWLANDS HORTICULTURAL INC. 25,807.04MEDTRONIC OF CANADA LIMITED 31,720.08MERCER (CANADA) LIMITED 73,148.83MERLETTI CONSTRUCTION (1999)LTD. 96,984.05MESSAGELABS, INC. 29,110.08METRO MOBILE RADIO SALES INC. 32,329.36METRO MOTORS LTD. 842,643.63MHPM PROJECT MANAGERS INC. 70,015.80MICHELIN NORTH AMERICA(CANADA) INC. 71,663.90MICRO COM SYSTEMS LTD. 207,616.91MICROSOFT CANADA CO. 70,044.80MICROSOFT LICENSING, GP 435,676.08MIDWAY TIRECRAFT 52,770.09MIERAU CONTRACTORS LTD. 970,820.52MILL CREEK PRODUCTIONS 25,424.00MILLER DESIGN 70,453.60MILLER, THOMSON, LLPBARRISTERS & SOLICITORS 36,761.98MILLS BASICS 369,709.20MINISTER OF FINANCE ANDCORPORATE RELATIONS 2,533,307.74MISSION CONTRACTORS LTD. 183,239.11MMM GROUP LIMITED 61,710.38MODERN GROUNDS MAINTENANCELTD. 772,593.26MODU‐LOC FENCE RENTALS LTD. 38,081.83MORGAN CROSSING PROPERTIESLTD. 250,458.92MORGAN HEIGHTS CONSTRUCTIONCORPORATION 566,119.49MORRISON HERSHFIELD LIMITED 46,838.99MOSAIC TRANSLATION SERVICES 65,786.69MOTT ELECTRIC GP 189,317.21MR. AMRIK SANGHERA,MR.JASPRIT GREWA & 40,448.87MULTIVISTA CONSTRUCTIONDOCUMENTATION 31,356.33MUNICIPAL PENSION PLAN 13,178,401.99MUSCO SPORTS LIGHTING CANADACO. 147,840.00MWL DEMOLITION LTD. 463,480.23N.A.T.S. NURSERY LTD. 171,269.92NAPA NEWTON ‐ MAG AUTO &INDUSTRIAL SUPPLIES 69,760.44NATIONAL BROKERAGE GROUP INC. 31,200.00NEC CANADA, INC. 195,396.05NERO GLOBAL TRACKING 75,130.68NEW GAME PLAN ENTERPRISESC/O STEPHEN RAGHOOBARSINGH 25,670.75NEW LINE SKATEPARKS INC. 1,440,473.19NEW PLANET COLLISION LTD. 47,543.85NEW WORLD SCREEN PRINTING LTD. 163,840.65NEWALTA CORPORATION 73,165.03NORTHCOAST BUILDING PRODUCTSLTD. 75,878.55
Page 10

City of SurreySchedule of Payments to Suppliers for
Goods and ServicesFor the year ended December 31, 2011
SUPPLIER NAME AGGREGATE AMOUNT PAID TO SUPPLIERS
NORTHWEST GARDENING SERVICESLTD. 55,258.76NOVACOM CONSTRUCTION LTD. 252,261.71NOW‐USE GLACIER 1‐30568 218,769.72OCEAN MARKER SPORT SURFACESLTD. 224,700.59OFFICE ESSENTIALS 51,886.00OMEGA & ASSOCIATESENGINEERING LTD. 368,297.24OMNI ENGINEERING INC. 523,231.95OMNI FACILITY SERVICES CANADALIMITED 63,268.68OPEN TEXT CORPORATION 180,256.14ORACLE CANADA ULC 297,959.90ORBIS CANADA LIMITED B9128 222,835.20ORION FIRE DISTRIBUTION LTD. 64,778.56OVERHEAD DOOR COMPANYDIV. OF STORDOR INVESTMENTS LT 52,933.48OXFORD PAINTING LTD. 43,663.76PACIFIC BARK BLOWERS INC. 43,560.16PACIFIC COAST HEAVY TRUCKGROUP 97,733.64PACIFIC CONTROLS LTD. 25,115.72PACIFIC FLOW CONTROL LTD. 120,122.24PACIFIC LAND RESOURCE GROUPINC. 76,815.65PACIFIC NEWSPAPER GROUP, A DIVOF POSTMEDIA NETWORK INC. 25,198.44PACIFIC NORTHWEST FIREPROTECTION INC. 166,160.29PACIFIC SURREY CONSTRUCTIONLTD. 404,149.14PADDA ENTERPRISES LTD. 51,689.25PALADIN SECURITY GROUP LTD. 289,443.00PALADIN SECURITY SYSTEMS LTD, 56,172.93PANARAMA TECHNOLOGIES LTD. 209,836.27PARAGON ENGINEERING LTD. 519,624.50PARK PLACE TOWERS LIMITEDPARTNERSHIP& PARK PLACE TOWERS 123,639.18PARKLAND INDUSTRIES LP 175,972.04PARSONS BRINCKERHOFF HALSALLINC. 112,098.68PARTNERSHIPS BRITISH COLUMBIA 257,956.28PATTISON OUTDOOR ADVERTISINGL.P. 92,929.76PAX CONSTRUCTION LTD. 3,739,430.80PCL CONSTRUCTORS WESTCOAST INC 9,964,451.38PEDRE CONTRACTORS LTD. 2,784,781.64PEEL'S NURSERIES LTD. 76,471.92PEOPLE POWER PRODUCTIONS INC 30,968.00PERFORMANCE ELECTRIC LTD. 102,559.41PERFORMANCE VISUAL WORKS INC 85,769.04PETER CLAIR 37,090.85PHOENIX TENT AND EVENT RENTALS 106,885.07PICTOMETRY CANADA CORP. 56,000.00PIEDMONT SHEET METAL(1997) LTD. 32,567.37PIROCHE PLANTS INC. 87,957.46PITNEYWORKS 413,005.24PIVOTAL PROJECTS INCORPORATED 504,392.92PJS SYSTEMS INC. 26,271.57PLEA COMMUNITY SERVICESSOCIETY OF BC 38,760.00
Page 11

City of SurreySchedule of Payments to Suppliers for
Goods and ServicesFor the year ended December 31, 2011
SUPPLIER NAME AGGREGATE AMOUNT PAID TO SUPPLIERS
PNR RAILWORKS INC. 47,329.80POLYGON DEVELOPMENTS 194LTD. 72,910.82POSTAGE BY PHONE 80,250.00PRAIRIECOAST EQUIPMENT 99,802.60PRECISION FIBRE STRUCTURESINC. 29,980.27PREMIER PACIFIC SEEDS LTD. 36,956.59PRINTHINK SOLUTIONS INC 181,054.40PRO QUALITY LOCKSMITH CO. 59,156.14PROCON ENGINEERING 30,615.54PROFIRE EMERGENCY EQUIPMENTINC. 68,619.30PROMAX AUDIO VISUALSYSTEMS INC 70,374.51PROPER LANDSCAPING INC. 200,735.10PROSCENIUM ARCHITECTURE &INTERIORS INC. 42,138.02PW TRENCHLESS CONSTRUCTIONINC. 398,475.98QUADRI PROPERTIES LTD. 714,645.94R. AND L. BIO‐PEST CONTROLLTD. 38,216.64R.F. BINNIE & ASSOCIATES LTD. 2,412,944.00RAE ENGINEERING AND INSPECTIONLTD. 30,996.36RAINBOW PAVING LTD. 236,801.60RAINCOAST APPLIEDECOLOGY 62,474.07RANDSTAD TECHNOLOGIES, ADIV OF RANDSTAD INTERIM INC 134,579.20RAYBERN ERECTORS LTD. 99,651.27RAYLEC POWER LTD 66,696.00RECEIVER GENERAL FOR CANADA 77,299,236.41RECTEC INDUSTRIES INC. 712,785.64REIMERS NURSERIES LTD. 25,893.28REMPEL ST. ANDREWSDEVELOPMENT LTD. 74,063.48RETHINK COMMUNICATIONS INC. 32,760.00RICHARDSON SPORT INC. 46,727.00RICOH CANADA INC 78,098.62RISKWIDE CONSULTING INC 40,953.70RJS PAINTING & WALLCOVERINGLIMITED 34,015.40RMC READY‐MIX LTD. 123,379.25ROADWAY TRAFFIC PRODUCTS LTD. 213,494.40ROCK MECHANICAL INC. 47,809.83ROCKSTONE HOMES LTD & HILLTONHOMES LTD. 233,236.80ROCKY MOUNTAIN PHOENIX 252,104.32ROLLINS MACHINERY LIMITED 53,500.59RONA HOME CENTRES 28,981.62RONA REVY INC. 46,579.61ROOF TECH 2000 CONSULTANTS LTD 59,404.29ROPER GREYELL LLP 239,095.03ROYAL PRINTERS LTD. 27,169.41S S MANN ENTERPRISES 48,122.00S.I. SYSTEMS LTD. 231,895.16S.L. FELDMAN & ASSOCIATES 31,000.00S‐304 HOLDINGS LTD. DBA JONKERNISSAN 48,389.60SAFE GUARD FENCE LTD. 109,689.84
Page 12
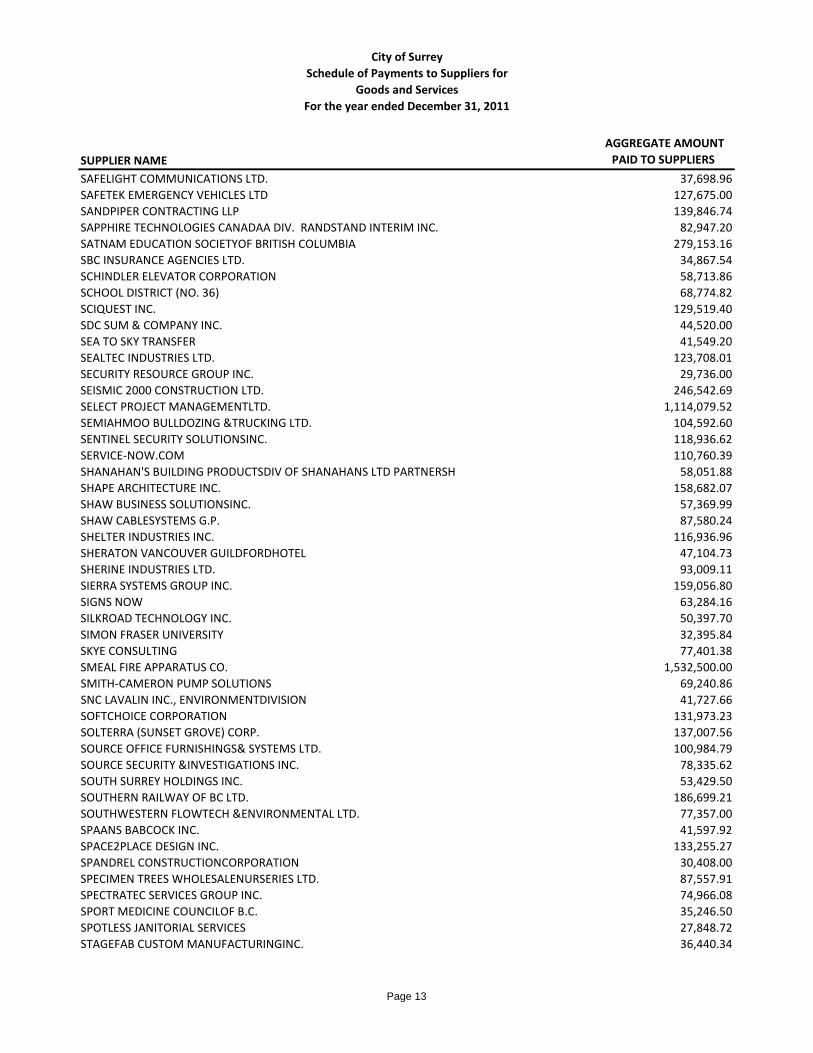
City of SurreySchedule of Payments to Suppliers for
Goods and ServicesFor the year ended December 31, 2011
SUPPLIER NAME AGGREGATE AMOUNT PAID TO SUPPLIERS
SAFELIGHT COMMUNICATIONS LTD. 37,698.96SAFETEK EMERGENCY VEHICLES LTD 127,675.00SANDPIPER CONTRACTING LLP 139,846.74SAPPHIRE TECHNOLOGIES CANADAA DIV. RANDSTAND INTERIM INC. 82,947.20SATNAM EDUCATION SOCIETYOF BRITISH COLUMBIA 279,153.16SBC INSURANCE AGENCIES LTD. 34,867.54SCHINDLER ELEVATOR CORPORATION 58,713.86SCHOOL DISTRICT (NO. 36) 68,774.82SCIQUEST INC. 129,519.40SDC SUM & COMPANY INC. 44,520.00SEA TO SKY TRANSFER 41,549.20SEALTEC INDUSTRIES LTD. 123,708.01SECURITY RESOURCE GROUP INC. 29,736.00SEISMIC 2000 CONSTRUCTION LTD. 246,542.69SELECT PROJECT MANAGEMENTLTD. 1,114,079.52SEMIAHMOO BULLDOZING &TRUCKING LTD. 104,592.60SENTINEL SECURITY SOLUTIONSINC. 118,936.62SERVICE‐NOW.COM 110,760.39SHANAHAN'S BUILDING PRODUCTSDIV OF SHANAHANS LTD PARTNERSH 58,051.88SHAPE ARCHITECTURE INC. 158,682.07SHAW BUSINESS SOLUTIONSINC. 57,369.99SHAW CABLESYSTEMS G.P. 87,580.24SHELTER INDUSTRIES INC. 116,936.96SHERATON VANCOUVER GUILDFORDHOTEL 47,104.73SHERINE INDUSTRIES LTD. 93,009.11SIERRA SYSTEMS GROUP INC. 159,056.80SIGNS NOW 63,284.16SILKROAD TECHNOLOGY INC. 50,397.70SIMON FRASER UNIVERSITY 32,395.84SKYE CONSULTING 77,401.38SMEAL FIRE APPARATUS CO. 1,532,500.00SMITH‐CAMERON PUMP SOLUTIONS 69,240.86SNC LAVALIN INC., ENVIRONMENTDIVISION 41,727.66SOFTCHOICE CORPORATION 131,973.23SOLTERRA (SUNSET GROVE) CORP. 137,007.56SOURCE OFFICE FURNISHINGS& SYSTEMS LTD. 100,984.79SOURCE SECURITY &INVESTIGATIONS INC. 78,335.62SOUTH SURREY HOLDINGS INC. 53,429.50SOUTHERN RAILWAY OF BC LTD. 186,699.21SOUTHWESTERN FLOWTECH &ENVIRONMENTAL LTD. 77,357.00SPAANS BABCOCK INC. 41,597.92SPACE2PLACE DESIGN INC. 133,255.27SPANDREL CONSTRUCTIONCORPORATION 30,408.00SPECIMEN TREES WHOLESALENURSERIES LTD. 87,557.91SPECTRATEC SERVICES GROUP INC. 74,966.08SPORT MEDICINE COUNCILOF B.C. 35,246.50SPOTLESS JANITORIAL SERVICES 27,848.72STAGEFAB CUSTOM MANUFACTURINGINC. 36,440.34
Page 13
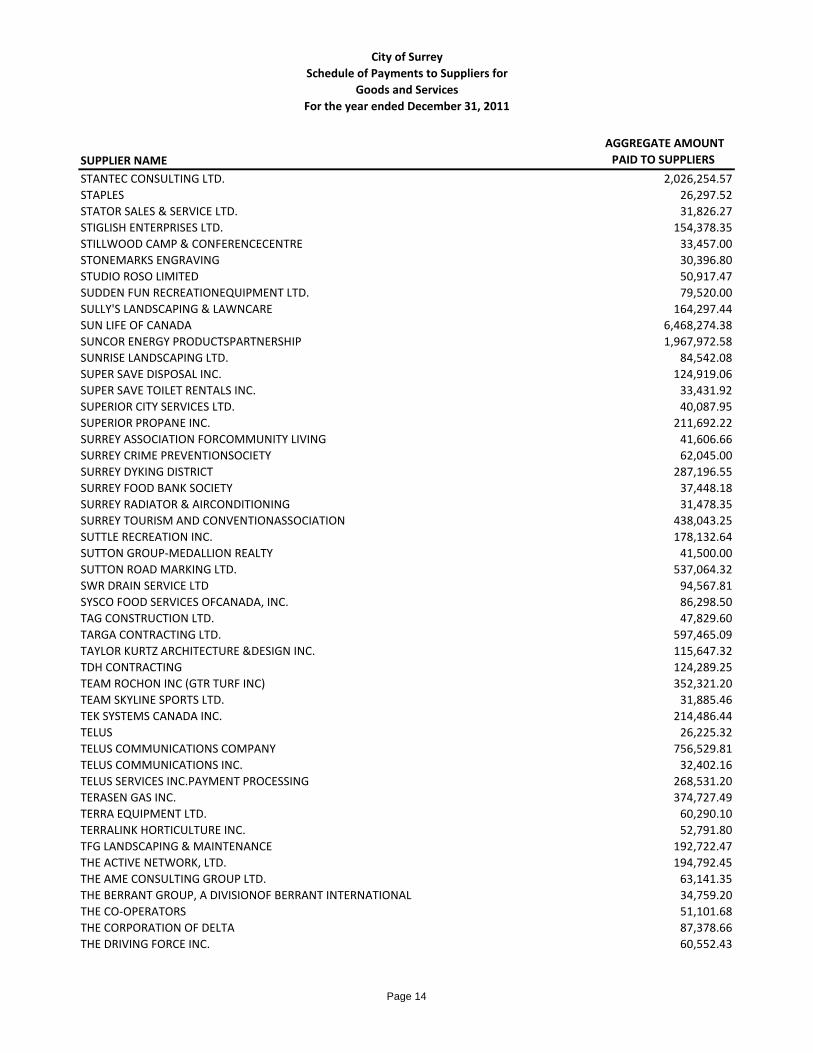
City of SurreySchedule of Payments to Suppliers for
Goods and ServicesFor the year ended December 31, 2011
SUPPLIER NAME AGGREGATE AMOUNT PAID TO SUPPLIERS
STANTEC CONSULTING LTD. 2,026,254.57STAPLES 26,297.52STATOR SALES & SERVICE LTD. 31,826.27STIGLISH ENTERPRISES LTD. 154,378.35STILLWOOD CAMP & CONFERENCECENTRE 33,457.00STONEMARKS ENGRAVING 30,396.80STUDIO ROSO LIMITED 50,917.47SUDDEN FUN RECREATIONEQUIPMENT LTD. 79,520.00SULLY'S LANDSCAPING & LAWNCARE 164,297.44SUN LIFE OF CANADA 6,468,274.38SUNCOR ENERGY PRODUCTSPARTNERSHIP 1,967,972.58SUNRISE LANDSCAPING LTD. 84,542.08SUPER SAVE DISPOSAL INC. 124,919.06SUPER SAVE TOILET RENTALS INC. 33,431.92SUPERIOR CITY SERVICES LTD. 40,087.95SUPERIOR PROPANE INC. 211,692.22SURREY ASSOCIATION FORCOMMUNITY LIVING 41,606.66SURREY CRIME PREVENTIONSOCIETY 62,045.00SURREY DYKING DISTRICT 287,196.55SURREY FOOD BANK SOCIETY 37,448.18SURREY RADIATOR & AIRCONDITIONING 31,478.35SURREY TOURISM AND CONVENTIONASSOCIATION 438,043.25SUTTLE RECREATION INC. 178,132.64SUTTON GROUP‐MEDALLION REALTY 41,500.00SUTTON ROAD MARKING LTD. 537,064.32SWR DRAIN SERVICE LTD 94,567.81SYSCO FOOD SERVICES OFCANADA, INC. 86,298.50TAG CONSTRUCTION LTD. 47,829.60TARGA CONTRACTING LTD. 597,465.09TAYLOR KURTZ ARCHITECTURE &DESIGN INC. 115,647.32TDH CONTRACTING 124,289.25TEAM ROCHON INC (GTR TURF INC) 352,321.20TEAM SKYLINE SPORTS LTD. 31,885.46TEK SYSTEMS CANADA INC. 214,486.44TELUS 26,225.32TELUS COMMUNICATIONS COMPANY 756,529.81TELUS COMMUNICATIONS INC. 32,402.16TELUS SERVICES INC.PAYMENT PROCESSING 268,531.20TERASEN GAS INC. 374,727.49TERRA EQUIPMENT LTD. 60,290.10TERRALINK HORTICULTURE INC. 52,791.80TFG LANDSCAPING & MAINTENANCE 192,722.47THE ACTIVE NETWORK, LTD. 194,792.45THE AME CONSULTING GROUP LTD. 63,141.35THE BERRANT GROUP, A DIVISIONOF BERRANT INTERNATIONAL 34,759.20THE CO‐OPERATORS 51,101.68THE CORPORATION OF DELTA 87,378.66THE DRIVING FORCE INC. 60,552.43
Page 14
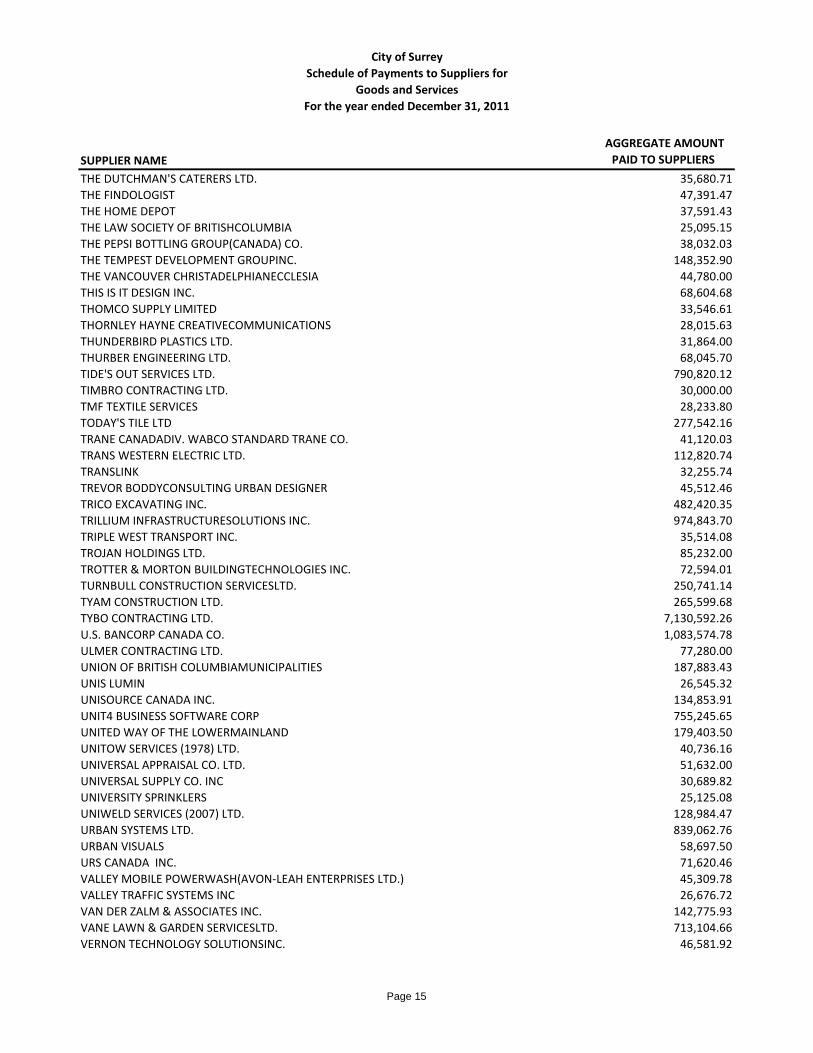
City of SurreySchedule of Payments to Suppliers for
Goods and ServicesFor the year ended December 31, 2011
SUPPLIER NAME AGGREGATE AMOUNT PAID TO SUPPLIERS
THE DUTCHMAN'S CATERERS LTD. 35,680.71THE FINDOLOGIST 47,391.47THE HOME DEPOT 37,591.43THE LAW SOCIETY OF BRITISHCOLUMBIA 25,095.15THE PEPSI BOTTLING GROUP(CANADA) CO. 38,032.03THE TEMPEST DEVELOPMENT GROUPINC. 148,352.90THE VANCOUVER CHRISTADELPHIANECCLESIA 44,780.00THIS IS IT DESIGN INC. 68,604.68THOMCO SUPPLY LIMITED 33,546.61THORNLEY HAYNE CREATIVECOMMUNICATIONS 28,015.63THUNDERBIRD PLASTICS LTD. 31,864.00THURBER ENGINEERING LTD. 68,045.70TIDE'S OUT SERVICES LTD. 790,820.12TIMBRO CONTRACTING LTD. 30,000.00TMF TEXTILE SERVICES 28,233.80TODAY'S TILE LTD 277,542.16TRANE CANADADIV. WABCO STANDARD TRANE CO. 41,120.03TRANS WESTERN ELECTRIC LTD. 112,820.74TRANSLINK 32,255.74TREVOR BODDYCONSULTING URBAN DESIGNER 45,512.46TRICO EXCAVATING INC. 482,420.35TRILLIUM INFRASTRUCTURESOLUTIONS INC. 974,843.70TRIPLE WEST TRANSPORT INC. 35,514.08TROJAN HOLDINGS LTD. 85,232.00TROTTER & MORTON BUILDINGTECHNOLOGIES INC. 72,594.01TURNBULL CONSTRUCTION SERVICESLTD. 250,741.14TYAM CONSTRUCTION LTD. 265,599.68TYBO CONTRACTING LTD. 7,130,592.26U.S. BANCORP CANADA CO. 1,083,574.78ULMER CONTRACTING LTD. 77,280.00UNION OF BRITISH COLUMBIAMUNICIPALITIES 187,883.43UNIS LUMIN 26,545.32UNISOURCE CANADA INC. 134,853.91UNIT4 BUSINESS SOFTWARE CORP 755,245.65UNITED WAY OF THE LOWERMAINLAND 179,403.50UNITOW SERVICES (1978) LTD. 40,736.16UNIVERSAL APPRAISAL CO. LTD. 51,632.00UNIVERSAL SUPPLY CO. INC 30,689.82UNIVERSITY SPRINKLERS 25,125.08UNIWELD SERVICES (2007) LTD. 128,984.47URBAN SYSTEMS LTD. 839,062.76URBAN VISUALS 58,697.50URS CANADA INC. 71,620.46VALLEY MOBILE POWERWASH(AVON‐LEAH ENTERPRISES LTD.) 45,309.78VALLEY TRAFFIC SYSTEMS INC 26,676.72VAN DER ZALM & ASSOCIATES INC. 142,775.93VANE LAWN & GARDEN SERVICESLTD. 713,104.66VERNON TECHNOLOGY SOLUTIONSINC. 46,581.92
Page 15
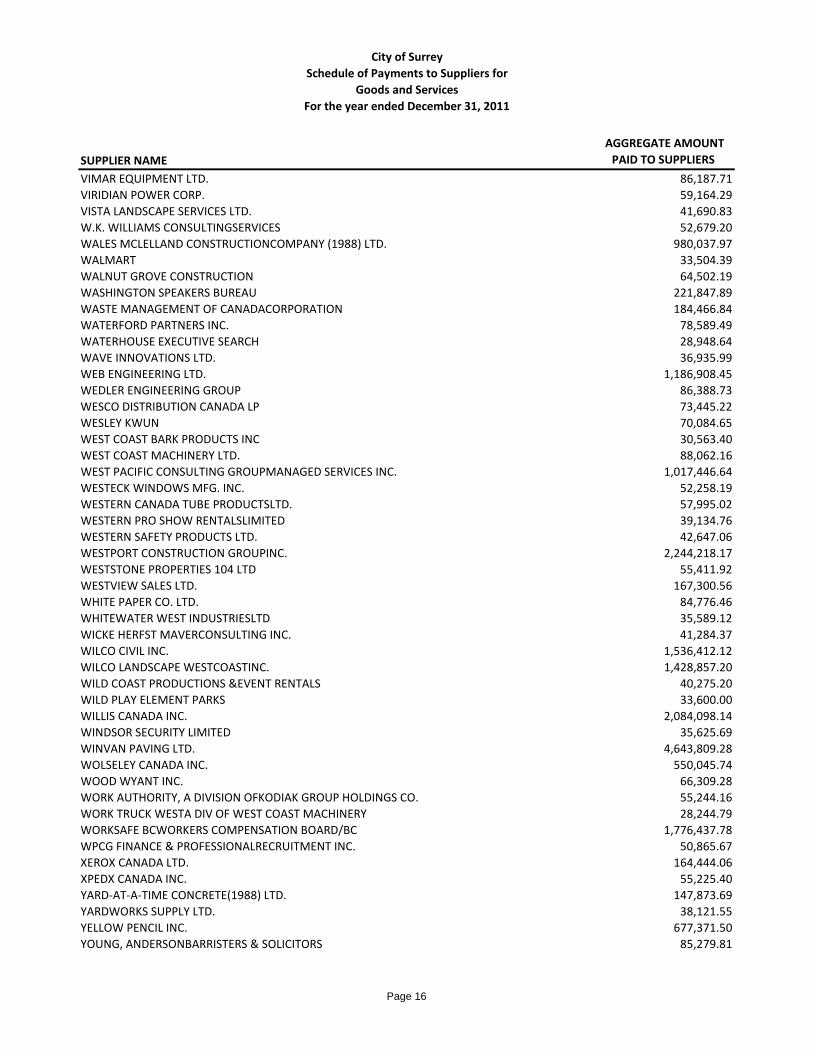
City of SurreySchedule of Payments to Suppliers for
Goods and ServicesFor the year ended December 31, 2011
SUPPLIER NAME AGGREGATE AMOUNT PAID TO SUPPLIERS
VIMAR EQUIPMENT LTD. 86,187.71VIRIDIAN POWER CORP. 59,164.29VISTA LANDSCAPE SERVICES LTD. 41,690.83W.K. WILLIAMS CONSULTINGSERVICES 52,679.20WALES MCLELLAND CONSTRUCTIONCOMPANY (1988) LTD. 980,037.97WALMART 33,504.39WALNUT GROVE CONSTRUCTION 64,502.19WASHINGTON SPEAKERS BUREAU 221,847.89WASTE MANAGEMENT OF CANADACORPORATION 184,466.84WATERFORD PARTNERS INC. 78,589.49WATERHOUSE EXECUTIVE SEARCH 28,948.64WAVE INNOVATIONS LTD. 36,935.99WEB ENGINEERING LTD. 1,186,908.45WEDLER ENGINEERING GROUP 86,388.73WESCO DISTRIBUTION CANADA LP 73,445.22WESLEY KWUN 70,084.65WEST COAST BARK PRODUCTS INC 30,563.40WEST COAST MACHINERY LTD. 88,062.16WEST PACIFIC CONSULTING GROUPMANAGED SERVICES INC. 1,017,446.64WESTECK WINDOWS MFG. INC. 52,258.19WESTERN CANADA TUBE PRODUCTSLTD. 57,995.02WESTERN PRO SHOW RENTALSLIMITED 39,134.76WESTERN SAFETY PRODUCTS LTD. 42,647.06WESTPORT CONSTRUCTION GROUPINC. 2,244,218.17WESTSTONE PROPERTIES 104 LTD 55,411.92WESTVIEW SALES LTD. 167,300.56WHITE PAPER CO. LTD. 84,776.46WHITEWATER WEST INDUSTRIESLTD 35,589.12WICKE HERFST MAVERCONSULTING INC. 41,284.37WILCO CIVIL INC. 1,536,412.12WILCO LANDSCAPE WESTCOASTINC. 1,428,857.20WILD COAST PRODUCTIONS &EVENT RENTALS 40,275.20WILD PLAY ELEMENT PARKS 33,600.00WILLIS CANADA INC. 2,084,098.14WINDSOR SECURITY LIMITED 35,625.69WINVAN PAVING LTD. 4,643,809.28WOLSELEY CANADA INC. 550,045.74WOOD WYANT INC. 66,309.28WORK AUTHORITY, A DIVISION OFKODIAK GROUP HOLDINGS CO. 55,244.16WORK TRUCK WESTA DIV OF WEST COAST MACHINERY 28,244.79WORKSAFE BCWORKERS COMPENSATION BOARD/BC 1,776,437.78WPCG FINANCE & PROFESSIONALRECRUITMENT INC. 50,865.67XEROX CANADA LTD. 164,444.06XPEDX CANADA INC. 55,225.40YARD‐AT‐A‐TIME CONCRETE(1988) LTD. 147,873.69YARDWORKS SUPPLY LTD. 38,121.55YELLOW PENCIL INC. 677,371.50YOUNG, ANDERSONBARRISTERS & SOLICITORS 85,279.81
Page 16
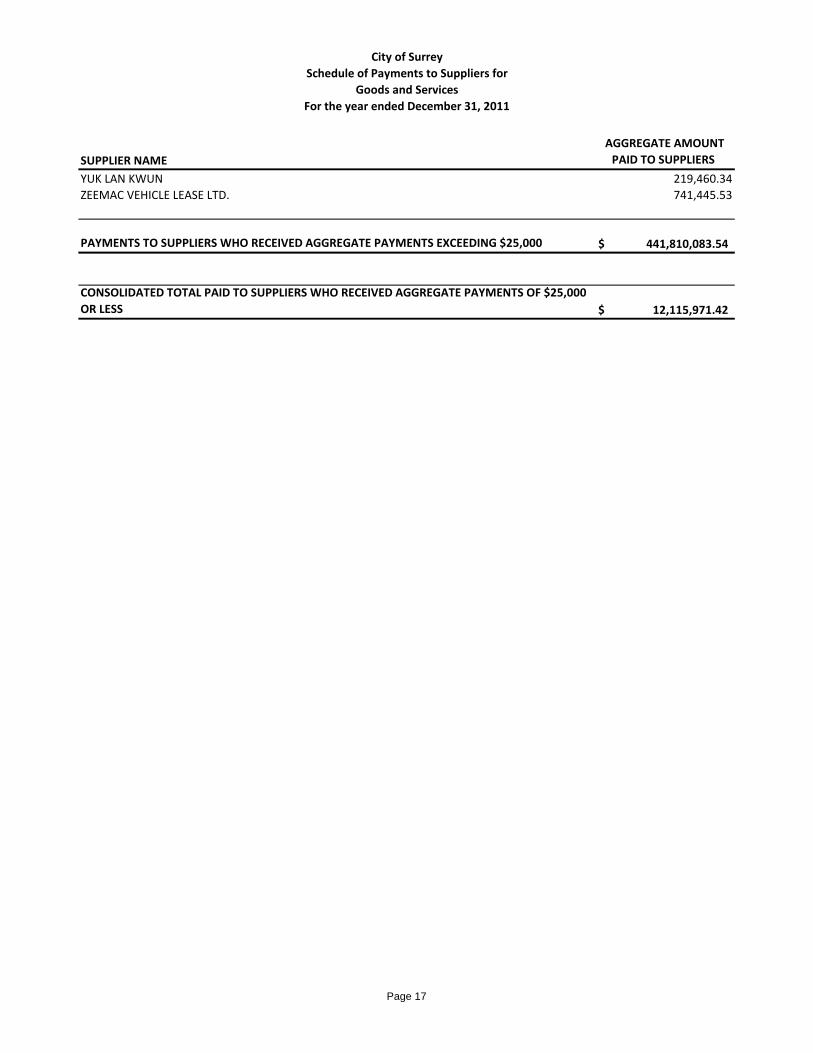
City of SurreySchedule of Payments to Suppliers for
Goods and ServicesFor the year ended December 31, 2011
SUPPLIER NAME AGGREGATE AMOUNT PAID TO SUPPLIERS
YUK LAN KWUN 219,460.34ZEEMAC VEHICLE LEASE LTD. 741,445.53
PAYMENTS TO SUPPLIERS WHO RECEIVED AGGREGATE PAYMENTS EXCEEDING $25,000 441,810,083.54$
CONSOLIDATED TOTAL PAID TO SUPPLIERS WHO RECEIVED AGGREGATE PAYMENTS OF $25,000 OR LESS 12,115,971.42$
Page 17
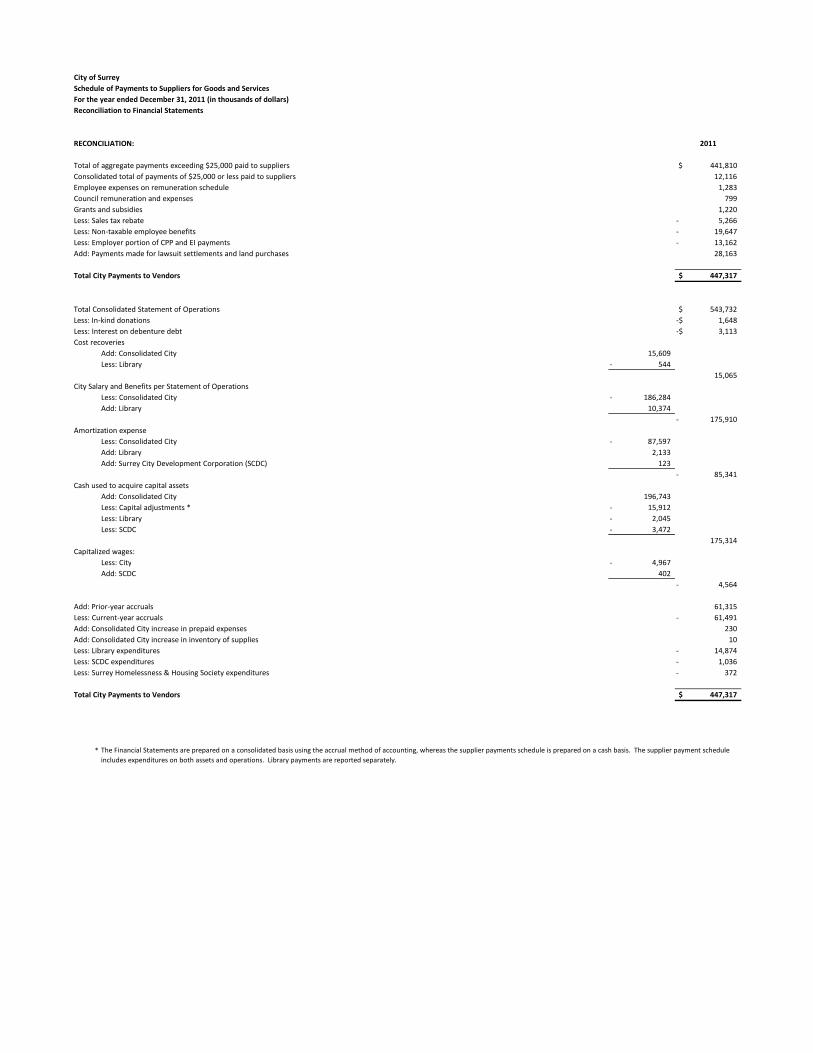
City of SurreySchedule of Payments to Suppliers for Goods and ServicesFor the year ended December 31, 2011 (in thousands of dollars)Reconciliation to Financial Statements
RECONCILIATION: 2011
Total of aggregate payments exceeding $25,000 paid to suppliers 441,810$ Consolidated total of payments of $25,000 or less paid to suppliers 12,116 Employee expenses on remuneration schedule 1,283 Council remuneration and expenses 799 Grants and subsidies 1,220 Less: Sales tax rebate 5,266‐ Less: Non‐taxable employee benefits 19,647‐ Less: Employer portion of CPP and EI payments 13,162‐ Add: Payments made for lawsuit settlements and land purchases 28,163
Total City Payments to Vendors 447,317$
Total Consolidated Statement of Operations 543,732$ Less: In‐kind donations 1,648‐$ Less: Interest on debenture debt 3,113‐$ Cost recoveries
Add: Consolidated City 15,609 Less: Library 544‐
15,065 City Salary and Benefits per Statement of Operations
Less: Consolidated City 186,284‐ Add: Library 10,374
175,910‐ Amortization expense
Less: Consolidated City 87,597‐ Add: Library 2,133 Add: Surrey City Development Corporation (SCDC) 123
85,341‐ Cash used to acquire capital assets
Add: Consolidated City 196,743 Less: Capital adjustments * 15,912‐ Less: Library 2,045‐ Less: SCDC 3,472‐
175,314 Capitalized wages:
Less: City 4 967‐Less: City 4,967‐ Add: SCDC 402
4,564‐
Add: Prior‐year accruals 61,315 Less: Current‐year accruals 61,491‐ Add: Consolidated City increase in prepaid expenses 230 Add: Consolidated City increase in inventory of supplies 10 Less: Library expenditures 14,874‐ Less: SCDC expenditures 1,036‐ Less: Surrey Homelessness & Housing Society expenditures 372‐
Total City Payments to Vendors 447,317$
* The Financial Statements are prepared on a consolidated basis using the accrual method of accounting, whereas the supplier payments schedule is prepared on a cash basis. The supplier payment schedule includes expenditures on both assets and operations. Library payments are reported separately.
City of Surrey Schedule of Grants Section 9
2011 Statement of Financial Information
Regulations require the City of Surrey to report a statement of payments for the purposes of grants or contributions. Prepared under the Financial Information Regulation, Schedule 1, subsection 7(2)(b)
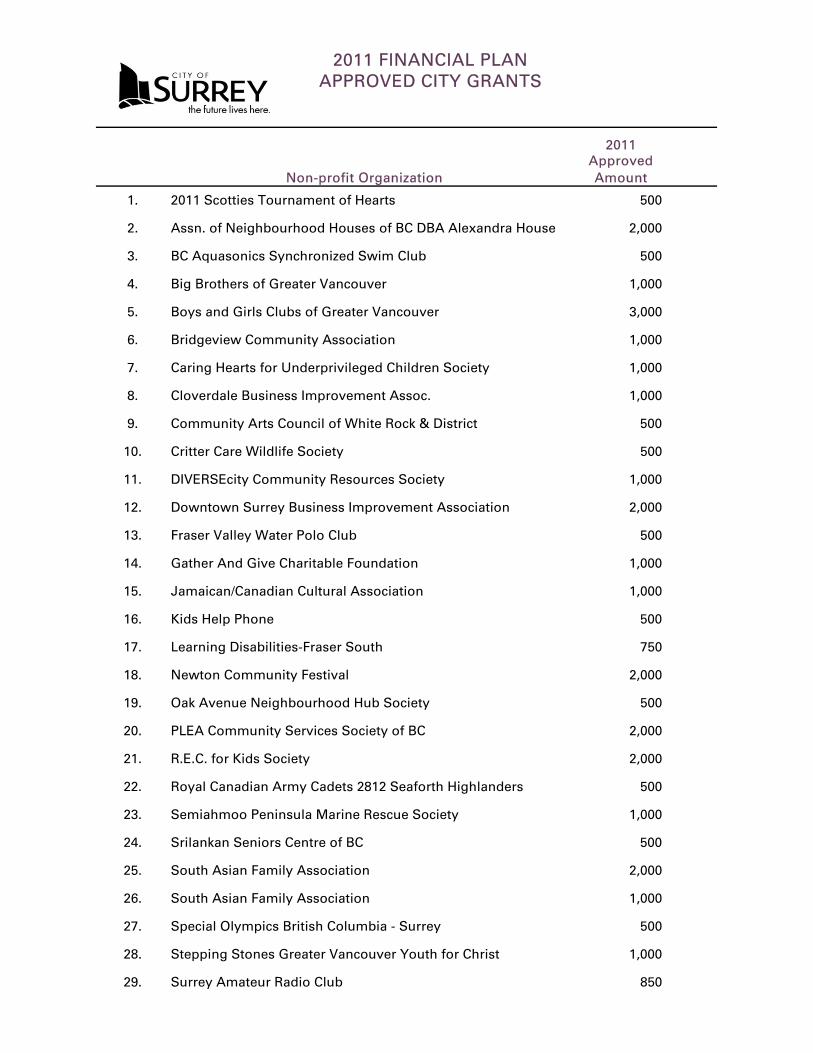
2011 FINANCIAL PLAN
APPROVED CITY GRANTS
2011
Non-profit Organization
Approved
Amount
1. 2011 Scotties Tournament of Hearts 500
2. Assn. of Neighbourhood Houses of BC DBA Alexandra House 2,000
3. BC Aquasonics Synchronized Swim Club 500
4. Big Brothers of Greater Vancouver 1,000
5. Boys and Girls Clubs of Greater Vancouver 3,000
6. Bridgeview Community Association 1,000
7. Caring Hearts for Underprivileged Children Society 1,000
8. Cloverdale Business Improvement Assoc. 1,000
9. Community Arts Council of White Rock & District 500
10. Critter Care Wildlife Society 500
11. DIVERSEcity Community Resources Society 1,000
12. Downtown Surrey Business Improvement Association 2,000
13. Fraser Valley Water Polo Club 500y
14. Gather And Give Charitable Foundation 1,000
15. Jamaican/Canadian Cultural Association 1,000
16. Kids Help Phone 500
17. Learning Disabilities-Fraser South 750
18. Newton Community Festival 2,000
19. Oak Avenue Neighbourhood Hub Society 500
20. PLEA Community Services Society of BC 2,000
21. R.E.C. for Kids Society 2,000
22. Royal Canadian Army Cadets 2812 Seaforth Highlanders 500
23. Semiahmoo Peninsula Marine Rescue Society 1,000
24. Srilankan Seniors Centre of BC 500
25. South Asian Family Association 2,000
26. South Asian Family Association 1,000
27. Special Olympics British Columbia - Surrey 500
28. Stepping Stones Greater Vancouver Youth for Christ 1,000
29. Surrey Amateur Radio Club 850
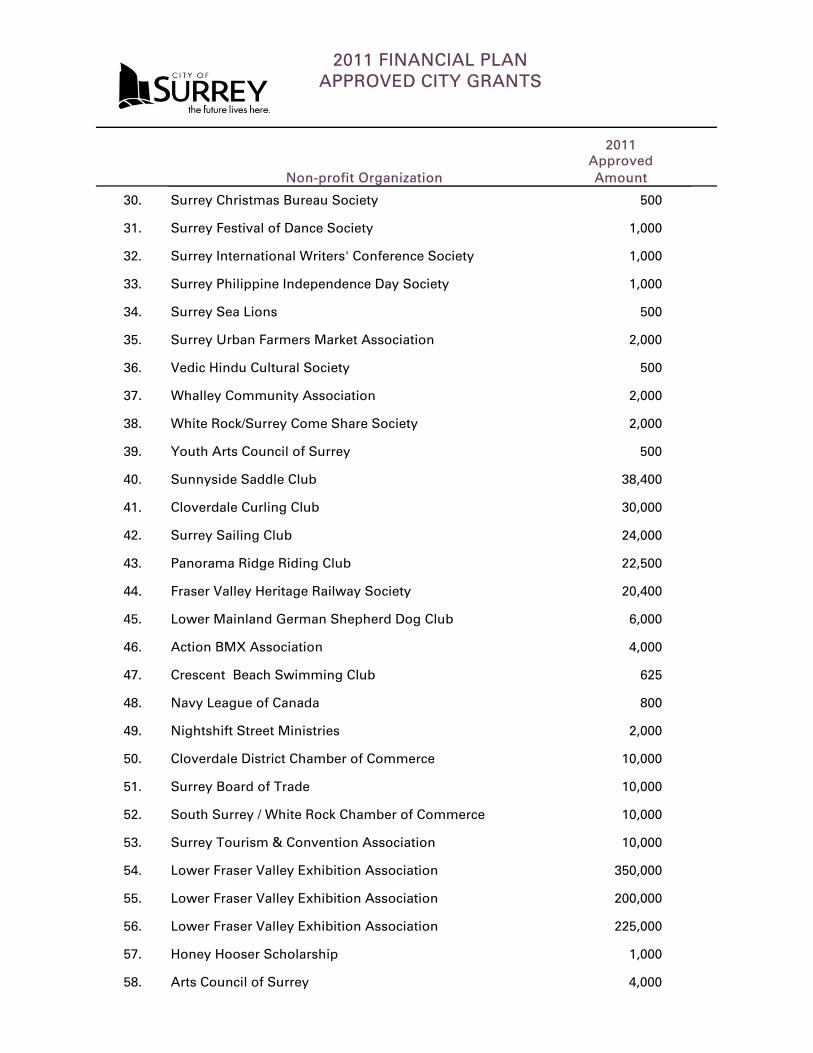
2011 FINANCIAL PLAN
APPROVED CITY GRANTS
2011
Non-profit Organization
Approved
Amount
30. Surrey Christmas Bureau Society 500
31. Surrey Festival of Dance Society 1,000
32. Surrey International Writers' Conference Society 1,000
33. Surrey Philippine Independence Day Society 1,000
34. Surrey Sea Lions 500
35. Surrey Urban Farmers Market Association 2,000
36. Vedic Hindu Cultural Society 500
37. Whalley Community Association 2,000
38. White Rock/Surrey Come Share Society 2,000
39. Youth Arts Council of Surrey 500
40. Sunnyside Saddle Club 38,400
41. Cloverdale Curling Club 30,000
42. Surrey Sailing Club 24,000y g ,
43. Panorama Ridge Riding Club 22,500
44. Fraser Valley Heritage Railway Society 20,400
45. Lower Mainland German Shepherd Dog Club 6,000
46. Action BMX Association 4,000
47. Crescent Beach Swimming Club 625
48. Navy League of Canada 800
49. Nightshift Street Ministries 2,000
50. Cloverdale District Chamber of Commerce 10,000
51. Surrey Board of Trade 10,000
52. South Surrey / White Rock Chamber of Commerce 10,000
53. Surrey Tourism & Convention Association 10,000
54. Lower Fraser Valley Exhibition Association 350,000
55. Lower Fraser Valley Exhibition Association 200,000
56. Lower Fraser Valley Exhibition Association 225,000
57. Honey Hooser Scholarship 1,000
58. Arts Council of Surrey 4,000

2011 FINANCIAL PLAN
APPROVED CITY GRANTS
2011
Non-profit Organization
Approved
Amount
59. Surrey Foundation 5,000
60. Community Enhancement Partnership Program 25,000
61. Cloverdale Curling Club 30,000
62. South Fraser Community Services Society 24,000
63. Metro Vancouver Crime Stoppers 25,000
64. Surrey Crime Prevention Society 84,500
65. Earl Marriott Secondary School 100
66. Ecole Panorama Ridge Secondary School 100
67. Kwantlen Park Secondary School 100
68. Queen Elizabeth Secondary School 100
69. Semiahmoo Secondary School 100
70. Sullivan Heights Secondary School 100
71. Elgin Park Secondary School 100g y
72. Special Recognition 2,500
Unallocated - Dry Grad 1,100
Unallocated - One-time 5,975
Unallocated - Property Taxes 2,200
Unallocated - Special Recognition 2,500
Total 1,219,800$


![FORM 1 [See Rule 53(1)] Nomination for Retirement Gratuity ...vigyanlekha.gov.in/Admin/Attachments/CPS-Forms... · Nomination for Retirement Gratuity/Death Gratuity ... [See Rule](https://img.pdfslide.net/doc/110x75/5eb88f1e5359796b195bd19c/form-1-see-rule-531-nomination-for-retirement-gratuity-nomination-for-retirement.jpg)