Embed Size (px)
Citation preview

1
CORPORATE
SUSTAINABILITY
REPORT 2011
2
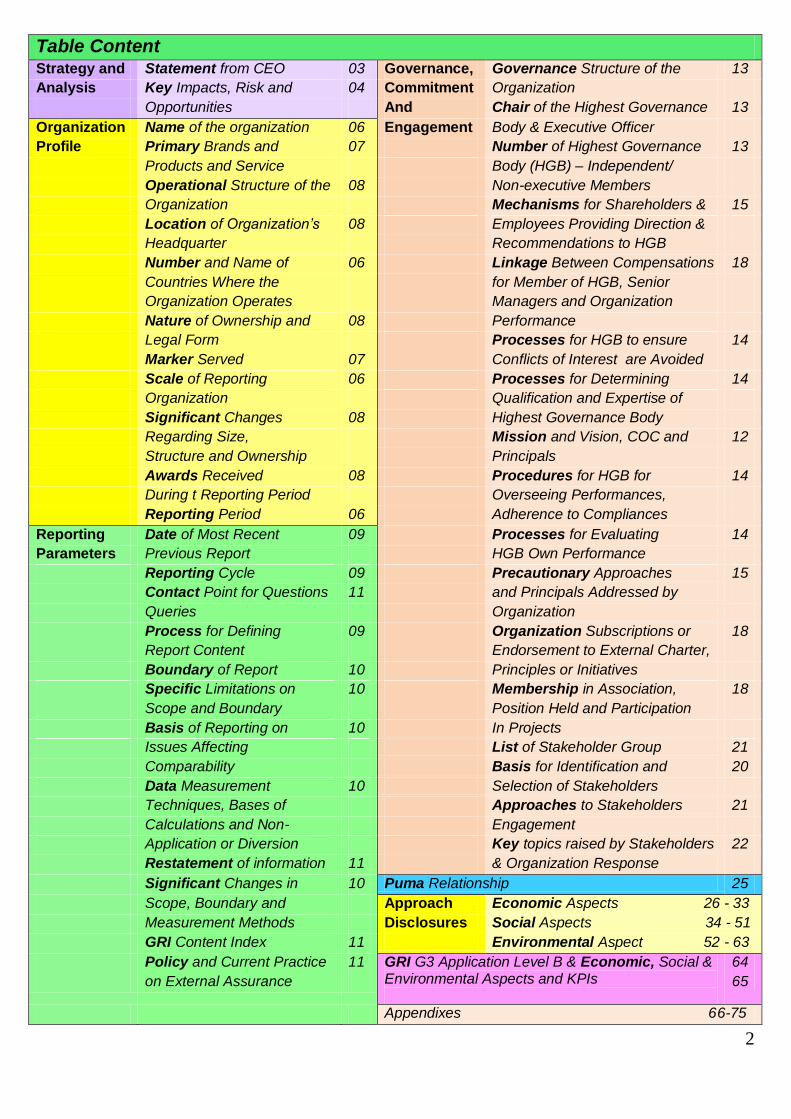
Table Content Strategy and Statement from CEO 03 Governance, Governance Structure of the 13
Analysis Key Impacts, Risk and 04 Commitment Organization
Opportunities And Chair of the Highest Governance 13
Organization Name of the organization 06 Engagement Body & Executive Officer
Profile Primary Brands and 07 Number of Highest Governance 13
Products and Service Body (HGB) – Independent/
Operational Structure of the 08 Non-executive Members
Organization Mechanisms for Shareholders & 15
Location of Organization’s 08 Employees Providing Direction &
Headquarter Recommendations to HGB
Number and Name of 06 Linkage Between Compensations 18
Countries Where the for Member of HGB, Senior
Organization Operates Managers and Organization
Nature of Ownership and 08 Performance
Legal Form Processes for HGB to ensure 14
Marker Served 07 Conflicts of Interest are Avoided
Scale of Reporting 06 Processes for Determining 14
Organization Qualification and Expertise of
Significant Changes 08 Highest Governance Body
Regarding Size, Mission and Vision, COC and 12
Structure and Ownership Principals
Awards Received 08 Procedures for HGB for 14
During t Reporting Period Overseeing Performances,
Reporting Period 06 Adherence to Compliances
Reporting Date of Most Recent 09 Processes for Evaluating 14
Parameters Previous Report HGB Own Performance
Reporting Cycle 09 Precautionary Approaches 15
Contact Point for Questions 11 and Principals Addressed by
Queries Organization
Process for Defining 09 Organization Subscriptions or 18
Report Content Endorsement to External Charter,
Boundary of Report 10 Principles or Initiatives
Specific Limitations on 10 Membership in Association, 18
Scope and Boundary Position Held and Participation
Basis of Reporting on 10 In Projects
Issues Affecting List of Stakeholder Group 21
Comparability Basis for Identification and 20
Data Measurement 10 Selection of Stakeholders
Techniques, Bases of Approaches to Stakeholders 21
Calculations and Non- Engagement
Application or Diversion Key topics raised by Stakeholders 22
Restatement of information 11 & Organization Response
Significant Changes in 10 Puma Relationship 25
Scope, Boundary and Approach Economic Aspects 26 - 33
Measurement Methods Disclosures Social Aspects 34 - 51
GRI Content Index 11 Environmental Aspect 52 - 63
Policy and Current Practice 11 GRI G3 Application Level B & Economic, Social & Environmental Aspects and KPIs
64
on External Assurance 65
Appendixes 66-75

3
Chief Executive Officer Statement
PCCS Group and its subsidiary JIT Textiles Limited has progressed
considerably in overall business performance which was matched by
positive developments in our sustainability agenda.
At PCCS Group – JIT Textiles Ltd, we take a long-term systematic
approach to sustainability objectives. In 2010/2011 period, we
developed roadmaps with specific action plans to achieve our 2010-
2011 strategic sustainability KPIs in partnership with our key
customers. We further improved our natural resource utilization, and
re-aligned several operational decisions in line with our sustainability
philosophy.
During the last two years, our progress in achieving savings in energy
and water were well documented. In addition to successful Energy
Saving programs, we also implemented fuel saving measures in
transportation and logistics system. As a result we achieved
substantial savings in diesel consumption. We were also able to
quickly share best practices in energy saving within the PCCS Group.
Our audit scores in CSR, Technical Quality, Sustainability and Safety
from annual audits conducted by key customers recorded huge
improvements and were rated among top in Asia.
We participated fully with our key customers in compliance with EU‟s
initiatives on Restricted Substances List and Kid‟s Safety Program. In
2011, we helped to develop a bio-degradable plastic bag for our
garments.
Through 2009-2012, we have intensified our localization process in
our human resources development. Through various training and
human resource development programs, increasing number of local
staff were able to make vertical progression in their careers within the
PCCS Group. As a result, we are now less dependent on expatriates
to fill in managerial and supervisory positions in the company.
JIT Textiles Limited has pioneered a workers‟ welfare program in
Cambodia. Through our unique in-house “Jouy K‟nier” (Self-Help)
Program, workers were able to enjoy welfare benefits far better than
those provided by the local Labor Law.
We firmly believe our commitment to sustainability makes us a
stronger business and will help to ensure PCCS Group and JIT
Textiles Limited will always be able to contribute to the society they
are operating in.
John Cha
Chief Executive Officer
Oct 2012
CEO : John Cha

4
Key Impacts, Risks and Opportunities
JIT Textiles Ltd (JIT) sustainability challenges (risks) and opportunities associated with the business goals and
operations are identified, prioritized and managed using our Company Risk Management Procedure:
Consider issues raised by our key stakeholders and international benchmarks for sustainability
performance
These findings are reported to our Head of Departments Committee periodically and inform of our
strategic planning and operating plan processes. There are 7 general aspects:
Aspects Challenges Opportunities Impacts 1. Global Macro
Economic
risks
Managing global macroeconomic
risks including
Natural resources
Raw material pricing
volatility
EU economy slum
Currency fluctuations
Applying management system and
governance processes effectively to ensure
Current and emerging risks are identified,
assessed and managed within our risk
appetites and
Opportunities are leveraged.
Fluctuating
sales volume
Cost Impacts
2. Environmental
Impacts of
Operations
Regulatory and stakeholder
expectations for operations with
low environmental impacts.
Reduction of environmental impacts
On manufacturing processes and products
to create new competitive advantage and
Reduce costs.
Sustainability
cost regarding
environmental
protection
3. Changing
Customer
Tastes
Changing consumer tastes
towards sustainable finishing
products
Be a leader in garment industry
Creating new areas of competitive
advantage through supply chain
partnerships and product life cycle
assessment capabilities
Maintaining sustainable value for our
customers.
Additional cost
to meet the
customers‟
tastes
4. Community
Support for our
Operations
Meeting social responsibility
requirements in return getting
community support for our
operations
To build effective partnerships and seek
constructive dialogue with the
communities in which we operate.
Social
responsibility
cost
5. Occupational
Health and
Safety
Regulatory and stakeholder
expectations for occupational
health and safety standard
To become internationally recognized for
Our safe work practices
Sharing our expertise with our suppliers
and customers
Helping customers and suppliers achieve
their own corporate social responsibility
goals.
Sustainability
cost regarding
occupational
health and
safety
6. Risk in
Emerging
Markets
Managing the political, cultural
and social risks associated with
our growth in emerging markets
Positively influence the development of
countries in the emerging markets into which
we are expanding
Delivering employment opportunities
Supporting local communities,
Contributing to the countries‟ economies
and demonstrating good governance and
supply chain integrity.
Cost of
maintaining
competitive
advantage in
orders
(Competition
from
Myanmar)
7. Climate
change
Melting of icebergs
Rising of seawater level
Widening of Ozone layer
Extreme weather conditions
worldwide.
Reducing the greenhouse gas intensity of
our processes and products to help
protect the environment.
Sustainability
cost regarding
environmental
protection

5
Besides the 7 general aspects above mentioned, there are 2 major threats faced by JIT during the year and the
impacts can be summarized as follows: -
From 1st of January, 2011, EU (European Union) further extended its GSP (Generalized
System of Preference) tax privilege to Cambodia garment manufacturers for all materials
imported from overseas which subsequently converted to finished goods and exported to
EU countries, meaning tax saving ranging 10% to 18% to EU buyers.
Lured by the exotic trade privilege, investors saw Cambodia as a new garment investment
heaven, made up their decision fast by closing down or shifting some of the factories in
other regions of the world, especially China when the labor cost was so high to make
garment industry volatile and unviable, and set up new factories in Cambodia especially in
the vicinity of Phnom Penh city. The existing factories in Cambodia took the opportunities to
enlarge their current production scale or even build new factories for their expansions.
Such influx of new investment or expansion would inevitable caused labor shortage in the
market.
Garment factories started to complete for both skillful and new labors to fill up the
employment vacancy. In order to retain existing workers and attract new comers for
business growth and expansion (Total workforce: 2010: 2,500 & 2011: 3,200), JIT resorted
increment both in salary and allowances to fulfill our business goal.
Consequently, the monthly basic wage plus allowances alone have increased from US$71
to US$87, representing 23% rise. The total wages (direct and indirect) shoot up 26% or
US$1,435,500 partly due to basic wage and allowances increment at the same time
increased the total workforce by about 700 workers and the rests by overtime claims.
Besides, JIT offered competitive remuneration by practicing the skill grading system to
workers whose monthly basic salary was higher than US$61 and enjoying incentives based
on productivity outputs.
Such sharp rise in remuneration resulted in the adverse consequence of low net profit
margin of mere 1% level in 2011, and the Company expected the government would further
increase the national minimum wage in the coming years. The estimated profit of
US$500,000 in the earlier year forecast was far outran by the wage increment of
US$1,435,500.
The lifting of EU (European Union) sanctions against Myanmar is bound to have an impact
on the Cambodian garment sector. The EU announced earlier that it was lifting sanctions
against the country. Japan and Canada have made similar announcements very recently.
The Cambodian garment industry will certainly be affected after EU sanctions against
Myanmar are abolished, but the extent of the effect was not known because the details of
the EU suspension of sanctions against Myanmar were not announced yet.
The impact on local apparel companies in Cambodia will not be felt soon and that, for the
time being at least, the local garment industry will not move to Myanmar.
What if EU, Japan, Canada and other western countries finally announce the lifting of
sanctions, we can expect a new round of investment in Myanmar by which customers may
pull away some orders from Cambodia to this country in near future. Cambodia garment
sector could be badly hit when more factories start operating in Myanmar and EU enforces
GSP system in two to three years‟ time.
L
A
B
O
R
C
O
S
T
M
Y
A
N
M
A
R
6
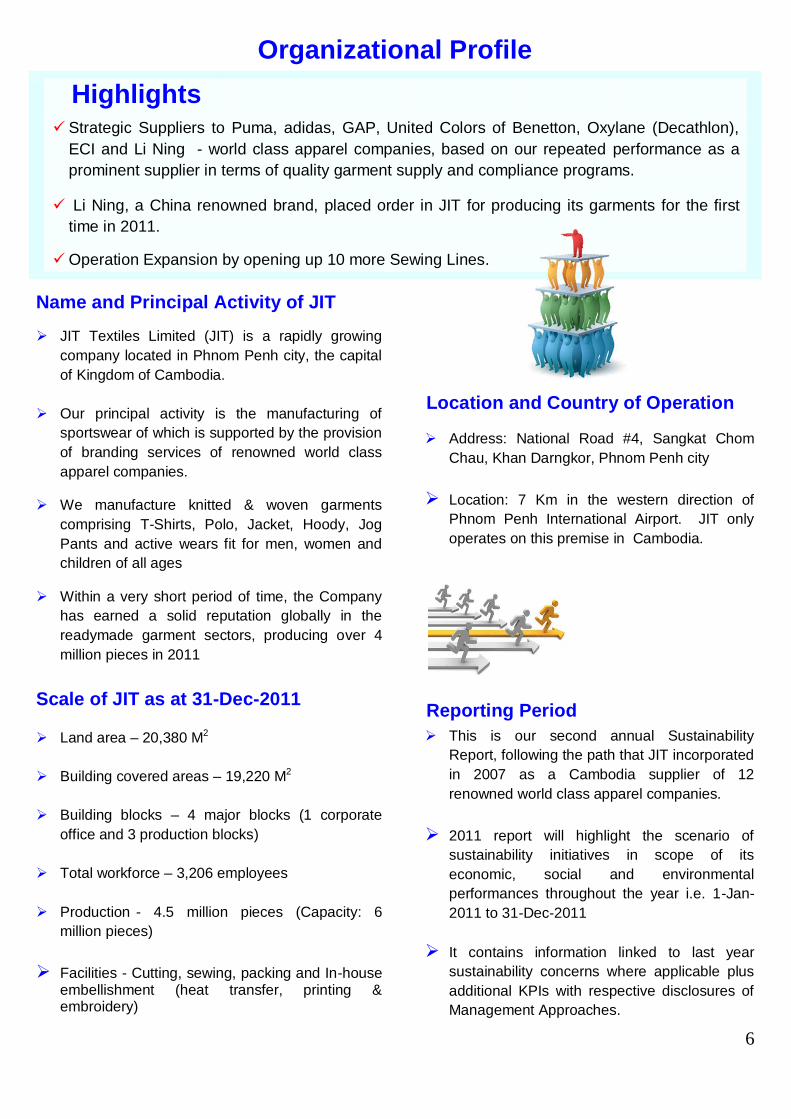
Organizational Profile
Highlights
Strategic Suppliers to Puma, adidas, GAP, United Colors of Benetton, Oxylane (Decathlon),
ECI and Li Ning - world class apparel companies, based on our repeated performance as a
prominent supplier in terms of quality garment supply and compliance programs.
Li Ning, a China renowned brand, placed order in JIT for producing its garments for the first
time in 2011.
Operation Expansion by opening up 10 more Sewing Lines.
Name and Principal Activity of JIT
JIT Textiles Limited (JIT) is a rapidly growing
company located in Phnom Penh city, the capital
of Kingdom of Cambodia.
Our principal activity is the manufacturing of
sportswear of which is supported by the provision
of branding services of renowned world class
apparel companies.
We manufacture knitted & woven garments
comprising T-Shirts, Polo, Jacket, Hoody, Jog
Pants and active wears fit for men, women and
children of all ages
Within a very short period of time, the Company
has earned a solid reputation globally in the
readymade garment sectors, producing over 4
million pieces in 2011
Location and Country of Operation
Address: National Road #4, Sangkat Chom
Chau, Khan Darngkor, Phnom Penh city
Location: 7 Km in the western direction of
Phnom Penh International Airport. JIT only
operates on this premise in Cambodia.
Scale of JIT as at 31-Dec-2011
Land area – 20,380 M2
Building covered areas – 19,220 M2
Building blocks – 4 major blocks (1 corporate
office and 3 production blocks)
Total workforce – 3,206 employees
Production - 4.5 million pieces (Capacity: 6
million pieces)
Facilities - Cutting, sewing, packing and In-house embellishment (heat transfer, printing & embroidery)
Reporting Period
This is our second annual Sustainability
Report, following the path that JIT incorporated
in 2007 as a Cambodia supplier of 12
renowned world class apparel companies.
2011 report will highlight the scenario of
sustainability initiatives in scope of its
economic, social and environmental
performances throughout the year i.e. 1-Jan-
2011 to 31-Dec-2011
It contains information linked to last year
sustainability concerns where applicable plus
additional KPIs with respective disclosures of
Management Approaches.
7
Sales by Brands
New customers like Li Ning, The S Group, Gander Mountain, Perry, ECI and
Casino (Graph 1) were introduced in 2011 partly due to the effect of GSP
(Generalized System of Preference) tax privilege introduced by EU. Another
reason was to fill up the gap during low season of the year so as to smoothen
the production level
Due to ever rising labor cost in China, Li Ning order started to move out from
China and JIT was the first factory producing its product in Cambodia. Other new
brands followed suit by placing orders in JIT hoping to further develop more
styles and increase orders beyond 2011
As an international leading garment manufacturer, our sales regions covered
North America, EU including UK, Japan, Australia, New Zealand and Asia
countries.
Market Distributions
Graph 2 shows Sales to EU and “Others” region
increased by 5% and 2% respectively where
customers placed more EU orders instead of USA
ones was due to the GSP tax privilege ranging 10 to
18% depending on the types of garment products
imported to EU countries.
The recent trade treaty, which was quite similar to
GSP, signed between ASEAN countries and Japan
on ASEAN + Japan AFT Agreement (Free Tax
Agreement) was another reason boosting 2%
increment in “Others” region
70%
20%
10%
75%
13% 12%
0%
20%
40%
60%
80%
EU USA Other
Per
cen
tage
Year
Graph 2 - Market Distribution by Region 2010 - 2011
2010
2011
35%
40%
10%
5% 7% 3%
25%
55%
6% 1% 5% 1% 1% 2% 1% 1% 1% 1%
0%10%20%30%40%50%60%
Pe
rcen
tage
Year
Graph 1 - Sales Ratio by Brands 2010 - 2011
2010
2011
No# Brands 2010 – 6 2011 – 12 Up 100%
Other includes East Asia, Canada, Australia,
New Zealand and Asia countries

8
Operational Structure of JIT
The structure of PCCS Group is shown below where JIT is 100% control of the holding company PCCS
GROUP BHD.
The Holding Company, PCCS Group Berhad (Ltd), is located and registered in Malaysia and listed in Kuala
Lumpur Stock Exchange (BURSA Malaysia) since 1995.
JIT is incorporated in Cambodia in 2007 as part of group expansion of overseas business activities. It is a
legal and separate entity registered in the country of Cambodia with Incorporation Registration No#:
1326/08E
The operations in the production floor can be grouped as follows: -
Sample Garment Development – JIT is capable of sample garment making from the beginning, based
on customer‟s technical design requirement, up to the last stage of development and
Bulk production – JIT performs CMT (Cut-Make-Trim) manufacturing process for the renowned brands
above mentioned.
PCCS Group Structure
PCCS
Group Bhd
(Holding
Company)
JIT
Textiles
Limited
Shem
Yee
Garments
Sdn. Bhd.
Jusca
Development
Sdn. Bhd
Beauty
Electronic
Embroidery
Center
Sdn. Bhd
Beauty
Apparels
(Cambodia)
Ltd
SA One
Garment
Ltd
Perusahaan
Chan
Choo Sing
Sdn.Bhd
Other
subsidiaries
Global
Apparels
Limited
Beauty Silk
Screen(M)
Sdn. Bhd.
JIT
Embroidery
Limited
Beauty Silk
Screen
Limited
Significant Changes There are no significant changes from previous reporting period regarding the structure and legal
ownership of JIT except the followings:
Size of operation – Additional of 10 new sewing lines of about 40 workers per line comprising sewing
ironing and packing operators, QC staff and line leader totaling 400 workers in sewing section
Manpower recruitment - Total workforce of 3,206 employees, an increment of 700 (including the 400
above mentioned) workers at the end of 2011 when compared to last year‟s.
Awards
JIT did not receive any award during the year of 2011
9
Reporting Parameters
Highlights
JIT is a subsidiary of PCCS Group Berhad (Ltd), a public listed company
in Kuala Lumpur Stock Exchange, and publishes its Financial Report in
accordance to International Accounting Standard and KL Stock
Exchange Regulations
Most Recent Report and Reporting Cycle
We started our first Sustainability Report in 2010 covering relevant information fro2m 1-Jan-2010 to 31-
Dec-2010 for the purpose of enhancing communication with our stakeholders and ever increasing demand
of corporate reporting transparency and decided to report on a yearly basis.
This is the second Sustainability Report of JIT, covering relevant information throughout the Year of 2011,
after taking accounts of materiality assessment that influenced it, which also included additional information
relevant to the Global Reporting Initiative (GRI) or where JIT deemed appropriate.
Process of Defining Report Content
Purpose of Report We need to emphasize the fundamental
purposes of this sustainability report as
each of them relates to:
our concern on the global climate
change,
our attention to the implementation of
sustainable development,
our emphasis towards Corporate Social
Responsibility (CSR) and
our commitment to the business transparency, social contribution and controlling pollution within the premises for conservation of the environment.
Core Aspects
JIT continues publishing this report which adheres to
the Global Reporting Initiative (GRI) guidelines (G3) as
the basic structure, which breaks down into five core
aspects:
Governance,
Economic performances,
Corporation Social Responsibility,
Environmental performances and
In-depth coverage on certain related issues.
These five aspects resonate with the disclosed
indicators on sustainability.
Consideration for Report Creation Process
Identify the business goals, objectives, target the main aspects relating to this report
Identify the connectivity parties, i.e. our reporting stakeholders to determine their
interests and influences over our business operation and management.
Selections of aspects as prioritized by stakeholders and Performance Indicators
associated with these aspects by applying materiality, inclusiveness and
completeness principals and respective disclosures of Management Approaches
(DMA) in relation to KPIs that we have selected and
Monitoring the collecting of relevant information for the selected indicators by
applying the comparability, reliability, accuracy, clarity, timeliness and balance
principals.

10
Scope and Boundary of Report
PCCS Group – Narrative on Group structure and legal formality
JIT – Covers all aspects of JIT operations which includes:
Waste Collection – Information on the recycled wastes
Customers – Information pertaining to sale and supply chain activities and
Fabric, accessories and packing suppliers which are our strategic supply chain partners
Besides these, general information pertaining to garments industry in Cambodia would be
disclosed accordingly to help readers understand better the business situation of the Company.
Limitations on Scope and Boundary
Even though steps have been taken to ensure full disclosure and
transparency, we are unable to disclose all information due to the following
limitations:
Only key stakeholders were selected meaning we were unable to disclose
certain aspects and performance indicators raised by the other
stakeholders
Certain data or information are unavailable for comparison due to its
completeness and relevancy to this GRI report
Basis of Reporting on Issues Affecting Comparability
As JIT did not have any subsidiary company and did not involve in joint venture
business, leased facilities, outsourced operation with any other company, the
basis of reporting which might significantly affects its comparability for the years
of 2010 and 2011 did not exist.
Significant Changes
There was no significant change from previous reporting period in the scope,
boundary or measurement methods applied in the report.
Measurement Techniques and Basis of Calculation
During the report creation process, we followed the disclosure requirement and
measurement techniques or methods recommended by GRI Reporting
Guidelines and simple linear calculation process was applied throughout this
report.
Where such techniques and methods were not available, we applied the
international acceptable standards of techniques and measurement. If such
standards were not available, we applied our internal standards based on our
assumptions. In both cases, disclosure would be made in the relevant sections
of this report.

11
Reporting Performance Indicators
We reported 24 Performance KPIs based on the GRI G3 (Global Reporting Initiatives) guidelines after
taking into consideration of the requests by some of our stakeholders and others which were needed
internally for better understanding and discussion.
Even though there were 13 new KPIs being reported for the first time in 2011, we managed to collect all the
data and information in each respect for comparison and providing relevant information to the readers of
this report.
External Assurance for the Report The Company decided to follow the GRI G3 guidelines with self-declared Level B.
JIT has no intention to obtain external assurance for this report. The GRI Content Index is disclosed on
Page 64 for reference.
Restatement
There was no restatement in the 2011 Sustainability Report.
Contact Window & Request for Feedback Producing a Sustainability Report not only is an arduous task but also requires countless hours of data
collection, collation and analysis. As such, we invite all readers for open discussion by providing us your
views on the quality and usefulness of this report.
While every effort has been made to ensure the accuracy of the information, anyone seeking to rely on
information in this report or seeking to draw detailed conclusions from the data should contact JIT for
verification and assistance.
Carlsbin Ng – Sustainability Committee Officer
Email: [email protected]
Tel: +85512333920 (Cambodia)
Economic KPIs
2010 – 02 2011 – 02 Sustained
Social KPIs
2010 – 03 2011 – 11 Up 267%
Environmental KPIs
2010 – 06 2011 – 11 Up 83%
Total KPIs
2010 – 11 2011 – 24 Up 118%

12
Governance Commitment and Engagement
Highlights GMAC
Member of Garment Manufacturer Association in Cambodia (GMAC) since 2007. One of JIT
A.G.M. is the Exco member of the Association.
Member of Fair Factories Cambodia (FFC) under the External Charter of ILO (Internal Labor
Organization)
The sustainability goals and objectives of JIT is in line with the following customers: -
Puma Sustainability Target 2011-2015 which launched in 2011 by Developing
Sustainability Projects and Target Plans (SPTP) from 2010 baseline year
adidas Sustainability Plan 2011-2015 which also launched in 2011 and monitored the
progress through internet EMeReT System (Environmental Metric Reporting Tool) from
2010 baseline year.
In-house Charity - “Jouy K‟nier” (“Self-Help” in Khmer) 2010: US$8,240 2011:US$4,593
Mission & Vision
• Our Mission is to provide our customers with the highest quality garment withthe lowest environmental impact
• Our Vision is to help conserve and protect our planet‟s resources through theuse of innovation and methods that maximizes operating efficiencies in allareas of our business.
Environmental Sustainability
• JIT is committed to leading the industry in minimizing the impact of its activitieson the environment. As a Company, we act in compliance with the law relatingto the environment and are committed to the integration of sound environmentalpractices in our business decisions. We recognize the direct and indirectenvironmental impacts of our operations and support the principles ofsustainable development.
Social Sustainability
• To be a responsible corporate entity, our corporate culture is built on respect forthe society in which we operate and an inclusive perspective on ourstakeholders embracing not just shareholders and staff, customers andbusiness partners but the community at large. Creation of value for society, helppeople in need and focus on the top priorities of the country – healthcare andeducation.
Economic Sustainability
• Profitable growth and long-term business success ensure our commitment tosustainable economic development. Maximizing resources utilization andminimizing costs are the driving forces towards ensuring that activities andinitiatives are economically viable. We practice long term gains which alwayshas preferences over short term yields.
Internal Code
of Conduct
• JIT developed internal code of conduct and principals which are in line with the statutory and customers‟ requirements
13
Governance, Commitments and Engagement
Board of Directors of PCCS Group
The Board of Directors of PCCS Group Bhd, the holding company of
JIT, remains unchanged since 2010 and consists of seven (7)
members.
JIT Highest Governance Body (HGB)
PCCS Group Berhad (Ltd) appoints one of its Executive Directors as
CEO (Chief Executive Officer) of JIT to run the business. He is
responsible for the overall managerial and operational decisions of
the corporate governance of JIT, and assisted by 3 more key
management members:
1 Country General Manager
2 Assistant General Managers
All four of them are considered as the HGB members of JIT. Their focus is to enhance the interests of
shareholders and other key stakeholders by providing oversight of the economic, environmental and social
performance of JIT. The Organization Chart shown below represents the governance structure of JIT:
A. G. M.
Customer Service
Country General
Manager
A. G. M.
Adm & HR
CEO
QA/QC
Manager
CI Manager
Production
Manager
Warehouse
Manager
Finance &
A/C
Manager
Shipping
Manager
Marketing
Manager
Marker &
Sample
Executive
Corporate governance is integral to the way we do business. It shapes our relationships with all our
stakeholders, including shareholders, staff and workers, customers, suppliers and the community, and
provides the framework and control systems that help us to adhere to the highest ethical standards. Our
approach to governance is to foster an organization that supports individual and professional integrity and
responsible behavior in all facets of our business.
We aspire to the highest standards of behavior from employees. This can only be achieved through
responsible leadership, accountability and a governance structure that is well communicated throughout
the organization.
Board of Directors No #
Executive Chairman & Managing Director
1
Executive Director 2
Director 2
Independent Director
2
Total 7

14
Qualification and Experiences
CEO and 3 other members of Highest Governance Body (HGB) are selected
and employed by the PCCS Group‟s Board of Directors based on their
extensive knowledge of the JIT‟s industry or experiences in financial reporting
and risk management.
CEO holds a Master Degree in MBA (Finance) and Degree in Environmental
and Social Study with more than 30 years of experiences as Lean Consultant.
Conflict of Interest
To ensure full disclosure and transparency, all members of HGB, managers and Head of Departments are required to report any potential conflicts of interest to the Company.
Already inbuilt conflict of interest into Employment Manual as an important element of the Employment Policy and Procedure, each employee should be abided by in full while providing employment service to the Company.
Identification and Management of Performances, Risks and Opportunities and
Adherence of Compliances
The HGB for overseeing the organization‟s identification and management of economic, environmental and
social performance, including relevant risks and opportunities, and adherence of compliance with
internationally agreed standards, codes of conduct and principals becomes part of its managerial functions
to keep the Company economically viable and sustainable.
Procedure is in place by setting and communicating performance standards including goals and objectives
and expectations, observing and providing feedback, and conducting appraisals enables JIT to achieve the
best results through identifying and managing these performances and adhering compliances.
Well-established executive, audit and compliance and human resources also ensure that their
responsibilities are upheld and executed to the highest level.
Should assessment is required; SWOT analysis is applied to evaluate the risks and opportunities.
Highest Governance Body (HGB) Performance Evaluation
The HGB performance evaluation process, including goal setting,
performance measurement, regular performance feedback, employee
recognition, and documentation of employee progress, is set by the Board of
Directors (BoD) of PCCS Group to ensure the successes both in JIT
business operation and members of HGB achievements on a yearly basis.
The performance appraisal is part of that process and provides an excellent
opportunity for BoD to communicate with the HGB members about past
performance, evaluate their job satisfaction, and make plans for JIT future
performance.
MBA Environmental & Social Degree

15
Precautionary Approach to Risk Management
A response to the organization‟s approach to risk management in operational
planning or the development and introduction of new products can be summarized
as follows:
Identification and prioritization of risks,
Reporting of these findings to our Head of Departments Committee periodically
and inform of our strategic planning and operating plan processes,
Execution of programs and monitoring of planned activities to mitigate the risk
level
Evaluation of the effectiveness of the plans and review for future actions
Mechanism for Shareholders and Employees Providing Direction & Recommendation
The concerns of the stakeholders, especially the shareholders and employees in providing direction and
recommendations, are well deal with by the Highest Governance Body (HGB) of JIT and other
committees as elaborated in the coming statements through direct involvement in operational activities
and the channels of communication.
Direction and recommendation from shareholders and employees can be conveyed to the parties below
mentioned by many ways such as agenda tabled for discussion in the meetings.
Outcomes of the discussion pertaining to issues raised by shareholders and employees will be
addressed by with solutions and relevant remedial actions.
Direction and Recommendation to Group Level
PCCS Group Berhad (Ltd) holds Annual General Meeting in Malaysia where all shareholders decide on
matters relating to the overall business and management of the Group companies. The intention and
expectation of the shareholders were conveyed to Board of Directors (BoD) during the meeting.
The BoD conducts regular board meeting, based on the strategy set in Annual General Meeting, to
oversee the overall operation and management of all subsidiaries within the Group and supervises the
HGB members to carry out managerial and operational decision makings in the interest of JIT.
JIT Factory-wide Level
The HGB members
They hold weekly senior management meeting to formulate policy,
objectives and goals, make decisions regarding the business strategies
and targets formally set, monitor the running of business, analyzed and
review the business outcomes.
The Head of Departments Committee (HODC)
HODC holds weekly meeting to discuss the daily business activities and
operations of the Company where its sub-committee, Sustainability
Advisory Committee (SAC) (formerly known as Sustainability
Committee) reports directly to HOD Committee on events pertaining to
sustainability.

16
By Functional Committee Level
Sustainability
Advisory
Committee
Health, Safety &
Environmental
Committee
Corporate Social Responsibility
Committee
In-house Charity
Fund
Labor Union
No# of Management (Mgmt) and Employee (Empe) Members
Sustainability Advisory Committee (SAC)
While SAC is responsible for the sustainability activities, its implementation and development programs is
further assisted by sub-committees namely HSE, HR, LEAN and CRS, each with specific functions related
to their fields of specializations. The representatives from each sit in the SAC meeting on the monthly
basis.
Reports
Health, Safety &
Environment
Committee
( HSEC)
Reports
Human Resource
(HR) Department
Board of
Directors CEO
Head of
Departments
Committee
(HODC)
Sustainability
Advisory
Committee
(SAC)
Reports
Corporate Social
Responsibility
Committee
(CSRC)
Reports Reports Reports
Reports LEAN
Department
Health, Safety and Environmental Committee (HSEC)
It is a sub-committee of the SAC, which has general oversight responsibility for compliance:
Oversee the company‟s implementation of compliance programs, policies and procedure that are
designed to be responsive to the various compliance and regulatory risks facing the company
Assist the SAC in fulfilling its oversight responsibility for the Company‟s compliance, polic ies and
procedures
Members comprise of personnel both from management and local employees with 50% and 50%
proportion respectively (2010: 50% to 50%). It holds monthly meeting to discuss the related issues.
2010: 4 – 1
2011: 4 – 1
Sustained
2010: 7 – 10
2011: 8 – 12 Mgmt Up 14%
Empe Up 20%
2010: 5 – 5
2011: 5 – 5
Sustained
2010: 0 – 3
2011: 0 – 3
Sustained
2010: 0 – 15
2011: 0 – 15
Sustained

17
Corporate Social Responsibility Committee (CSRC)
CSR policy functions as a built-in, self-regulation mechanism whereby
monitors and ensures its active compliance with the spirit of the law, ethical
standards and international norms.
The goal of CSR is to embrace responsibility for the Company‟s actions and
encourages a positive impact through its activities on the environment,
consumers and all stakeholders.
The major projects which the Committee is currently running are the In-house
Social Charity Fund and customers CSR audit sustainability. The ratio of
management to local workers is 50% to 50% (2010: 50% to 50%) and the
Committee meets on a quarterly basis and report to SAC accordingly.
In-house Social Charity Fund
It is named as “Jouy K‟nier” (“Self-Help” in Khmer) and provides charitable fund to
the employees since 2010 in the following circumstances:
Natural disasters like flood and fire suffered by families of employees,
Injury & sickness suffered by employees,
Death of immediate family members of the employees and
New born babies of employees
From the Employee Survey feedback, charitable foundation is useful for
strengthening factory reputation and relationship among employees. JIT has set a
good example by engaging in charitable project directly and determining conditions
of providing assistance to employees when needed. It strives to provide better
service in this respect so that the welfare of the employees would be further
enhanced in future.
Social Charity Fund distributed: 2010: US$8,240, 2011: US$4,593. For more detail
information, please refer Table A in the Appendixes.
The fund paid was contributed and shared equally by JIT and the Labor Union
whose cash collected are from its members. Even though the cash amount
distributed in 2011 was lower than last year, we strongly believed that all
employees were aware of such fund and the claim entitlements.
Labor Union
Labor union named United Labor Union is formed under the local
legislation. It is an independent body formed by the employees of the
Company taking charge of the welfare and rights of the Union‟s
members.
Union members take part in trainings, both conducted internally or by
external consultants, on HR and union topics so that the minimum
statutory and customers requirements are made known to them. The
union conducts meeting with management on a monthly basis.
CSRC Ratio Mgmt – Employee 2010: 50% - 50% 2011: 50% - 50%
Donations 2010: US$8,240
2011: US$4,593
Union members 2010: 2,140 (85.45%) 2011: 2,350 (87.92%) of total workforce

18
EXCO – Deputy
Chairman
Informal dialogues For informal issues-based discussions with Line Leaders and Supervisors in
all departments of JIT, HOD (Head of Department) conducts regular meetings
to listen to the needs of employees and take initiatives to make improvements.
Issues raised by the employees or complaints received from employees‟
suggestion box are brought to the meeting to openly discuss and corrective
actions taken to mitigate or settled accordingly.
Linkage between Compensations for HGB, Managers and
JIT’s Performance
As JIT is 100% owned by PCCS Group Bhd, the holding company is entitled
to any dividend which is proposed by the Board of Directors, and approved
by shareholders during the Annual General Meeting. There was no dividend
declared in 2010 and 2011
Members of HGB and managers obtained their respective remunerations and
fringe benefits based the employment contracts signed between JIT. Bonus
will be given based on the overall financial performance of JIT on the yearly
basis.
JIT did not specifically allocate certain amount of cash as compensation to
them in respect of social and environmental performances that they
achieved.
Subscription or Endorsement to External Charter
JIT is a member of Fair Factory Cambodia (FFC) under the Endorsement to
External Charter of ILO (Internal Labor Organization) since 2007.
Under this endorsement agreement, FFC conducts compliance audit twice a
year on unannounced basis. JIT participated in certain training courses
conducted by FFC so that the latest developments and update information on
labor, legislations, code of conducts, principles and standards were followed
up and closely adhered to.
GMAC Membership and Position Held
JIT is a member of Garment Manufacturer Association in Cambodia (GMAC)
since 2007 up-to-date and enjoys some of the prominent benefits:
Obtaining first hand information of government and relevant authority
via GMAC
Active in negotiation with governmental bodies via GMAC so that the
interest of members is protected.
GMAC
19
GMAC EXCO Member
One of JIT Assistant General Managers, Mr. YT Choon is the
Deputy Chairman of GMAC since 2009 until up-to-date. Being an
EXCO member in GMAC, he is actively involves in the followings:
Trade facilitations which involve Ministry of Commerce, Council
of Development of Cambodia and Custom Trade Department, a
sub-unit of Ministry of Finance.
Industrial Relations which involve ILO, National Labor Union and
Ministry of Labor,
Financial arrangements between members and the Ministry of
Finance, especially on the tax matters (corporate and employee)
Negotiation on the construction of National Garment Institute –
Donation of US$3 million from France
Promoting Cambodia as a garment sourcing center. GMAC organized a forum in Japan, 2008
Encouraging fabric mills to invest in Cambodia. GMAC organized a forum in DongGuang city, China,
2011
Training programs – GMAC is collaborating with JODC (Japan Overseas Development Corporation)
on paper pattern design course to local Khmers
Exhibitions
Act as a co-organizer for a series of trade fairs such as SASFA Global Forum Seminar in Phnom Penh &
Workshop and Cambodia Trade Fair in Siam Reap
The activities that JIT participated in 2011 were as follows: -
Garment Trade Fair in New Delhi
Cambodia Trade Fair in Phnom Penh
….

20
2011: 7 2011: 7
Sustained
Identification of Stakeholders and Selection for Engagement
Goals
Setting
Sales
Growth Energy Saving
CO2
Emission
Reduction
Waste
Reduction
Water
Saving
No# of
Stakeholders
2011
Target
2010
Based Yr.
Based on
2010 Sales
Based on Per Piece of Garment
Produced
Based on
Per Worker
The process of identification, selection and engaging of stakeholders is done by SAC and HESC
committees during report preparation stage.
They start liaising with relevant departments, meeting stakeholders and governmental bodies‟
representatives to identify business goals, aspects and related indicators that are relevant and appropriate
to the report by considering factors:
Usefulness, reliability, materiality and inclusiveness of stakeholders
Sustainability context, completeness of data/information needed to be collected and represented.
Expectations and interest of the organization and stakeholders which are equally important when
deciding the content of the report.
The process of identification of business goals, aspects and performance indicators includes:
Using various approaches such as relevancy of business goals; prioritize stakeholders, principal of
materiality, stakeholder inclusiveness, completeness and sustainability context.
The business goals and types of positive and negative impacts associated with possible actions
counter-balance the negative impacts.
Business Goals and Targets Settings
JIT‟s key business goals and targets set, taking 2010 as the baseline year,
with related stakeholders can be summarized as follows:
2011 Sales Growth – 5% (2010: 2%)
Energy Saving – 20% both for direct and indirect energy sources based on per piece of garment
produced
CO2 Reduction – 20% on the direct and indirect energy used in JIT based on the conversion rate on
quantity or volume of emissions and effluents
Waste Reduction - Encourage the recycle of by-products and wastes by 10% based on total materials
Water Saving – 15% based on consumption per employee
Full compliances on statutory and regulatory and customer‟s requirements covering economic, social
and environmental aspects and impacts. Target: Zero fine
Quality Policy – The Company is committed to understand, meet, and when possible, exceed
customer‟s requirements through the continuous improvement of our processes and dedicated to
delivering defect-free product on-time at the most competitive price possible
5%
20%
20%
10%
15%

21
Engagement Methods
The potential stakeholders were identified when we defined the business goals
and main aspects. To determine the level of engagement, we analyzed the rate
of “Influence” and “Control” to these stakeholders and vice versa.
Our stakeholders provide a diverse range of perspectives and we maintain
various formal management systems to engage with, listen to and learn from
them. We take their feedback seriously, and when appropriate and relevant to
our business, incorporate it into our thinking and planning.
To prioritize our stakeholders and their concerns, we set the engagement plan,
taking into considerations of the following aspects:
significant/strong influences and/or,
significant impacts on the economic, environmental and social issues
between us,
the relevance of the stakeholders‟ relationship both direct & indirect to our
business and
the importance of the particular issue being raised
After brainstorming process, those stakeholders with significant impacts both
positive and negative outcomes were selected by taking the factors above
mentioned into consideration, the higher the total score, the stronger is the
connection and the final list of stakeholders is shown in Table 1 which are
similar to 2010 for sustainability report creation.
1 Employees
2 Shareholders
3
Government –
Ministry of
Labor, Tax
Department &
Ministry of
Environment
4 Customers
5 Waste
Collectors
6 Suppliers
7 Local
Community
Table 1
Like 2010 where the sustainability engagement team continued contacting and communicating with the
selected stakeholders on our intention to engage them again in 2011. Feedback from above stakeholders
revealed that they were willing to be engaged again for 2011 GRI report creation.
In the events when a particular stakeholder group is in a large group such as employee and local
community, different approaches had been applied to collect information to ensure the accuracy and
reliability of them. In cases of certain limitation of approaching the issues, we interpreted the aspects into
simple and practical issues to help our stakeholders understand more easily hence providing relevant
information in return.
The members of Sustainability Advisory Committee have done the engagement activities with potential
stakeholders their concerns on our business operations as well as main aspects of the report by the
following ways:
face to face interview,
telephone enquiry,
direct dialogue,
extract of data and information and analysis, email correspondence and
questionnaires

22
Stakeholders’ Feedback – Key Concerns
Governmental Bodies 1. Tax Department - It mentioned that not only JIT (the Company)
paid the monthly employee tax amount on time by withholding
individual employee tax portion but also disclosed the income of
individual employee on the gross amount, meaning the Company is
obliged by the legislative requirements to withhold tax and set a good
example for other factories to fully comply in Cambodia.
JIT has regular face-to-face meeting or through email with Tax
Department officers pertaining to updating of tax information.
Prioritized stakeholders
Aspects chosen by
stakeholders
List of aspect to be reported
List of indicators associated
with aspects
Materiality test
List of indicators to be reported
Completeness test
Determination of Materiality and Reporting Indicators
For this Report content, we have carried out the tests of reporting principals
including Materiality, Inclusiveness, Completeness, Sustainability Context and
the steps taken can be summarized in the Engagement Process Flow on the
right
Prioritization of stakeholders together with inclusiveness, list of aspects
chosen by stakeholders and to be reported have been disclosed and
explained in the foregoing statements. The following principals are equally
important:
Materiality
After considering the potential core indicators and associated main aspects,
we applied the materiality tests by answering several relevant test questions
for each indicator. First 24 highest scored indicators were selected for GRI
Reporting creation purpose.
Those indicators with adverse effects were considered if those would affect
our performances. Subsequently, JIT would implement corrective actions to
check such drawbacks.
Completeness
We applied completeness tests to the following issues to ensure that the contents
reflect our significant aspects and allow our stakeholders to review our
performance:-
Inclusiveness of entities which our Company has control and influences over
them or to be controlled by them
Providing sufficient information concerning to stakeholders concerns or
company impacts
Reporting on significant events or impacts
Engagement
Process Flow

23
2. Ministry of Labor - It emphasized that the
Company should continue providing high quality
working condition to all employees.
Knowing that the total workforce has increased to
3,200 employees, the Company has continuously
playing greater role in providing job opportunities to
the residents surrounding the Factory as well to the
rural workers despite the fact the basic salary has
increased by about 25% since last year due to the
influx of foreign businessmen investing in
Cambodia at the beginning of 2011.
The Company has to submit certain reports to the
Ministry and meet them on a monthly basis hence
labor issues can be brought to discuss freely.
3. Ministry of Environment - It stressed the
importance of meeting the minimum legislative
and regulatory requirements of environmental
protection.
Based on the audit reports done half-yearly, JIT
passed all regulatory tests such as drinking
water content, machinery and equipment
operation standards, water treatment discharge,
noise and heat levels.
In addition, JIT achieved best practices in
Energy, Water and wastes reduction by more
than 30% in 2011 comparing to 2010
performances. During closing meeting, the
Ministry officers discussed directly with us on
the matters to be improved in each audit.
Customers 4. As part of the supply chain, customers support and encourage JIT in sustainable
compliance practices in order to maintain the world leading garments manufacturer
status concerning product and conservation of environment.
Puma has upgraded JIT CSR (Corporate Social Responsibility) status from B+ to A
grade in S.A.F.E. audit in 2011.
Suppliers 5. The feedback from existing suppliers still concentrated in strengthening the
business partnership in material supply chain.
Non ASEAN countries suppliers admitted that they have grabbed the chance by
trading big quantity of materials throughout the year due to EU (European Union)
further extends the GSP (Generalized System of Preference) trade privilege to
Cambodia manufacturing sectors.
All fabric suppliers have to come to JIT for the types, quantity and quality of fabric
for the new sample garments development in each season.
6. Community Hawkers
Local Community hawker‟s sales increased by 25% (between 100,000 to 240,000
riel or US$25 – US$60) when compared to last year.
Approximate earnings of 60,000 to 120,000 riel (US$15 to US$30). The sales
volume was higher than last year because JIT split the lunch break into two
sessions, i.e. one at 10:15am and another at 11:00 am as the total numbers of
workers has increased considerably. 90% of the hawkers admitted that they relied
heavily on the income earned from here to support their family lives.

24
Employees
7. Employees‟ Survey conducted in 2011 summarized the following key points: Employees’ Survey Summary
Areas of
discussions
Significant improvements Satisfaction
Level
A Occupational Health & Safety 2010 2011
Working
conditions –
Noise, Heat,
Ventilations
Noise reduction - Constructed concrete building to install the
generator located about 15 meters away from the nearest production
floor. In 2010, the generator is located 3 to 5 meters away from the
Electrical and Embroidery Departments. Decibel: 2010: 93 2011:65
(Acceptable level: 75 and below)
Heat reduction – Using shelters made of fabric mesh to block the
directly contact of sunshine to production floors.
Exhaust fans used in water curtain cooling system of which take
away the heat from the production floor are covered with hollow
cylinder-shape fabric to prevent sunlight.
Extending the function of water curtain cooling system by additional
2 hours per day from 8:30 am to 4:30 pm. {Normally from 9:30 am to
3:30 pm } Temperature: 2010: 32OC, 2011: 29OC
79% 87%
B High risks
areas
Shifted the Printing Ink Chemical Room out of production floor and
allow having chemical ink for single day‟s consumption only in the
Design Room. The exposure of hazardous chemical to printing
workers has greatly reduced.
75% 90%
C Day Care
Center
Double the current size of the Day Care Center plus a playground for
the children of the JIT employees to stay more comfortably.
78% 95%
D Recycled
Waste Store
Constructed a concrete store to keep recycled wastes for the
protection of the environment.
JIT management conducts monthly meetings with the Labor Union and Shop Stewards on workers welfare and
concerns.
Shareholders
8. The importance of profit to a business is that JIT knows exactly what
can be spent to make the business prospers and makes sure that we
can develop our merchandise and services to make them better to
attract more customers to the business. Other benefits derived from
profit in business includes but not limited to:-
It helps in the development of the company position in the market,
It judges the position of their management ,working involvement of
workers and healthy proper accounting and
It acts as a benchmark for future challenge of the Company and
long-term stable business development and expansion so that the
revenue generated can be further distributed to all relevant
stakeholders.

25
Obtaining Grade A in PUMA
S.A.F.E. audit rating with score
of 96.96% in 2011
Sustaining Grade A in Technical audit
conducted by Puma for two consecutive
years with same score of 96% in 2010-
2011
All these years, we are pride of ourselves in our ability in providing Puma
the branding services it required in a cost and brand-concious manner
JIT materializes the corporation vision which focuses on top quality, cost effectiveness, excellent customer service and on time delivery in our sustainable products
Total Puma garments made 2010 – 2.11 million pieces, 2011 – 2.49 million pieces
Puma Sustainability Program 2011-2015 - Monitor the progress through E-KPI Measurement System (internet Enablon System)
Vincent Ng, Cambodian boy starts drawing World Cat
26
Economic
Economic Management Approach
Profitable growth and long-term business success ensure our commitment to
sustainable development. Transparent, honest and fair business dealing helps
position JIT to realize opportunities for our continuous growth and outperform
our stakeholders‟ expectations.
By demonstrating good governance, sensible risk taking and transparency in
communication, business continuity and expansion is most effective when it is
integrated with business processes and organizational management systems.
JIT continues allocating an appropriate proportion of its fund or profit
generated into environmental protection expenditures and investments which
we believe that the short term spending brings greater long term gains to the
Company.
GRI Report published annually is one of the many ways of JIT in providing
information regarding economic performance and market presence of the
Company.
JIT offers competitive benefits to our stakeholders which are better than that
of similar industries of the country in most cases, making it an attractive
garment manufacturer in Cambodia.
By demonstrating good governance, sensible risk taking and transparency in
communication, business continuity and expansion is most effective when it is
integrated with business processes and organizational management systems.

27
Economic Highlights
2011, Cambodia continued to be granted by European Union (EU) the privilege of Generalized
System of Preference (GSP) where all materials imported from overseas, irrespective of
countries of origin, will enjoy tax relief for buyers importing garments in EU countries.
Sales increased by 57 % from 2.90 million in 2010 to 4.55 million pieces in 2011 with more
efficient materials utilization rate and natural resources usages.
Continue using PUMA-approved environmentally friendly CHT inks for all screen printing
panels.
Deployment of Lean Manufacturing System to maintain sustainability growth and expansion as
well as making it another profitable year in 2011
Doing Business in Cambodia
Doing business in Cambodia was becoming more competitive than before d ue to the shortage of labor
and ever rising labor cost. Global rising labor and material costs, especially in China, had resulted many
foreign investors to look for alternatives for production base and selected Cambodia as one of their
choices.
Cambodia has become a popular prospect for foreign investment, with regional investors, such as China,
Malaysia and South Korea, seeking to capitalize on emerging business opportunities. Since then,
garments factories competed among each other both for skillful as well as new workers to fill up their job
vacancies.
The garment and footwear industry has been the main magnet for foreign investment since 1993.
However, in recent years, other sectors of the economy have been catching up, including tourism,
construction, telecommunication, extractive industries and exploration of mineral resources. Investment
opportunities in Cambodia are plentiful and substantial for both local and foreign investors.
It is the newest investment destination in the region especially the GSP tax privilege system strengthened
by EU.
It has become even more attractive after the Royal Government devoted more attention to strengthening
political stability and the rule of law, and mobilizing all available resources for greater economic
development. All these add to the acute labor shortage in the country.
Major Steps Taken in Sustaining Business Growth
Major steps have been taken in 2011 to check the ever increasing labor cost while striving to sustain
business growth and expansion. During the year, the Company continuously practicing Lean
Manufacturing System which focused on the following aspects:
Incoming materials and production management - Close monitoring processes on procurement,
accessories & fabric consumptions, reduce defective parts to the minimum level during production,

28
Quality – emphasis on the upgrading of quality standard
Efficiency – focus on daily productivity as well as documentation process efficiencies to increase output
and practice over shipment of finished goods if allowed by customers and
Waste Reduction – Physical and process wastes are 2 major areas where all workers have to take
steps to mitigate or eliminate them aiming at shortening lead time, improving quality and saving cost.
Non-production overheads – Tightening the expenditures by removing repetitive activities of same
nature, reduced frequency and timings and spending based on approved amount.
Requested an average 10% increase in CM price but customers only approved about 5% which was
reflected in the FOB price of the finished garments.
Some of the prominent outcomes of such implementation can be summarized as follows (refer to
Financial Overview 2010-2011 below):
Cost saving of around 4% in procurement and control of materials amounting to US$715,500,
Overheads saving by 3% amounting to US$135,100,
The balance of estimated US$850,000 was from the increased FOB price
In short, Lean initiatives implementation is inevitably one of the key factors to the success in maintaining
sustainable growth and expansion as well as making it another profitable year to JIT operation.
It‟s of great challenge to the Company as well as to all staff and workers in achieving higher target set for
2012 as the expansion actions are essential to meet the requirements and expectations of our
stakeholders.
FINANCIAL OVERVIEW OF 2010-2011
Summary of 2011 financial results by referring to Graph 3 below:
Sales
Profit
Production
Volume
In general, 2011 business was good with quite constant production
volume to fill-up the monthly capacity throughout the year
Sales orders in pieces increased tremendously by 57% and it was
able to be absorbed by production floors after successful recruitment
of workers
Increase in FOB sale price by 13% was lower than the target of 20%
set previously due to competitive selling price set by the customers
Materials
Wages
Rising material costs by 13% and labor shortage have become great
challenge to operate apparel manufacturing factory profitability in
Cambodia
When labor shortage problem existed, JIT increased basic wage
which was higher than the National minimum amount and extra
allowances to maintain the labor force resulting 28% and 22% rises
for direct and indirectly wages respectively
Uncertainty is perhaps the biggest challenge facing apparel industry in future. The economic situation in
Europe and US, swings in garment prices, acute labor shortage and rising operating costs, all add up to
a worrying year. There may be opportunities to increase productivity and reduce non-value added
activities to create competitive advantage for JIT to sustain growth and expansion in the coming years.

29
SalesProfit
MarginProfit
Raw Materials
Direct Wages
Indirect wages
Sales in million pieces
Total workforce
Percentage 13% 62% 82% 13% 28% 22% 57% 28%
13%
62%82%
13% 28% 22%57%
28%
0%
50%
100%
Per
cen
tage
Major Corporate & Financial Ratios2010 V.S. 2011
Graph 3: Revenue and its Distribution
Note: For more details, please refer to Table B in Appendixes.
Comparison of Business Forecast and Actual Outcomes By comparing the targets set in the first GRI Report, 2010, Graph 4 displayed the forecasted figures
against actual outcome of the financial situation:
Sales volume was 6% short of
forecasted figure due to the actual
average FOB price slightly lower than
expected. Forecast sale in 2012:
US$30 million (2010: US$28.5
million) increased by 5%
Economic value retained (profit)
slummed by 40% mainly due to rising
direct and indirect labor cost and
partially due to rising material cost.
Forecast labor cost in 2012: 25% of
Turnover (2011: 24%)
Sales in pieces shot up by 34% due
to GSP (Generalized System of
Preference by EU) effect. Forecast
manufacturing pieces in 2012: 5.5
million pieces, (2011: 4.55 pieces)
22% increase.
Due to expansion of 10 sewing lines.
More manpower was needed. JIT
expects to maintain same number of
workers in 2012 (2011: 3,200
workers)
Graph 4: 2011 Business Forecast Vs. Actual
Sales ProfitSales in pieces Workforce
Percentage -6% -40% 34% 18%
-50%
-40%
-30%
-20%
-10%
0%
10%
20%
30%
40%
Per
cen
tage
2011 Business Forecast V.s. Actual Expenditure

30
Market Presence & Localization of Manpower The balance between the employment of right people and machinery is one of the fundamental principal if
one Company wishes to carry out its production efficiently. The Recruitment Procedure emphasizes on the
prioritization in selection of local citizens during new intake process with no racial and gender
discrimination.
We continue strengthening the collaboration between stakeholders, especially the local community where
most of our workers stay in so that they are able to work in JIT factory as near to their residences as
possible
In addition, JIT has gained confidence from the renowned buyers to be the strategy supplier in this respect
which is also in line with the government objective to prioritize local citizens in the recruitment process.
Graph 5 displays workforce diversification as at 31-Dec-2010 & 2011 in the Company
Khmer workers have increased by 1.32%, representing 716 employees whereas expatriates reduced
slightly from 96 to 84 persons. The company management was confident that the trend of hiring local
supervisors and middle management level personnel was positive and in lined with the Ministry of Labor
who represents the governmental body in ensuring fair recruitment process is being exercised and fully
support in searching of local manpower.
Despite the fierce manpower recruitment competition both from existing and new factories surrounding
JIT, statistical data showed that 78% of the total workforce remained working with us after one year of
development. Many approaches have been applied by HR Department with the assistance of Head of
Departments to upgrade the skill and competence level of employees
BY providing trainings and disseminating relevant knowledge, skill and techniques to the exiting workers,
some new faces were being promoted to the managerial level. They have shown their capabilities in their
respective fields of expertise. This reflects the eagerness of the Senior Management to localize workers
working in management positions.
2010 2011
Khmers 96.18% 97.50%
Chinese 2.46% 1.35%
Malaysians 0.96% 0.82%
Filipinos 0.32% 0.27%
Hongkies 0.08% 0.03%
Indonesian 0 0.03%
0%20%40%60%80%
100%120%
Per
cen
tage
Graph 5 -Workforce by Nationality2010 - 2011
Khmers
Chinese
Malaysians
Filipinos
Hongkies
Indonesian

31
In general, there are some improvements in localization of management posts. The Company plans to
increase at least one local manager in 2012
Graph 6 below shows a promising result, especially the supervisory and technical level locals with 78% and
334% improvements respectively. The Ministry of Labor encourages the Company continues training local
workers in order to take up the posts previously occupied by expatriates such as HOD (Head of
Department), executives, supervisors and leaders
6: Workforce by Employment Type at 31-Dec-2010 & 2011
Note: For more details, please refer to Table C in Appendixes.
Total Environmental Protection Expenditures and Investments by Type and Reinvestment
JIT has numerous environmental protection projects in hand since its incorporation in 2007. By tracking
and analyzing the expenditures and investments over a period of time, these data allows us to judge the
value of complex organizational or technological investments for improving environmental performance.
The Sustainability Advisory Committee and our Finance and Accounts Department have developed a set of
environmental management accounting system that tracks multiple categories of information including
reinvestment strategy. Both parties review the progress of the projects on a yearly basis and decide what
should be done for the following years.
This indicator focuses on waste disposal, emissions treatment, remediation costs, as well as prevention
and environmental management costs. Pictures shown on next page are some of the environmental
protection initiatives carried out in JIT and the details on the categories and benefits are disclosed in
Tables D & E in the Appendixes.
Managerial Supervisory Technical Clerical Operational Sub-total
Percentage 0% 78% 334% 33% 14% 30%
0%
50%
100%
150%
200%
250%
300%
350%
400%
Per
cen
tage
Workforce by Employment Type Ratio31-Dec-2010 V.s. 2011

32
1. Spiral staircase 2. Cooling System - 3. Aboveground Water 4. “Totoo” car
sliding slope Water Curtain Tanks
Benefits
The accumulated net financial benefit from 2007 to 2011 as shown in Graph 7 below was US$113,400
(Saving US$299,100 - Investment/Expenses US$185,700) and the balance can be utilized for future
improvements especially in renewable energy investment.
While we believe that our collective commitment to environmental initiatives, we continue our investments
so that benefits to employees and JIT factory is greater from the past.
Graph 7: Expenditure and Investments Vs. Savings and Re-investment Summary
Note: For more details, please refer to Tables D & E in the Appendixes.
Expenses mentioned in Graph 7 include prevention and environmental management costs, regulatory
treatment and testing costs but excluding fines for non-compliance with environmental regulation.
2007 2008 2009 2,010 20112012 ( Foreca
st )
Balance B/F 0 -29,800 5,700 24,500 60,800 113,400
Investment/ Expenses US$ 66,900 11,400 43,600 31,200 32,600 113,400
Saving US$ 37,100 46,900 62,400 67,500 85,200 93,500
Balance C/F -29,800 5,700 24,500 60,800 113,400 93,500
-40,000
-20,000
0
20,000
40,000
60,000
80,000
100,000
120,000
140,000
USD
Year
Expenditure & Investment V.s. Saving and Reinvestment2007 - 2012
Balance B/F
Investment/ Expenses US$
Saving US$
Balance C/F

33
2012 Improvement Projects
JIT reinvests on environmental protection projects from the surplus
generated from the current practice. As the effort to protect the
environment is an endless process, we take the initiatives to
continuous meet or exceed all the environmental legislation that
relates to the Company:
Renewable energy- solar generated lights as street lights for
exterior space,
Re-invest in cooling system as the fixture has reached the full
5 years of depreciation,
Replacing polybags with fabric bags to store cut-panels in
Cutting Section.
Significant Fines and Non-Monetary Sanction The level of non-compliance within the organization helps to
indicate the ability of management to ensure that operations conform to certain performance parameters. From an economic perspective, ensuring compliance helps to reduce financial risks that occur either directly through fines or indirectly through impacts on reputation.
The strength of an organization‟s compliance record can also affect
its ability to expand operations or gain permits. The strength of an
organization‟s compliance record can also affect its ability to
expand operations or gain permits.
Transparency in reporting encouraged JIT to report fines and non-
monetary sanctions in terms of the focus of laws. Since its
incorporation in 2007, JIT has not identified any non-compliance
with laws or regulations therefore no monetary fines or non-
monetary sanctions being imposed by any party so far.
Significant fines for non-compliance with laws and regulations concerning the provision and use of products and services. In order to avoid fines in respect to this section, all Head of
Departments are taking charge of the relevant statutory and
regulatory compliances by closely monitoring to ensure full
compliance at all times.
Similarly, JIT has not identified any non-compliance with laws or
regulations concerning the provision and use of products and
services therefore no monetary fines being imposed by any party
so far since 2007

34
Social
Social Management Approach JIT regards itself as an active member of the society so that we are committed to
acting in the best interests of our employees and the community people who live
and work near our Factory. After all, we benefit from highly motivated and well-
qualified employees, satisfied customers and good relations with our stakeholders
that are based on mutual trust.
To be a responsible corporate entity, we create value for society and all employees
in the best practice of:
JIT is committed to providing a happy, safe and healthy working environment for
all employees. We constantly engage and develop our employees to the full
extent by providing a diverse and equal work opportunity to them in order to
attract and retain the best individuals for our continuous growth,
JIT helps employees in need through our “Jouy K‟nier” (“Self-Help” in Khmer)
donations and focus on the top priorities of the country – healthcare and
education,
JIT constantly conducts open and constructive dialogue with our communities
relating to economic, social and environmental aspects and impacts,
JIT does not discriminate on the basis of gender, ethnicity personal
characteristics or belief and
JIT is not involved in activities including child labor forced labor, discrimination
and other activities that it believes are ethically questionable.

35
Social Highlights
Employee population of 3,200 staff and workers, of which 97.5% are Khmers meaning
providing employment to local citizens
Successfully recruited additional 700 workers in 2011 despite the acute labor shortage
situation in Cambodia
Continuous trainings to ensure that our industry has access to well-trained and competent staff
and workers to keep pace of ever increasing quality demand of buyers. 2010: 1,987 and 2011:
2,133 employees trained
Met Minimum National Minimum Wage but imbalance did exist in the highest basic pay by
employee type by gender
Cost savings in Quality Inspection System by Customer Certified Internal Quality Auditors and
localization of manpower
Cambodia National Minimum Wage
Cambodia has a government-mandated minimum wage where no worker in Cambodia can be paid less
than this amount. Labor is one of the most important resources of the Company. By reflecting our sound
labor policy, JIT continuously provides trainings to upgrade the skill, techniques, education and counseling
to our employees.
We respect employees as our strategic internal partner and collaborate closely with them. We care of them
through wage, incentives and benefit payments which are above the Cambodia minimum wage standard
as one of many moves to re-affirm their contributions.
Graph 8 shows that the minimum wage per month increased by 23% within one year and this became the
major economic impact to the Company.
Graph 8: Comparison of Monthly Minimum National Wage 2010-2011
61
5 5 0 0
7161
7 8 5 6
87
0
20
40
60
80
100
Basic Salary Attendance Allowance
Seniority Allowance
Health Care Allowance
Transport Allowance
Total
USD
Comparison of Monthly Minimum National Wage2010-2011
2010
2011

36
Graph 9: Rate of Revenue Distribution 2010-2011 From the data shown in Graph 9 above, nearly one quarter 24.1% (2010: 21.5%) of the revenue generated
is used to pay off employees‟ wages and related benefits. Even though the basic wage increased by 23%
when compared to last year value, the proportion of direct wage against total turnover shot up by 2.3% only
partly due to the efficient production processes resulting greater output with less overtimes.
The average take-home pay of local employees has gradually increased throughout the year, showing a
positive trend of distribution of direct economic value generated from the Company to them. They are
valuable resources of the Company not only meeting the production efficiency but also fostering a culture
of continuous upholding quality standard of the finished goods.
In return, the average take-home pay including OT increased by 10% in Dec-2011 (US$150) when
compared to Dec-2010 (US$137).
The government of Cambodia periodically reviews the minimum national wage of employee to ensure the
amount of take-home pay is sufficient to cover the living expenses of the employee. In general, it would
consider and adjust the minimum wage or other wage-related benefits level in every four (4) years‟ interval
and the next round of such increment is expected to be in 2013 when Cambodia is having its National
Election.
Labor Turnover In order to remain competitive in human resource management, JIT has targeted an average employee
turnover rate of less than 4% this year and fortunately we managed to achieve it at 3.64% as per Graph 10
below.
54
.50
%
17.1
0%
4.40
%
0.10
% 21.2
0%
1.3
0%
0.80
%
99.4
0%
0.60
%
54
.50
%
19.4
0%
4.70
%
0.10
%
18
.40
%
1.20
%
0.70
%
99%
1.00
%
0%
20%
40%
60%
80%
100%
120%
Rate of Revenue Distribution ( Based on Sales 100%)2010 - 2011
2010 2011
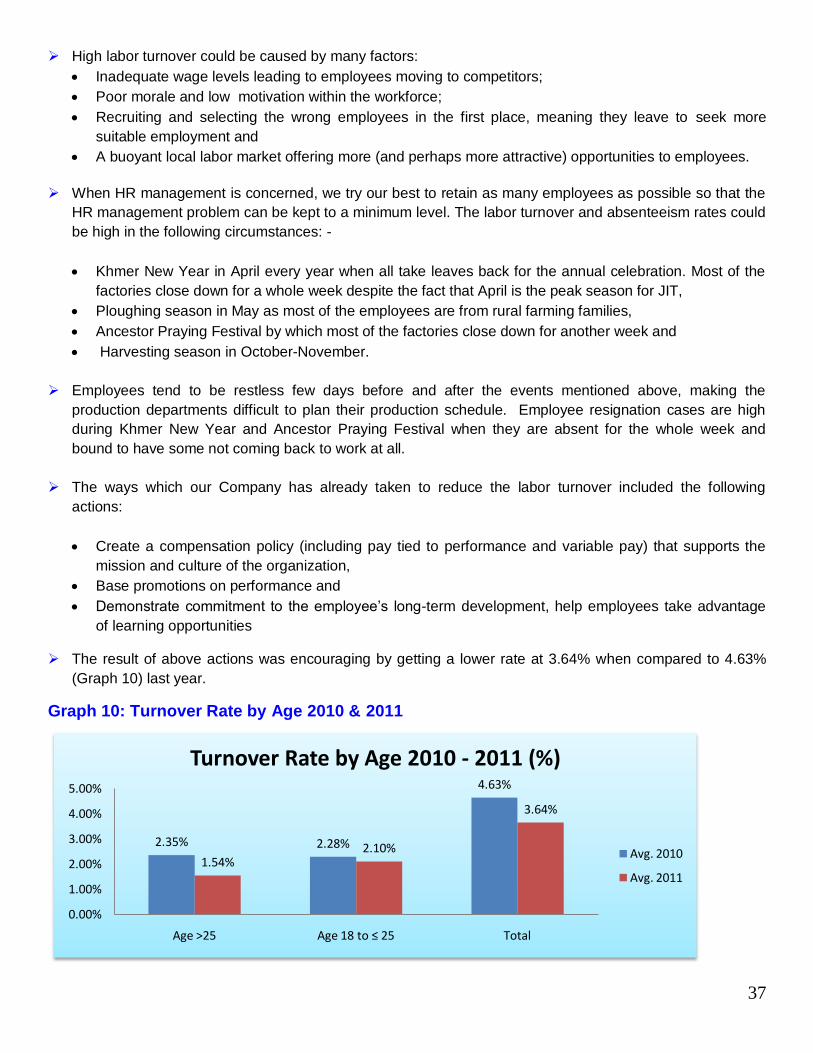
37
High labor turnover could be caused by many factors:
Inadequate wage levels leading to employees moving to competitors;
Poor morale and low motivation within the workforce;
Recruiting and selecting the wrong employees in the first place, meaning they leave to seek more
suitable employment and
A buoyant local labor market offering more (and perhaps more attractive) opportunities to employees.
When HR management is concerned, we try our best to retain as many employees as possible so that the
HR management problem can be kept to a minimum level. The labor turnover and absenteeism rates could
be high in the following circumstances: -
Khmer New Year in April every year when all take leaves back for the annual celebration. Most of the
factories close down for a whole week despite the fact that April is the peak season for JIT,
Ploughing season in May as most of the employees are from rural farming families,
Ancestor Praying Festival by which most of the factories close down for another week and
Harvesting season in October-November.
Employees tend to be restless few days before and after the events mentioned above, making the
production departments difficult to plan their production schedule. Employee resignation cases are high
during Khmer New Year and Ancestor Praying Festival when they are absent for the whole week and
bound to have some not coming back to work at all.
The ways which our Company has already taken to reduce the labor turnover included the following
actions:
Create a compensation policy (including pay tied to performance and variable pay) that supports the
mission and culture of the organization,
Base promotions on performance and
Demonstrate commitment to the employee‟s long-term development, help employees take advantage
of learning opportunities
The result of above actions was encouraging by getting a lower rate at 3.64% when compared to 4.63%
(Graph 10) last year.
Graph 10: Turnover Rate by Age 2010 & 2011
2.35% 2.28%
4.63%
1.54%2.10%
3.64%
0.00%
1.00%
2.00%
3.00%
4.00%
5.00%
Age >25 Age 18 to ≤ 25 Total
Turnover Rate by Age 2010 - 2011 (%)
Avg. 2010
Avg. 2011

38
Turnover Rate by Age Group
The turnover rate by age for aged group >25 was improving by reducing from 2.35% to 1.54% in Graph 10
above, mainly due to the fact that, from the Employee Survey Feedback, the majority of this age group
enjoyed a fairly constant monthly income therefore decided to stay back and continued working.
There were 21% of the employees who left the Company but joint back after a short period of time outside
and some of the reasons why they preferred JIT were the good working condition and prompt payment of
salary.
Graph 11: Turnover Rate by Region 2010-2011
Turnover Rate by Region
JIT is located in Kandal province which is about 20 KM from Phnom Penh city and the origin of the
employees can be classified as coming from:
Phnom Penh city
Kandal province
out of Kandal province
Employees from “Out of Kandal” region represented the highest rate of labor turnover.
Cambodia has never exported rice to any overseas countries until very lately when China bought 100 tons
from the Ministry of Agriculture at the end of 2011. Very recent news talked about Japan and EU is
interested in importing rice from Cambodia too meaning the prospect of agriculture is bright and promising.
If those countries open up their markets for this commodity, more workers will shift their jobs to agricultural
sectors. From the trend of 1.92% in 2010 increased to 2.65% in 2011 (Graph 11) could more or less
confirm that such employment shift was becoming more and more obvious.
1.00%
1.72%1.92%
4.63%
0.25%
0.74%
2.65%
3.64%
0.00%
0.50%
1.00%
1.50%
2.00%
2.50%
3.00%
3.50%
4.00%
4.50%
5.00%
Phnom Penh city Kandal province Out of Kandal Total
Turnover Rate by Region 2010 - 2011 (%)
Avg. 2010
Avg. 2011

39
Graph 12: Turnover Rate by Gender 2010 & 2011
Turnover Rate by Gender Graph 12 shows that male workers turnover rate was as low at 0.49% (2010: 1.81%) because they did not
have many choices in career opportunities as most of the garment factories were monopolized by female counterparts.
Once they got to be employed, they tended to be more loyal to their employers, feeling that getting a job in garment factory weren‟t an easy chance at all.
Trainings to Employees Since 2009, JIT set up CCS Academy Center for the purpose of upgrading the skill, techniques and
education standard for employees. The reasons of providing a verity of training to employees are:
When a performance appraisal indicates performance improvement is needed;
As part of an overall professional development program;
To “benchmark‟ the status of improvement so far in a performance improvement effort;
As part of succession planning to help an employee be eligible for a planned change in role in the
organization;
To “pilot”, or test, the operation of new performance management system;
To train about a specific topic (e.g. safety training is critical where working with heavy equipment,
hazardous chemical, repetitive activities, can be useful with practical advice for avoiding assaults).
The CCS Academy Center is monitored by the Training Committee consisting of 7 trainers appointed by
management to take charge of the training management throughout the year.
The Committee meets on monthly basis to formulate the Policy, Mission and Objectives of the trainings
including related functions like Program Development, Quality Control, Course Management and Training
Specialists. The Committee not only handles internal trainings but also needs to liaise with external
consultants to meet the training targets.
1.81%
2.82%
4.63%
0.49%
3.15%
3.64%
0.00%
0.50%
1.00%
1.50%
2.00%
2.50%
3.00%
3.50%
4.00%
4.50%
5.00%
Male Female Total
Turnover Rate by Gender 2010 - 2011
Avg. 2010
Avg. 2011

40
The general benefits derived from employee training and development includes:
Increased job satisfaction and morale among employees;
Increased employee motivation;
Increased efficiencies in processes, resulting in financial gain;
Increased capacity to adopt new technologies and methods;
Increased innovation in strategies and products; Reduced employee turnover;
Enhanced company image;
Risk management.
The approach to collect training needs were similar to previous years where CI (Continuous Improvement)
Department started collecting all training needs forms from each department, complied and tabled for
Sustainable Advisory Committee meeting and approval. Basically, the trainings can be classified into 2
major categories:
Internal training – These trainings are conducted by internal trainers appointed by the management in
their respective fields of expertise. On average, there are 20 participants in each class for 1-2 hours of
training per session. Courses covers Fire Drill, Fire Fighting & Safety, QA/QC Inspections,
Occupational health and safety, Admin on local laws & regulations, Lean & Compliances with handouts
prepared internally or extracted and summarized from governmental bodies, clients manuals &
standards and consultants‟ handouts and
External training - This includes external consultations covering topics from governmental bodies like
local laws and regulations enforcement, fire prevention and precaution lessons from fire brigade
department, Lean fulfillments, ISOs and clients‟ Compliances.
Both internal and external trainings include shop floor practical exercises.
Graph 13: Training Needs Analysis 2010 & 2011
Fire Drill & Safety
Admin LeanComplianc
e & SEAHR ISO 9001 QC Total
2010 Internal Approved 12 0 200 10 0 0 0 222
2010 External Approved 16 66 60 44 8 56 72 322
2011 Internal Approved 16 6 160 40 0 0 0 222
2011 External Approved 14 85 48 60 20 30 85 342
050
100150200250300350400
Ho
urs
Training Needs Analysis 2010 - 2011 (Hours)

41
In 2011, the total approved training course was 564 hours in Graph 13 (2010: 544) against 596 budgeted
hours (2010: 675). The total approved hours in these two years remained quite constant but hours
approved for various departments varied quite considerably as those needs were necessary to meet
customers, regulatory bodies as well as internal requirements.
From Graph 14, the budgeted external training fee of US$20,000 in year 2011 (2010:19,000) has almost
spent up at US$19,800 for external trainers. On the other hand, according to the assumption that the free
charged by internal trainers was US$10.00 per hour (2010: US$6/hr), the actual internal training cost was
US$2,800 (2010: US$1,750).
Graph 14: Training Budget vs. Actual Spending 2011
Throughout the year, the average hours of training per year per employee in 2011 were 5.79 hours (2010:
6.89 hours) as per Graph 15 shown below.
From the data, some 33% (2010: 25%) of the total employees are not trained by us due to the following
reasons:
Joining and resigning the Company before getting a chance to be trained and
Certain categories of workers are not taking into consideration due to budgetary constraints.
The net intake of 700 workers has widely distributed to various departments meaning the chance to get
training is lower than before.
Benefit derived from the training was around US$60,000 in 2011 (2010: US$50,000).
In view of the drawbacks, several steps which include hiring additional 3 local trainers and providing more
relevant topics have been taken to widen the scope of trainings so as to cover wider categories of workers.
The Company plans to maintain at least average 5 hours of training per year per Employees by Employee
Category in future.
Internal Training External Training Total(US$)
Actual 2,800 19,800 22,600
Budget 2,000 20,000 22,000
-5,000
10,000 15,000 20,000 25,000
US$
Training Budget vs Actual Spending 2011
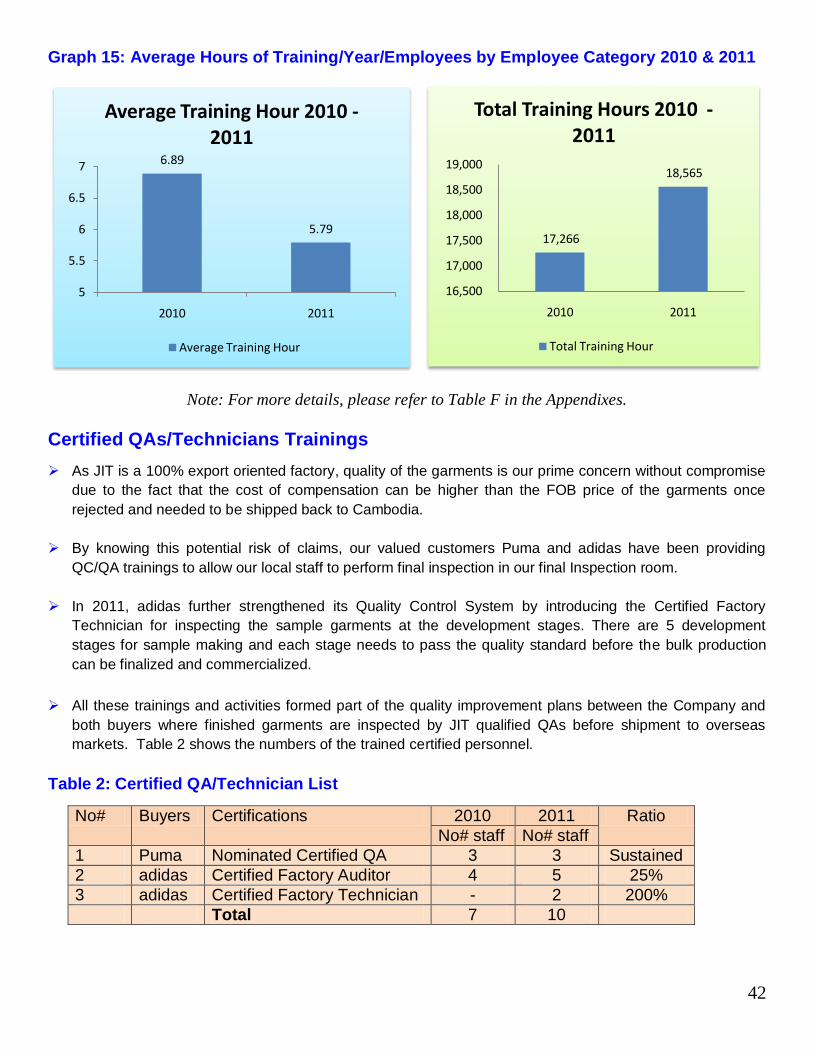
42
Graph 15: Average Hours of Training/Year/Employees by Employee Category 2010 & 2011
Note: For more details, please refer to Table F in the Appendixes.
Certified QAs/Technicians Trainings
As JIT is a 100% export oriented factory, quality of the garments is our prime concern without compromise
due to the fact that the cost of compensation can be higher than the FOB price of the garments once
rejected and needed to be shipped back to Cambodia.
By knowing this potential risk of claims, our valued customers Puma and adidas have been providing
QC/QA trainings to allow our local staff to perform final inspection in our final Inspection room.
In 2011, adidas further strengthened its Quality Control System by introducing the Certified Factory
Technician for inspecting the sample garments at the development stages. There are 5 development
stages for sample making and each stage needs to pass the quality standard before the bulk production
can be finalized and commercialized.
All these trainings and activities formed part of the quality improvement plans between the Company and
both buyers where finished garments are inspected by JIT qualified QAs before shipment to overseas
markets. Table 2 shows the numbers of the trained certified personnel.
Table 2: Certified QA/Technician List
No# Buyers Certifications 2010 2011 Ratio
No# staff No# staff
1 Puma Nominated Certified QA 3 3 Sustained
2 adidas Certified Factory Auditor 4 5 25%
3 adidas Certified Factory Technician - 2 200%
Total 7 10
6.89
5.79
5
5.5
6
6.5
7
2010 2011
Average Training Hour 2010 -2011
Average Training Hour
17,266
18,565
16,500
17,000
17,500
18,000
18,500
19,000
2010 2011
Total Training Hours 2010 -2011
Total Training Hour

43
Localization of Supervisory Level Employees
Another remarkable improvement in HR management, besides the workforce by employment type in Graph
6 on Pg 27 as mentioned in Economic Section earlier, is the localization of supervisory level employees
comprising executives, supervisors and leaders (sewing, QC/QA, cutting, ironing & packing).
Previous years showed quite a number of expatriate supervisors taking charge of the production sections
owing to lack of skill and techniques in handling supervisory tasks by local Khmers. Another reason in
scaling down the number of expatriates was the ever increasing labor cost faced by the Company when
employing those incurring additional expenditures such as visa, meal & accommodation, travelling and
work permit which could be totally omitted when they were replaced by locals.
This year, management and HODs (Head of Department) continued conducting intensive courses to
upgrading the management skill and techniques of local potential employees into the daily operation of
their respective departments. After one and a half year of continuous improvement activities, the results are
shown in Graph 16 below:
Graph 16: Localization of Employees (Supervisory Level)
JIT promoted additional 8 totaling 20 supervisor level local personnel in 2011 (2010: 12 persons),
representing 66% increment. On the other hand, the number of expatriates has been reduced from 15 to 12 persons.
As the total saving of US$24,000 was the result of localization of employee practices in 2011 (2010: US$52,000), we continued providing trainings to upgrade the skill, techniques and working experiences of locals so that they were capable of taking over the tasks handled by expatriates eventually.
2010 2011 2010 2011 2010 2011 2010 2011
Supervisors Sample cutting leaders QC leaders - Sewing QC leaders - Cutting
Expatriates 12 10 1 1 2 1 0 0
Local employees 3 7 2 5 5 6 2 2
3
7
25 5 6
2 2
12
10
1
1 2 1
0 0
0
2
4
6
8
10
12
14
16
18
Axi
s Ti
tle
Localization of Employees 2010 - 2011

44
Equal Remuneration for Women and Men Many countries have introduced legislation to enforce the principle of equal pay for work of equal value.
Cambodia government enforced this principal so that all employers pay their employees not less than the
minimum national wage level set by the government.
Equality of remuneration is a factor in retaining employees in the workforce. Where imbalances exist, an
organization runs a risk to its reputation and legal challenges on the basis of discrimination.
Graph 17: Cambodia Monthly Minimum National Wage 2010-2011
Except the transport allowance of US$6 which JIT pays as an additional fringe benefit, Graph 17 above
shows the minimum wages and allowances that JIT pays to each of the employees.
From the payroll record, JIT met the minimum wage and allowances requirement for both years, meaning
the ratio of basic salary paid to male and female workers is 1:1
However, by referring to the highest basic salary obtained in each category of employee, the ratio differs in
each of them except mechanic (US$86) and cartonning (US$81) production staff and workers as per Graph
19 shown below. For zero value in the Graph indicating no particular gender took up the posts in respect of
the posts.
Production Staff
In general, the ratio of highest basic salary obtained for female to male is 56.43% against 43.57% or in 1.3:
1 ratio (Graph 18) which meant that imbalance did exist in our Company for both genders in the same job
position.
61
5 50 0
71
61
7 8 5 6
87
0
10
20
30
40
50
60
70
80
90
100
Basic Salary (US$) Attendance Allowance (US$)
Seniority Allowance (US$)
Health Care Allowance (US$)
Transport Allowance (US$)
Total (US$)
Monthly Minimum National Wage 2010 - 2011
2010 2011

45
Graph 18: Ratio of Highest Pay of Production Staff by Gender by Employment Type 2011
Note: For more details, please refer to Table G in the Appendixes.
Production Workers
Same scenario happened in production workers where the ratio of highest basic salary obtained for female
to male is 56.68% against 43.32% or in 1.3: 1 ratio (Graph19 ) and the reasons of such differences for both
genders existed in the same job position are as follows:
Different working experiences of workers,
Number of years of services,
Slight differ in job description and responsibility,
The numbers of sub-ordinates under his/her supervision,
Academic qualification and
The result of yearly competency appraisal.
Graph 19: Ratio of Highest Pay of Production Workers by Gender by Employment Type 2011
Note: For more details, please refer to Table H in the Appendixes.
Cutting CTN FinishingMechani
cQA QC QFI Sample
Warehouse
Sewing Sub-total
Female 100 47.51 50.17 0 46.15 100 100 63.71 47.85 57.36 56.43
Male 0 52.49 49.83 100 53.85 0 0 36.29 52.15 42.64 43.57
0
20
40
60
80
100
120
pe
rce
nta
ge (%
)
Ratio of Highest Pay by Production Staff Category of 2011
Cutting Ironing Packing GAMecha
nicQA QC CTN
Warehouse
Sewing SampleSub-total
Grand Total
Female 44.2 51.37 100 33.44 50 100 100 50 48.59 100 57.81 57.13 56.68
Male 55.8 48.63 0 66.56 50 0 0 50 51.41 0 42.19 42.87 43.32
0
20
40
60
80
100
120
per
cen
tage
(%)
Ratio of Highest Pay by Production Workers Caterogy of 2011

46
Future Plans
In order to mitigate the situation of such imbalance in highest salary, JIT has taken the following steps for
both genders:
Offering same job description and responsibility,
Narrowing the gap between working skill & techniques and qualification by providing relevant trainings
and supervision.
Balancing the numbers of sub-ordinates under his/her supervision
Even though JIT cannot pay equally as so long as the highest basic pay is concerned in near future, a
targeted ratio for 2012 is 55% against 45% (or 1.22:1 ratio) for female and male respectively.
Injury, Occupational Diseases, Lost Days, Absenteeism and Work-related Fatality
Health and safety performance is a key measure of an organization‟s
duty of care. Low injury and absentee rates are generally linked to
positive trends in staff morale and productivity.
Good health and safety management practices resulting in fewer
occupational health and safety incidents is one of the most
fundamental objectives of the Company.
JIT recorded all cases, in accordance to the requirements set by the
Ministry of Labor, of injury, occupational diseases, lost days,
absenteeism and work-related fatality on a daily basis for total
workforce of the Company plus the independent contractors working
on-site to whom we are liable for the general safety of the working.
Basis of Calculations
We base on calendar days to calculate our Injury Rate (IR), Lost Day
Rate (LDR) and Absentee Rate (AR).
Lost days refer to the hours that could not be worked (and is thus „lost‟)
as a consequence of a worker or workers being unable to perform their
usual work because of an occupational accident or disease.
The lost day count begins when the total number of hours in a single
period is 4 hours and above which we consider a half day lost.
A return to limited duty or alternative work for the same Company does
not count as lost day.
Common Injuries
Common Missed Cases
Sewing machine needles poking fingers
Scissors hurting feet
Goods Fallings
Falling down due to goods obstructing walkways
Ways to Reduce Injury
Practicing safety moment to all employees factory wide
Strictly follow SOP (Standard Operation Procedure) and WI (Work Instruction) in workplace
Continuous Improvements in potential hazardous workplace and activities
Continuous trainings on safety issues

47
Statistical Facts
Injury Rate (IR)
IR data shown on the left remained quite constant in both
years 2010 and 2011 at 1.58 and 1.57 respectively
On average, there were 4 injuries cases per month, almost
all on sewing machines‟ needles poking fingers, which were
considered high
Throughout the year 2011, 48 cases all on female workers
were recorded (2010: 51 cases) with 47 minor injuries on
needles poking fingers and 1 case on scissors poking foot
of sewing operators.
Note: For more details, please refer to Table I in Appendixes.
Lost Days Rate (LDR)
LDR data shown on the right was worsen especially to male
workers because JIT recruited additional 300 male workers
in 2011 whose working attitudes and disciplines were not up
to the expected level
On average, the LDR rate of male worker is 58 compared to
38 in 2010, representing 52% higher than last year
The average LDR for female worker was also higher by
22% when compared to last year figure (2011: 33 & 2011:
27), mainly due to lost days from sewing section
Note: For more details, please refer to Table J in Appendixes.
Absentee Rate (AR)
AR data shown on the was deteriorating especially to male
workers with the same reasons in LDR mentioned above
On average, the AR rate of male worker is 468 compared
to 303 in 2010, representing 54% higher than last year
The average LDR for female worker was also higher by
21% when compared to last year figure (2011: 263 &
2011: 216), mainly due to lost days from sewing section
Note: For more details, please refer to Table K in the Appendixes.
Occupational and Fatality Rate
There was no occupational disease and work-related fatality reported by our HR Department during the year.
1.58 1.57
0
0.5
1
1.5
2
2010 2011
Injury Rate of 2010 - 2011
Injury rate (Female) Injury rate (Male)
27 3338
58
0
20
40
60
80
Lost Day Rate (Female)
Lost Day Rate (Male)
Per
son
s
Lost Day Rate of 2010 -2011
2010 2011
216263
303
468
0
100
200
300
400
500
Absentee Rate
(Female)
Absentee Rate (Male)
Per
son
Absentee Rate of 2010 -2010
2010
2011

48
Freedom of Association or CBA (Collective Bargaining Agreement)
Years 2010 2011
Labor Union member s 2,140 2350
Total no# of workers 2,506 3,206
Percentage 85.40% 87.92%
Labor Union Membership Record 2010-2011
In accordance to the explanation in GRI guidelines, inherent in the right to freedom of association and
collective bargaining is the protection of the right of workers (and employers) to organize collectively in
organizations of their own choice.
Freedom of association is the individual right to come together with other individuals and collectively
express, promote, pursue and defend common interests. The right to freedom of association has been
included in the Cambodia national constitutions and human rights instruments.
Freedom of association in the sense of workers' right to organize is also recognized in JIT and it also
protects collective bargaining in the conventions on freedom of association.
Labor Union
The labor union named United Labor Union is legally
recognized as representatives of workers in JIT. Their activities
today cantered on collective bargaining over wages, benefit,
and working conditions for their membership, and on
representing their members in disputes with management over
violation of contract provisions
HR Department reported that, 87.92% (2010: 85.4%) of the
employees from the Company joined the Union which
represents the nominated union having CBA (Corrective
Bargaining Agreement) with JIT
Shop Steward Committee
Shop Steward Committee acts as representative of employees from all department of the JIT
It works hand in hand with the Union on matters relating to human resources, working conditions,
occupational health and safety and in negotiation with JIT for the better benefits of the employees in the
Company
…
Significant Risks By knowing the fact that operations identified in which the right to exercise freedom of association or
collective bargaining may be at significant risk, firstly JIT took the initiative to identify significant risks
associated with the freedom of association and subsequently approaches were developed to mitigate
them
Union members 2010: 2,140 (85.45%) 2011: 2,350 (87.92%) of total workforce

49
1. Wage Effect Risk
Challenge
Labor Unions always demand higher wages,
shorter hours and more extensive fringe benefits or
allowances. This may bring the side-effect of
increasing cost for employers, direct effect on
consumer process which can cause the firm to lose
customers
Opportunity
We apply production management system
effectively to ensure higher portion is tie up with
productivity output.
The higher the output, the greater the incentives
will be rewarded to individuals as well as to the
group
2. Working Condition Risk
Challenge
Labor Union with their legal right to strike and enter
into collective-bargaining agreements which can
ensure that business maintains safe and equitable
working conditions
Opportunity
JIT always complies with all applicable
environmental laws and regulations in respect of
protecting the environment and maintains
effectively. This is essential to provide a safe and
healthy working environment to the employees of
the Company
3. Productivity Effect Risk
Challenge
Union identifies itself as “progressive” politically by
claiming that union workers exhibit greater level of
productivity than their non-union peers
Opportunity
Again productivity is always tie-up with actual good
quality output and the JIT treats every worker fairly
and pays incentives in accordance to the actual
performance
4. Investment Effect Risk
Challenge
A portion of the return from investment must be
shared with union employees
Opportunity
Educate Labor Union on the legal status of
“Separate and legal entity” to a Company, meaning
any investment return belongs entirely to JIT
JIT Actions Taken to Support These Rights In order for all employees to have the equal right to exercise freedom of association or collective bargaining,
JIT management allows them:
To form their own unions, selection of their own union committee members and shop stewards
To express, promote, pursue and defend their common interests without interference.
In addition, JIT also supports these rights across the organization‟s range of operations. The Company sets up:
Employee Survey Procedure
Employees‟ Suggestion System (ESS) as channels for the employees to furnish constructive suggestions, dialogue and discussion with the management.
JIT supports these rights across the Company in the following ways: -
Setting up Labor Union and Shop Stewards Meeting Rooms for their related activities and
JIT does not interfere into their activities as long as they carried out in a legal manner.
To take a balance between JIT and labor: Our company has figured out the better way to make the most goods at the lowest cost while employees work safely and happily, often in the best interest of the health and working condition.

50
Risks and Elimination of Child Labor
Social Responsible Conduct
In accordance to the explanation in GRI guidelines, the
abolition of child labor is a key principle and objective of major
human rights declarations and legislation, and is subject to ILO
Conventions 138 and 182.
The presence and effective implementation of policies on child
labor are a basic expectation of socially responsible conduct
Children should go to school to pursue their education. Employment of children in any work that deprives
children of their childhood interferes with their ability to attend regular school, and that is mentally,
physically, socially or morally dangerous and harmful.
Risks in Recruiting Child Labor
During recruitment process, our HR Department is facing the potential risk of employing child labor or
young workers. By having a governance structure that facilitates realistic strategies and responses to the
management of child labor and its right, we are aware of our management responsibility, risk management
system and internal control processes to check the possible occurrence of employing under aged labor.
The risk associated with employment of child labor and young workers:
Employment of such group is illegal in the eyes of law. However, they still serve a major contribution to
the family income in developing country even though they are not well paid off
In the situation where there is inaccessibility of schools or the lack of quality education which spurs
parents to enter their children in more profitable pursuits, they encourage employment of their children
in young age
Working children are the object of extreme exploitation in terms of toiling for long hours for minimal pay
. Actions Taken to Resolve Child Labor Problem In order to resolve the problems of child labor, our Company takes the following actions: -
Prevention of any form of child labor intake. Only workers with legal and genuine documents of any two
of these: Identity Card, Birth Certificate, Cambodia Family book and Election Cards will considered for
intake,
Sustain the minimum age standard. Our Company complies the legislative law in this respect by
recruiting workers aged 18 or above
Setting a clear guideline in relation to recruitment practices
To be responsible in eliminating child labor
By summarizing our stand in child labor issue, JIT is not involved in activities including child labor, forced
labor, discrimination and other activities that it believes are ethically questionable.

51
Forced or Compulsory Labor
Social Responsible Conduct
In accordance to the explanation in GRI guidelines, not to be
subjected to forced or compulsory labor is considered a
fundamental human right and is a provision of the UN
Universal Declaration of Human Rights and subject to ILO
Core Conventions 29 & 105.
This type of labor can exist in a variety of forms and the data
provided will indicate the reporting organization‟s challenges
in contributing to the abolition of forced and compulsory labor.
Possibility of Force and Compulsory Labor
HR Department constantly involve in checking and monitoring the possible act of forced or compulsory
labor in our Factory. All work and service which is extracted from any person under the menace of any
penalty and for which the said person has not offered himself voluntarily is considered as forced or
compulsory labor work.
The risk associated with such act includes:
Economic aspects of immigration – Immigrants are prone to this act when they are faced with basic
living requirement by getting any work for survival
Wage trends – Some organization use higher pay to exploit workers to increase output, without noticing
that this act is to the detriment of employee working conditions
Emerging industry – During the influx of investment, the markets need a huge supply of labor to fill up
the vacant positions to meet the demands of the market, causing forced or compulsory labor services to
rush out the products to resolve the acute supply
Legal risk – forced labor is illegal in most countries and breaking notional law may carry civil and/or
criminal sanctions for a company
Reputation and commercial risks – even where allegations of complicity for not result in legal action,
companies can still face a range of non-legal risks if perceived to be complicit in using forced labor
Actions Taken to Resolve the Risk of Forced or Compulsory Labor
In order to resolve the risk assessment of forced labor, JIT has taken the following steps:
Compliance with national laws on forced labor,
Not engaging in or supporting worker exploitation amounting to forced labor,
To be responsible in eliminating force labor,
Not retaining personal documents or importance possessions of any workers and
Giving worker the right to terminate employment freely and voluntarily.
By summarizing our stand in this respect, JIT is not involved in activities including child labor, forced labor,
discrimination and other activities that it believes are ethically questionable.

52
Environment
Environmental Management Approach JIT is committed to leading the industry in minimizing the impact of its activities on the environment. As a company, we act in compliance with the law relating to the environment and are committed to the integration of sound environmental practices in our business decisions. We recognize the direct and indirect environmental impacts of our operations and support the principles of sustainable development. The key points of our strategic approach to achieve these in JIT are:
Meet or exceed all the environmental legislation that relates to the Company
Minimize the waste produced in all parts of our business
Minimize the toxic emissions through the selection and use of materials
and the source of power requirement Actively promote recycling both internally and amongst our customers and
suppliers Support the integration of environmental considerations and objectives
into our business decisions
Seek to conserve natural resources by ensuring responsible use of energy, water and materials
Raise the awareness of environmental issues among our staff and enlist their support in improving the Company‟s performance
Continue to review the environmental impacts of our business to identify and, where practicable set ourselves improvement targets and monitor progress
To evaluate proposed new equipment, materials, procedures and systems for environmental impact, before introducing them

53
Environmental Highlights
Recycle waste materials wherever possible, and in a manner that has a socio-economic impact on all members in our community
Continually applying Lean Production System to increased productivity and improved quality of products, resulting reductions in Energy and Water costs per product manufactured by more than 30% in 2011 comparing to 2010 performances
CO2 emission is lesser by 19% in terms of total weight by converting the direct and indirect energy and CO2 Footprint per piece of garment produced was reduced by 49.8% in 2011
Environment
The Company complies with all applicable environmental laws and regulations in respect of protecting the
environment and maintains procedures for notifying local authorities in the event of an environmental
accident resulting from the operation. This is essential to provide, besides meeting the local legislations
and regulations, a safe and healthy working environment to the employees of the Company.
Environment Management System
We have developed our Environmental Management System which follows the methodology of Plan-Do-
Check-Act of ISO14001 program implementation. For the benefit of stakeholders, this instrument will
definitely help us to guarantee our consistent compliance and enhance sustainability. The project of
Environmental Management Plan that carried out included:
Controlling and planning of raw materials usage and consumptions;
Electric energy managements: establish a system of electricity usage to control the usage
of lighting and equipment‟s; reallocation of electricity supply area; and tried to use energy
saving appliances;
Educate employees saving energy and water, as well as revile training, maintenance of
facilities and equipment;
Formulated low carbon and greenhouse gases emission reduction plan and calculated the
emission of the green gas;
Management of office paper usage;
Water purification installation at Printing Section;
Ensure the orderly emission of living waste water;
Establish ad environmental emergency plan, and organized emergency responses and
preparation;
Set up and formulate our e-KPI;
Develop programs to create awareness of employees in controlling pollution within the
premises for conservation of the environment and
Set up control system to check the consumption and reduction of wastages in respect of
power, energy, water, wastes, effluent and emissions.
In additional, our stakeholders require and expect our environmental practices leading to producing
finished goods as “sustainable” as possible, meaning the goods must be environmental friendly and
harmless to the end-users.

54
Materials, Waste & Disposal
According to the goal planning of sustainable development, energy sourcing and environment protection is
one of the important programs of JIT in 2011. Firstly, according to the 3R practice - reduce, reuse and
recycle, our company measured the amount of the raw materials, scraps and wastes and the percentage of
recycled materials usage, emission of pollutant, energy consumption, carbon dioxide emission, etc
Materials
The Company uses a wide range of materials and consumables for the manufacturing of
garments. The production process is CMT (Cut-Make-Pack) meaning readymade fabric
rolls and accessories are purchased, almost all from overseas, for converting into
garments.
Even though the material suppliers are nominated by our buyers, we still have to request
the suppliers to furnish the restricted substances list (RSL) for the materials purchased.
Waste and Disposal By practicing effective production system and procedures, the quantity or volume of
emissions, effluents and waste can be controlled to a sustainable level. Meanwhile, the
management also encourages the recycle of by-products and wastes to the full extent.
Understanding of the problems involved in ultimate disposal of waste should enable
the various Head of Departments to respond to the need for proper segregation,
packaging, labeling and documentation of waste.
Hazardous Waste
Regulatory Requirements
Hazardous waste is defines as “a waste with properties
that make it dangerous or potentially harmful to human
health or the environment”. A hazardous waste is waste
that poses substantial or potential threat to public health
or the environment.
Waste management is the collection, transport,
processing or disposal, managing and monitoring of
waste materials. Hazardous wastes include sewing
machine oil, lubricants, broken fluorescent tubes, ink
cartridges, scrap metal & sewing machine needles and
used batteries. Waste collection is observed and
monitored by assigned staff and security guard to
ensure it is properly treated by the staff of service
providers.
Waste management is a distinct practice from resource
recovery which focuses on delaying the rate of
consumption of natural resource. All wastes material,
whether they are solid, liquid, gaseous or radioactive fall
within the remit of waste management.
The Ministry of Environment conducts
inspection for certifications pertaining to
environmental issues on a half yearly
basis.
The company has contracted SAROM
TRADING by signing contract in
disposing the Company waste both
hazardous and non-hazardous except
those recycled materials. It is the only
waste service provider authorized by The
Ministry of Environment in waste
collecting and disposing in Phnom Penh.
There is a special treatment i.e.
infectious and normal medical waste from
our clinic. The clinic‟s doctor and nurses
need to strictly control the waste and
packed with proper labeling before
passing to the General Hospital of
Phnom Penh for disposal.

55
Non-Hazardous Waste The control of the waste isn‟t as strict as those of hazardous waste. Due to large
quantity, we have internal disposing procedure to adhere to:
Sorting of wastes at the points of collection,
Food leftover is sold for animal feeding,
Reduce the normal wastage allowance of fabric and accessories by at least 1%
(normal 3%)
Continuously training to employees to conserve consumables and materials,
Replacing polybags with fabric bags which used to store cut-panels in Cutting
Department,
Recycled wastes as mentioned in Table 3 on Page 56 below are sold either for
manufacturing of secondary qualified products or re-process and purchase back
as recycled inputs and,
Other domestic wastes are collected and transported to the treatment station by
licensed service provider. Disposal methods are burning and land filling.
Comparison Ratio – Materials Purchased Vs. Recycled Wastes
Graph 20 below shows the following improvements:
Recycled waste increased from 7.24% in 2010 to 8.96% in 2011 partly due to better segregation of
wastes from domestic waste of 8.05% (2010: 17.19%)
Total recycled and domestic wastes also has been reduced drastically from 24.43% to 17.01%
Graph 20: Proportion of Domestic & Recycled Wastes Vs. Total Material Purchased in 2010-11
Total material waste Total recycled waste Domestic wastes
2010 100.00% 7.24% 17.19%
2011 100.00% 8.96% 8.05%
100.00%
7.24%
17.19%
100.00%
8.96% 8.05%
0.00%
20.00%
40.00%
60.00%
80.00%
100.00%
120.00%
Per
cen
tage
2010 & 2011 Proportion of Domestic & Recycled Wastes Vs. Total Materials Purchased
2010
2011
2,206,472 kg
3,499,223 kg
159,833 kg
313,587 kg 281,688 kg
379,186 kg

56
Recycled Wastes and Resale Value Table 3 below shows the materials purchased and resale by weight in kg with the resale value. Even
though the resale price is low, it was part of the Company‟s environmental protection initiatives to practice
3R principal - reduce, reuse and recycle.
Data collected on waste generation figures over these years indicated the level of progress the Company
has made toward waste reduction efforts. It could also indicate potential improvements in process
efficiency and productivity. From a financial perspective, the reduction of waste contributes directly to lower
costs for materials, processing and disposal.
Table 3: Category of Material Purchased, Recycled Weight & Resale Value 2010-2011
2010 Material
Fabric Cartons Cupboard tube
Stationery Paper
Marker Paper
Polybag Sewing Machine
Accessory Total
Purchases (Kg) 1,761,186 127,534 7,343 20,479 49,799 120 240,011 2,206,472
Recycled (Kg) 126,177 4,697 7,581 1,014 5,049 15,231 84 159,833
% 7.16% 3.68% 100% 13.81% 24.65% 30.58% 70% 7.24%
Disposal Price (US$) 8,140 1,834 1,523 42 11,539
Disposal Methods A* B* C* D*
2011 Material
Purchases (Kg) 2,495,907 563,607 8,394 35,500 61,960 63 333,792 3,499,223
Recycled (Kg) 260,422 24,605 7,667 1,006 5,079 14,770 38 313,587
% 10.43% 4.37% 100% 11.98% 14.31% 23.84% 60.32% 8.96%
Disposal Price (US$) 16,013 1,836 1,477 19 19,345
Disposal Methods A* B* C* D*
A* = Left -over cut-piece sold as rags for manufacturing of secondary qualified products
B* = Sold to corrugated carton factory for transformation into “medium” layer paper and resell to JIT
C* = Sold to paper mill to re-process and re-sell to JIT
D* = Sold to paper mill as lubricant to corrugated machines
Table 4: Types of Waste in 2010 - 2011
Table 4 shows the proportion of each type of waste that the Company generated throughout the years. The
proportion of domestic waste has dropped drastically from 70.33% in 2010 to 47.31% in 2011 mainly due to
the effective segregation of recycled waste from the domestic one.
Year Recycled waste Domestic waste Hazardous
waste Total (Kg)
2010 159,833 (29.65%) 379,186 (70.33%) 123 (0.02%) 539,142 (100%)
2011 313,587 (52.67%) 281,688 (47.31%) 134 (0.02%) 595,409 (100%)

57
Energy
Energy, which include direct and indirect source, is one of the most essential factors of production in a
factory. Energy consumption has a direct effect on operational costs and is subject to the influence of
fluctuations in energy supply and prices. JIT uses 3 types of energy: Steam, Diesel and Electricity.
Indirect Energy - Steam
Steam which considers as indirect energy is used for pressing process and the source is bought from Harta
Packaging Ltd located next to JIT. The steam is conveyed through an insulated flow pipe to our production
floor.
Insulated Steam Pipe Steam Recycled System
The existing steam recycle and insulation piping systems allow the steam temperature to be maintained
between 160-1800C and recycle throughout the whole production hours resulting energy and cost savings.
Graph 21: Cost of Steam Purchased 2010-2011
Graph 21 shows the total cost of US$79,471 for the steam purchased in 2011 from adjacent factory Harta
Packaging Ltd (Harta). This amount was about 6 times higher than 2010 figure of US$11,711 because it
charged us in full based for the total hours of steam supplied to JIT.
Previous year‟s charge was on those hours where the steam was entirely used by us, normally during over
time period when Harta did not work for it. Since Harta waived the 2010 claims, the cost and volume of
steam consumed were incomparable for analysis.
11,711
79,471
0
20,000
40,000
60,000
80,000
100,000
Year
USD
Total Cost of Steam2010-2011
2010
2011

58
Indirect Energy – Electricity and Electricity Generated from Generator (Diesel)
Another common type of energy is electricity which is used to supply current to
the machines and lighting of premises. Table E: Expenditure and
Investments vs. Savings and Re-investment Summary in the Appendixes
explains the types of environmental protection projects that our Company has
so far carried out to reduce the green house effect and CO2 emission which
relates to the consumption of electricity.
During electricity cut-off from local governmental authority, we used generator
which consumes diesel to produce current for the production factory-wide. The
current generated from there becomes an indirect energy source as part of the
whole electricity supply to the Company.
Indirect Energy Saving Initiatives
The Sustainability Advisory Committee (SAC) takes the initiatives to reduce indirect energy consumption
since 2007 in the following ways:-
Install any fixture and equipment which bring reduction in indirect energy consumption,
Replacement of existing facilities with more energy efficient parts or technology innovation,
Reduction of non valued added activities or waste in relation to indirect energy consumptions
The SAC Committee tabled the proposal, after conducting the feasibility study, for the management
approval. Once the project is approved, implementation and monitoring of such kaizen activities is taken
over by the Health, Safety and Environment Committee. SAC Committee analyses and evaluates the
effectively of the project and take corrective actions in the coming years.
Continuous Indirect Energy Saving Projects
Based on the concepts above mentioned, we have the following projects which aim
at reducing the indirect energy consumptions:
Water Curtain Cooling System - Installed water curtains in Cutting, Sewing,
Printing & Embroidery Sections which has a lifespan of 5 years (i.e. 5 years
depreciation) and needs to reinvestment at the end of its usage
Changing T8 to T5 fluorescent tubes factory-wide – Our Company decides to
change the entirely floor‟s lights by selecting a particular department/office bock
on a yearly basis
Replacing energy efficient sewing motors – Those old and spoilt sewing motors
will be replaced by the automatic current generated motor, meaning the sewing
machine consume electricity
Green Logistic linking Sewing Departments and Finishing Warehouse – Energy
free by constructing the spiral staircase and sliding slope from the production
floors which slide the finished goods cartons to Finishing Warehouse directly
Installation of transformer to stabilize the government supply of electricity and at
the same relieves the workload of generator which is triple costly than the
government supplied electricity.
The information on cost saving against its investment/expenditures and reinvestment schedule can be
obtained from Table E: Expenditure and Investments vs. Savings and Re-investment Summary in the
Appendixes.

59
Graph 22: Cost of Electricity and Diesel-generated Electricity Purchased 2010-2011
Graph 23: Electricity (including Diesel-generated Electricity) Consumption in KW per Piece of Product Produced 2010-2011
JIT produced 4.55 million pieces of garments in 2011
(2010: 2.90 million pieces) which was 57% higher
than last year but the total electricity consumption as
listed above was actually lesser by 16.6% in term of
the cash value spent.
The electricity, in kilowatt, consumed to
produce a single piece of garment also
shows a positive trend in 2011 (0.75 Kw),
i.e. consumed lesser by 53.7% when
compared to 2010 1.62 Kw.
Direct Energy – Diesel
Generally, energy consumption has a direct effect on operational costs and exposure to fluctuations in
energy supply and prices. JIT has shown its ability to use energy efficiently and the result can be revealed
by calculating the amount of energy we consumed in the following Tables.
The approach that we used to reduce the consumption of direct energy is similar to that explained in the
foregoing section on Indirect Energy – Electricity and Electricity generated from Generator (Diesel)
on Page 58
We managed to make some changes which indicated our efforts to minimize the environmental impacts: -
Diesel is used in our factory for vehicles, trucks, “Totoo” cars and generator. We practiced car pool
system by setting up PCCS Intercompany Bus Schedule. Under this arrangement, we send passengers,
i.e. Company staff and workers in group from JIT premise to the other 3 factories within the group at
7:30am, 9:30am and 12:30pm daily and schedule the returned trips one hour later from the times
mentioned here. Staff and workers can go to and back from their specific destination with ease.
By having a centralized material warehousing management system, all trucks are stationed in JIT.
When shipment in containers arrived, the trucks are instructed to load fully and distribute the goods to
other factories within PCCS Group in one trip if possible in order to save the time and diesel cost.
The information on cost saving against its investment/expenditures can be obtained from Table E:
Expenditure and Investments vs. Savings and Re-investment Summary in the Appendixes.
Electricity Diesel Total
2010 289,450 163,127 452,577
2011 321,810 55,608 377,418
0
100,000
200,000
300,000
400,000
500,000
US$
Cost of Electricity and Diesel-generated Electricity Purchased
2010 - 2011 1.62
0.75
0
0.2
0.4
0.6
0.8
1
1.2
1.4
1.6
1.8
Average 2010 Average 2011
KW
/pie
ce
Electricity Consumption in KW per Piece Produced 2010 - 2011

60
Graph 24: Total Diesel Consumption 2010-2011
Graph 25: Diesel Consumption in Liter per Piece of Product Produced 2010-2011
Referring to the information in Graph 24 below,
the total amounts of consumption in 2010 was
103,726 liters but 2011 cost was reduced by
69.6% to 31,530 liters
In terms of direct energy spent in producing per
piece of garment manufactured in JIT, the data
for 2010 and 2011 were 0.0365 liter and
0.0069 liter respectively, showing an
improvement of 81%
Future Plan
JIT plans to use “Totoo” cars instead of trucks to carry goods or materials in small quantity with flexible
travelling schedule within the companies of PCCS Group in 2011.
Water and Rain Water
Water is a crucial part of production in our factory. Water consumption has a direct effect
on opearational costs, and it is subjuct to the influence of fluctuation in water supply and
prices. Further, the amounts and quality of discharge waster waste affect the balance of
ecology and environment.
By progressively improving the quality of discharged water and/or reducing volumes, one
has the potential to reduce its impact on the surrounding environment. Unmanaged
discharge of effluents with a high chemical or can have a significant impact on receiving
waters. This, in turn, can affect the quality of the water supply available to the Company
and its relationship with communities and other water users.
Rain Water
The Company collects rain water from May to Dec each year during which is the raining
season in Cambodia. Rain water is collected and stored in the underground water tank
with storage capacity of 110,000 liters and 6 units of aboveground water tanks of 6,000
liters each totaling 146,000 liters. Rain water collected is mainly used for household
cleaning, Company car washing, sanitary flush, and gardening and to great extent as
recycled water to the water curtain cooling system but not for human drinking and
personal cleaning.
The information on cost saving against its investment/expenditures in relation to rain water can be obtained
from Table E: Expenditure and Investments vs. Savings and Re-investment Summary in the
Appendixes
103,726
31,530
0
20,000
40,000
60,000
80,000
100,000
120,000
2010 2011
Total Diesel Consumption 2010 -2011 (Liters)
2010
2011
0.0365
0.0069
0.0000
0.0100
0.0200
0.0300
0.0400
Year
Litr
e
Diesel Consumption in Litre/Pieces2010-2011
2010
2011

61
Graph 26: Water (Including Rain Water) Consumption 2010-2011
Graph 27: Water Consumption in Liter per Employee Per Year 2010-2011
Graph 26 above shows that a total of 6,849 M3 of
rain water was collected representing a cost
saving of US$6,900 (28%).
Besides rain water, a total of 16,477 M3of tapped
water was purchased from the local municipal
council costing US$17,000.
The proportion of tapped water has reduced by
7% (2010: 79%, 2011: 72%) of which was
substituted by rain water.
As water is mainly used for household
cleaning and human drinking, the
measurement unit used to calculate the
saving should be the total number of
employees against the total quantity of
garments produced in a year.
In terms of water (municipal and rain water)
spent per employee, the data for 2010 and
2011 were 9,065 liters and 7,276 liters per
annum respectively, showing an improvement
of 19%
Future Plan
As part of the environmental protection plan, the Company will further invest in water tanks of 10,000 liters
each to collect more rain water with forecasted saving of another 19% in 2012.
Water Treatment
In order to comply with the local regulatory requirements,
JIT installed a unit of water treatment plant costing
US$15,000 in Printing Section in 2010. It purifies the
printing ink water before discharging to the public
sewerage system. The total usage of water for this unit is
1,240 M3 (2010: 1,350M3) and about 85% were
discharged to the public sewerage system.
Water Purchase(
m3)
Rain Water(m3
)Total
2010 18,000 4,716 22,716
2011 16,477 6,849 23,326
-
5,000
10,000
15,000
20,000
25,000
Me
ter
cu
bic
Water Consumption (Including Rain Water) 2010 - 2011
9,065
7,276
0
2,000
4,000
6,000
8,000
10,000
Year
Litr
e
Water Consumption in Liter Per Employee Per Year
2010 - 2011
2010
2011

62
The purifying process needs to comply with Standard Operating Procedure (SOP) in order to maintain a
qualified chemical content in the water and sludge. SAROM TRADING is the only waste service provider
authorized by The Ministry of Environment to whom the sludge can be disposed off accordingly.
The Ministry of Environment comes to collect the treatment water sample for testing as part of their half
yearly routine practice. The result of the test for 2011 is detailed in Table 5 below: -
Table 5: Printing Water Test Analysis
No Parameter Unit Result Standard Method Equipment
1 pH - 8.16 5-9 pH-EC & TDS meter
2 Total Suspended Solid (TSS) mg/1 36.00 < 120 Method 2540 D 3 Biochemical Oxygen Demand (BOD) mg/1 25.72 < 80 Method 5210 B
4 Chemical Oxygen Demand (COD) mg/1 48.91 < 100 Method 5220 B 5 Oil & Grease mg/1 1.64 < 15 Method 5520 D
6 Ammonia (NH3) mg/1 0.48 < 7 Photometer
The result from the analysis report showed that standard requirements set by the ministry have been met
which proved that the water treatment plant was functioning in good condition.
Overall Performances
The foregoing statements explain individual types of expenditures and saving which has significant impacts
to environment. Now let us summarize all the costs of direct and indirect energy and water in one table for
quick reference purposes.
Graph 28: Total Cost US$ – Electricity (including diesel-generated electricity), Diesel and Water (excluding Rain Water) 2010-2011
Graph 29: Total Cost (all Electricity + Diesel + Water) Per Piece of Garments Produced 2010-2011
JIT produced 2,899,156 and 4,551,353 pieces of garments in 2010 and 2011 respectively. This
represents an increment of 57%
Graph 28 shows that 2011 total cost of direct & indirect energy and water is slightly 4.8% higher than last
year
Taking the yearly total cost listed from Graph 29 above, 2010 figure shows the cost of making a piece of
garment is US$0.19 whereas 2011 is US$0.11, a 42% improvement over the last year figure
Please take note that the cost of steam was not taking into account for comparison purpose as the 2010
figures on Page 57 did not reflect the true cost of it
2010 2011
Total cost 436,603 457,954
436,603
457,954
420,000
430,000
440,000
450,000
460,000
US$
Total Cost of Electricity (including diesel-generated electricity), Diesel and Water (excluding Rain Water)
2010 2011
Total cost 0.19 0.11
0.19
0.11
0
0.05
0.1
0.15
0.2
US$
Total Cost (all Electricity + Diesel + Water) per Piece of Garment
Produced

63
Future Plan
The Sustainability Advisory Committee not only sustains the current energy and water saving projects but
also ventures into renewable energy sources in 2012 onwards
Greenhouse Gas Emission
Greenhouse gas emissions are the main cause of climate change. Different national and
international regulations and incentive systems (such as trading climate certificates) aim to
control the volume and reward the reduction of greenhouse gas emissions. When monitored
comprehensively, emissions can be reduced effectively. The environmental footprint of the
Company is shaped in part by our choice of energy sources.
In line with the Environmental and Sustainability Policy and objective of JIT, we have selected
energy-efficient materials, services and production capabilities applicable to our Company to
mitigate the effect the greenhouse gas emission.
Measures
We have identified the sources of emission and steps have been taken to reduce or control
them. The major common greenhouse emissions in our factory are as follows with respective
corrective measures taken to reduce its effects: -
Direct energy – Diesel used for transportation, etc. with initiatives taken. Please refer to
explanations on Page 59,
Indirect energy – Electricity and diesel-generated electricity used in all types of machinery
, equipment, apparatus and electrical appliances such as Fabric auto-cutter, air
compressors used in pressing or air-conditioning system, sewing machines and lighting
system. The initiatives taken to reduce the emission are explained in Table E:
Expenditure and Investments vs. Savings and Re-investment Summary in the
Appendixes.
Heat from the steam used for pressing process – We purchased a portion of the whole
steam generated from Harta Packaging Ltd daily
Conversion Factors
We applied the conversion rate of 1 liter of diesel to 2.75 kilograms of CO2 emission in our computation.
For electricity computation, 1 kilowatt of electricity to 0.78 kilograms of CO2 is the rate that we used for calculation. This was based on rate used by the Ministry of Science & Technology in Sri Lanka
Table 6: Total CO2 Emission 2010-2011
Table 6 displays the total CO2 emission by JIT where the 2011 figure was lesser by 19.6% (3,158,840 Kg in
2010 reduced to 2,540,999 Kg in 2011)
The weight in Kg of the CO2 per piece of garment produced was reduced by 49.8% (from 1.111 Kg down to
0.558 Kg)
Year Diesel Electricity (include diesel-diesel generated electricity)
Total (Kg) Kg/Piece
2010 285,247 2,873,593 3,158,840 1.111
2011 86,708 2,454,291 2,540,999 0.558

64
GRI G3 Application Level B Requirements The Company decides to follow the GRI G3 guidelines with self-declared Level B. The following table provides a summary of the GRI‟s requirements as well as quick reference to our self-assessment of compliance to the B Level.
Application Level
Report on: Report on all criteria listed Same as requirement for
1.1 for Level C plus: Level B
2.1 - 2.10 1.2
3.1 - 3.8, 3.10 - 3.12 3.9, 3.13
4.1 - 4.4, 4.14 - 4.15 4.5 - 4.13, 4.16 - 4.17
Not Required Management Approach Management Approach
Disclosures for each Disclosures for each
Indicator Indicator Category
Category
Report on a minimum of 10 Report on a minimum of 20 Report on each core G3 and
Performance Indicators. Performance Indicators, at Sector Supplement* Indicator
Including at least one from least one from each of with due regard to the
each of: Economic, Environmental, Materiality Principle by
Economic, Social and Human Rights, Labor, Society, either: a) reporting on the
Environmental Product Reponsibility. Indicator or b) explaining the
reason for its omission.
*Sector supplement in final version
Report
Sta
ndard
Dis
clo
sure
s
OU
TP
UT
G3 Profile
Disclosures
OU
TP
UTG3 Managerment
Approach
Disclosures
OU
TP
UT
G3 Performance
Indicators &
Sector
Supplement
Performance
Indicators
Approach
Disclosures
Report
Exte
rnally
A
ssure
d
Report
Exte
rnally
A
ssure
d
Report
Exte
rnally
A
ssure
d
C+C B B+ A A+

65
GRI Performance Indicators
Aspects
Indicators code
Descriptions Page
Eco
no
mic
Eco
no
mic
P
erf
orm
an
ce
Ind
icato
rs
Economic Performance
EC1
Direct economic value generated and distributed, including revenues, operating costs, employee compensation, donations and other community investments, retained earnings, and payments to capital providers and governments.
29 & 36
Market Presence EC7 Procedures for local hiring and proportion of senior management hired from the local community at significant locations of operation
30 & 43
En
vir
on
me
nt
E
nvir
on
men
tal
Perf
orm
an
ce
Ind
icato
rs
Materials
EN1 Materials used by weight or volume. 55 – 56
EN2 Percentage of materials used that are recycled
Input materials.
56
Energy
EN3 Direct energy consumption by primary energy source. 59 - 60
EN4 Indirect energy consumption by primary source. 57 - 59
EN7 Initiatives to reduce indirect energy consumption and reductions achieved.
31-33 & 62
Water EN8 Total water withdrawal by source. 60 – 61
Emissions, Effluents, And
Waste
EN16 Total direct and indirect greenhouse gas emissions by weight. 63
EN18 Initiatives to reduce greenhouse gas
Emissions and reductions achieved.
63
EN21 Total water discharge by quality and destination. 61 - 62
EN22 Total weight of waste by type and disposal method. 54 - 56
Overall EN30 Total environmental protection expenditures and investments by type.
31 -33
Lab
or
Pra
cti
ces a
nd
Decen
t W
ork
Perf
orm
an
ce In
dic
ato
rs
Employment
LA1 Total workforce by employment types, employment contract and region
30 & 31
LA2 Total number and rate of employee turnover by age group, gender, and region.
37 - 39
Labor Management Relations
LA4
Percentage of employees covered by collective bargaining agreements.
48
So
cia
l
Occupational Health and Safety
LA7
Rates of injury, occupational diseases, lost days, and absenteeism, and total number of work-related fatalities by region.
46 – 47
Training and
education LA10
Average hours of training per year per employee by employee category.
39 – 42
Equal
Remuneration For Women and Men
LA14 Ratio of basic salary of men to women by employee category. 39 – 41
Hu
man
Rig
hts
P
erf
orm
an
ce
Ind
icato
rs
Freedom of Association and
Collective Bargaining
HR5
Operations identified in which the right to exercise freedom of association and collective bargaining may be at significant risk, and actions taken to support these rights.
48 – 49
Child Labor HR6 Operations identified as having significant risk for incidents of child labor, and measures taken to contribute to the elimination of child labor.
50
Forced and Compulsory
Labor HR7
Operations identified as having significant risk for incidents of forced or compulsory labor, and measures taken to contribute to the elimination of forced or compulsory labor.
51
So
cie
ty &
Pro
du
ct
Resp
on
sib
ilit
ies
Perf
orm
an
ce
Ind
icato
rs
Compliance SO8
Monetary value of significant fines and total number of non-monetary sanctions for non-compliance with laws and regulations.
33
Compliance PR9
Monetary value of significant fines for non-compliance with laws and regulations concerning the provision and use of products and services
33

66
Appendixes
For better understanding of this Corporate Sustainability Report, the following tables should be read together as they form the integral part of the whole report.
Table A: In-house Social Charitable Fund Received by Employees 2011 (Pg 17)
2010 Jan Feb Mar Apr May Jun Jul Aug Sep Oct Nov Dec Total (US$)
Condolence (US$60/case) 240 60 300 360 300 300 120 240 180 120 120 2,340
Sickness (Case by Case basis) 170 310 380 170 280 260 760 630 590 30 210 210 4,000
Maternity (US$20/case) 240 120 120 280 320 480 240 1,800
Disaster (Us$100/case) 100 100
Total (US$) 410 370 680 530 820 680 1,000 870 1.15 470 810 450 8,240
2011 Jan Feb Mar Apr May Jun Jul Aug Sep Oct Nov Dec Total (US$)
Condolence (US$60/case) 60 60 120 60 60 240 180 120 120 60 60 60 1,200
Sickness (Case by Case basis) 170 200 100 120 30 110 80 90 78 110 45 40 1,173
Maternity (US$20/case) 60 120 140 160 220 120 220 160 120 300 300 100 2,020
Disaster (Us$100/case) 100 100
200
Total (US$) 290 380 460 340 310 470 480 370 418 470 405 200 4,593
Table B: Major Corporate & Financial Ratios 2010-2011 (Pg 29)
Descriptions 2010 2011 Ratios 2011 vs. 2010
US$ US$ US$ US$ %
A)
Sales 25,351,600 28,541,600 13%
Operating Costs
Raw Materials 13,808,200 15,556,500 13%
Direct Wages 4,338,900 5,535,200 28%
Indirect wages 1,112,500 1,351,700 22%
Charity Fund 8,200 4,600
Expenses (Direct &indirect) 5,387,500 5,252,400 -3%
Depreciation 339,000 338,300
Bank Loan in% 192,200 203,200
Economic Value Distributed 25,186,500 28,241,900 99% vs. Sales
Economic Value Retained 165,100 299,700 1% vs. Sales
B) Sales in million pieces 2.90 4.55 57%
C) Equity to Debt Ratio 1: 1.1 1: 0.9 18%
D) Total workforce as at Dec 2,506 3,206 28%

67
Table C: Workforce by Employment Type at 31-Dec-2010 & 2011 (Pg 31)
2010 2011 Ratios
Level Khmers Expatriates Khmers Expatriates Khmers
Managerial 3 15 3 12 Sustained
Supervisory -
Executives, Leaders &
Supervisors
117 42 208 28 78%
Technical – Marker,
QC/QA & Sample
Development
85 14 369 16 334%
Clerical 98 16 130 11 33%
Operational 2,107 9 2,412 17
Sub-total 2,410 96 3,122 84
Grand total 2,506 3,206
Table D: Summary of the Environmental Protection Projects – Part 1/3 (Pg 32)
Projects Information from
July-2007
(commencement of
production operation)
to Dec-2011
Major benefits No# Yrs
of
Depre-
ciation
Water tanks to collect rain water
Constructed 1 underground water tank (110,000 liters) and installed 6 units of aboveground water tanks (total 36,000 liters)
Mitigate the use of municipal water & cost saving from purchasing municipal water
Tapped rain water during raining season from May-Dec for cleaning, using recycled water in water curtain cooling system & sanitary flush
Act as reservoir for fire emergency case
20
Water treatment
Installed 1 unit of water purifying plant in Printing Section
Meeting statutory requirements
Water discharged to the public sewerage system meets BOD and COD standards
Proper handling and disposal of chemical wastes
10
Cooling System Installed water curtains in Cutting, Sewing, Printing & Embroidery Sections
This system replaces the central air-conditioning system
Cost saving in electricity consumptions by using exhaust fans and motors for recycled water to take away heat from the production floors
Temperature maintained at 270C to 290C (Average 320C without such cooling system)
5
Changing T8 to T5 lamps
Changing fluorescent tubes factory-wide
Increase brightness 500 – 700 lux (before 400 - 500 lux)
Temperature further reduced by 10C
Cost saving by using lower wattage T5 light tubes 25W (T8 = 36W)
8
Sewing motors replacement
Replacing energy efficient sewing motor s
Saving 100watt (new motor 250 watt compared to the old type 350w), consume electricity the moment the sewing machine start operating
Generate less heat
8
JIT applies straight line basis for the depreciation of the fixed assets purchased in Table D

68
Table D: Summary of the Environmental Protection Projects – Part 2/3 (Pg 32)
Projects Information from July-
2007 (commencement of
production operation) to
Dec-2011
Major benefits No# Yrs
of
Depre-
ciation Green logistic - finished goods
Installed the spiral staircase and sliding slope from the production floors and slide the finished goods cartons to Finishing Warehouse directly
Energy free by sliding down the finished goods cartons
Saving in labor cost
Cost saving in using no cargo lifts
20
PCCS Group intercompany transport schedules
i) Running intercompany bus schedule
ii) “Totoo” cars services
Saving in diesel consumptions by running daily group bus schedule to & fro JIT, SA One Garments Ltd & Beauty Apparels Ltd (PCCS intercompany) for sending workers at 7:30am, 9:30am & 12:30pm and back to JIT one hour later each form the above destinations
Saving in diesel consumption by using “Totoo” cars instead of trucks to send goods (such as cut-panels, cartons, accessories) from one factory to another within PCCS Group
Less CO2 emission
5
Waste management
Recycled wastes such as left over cut-pieces, papers, cartons, polybags, domestic waste, etc and segregation of hazardous wastes
Side income by selling recycled and reused wastes such as paper, carton, polybag, thread spool cones
Control of disposal of wastes in a proper manner
Solar Energy Budget on Street Light Plan to purchase solar generated LED lights to replace the existing florescence lights on the exterior walls of Cutting Section
2012 Budget
Water tanks to collect rain water
Constructed 1 underground water tank (110,000 liters) and installed 6 units of aboveground water tanks (total 36,000 liters)
Mitigate the use of municipal water & cost saving from purchasing municipal water
Tapped rain water during raining season from May-Dec for cleaning, using recycled water in water curtain cooling system & sanitary flush
Act as reservoir for fire emergency case
20
Water treatment
Installed 1 unit of water purifying plant in Printing Section
Meeting statutory requirements
Water discharged to the public sewerage system meets BOD and COD standards
Proper handling and disposal of chemical wastes
10
Cooling System
Installed water curtains in Cutting, Sewing, Printing & Embroidery Sections
This system replaces the central air-conditioning system
Cost saving in electricity consumptions by using exhaust fans and motors for recycled water to take away heat from the production floors
Temperature maintained at 270C to 290C (Average 320C without such cooling system)
5
Changing T8 to T5 lamps
Changing fluorescent tubes factory-wide
Increase brightness 500 – 700 lux (before 400 - 500 lux)
Temperature further reduced by 10C
Cost saving by using lower wattage T5 light tubes 25W (T8 = 36W)
8
JIT applies straight line basis for the depreciation of the fixed assets purchased in Table D

69
Table D: Summary of the Environmental Protection Projects – Part 3/3 (Pg 32)
Projects Information from
July-2007
(commencement of
production operation)
to Dec-2011
Major benefits No# Yrs
of
Depre-
ciation
Sewing motors replacement
Replacing energy efficient sewing motor s
i) Saving 100watt (new motor 250 watt compared to the old type 350w), consume electricity the moment the sewing machine start operating
ii) Generate less heat
8
Green logistic - finished goods
Installed the spiral staircase and sliding slope from the production floors and slide the finished goods cartons to Finishing Warehouse directly
i) Energy free by sliding down the finished goods cartons ii) Saving in labor cost iii) Cost saving in using no cargo lifts
20
PCCS Group intercompany transport schedules
iii) Running intercompany bus schedule
iv) “Totoo” cars services
i) Saving in diesel consumptions by running daily group bus schedule to & fro JIT, SA One Garments Ltd & Beauty Apparels Ltd (PCCS intercompany) for sending workers at 7:30am, 9:30am & 12:30pm and back to JIT one hour later each form the above destinations
ii) Saving in diesel consumption by using “Totoo” cars instead of trucks to send goods (such as cut-panels, cartons, accessories) from one factory to another within PCCS Group
iii) Less CO2 emission
5
Waste management
Recycled wastes such as left over cut-pieces, papers, cartons, polybags, domestic waste, etc and segregation of hazardous wastes
i) Side income by selling recycled and reused wastes such as paper, carton, polybag, thread spool cones
ii) Control of disposal of wastes in a proper manner
Solar Energy Budget on Street Light Plan to purchase solar generated LED lights to replace the existing florescence lights on the exterior walls of Cutting Section
2012 Budget
JIT applies straight line basis for the depreciation of the fixed assets purchased in Table D
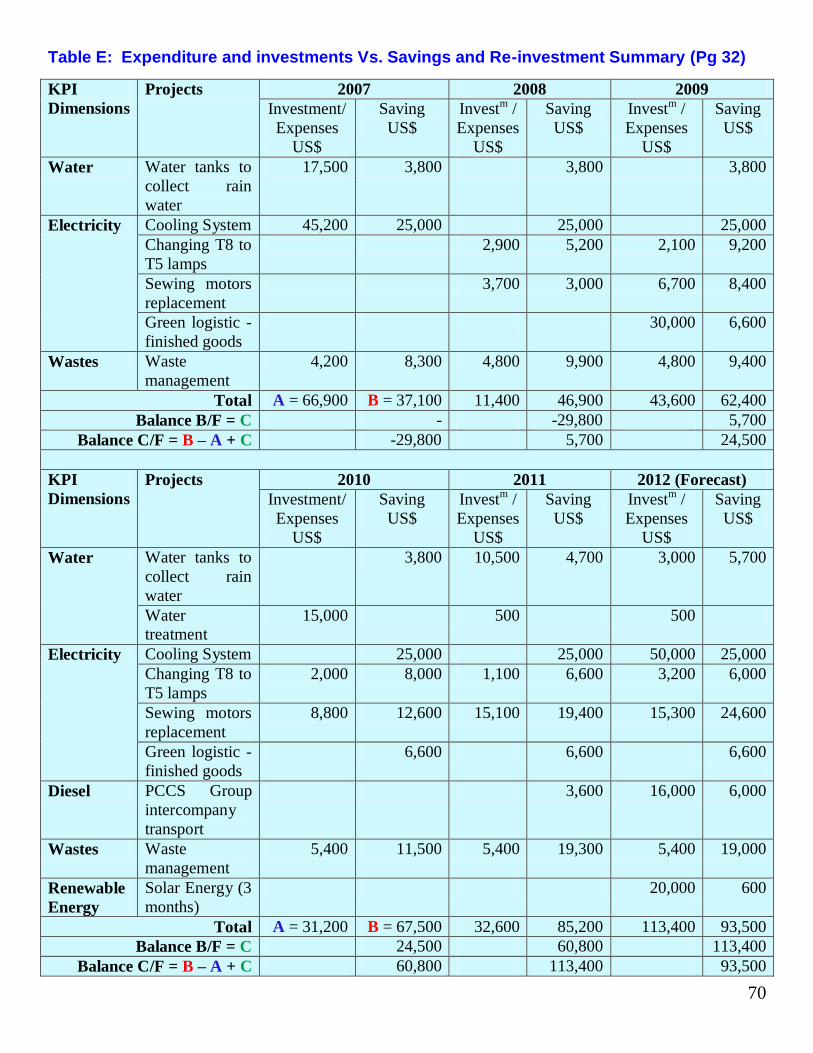
70
Table E: Expenditure and investments Vs. Savings and Re-investment Summary (Pg 32)
KPI
Dimensions
Projects 2007 2008 2009
Investment/
Expenses
US$
Saving
US$
Investm /
Expenses
US$
Saving
US$
Investm /
Expenses
US$
Saving
US$
Water Water tanks to
collect rain
water
17,500 3,800 3,800 3,800
Electricity Cooling System 45,200 25,000 25,000 25,000
Changing T8 to
T5 lamps
2,900 5,200 2,100 9,200
Sewing motors
replacement
3,700 3,000 6,700 8,400
Green logistic -
finished goods
30,000 6,600
Wastes Waste
management
4,200 8,300 4,800 9,900 4,800 9,400
Total A = 66,900 B = 37,100 11,400 46,900 43,600 62,400
Balance B/F = C - -29,800 5,700
Balance C/F = B – A + C -29,800 5,700 24,500
KPI
Dimensions
Projects 2010 2011 2012 (Forecast)
Investment/
Expenses
US$
Saving
US$
Investm /
Expenses
US$
Saving
US$
Investm /
Expenses
US$
Saving
US$
Water Water tanks to
collect rain
water
3,800 10,500 4,700 3,000 5,700
Water treatment
15,000 500 500
Electricity Cooling System 25,000 25,000 50,000 25,000
Changing T8 to
T5 lamps
2,000 8,000 1,100 6,600 3,200 6,000
Sewing motors
replacement
8,800 12,600 15,100 19,400 15,300 24,600
Green logistic -
finished goods
6,600 6,600 6,600
Diesel PCCS Group
intercompany
transport
3,600 16,000 6,000
Wastes Waste
management
5,400 11,500 5,400 19,300 5,400 19,000
Renewable
Energy
Solar Energy (3
months)
20,000 600
Total A = 31,200 B = 67,500 32,600 85,200 113,400 93,500
Balance B/F = C 24,500 60,800 113,400
Balance C/F = B – A + C 60,800 113,400 93,500

71
Table F: Average Hours of Training per Year per Employees by Employee Categories 2010-2011 (Pg 41)
2010
No# Employee Category Number
Employees Trained
Total Training Hours
Average Training Hour
1 Management 18 99 7.26
2 Executives 9 97 10.78
3 Supervisors 43 491 11.42
4 Leaders 58 1,017 17.53
5 QC/QA Staff 238 3,056 12.84
6 Floor Workers 1,621 12,506 7.71
Subtotal employees trained (75%)
1,987
Employees not being trained (25%)
519
Total 2.506 17,266 6.89
2011
No# Employee Category Number
Employees Trained
Total Training Hours
Average Training Hour
1 Management 15 105 7.00
2 Executives 32 110 3.44
3 Supervisors 80 500 6.25
4 Leaders 124 1,250 10.08
5 QC/QA Staff 385 3,200 8.31
6 Floor Workers 1,497 13,400 8.95
Subtotal employees trained (67%)
2,133
Employees not being trained (33%)
1,073
Total 3,206 18,565 5.79

72
Table G: Summary of Employees by Category and Highest Basic Salary Paid 2011 (Pg 45)
No# Descriptions 2011
Female Male Total Female Male Total
1
Production Staff
US$ US$ US$ % % %
Cutting 231 0 231 100.00 0.00 100
CTN 191 211 402 47.51 52.49 100
Finishing 151 150 301 50.17 49.83 100
Mechanic 0 166 166 0.00 100.00 100
QA 210 245 455 46.15 53.85 100
QC 155 0 155 100.00 0.00 100
QFI 80 0 80 100.00 0.00 100
Sample 230 131 361 63.71 36.29 100
Warehouse 211 230 441 47.85 52.15 100
Sewing 230 171 401 57.36 42.64 100
Sub-total 1,689 1,304 2,993 56.43 43.57 100
Table H: Ratio of Highest Pay of Production Workers by Gender by Employment Type 2011 (Pg 45)
No# Descriptions 2011
Female Male Total Female Male Total
2
Production Workers
Cutting 80 101 181 44.20 55.80 100
Ironing 75 71 146 51.37 48.63 100
Packing 86 0 86 100.00 0.00 100
GA 101 201 302 33.44 66.56 100
Mechanic 86 86 172 50.00 50.00 100
QA 81 0 81 100.00 0.00 100
QC 81 0 81 100.00 0.00 100
CTN 81 81 162 50.00 50.00 100
Warehouse 86 91 177 48.59 51.41 100
Sewing 81 0 81 100.00 0.00 100
Sample 111 81 192 57.81 42.19 100
Sub-total 949 712 1,661 57.13 42.87 100
Grand Total 2,638 2,016 4,654 56.68 43.32 100

73
Table I: Workers Injury Record 2010-2011 (Pg 47)
2010 Injury Rate
Month
Total Workforce Total Working Hrs Total Injuries Injury Rate
Male Female Male Female Male Femal
e Male
Female
Jan 281 2,528 58,427 525,845 - 4 - 1.52
Feb 279 2,509 53,530 481,766 - 3 - 1.25
Mar 282 2,542 60,998 548,986 - 6 - 2.19
Apr 271 2,435 56,264 506,376 - 4 - 1.58
May 292 2,632 60,819 547,373 - 6 - 2.19
Jun 296 2,664 61,568 554,112 - 5 - 1.80
Jul 280 2,516 60,372 543,348 - 6
2.21
Aug 283 2,548 58,885 529,963 - 5 - 1.89
Sep 291 2,616 60,466 544,190 - 4 - 1.47
Oct 285 2,561 59,176 532,584 - 3 - 1.13
Nov 290 2,611 60,341 543,067 - 2 - 0.74
Dec 304 2,735 63,211 568,901 - 3 - 1.05
Total 3,433 30,895 714,057 6,426,511 - 51 - 19.01
Average 286 2,575 59,505 535,543 - 4 - 1.58
2011 Injury Rate
Month
Total Workforce Total Working Hrs Total Injuries Injury Rate
Male Female Male Female Male Femal
e Male
Female
Jan 264 2,377 54,933 494,395 - 5 - 2.02
Feb 264 2,379 48,631 437,681 - 4 - 1.83
Mar 270 2,433 58,385 525,463 - 6 - 2.28
Apr 273 2,456 56,763 510,869 - 4 - 1.57
May 279 2,515 58,115 523,037 - 4 - 1.53
Jun 289 2,599 60,070 540,634 - 2 - 0.74
Jul 281 2,525 58,344 525,096 - 5 - 1.90
Aug 276 2,486 59,659 536,933 - 4 - 1.49
Sep 275 2,471 57,096 513,864 - 3 - 1.17
Oct 271 2,443 56,451 508,061 - 5 - 1.97
Nov 262 2,355 54,434 489,902 - 2 - 0.82
Dec 267 2,406 57,737 519,631 - 4 - 1.54
Total 3,271 29,443 680,618 6,125,566 - 48 - 18.86
Average 273 2,454 56,718 510,464 - 4 - 1.57

74
Table J: Lost Days Rate 2010-2011 (Pg 47)
2010 Lost Day Rate
Month Total Workforce Total Working Hrs Lost Day Lost Day Rate
Male Female Male Female Male Female Male Female
Jan 281 2,528 58,427 525,845 6 90 21 34
Feb 279 2,509 53,530 481,766 7 72 26 30
Mar 282 2,542 60,998 548,986 9 71 30 26
Apr 271 2,435 56,264 506,376 5 62 18 24
May 292 2,632 60,819 547,373 13 69 43 25
Jun 296 2,664 61,568 554,112 9 91 29 33
Jul 280 2,516 60,372 543,348 15 78 50 29
Aug 283 2,548 58,885 529,963 10 79 34 30
Sep 291 2,616 60,466 544,190 8 48 26 17
Oct 285 2,561 59,176 532,584 12 93 41 35
Nov 290 2,611 60,341 543,067 12 52 40 19
Dec 304 2,735 63,211 568,901 12 66 38 23
Total 3,433 30,895 714,057 6,426,511 118 867 394 324
Average 286 2,575 59,505 535,543 10 72 33 27
2011 Lost Day Rate
Month Total Workforce Total Working Hrs Lost Day Lost Day Rate
Male Female Male Female Male Female Male Female
Jan 264 2,377 54,933 494,395 15 120 55 48
Feb 264 2,379 48,631 437,681 17 155 70 71
Mar 270 2,433 58,385 525,463 19 55 65 21
Apr 273 2,456 56,763 510,869 19 83 67 32
May 279 2,515 58,115 523,037 20 59 69 22
Jun 289 2,599 60,070 540,634 15 73 50 27
Jul 281 2,525 58,344 525,096 13 94 45 36
Aug 276 2,486 59,659 536,933 10 97 34 36
Sep 275 2,471 57,096 513,864 20 182 70 71
Oct 271 2,443 56,451 508,061 19 63 67 25
Nov 262 2,355 54,434 489,902 15 52 55 21
Dec 267 2,406 57,737 519,631 16 117 55 45
Total 3,271 29,443 680,618 6,125,566 198 1,147 701 455
Average 273 2,454 56,718 510,464 17 96 58 38

75
Table K: Absentee Rate 2010-2011 (Pg 47)
2010 Absentee Rate
Month Total Workforce Total Working Day Lost Day Absentee Rate
Male Female Male Female Male Female Male Female
Jan 281 2,528 7,303 65,731 6 90 164 272
Feb 279 2,509 6,691 60,221 7 72 209 237
Mar 282 2,542 7,625 68,623 9 71 236 205
Apr 271 2,435 7,033 63,297 5 62 142 194
May 292 2,632 7,602 68,422 13 69 342 202
Jun 296 2,664 7,696 69,264 9 91 234 263
Jul 280 2,516 7,547 67,919 15 78 398 228
Aug 283 2,548 7,361 66,245 10 79 272 237
Sep 291 2,616 7,558 68,024 8 48 212 140
Oct 285 2,561 7,397 66,573 12 93 324 278
Nov 290 2,611 7,543 67,883 12 52 318 153
Dec 304 2,735 7,901 71,113 12 66 304 184
Total 3,433 30,895 89,257 803,314 118 867 3,155 2,594
Average 286 2,575 7,438 66,943 10 72 263 216
2011 Absentee Rate
Month Total Workforce Total Working Day Lost Day Absentee Rate
Male Female Male Female Male Female Male Female
Jan 264 2,377 6,867 61,799 15 120 437 387
Feb 264 2,379 6,079 54,710 17 155 559 567
Mar 270 2,433 7,298 65,683 19 55 521 167
Apr 273 2,456 7,095 63,859 19 83 536 258
May 279 2,515 7,264 65,380 20 59 551 179
Jun 289 2,599 7,509 67,579 15 73 400 215
Jul 281 2,525 7,293 65,637 13 94 357 286
Aug 276 2,486 7,457 67,117 10 97 268 288
Sep 275 2,471 7,137 64,233 20 182 560 565
Oct 271 2,443 7,056 63,508 19 63 539 198
Nov 262 2,355 6,804 61,238 15 52 441 170
Dec 267 2,406 7,217 64,954 16 117 443 359
Total 3,271 29,443 85,077 765,696 198 1,147 5,611 3,639
Average 273 2,454 7,090 63,808 17 96 468 303

76
JIT Shoot
After 365 sunny & rainy days…
…grows up with a tiny friend..