Embed Size (px)
Citation preview

Oct/Nov 2017
Corporate Update Right Time, Right Business, Right Model

The information contained in this presentation is intended solely for your personal reference and may not be reproduced, redistributed or passed on,
directly or indirectly, to any other person (whether within or outside your organisation/firm) or published, in whole or in part, for any purpose. No
representation or warranty express or implied is made as to, and no reliance should be placed on, the fairness, accuracy, completeness or
correctness of the information or opinions contained in this presentation. It is not the intention to provide, and you may not rely on this presentation as
providing, a complete or comprehensive analysis of the Company’s financial or trading position or prospects. The information contained in this
presentation should be considered in the context of the circumstances prevailing at the time and has not been, and will not be, updated to reflect
material developments which may occur after the date of the presentation. None of the Company nor any of its respective affiliates, advisors or
representatives shall have any liability whatsoever (in negligence or otherwise) for any loss or damage howsoever arising from any use of this
presentation or its contents or otherwise arising in connection with this presentation.
This presentation includes forward-looking statements. Forward-looking statements include, but are not limited to, the company’s growth potential,
costs projections, expected infrastructure development, capital cost expenditures, market outlook and other statements that are not historical facts.
When used in this presentation, the words such as "could," “plan," "estimate," "expect," "intend," "may," "potential," "should," and similar expressions
are forward-looking statements. Although MMG believes that the expectations reflected in these forward-looking statements are reasonable, such
statements involve risks and uncertainties and no assurance can be given that actual results will be consistent with these forward-looking statements.
This presentation may contain certain information derived from official government publications, industry sources and third parties. While we believe
inclusion of such information is reasonable, such information has not been independently verified by us or our advisers, and no representation is
given as to its accuracy or completeness.
This presentation should be read in conjunction with MMG Limited’s interim results announcement for the six months ended 30 June 2017 issued to
the Hong Kong Stock Exchange on 22 August 2017.
Disclaimer
2

Safety, Environment and Social Performance
1. Total recordable injury frequency per million hours worked
2. Las Bambas safety data incorporated into MMG from January 2015
Safety – our first value
Record low half yearly TRIF for MMG of 1.14 per
million hours worked in the first six months of 2017
MMG’s TRIF benchmarks in the lowest quartile of
all International Council on Mining and Metals
(ICMM) members globally. 2016 member average
TRIF was 4.19
Committed to ICMM’s 10 principles of Sustainable
Development
We mine for progress. Contributing to the
development of our host countries and communities
4.1
3.0
2.4 2.3 2.1
1.9
1.1
2011 2012 2013 2014 2015 2016 1H17
TRIF1,2
Safety performance
3

We do what we say
4
1. Las Bambas
delivered Ahead of schedule/budget and established as one of the largest and
lowest cost Cu mines in the world
12 month1 Net Operating Cash Flow of US$1.8b and Net Debt
reduction of US$1.4b. Spot copper would add ~US$1b to Cash Flow2
Disposal of Golden Grove, Century and Avebury assets. Delivering a
simpler, more focused business. Efficiency improvement programs
across all operations and corporate
2. Strong cash
generation & debt
reduction
3. Portfolio
optimisation &
efficiency
4. Dugald River
ahead of schedule
Dugald River project ahead of schedule and lowered capex
budget. First production now expected in 2017
1. 12 months to 30 June 2017 (including 2H16 and 1H17 financial results)
2. Spot prices for Cu, Zn, Pb, Au, Ag, AUDUSD and USDPEN at 25/10/17

1. Las Bambas – world class delivery
5
1.85
1.02 1.01
$0.00/lb
$0.50/lb
$1.00/lb
$1.50/lb
$2.00/lb
1H16 2H16 1H17
Ramp up profile C1 cost (incl by-product credits)
Over 12 months of stable operation, 430kt copper production to 30 June 2017, C1 US$1.02 (FY17 guidance 440-460kt
production and C1 of US$0.95-1.05/lb)
One of the lowest cost copper operations of this scale in the world
Las Bambas efficiency review of external spend and productivity improvements. Full benefit expected in 2018.
Initial 20+ year mine life producing copper, gold, silver and molybdenum (Molybdenum commercial production in 1H17).
Exploration upside, only ~10% of tenement explored
0%
20%
40%
60%
80%
100%
Comm. 1st 2nd 3rd 4th 5th 6th 7th 8th
% o
f in
stal
led
Cap
acit
y
Production Quarters
Las BambasMine 1Mine 2Mine 3Mine 4Mine 5

2. Driving value – focus on cash generation
6
US$1.8b Net Operating Cash generated in 12 months to 30 June 2017.
Spot commodity prices and FX adds ~US$1b
to EBIT and cash flow.
Cash impact similar to EBIT sensitivity given carried forward tax loss position.
Net Debt reduction of US$1.4b in 12 months
to 30 June 2017.
Sensitivity EBIT Impact (US$m)
Copper US$/lb US$0.10/lb / (US$0.10/lb) 135/(135)
Zinc US$/lb US$0.10/lb / (US$0.10/lb) 10/(10) 1
Lead US$/lb US$0.10/lb / (US$0.10/lb) 4/(4)
Gold US$/oz US$100/oz / (US$100/oz) 13/(13)
Silver US$/oz US$1.00/oz / (US$1.00/oz) 8/(8)
AUD:USD2 AUD (10%) / 10% 9/(9)
PEN:USD3 PEN (10%) / 10% 4/(4)
Net operating cash flow sensitivity (US$m)
Estimated impact on FY17 underlying EBIT from changes in commodity prices and currency
US$1,781m LME Cu Avg. US$2.44/lb
US$2,767m LME Cu spot4
US$3.18/lb
US$.0b
US$.5b
US$1.0b
US$1.5b
US$2.0b
US$2.5b
US$3.0b
12 Months to 30 Jun 17 Spot
1. FY17 Zinc sensitivity does not incl Dugald River. FY17 zinc production guidance is 65-72kt. First production for Dugald River expected 2H17 and production of 170ktpa at steady state
2. AUD:USD FX exposure relates to FX gain/loss on production expenditure at Rosebery and administration expenses at Group Office
3. PEN:USD FX exposure predominantly relates to translation of Las Bambas tax receivables balance and production expenditure
4. Spot Cu, Zn, Pb, Ag, Au, AUDUSD, USDPEN as at 25 October 2017

3. Ongoing efficiency programs
MMG weighted average Copper C1 costs (US$/lb)
Track record of C1 improvement at
operations
Mining industry costs likely to have seen
bottom of cycle
Mature operations facing challenges -
working hard for incremental
improvement
Efficiency programs in place across all
operations and corporate functions
Expect to deliver annualised overhead
savings of ~US$30m
Portfolio optimisation initiatives
continuing
7
0.80
1.00
1.20
1.40
1.60
1.80
2.00
2012 2013 2014 2015 2016 2017F

4. Dugald River – to deliver first production 2017
The Dugald River project ahead of
schedule
First production now expected in late 2017
(previously first half 2018)
Total development capital expected around
US$550-570m (previous range of US$600-
620m)
Will be one of the 10 largest zinc mines
globally
Highest-grade zinc project in development
Large scale and long life – annual
production of 170 kt Zn; ~25 year life
Strong cash flow potential – steady state
C1 costs of US$0.68 – 0.78/lb
2019 forecast production capability1
Contained zinc ‘000 tonnes
Source: a selection of top 10 zinc producers from the Wood Mackenzie Base Metals
Markets Tool (Q3 2017)
1. Only includes mines producing zinc and lead as primary commodities
8
0 100 200 300 400 500 600
Gamsberg
Dugald River
Cerro Lindo
San Cristobal
Penasquito
Antamina
McArthur River
Mount Isa Pb/Zn
Red Dog
Rampura-Agucha

MMG asset base
We have a globally diversified portfolio of base metals operations and development projects
AUSTRALIA
OPERATIONS
DEVELOPMENT PROJECTS
OFFICES
LAOS
DRC
SOUTH
AMERICA
KINSEVERE
ROSEBERY
HONG KONG
DUGALD RIVER
SEPON
JOHANNESBURG
LAS BAMBAS
MELBOURNE
VIENTIANE
HIGH LAKE
IZOK LAKE
LAS BAMBAS (62.5%)
2017 production guidance:
420,000 – 460,000 tonnes of
copper in copper concentrate
2017 C1 guidance:
US$0.95 – US$1.05/lb
KINSEVERE (100%)
2017 production guidance:
75,000 – 80,000 tonnes of
copper cathode
2017 C1 guidance:
US$1.50 – US$1.60/lb
SEPON (90%)
2017 production guidance:
~65,000 tonnes of copper
cathode
2017 C1 guidance:
US$1.40 – US$1.50/lb
ROSEBERY (100%)
2017 production guidance:
65,000 – 72,000 tonnes of
zinc in zinc concentrate and
18,000 – 25,000 tonnes of
lead in lead concentrate
2017 Zinc C1 guidance:
US$0.15 – US$0.25/lb
9
DUGALD RIVER (100%)
First production 4Q2017:
~170k tonnes of zinc in zinc
concentrate pa
C1 guidance:
US$0.68 – US$0.78/lb
LIMA

-100
0
100
200
300
400
500
0 20 40 60 80 100
C1 C
ash
Co
st
(c/l
b)
Production percentile
Sustained production growth
10
277 315 368 402 404
565 629
2011 2012 2013 2014 2015 2016 2017E
World’s top copper producers (2017)1 Kt
MMG copper equivalent production Kt
Top 10 miner of copper and zinc
Low cost position
Delivered 15% pa growth in Cu equivalent production over 5 past years
2016-2018 Las Bambas (Cu) and Dugald River (Zn) growth
1. Company guidance
2. Wood Mackenzie Q2 2017 Composite C1 Cash Cost Curve. MMG consolidated C1 based on the guidance ranges for Las Bambas, Kinsevere and Sepon.
C1 copper cost curve (2017)2
MMG consolidated C1 cost
(US$1.10/lb)
0
200
400
600
800
1,000
1,200
1,400
1,600
Codelc
o
Fre
eport
GLE
N
BH
P
SC
CO
AN
TO
MM
G
First
Quant
KG
HM
Rio
Tin
to
Source: Wood Mackenzie, Q2 2017

Attractive fundamentals and insights from major shareholder support commodity outlook
Supply risks growing – social, political, grade and
under-investment
Demand growth – US/Euro recovery, EV demand,
urbanisation
Understanding China fundamentals a competitive
advantage
One belt. One road.
Positive outlook for copper and zinc
11
Copper head grade and production Mined zinc supply gap and requirement for new capacity
Mined copper supply gap and requirement for new capacity
Source: Wood Mackenzie, Q2 2017
10
12
14
16
18
Mt
Zn
Base Case Production Capability, including highlyprobable projects
Requirement for mine production capability
Source: Wood Mackenzie, Q3 2017
Requirement for 4.9 Mt of
new mine production
capability in 2026
0.40
0.65
0.90
1.15
1.40
1.65
1.90
2.15
0
5000
10000
15000
20000
1990 1995 2000 2005 2010 2015 2020 2025
Ave g
rade m
ined (
Cu%
) –
weig
hte
d b
y p
aid
Cu
Pro
ductio
n (
kt C
u)
Total Recovered Cu*
Total Ore Average Grade
Source: Wood Mackenzie, Q3 2017
14
16
18
20
22
24
26
2013 2014 2015 2016 2017 2018 2019 2020 2021 2022 2023 2024 2025 2026 2027
Mt C
u
Available from base case mines plus projects
Demand for mine production capability (refined metal)
Requirement
for 4.6 Mt of
new mine
production
capability by
2027
Source: Wood Mackenzie Q3 2017

Focused, Efficient and Delivering Growth
12
Growth Major shareholder support has enabled MMG to fund and
deliver world top 10 copper and zinc mines at a time of
improving supply/demand fundamentals
Track record of continuous improvement. Operational
Excellence
Shareholder
value 12 month total shareholder return of 110%. Strong cash
generation and near term focus on debt reduction

Appendix
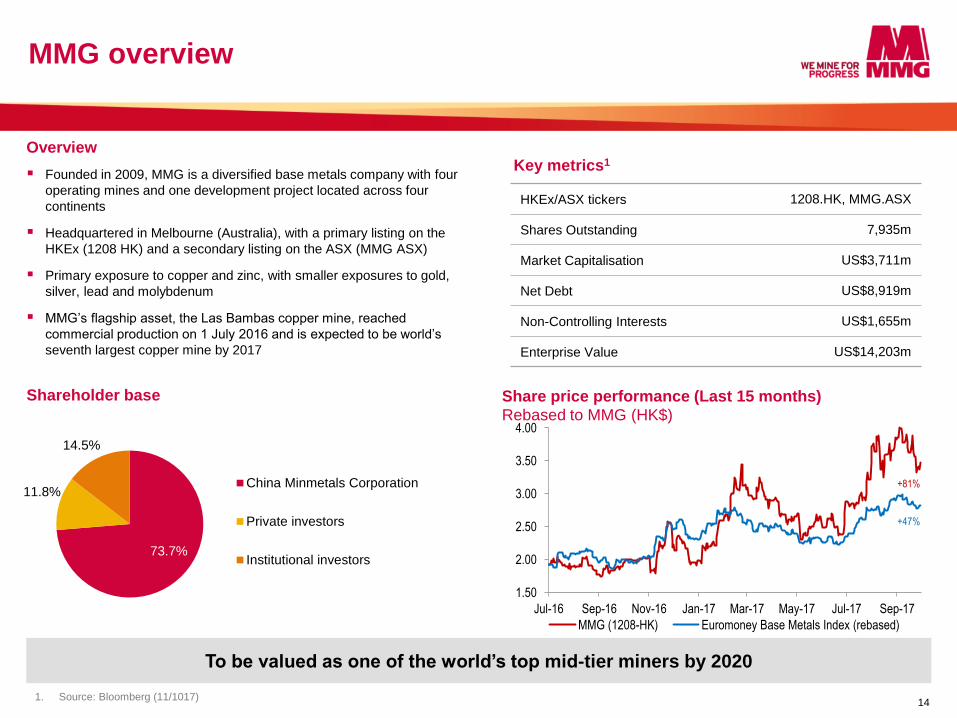
73.7%
11.8%
14.5%
China Minmetals Corporation
Private investors
Institutional investors
MMG overview
14
HKEx/ASX tickers 1208.HK, MMG.ASX
Shares Outstanding 7,935m
Market Capitalisation US$3,711m
Net Debt US$8,919m
Non-Controlling Interests US$1,655m
Enterprise Value US$14,203m
Key metrics1
Share price performance (Last 15 months)
Rebased to MMG (HK$)
To be valued as one of the world’s top mid-tier miners by 2020
Shareholder base
Founded in 2009, MMG is a diversified base metals company with four
operating mines and one development project located across four
continents
Headquartered in Melbourne (Australia), with a primary listing on the
HKEx (1208 HK) and a secondary listing on the ASX (MMG ASX)
Primary exposure to copper and zinc, with smaller exposures to gold,
silver, lead and molybdenum
MMG’s flagship asset, the Las Bambas copper mine, reached
commercial production on 1 July 2016 and is expected to be world’s
seventh largest copper mine by 2017
Overview
1. Source: Bloomberg (11/1017)
1.50
2.00
2.50
3.00
3.50
4.00
Jul-16 Sep-16 Nov-16 Jan-17 Mar-17 May-17 Jul-17 Sep-17
MMG (1208-HK) Euromoney Base Metals Index (rebased)
+81%
+47%

Executive team – global experience
25+ years’ experience in metals and mining
Vice-President of China Minmetals Corporation (CMC)
Chairman of China Minmetals Non-ferrous Metals Company Limited (CMN)
President of CMN
Director of Hunan Nonferrous Metals Holding Group Co., Ltd. (HNG)
25+ years’ experience in the Natural Resources sectors
CEO and MD Macmahon Holdings
CFO Woodside Petroleum
Senior financial roles BHP Billiton
25+ years’ experience in finance, strategy, investment
Director of CMNH and Jiangxi Tungsten
Director Copper Partners Investment and HNG
Vice President and CFO of China Minmetals Non-Ferrous
20+ years’ government, media, community and investor relations
General Manager Media and Reputation Foster’s Group.
Group Manager Public Affairs WMC Resources
Executive General Manager Services and Strategic Planning Myer Limited
7+ years BHP Billiton
6+ years Pratt Group
11+ years WMC Resources
Chief Executive Officer
Mr Jerry Jiao
Chief Financial Officer
Mr Ross Carroll
EGM Marketing & Risk
Mr Xu Jiqing
EGM Stakeholder Relations
Mr Troy Hey
EGM Business Support
Acting Chief Operating Officer
Mr Greg Travers
15

Las Bambas
Copper – production 420,000 – 460,000 tonnes
Copper – C1 costs US$0.95 – 1.05 / lb
Rosebery
Zinc – production 65,000 – 72,000 tonnes
Zinc – C1 costs US$0.15 – 0.25 / lb
Lead – production 18,000 – 25,000 tonnes
Sepon
Copper – production ~65,000 tonnes
Copper – C1 costs US$1.40 – 1.50 / lb
Kinsevere
Copper – production 75,000 – 80,000 tonnes
Copper – C1 costs US$1.50 – 1.60 / lb
Guidance for 2017
17
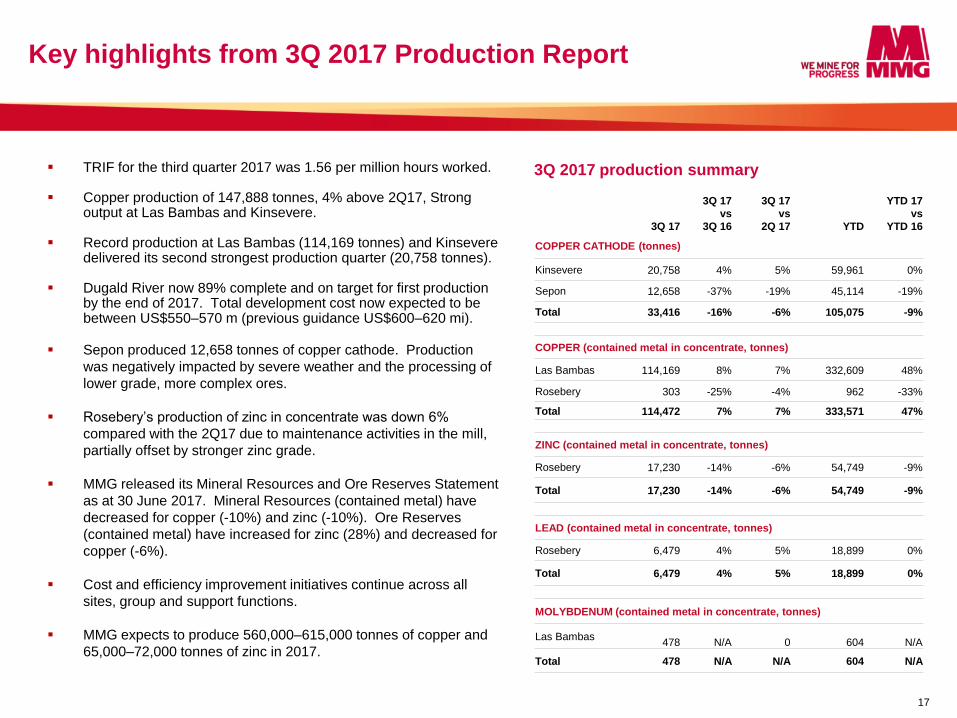
Key highlights from 3Q 2017 Production Report
3Q 2017 production summary TRIF for the third quarter 2017 was 1.56 per million hours worked. Copper production of 147,888 tonnes, 4% above 2Q17, Strong
output at Las Bambas and Kinsevere. Record production at Las Bambas (114,169 tonnes) and Kinsevere
delivered its second strongest production quarter (20,758 tonnes). Dugald River now 89% complete and on target for first production
by the end of 2017. Total development cost now expected to be between US$550–570 m (previous guidance US$600–620 mi).
Sepon produced 12,658 tonnes of copper cathode. Production
was negatively impacted by severe weather and the processing of
lower grade, more complex ores.
Rosebery’s production of zinc in concentrate was down 6%
compared with the 2Q17 due to maintenance activities in the mill,
partially offset by stronger zinc grade.
MMG released its Mineral Resources and Ore Reserves Statement
as at 30 June 2017. Mineral Resources (contained metal) have
decreased for copper (-10%) and zinc (-10%). Ore Reserves
(contained metal) have increased for zinc (28%) and decreased for
copper (-6%).
Cost and efficiency improvement initiatives continue across all
sites, group and support functions.
MMG expects to produce 560,000–615,000 tonnes of copper and
65,000–72,000 tonnes of zinc in 2017.
3Q 17
3Q 17
vs
3Q 16
3Q 17
vs
2Q 17
YTD
YTD 17
vs
YTD 16
COPPER CATHODE (tonnes)
Kinsevere 20,758 4% 5% 59,961 0%
Sepon 12,658 -37% -19% 45,114 -19%
Total 33,416 -16% -6% 105,075 -9%
COPPER (contained metal in concentrate, tonnes)
Las Bambas 114,169 8% 7% 332,609 48%
Rosebery 303 -25% -4% 962 -33%
Total 114,472 7% 7% 333,571 47%
ZINC (contained metal in concentrate, tonnes)
Rosebery 17,230 -14% -6% 54,749 -9%
Total 17,230 -14% -6% 54,749 -9%
LEAD (contained metal in concentrate, tonnes)
Rosebery 6,479 4% 5% 18,899 0%
Total 6,479 4% 5% 18,899 0%
MOLYBDENUM (contained metal in concentrate, tonnes)
Las Bambas 478 N/A 0 604 N/A
Total 478 N/A N/A 604 N/A

Appendix: 1H17 results summary

Revenue, Earnings, NPAT and Cash Improve in H1
19
US$ million 1H16 2H16 1H17 1H7 v 1H16
Revenue 586.1 1,902.7 1,942.4 231%
Underlying EBITDA 134.3 814.9 855.0 537%
Underlying Profit / (Loss) After Tax -93.0 -5.7 107.8 N/A
Net Operating Cash Flow 57.7 664.6 1,116.0 1834%
Net Debt 10,279.8 9,786.8 8,918.6 13%

Underlying earnings up over 500%, costs controlled
US$ million
20
1H16 EBITDA
134
1H17 Underlying
EBITDA 855
0
200
400
600
800
1000
Price
114
Volume
(29)
Stock
Movements
(29) Las
Bambas
740
Cash
Prodn
Expenses
(31) Other
(22)
FX
(30)
Discontinued
Ops
8

Net debt down US$868m
21
9,787
8,919
726
209
(165)
95
2
8,200
8,400
8,600
8,800
9,000
9,200
9,400
9,600
9,800
10,000
Net Debt 31Dec 16
FCF Asset sales GrowthCapex
Related partyloan
repayment
Other Net Debt 30Jun 17
Movements in Net Debt (US$m) Net debt reduction of US$868m,
driven by:
- Free Cash Flow1 of US$726m
- US$209m from asset sales
- Growth capital predominantly
relates to Dugald River
development (~US$200m
remaining)
Post balance date: Surplus cash
used to prepay US$500m of Las
Bambas Project Debt. Annualised
interest saving of ~US$25m2
1. FCF = Net Operating Cash Flow less sustaining capex and net financing costs paid.
2. Subject to prevailing LIBOR

Well managed debt maturity profile
22
0
500
1,000
1,500
2,000
2,500
3,000
3,500
4,000
4,500
5,000
2017 2018 2019 - 2021 2022 - 2032
Debt repayment schedule1 (US$m)
Las Bambas Acquisition Facility, 7 yrs, not exceeding LIBOR +3.3%
Las Bambas Project Facility, 18 yrs, not exceeding LIBOR +3.55%
Dugald River, 13 yrs
2017 Debt Repayments (to 31 Jul 17)
Gross debt reduced by >US$1b in 2017 YTD
Average outstanding maturity profile now ~8 years
1. Principal and interest payments including Joint Venture partner liabilities. Excludes related party debt which includes US$2.262 billion shareholder loan and interest payable thereon. Also excludes US$350m Las Bambas revolving
facility, which was un drawn at 30 June 2017

Las Bambas 1H17 overview – 12 months of stable
production
1. EBITDA includes revenue, operating expenses and other income and expense items. Las Bambas was only accounted for as an operation from 1 July 2016 when commercial production
was achieved, and therefore the operating results for the six months ended 30 June 2016 do not take into account sales, operating expenses and depreciation and amortisation expenses
Las Bambas demonstrated 12 months of stable operation since
achieving commercial production on 1 July 2016. Total
production over the previous 12 months of 430kt at a C1 cost of
US$1.02/lb.
Production of 218,440 tonnes of copper in copper concentrate in
1H17, 3% above 2H16.
Revenue of US$1,361.7 million was driven by payable metal in
product sold of 223,065 tonnes of copper concentrate.
Inventory on hand remained at low levels with no significant
logistics disruptions during the first half of 2017.
Total operating expenses were $608.0 million and EBITDA for
the six-month period was US$756.4 million (2016: $16.9 million).
MMG expects total copper in copper concentrate production for
2017 at Las Bambas of 420,000 to 460,000 tonnes, with C1 unit
costs to be in the range of US$0.95/lb to US$1.05/lb. Making Las
Bambas one of the lowest cost copper mines of this scale in the
world. C1 costs for the six months to 30 June 2017 were
US$1.01/lb.
In 2017, Las Bambas has embarked on an efficiency review with
the full benefit of this program expected to be realised in 2018.
Financials
US$ million 1H17 1H161 %
Revenue 1,361.7 N/A
EBITDA1 756.4 16.9 4,376%
EBIT 476.8 16.9 2721%
EBITDA margin (%) 56% N/A
Production 218,440 N/A
C1 costs – copper (US$ / lb) 1.01 N/A
23
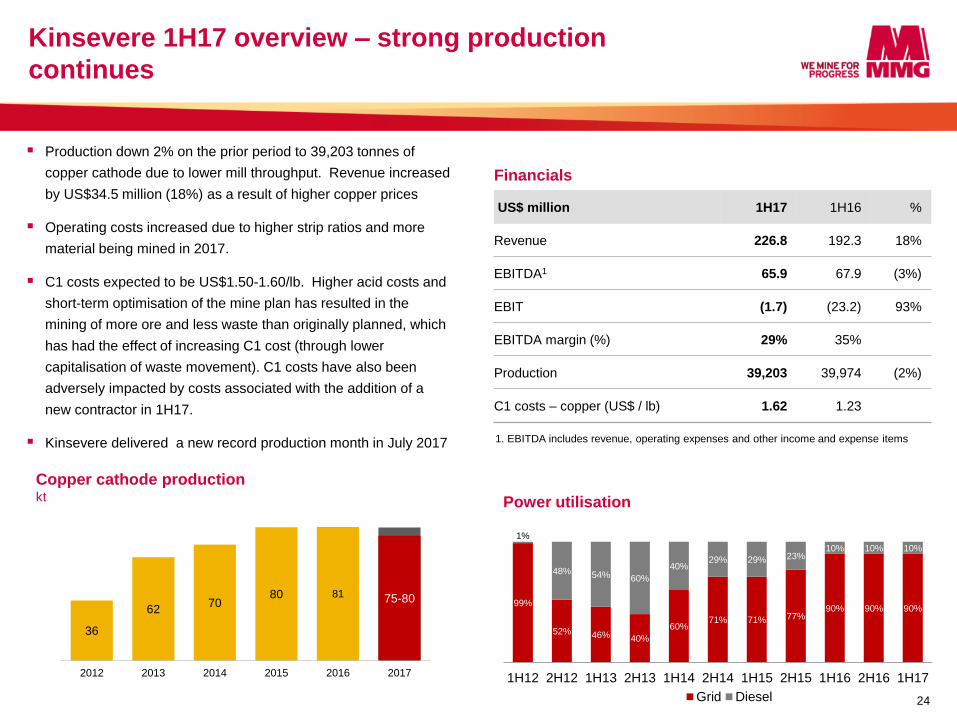
Kinsevere 1H17 overview – strong production
continues
1. EBITDA includes revenue, operating expenses and other income and expense items
Production down 2% on the prior period to 39,203 tonnes of
copper cathode due to lower mill throughput. Revenue increased
by US$34.5 million (18%) as a result of higher copper prices
Operating costs increased due to higher strip ratios and more
material being mined in 2017.
C1 costs expected to be US$1.50-1.60/lb. Higher acid costs and
short-term optimisation of the mine plan has resulted in the
mining of more ore and less waste than originally planned, which
has had the effect of increasing C1 cost (through lower
capitalisation of waste movement). C1 costs have also been
adversely impacted by costs associated with the addition of a
new contractor in 1H17.
Kinsevere delivered a new record production month in July 2017
Copper cathode production kt
Power utilisation
Financials
US$ million 1H17 1H16 %
Revenue 226.8 192.3 18%
EBITDA1 65.9 67.9 (3%)
EBIT (1.7) (23.2) 93%
EBITDA margin (%) 29% 35%
Production 39,203 39,974 (2%)
C1 costs – copper (US$ / lb) 1.62 1.23
24
36
62 70
80 81 75-80
0
20
40
60
80
2012 2013 2014 2015 2016 2017
99%
52% 46% 40%
60% 71% 71% 77%
90% 90% 90%
1%
48% 54% 60%
40% 29% 29% 23%
10% 10% 10%
1H12 2H12 1H13 2H13 1H14 2H14 1H15 2H15 1H16 2H16 1H17
Grid Diesel

Sepon 1H17 overview – record asset utilisation
1. EBITDA includes revenue, operating expenses and other income and expense items
Sepon produced 32,456 tonnes of copper cathode in 1H17(-10%)
with continued transition to lower grade, more complex ores.
The decline in grade was partially offset by record asset
utilisation, with plant throughput 30% above the first half of 2016,
and higher copper prices.
A review that focused on all activities and costs was implemented
at Sepon in 2016 to rebase the asset for a lower grade future and
this program is expected to deliver cost savings of US$18m in
2017.
MMG expects Sepon C1 unit costs to be in the range of
US$1.40/lb to US$1.50/lb with total copper cathode production
around 65,000 tonnes.
MMG continues to actively review future options for the Sepon
mine and associated infrastructure following the depletion of the
existing high grade copper Ore Reserves expected over the next
three to four years. Future production options being assessed
include the processing of lower grade copper ores, the restart of
oxide gold production and the exploitation of the sizeable primary
gold Resources within the MEPA area as well as other external
options.
64 79
86 90 89 89 79
~65
2010 2011 2012 2013 2014 2015 2016 2017
Copper cathode production kt
Financials
US$ million 1H17 1H16 %
Revenue 192.7 176.3 9%
EBITDA1 59.1 61.2 (3%)
EBIT 16.0 1.7 841%
EBITDA margin (%) 31% 35%
Production 32,456 35,919 (10%)
C1 costs – copper (US$ / lb) 1.40 1.38
25

Australian Operations 1H17 overview
1. EBITDA includes revenue, operating expenses and other income and expense items
Lower revenue due to sale of Golden Grove in February 2017 and
lower sales volumes at Rosebery due to declining grades.
C1 zinc cost guidance reduction at Rosebery to US$0.15-0.25/lb
(was US$0.25-0.35/lb) due to lower than planned Treatment
Charges for zinc concentrate and a continued focus on cost and
efficiency.
MMG expects to produce between 65,000–72,000 tonnes of zinc in
zinc concentrate and 18,000–25,000 tonnes of lead in lead
concentrate at Rosebery in 2017
Golden Grove sold to EMR for US$210m on 28 February 2017
Transaction for the transfer of Century assets and infrastructure
and associated liabilities completed on 28 February 2017
Zinc in zinc concentrate production kt
120 – 135
10 – 12
Financials
US$ million 1H17 1H16 %
Revenue 154.5 193.7 (20%)
EBITDA1 70.9 59.1 20%
EBIT 32.7 10.2 220%
EBITDA margin (%) 46% 31%
Production
Zinc (tonnes) 38,881 58,137 (33%)
Lead (tonnes) 12,668 14,441 (12%)
Copper (tonnes) 2,301 7,231 (68%)
C1 costs – Rosebery zinc (US$/lb) 0.21 0.14
26
152
107 112 122
147
120
65-72
2011 2012 2013 2014 2015 2016 2017F

Consolidated financial performance: Statement of financial
performance
27
Six Months Ended 30 June 2017 1H17 1H16 Var %
US$ million
Revenue 1,942.4 586.1 231%
Underlying EBITDA 855.0 134.3 537%
Depreciation and amortisation -425.7 -201.3 111%
Underlying EBIT 429.3 -67.0 741%
Net Interest -260.1 -47.1 452%
Underlying Profit / (Loss) Before Tax 169.2 -114.1 248%
Income Tax Credit/(Expense) -61.4 21.1 -391%
Underlying Profit / (Loss) After Tax 107.8 -93.0 216%
Profit on Sale of Divested Operations (pre tax) 173.6 - N/A
Income Tax Expense -167.7 - N/A
Net Profit After Tax - MMG Group 113.7 -93.0 222%
Attributable to equity holders of the Company 17.8 -92.5 119%
Non-controlling interests 95.9 -0.5 N/A
RESTATED
EPS attributable to equity holders of the Company US 0.22 c US (1.53) c 114%

Condensed consolidated balance sheet
US$ million 30 June 2017 31 Dec 2016
Non-current assets 12,926.0 13,198.5
Current assets – cash and cash equivalents 914.3 552.7
Current assets – other 784.0 1,478.8
Total assets 14,624.3 15,230.0
Total equity 2,713.9 2,589.6
Non-current liabilities – other 1,496.6 1,514.3
Non-current liabilities – borrowings 9,346.1 9,516.2
Current liabilities – other 662.9 872.9
Current liabilities – borrowings 405.1 737.0
Total liabilities 11,910.4 12,640.4
Total equity and liabilities 14,624.3 15,230.0
Net current assets 630.6 421.6
Total assets less current liabilities 13,556.6 13,620.1
28

Consolidated financial performance:
Cash flow statement
Six months ended 30 June
US$ million
2017
2016
Receipts from customers 2,426.51 686.1
Payments to suppliers
(1,263.1) (561.0)
Payments for exploration expenditure (17.6) (18.8)
Income tax paid (29.8) (48.6)
Net cash generated from operating activities
1,116.0 57.7
Purchase of property, plant and equipment (347.8) (375.6)
Other investing activities 303.0 (3.0)
Net cash used in investing activities (44.8) (378.6)
Proceeds from borrowings 80.0 363.4
Repayment of borrowings (588.2) (226.9)
Interest and financing costs paid (210.0) (197.1)
Other financing activities 8.6 (0.9)
Net cash generated from / (used in) financing activities (709.6) (61.5)
Net increase / (decrease) in cash and cash equivalents 361.6 (382.4)
Cash and cash equivalents at 1 January 552.7 598.3
Cash and cash equivalents at 30 June 914.3 215.9
29